Article

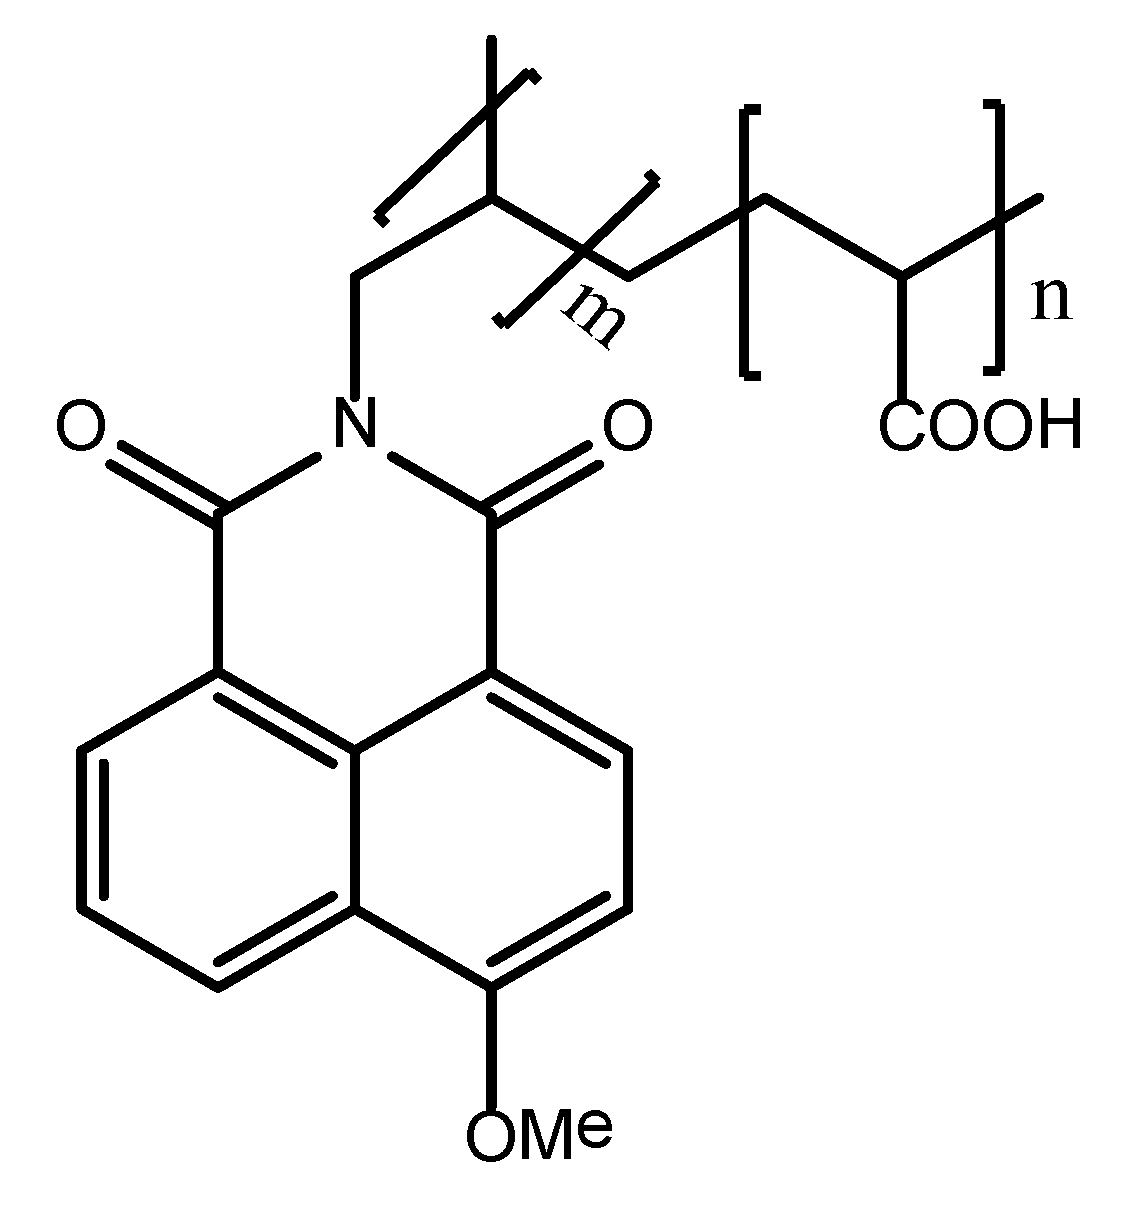
Gypsum Crystallization during Reverse Osmosis Desalination of Water with High Sulfate Content in Presence of a Novel Fluorescent-Tagged Polyacrylate

1
JSC “Fine Chemicals R&D Centre”, Krasnobogatyrskaya, str. 42, b. 1, 107258 Moscow, Russia
2
Mendeleev University of Chemical Technology of Russia, Miusskaya sq. 9, 125047 Moscow, Russia
3
Moscow State University of Civil Engineering, Yaroslavskoe shosse, 26, 129337 Moscow, Russia
4
Prokhorov General Physics Institute of the Russian Academy of Sciences, Vavilov str., 38, 119991 Moscow, Russia
*
Author to whom correspondence should be addressed.
Submission received: 17 March 2020 / Revised: 9 April 2020 / Accepted: 14 April 2020 / Published: 16 April 2020
(This article belongs to the Special Issue Advances in Industrial Crystallization)

Abstract

:
Gypsum scaling in reverse osmosis (RO) desalination process is studied in presence of a novel fluorescent 1,8-naphthalimide-tagged polyacrylate (PAA-F1) by fluorescent microscopy, scanning electron microscopy (SEM), dynamic light scattering (DLS) and a particle counter technique. A comparison of PAA-F1 with a previously reported fluorescent bisphosphonate HEDP-F revealed a better PAA-F1 efficacy, and a similar behavior of polyacrylate and bisphosphonate inhibitors under the same RO experimental conditions. Despite expectations, PAA-F1 does not interact with gypsum. For both reagents, it is found that scaling takes place in the bulk retentate phase via heterogeneous nucleation step. The background “nanodust” plays a key role as a gypsum nucleation center. Contrary to popular belief, an antiscalant interacts with “nanodust” particles, isolating them from calcium and sulfate ions sorption. Therefore, the number of gypsum nucleation centers is reduced, and in turn, the overall scaling rate is diminished. It is also shown that, the scale formation scenario changes from the bulk medium, in the beginning, to the sediment crystals growth on the membrane surface, at the end of the desalination process. It is demonstrated that the fluorescent-tagged antiscalants may become very powerful tools in membrane scaling inhibition studies.

1. Introduction

Reverse osmosis (RO) is becoming recently a powerful technology for the purification of sea, brackish and waste water [1,2,3,4]. However, one of the major limitations in efficient RO application is the membrane scaling [5,6,7]. Inorganic scaling, occurs when the solubility limits are exceeded. The most common scales are represented by calcium carbonate, calcium sulfate and silica [6]. As a result of inorganic fouling, the operation cost of an RO plant increases due to higher consumption of energy and expenses of membrane cleaning. The most common method in mitigating scaling in RO facilities is an application of antiscalants. Among these, polycarboxylates (polyacrylates, polyaspartates, etc.) and phosphonates are found to be highly efficient [6,7,8,9,10,11].
However, in spite of numerous relevant studies, some controversy regarding both the dominant scaling mechanism in particular situations and the mechanism of antiscalant activity still exists [12,13,14,15,16,17,18]. Recent reviews on scale formation control in RO technologies [6,19] mention two main hypothetic mechanisms of inhibition: (i) antiscalant molecules adsorb on the active growth sites at the crystal surface of sparingly soluble inorganic salt and retard nucleation and crystal growth by distorting its crystal structure; (ii) antiscalant molecules provide similar electrostatic charge, and thus, repulsion between particles prevents them from agglomeration.
Nevertheless, our recent static [20,21] and RO [22] experiments operating gypsum as a model scale in presence of a novel fluorescent-tagged bisphosphonate antiscalant 1-hydroxy-7-(6-methoxy-1,3-dioxo-1H-benzo[de]isoquinolin-2(3H)-yl)heptane-1,1-diyl-bis(phosphonic acid), HEDP-F (H4hedp-F) revealed a paradoxical effect: an antiscalant does not interact with gypsum at all, but provides nevertheless retardation of corresponding deposit formation. According to the classical crystallization theory [23], this is possible only in the case, when gypsum passes bulk heterogeneous nucleation, and exactly the “nanodust” plays the role of the solid phase template. Indeed, it is demonstrated that HEDP-F molecules being immersed into the stock solution (undersaturated against gypsum) occupy a significant part of “nanodust” crystallization centers and form there their own solid phase Ca2hedp-F·nH2O. However, polyacrylates are much less sensitive to calcium environment than phosphonates [20,21]. In this way, it was reasonable to study the traceability of phosphorus-free fluorescent polymeric antiscalants in RO process.
The present study is focused on the scale inhibitor visualization during RO treatment of model water sample, with high sulfate content, in the presence of a fluorescent antiscalant- 1,8-naphthalimide-tagged polyacrylate, PAA-F1, Figure 1.
The gypsum scale was taken as a model of a sparingly soluble salt due to: (i) its importance for the RO and other water treatment technologies [10,11,12,13,14,15,16]; (ii) its poor dependence on pH; (iii) its easily detectable crystal shapes; and (iv) the nucleation of gypsum has been investigated extensively in the past [10,11,14,16,17,18,24,25,26,27,28,29,30,31,32,33]. On the other hand PAA-F1 is expected to be a better antiscalant for CaSO4·2H2O deposits relative to HEDP-F. This was demonstrated for the non-fluorescent prototypes 1-hydroxyethane-1,1-bis(phosphonic acid) (HEDP) and polyacrylate (PAA) [34].The fluorescent-tagged polyacrylates have gained increasing interest as the reagents for on line antiscalant concentration monitoring in water treatment applications recently [35]. However, they have not been applied, so far, for scale formation mechanisms studies. As far as we know, this is the first communication on polymer antiscalant visualization in a RO experiment with gypsum scaling.

2. Materials and Methods

2.1. Reagents, Membrane Material and Model Solutions

Antiscalant PAA-F1 (Figure 1) was synthesized by our group as described elsewhere [36] along with its scale inhibition efficiency against gypsum scaling and its fluorescent properties. It has the mean molecular mass 4000 Da with c.a. 1% mass of 1,8-naphthalimide moiety. This corresponds randomly to c.a. 0.2 fluorescent fragments per one molecule of polyacrylate.
For model scaling solutions, the reagent grade CaCl2·2H2O and Na2SO4 were used in crystalline form and were separately dissolved in distilled water (conductivity 2 μS/cm) to prepare stock solutions of 0.04 mol·dm3. After complete dissolution, stock solutions represented transparent colorless liquids, and were deliberately exposed no filtration for a better imitation of saline or brackish water. For gypsum (CaSO4·2H2O) scaling experiments, each stock solution was combined with distilled water to achieve a total volume of 5 L and a final concentration of 0.015 mol·dm3 [Ca2+] and 0.015 mol·dm3 [SO42−]. The solvent (distilled water) and all stock solutions were analyzed separately for foreign particles content, Table 1. A particle counter SLS-1100 (Particle Measuring Systems Inc.) reveals a presence of background solid suspended particles (“microdust”) in both stock brines, as well as in the distilled water used for the brine preparation, Table 1.
The values of gypsum solubility in water at 25 °C provided by different research groups, varies from 0.018 to 0.025 mol·dm3 and depend drastically on the background NaCl content [37]. Therefore, the stock calcium and sulfate solutions have been prepared (Table 1) in such concentrations, that being mixed in 1:1 volume ratio they would give 0.015 mol·dm3 gypsum solution, that is a bit below the saturation level. However, the retentate was expected to exceed the saturation level already at saturation coefficient (concentration factor) K = 1.5 and to reach steadily supersaturation S~4 (K = 5) at the end of the experiment (in absence of scaling). Notably, these supersaturation assessments are very approximate ones as NaCl content in retentate is changed in experiment run from 0.03 to c.a. 0.15 mol·dm3, increasing gypsum solubility.
Here and further saturation coefficient K and saturation ratio S are denoted as:
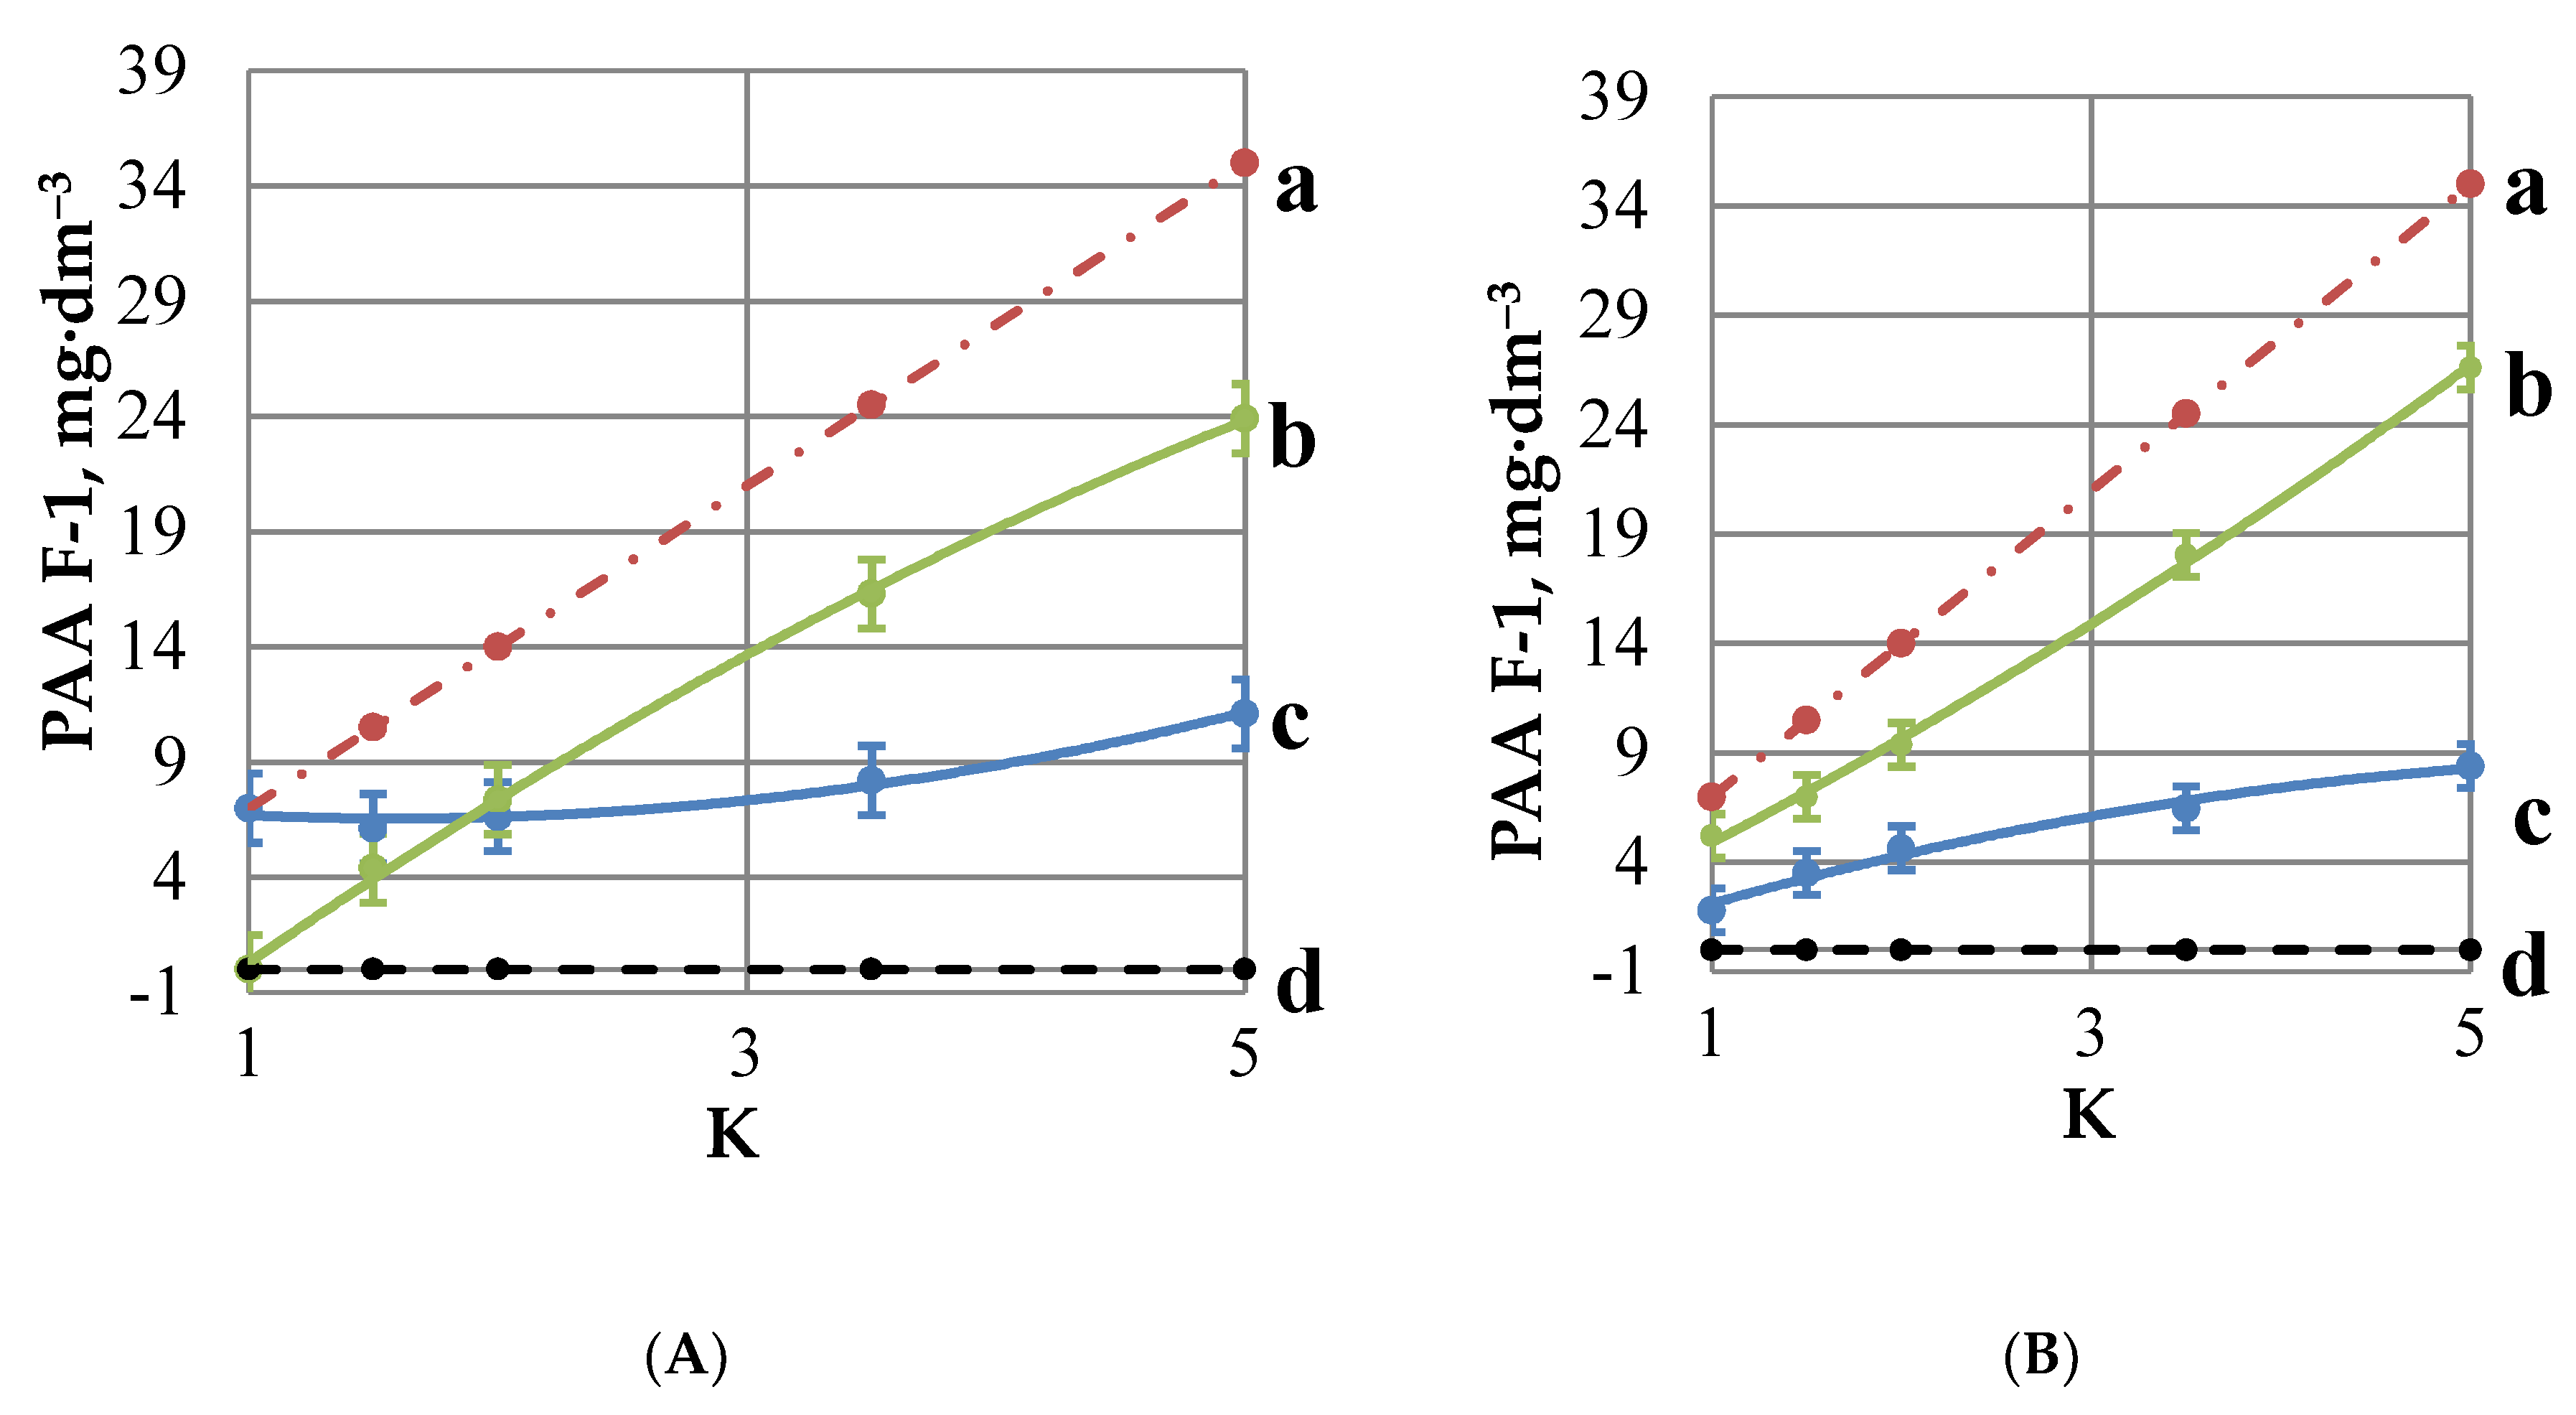
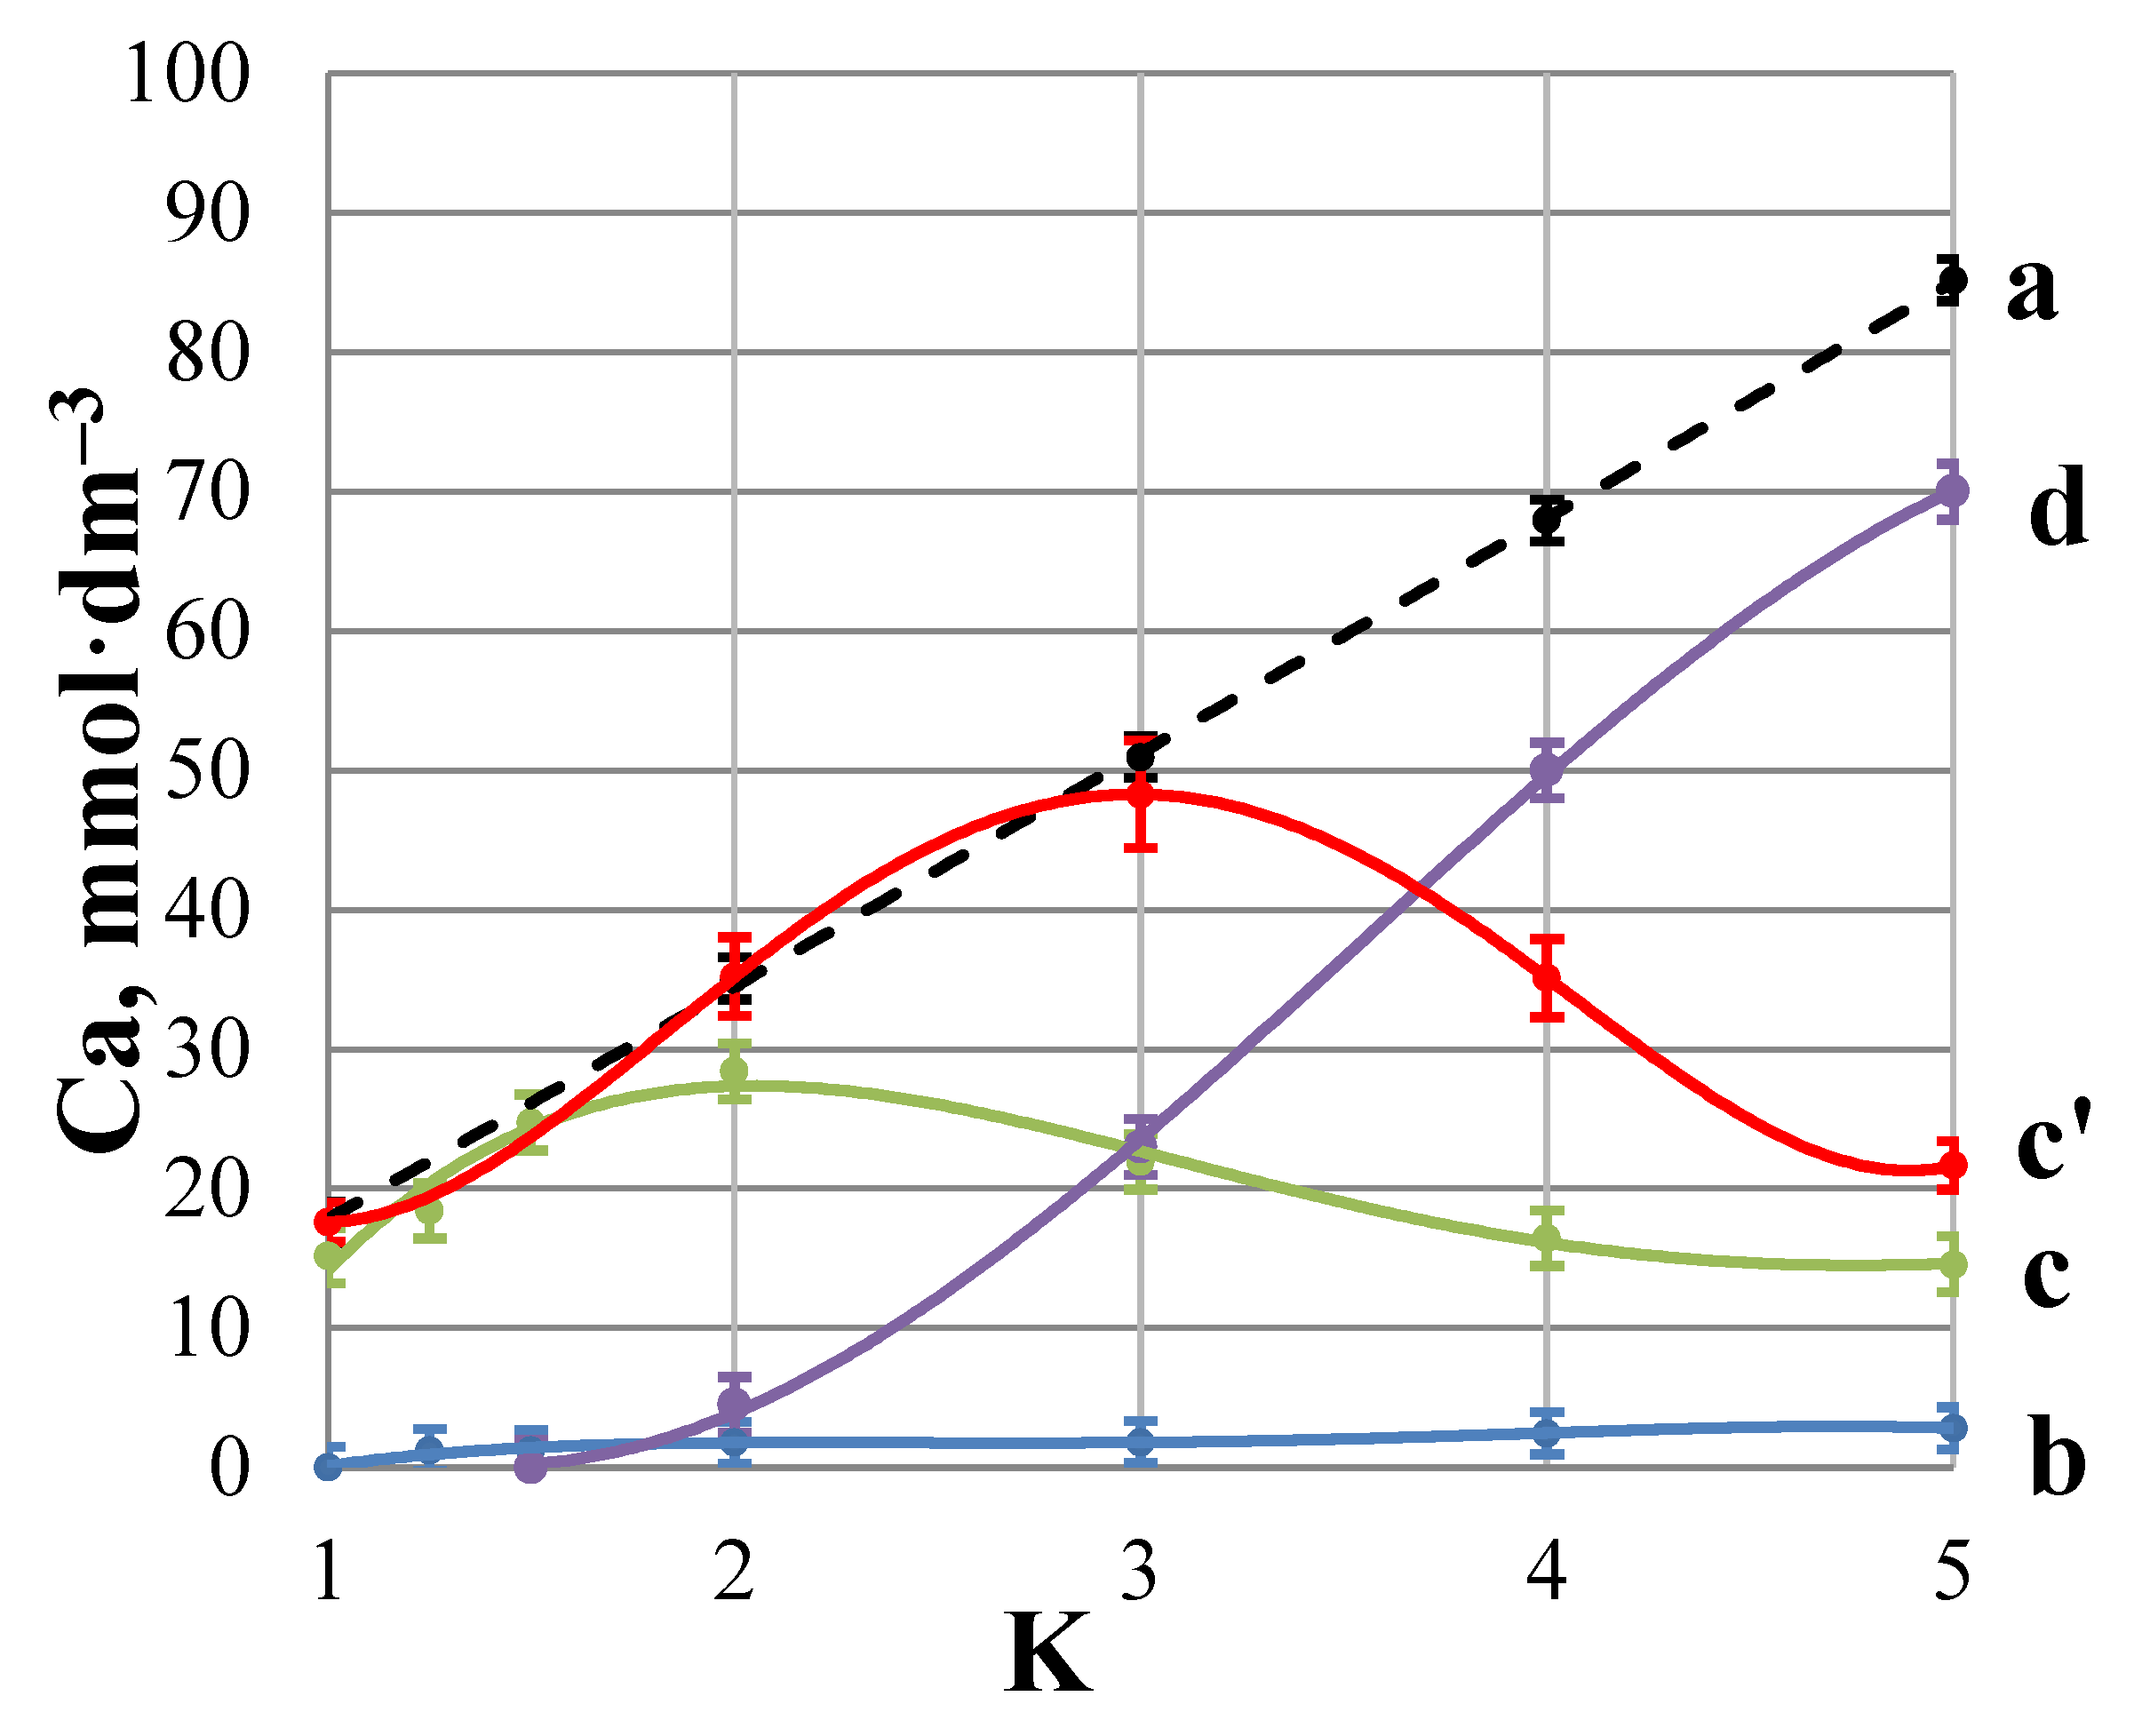
  • K = (total initial volume of feeding solution)/(current volume of retentate)
  • S = (initial gypsum concentration, mol·dm3)/(gypsum solubility at 25 °C, mol·dm3)
  • Thus for S < 1 the solution is undersaturated, while for S > 1 it is supersaturated.
Notably, an antiscalant, where necessary, was added always initially to the sulfate test solution in amounts that provided its final concentration 7 mg·dm3 (corresponds to c.a. 1.7·106 mol·dm3 PAA-F1 concentration bearing in mind that the mean molecular mass is 4000 Da) in gypsum scaling experiment, and equilibrated there no less than 30 min.
It is well-known that the heterogeneous nucleation, in the presence of such solid impurities, as clay minerals or other foreign particles, is characterized by a lower free energy barrier than the homogeneous one [23]. Bearing in mind the particle counter data, Table 1, a bulk homogeneous formation of solid gypsum phase is unlikely in our case, while the bulk heterogeneous nucleation is the most likely route. It should be noted that deionization of distilled water leads to a significant reduction of suspended particles concentration. However, this operation fails to remove even “microdust” completely, to say nothing of “nanodust”. The latter is likely to be present in any aqueous samples in much higher amounts than “microdust”, although the “nanodust” (1 nm < particle sizes < 100 nm) is beyond the detection limit of commercial particle counters. This becomes clear by extrapolating the cumulative number of foreign particles in 1 mL (Table 1) to the 1≤ nm ≤ 100 range. Thus, all the background solid suspended particles are referred to as “nanodust”.
A rough estimation indicates that if the number of undetectable by the particle counter “nanodust” particles with a size D < 100 nm is equal to the detected “microdust” ones, than the total heterogeneous impurities concentration constitutes c.a. 3,000,000 units in 1 mL, or 3·109 in 1 L. At the same time PAA-F1 concentration corresponds to 3.5·1015 molecules per liter. Thus, there are at least 106 molecules of PAA-F1 per one nano/microdust particle in the system.
A detailed analysis of the background solid suspended particles nature in all chemicals used (H2O; CaCl2·2H2O; Na2SO4; PAA-F1) represents a special complicated task, and is hardly possible. It is outside of the frames of the present study. However, some preliminary analyses carried out in [22] indicate that a tentative nature of solid impurities in distilled water might be assigned to Al/Fe hydroxo/oxides and to either SiO2 or to some silicate solid impurities. At the same time, it should be noted that all the background solid suspended particles, listed in Table 1, correspond to the ppb level, e.g., to the reagent grade purity solutions.
Studies were carried out using commercial spiral wound BLN-type low pressure reverse osmosis membrane produced by CSM Co. (Seoul, South Korea). The membranes are found to have their own non uniform fluorescence. This makes it difficult to observe PAA-F1 location on membrane surface, as the coresponding images are not very clear.

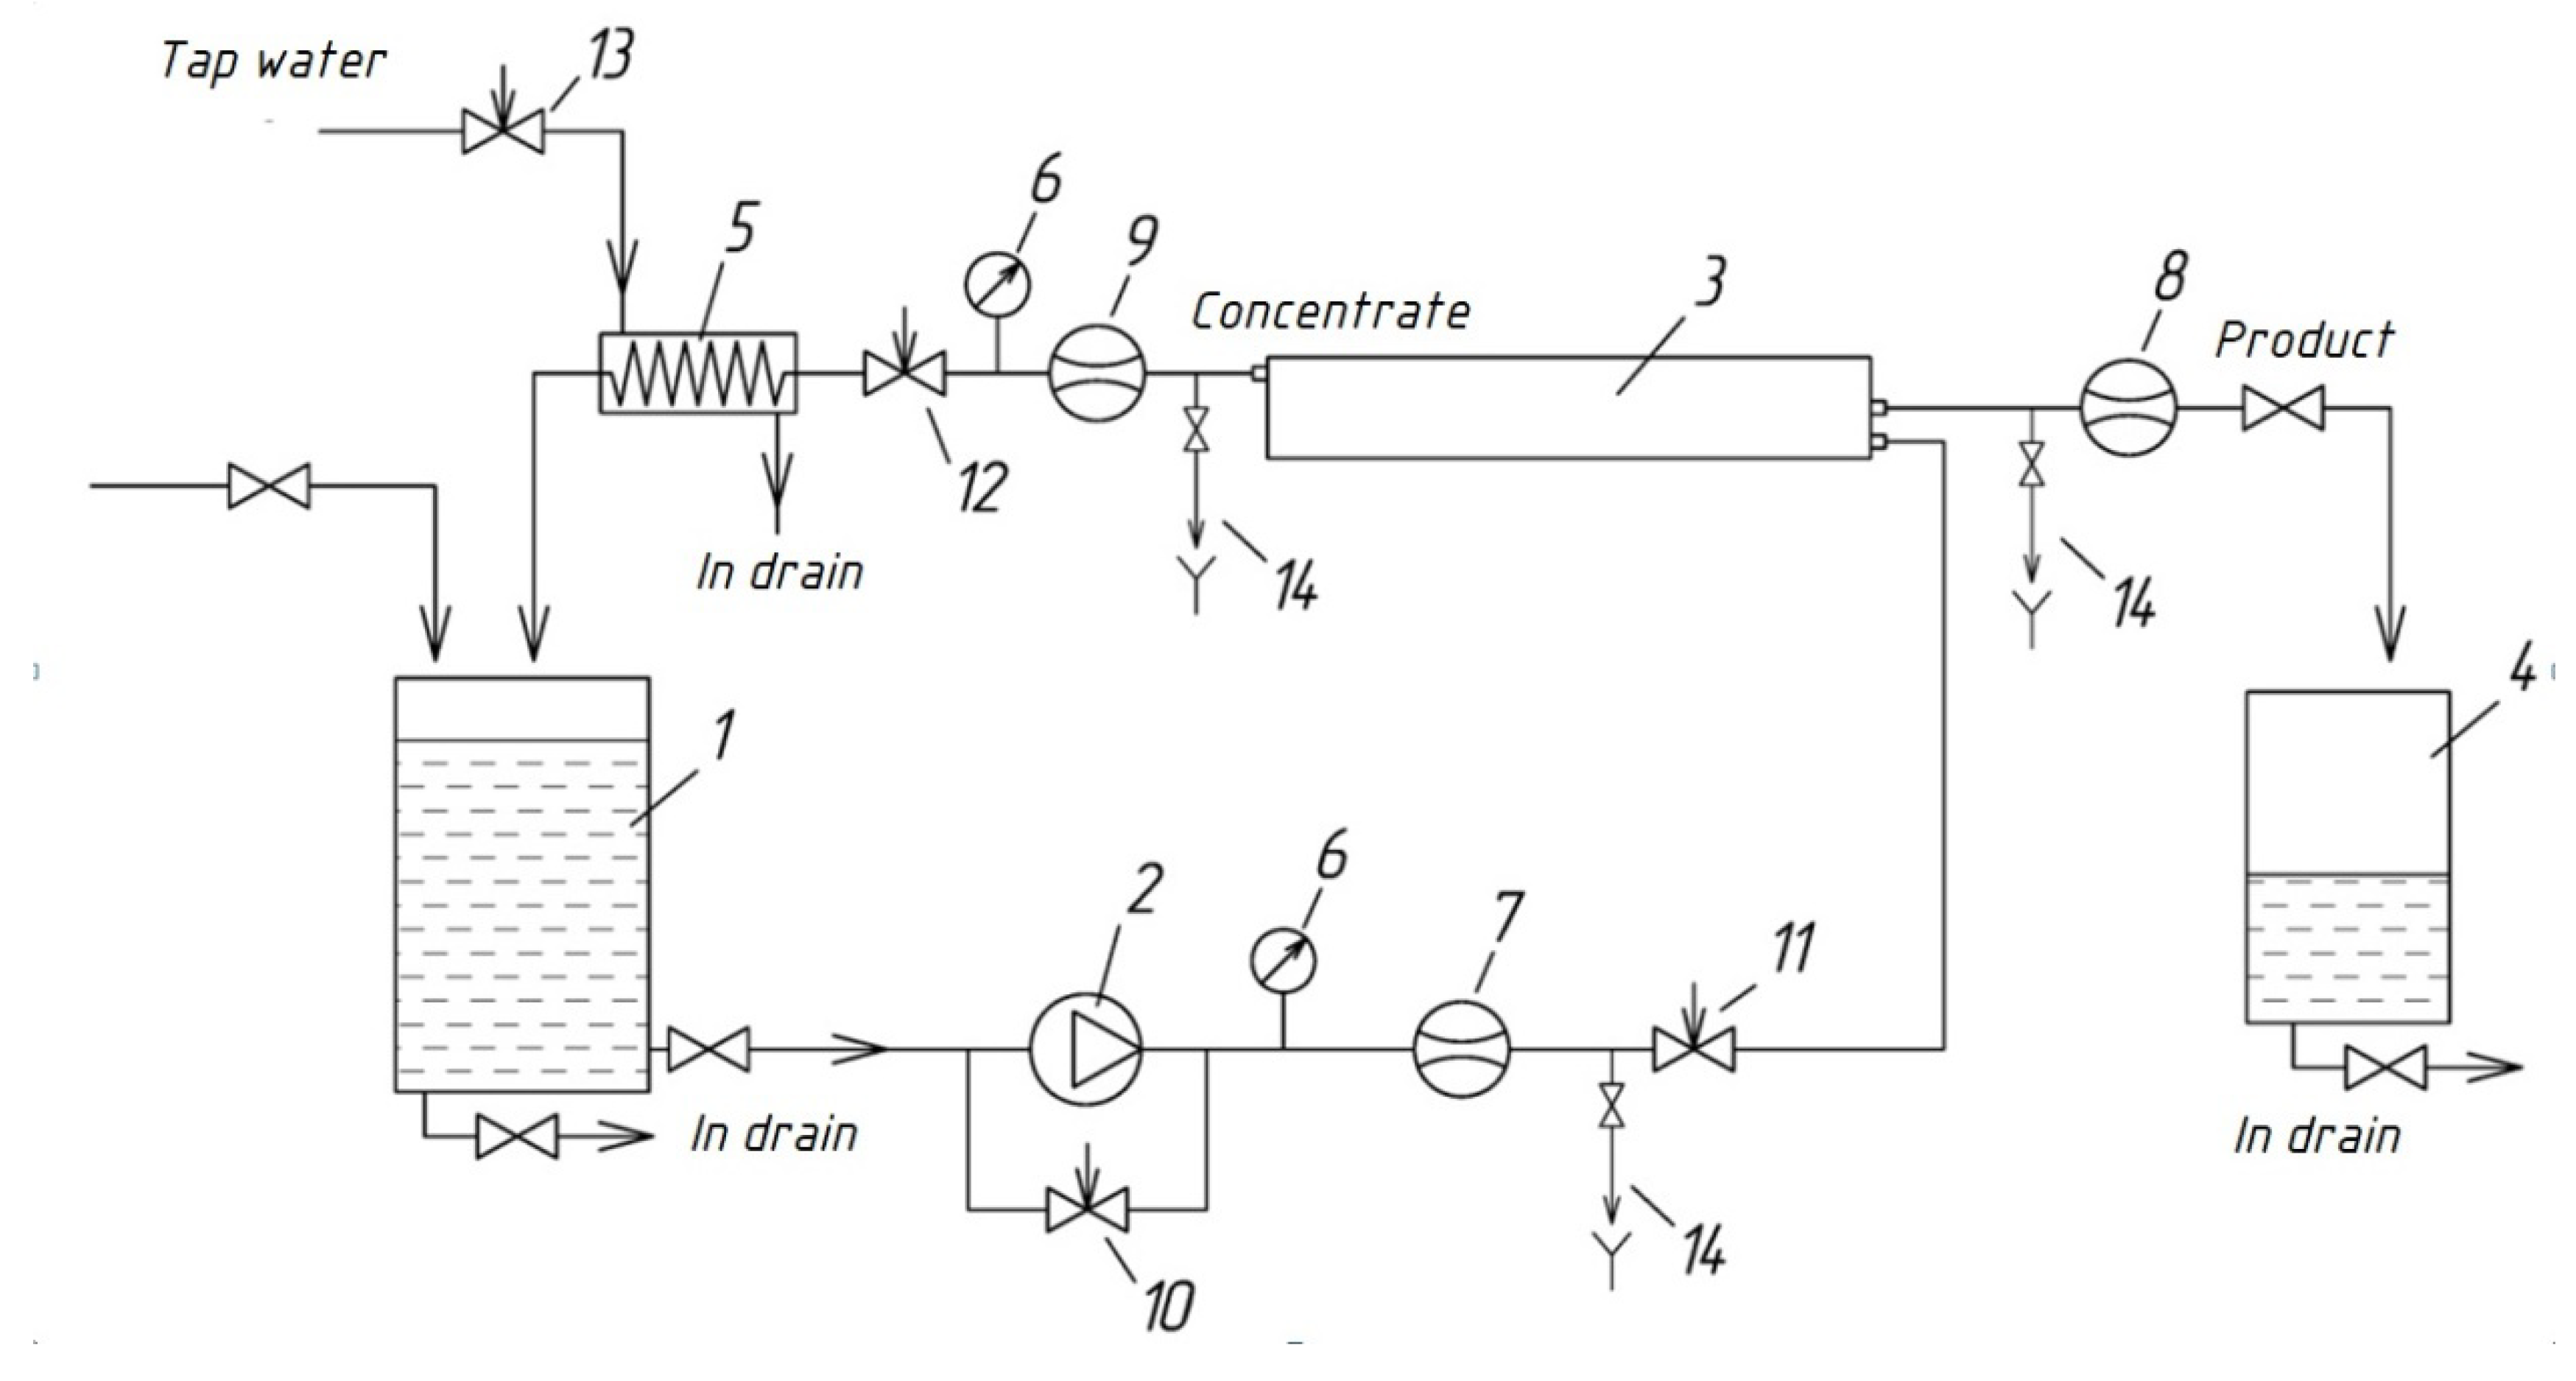
2.2. Reverse Osmosis Membrane System

Gypsum scaling experiments were carried out using an automatically controlled laboratory-scale cross-flow RO spiral wound module RE 1812 tailored with thin film composite BLN membrane (Figure 2). The test unit was operated in circulation mode whereby concentrate after membrane module was returned back to feed water tank. The feed water was added to feed water tank 1. The volume of tank 1 was 5 L. Feed water from tank 1 was supplied by small gear pump 2 to membrane module 3. In all experiments the commercially available spiral-wound filter elements (CSM RE1812-80 GPD) made of polyamide and manufactured by CSM (Seoul, South Korea) were used. These operated at constant feed flow rate of 72.0 ± 0.2 dm3/h, permeate flow rate of 6.0–6.3 dm3/hour, constant temperature of 25.0 ± 2 °C; constant pressure 7.0± 0.2 bar in concentration mode.
Stabilized salt rejection, at a constant pressure of 7 bar, a solution temperature of 25 °C, and a pH value of 6.5–7.0 is reported to be 96.5–97.0% for a 200 mg·dm3 NaCl solution (manufacturer’s data). Each run was performed with a virgin membrane sample.

2.3. Gypsum Scaling Experiments

The gypsum scale formation studies, included three blank experiments (A,B,C) and a gypsum scale inhibition test run in presence of PAA-F1 (GSI), Table 2, Figure 3, Figure 4, Figure 5, Figure 6, Figure 7, Figure 8 and Figure 9. Each of the blank experiments had its own objective. Blank A experiment was intended to evaluate “free” PAA-F1 sorption by membrane in concentration operating mode. Within the frames of this experiment, the PAA-F1 concentration was monitored directly by fluorescence intensity measurements of aqueous phase in retentate and in permeate tanks, Figure 2. To the extent that no antiscalant was found in permeate, the difference between the calculated total PAA-F1 concentration in retentate + membrane system (Figure 3A, curve a) and its experimentally-measured concentration in retentate (Figure 3A, curve c), indicated an amount of PAA-F1 consumed by membrane (Figure 3A, curve b). For simplicity and clarity, here, and further the membrane-consumed PAA-F1 is expressed in units of concentration as the loss of the bulk antiscalant concentration relative to the total concentration.
An objective of the Blank B experiment (Figure 4) was to estimate a possible PAA-F1 participation in side reaction with Ca2+ ions, followed by its undesirable consumption by calcium due to formation of insoluble Ca0.5xHyPAA-F1·nH2O (0.5x + y = 1) salts (these are indicated further as [Ca-PAA-F1]). A PAA-F1 distribution between retentate and membrane (Figure 4) was found in the same way as in a Blank A experiment.
Blank C experiment (Figure 6) was intended to demonstrate a non-inhibited RO membrane gypsum scaling as a reference to the inhibited one. Variations of Ca2+ concentration in a Blank C experiment was monitored by an immediate titration of calcium with EDTA in samples taken from retentate and permeate tanks (Figure 6b,c). Then, a total calcium concentration in retentate + membrane was calculated (Figure 6a) as a difference between the calculated total Ca2+ concentration in the system and its experimentally found content in permeate (Figure 6c). Then, the calcium content on membrane surface as gypsum (Figure 6d) was found, and expressed in units of calcium concentration decrease in the same way as it was done for PAA-F1 distribution in the Blank A and B experiments.
Individual gypsum scaling experiments were performed with a virgin sample of pre-soaked membrane. Each membrane was initially contacted with distilled water overnight (12–14 h) to allow the membrane permeability to stabilize. The experimental protocol for the scaling tests in cross-flow RO membrane filtration is presented in Table 2. Experiments were run with a single superficial cross-flow velocity and were terminated after reaching K = 5. The cross-flow velocity varied from 3.0 to 3.6 cm/sec, which excluded influence of concentration polarization on gypsum supersaturation at membrane surface. This value adequately fits the range of cross-flow velocities encountered in spiral-wound RO/NF.
At the end of each experimental cycle, scaled membrane samples were carefully extracted from the autopsied membrane element and submerged in an ultrapure water bath for approximately 2 s to prevent further crystallization from evaporation of residual scaling solution. The membrane samples were then air dried for at least 48 h and afterwards cut into ten equally sized pieces of 4 cm × 10 cm. These pieces were stored in a desiccator for at least 24 h. Then the fragments were sent for analysis by scanning electron microscopy (SEM) and by fluorescent microscopy (FM).
Each test was run with a new virgin membrane spiral wound element in two replicates. Pressure and retentate cross-flow rate were monitored through digital sensors. The permeate volume was continuously recorded. The temperature was almost constant (varying by less than 2 °C) during each experiment at a level of 25 °C. The liquid phase was periodically sampled and also examined by laser confocal microscopy, dynamic light scattering (DLS), and the current Calcium content was measured by titration with EDTA. During the blank experiment with PAA-F1, content of antiscalant was monitored by fluorescence intensity measurements (Shimadzu RF-6000).
The concentration of 0.015 mol·dm−3 of the starting gypsum solution was chosen to be used in the experiments, which corresponds to an undersaturated state. In all runs with antiscalant, the PAA-F1 solution was initially added to the sulfate brine, equilibrated, there for half an hour, and only after that the calcium brine was added to obtain the total 5 L volume of a feeding solution. Totally four cross-flow tests have been run it two replicates each, Table 2.

2.4. Fluorescent Microscopy Measurements

Confocal microscopy measurements have been run with laser scanning confocal microscope LSM-710-NLO (Carl Zeiss MicroImaging GmbH, Jena, Germany), 20× Plan-Apochromat objective (NA = 0.8). The samples were placed onto the Petri dish with a glass bottom 0.16 mm thick. The fluorescence of the PAA-F1 was recorded in the wavelength range of 500–600 nm, when excited by laser radiation with a wavelength of 488 nm. As a result, overlay of the distribution of PAA-F1 fluorescent image (green pseudo-color in images) and transmitted light image (grey color) was obtained. Notably, all the retentate samples have been taken and analyzed by confocal microscopy within 2–3 min after sampling.

2.5. Fluorescence Intensity Measurements of Aqueousphase

PAA-F1 concentration in aqueous phase was monitored by fluorescence intensity measurements, carried with luminescence spectrometer Shimadzu RF-6000 (Shimadzu Corporation, Kyoto, Japan) operating with a xenon lamp as a light source. All spectral measurements were carried out in a quartz sample cell (path length ℓ = 1 cm) at 20 ± 1 °C in air-saturated solutions. The fluorescence intensity was measured at a wavelength of 462 nm (2 nm slid width).

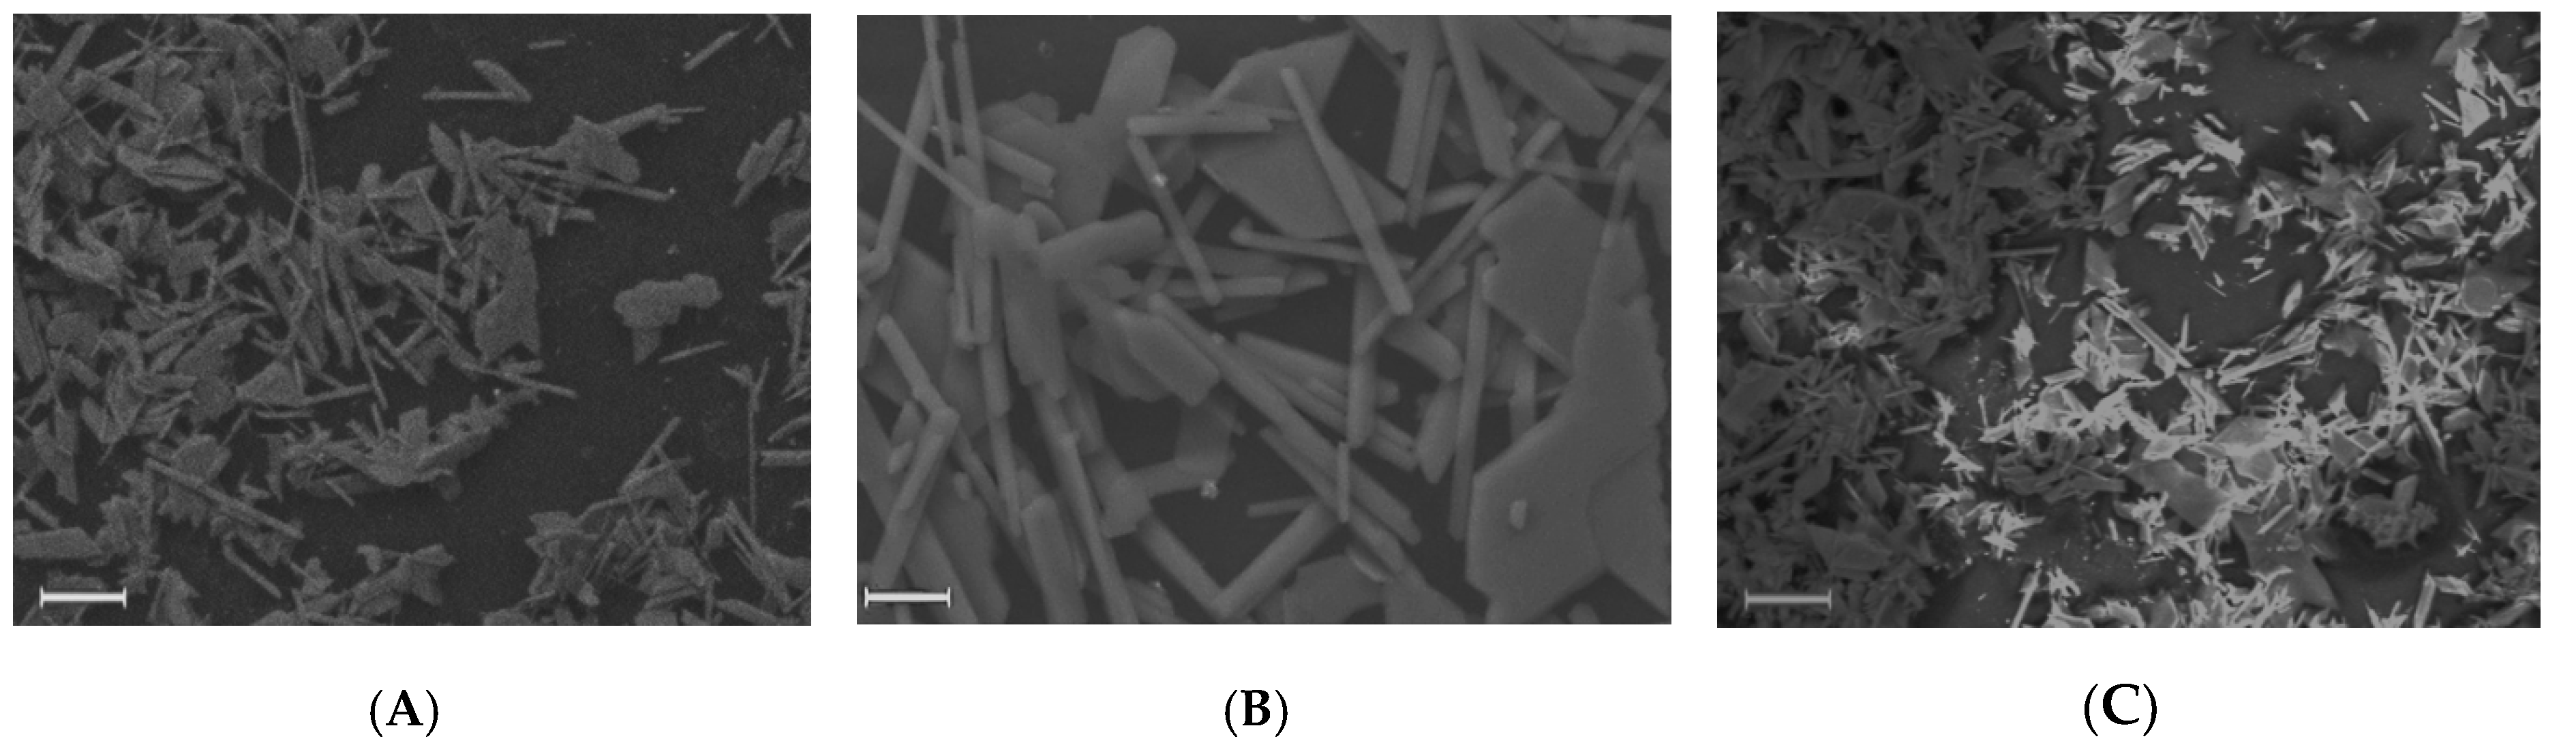
2.6. SEM Crystal Characterization

The membrane pieces with precipitated solids, after being triply rinsed with deionized water and air dried at 20–25 °C, were characterized by scanning electron microscopy (SEM, TM-3030, Hitachi, Japan). The sample examinations by SEM were done at 15 kV accelerating voltage in a Charge-Up Reduction Mode with crystal phase located on a Conducting Double-Sided Tape and the working distance of 4.1 mm.

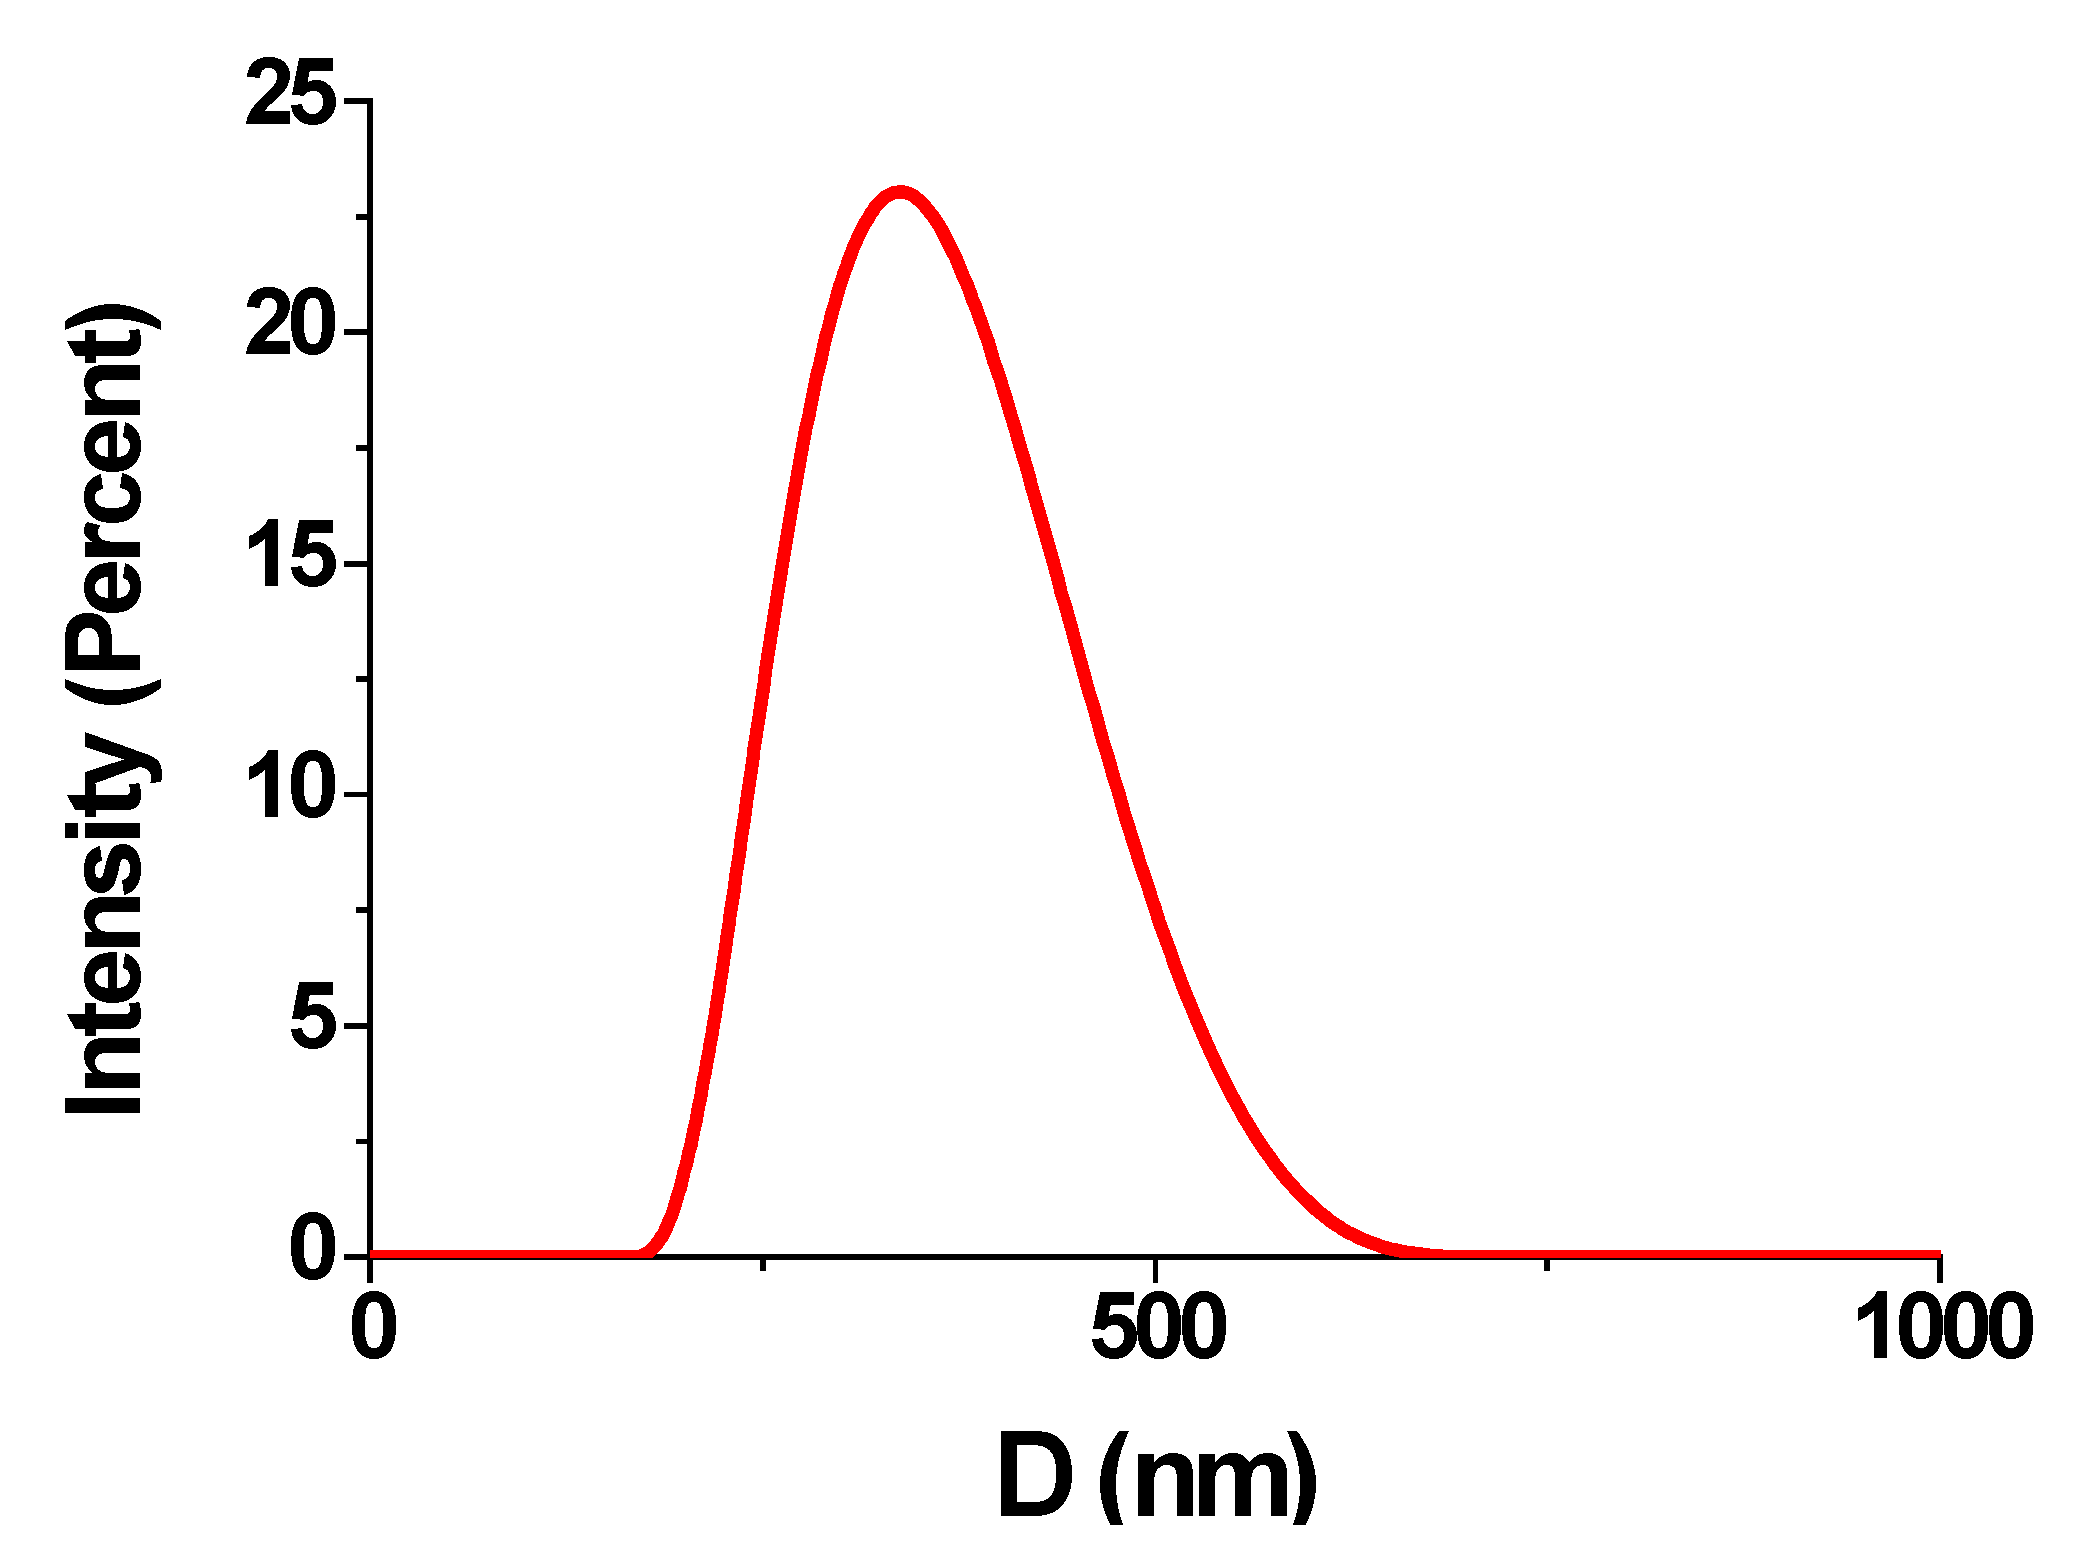
2.7. DLS Characterization of Retentate

Liquid phase was monitored by the dynamic light scattering technique. DLS experiments were performed at 25 °C with Malvern Nano ZS instrument (λ = 633 nm, operating power 4 mW) at θ = 173°. Gypsum was always taken as a light scattering material even for the pure PAA-F1 solutions.

3. Results and Discussion

All experiments were monitored in a liquid phase along the retentate saturation (fluorescent microscope, DLS, fluorescence intensity, pH and calcium concentration measurements) and were followed by a final SEM analysis of solid membrane surface after each run.

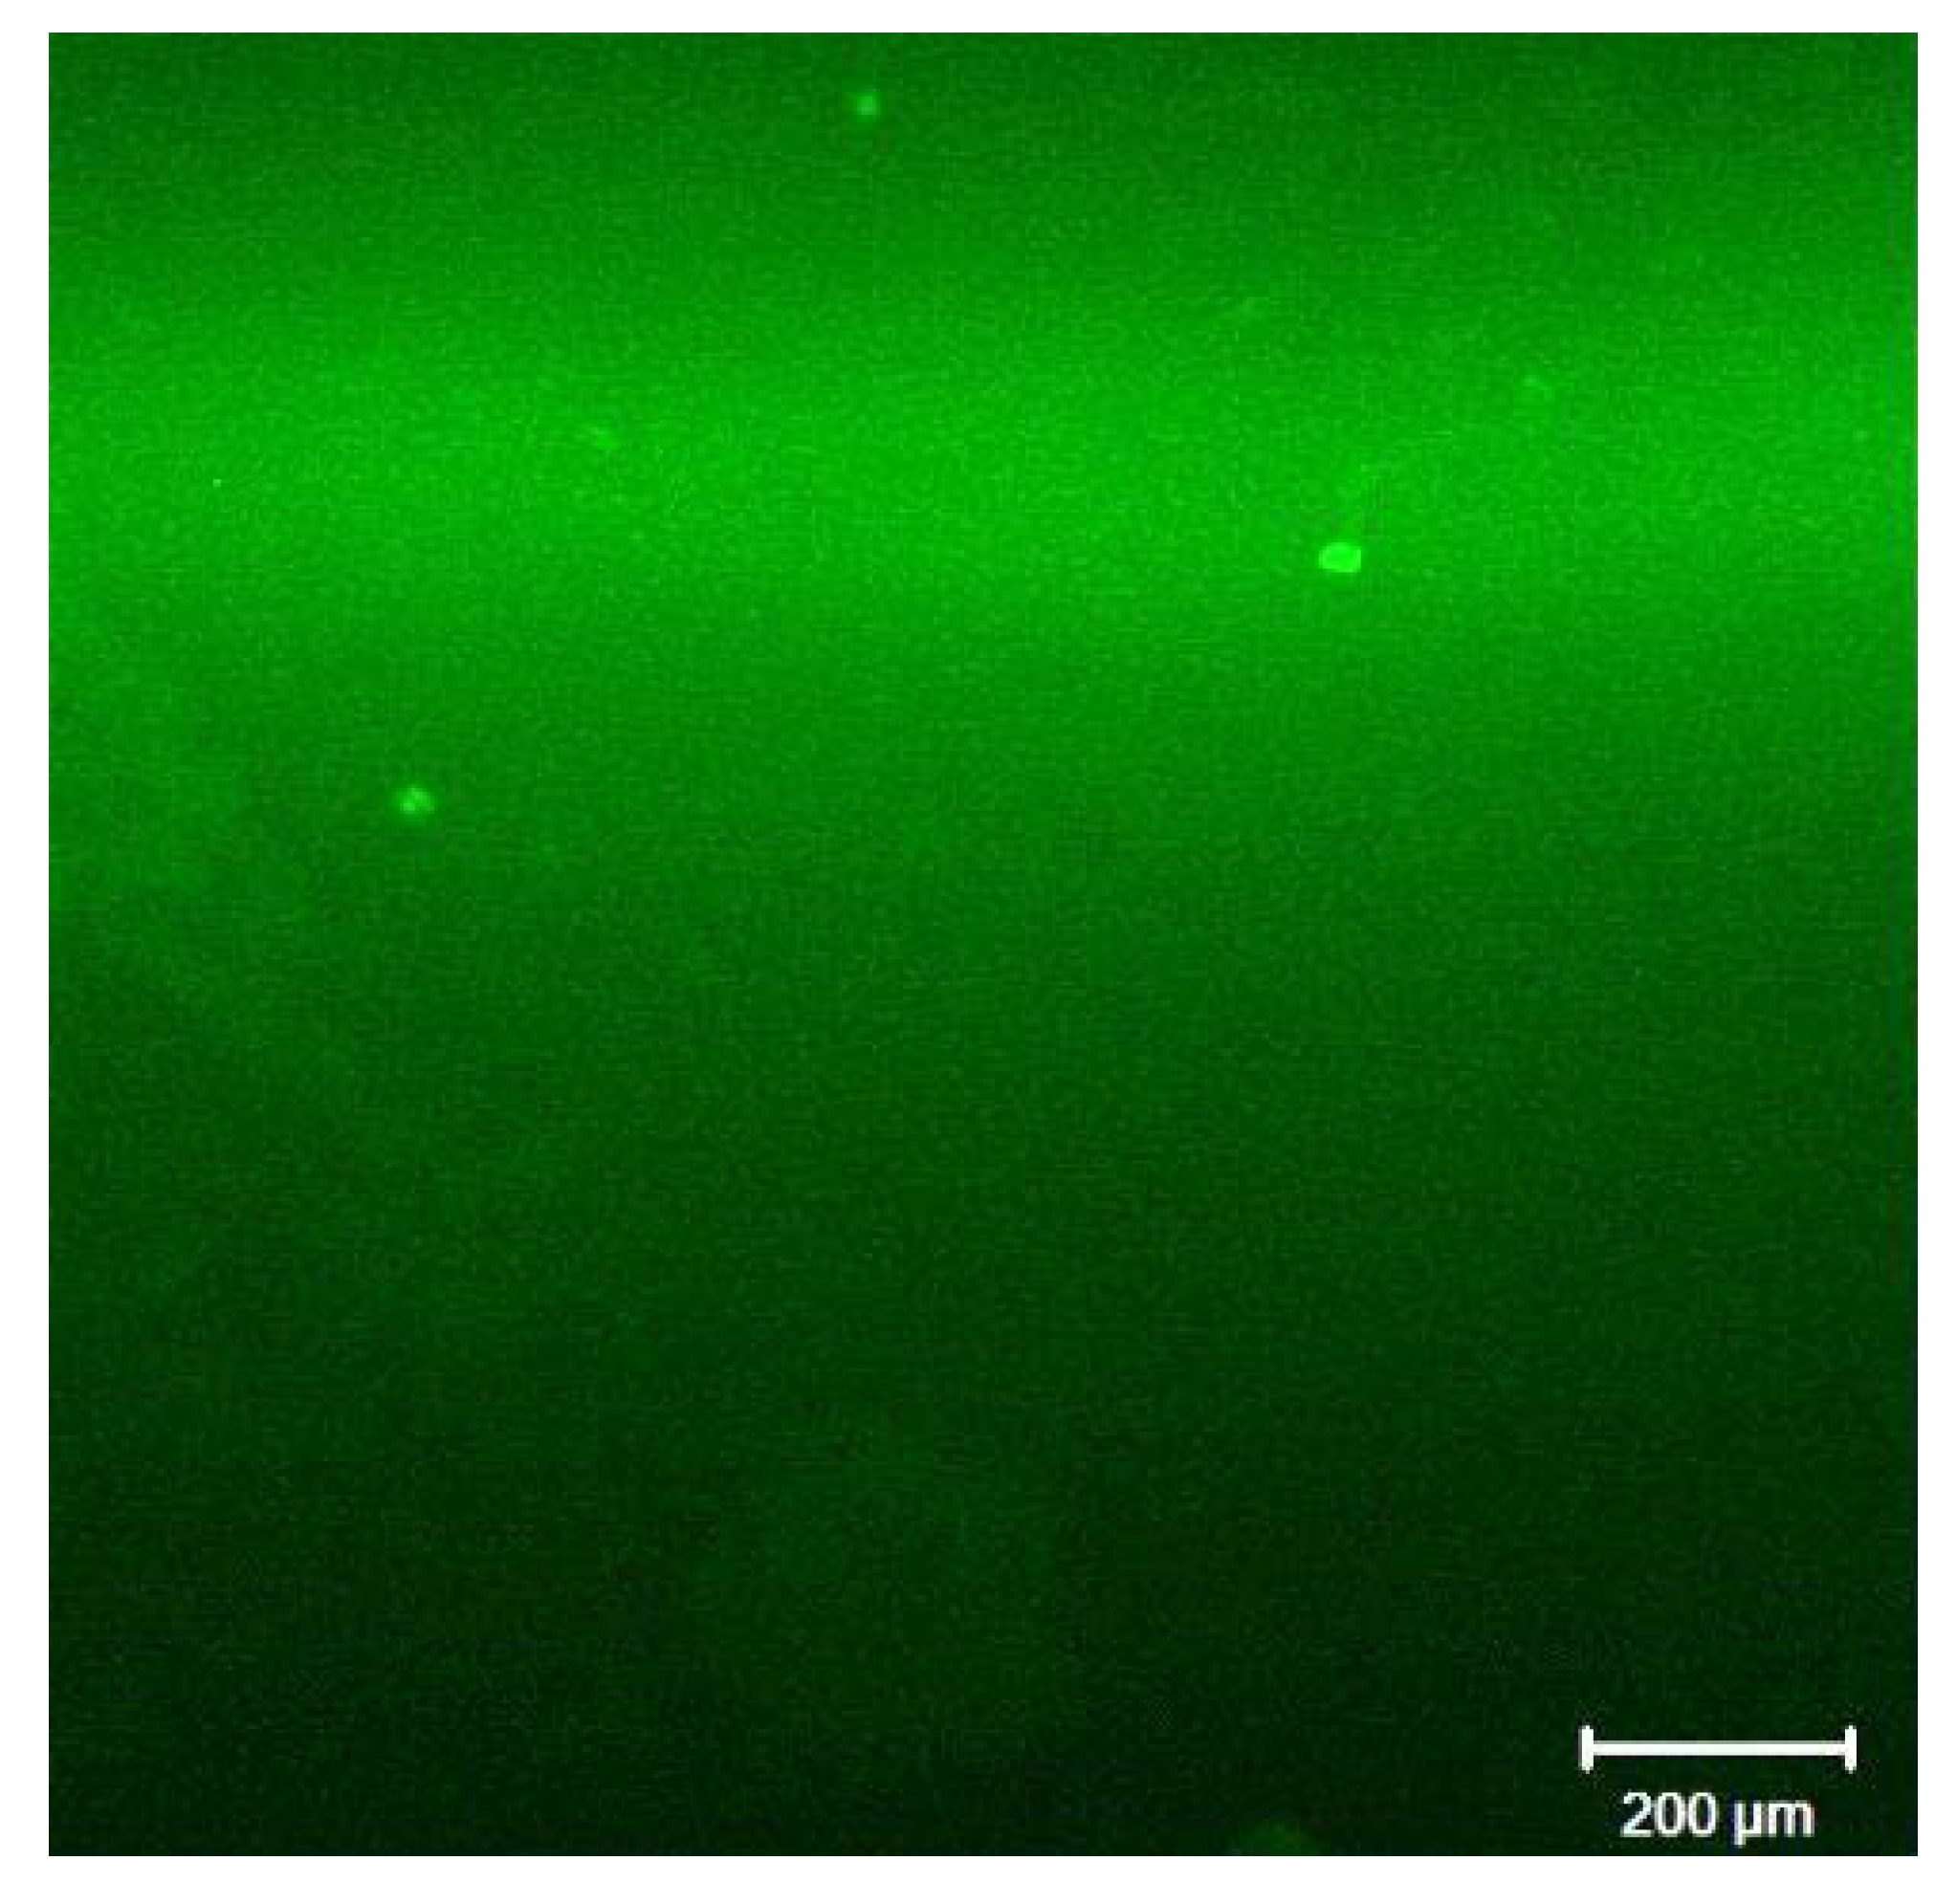
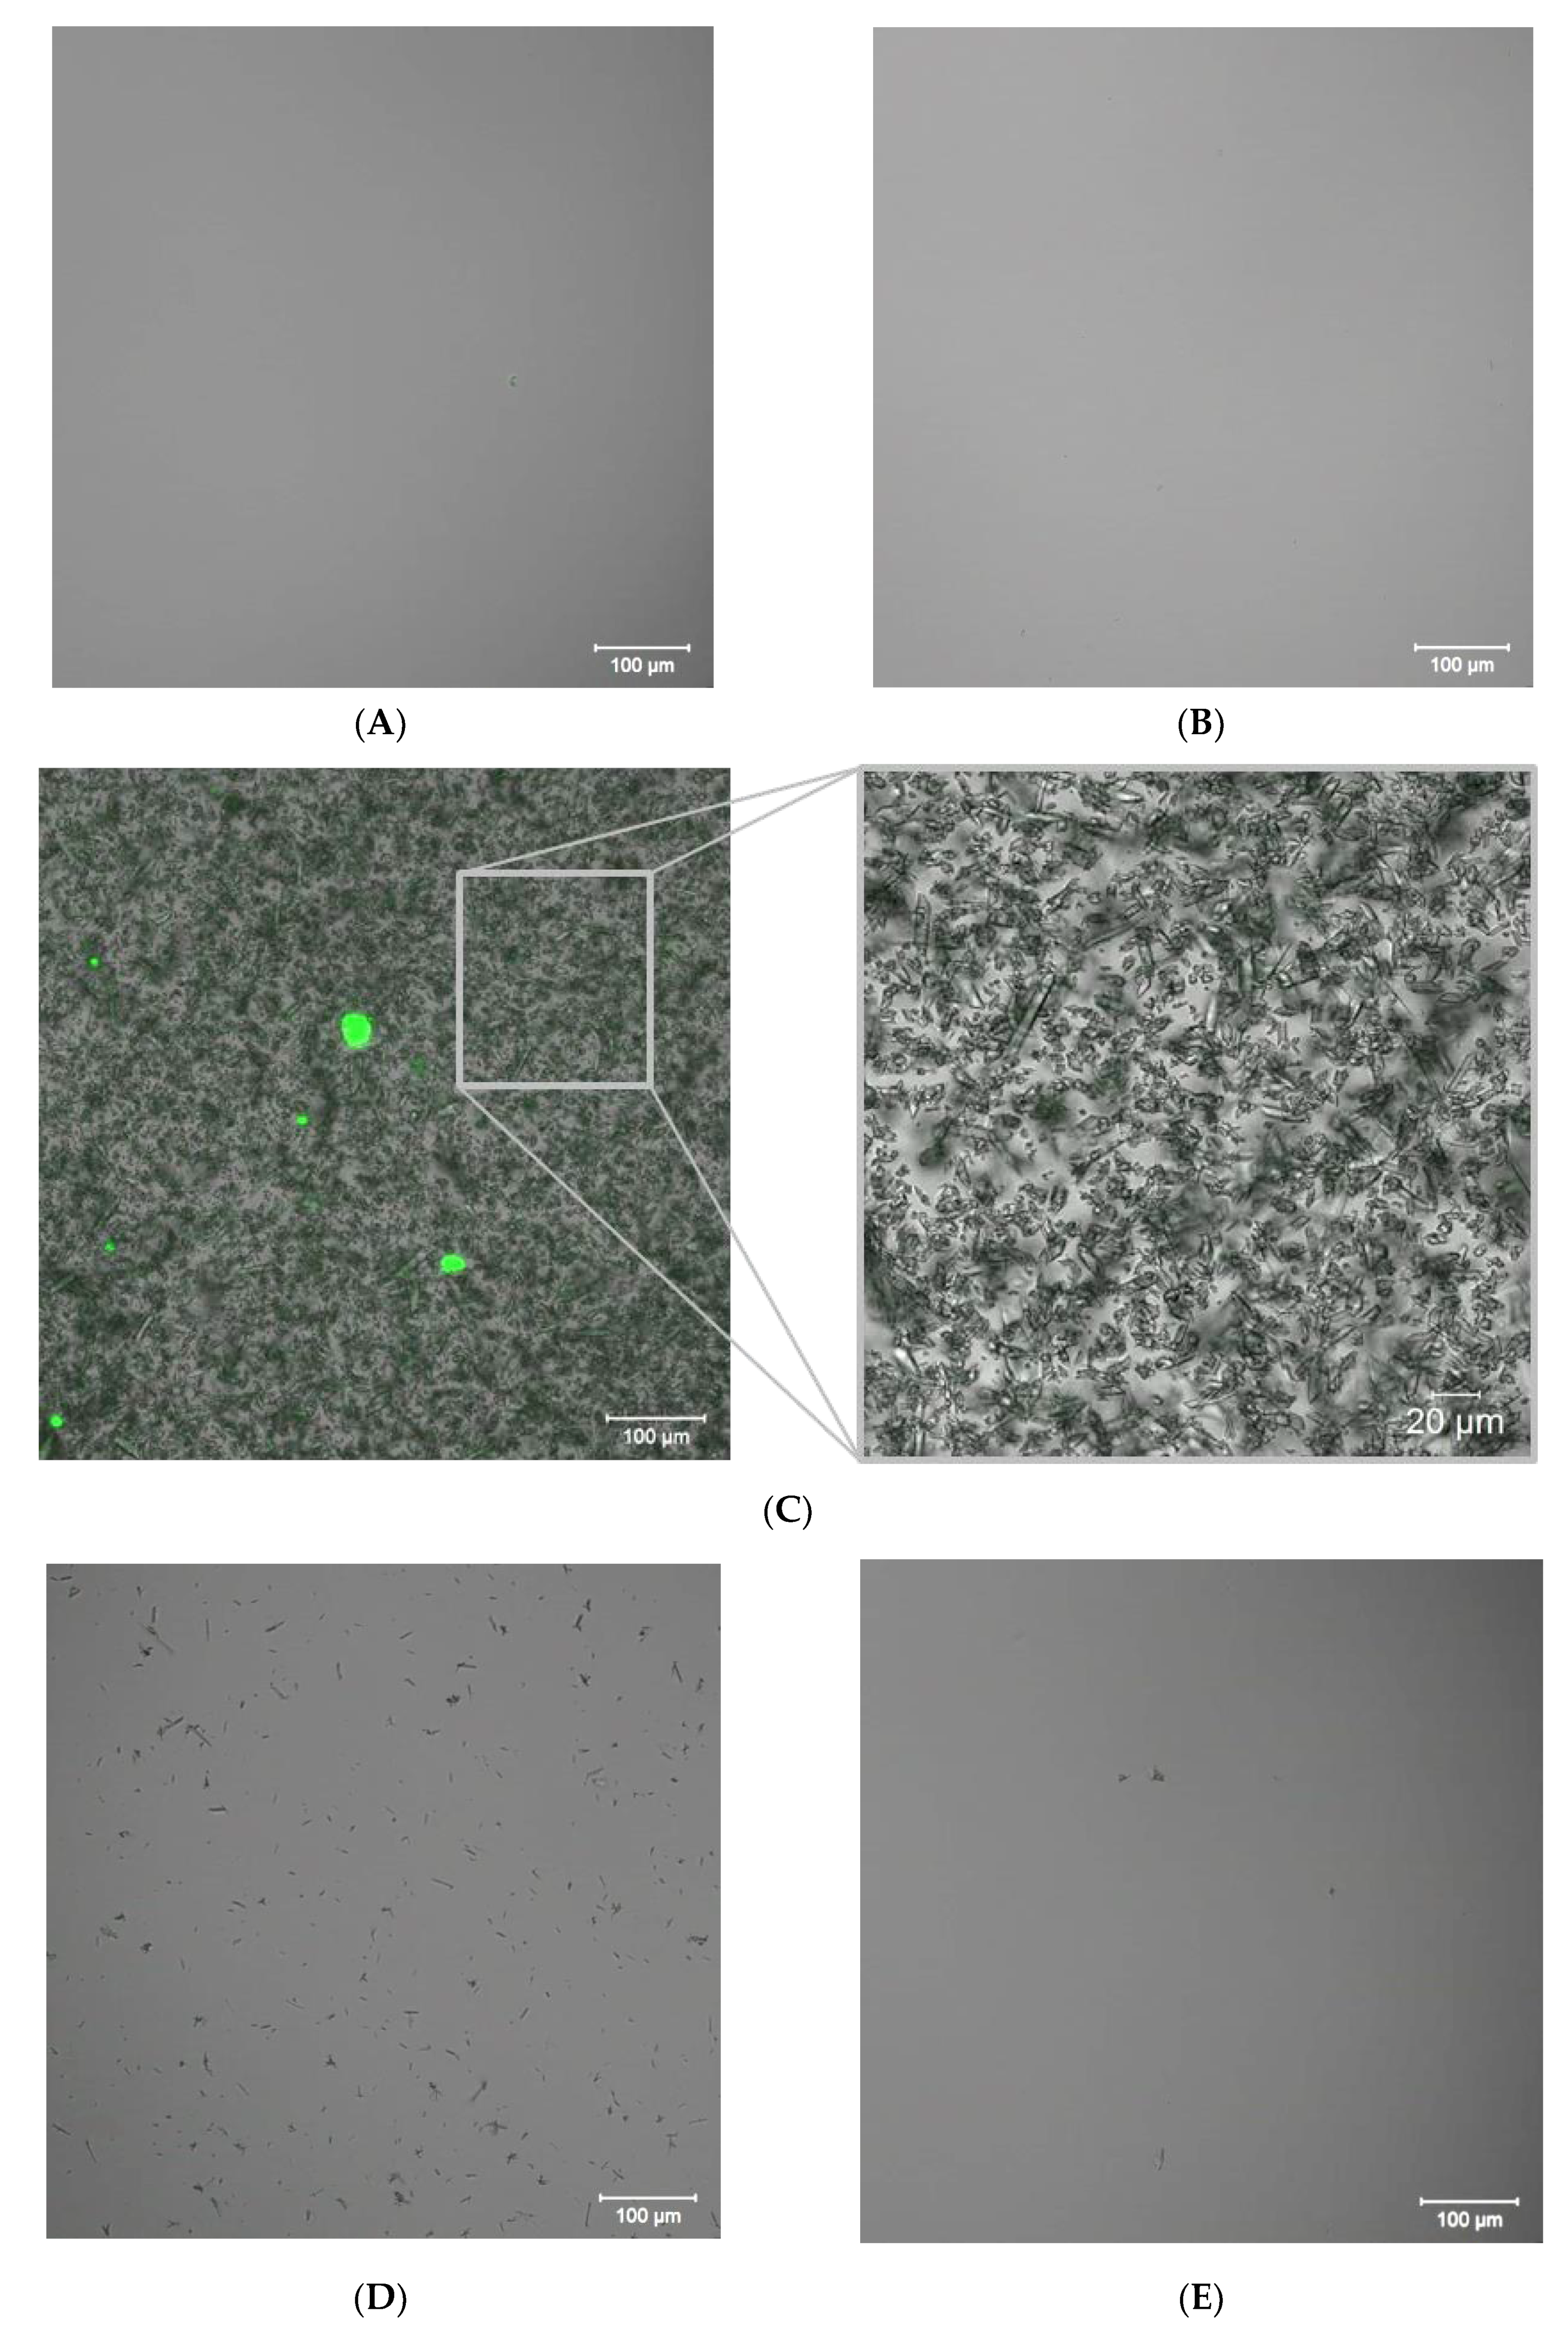
3.1. Blank A Experiment Results

This blank experiment was intended to evaluate “free” PAA-F1 sorption by membrane in concentration mode run in distilled water, Table 2. The periodic fluorescence intensity measurements of retentate reveal an increasing sorption of PAA-F1 as K is changing from 1 to 5, Figure 3A.
At the same time, no detectable PAA-F1 concentration was found in permeate. Therefore, an antiscalant sorption by membrane was estimated as the difference between the PAA-F1 total content and its real content in liquid phase. Location of PAA-F1 on membrane might provide an isolation of potential gypsum crystallization centers there. At the same time PAA-F1 “free” concentration remains at the level of 7 to 12 mg·dm−3, which is capable to provide scale inhibition in the bulk aqueous phase. Meanwhile DLS reveals no notable content of PAA-F1 globules in aqueous phase.

3.2. Blank B Experiment Results

This experiment is intended to estimate possible PAA-F1 participation in its side reaction with excess of Ca2+ ions via formation of soluble CanPAA-F1 complexes. Indeed, Figure 3B demonstrates some changes relative to Figure 3A. It exhibits that calcium ions do interact with PAA-F1 forming colloid solutions. This manifests in some decrease of fluorescence intensity relative to the Blank A experiment already at K = 1, and in arrival of a light scattering band, indicating formation of CanPAA-F1 colloids with a mean size of c.a. 400 nm, Figure 4.
Indeed, the individual CanPAA-F1 aggregates are then detected on the membrane surface as bright green spheres with a size ranging from 10 to 20 μm, Figure 5.
Notably, an excess of calcium ions relative to antiscalant, forces PAA-F1 to concentrate preferably in [Ca-PAA-F1] moieties, located both in a liquid phase and on a membrane surface. Meanwhile PAA-F1 “free” concentration remains at the level of 2 to 7 mg·dm−3, which is still capable to provide scale inhibition in the bulk aqueous phase.

3.3. Blank C Experiment Results

This experiment has to demonstrate non-inhibited RO membrane gypsum scaling as a reference to the inhibited one. Figure 6 reveals a linear increase of Ca2+ content from 0.015 up to 0.025 mol·dm−3. When CaSO4·2H2O saturation is achieved (K = 2), the Ca2+ concentration reaches the maximum. Then [Ca2+] decreases due to the gypsum crystals deposition, and at the final moment (K = 5) [Ca2+] corresponds almost to its initial level. At the same time 80% of calcium gets deposited as gypsum scale on membrane surface.
The corresponding scale on membrane surface fits well typical stick-shaped gypsum crystals morphology [6], Figure 7A,B. These images leave an impression that the scale is formed by crystal precipitation from the bulk, rather than by their initial formation on the membrane surface: several crystals lying on top of each other are clearly visible.

3.4. GSI Experiment Results

Figure 6 demonstrates a PAA-F1 inhibited RO membrane gypsum scaling (Figure 6c’) relative to the un-inhibited one (Figure 6c). Like in a blank experiment, an increase of Ca2+ content from 15 mmol·dm−3 (K = 1) up to 48 mmol·dm−3 at K = 3 is observed (Figure 6c,c’). This corresponds to the gypsum saturation SI~2. Then [Ca2+] decreases due to the gypsum crystals deposition, and at the final moment (K = 5) it corresponds almost to its initial level, Figure 6c’. A variation of calcium concentration with K in retentate for a Blank C and GSI experiments is nearly the same for K ≤ 1.5, e.g., before gypsum starts to form, Figure 6c,c’. When K > 1.5 the crystals of CaSO4·2H2O start to form in the Blank C experiment, while in presence of PAA-F1 this process starts at K>3, and the gypsum formation goes slower relative to the blank run. A significant shift of curve “c’ ” (GSI experiment) relative to curve “c” (blank experiment) clearly indicates that an effective inhibition takes place. For K = 3 PAA-F1 reveals c.a. 90% inhibition, and for K= 4 − c.a. 60%.
Fluorescent images of retentate (Figure 8) correspond well to the calcium content data, Figure 6c’. Indeed, there are no any crystals in the stock solution (K = 1) and at K = 2 saturation level, Figure 8A,B. At K = 3 gypsum deposition starts. The corresponding image (Figure 8C) indicates the landslide formation of numerous gypsum stick-like crystals with a mean size c.a. 10 to 20 µm. These are much smaller than those found later on the membrane surface after GSI experiment is finished, Figure 7C. Images (Figure 8C) leave no doubt that the major location of gypsum crystals formation is the bulk retentate solution, but not the membrane surface. Most of them have no any traces of antiscalant presence neither on their surface, nor inside of the crystals, Figure 8C–E. Meanwhile, the big bright green spherical solids with diameter ranging from 10 to 50 μm belong to the solid particles of pure [Ca-PAA-F1] complexes, which do not have any gypsum inclusions, Figure 8C. Bearing in mind that there are 360 g of gypsum per 1 g of PAA-F1, their size indicates that almost all antiscalant is concentrated in [Ca-PAA-F1] particles.
Indeed, if it is assumed that [Ca-PAA-F1] species form 100 nm size primary spherical particles, then each green sphere presented in Figure 8C corresponds to an aggregate of 105–107 such particles. Thus most of PAA-F1 and gypsum seem to form solids by itself with no interaction with each other. This observation is very similar to that one found by us previously for HEDP-F/gypsum system [22]. For K = 4 most of gypsum and of [Ca-PAA-F1] complexes are deposited on membrane surface. Therefore much less gypsum crystals remain in the bulk solution, Figure 8D. At K = 5 only a few gypsum crystals remain in the bulk retentate, while the rest are completely deposited on membrane, Figure 7C and Figure 8E.
Notably, the size and shapes of gypsum crystals deposited in presence of PAA-F1 (Figure 7C) are similar to those, observed in a Blank C experiment, Figure 7A. This indicates that there is very little interaction of antiscalant with gypsum if any during its growth stage. Meanwhile, the size of CaSO4·2H2O crystals at the end of GSI experiment (Figure 7C) is at least twice bigger than of those formed in the bulk solution at K = 3 (Figure 8C). Thus, it is likely that, after fast formation in the bulk medium at K=3, the gypsum crystals pass sedimentation and proceed to grow already on membrane surface.
Although, there is no bulk crystal formation detected by fluorescent microscopy for K < 3 (Figure 8A,B), the DLS experiment, run in a parallel way, reveals an intensive formation and aggregation of colloids already at K = 1 and K = 2, Figure 9a,b.
These data are unable to distinguish gypsum and [Ca-PAA-F1] particles, but they provide some additional information on what happens in a transparent retentate before visible gypsum crystals appear. However, DLS gives some independent approval of heterogeneous mechanism of gypsum particles in the bulk: it clearly indicates that CaSO4·2H2O and/or [Ca-PAA-F1] aggregates appear in retentate almost immediately after saturation starts. Indeed, according to the classical crystallization theory [23], this is possible only in the case, when gypsum passes bulk heterogeneous nucleation, and exactly the “nanodust” plays the role of the solid phase template.
It should be noted that PAA-F1 is more efficient than HEDP-F in a gypsum scale formation inhibition, reported in [22]. In a similar experiment, run under the same conditions, HEDP-F provides supersaturated gypsum solution stabilization only for 1 < K ≤ 2 [22], while PAA-F1 is effective for 1 < K ≤ 3. This result is in a good agreement with a sequence found earlier in the batch experiments for the non-fluorescent analogues HEDP and PAA: PAA>>HEDP [34].

3.5. Tentative Mechanism of Gypsum Membrane Fouling Inhibition by PAA-F1 in RO Process

PAA-F1 has definitely proved itself as an effective antiscalant in gypsum brine RO desalination, Figure 6. This was also confirmed earlier by the static experiment tests [36]. However, the visualization of PAA-F1 molecules indicates clearly that there is no definite interaction between antiscalant and gypsum along the brine RO treatment. The same result was obtained earlier for HEDP-F/gypsum RO desalination process [22] as well as for batch static experiments with gypsum [20] and barite [21] in presence of HEDP-F. A tentative mechanism of gypsum inhibition in RO membrane fouling is proposed [22] and our present data for PAA-F1 give a further approval to this hypothesis.
This mechanism involves interaction of foreign solid impurities (“nanodust”), which are always present in RO brines (Table 1), with antiscalant. In the absence of scale inhibitor the gypsum nucleation has a heterogeneous origin with solid foreign particles (“nanodust”) serving as nucleation centers in the bulk retentate solution. Antiscalant molecules block these nucleation centers partly or completely, via sorption on their surface before retentate gets supersaturated relative to gypsum. Thus, when gypsum solution gets supersaturated, the potential sorption centers on the surface of “nanodust” particles become much less available for gypsum layers formation. This hampers and retards the process of scale formation.
Indeed, as it was mentioned earlier, there are at least 106 molecules of PAA-F1 (with a mean number of 50 monomer units, e.g., 4000 Da) per one nano/microdust particle in the system studied. A simple calculation indicates, that one PAA-F1 molecule is capable to cover 4 nm2 of a particle surface, being completely stretched, Assuming that all nano/microdust particles have an equal size of 100 nm and an ideally spherical form, there are only 7.9·103 molecules of PAA-F1 needed to cover the whole single particle surface by a monolayer. An option to occupy only some active centers diminishes this number, while globular conformation of polymer molecule increases it. Evidently PAA-F1 is capable to cover all potential nucleation centers several times. Anyhow a supposition that it blocks a sufficient part of them is a quite realistic one.
On the other hand, although a high excess of PAA-F1 over nano/microdust particles surface area slows down gypsum scale formation, it does not stop this process. Therefore, both CaSO4·2H2O and [Ca-PAA-F1] phases are formed in a parallel way braking each other, as they compete for one and the same set of natural nucleation centers (colloid impurities) present in retentate. Notably, our conclusions derived from antiscalant visualization are perfectly supported by the independent DLS studies [38,39].
At the same time our results conflict somehow with the conclusions of numerous reports on static gypsum crystals formation in supersaturated aqueous solutions [24,25,26,27,28,29,30,31,32,33]. All these studies are built on the grounds of homogeneous nucleation scenario, excluding the possibility of “nanodust” presence. Meanwhile, the “nanodust” was surely present in these experiments, that all use Sigma-Aldrich high purity reagents (>98–99%), a double-deionised boiled water, and (in some cases) stock solutions filtration operating 200 nm filter. However, none of these solutions was then examined for the residual solid nanoparticles content. In order to make the situation clear, we have done a blank test, operating model Sigma-Aldrich KCl salt (ACS reagent, 99.0–100.5% CAS 7447-40-7) and a particle counter. Then KCl was dissolved in deionized water (340 particles bigger than 100 nm in 1 mL) to make 0.1 mol·dm−3 solution. This KCl solution revealed 268000 particles bigger than 100 nm in 1 mL. This solution was filtered with 220 nm filter and a “purified” solution demonstrated still 1540 particles bigger than 100 nm in 1 mL. A homogeneous scenario was unlikely to take place in [24,25,26,27,28,29,30,31,32,33] as an energy barrier for crystals nuclei formation is much lower for heterogeneous scenario, than for homogeneous one [23].
It should be noted that in an excellent study by Nicoleau, Van Driessche and Kellermeier [30] on static gypsum crystallization, in the presence of polyacrylate and of some other polymers, run on the other grounds, a conclusion was partly similar and partly alternative to ours. It was indicated that the polymers do not change the nature of the nucleating primary species, but rather modulate their subsequent growth and/or aggregation increasing the viscosity of the solution. However, the authors of this study [30] did not control “nanodust” content and could not monitor the polymer location. On the other hand, we did not control the viscosity. Our data could be a valuable supplement to the studies [24,25,26,27,28,29,30,31,32,33].
Our recent results [20,21,22], and the data of a present study, indicate the importance of natural background particles for scale inhibitors application strategies. As ppb impurities, these are always present in any ultrapure reagent or solvent, specially prepared for microelectronics, to say nothing of technical grade purity reagents and brackish water commonly used in RO technologies. The particular chemical nature of this “nanodust” is a challenge for researchers, as far as it is hardly possible to isolate them completely from a liquid phase. In our opinion, these solid impurities are chemically non-uniform, and their different ingredients have different affinity towards scale material and antiscalants. Their composition may vary between water samples. At present, only a rough and incomplete estimation of its chemical composition and particle size distribution is feasible. However, even the treatment of “nanodust” as a “blackbox” may become very fruitful.
At the same time, the fluorescent antiscalants may become a promising tool in scale formation studies. This method has very high sensitivity and is widely used in analytical applications [35] as well as a powerful traceability approach in medicine [40]. Normally, the method sensitivity corresponds to the ppb level for both solid and liquid samples. For example, the detection limit of Rhodamine is in the range of 0.01 ppb in distilled water (25 mm cuvette) [35], and fluorescence quantum yield of our fluorescent inhibitor is quite close to Rhodamine [35,36]. Thus, localization of fluorescent inhibitor upon crystals/particles of scale is a valid approach. On the other hand, an absence of fluorescence is a clear indication that the fluorescent inhibitor is not present in the solution but either forms self-aggregates or participates in the crystal formation.

4. Conclusions

Visualization of fluorescent-tagged antiscalants provides a deeper insight of antiscaling mechanisms in reverse osmosis facility desalination. A case study of gypsum scale formation revealed a nonconventional mechanism of antiscalant efficacy. Scaling supposedly takes place in the bulk retentate phase via heterogeneous nucleation step. The “nanodust” particles play a key role as gypsum nucleation centers. It is demonstrated that contrary to popular belief an antiscalant interacts not with gypsum nuclei, but with “nanodust” particles, isolating them from calcium and sulfate ions sorption. Therefore, the number of gypsum nucleation centers are reduced, and in turn, the overall scaling rate is diminished.
At the same time, significant amounts of work is still necessary, in order to understand how much the case of gypsum is a universal one. Therefore, a study of fluorescent-tagged polyacrylates and phosphonates in RO desalination of carbonate brines is underway now.

Author Contributions

Conceptualization, K.P.; methodology; writing—original draft, supervision, V.G.; Investigation (all RO membrane operations); Methodology; Writing—Original Draft (Figures preparation); M.O., Investigation (SEM; calcium concentration measurements, water ICP analysis); writing—review and editing; resources (PAA-F1 synthesis); S.T., Investigation (fluorescence intensity measurements), writing—reviewing and Editing; A.R. (Anatoly Redchuk), Investigation (particle counter measurements; polymer conformation modeling); A.R. (Anastasia Ryabova): Investigation (confocal fluorescent microscope measurements); A.P.: Conceptualization, Supervision, Writing—Review & Editing. All authors have read and agreed to the published version of the manuscript.

Funding

The authors would like to thank Russian Science Foundation, Project No. 19-79-10220 for the financial support of the present study.

Acknowledgments

This work was carried out with the using equipment of the Center for collective use No. 74834 “Technological and diagnostic center for the production, research and certification of micro and nanostructures” in GPI RAS.

Conflicts of Interest

The authors declare no conflict of interest.

References

  1. Anis, S.F.; Hashaikeh, R.; Hilal, N. Reverse osmosis pretreatment technologies and future trends: A comprehensive review. Desalination 2019, 452, 159–195. [Google Scholar] [CrossRef] [Green Version]
  2. Badruzzaman, M.; Voutchkov, N.; Weinrich, L.; Jacangelo, J.G. Selection of pretreatment technologies for seawater reverse osmosis plants: A review. Desalination 2019, 449, 78–91. [Google Scholar] [CrossRef]
  3. Zhang, P.; Hu, J.; Li, W.; Qi, H. Research Progress of brackish water desalination by reverse osmosis. J. Water Resour. Prot. 2013, 5, 304–309. [Google Scholar] [CrossRef] [Green Version]
  4. Li, X.; Hasson, D.; Semiat, R.; Shemer, H. Intermediate concentrate demineralization techniques for enhanced brackish water reverse osmosis water recovery—A review. Desalination 2019, 466, 24–35. [Google Scholar] [CrossRef]
  5. Goh, P.S.; Lau, W.J.; Othman, M.H.D.; Ismail, A.F. Membrane fouling in desalination and its mitigation strategies. Desalination 2018, 425, 130–155. [Google Scholar] [CrossRef]
  6. Matin, A.; Rahman, F.; Shafi, H.Z.; Zubair, S.M. Scaling of reverse osmosis membranes used in water desalination: Phenomena, impact, and control; future directions. Desalination 2019, 455, 135–157. [Google Scholar] [CrossRef]
  7. Demadis, K.D.; Neofotistou, E.; Mavredaki, E.; Tsiknakis, M.; Sarigiannidou, E.-M.; Katarachia, S.D. Inorganic foulants in membrane systems: Chemical control strategies and the contribution of green chemistry. Desalination 2005, 179, 281–295. [Google Scholar] [CrossRef]
  8. Rabizadeh, T.; Morgan, D.J.; Peacock, C.L.; Benning, L.G. Effectiveness of Green Additives vs. Poly(acrylic acid) in Inhibiting Calcium Sulfate Dihydrate Crystallization. Ind. Eng. Chem. Res. 2019, 58, 1561–1569. [Google Scholar] [CrossRef]
  9. Pramanik, B.K.; Gao, Y.; Fan, L.; Roddick, F.A.; Liu, Z. Antiscaling effect of polyaspartic acid and its derivative for RO membranes used for saline wastewater and brackish water desalination. Desalination 2017, 404, 224–229. [Google Scholar] [CrossRef]
  10. Ali, S.A.; Kazi, I.W.; Rahman, F. Synthesis and evaluation of phosphate-free antiscalants to control CaSO4·2H2O scale formation in reverse osmosis desalination plants. Desalination 2015, 357, 36–44. [Google Scholar] [CrossRef]
  11. Rahman, F. Calcium sulfate precipitation studies with scale inhibitors for reverse osmosis desalination. Desalination 2013, 319, 79–84. [Google Scholar] [CrossRef]
  12. Abdel-Aal, E.A.; Abdel-Ghafar, H.M.; El Anadouli, B.E. New Findings about Nucleation and Crystal Growth of Reverse Osmosis Desalination Scales with and without Inhibitor. Cryst. Growth Des. 2015, 15, 5133–5137. [Google Scholar] [CrossRef]
  13. Ying, W.; Siebdrath, N.; Uhl, W.; Gitis, V.; Herzberg, M. New insights on early stages of RO membranes fouling during tertiary wastewater desalination. J. Membr. Sci. 2014, 466, 26–35. [Google Scholar] [CrossRef]
  14. Shmulevsky, M.; Li, X.; Shemer, H.; Hasson, D.; Semiat, R. Analysis of the onset of calcium sulfate scaling on RO membranes. J. Membr. Sci. 2017, 524, 299–304. [Google Scholar] [CrossRef]
  15. Benecke, J.; Haas, M.; Baur, F.; Ernst, M. Investigating the development and reproducibility of heterogeneous gypsum scaling on reverse osmosis membranes using real-time membrane surface imaging. Desalination 2018, 428, 161–171. [Google Scholar] [CrossRef]
  16. Cai, Y.; Schwartz, D.K. Single-nanoparticle tracking reveals mechanisms of membrane fouling. J. Membr. Sci. 2018, 563, 888–895. [Google Scholar] [CrossRef]
  17. Kim, H.; Park, S.; Choi, Y.; Lee, S.; Choi, J. Fouling due to CaSO4 scale formation in forward osmosis (FO), reverse osmosis (RO), and pressure assisted forward osmosis (PAFO). Desalin. Water Treat. 2018, 104, 45–50. [Google Scholar] [CrossRef]
  18. Benecke, J.; Rozova, J.; Ernst, M. Anti-scale effects of select organic macromolecules on gypsum bulk and surface crystallization during reverse osmosis desalination. Sep. Purif. Technol. 2018, 198, 68–78. [Google Scholar] [CrossRef]
  19. Hoang, T.A. Mechanisms of Scale Formation and Inhibition. In Mineral Scales and Deposits, Scientific and Technological Approaches, 1st ed.; Amjad, Z., Demadis, K., Eds.; Elsevier: Amsterdam, The Netherlands, 2015; pp. 47–83. [Google Scholar] [CrossRef]
  20. Oshchepkov, M.; Kamagurov, S.; Tkachenko, S.; Ryabova, A.; Popov, K. An Insight into the Mechanisms of the Scale Inhibition. A Case Study of a Novel Task-specific Fluorescent-tagged Scale Inhibitor Location on Gypsum Crystals. ChemNanoMat 2019, 5, 586–592. [Google Scholar] [CrossRef]
  21. Oshchepkov, M.; Popov, K.; Ryabova, A.; Redchuk, A.; Tkachenko, S.; Dikareva, J.; Koltinova, E. Barite Crystallization in Presence of Novel Fluorescent-tagged Antiscalants. Int. J. Corros. Scale Inhib. 2019, 8, 998–1021. [Google Scholar] [CrossRef]
  22. Oshchepkov, M.; Golovesov, V.; Ryabova, A.; Tkachenko, S.; Redchuk, A.; Rudakova, G.; Pervov, A.; Rönkkömäki, H.; Popov, K. Visualization of a novel fluorescent-tagged bisphosphonate behavior during reverse osmosis desalination of water with high sulfate content. Sep. Purif. Technol. 2020, in press. [Google Scholar]
  23. Sosso, G.C.; Chen, J.; Cox, S.J.; Fitzner, M.; Pedevilla, P.; Zen, A.; Michaelides, A. Crystal nucleation in liquids: Open questions and future challenges in molecular dynamics simulations. Chem. Rev. 2016, 116, 7078–7116. [Google Scholar] [CrossRef] [PubMed] [Green Version]
  24. He, S.; Oddo, J.E.; Tomson, M.B. The nucleation kinetics of calcium sulfate dehydrate in NaCl solution up to 6 m and 90 °C. J. Coll. Interface Sci. 1994, 162, 297–303. [Google Scholar] [CrossRef]
  25. Klepetsanis, P.G.; Dalas, E.; Koutsoukos, P.G. Role of temperature in the spontaneous precipitation of calcium sulfate dehydrate. Langmuir 1999, 15, 1534–1540. [Google Scholar] [CrossRef]
  26. Lancia, A.; Musmarra, D.; Prisciandaro, M. Measuring induction period for calcium sulfate dehydrate precipitation. AICHE J. 1999, 45, 390–397. [Google Scholar] [CrossRef]
  27. Prisciandaro, M.; Lancia, A.; Musmarra, D. Gypsum nucleation into sodium chloride solutions. AICHE J. 2001, 47, 929–934. [Google Scholar] [CrossRef]
  28. Alimi, F.; Elfil, H.; Gadri, A. Kinetics of the precipitation of calcium sulfate dihydrate in a desalination unit. Desalination 2003, 57, 9–16. [Google Scholar] [CrossRef]
  29. Van Driessche, A.E.S.; Stawski, T.M.; Kellermeier, M. Calcium sulfate precipitation pathways in natural and engineered environments. Chem. Geol. 2019, 530, 119274. [Google Scholar] [CrossRef]
  30. Nicoleau, L.; Van Driessche, A.E.; Kellermeier, M. Kinetic analysis of the role of polymers in mineral nucleation. The example of gypsum. Cem. Concr. Res. 2019, 124, 105837. [Google Scholar] [CrossRef]
  31. Van Driessche, A.E.; García-Ruiz, J.M.; Delgado-López, J.M.; Sazaki, G. In Situ Observation of Step Dynamics on Gypsum Crystals. Cryst. Growth Des. 2010, 10, 3909–3916. [Google Scholar] [CrossRef]
  32. Stawski, T.M.; Van Driessche, A.E.; Ossorio, M.; Rodriguez-Blanco, J.D.; Besselink, R.; Benning, L.G. Formation of calcium sulfate through the aggregation of sub-3 nanometre primary species. Nat. Commun. 2016, 7, 11177. [Google Scholar] [CrossRef] [PubMed] [Green Version]
  33. Stawski, T.M.; Van Driessche, A.E.; Besselink, R.; Byrne, E.H.; Raiteri, P.; Gale, J.D.; Benning, L.G. The Structure of CaSO4 Nanorods: The Precursor of Gypsum. J. Phys. Chemi. C 2019, 123, 23151–23158. [Google Scholar] [CrossRef] [Green Version]
  34. Popov, K.; Rudakova, G.; Larchenko, V.; Tusheva, M.; Kamagurov, S.; Dikareva, J.; Kovaleva, N.A. Comparative Performance Evaluation of Some Novel “Green” and Traditional Antiscalants in Calcium Sulfate Scaling. Adv. Mat. Sci. Eng. 2016, 2016, 7635329. [Google Scholar] [CrossRef] [Green Version]
  35. Oshchepkov, M.; Tkachenko, S.; Popov, K. Synthesis and applications of fluorescent-tagged scale inhibitors in water treatment. A review. Int. J. Corros. Scale Inhib. 2019, 8, 480–511. [Google Scholar] [CrossRef]
  36. Popov, K.; Oshchepkov, M.; Kamagurov, S.; Tkachenko, S.; Dikareva, Y.; Rudakova, G. Synthesis and properties of novel fluorescent-tagged polyacrylate-based scale inhibitors. J. Appl. Polym. Sci. 2017, 134, 45017. [Google Scholar] [CrossRef]
  37. Raju, K.; Atkinson, G.J. The thermodynamics of «scale» mineral solubilities. 3. Calcium sulfate in aqueous sodium chloride. Chem. Eng. Data 1990, 35, 361–367. [Google Scholar] [CrossRef]
  38. Popov, K.I.; Oshchepkov, M.S.; Shabanova, N.A.; Dikareva, Y.M.; Larchenko, V.E.; Koltinova, E.Y. DLS study of a phosphonate induced gypsum scale inhibition mechanism using indifferent nanodispersions as the standards of a light scattering intensity comparison. Int. J. Corros. Scale Inhib. 2018, 7, 9–24. [Google Scholar] [CrossRef]
  39. Popov, K.; Oshchepkov, M.; Afanas’eva, E.; Koltinova, E.; Dikareva, Y.; Rönkkömäki, H. A new insight into the mechanism of the scale inhibition: DLS study of gypsum nucleation in presence of phosphonates using nanosilver dispersion as an internal light scattering intensity reference. Colloids Surf. A 2019, 560, 122–129. [Google Scholar] [CrossRef]
  40. Oshchepkov, A.; Oshchepkov, M.; Pavlova, G.; Ryabova, A.; Kamagurov, S.; Tkachenko, S.; Frolova, S.; Redchuk, A.; Popov, K.; Kataev, E. Naphthalimide-functionalized Bisphosphonates for Fluorescence Detection of Calcification in Soft Tissues. Sens. Actuators B Chem. 2020, 128047, in press. [Google Scholar] [CrossRef]
Figure 1. 1,8-Naphthalimide-tagged polyacrylate molecular structure.
Crystals 10 00309 g001
Figure 2. Schematic diagram of laboratory RO unit for membrane scaling tests: 1-feed water tank; 2-pump; 3-spiral wound membrane module; 4-permeate tank; 5-heat exchanger; 6-pressure gauge; 7-feed water flow meter; 8-permeate flow meter; 9-concentrate flow meter; 10-by-pass adjusting valve; 11-feed water adjusting valve; 12-concentrate adjusting valve; 13-cooling water adjusting valve; 14-sampler.
Crystals 10 00309 g002
Figure 3. Variation of PAA-F1content monitored by fluorescence intensity within a Blank A (A) and Blank B (B) experiment: Total content in retentate + membrane (a), its content on membrane, expressed in units of PAA-F1 concentration in retentate (b), in retentate (c), and in permeate (d).
Crystals 10 00309 g003
Figure 4. DLS particle size distribution by intensity in retentate in a Blank B experiment for K = 1.
Crystals 10 00309 g004
Figure 5. Fluorescent image of membrane surface deposit after Blank B experiment. Scale marker corresponds to 200 µm.
Crystals 10 00309 g005
Figure 6. Variation of Ca2+ concentration in a Blank C (a,b,c,d) and in GSI experiment (c’): (a) total calcium concentration in retentate + membrane; (b) Ca2+ concentration in permeate; (c,c’) “free” calcium in retentate; and (d) calcium content on membrane surface as gypsum, expressed in units of calcium concentration.
Crystals 10 00309 g006
Figure 7. SEM images of gypsum deposit on membrane surface at the end of the Blank C (A,B) and GSI (C) experiment. Scale marker corresponds to 20 (A,C) and 5 (B) µm.
Crystals 10 00309 g007
Figure 8. Fluorescent images of initial undersaturated gypsum solution droplets (A), K = 1, and of retentate at K = 2 (B), K = 3 (C), K = 4 (D), K = 5 (E) within the GSI experiment.
Crystals 10 00309 g008
Figure 9. DLS particle size distribution by intensity in retentate of the GSI experiment for K = 1 (a), K = 2 (b) and K = 3 (c).
Crystals 10 00309 g009
Table 1. Initial stock solutions characterization by particle counter.
Solvent/SolutionConcentration
(mol·dm−3)
pHCumulative Number of Foreign Particles
in 1 mL *
≥100 nm≥200 nm≥300 nm≥500 nm
Distilled water for feed solution preparation;
2 μS/cm
55.555.5390,00097,00019,60016,400
CaCl2 stock solution, diluted by distilled water0.015 7.11,800,000200,00076,00039,000
Na2SO4 stock solution, diluted by distilled water0.015 6.1 1,550,000185,00073,00032,000
PAA-F1 solution1.7·10−66.2860,000110,00038,00016,000
* The data deviations found for three replicate measurements constituted ±20%.
Table 2. Experimental protocol for the scaling tests in cross-flow RO membrane filtration.
Membrane Preparation and Treatment
StepTaskFeedPressureDurationComments
1Membrane preparationDistilled water-20–30 minutes Washing with distilled water for preservatives removal.
2Membrane conditioningDistilled water-8–12 hoursCovered by distilled water layer for preservatives removal.
3RO membrane desalination in concentration mode continuous monitoringFeed solution circulation mode; well-controlled feed solution: composition, pH, T, etc.88 to 110 psi depending on desirable flux5–6 hours duration of the entire experiment for all runsFeed, permeate and retentate samples collected and analyzed for Ca content, for PAA-F1 concentration (by fluorimeter) and by fluorescent microscope.
4Post experiment treatment--24RO membrane is removed, gently rinsed out with distilled water; dried at 22–25 °C and segmented. RO membrane segments are characterized by SEM and fluorescent microscopy.
Cross-flow tests
TestInitial feed solutionComments
Blank A7 mg·dm−3 PAA-F1 in distilled water Experiment is intended to evaluate “free” PAA-F1 sorption by membrane in concentration operating mode.
Blank B0.015 mol·dm−3 CaCl2 and 7 mg·dm−3 PAA-F1 in distilled waterExperiment is intended to estimate PAA-F1 participation in side reaction with Ca2+ ions, followed by its undesirable consumption by calcium due to formation of insoluble Ca0.5xHyPAA-F1·nH2O (0.5x + y = 1) salts.
Blank C0.015 mol·dm−3 CaCl2 and 0.015 mol·dm−3 Na2SO4 in distilled waterExperiment has to demonstrate non-inhibited RO membrane gypsum scaling as a reference to the inhibited one.
Gypsum Scale Inhibition (GSI)0.015 mol·dm−3 CaCl2, 0.015 mol·dm−3 Na2SO4 and 7 mg·dm−3 PAA-F1 in distilled waterA PAA-F1 inhibited gypsum scaling.

