Article

Ordering Phase Transition with Symmetry-Breaking from Disorder over Non-Equivalent Sites: Calorimetric and Crystallographic Study of Crystalline d-Sorbose

1
Department of Chemistry, Faculty of Pure and Applied Sciences, University of Tsukuba, Tsukuba 305-8571, Japan
2
Department of Chemistry, Graduate School of Science and Engineering, Saitama University, Saitama 338-8570, Japan
3
Department of Applied Biological Science, Faculty of Agriculture, Kagawa University, Miki-cho 761-0795, Japan
*
Author to whom correspondence should be addressed.
Submission received: 19 March 2020 / Revised: 21 April 2020 / Accepted: 22 April 2020 / Published: 1 May 2020
(This article belongs to the Special Issue Crystallography of Structural Phase Transformations)

Abstract

:
Phase transitions in the crystalline state of chiral sorbose were examined using precise heat capacity calorimetry and X-ray crystallography. The calorimetry established heat capacity below room temperature. Besides the known transition (main transition) at 199.5 K, the calorimetry detected plural thermal anomalies assignable to new phase transitions (around 210 K) and a glass transition (at ca. 120 K). The X-ray diffraction at low temperatures established the crystal structure of the lowest temperature phase. The identification of the broken symmetry upon the main transition solves an apparent contradiction that the structural disorder reported previously does not contribute seemingly to the symmetrization.

1. Introduction

Phase transition has long been a central issue in the science of matter [1,2]. This statement also applies to the case of the science of crystals, i.e., crystallography, because the symmetry plays an essential role in discussing phase transitions [3]. Molecular crystals have offered essential examples where molecular dynamics bring about intrinsic phase transitions from nominally perfect crystals into partially disordered states such as plastic crystals and liquid crystals [4]. In contrast to the understanding of phase transitions as the way of acquiring disorder (entropy) in the previous sentence, there exists a counter view, the emergence of order. In the latter context, the concept of “spontaneous symmetry-breaking” was one of the essentials reached in the past [5]. The situation is expressed in microscopic terms as follows: In a high symmetry phase (usually at high temperature), some disorder contributes to establishing the higher symmetry, and the ordering contradicts some part of the symmetries, resulting in the formation of the low symmetry phase (at lower temperatures). An example of the high symmetry state is the paramagnetic state with random orientations of Ising spins, which are allowed only two (up and down) states. The equivalence of two states brings a macroscopic symmetry (between the upper and lower sides) of the ensemble. Upon cooling, the ensemble undergoes the so-called order-disorder transition into an ordered phase, in which the number of one orientation, say “up”, is larger than that of the other. The symmetry is lower than the high temperature phase due to the loss of the macroscopic up/down symmetry. If the equivalence of two orientations of each spin is violated (even at high temperatures), the random orientations are impossible, and the macroscopic symmetry does not exist. Indeed, ferromagnets do not undergo phase transitions under a field [6]. This example leads us to a naive recognition of the relevance of two equivalent states, over which the disorder occurs. The question treated in this paper is: Is a transition of the order-disorder type when the disorder is over non-equivalent configurations?
The compound we chose in this study is sorbose, the molecular structure of which is shown for the d-form in Figure 1. Sorbose is the hexose that was identified in the l-form for the first time in nature. The existing report of heat capacity on crystalline l-sorbose [7] indicates the presence of a phase transition around 200 K. The structural studies at room temperature reported for l-sorbose crystals [8,9] suggested possible involvement of the structural disorder in the transition mechanism. However, the reported disorder is over non-equivalent configurations if we consider only a single molecule. The perfect order to the major configuration (with not O1B, but O1A in this case) does not contradict the symmetry (space group) of the room temperature phase. The relationship between the structural disorder and the nature of the phase transition remains unclear, accordingly.
The present study of our project was to establish the thermodynamic properties of sugars in an extended temperature range. The project started while considering the situation that a reliable heat capacity at room temperature has been reported for only four hexoses [7,10]. Partial results of the project were already published [11]. Since complete coverage over monosaccharides necessitates the inclusion of the so-called rare sugars, we dared to use the rare counterpart (d-sorbose) of the naturally abundant l-form in the present study. Excellent coincidence with the existing data on the l-form [7,8,9] strengthens the common belief that ensembles of two enantiomers are equivalent in the isolated state.
This paper is organized as follows. After the description of the experiments (Section 2), we describe the experimental results of the calorimetry (Section 3.1 and Section 3.2) and crystallographic experiments of the high (Section 3.3) and low temperature (Section 3.4) phases in this order. The description of the calorimetry includes not only those related to phase transitions and standard thermodynamic functions (Section 3.1), but also the newly found glass transition (Section 3.2). Section 3.5 discusses the main subject, which is represented in the title and summarized in the last sentence of the first paragraph. Section 4 concludes the paper by summarizing findings with a comment about the meaning of this paper from a broader perspective.

2. Materials and Methods

2.1. Material

d-sorbose was synthesized by utilizing enzymatic reactions according to the “Izumoring” strategy [12,13,14] at the Rare Sugar Research Center, Kagawa University. The resultant specimen was purified by recrystallization from aqueous solution. The final purity of the sample used for measurements was better than 99%, as confirmed by high pressure liquid chromatography (HPLC). Note that the consideration of possible isomerization to other forms than α -d-sorbopyranose shown in Figure 1 was unnecessary because the samples subjected to measurements in this study were crystalline solids. Since there was no report of polymorphism and hydrates as far as the authors know, the sample was treated as nominally pure.

2.2. Adiabatic Calorimetry

Heat capacity measurements were performed using a laboratory-made adiabatic calorimeter, the details of which, including its performance, can be found elsewhere [15]. The measurements were carried out using the so-called intermittent heating adiabatic method in the heating direction.
Our calorimetric experiment gave nominally equilibrium properties. It covered the temperature interval continuously, in contrast to many experimental techniques that perform measurements at selected temperatures (even if the data are dense). This property best assures no phase transitions are missed.
The sample with a mass of 2.74474 g (15.2354 mmol) after buoyancy correction was loaded in a gold-plated calorimeter vessel. The vessel was sealed after introducing a small amount of helium gas ( 10 5 Pa at room temperature), which served as the heat conduction gas inside the vessel. The thermal equilibrium inside the vessel was attained within a reasonable time (1∼25 min depending on the temperature), except for the glass transition region. The sample contributed to the total heat capacity consisting of those of the sample, vessel, and the heat conduction gas by 25% at 100 K, 29% at 200 K, and 34% at 300 K. The working thermometer was the platinum resistance thermometer (MINCO, S1059), the temperature scale of which was based on the ITS-90 (International Temperature Scale of 1990 [16]).

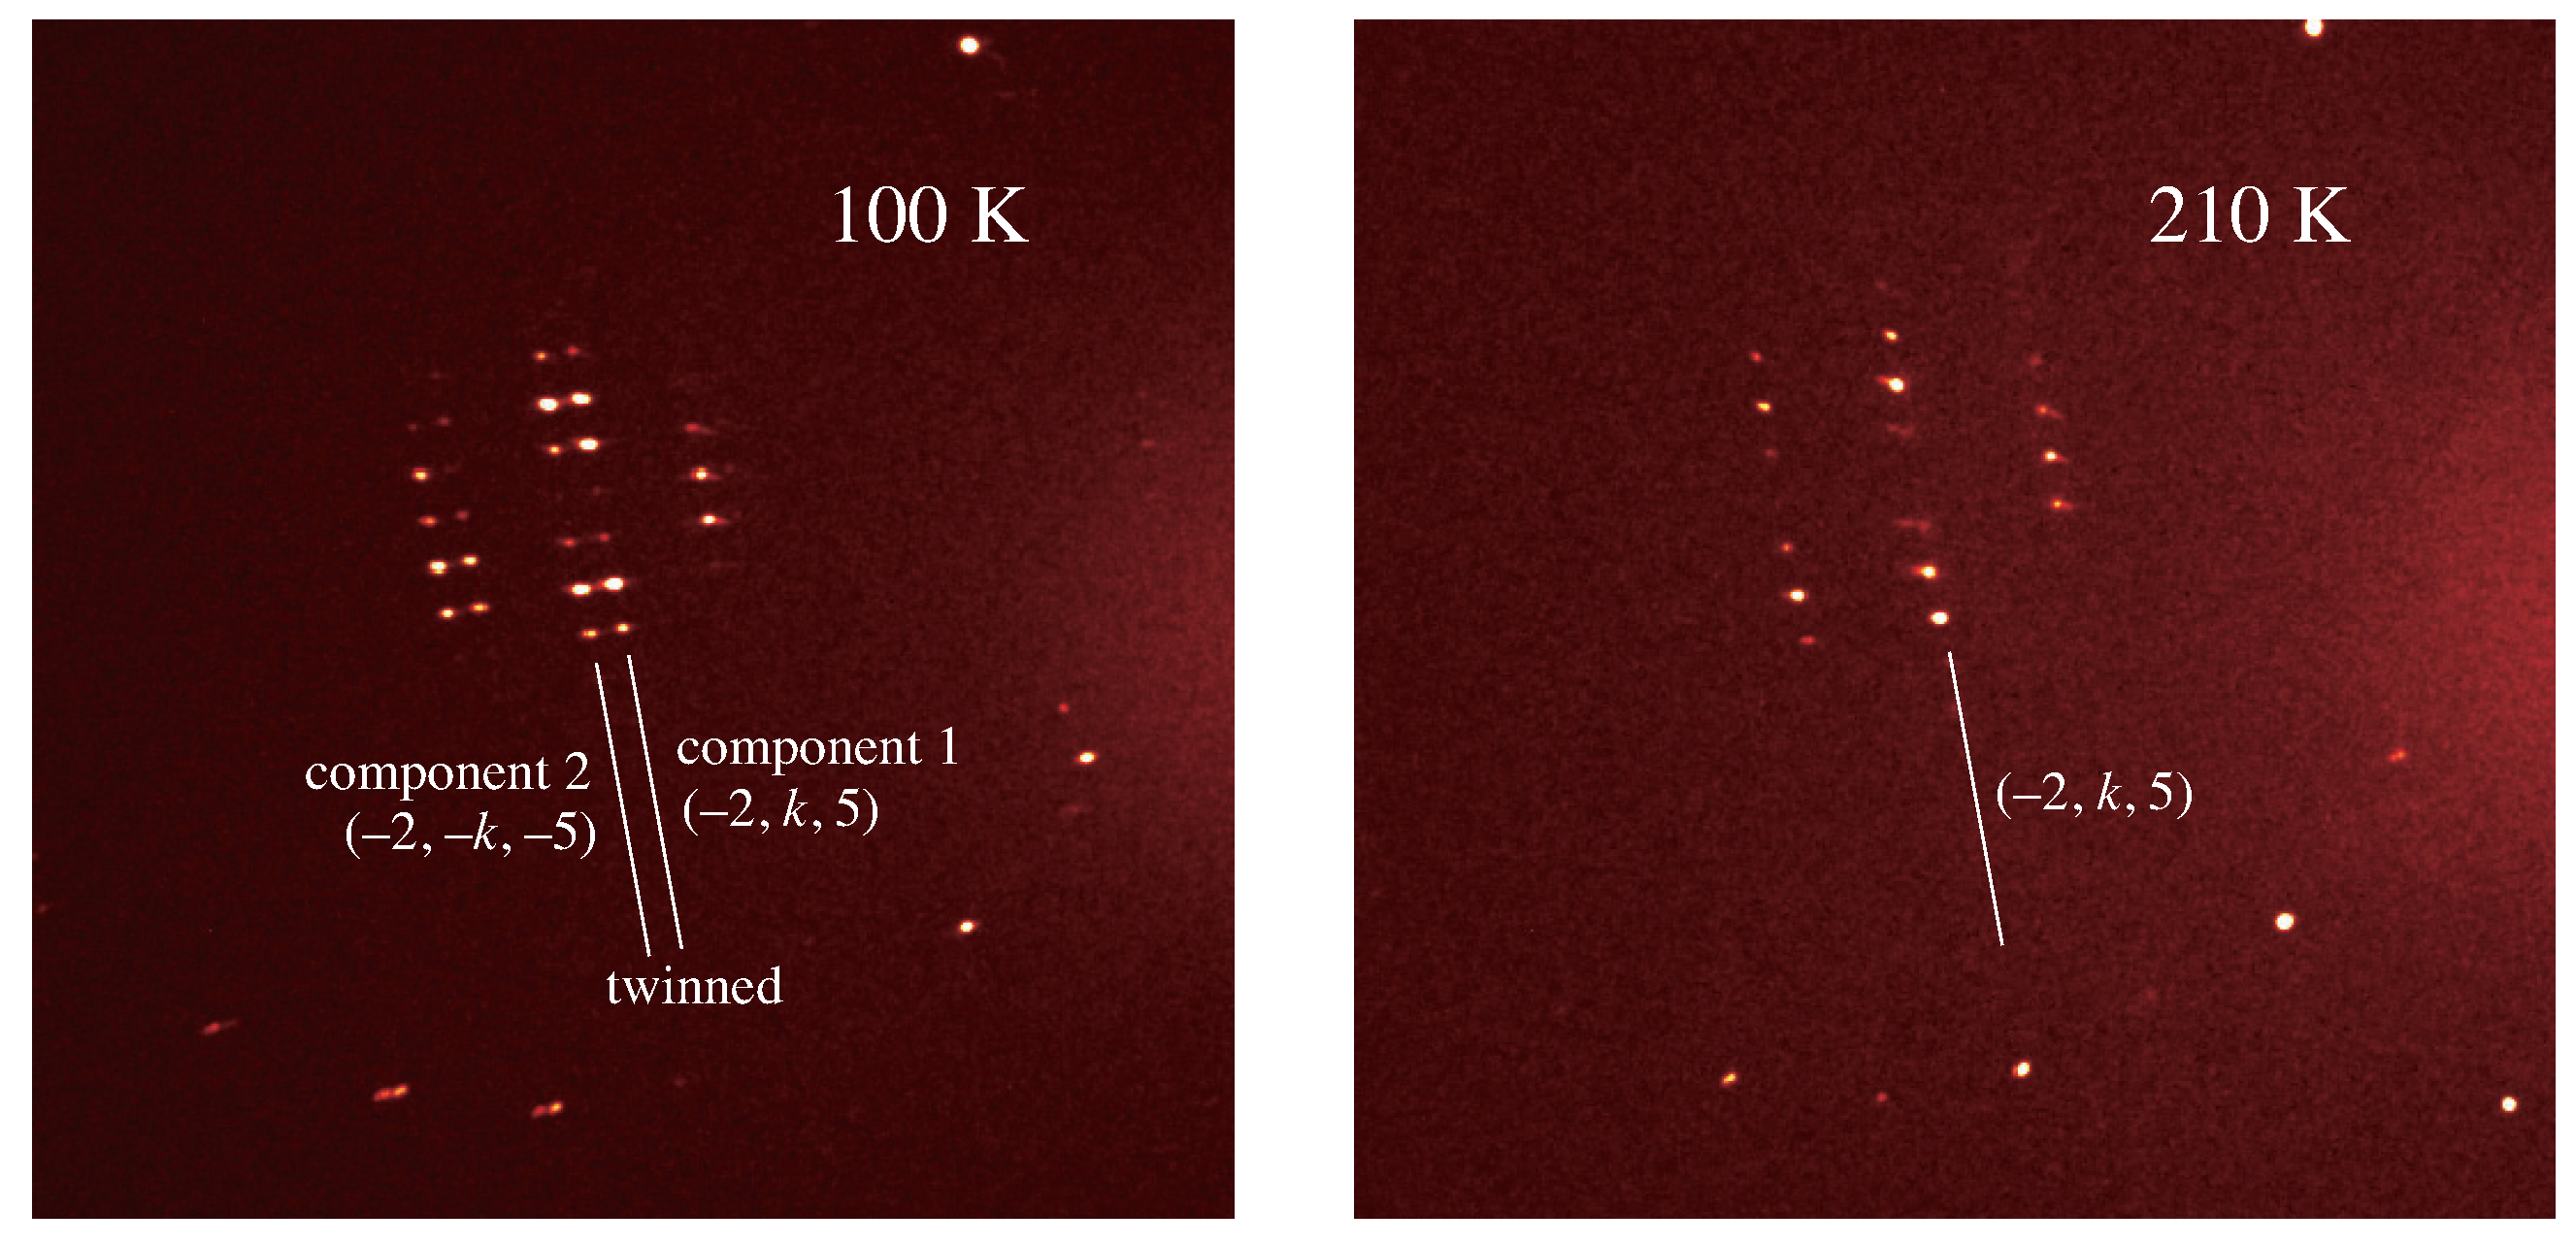
2.3. X-ray Crystallography

Single crystals were picked up from the recrystallized specimen from the aqueous solution. The diffractometer (Bruker APEX-IICCD), equipped with a CCD camera, which enabled us to observe the appearance/absence of possible superlattice reflections, was used to collect diffraction data at several temperatures. Data reduction and cell refinement were performed by SAINT [17], and the absorption correction, including scaling, was by SADABS [18] and TWINABS [19] for single-crystalline and twinned samples, respectively. Structures were solved by the direct method using SHELXS-97 [20] and refined using SHELXL-2014 [21], which is capable of refining the structure for the data of a twinned sample. Essential crystallographic information is given in Table S3 (see Supplementary Materials). Full crystallographic data have been deposited with the Cambridge Crystallographic Data Centre [22].

3. Results and Discussion

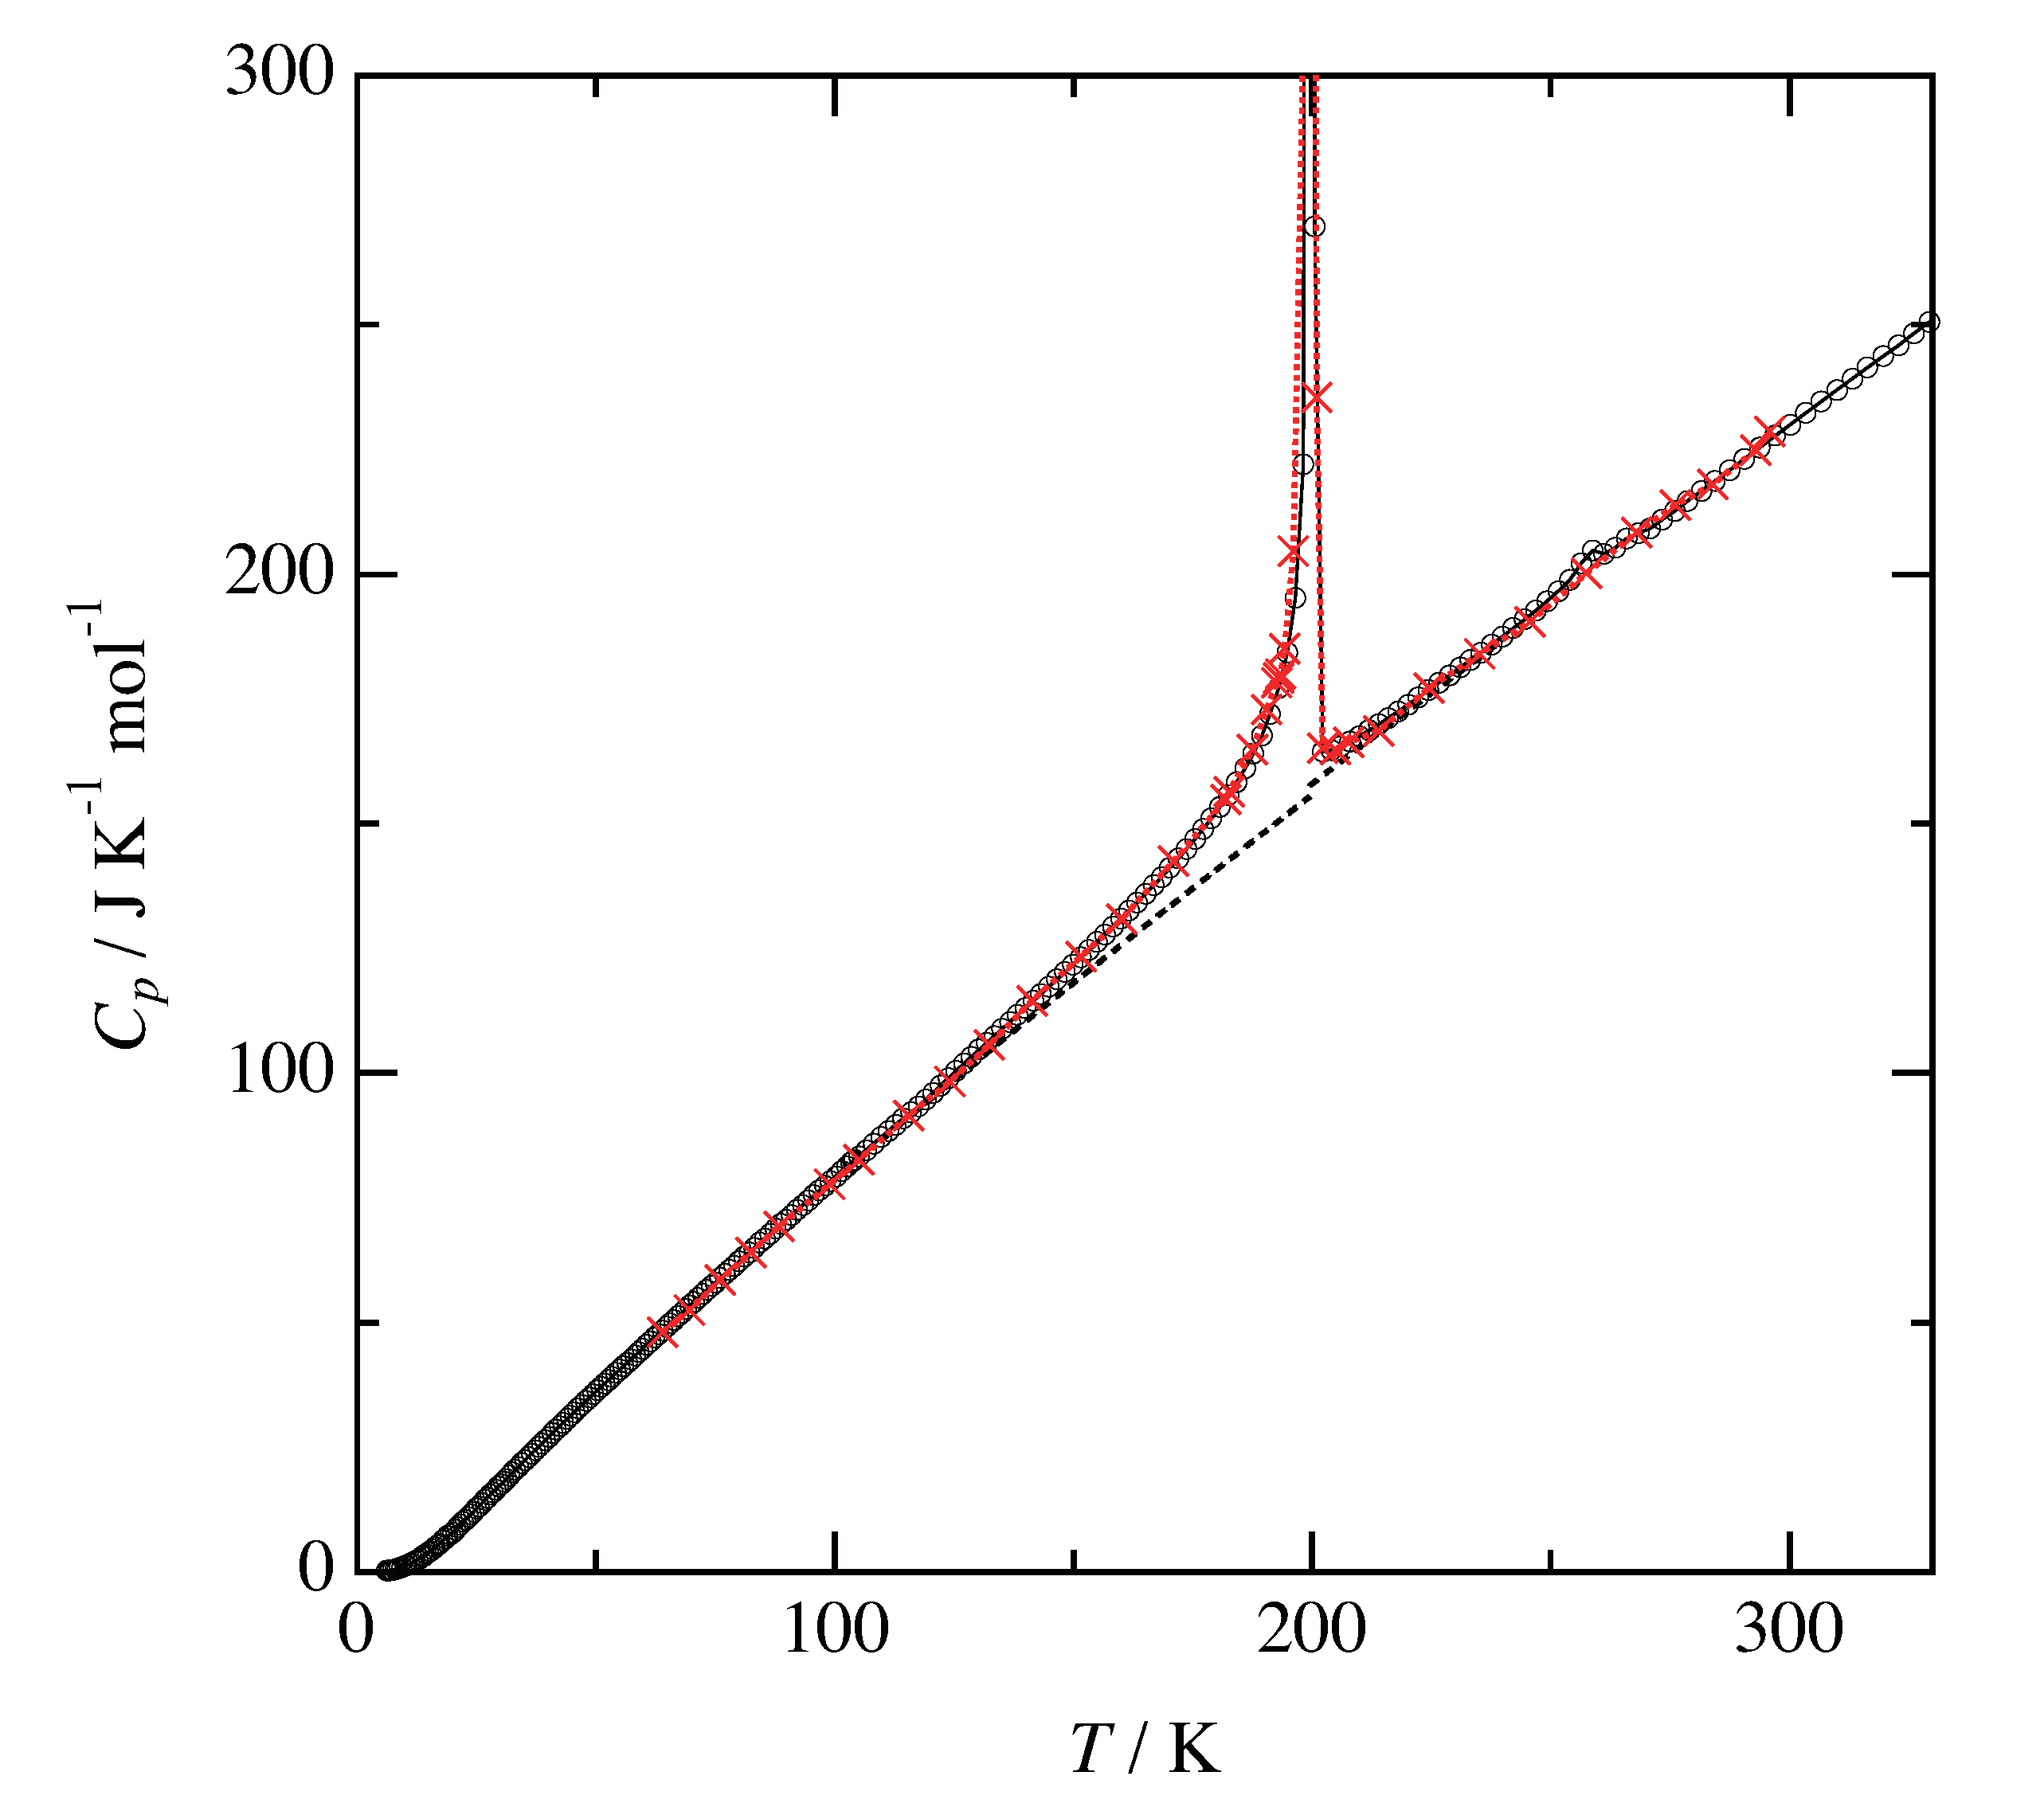
3.1. Heat Capacity and Phase Sequence

The temperature range covered in the present calorimetry was from 6 K to 330 K. Experimental heat capacities are tabulated in Table S1. Figure 2 shows the representative data of the experimental heat capacities of crystalline d-sorbose together with those of l-sorbose [7]. Despite a much smaller amount of the sample used in this study, the two sets of experimental data exhibited excellent consistency except for the temperature intervals between successive data points. The difference reflected the improvement of the adiabatic heat capacity calorimetry. The coincidence confirmed the equivalence of two forms in the isolated state. Smoothing experimental data and integration over the smoothed curve in the appropriate manner yielded standard thermodynamic quantities (such as enthalpy and entropy) relative to 298.15 K under a constant pressure of around 10 5 Pa. These quantities are tabulated in Table S2. The reason why the reference state was not absolute zero is noteworthy. As explained in detail later, the crystalline sorbose exhibited a glass transition around 120 K, below which the crystal was out of thermodynamic equilibrium. Although the deviation from the supposed “equilibrium” was probably small, judging from the fact that no appreciable disorder was detected even at 100 K, it was logically incorrect to treat absolute zero as the reference state with vanishing entropy. Concerning the reason the derived quantities may be treated as those under constant pressure despite varying pressure during measurements, a note from [11] is useful.
Although the two sets of heat capacity data exhibited consistency, there certainly were differences. One feature was the presence of small anomalies around 260 K. Figure 3 shows the experimental heat capacities there. Different symbols distinguish the data obtained in different runs. Two peaks were observed when the experiment started below the main transition (at 199.5 K). Note that a compatible feature could be recognized in the old data [7] by careful inspection. As seen in Figure 3, the shape of anomaly depended on the temperature, to which the calorimeter (containing the sample) was cooled before measurements. They can successively be “erased” from the peak at the highest temperature to the low temperature side. The successive occurrence of two first-order phase transitions plausibly rationalized this behavior. Note that their supercooling behaviors were different from the main transition, which exhibited supercooling to the extent of only a few K. Table 1 lists the thermodynamic quantities associated with these transitions, which were estimated by assuming the heat capacity curve of the supercooled states as respective backgrounds (baselines).
The success of the supercooling of the phase above 200 K (not shown in Figure 2) indicated that the main transition at 199.5 K was of first-order. The large tail of the anomaly associated with this transition at the low temperature side implied strong cooperativity, which was seemingly consistent with the involvement of the structural disorder in the transition mechanism. By assuming the baseline stepped at 199.5 K, as shown in Figure 2, we estimated the excess enthalpy and entropy associated with this transition (including the contribution of the latent heat) as ( 1.01 ± 0.02 ) kJ mol 1 and ( 5.06 ± 0.09 ) J K 1 mol 1 , respectively. It is noteworthy that this magnitude of the excess entropy was close to the ideal magnitude expected for the simplest order-disorder transition, R ln 2 ( 5.76 J K 1 mol 1 ). This fact again suggested the involvement of the structural disorder in the transition mechanism.

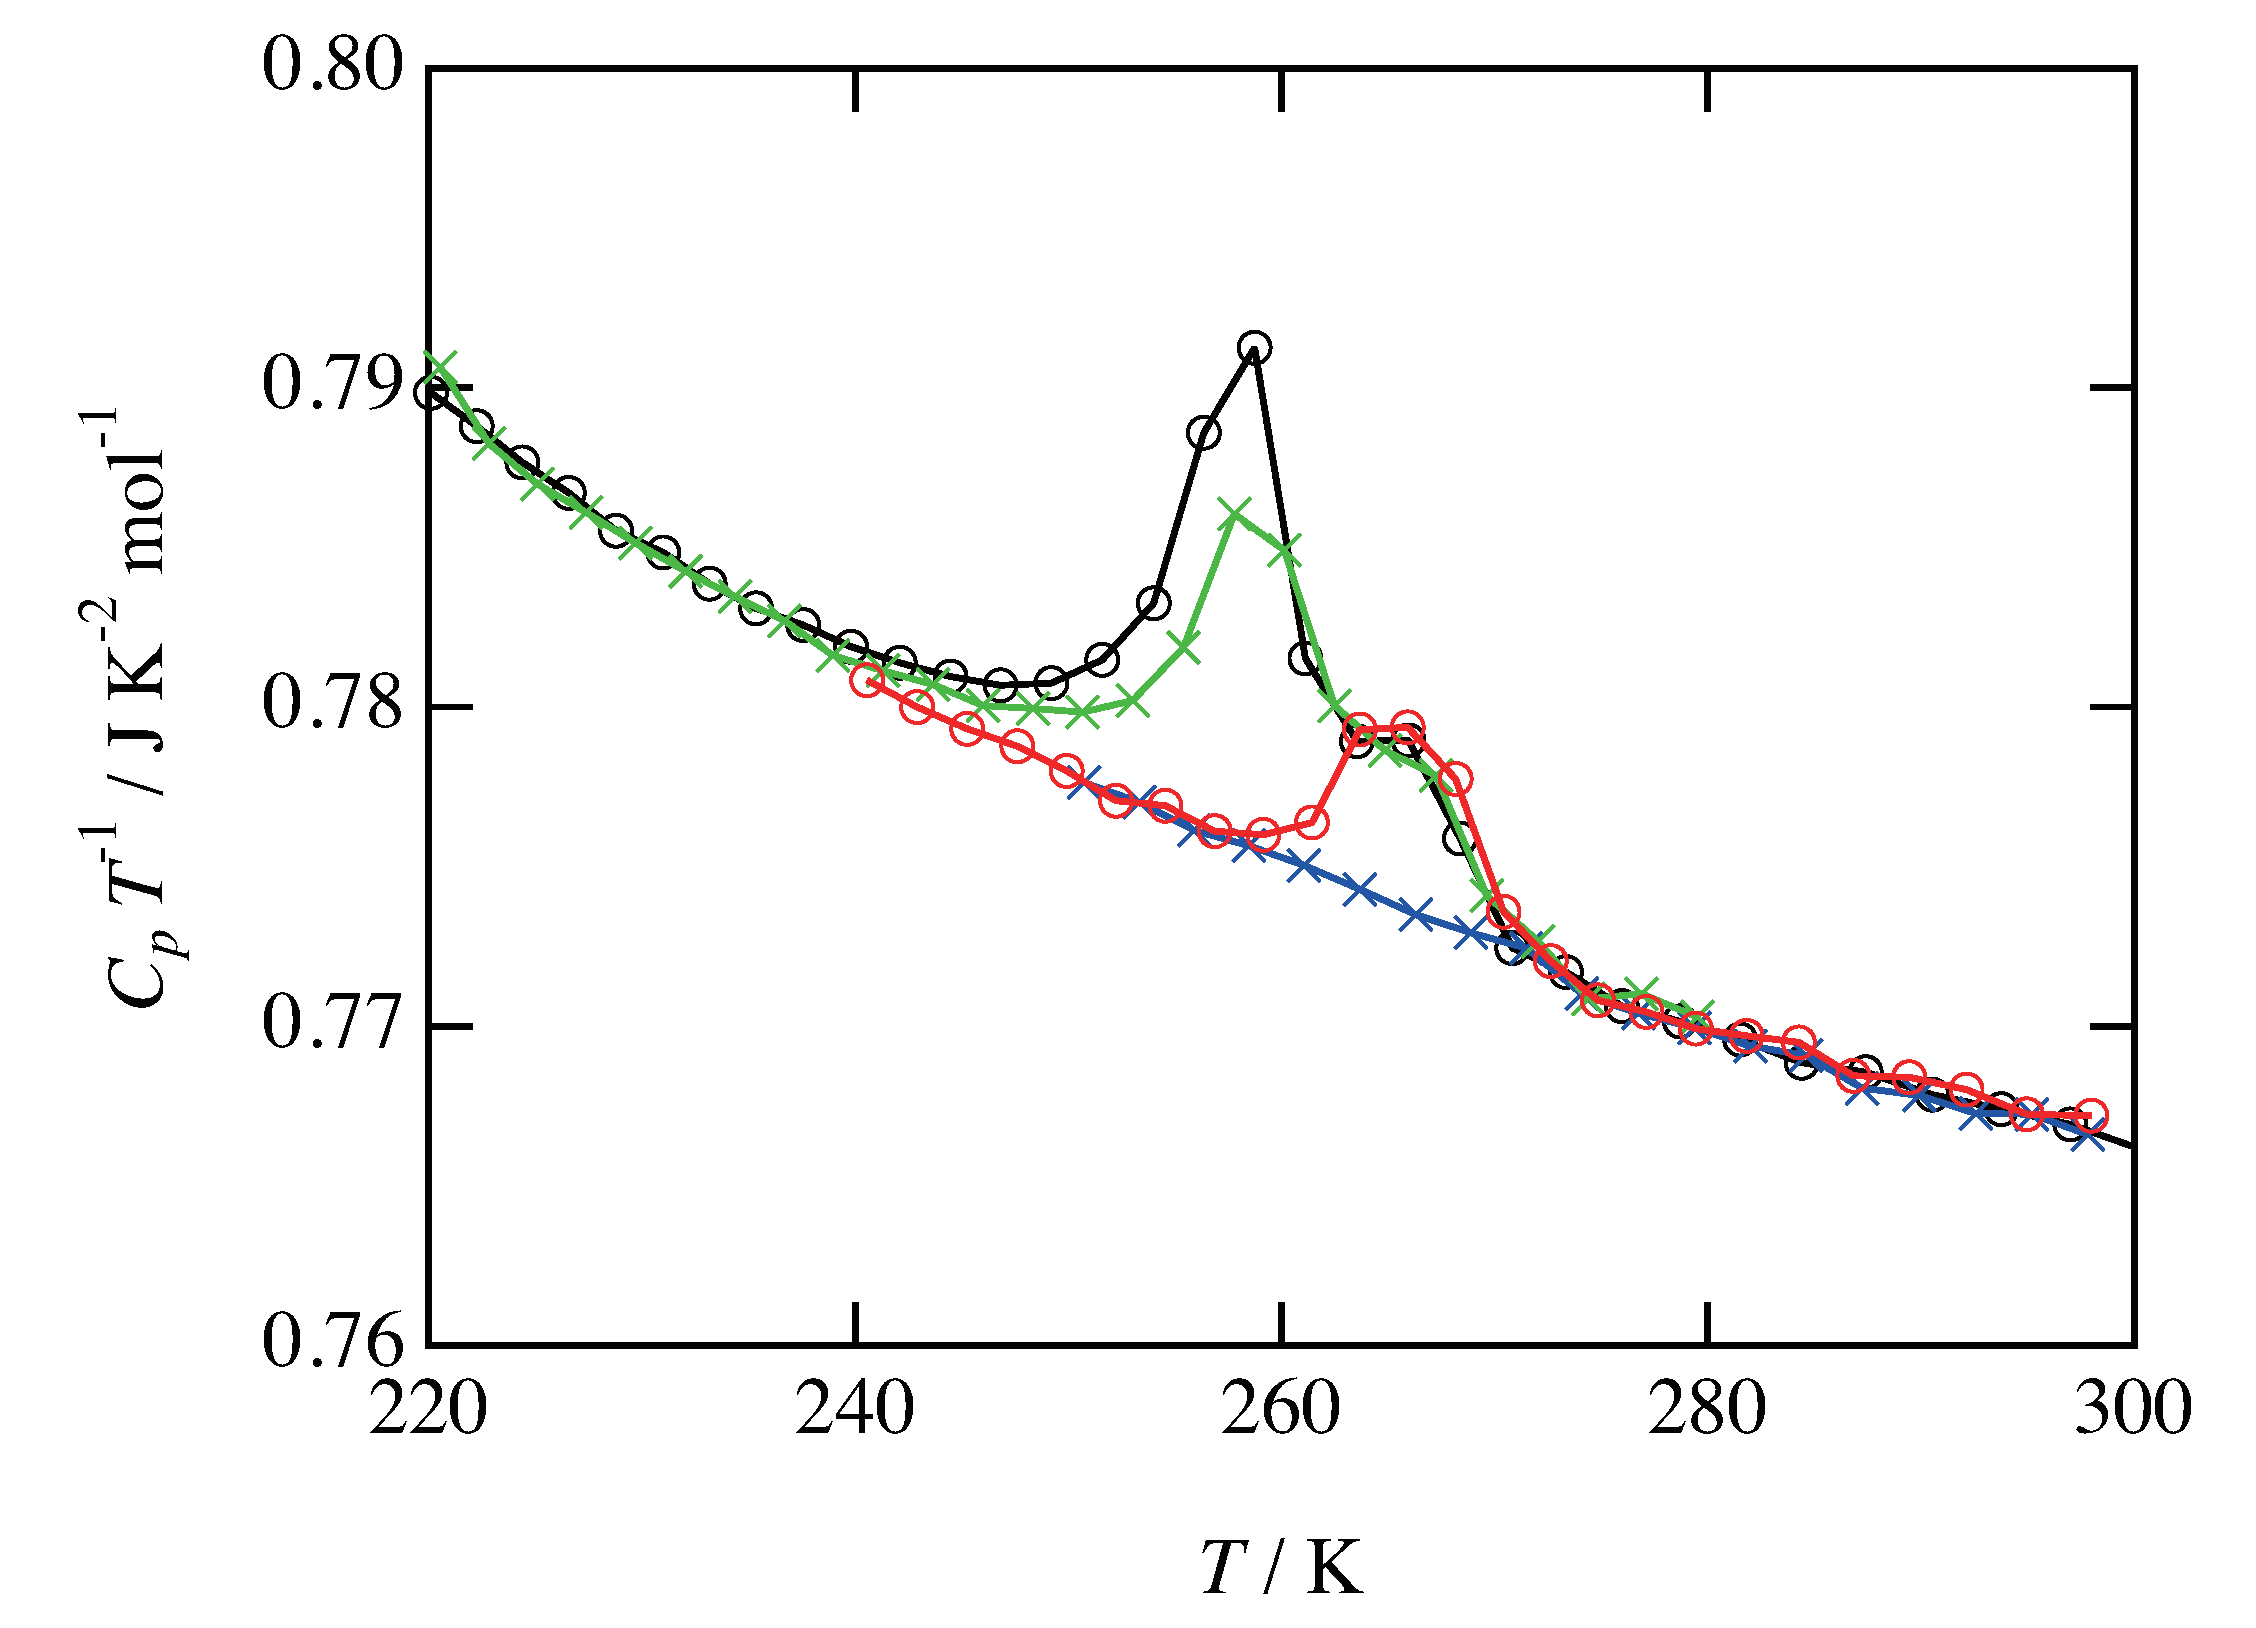
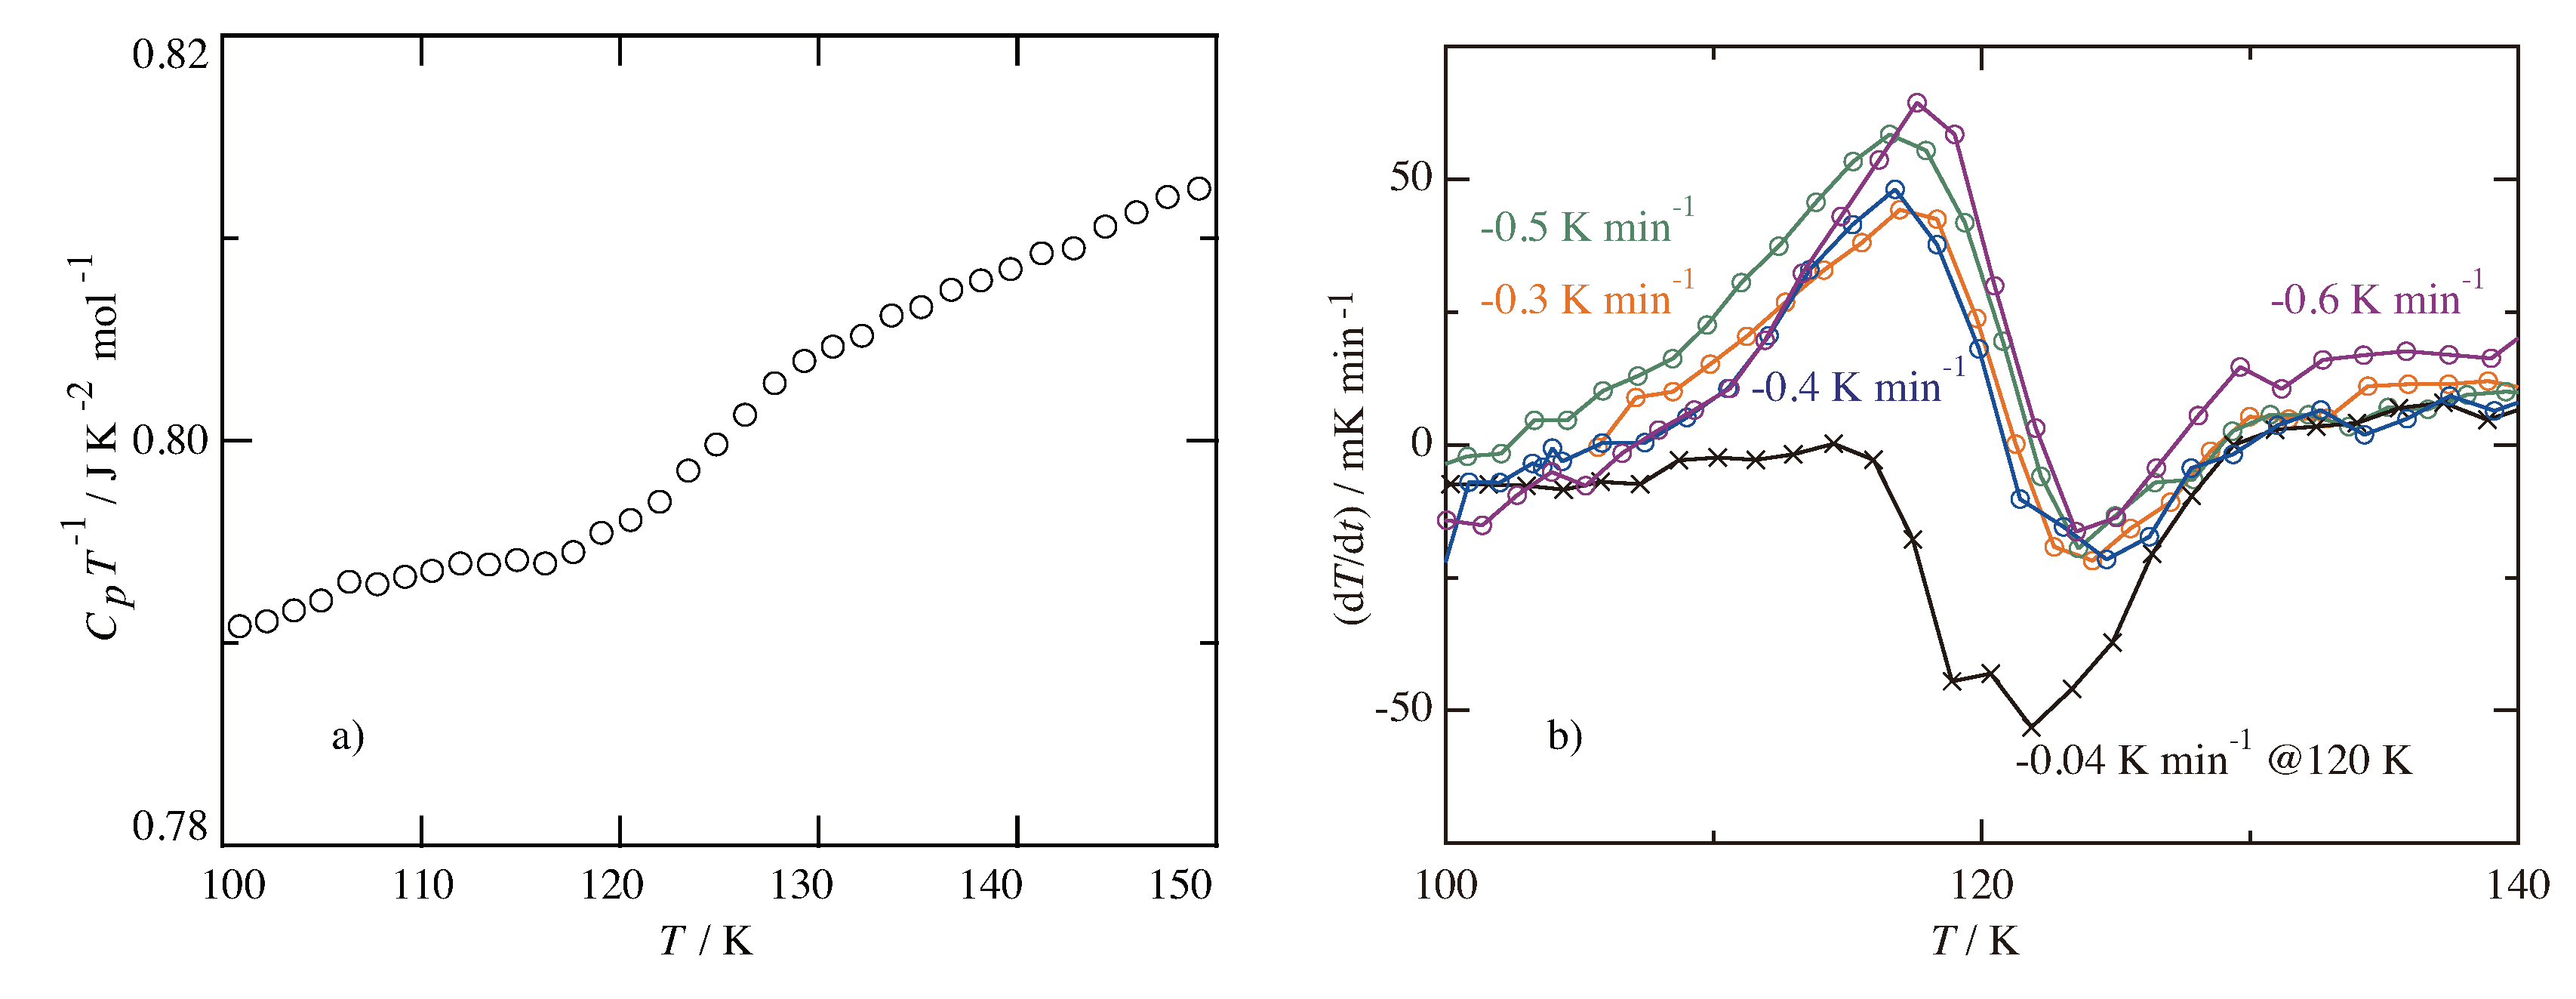
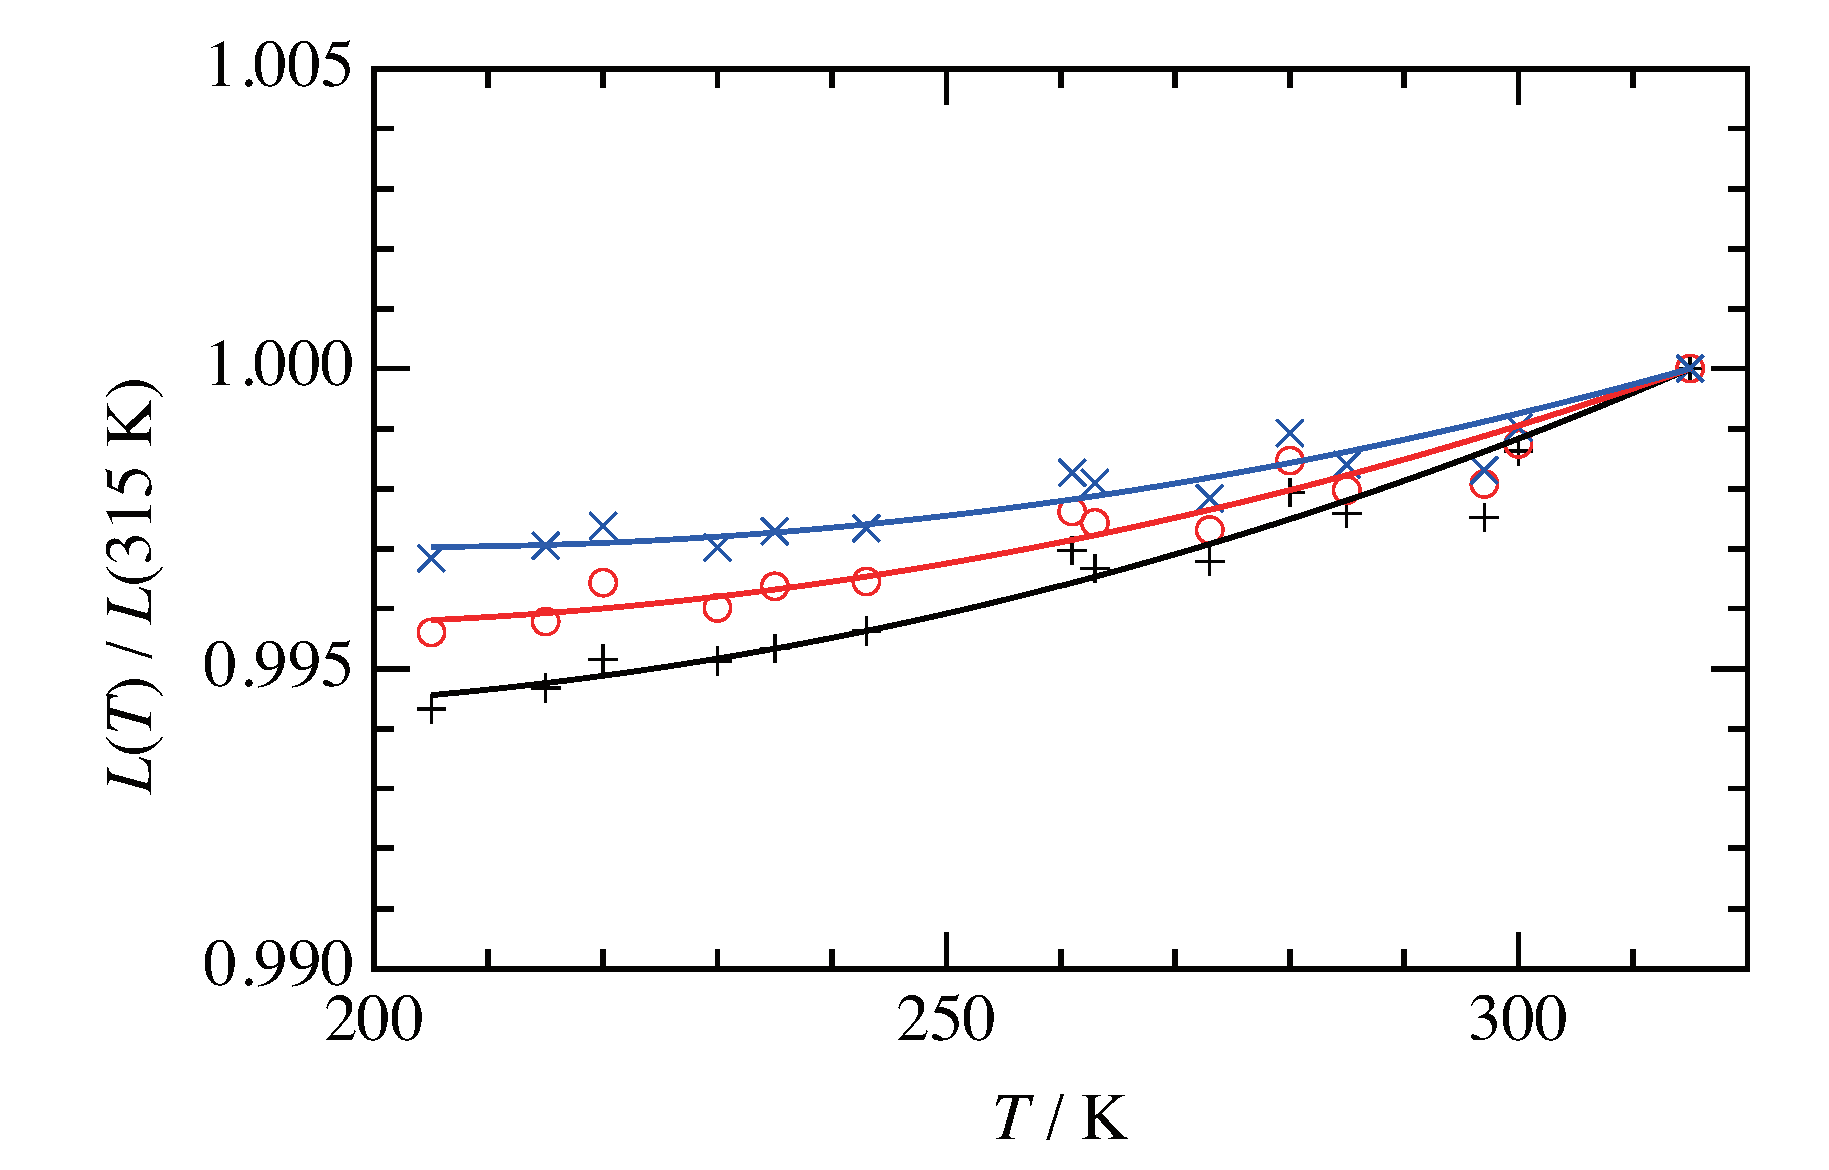
3.2. Glass Transition

Another difference in the calorimetric results from the existing report [7] was a symptom of a glass transition around 120 K. Figure 4a shows the experimental heat capacities divided by temperature, obtained in the run from the lowest temperature. A definite step existed. In this temperature region, the temperature drift, which was the time course of temperature reading during the equilibration period after each heat input, showed the following behavior: exothermic at the low temperature side, while endothermic at the high temperature side. Besides, the strength of the exothermic and endothermic effects depended on the cooling rate. Sufficiently slow cooling nullified the exothermic effect. All of these behaviors could be rationalized by assuming the occurrence of enthalpy relaxation and is characteristic of glass transitions [23].
Since glass transitions have widely been understood as the freezing-in of some disorder, it is natural to ask what kind of disorder is involved in this glass transition. If this glass transition is related to the structural disorder, which might be responsible for the main transition, the baseline to separate the excess heat capacity associated with the transition should extend below this glass transition. This discussion is logically correct. As will be described later, however, it was unnecessary to assume any structural disorder to achieve the structural solution at low temperatures. We thus assumed that the glass transition was due to the freezing of the residual structural disorder, which was too insignificant to be detected by crystallography. We kept in mind the possibility that the excess enthalpy and entropy became slightly greater than those tabulated in Table 1 if the baseline were extended to this temperature region.

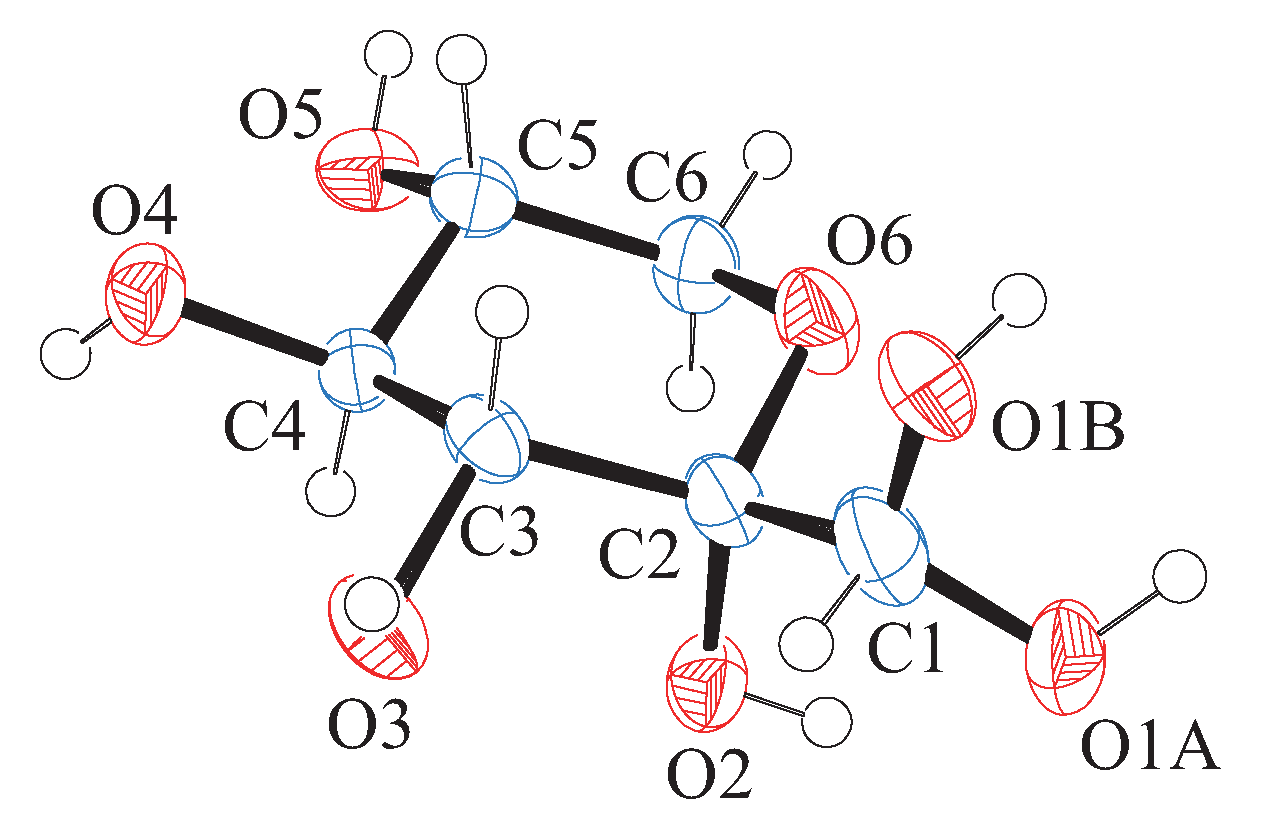
3.3. Structure of Room Temperature Phase

The crystal structure at room temperature (295 K) was successfully solved. The resultant crystal data were favorably compared with those reported previously utilizing neutron diffraction [9], as seen in Table 2. The solved structure itself was entirely consistent, as well. Only a single molecule, which exhibited conformational disorder, was crystallographically independent in this structure. Namely, all molecules were related by the symmetry operation(s). One of the oxygen atoms (O1) was disordered over two sites (O1A and O1B in Figure 1) with the population ratio of 0.625 : 0.375 , which was reasonably close to the reported ones [8,9]. Two conformations, over which the disorder occurred, were related by a rotation of the hydroxymethyl group around the C1-C2 single bond.
Since two phase transitions were identified around 260 K by the calorimetry, we attempted, but failed to detect any symptoms of them in diffraction experiments. The space group remained the same. Cell constants only exhibited smooth dependencies against temperature, as shown in Figure 5. The full structure solution at 210 K, the crystal data of which are in Table 2, did not give discernible differences in the structure except for a tiny difference attributable to the temperature variation. These findings indicated the superior sensitivity of the precise heat capacity calorimetry to detect any phase transitions. Since no qualitative difference could be identified, the crystal structure just above the main transition could be treated as the structure at room temperature. The structure at 210 K is shown in Figure 6. It is noteworthy that the population ratio turned out not to vary significantly beyond the detectable level against temperature.

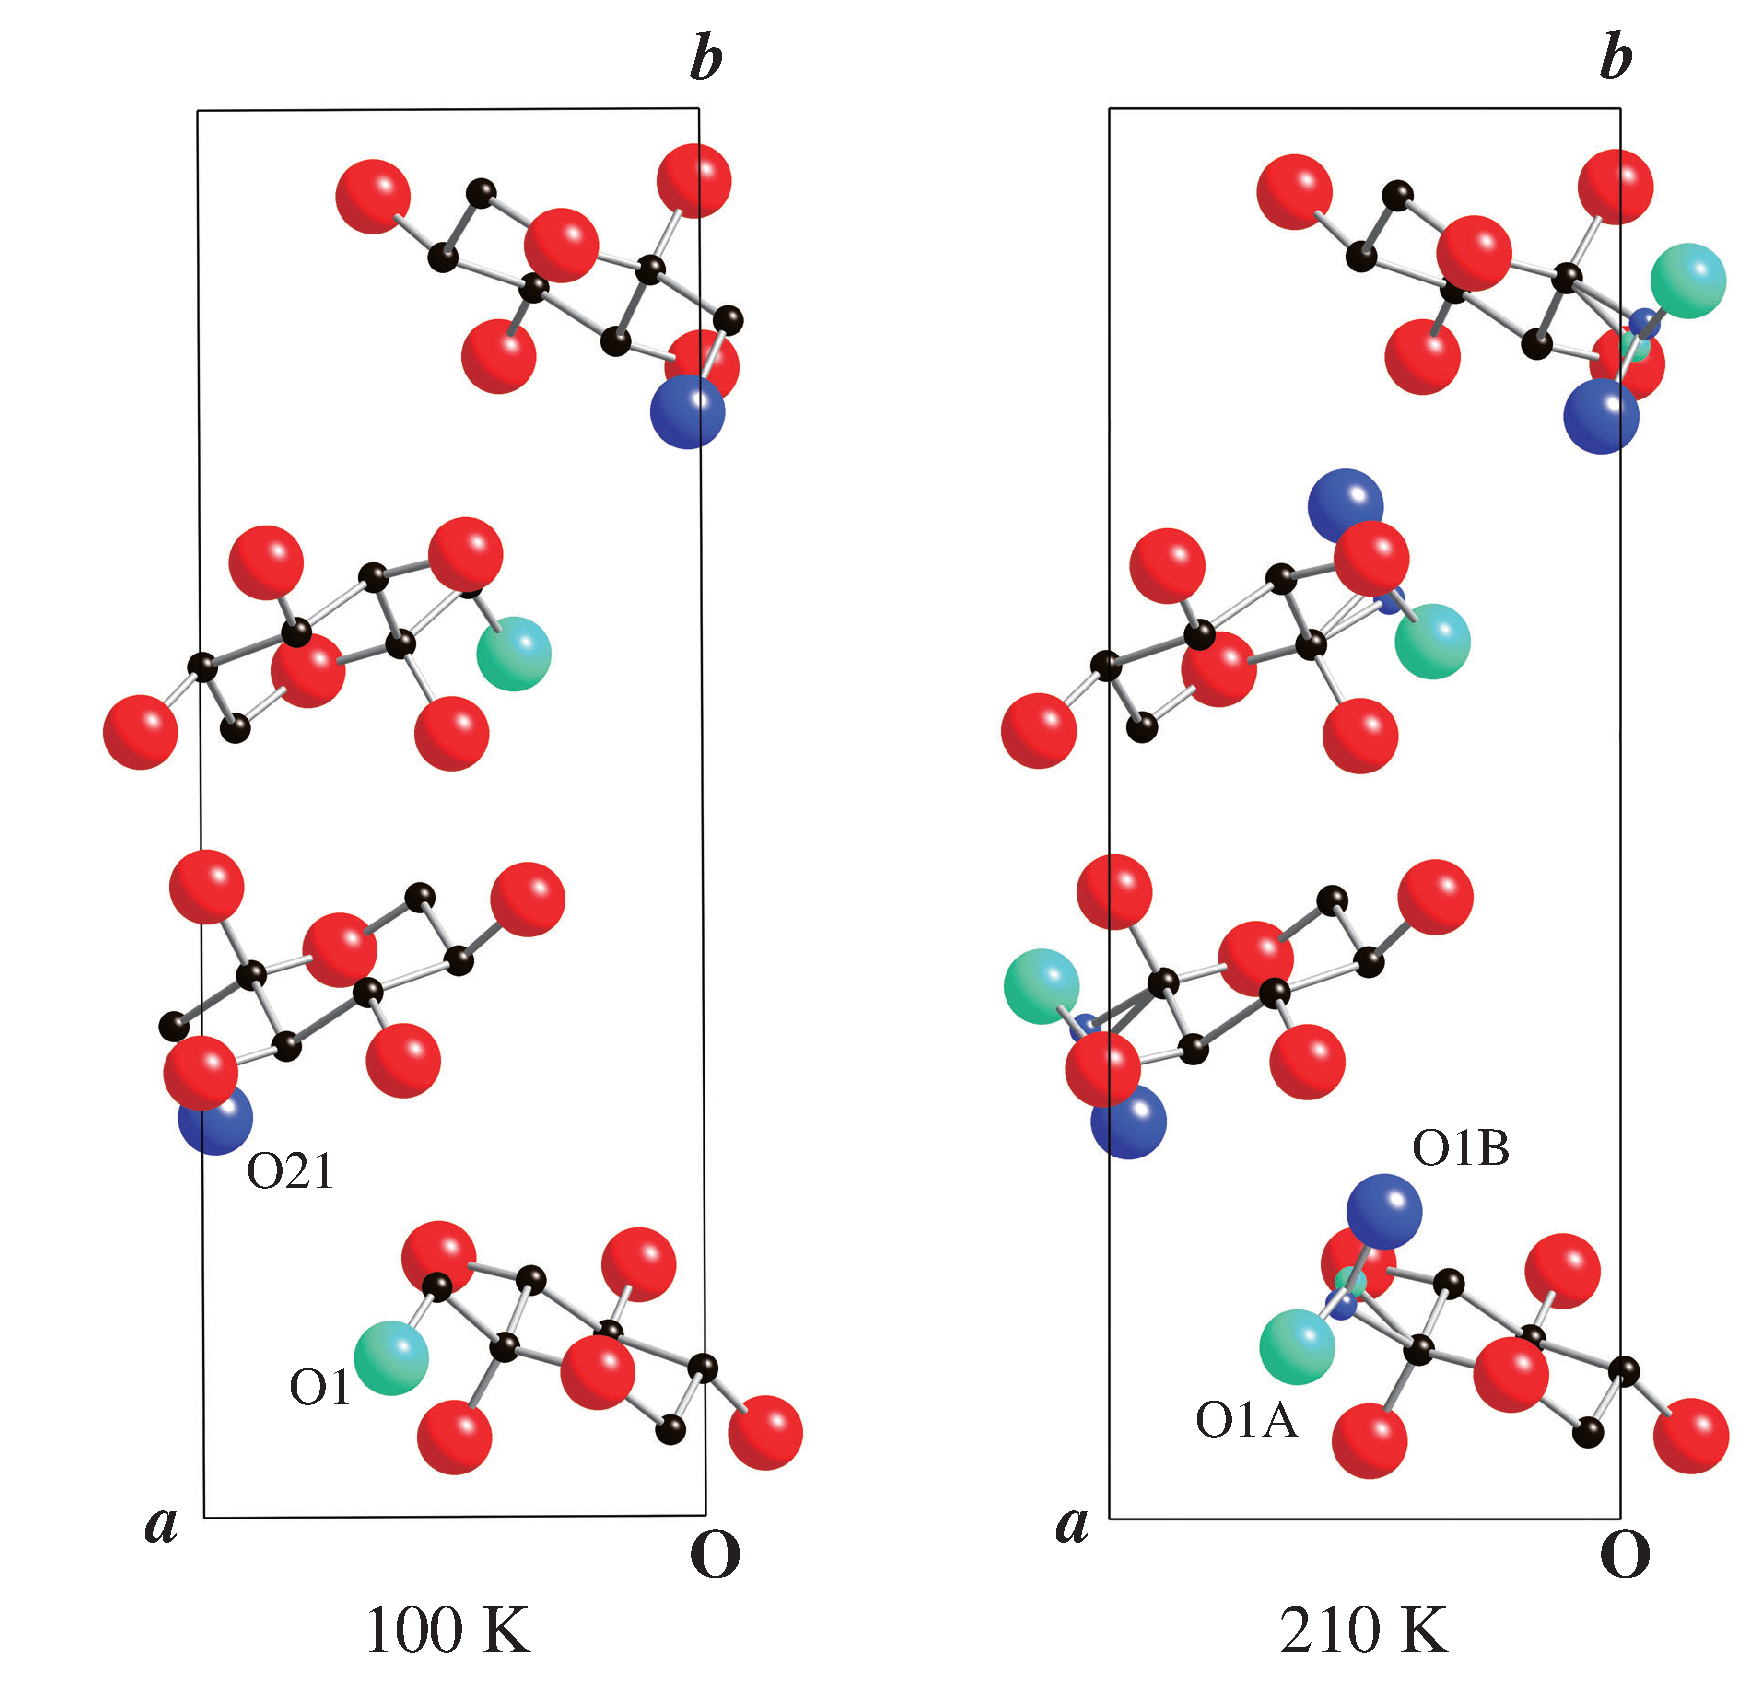
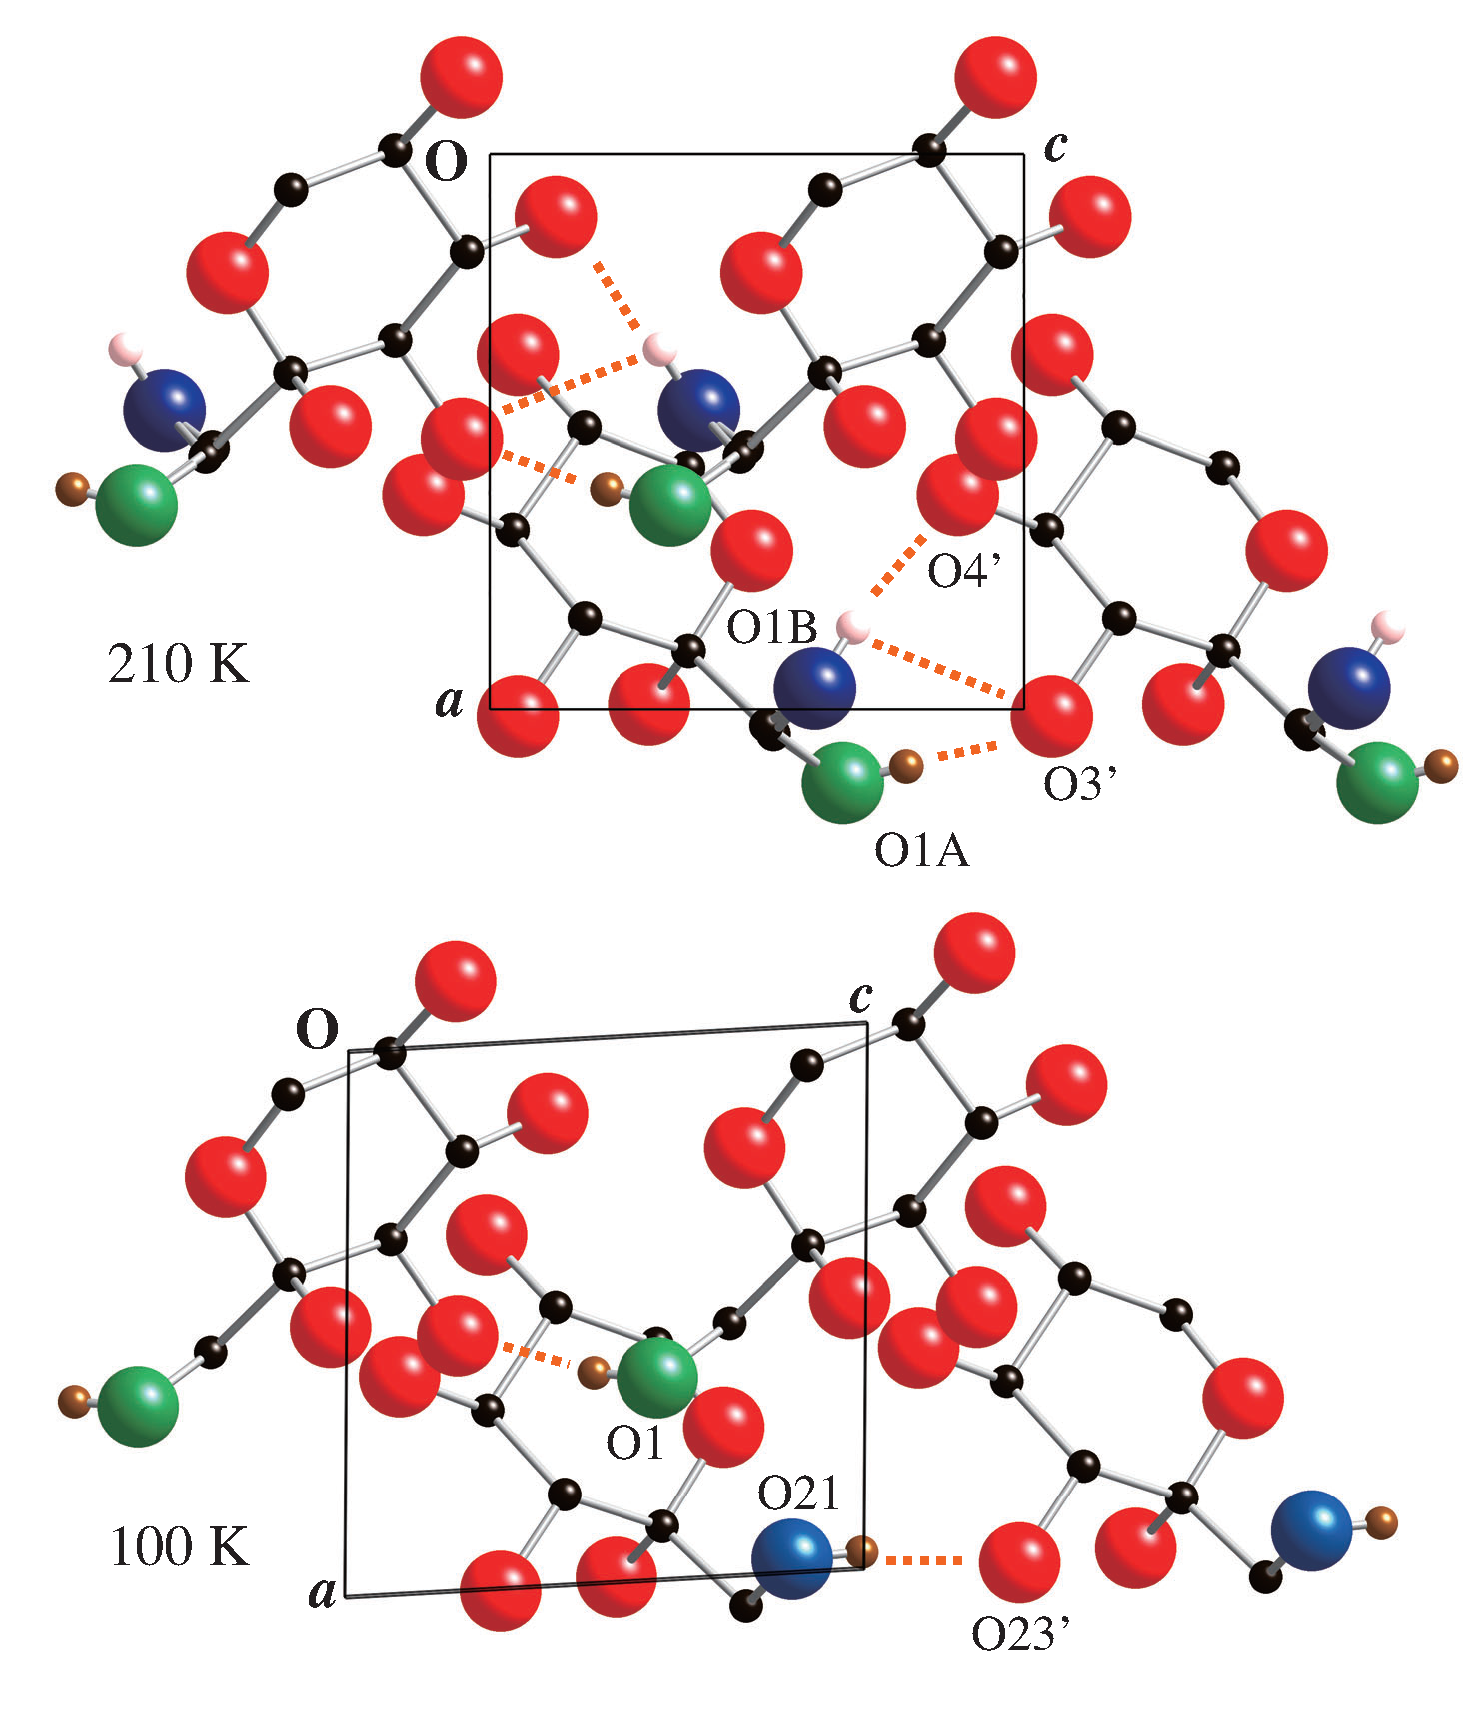
3.4. Structure of Low Temperature Phase

Although no symptom was encountered for phase transitions around 260 K, we detected a definite change caused by the main transition at 199.5 K. Diffraction photographs taken above and below the transition temperature are compared in Figure 7. The splitting of an array of diffraction spots is evident. We could index the obtained diffractions reasonably by assuming the twinning of monoclinic crystals while keeping the orientations of the a and b axes. The resultant indexing indicated that two domains had the opposing b -axis.
Adopting the standard procedure for treating diffraction data from twined samples, we completed the structural solution for the low temperature phase. The analysis of the domain volumes yielded no preference for domains having two different orientations. Equality implied that the sample crystal felt little stress. Table 2 compares the resultant crystal data with those at higher temperatures. The monoclinic angle deviated only slightly from the orthorhombic (right) angle.
The structural correspondence was not limited to the cell constants. Figure 6 compares the structures. It is noteworthy that the number of crystallographically independent molecules was not one, but two in this structure despite the same number of molecules inside a unit cell. We kept the atomic labeling in one molecule except for the O1 instead of O1A because the disorder disappeared. For the other molecule, the labeling was given by adding 20 to each atomic label number. Two types of molecules had different conformation, as distinguished by different colors of the oxygen atoms bonded to the C1 and C21 atoms in Figure 6. They had conformations that were virtually the same as the two forms in the high temperature phase. The regular arrangement in space resolved the structural disorder.
Since the phase transition kept the essential molecular packing, the molecular network formed by hydrogen bonds (H-bonds) between molecules remained mostly the same. We here describe only the notable changes involving the disordering oxygen atoms. Such H-bonds existed between equivalent molecules related by the c translation. Figure 8 shows the relevant H-bonds. In this paragraph, the prime ( ) indicates the atoms of the translated molecule defined locally. The bond between O1A and O3 via H1A in the high temperature phase (at 295 K) was nearly linear (∠OHO = 167 ) with a reasonable length (O-O = 2.80 Å) and kept its feature even in the low temperature phase (at 100 K) as that between O1 and O3 ( 171 and 2.75 Å). On the other hand, the distances between H1B (bonding to O1B) and O3 (H-B = 2.46 Å) and O4 (H-B = 2.14 Å) in the high temperature phase implied the possible formations of H-bonds. The geometry was more reasonable in the bond to O4 (∠OHO = 165 ) than O3 (∠OHO = 116 ). Indeed, H1B was apparently out of the shortest connection between O1B and O3 . However, the phase transition established a linear H-bond with a reasonable length between O21 and O23’ via H21 ( 173 and 2.77 Å).

3.5. Symmetry Breaking in the Main Transition of Crystalline Sorbose

The space groups of the room and low temperature phases were P 2 1 2 1 2 1 and P 2 1 , respectively, as shown in Table 2. The screw axes except that parallel to the b-axis of the low temperature phase disappeared in the main transition upon cooling. This disappearance resulted in the deviation of β from the right angle and caused the twinning. Although the relationship between the two space groups allowed a continuous phase transition [3,24], the main transition was first-order, as revealed by the present calorimetric experiment.
The revealed low temperature structure indicated that the symmetry realized by the assistance of the structural disorder was not one on a single site, but the one involving translation (characteristic to space groups). This situation was, in a sense, the same as the antiferromagnetic Ising model (on bipartite lattices). It is interesting to note that antiferromagnetic phase transitions survive in a magnetic field [6] because the symmetry that is broken by the transition is not the up/down symmetry, but the translational one. However, the disordered state of the Ising model is seemingly the same as that of the ferromagnetic one under the vanishing field. This identity led us to the trivial “yes” when attempting to answer whether the disorder contributed to the higher symmetry or not. The present example gave us a lesson that the thing we must see was not the equivalence on a single site if the system was antiferroic. In other words, the information on the symmetry of the high symmetry phase was insufficient to predict the low symmetry phase, as exemplified by the discussion of crystallization from the isotropic liquid [25,26].
In the above context, the present system was equivalent to the antiferromagnetic Ising model under a field. We could classify the transition as the order-disorder type, accordingly. However, the disorder was not complete, as indicated by the population ratio over two conformations. The expected entropy calculated using the ratio was 5.24 J K 1 mol 1 . The coincidence with the experimental excess (combined) was accidentally excellent. We must keep in mind the possibility that the baseline assumed had some ambiguity.

4. Conclusions

Triggered by the fact that the structural disorder, previously reported for crystalline l-sorbose [8,9], did not seem to contribute to establishing any symmetry, we started the present study.
The precise heat capacity calorimetry established thermodynamic information for a wide temperature range and the occurrence of two additional phase transitions above and a glass transition below the main transition, which was known. Since thermal anomalies associated with newly found transitions are tiny, the main transition at 199.5 K was responsible for the significant parts of excess thermodynamic quantities (enthalpy and entropy). The combined magnitude of excess entropy for three successive phase transitions was 5.23 J K 1 mol 1 , which was close to, but smaller than the expected entropy ( R ln 2 ) for an idealized order-disorder transition having two states (Ising model). Freezing of the residual disorder occurred with the glass transition around 120 K. The crystallographic experiments at several temperatures failed to detect the symptoms of the newly found transitions, but gave the structural change at the main transition. The structure of the low temperature phase was a regular spatial arrangement of two conformers, over which the disorder happened in the high temperature phase. This finding indicated that the symmetry broken in the successive transitions was not the symmetry on a single site, but the symmetry involving a translation. The structural disorder was involved in the latter, as in the antiferromagnetic Ising model under the field.
The authors demonstrated that molecular systems are a sound stage, even if not the best, for studies of structural phase transitions. The previous examples included testing a unified model for displacive and order-disorder transitions [27] in a clean (neat) system [28,29], systematic studies of the effects of well-defined impurities on such well-characterized systems [30,31], and the identification of a dipolar Ising system with an easily accessible transition temperature [32]. A new subject of the phase transition to exotic superstructures was also presented recently [33]. The present study is another example in the same spirit: molecular crystals offer typical systems for condensed matter physics because of the richness of their variety.

Supplementary Materials

The following are available online at https://0-www-mdpi-com.brum.beds.ac.uk/2073-4352/10/5/361/s1: Table S1: Experimental heat capacities of crystalline d-sorbose, Table S2: Standard thermodynamic quantities of crystalline d-sorbose at round temperatures, Table S3: Summary of the structure analyses of d-sorbose at 100 K, 210 K, and 295 K.

Author Contributions

Conceptualization, K.S.; calorimetry, S.I. and Y.Y.; X-ray diffraction; H.K. and H.S.; formal analysis, S.I. and H.K.; investigation, K.S.; resources, K.F.; writing, original draft preparation, K.S.; writing, review and editing, Y.Y., M.H. and H.S.; visualization, H.S. and K.S.; supervision, K.S.; project administration, K.S. All authors read and agreed to the published version of the manuscript.

Funding

This research received no external funding.

Conflicts of Interest

The authors declare no conflict of interest.

References

  1. Stanley, H.E. Introduction to Phase Transitions and Critical Phenomena; Oxford University Press: New York, NY, USA, 1987. [Google Scholar]
  2. Nishimori, H.; Ortiz, G. Elements of Phase Transitions and Critical Phenomena; Oxford University Press: New York, NY, USA, 2010. [Google Scholar]
  3. Landau, L.D.; Lifshitz, E.M. Statistical Physics, 3rd ed.; Butterworth-Heinemann: Oxford, UK, 1980. [Google Scholar]
  4. Sherwood, J.N. Plastically Crystalline State: Orientationally-Disordered Crystals; John Wiley & Sons Ltd.: Chichester, UK, 1979. [Google Scholar]
  5. Nambu, Y.; Jona-Lasinio, G. Dynamical model of elementary particles based on an analogy with superconductivity. I. Phys. Rev. 1961, 122, 345–358. [Google Scholar] [CrossRef] [Green Version]
  6. Nakazawa, Y.; Tamura, M.; Shirakawa, N.; Shiomi, D.; Takahashi, M.; Kinoshita, M.; Ishikawa, M. Low-temperature magnetic properties of the ferromagnetic organic radical, p-nitrophenyl nitronyl nitroxide. Phys. Rev. B 1992, 46, 8906–8914. [Google Scholar] [CrossRef] [PubMed]
  7. Jack, G.W.; Stegeman, G. The heat capacities and entropies of two monosaccharides. J. Am. Chem. Soc. 1941, 63, 2121–2123. [Google Scholar] [CrossRef]
  8. Kim, S.H.; Rosenstein, R.D. The crystal structure of α-L-sorbose. Acta Cryst. 1967, 22, 648–656. [Google Scholar] [CrossRef] [PubMed]
  9. Nordenson, S.; Takagi, S.; Jefferey, G.A. α-L-Sorbopyranose: A neutron diffraction refinement. Acta Cryst. B 1979, 35, 1005–1007. [Google Scholar] [CrossRef]
  10. Boerio-Goates, J. Heat-capacity measurements and thermodynamic functions of crystalline α-D-glucose at temperatures from 10 K to 340 K. J. Chem. Thermodyn. 1991, 23, 403–409. [Google Scholar] [CrossRef]
  11. Yamamura, Y.; Iwagaki, S.; Hishida, M.; Nagatomo, S.; Fukada, K.; Saito, K. Heat capacity and standard thermodynamic functions of three ketohexoses in monosaccharides including rare sugars: d-fructose, d-psicose, and d-tagatose. J. Chem. Thermodyn. 2019, 131, 420–430. [Google Scholar] [CrossRef]
  12. Izumori, K. Bioproduction strategies for rare hexose sugars. Naturwissenschaften 2002, 89, 120–124. [Google Scholar] [CrossRef]
  13. Granström, T.B.; Takata, G.; Tokuda, M.; Izumori, K. Izumoring: A novel and complete strategy for bioproduction of rare sugars. J. Biosci. Bioeng. 2004, 97, 89–94. [Google Scholar] [CrossRef]
  14. Izumori, K. Izumoring: A strategy for bioproduction of all hexoses. J. Biotechnol. 2006, 124, 717–722. [Google Scholar] [CrossRef]
  15. Yamamura, Y.; Saito, K.; Saitoh, H.; Matsuyama, H.; Kikuchi, K.; Ikemoto, I. Heat capacity measurements and phase transition of crystalline 4,4″-difluoro-p-terphenyl. J. Phys. Chem. Solids 1995, 56, 107–115. [Google Scholar] [CrossRef]
  16. Preston-Thomas, H. The International Temperature Scale of 1990 (ITS-90). Metrologia 1990, 27, 3–10. [Google Scholar] [CrossRef]
  17. SAINT Version 8.34A 2013; Bruker AXS: Madison, WI, USA, 2013.
  18. Sheldrick, G.M. SADABS; University of Göttingen: Göttingen, Germany, 1996. [Google Scholar]
  19. Sheldrick, G.M. TWINABS 2012/1; Bruker: Madison, WI, USA, 2012. [Google Scholar]
  20. Sheldrick, G.M. SHELXS-97. Acta Cryst. A 2008, 64, 112–122. [Google Scholar] [CrossRef] [PubMed] [Green Version]
  21. Sheldrick, G.M. SHELXL-2014. Acta Cryst. C 2015, 71, 3–8. [Google Scholar] [CrossRef]
  22. Deposition Numbers 1990266 (at 295 K), 1990267 (at 210 K), and 1990268 (at 100 K), Copies of the Data Can Be Obtained Free of Charge. Available online: https://www.ccdc.cam.ac.uk/structures/ (accessed on 24 April 2020).
  23. Suga, H.; Seki, S. Thermodynamic investigation on glassy states of pure simple compounds. J. Non-Cryst. Solids 1974, 16, 171–194. [Google Scholar] [CrossRef]
  24. Stokes, H.T.; Hatck, D.M. Isotropy Subgroups of the 230 Crystallographic Space Groups; World Scientific: Singapore, 1988. [Google Scholar]
  25. Alexander, S.; McTague, J. Should all crystals be bcc? Landau theory of solidification and crystal nucleation. Phys. Rev. Lett. 1978, 41, 702–705. [Google Scholar] [CrossRef]
  26. Saito, K.; Yamamura, Y.; Kutsumizu, S. Possible formation of multicontinuous structures by rodlike particles. J. Phys. Soc. Jpn. 2008, 77, 093601. [Google Scholar] [CrossRef]
  27. Onodera, Y. Dynamic susceptibility of classical anharmonic oscillator: A unified oscillator model for order-disorder and displacive ferroelectrics. Prog. Theor. Phys. 1970, 44, 1477–1499. [Google Scholar] [CrossRef] [Green Version]
  28. Saito, K.; Yamamura, Y.; Saitoh, H.; Matsuyama, H.; Kikuchi, K.; Ikemoto, I. Phase transition associated with molecular twisting in crystalline 4,4″-difluoro-p-terphenyl: Displacive or order-disorder transition? Solid State Commun. 1993, 87, 903–906. [Google Scholar] [CrossRef]
  29. Saito, K.; Yamamura, Y.; Saitoh, H.; Matsuyama, H.; Kikuchi, K.; Ikemoto, I. Phase transition in crystalline p-polyphenyls: Heat capacity of 4,4‴-difluoro-p-quaterphenyl. Solid State Commun. 1994, 92, 495–499. [Google Scholar] [CrossRef]
  30. Yamamura, Y.; Saito, K.; Ikemoto, I.; Sorai, M. Entropic evidence of the order-disorder nature of the phase transition in p-terphenyl crystal. J. Phys. Cond. Matter 1998, 10, 3359–3366. [Google Scholar] [CrossRef]
  31. Yamamura, Y.; Saito, K.; Sorai, M.; Ikemoto, I. Disappearance of a displacive phase transition in crystalline biphenyl by a small amount of impurity. J. Phys. Soc. Jpn. 1998, 67, 1649–1654. [Google Scholar] [CrossRef]
  32. Yamamura, Y.; Saitoh, H.; Sumita, M.; Saito, K. One-dimensional correlation in the dipolar Ising crystal tricyclohexylmethanol: Crystal structure revisited and heat capacity. J. Phys. Cond. Matter 2007, 19, 176219. [Google Scholar] [CrossRef]
  33. Saito, K.; Ikeda, T.; Yamamura, Y.; Saitoh, H.; Hishida, M.; Kobayashi, Y.; Fujita, T.; Ichikawa, J. Cell-quintupling: Structural phase transition in a molecular crystal, bis(trans-4–butylcyclohexyl)methanol. J. Chem. Phys. 2017, 146, 074503. [Google Scholar] [CrossRef] [PubMed]
Figure 1. Structure of the d-sorbose molecule and atomic labeling in the room temperature phase. Since O1A and O1B atoms and bonding hydrogens result from the structural disorder, they are exclusive to each other. Hydrogen atoms bonding to oxygen atoms share the same number with respect to oxygen atoms.
Crystals 10 00361 g001
Figure 2. Experimental heat capacities of crystalline sorbose. Black circle, present data for d-sorbose; red cross, data for l-sorbose by Jack and Stegeman [7]; dotted line, normal heat capacity (see the text).
Crystals 10 00361 g002
Figure 3. Experimental heat capacities divided by temperature of crystalline d-sorbose. Black, data obtained in the run from 6 K; green, data from 220 K; red, data from 240 K; blue, data from 250 K.
Crystals 10 00361 g003
Figure 4. Experimental results in the glass transition region. (a) Heat capacities divided by the temperature of crystalline d-sorbose, obtained in the run from the lowest temperature (ca. 6 K). (b) Temperature drifts during the equilibration period observed after cooling with different rates. Indicated rates are those around 120 K.
Crystals 10 00361 g004
Figure 5. Relative cell constants above the main transition (at 199.5 K) of crystalline d-sorbose. Black plus, a; red circle, b; blue cross, c.
Crystals 10 00361 g005
Figure 6. Crystal structures of the low (at 100 K) and high temperature (at 210 K) phases of d-sorbose viewed along the c-axis. Green and blue balls on the right are the major and minor components of the disordered oxygen atom in the high temperature phase. Hydrogen atoms are not shown for clarity.
Crystals 10 00361 g006
Figure 7. Diffraction photographs of crystalline d-sorbose taken at 100 K (left) and 210 K (right). The sharp spots on the extrapolation of the lines correspond to k = 2 8 from bottom to top.
Crystals 10 00361 g007
Figure 8. Crystal structures of the low (at 100 K) and high temperature (at 210 K) phases of d-sorbose viewed along the b-axis. Green and blue balls in the top are major and minor components of the disordered oxygen atom in the high temperature phase. Selected hydrogen bonds are shown by dotted lines together with the mediating hydrogen atoms.
Crystals 10 00361 g008
Table 1. Thermodynamic quantities associated with the phase transition of crystalline sorbose.
T trs (K) 199.5 ± 0.5 259 ± 1 267 ± 1
Order of transition111
Δ trs H (J mol 1 ) 1010 ± 20 30 ± 1 14 ± 1
Δ trs S (J K 1 mol 1 ) 5.06 ± 0.09 0.12 ± 0.01 0.05 ± 0.01
Notemain transition
Table 2. Crystal data of sorbose at different temperatures.
Empirical formula C 6 H 12 O 6
Formula weight 180.16
Molecular formdddl
RadiationX-rayX-rayX-rayneutron
T (K)100210295RT [9]
Crystal systemmonoclinicorthorhombicorthorhombicorthorhombic
Space groupP 2 1 P 2 1 2 1 2 1 P 2 1 2 1 2 1 P 2 1 2 1 2 1
a (Å)6.4999 (7)6.5258 (2)6.5372 (1)6.545 (2)
b (Å)18.1977 (20)18.0150 (6)18.0528 (3)18.062 (7)
c (Å)6.1935 (7)6.2922 (2)6.3059 (1)6.310 (2)
β ( )93.562 (5)909090
V 3 )731.18 (14)739.73 (4)744.19 (2)745.94
Z4444
R [ F 2 > 2 σ ( F 2 ) ] 0.02790.02860.03020.044

