Article

Enhancement of ZnO Nanorods Properties Using Modified Chemical Bath Deposition Method: Effect of Precursor Concentration

by
Ahmed Fattah Abdulrahman
1,*,
Sabah Mohammed Ahmed
2,
Naser Mahmoud Ahmed
3 and
Munirah Abullah Almessiere
4
1
Department of Physics, Faculty of Science, University of Zakho, Kurdistan Region 42001, Iraq
2
Department of Physics, College of Science, University of Duhok, Kurdistan Region 42001, Iraq
3
School of Physics, Universiti Sains Malaysia, Penang 11800, Malaysia
4
Department of Biophysics, Institute for Research and Medical Consultations (IRMC), Imam Abdulrahman Bin Faisal University, P.O. Box 1982, Dammam 31441, Saudi Arabia
*
Author to whom correspondence should be addressed.
Submission received: 14 March 2020 / Revised: 5 May 2020 / Accepted: 6 May 2020 / Published: 9 May 2020
(This article belongs to the Special Issue Zinc Oxide Nanomaterials and Based Devices)

Abstract

:
In this study, the effects of different precursor concentrations on the growth and characteristics properties of the zinc oxide (ZnO) nanorods (NRs) synthesized by using modified and conventional chemical bath deposition (CBD) methods were investigated. The morphologic, structural and optical properties of synthesized ZnO NRs with different precursor concentrations were studied using various characterization techniques. The experimental results show that the varying precursor concentration of the reactants has a remarkable and significant effect on the growth and characteristics properties of ZnO NRs. In addition, the characteristic properties of ZnO NRs grown using the modified method showed significantly improved and enhanced properties. The average length of grown ZnO NRs increased with increased precursor concentration; it can be seen that longer ZnO NRs have been investigated using the modified CBD methods. The ZnO NRs synthesized at 0.05 M using the modified method were grown with high aspect ratios than the ZnO NRs grown using conventional means which were 25 and 11, respectively. The growth rate increased with increased precursor concentration; it can be observed that a higher growth rate was seen using the modification CBD method. Furthermore, XRD results for the two cases reveal that the grown ZnO samples were a nanorod-like in shape and possessed a hexagonal wurtzite structure with high crystal quality. No other phases from the impurity were observed. The diffraction peaks along (002) plane became higher, sharper and narrower as precursor concentration increased, suggesting that the crystalline quality of ZnO NRs grown using the modified method was more enhanced and better than conventional methods. However, optical studies show that the transmittance at each concentration was more than two times higher than the transmittance using the modified CBD method. In addition, optical studies demonstrated that the ZnO NRs grown by using modified and conventional methods had a direct Eg in the range of (3.2–3.26) eV and (3.15–3.19) eV, respectively. It was demonstrated in two methods that ZnO NRs grown at a precursor concentration 0.05 M gave the most favorable result, since the NRs had best characteristic properties.

1. Introduction

Recently, zinc oxide (ZnO) is one of the versatile n-type and technologically significant semiconducting material due to its unique properties such as; wide direct energy band gap (3.37 eV), transparency in the visible range, plenty in nature, non-toxic, high-electrochemical stability and resistivity control over range 10−3 to 105 Ω cm [1]. At room temperature, ZnO has wide exciton-binding energy (60 meV), high mechanical stability, high chemical stability, thermal stability, biocompatibility, excellent optical and electrical properties and [2]. These properties make the ZnO material useful for many optoelectronic devices such as ultraviolet light sensors, gas sensors, dye-sensitized solar cells, transparent conducting layers, photocatalysts, blocking layer in flexible organic solar cell, light-emitting devices and thin-film transistors [3,4,5,6,7]. ZnO has typical morphologies of nanostructure that have been synthesized include nanoparticles, nanosheets, nanotubes, nanotetrapods, nanowire, nanocombs, nanodisks, nanobelts, nanorods, nanorings and several other as having been investigated in various studies [8,9,10,11]. Many methods have been developed for the growth of ZnO nanostructures. These methods fall into the main categories of physical and chemical approaches. The methods are radiofrequency magnetron sputtering, molecular beam epitaxy, chemical vapor deposition (CVD), vapor phase transport, pulsed laser deposition, metallic organic chemical vapor deposition, electrochemical deposition, spray pyrolysis, CBD method, sol–gel method, modified chemical bath deposition method and several others as described in previous reviews [12,13,14,15]. Among the above-mentioned methods, the CBD technique is recently attracting great attention, as one of the most effective, efficient and high-performance growth methods for fabrication different nanomaterial and nanostructures due to its advantages, such as low cost, reproducibility, the cheapness and common availability of starting chemicals, low temperature (<100 °C), lack of a complex growth system requirement, use of environmentally friendly chemicals, formation of high-density arrays, non-hazardous, simplicity, high quality of obtained crystals and large capacity of growth vessel used [16,17,18]. A large range of substrates (organic and inorganic) can be used in CBD approaches due to the fact it does not require electrical conductivity of the substrate [16]. The low-temperature CBD method avoids corrosion and oxidation of metallic substrates. The CBD results in pinhole-free and uniform deposits that are easily obtained since the basic building blocks are ions instead of atoms. However, the CBD approach has three main disadvantages that most the researchers have mentioned in various studies [19,20,21]. These problems have been addressed using the low-cost modified CBD method [21]. The modification is by using injections of air bubbles inside the growth solution during CBD reaction in the oven to provide a continuously homogenous growth solution and furnish the oxygen for the duration of the CBD process [21]. The morphology of ZnO nanorods synthesized by modified CBD methods depends on several main growth parameters, such as the growth time [22], seed layer characteristics (thickness, orientation and grain size) [23], precursor concentration of the reactants in the deposition solution [24,25], growth temperature [26], presence of capping agents (usually polyelectrolyte molecules) [23], pH of the deposition solution [23,27], substrate position in the reactor [23], effect of polyethylenimine (and its molecular weight) [28], role of different initial rest times on buffer layer [29] and mechanical stirring [23]. Clearly, simultaneous improvement of these growth parameters toward achieving NRs arrays with in-demand properties is a formidable task.
In the current study, low-cost-modified and conventional CBD methods were used to synthesize ZnO nanorods (NRs). The effects of different precursor concentrations of growth solution on ZnO nanorods properties were obtained for both methods of preparation.

Brief Survey on the Influence of Precursor Concentration in the Growth of ZnO Nanorods

Many researchers have attempted to control the growth and physical characterization of ZnO NRs using several precursor concentrations to improve the growth and performance of ZnO NRs-based devices. For example, the influence of different precursor concentrations such as 0.02, 0.03 and 0.04 M on the morphology of ZnO NRs have been observed by Jia et al., who found that the surface morphology of the ZnO NRs changed from rods with diameter from 80–1200 nm to wire or pie [30]. Li et al. investigated the influence of precursor concentrations (12.5, 25, 37.5 and 50 mM) on ZnO NRs morphology and reported that it was possible to control the aspect ratio of ZnO NRs on the substrate by changing the preparation parameters [31]. Wahab et al. investigated the effect of different precursor concentrations on ZnO NRs properties and demonstrated that the surface morphology, size and shape of ZnO NRs are strongly dependent on precursor concentration. Also, the optical properties of the produced samples displayed good optical property as compared with bulk ZnO [32]. The effect of different precursor concentrations from 0.01 M to 0.1 M on crystal growth, alignment, optical and electrical properties were obtained by Lee and Yang, who was reported that the precursor concentration had a large influence on the well-aligned orientation and highest aspect ratio (~21) of the ZnO nanorods [33]. Tong et al. investigated the effect of different precursor concentrations (12.5, 18.75, 25, 37.5 and 50 mM) on the structure, morphology and optical properties of ZnO NRs grown on ITO films coated with PET by two steps CBD at low temperatures. It has been reported that the average size, length, orientation and density distribution of produced ZnO NRs are dependent on the precursor concentrations of a solution. Also, the diameter and length of ZnO NRs increased in the range of 173–397 nm and 600–1200 nm by increasing the concentration from 12.5 mMol to 50 mMol, respectively [34]. The influence of different precursor concentrations on the growth of ZnO NRs on Si substrates by simple CBD was studied by Urgessa et al., who found that the average size and aspect ratio of obtained ZnO NRs largely increased with the increase of precursor concentrations [35]. Patil et al. proposed the role of precursor concentrations (0.025, 0.05 and 0.075 M) on alignment, morphology, optical properties and energy band gap ZnO NRs on Si substrates by using CBD method at low temperature. Also, they reported that the controllable growth of ZnO NRs can be realized by changing the precursor concentrations [36]. Shabannia and Abu Hassan reported that the precursor concentration has a significant impact on the diameter, length, shape, orientation, density, structure and optical properties of ZnO NRs. The well-aligned hexagonal ZnO NRs were found at 50-mM precursor concentration and had small average diameter ranged from 10 nm to 40 nm as well as sharpest and most intense UV peaks [37]. Chee et al. studied the effect of the different precursor concentrations on the morphology, structure and optical properties of ZnO NRs grown on FTO substrate by using the CBD method. Also, the precursor concentration has a strong effect on the morphology and aspect ratio of ZnO NRs [38]. Thambidurai et al. prepared ZnO NRs grown on ITO substrate at precursor concentration by CBD method for dye-sensitized solar cell applications. The average diameter and average length of ZnO nanorods are 100–200 nm and 1–3 μm, respectively with hexagonal structure was obtained [39]. Fuad et al. obtained the impact of different precursor concentrations (30, 35 and 45 mM) on the morphology, crystal structure and Eg of ZnO NRs grown on ITO substrate by using low-temperature method. It was reported that the average diameter and particle size increased as the precursor concentration change from 30 mM to 35 mM and then decreased at 45 mM. In addition, the obtained ZnO NRs had wurtzite hexagonal crystal structure and grown with c-axis [40]. The influence of different precursor concentrations (0.01–0.07 M) on the morphology, structure and nanoscale electrical properties of well-aligned ZnO NRs grown on gallium-doped ZnO substrate by CBD process was observed by Chen et al [41]. It was found that intensity; average length, and average diameter increased as the precursor concentrations are increased. The high aspect ratio was found when ZnO nanorods were grown at 0.05 M precursor concentration [41]. Abuelsamen et al. demonstrated that the crystallinity and surface morphology of ZnO NRs were strongly affected by changing the concentration and had an effect on the UV photosensing [42]. The density of ZnO NRs was decreased as the precursor concentrations are increased. The highest photocurrent and current gain under low power intensity were found to be best at 50 mM precursor concentration. The brief survey presented above demonstrates that the precursor concentration of deposition solution is a crucial parameter in preparing controllable ZnO NRs for various nano-technological applications and has a great influence on the growth, morphology, size, shape, alignment, length, density distribution, orientation and aspect ratio of the ZnO nanorods.

2. Experimental Methodology

In this study, all the used chemical substances such as zinc nitrate hexahydrate (ZNH) (Zn(NO3)2.6H2O) and hexamethylenetetramine (HMTA) (C6H12N4) was bought from Sigma-Aldrich without further purification. Deionized (DI) water with a resistivity of 18.2 MΩ*cm was employed for synthesis and treatment processes.

2.1. Sample Preparation
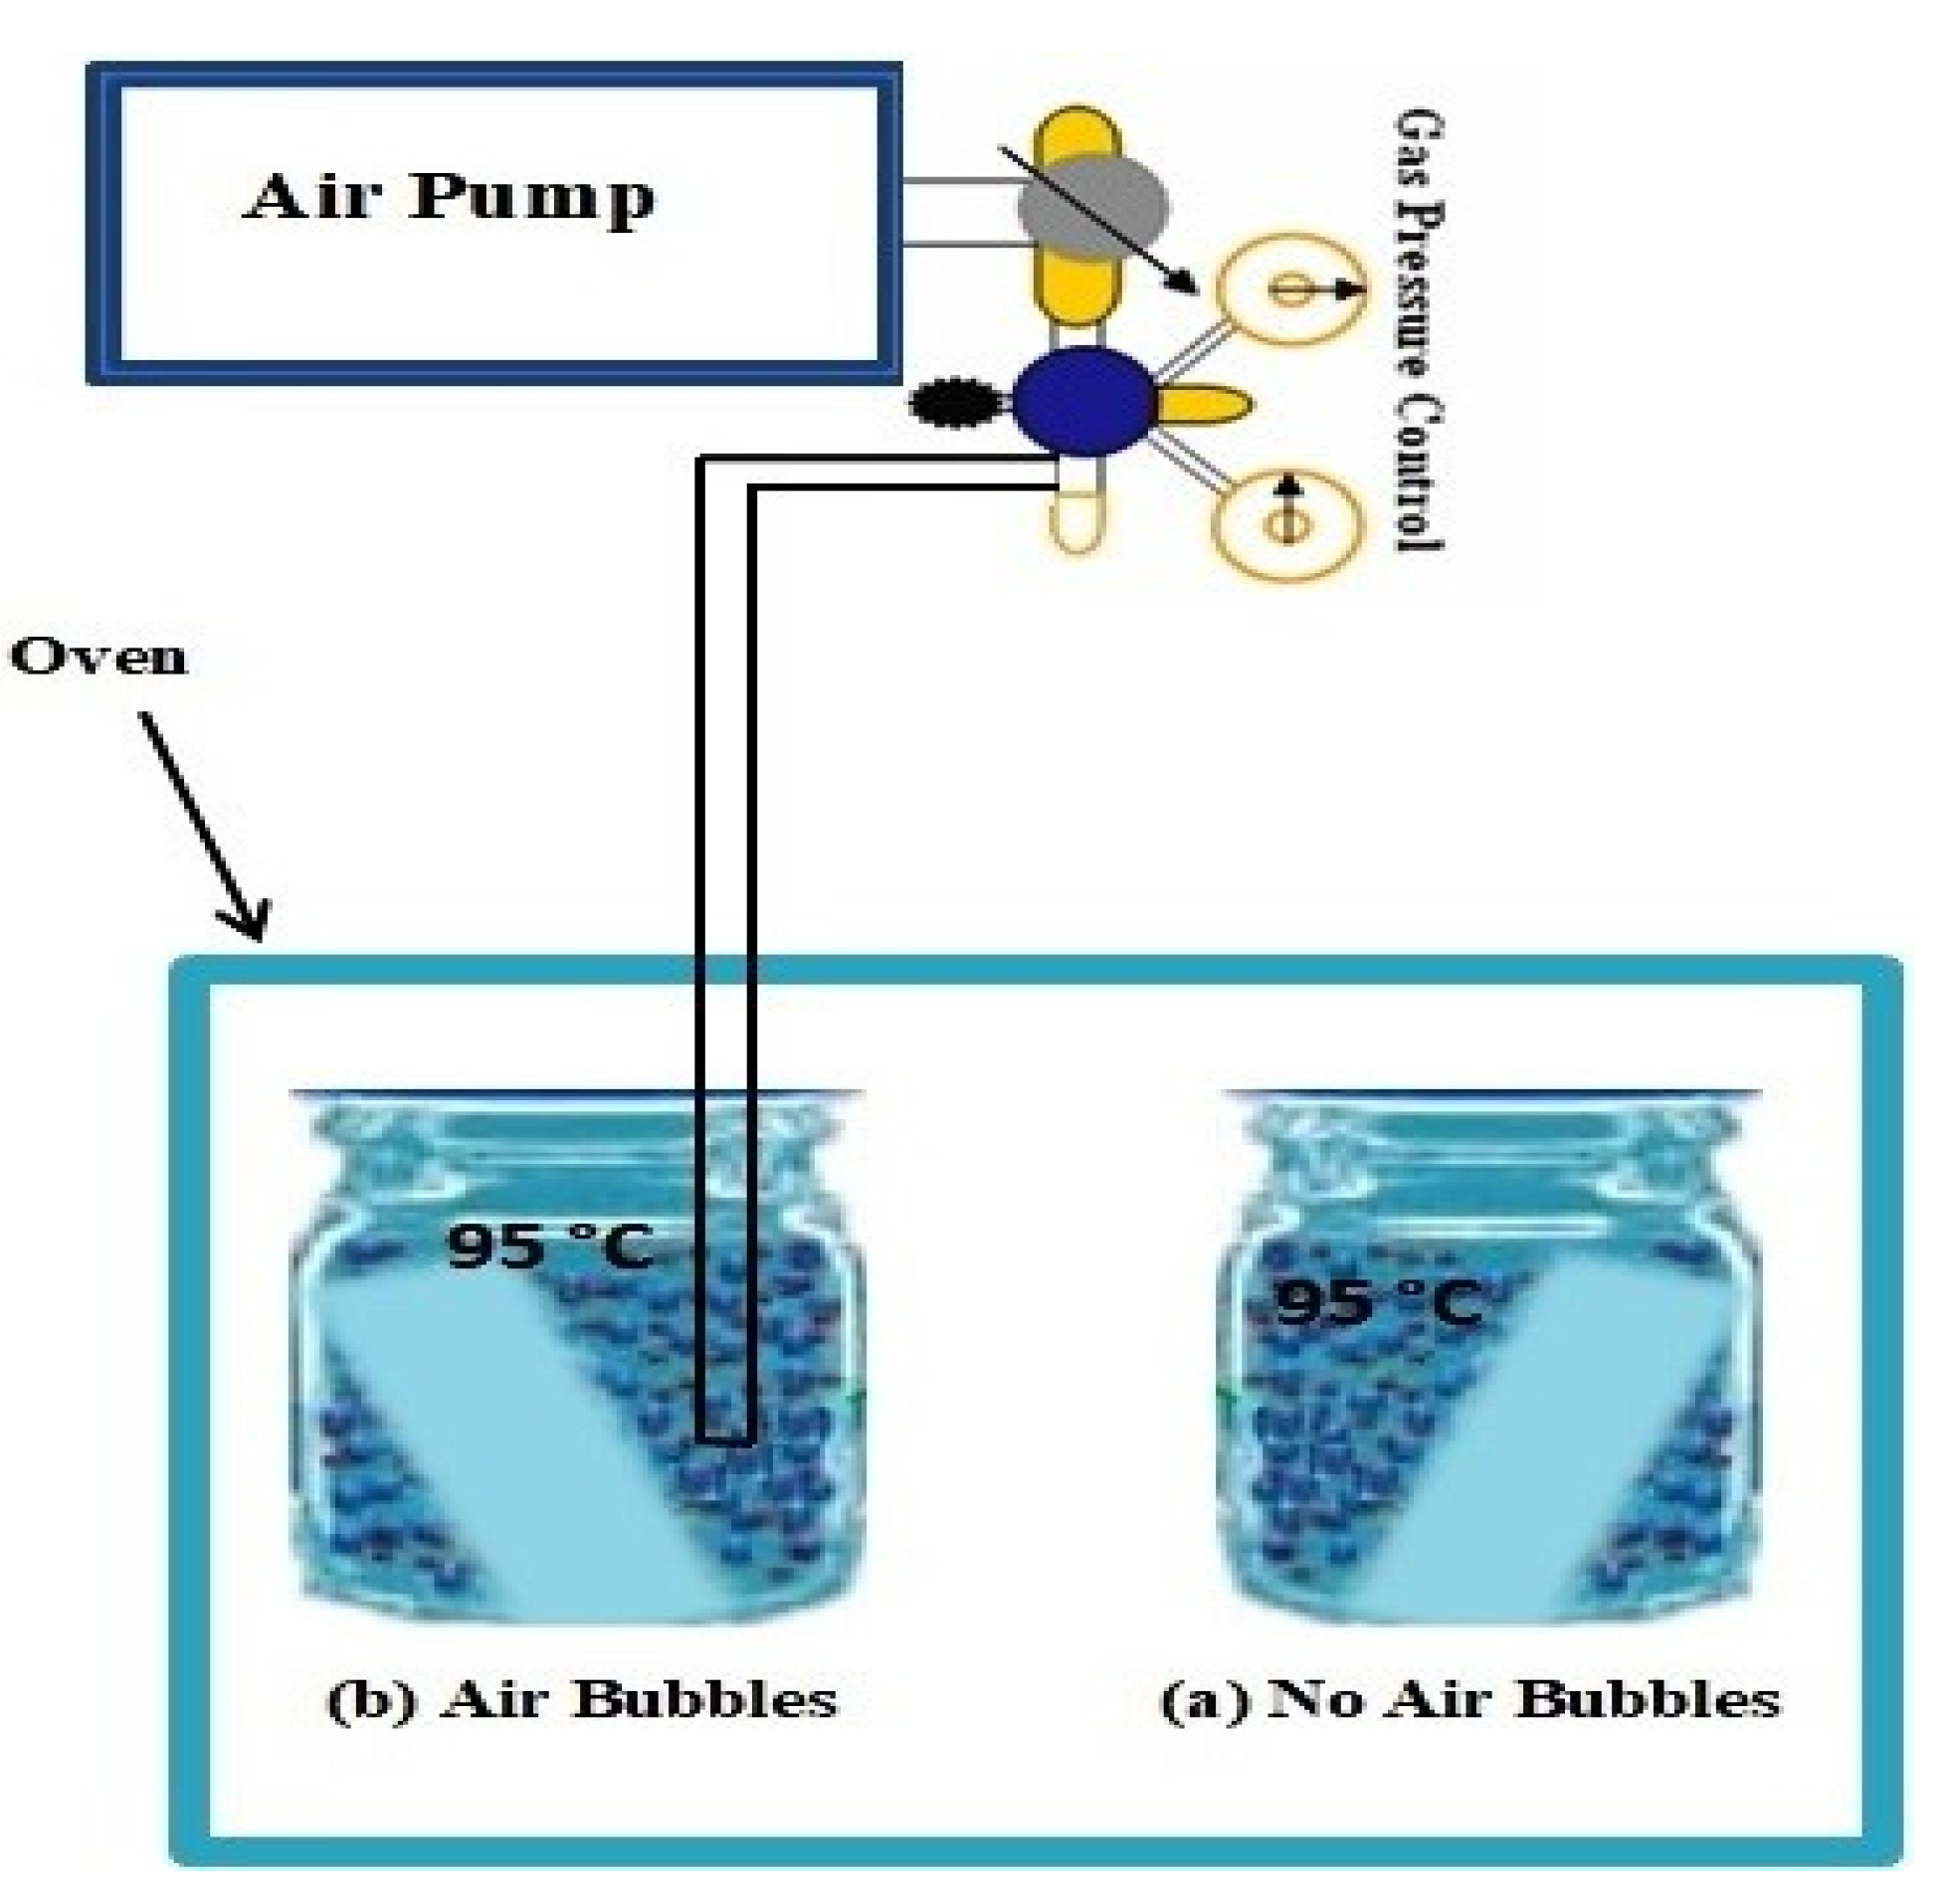
The microscopic slide laboratory glass (soda lime) was chosen as substrates for growing ZnO nanorods. The ZnO nano-seed layer was deposited on glass substrates by the following two stages. First, the microscopic glass substrates were cleaned by employing an ultrasonic bath using ethanol (96%), acetone and DI water for 15 min, respectively. Second, the radio frequency (RF) magnetron sputtering technique was applied by utilizing the ZnO target (99.999% purity of ZnO) to coat 100 nm ZnO nano-seed layer on cleaned glass substrates with 150-watt radio frequency power 5.5 × 10⁻³ mbar gas pressure of argon inside RF chamber for 15 min. The prepared ZnO nano-seed layers on glass substrates were annealed inside of the tubular furnace at 400 °C under an atmosphere for 2 h to stress relief and improve the nano-seed layer quality [18].

2.2. Growth Process

High quality, vertically well-aligned ZnO NRs were synthesized using the conventional and modified CBD methods. DI-water was employed as the solvent and each HMTA and ZNH were employed as precursors. The equimolar 1:1 of both (Zn(NO3)2.6H2O) and (C6H12N4) being 0.5 Mol was thawed in DI-water one by one and the thawed solutions were blended with each other by employing a magnetic stirrer to obtain an identical deposition solution [43]. The initial pH value of the original growth solution was 6.7, the growth solution was transparent. To show the effectiveness of the different precursor concentration on the growth of ZnO NRs, the obtained structures using the modified CBD method were compared with the conventional CBD method. The ZnO NRs were synthesized from different precursor concentrations of growth solution when no air bubbles and air bubbles. The precursor concentrations were 0.01 M, 0.025 M, 0.05 M and 0.075 M and the corresponding samples when no air bubbles were labeled a, b, c, d, respectively. But the corresponding samples when air bubbles were labeled e, f, g and h for 0.01 M, 0.025 M, 0.05 M and 0.075 M, respectively. The initial and final pH values of the growth solution were precisely measured before and after the growth process. The annealed ZnO nano-seed layer deposited glass substrates was transferred inner a container or vessel containing a combination of the two deposition solutions at 70 substrate-angle with vessel. To gain the influence of the several precursor concentrations on the ZnO NRs properties for two cases, the CBD arrangement (beaker with seeded substrate and solution) were allocated inside an oven under air bubbling with 5000 mL/min flow rate and 70,000 Pascal air pressure for 240 min at 95 °C [21] and the schematic of CBD growth process is shown in Figure 1. After ending the required growth duration of the CBD process for two cases, the synthesized ZnO NRs samples were taken from deposition solution and washed through the use of DI-water to take off the remaining zinc salt and dried nitrogen gas was utilized to dry it.

2.3. Characterization Techniques

The direct current (DC)/ RF magnetron sputtering system Auto HHV 500 sputter coater model: was employed to coat the ZnO nano-seed layer on glass substrates. In addition, the annealing tube furnace model: Lenton VTF/12/60/700 was utilized to anneal the ZnO nano-seed layer. High-quality pH meter bench top model PHSJ-4F from Hinotek Company was utilized to measure the pH of growth solution. In addition, the three standard buffer pH solutions (pH 4, pH 7 and pH 10) were used to calibrate the pH meter. The high-resolution field emission scanning electron microscope (FESEM) (model of FESEM was Carl Zeiss, Leo-Supra 50 VP, Germany and a nano SEM 450-FEI Nova Netherlands) were employed to examine and characterize the surface morphology such as top view and side view (density, shape, size, length, thickness, cross-section, homogeneity, thickness and distribution) and energy-dispersive X-ray spectroscopy (EDX) analysis was used to analyses of chemicals composition of the produced ZnO NRs. In addition, the high-resolution X-ray diffraction (HR-XRD) system with a model of X-Pert Pro MRD with CuKa (λ = 0.154050 nm) radiation was employed to examine and analyze the X-ray pattern and crystal structure such as crystal quality, crystal size, strain, stress and epitaxial growth of synthesized ZnO NRs in the scanning range of 2 theta (2θ set between 20° and 80°). In addition, a double beam ultraviolet visible (UV-4100) was utilized to analyze the optical properties such as transmittance spectrum and band gap of prepared ZnO NRs in the wavelength range 300 nm to 800 nm

3. Results and Discussion

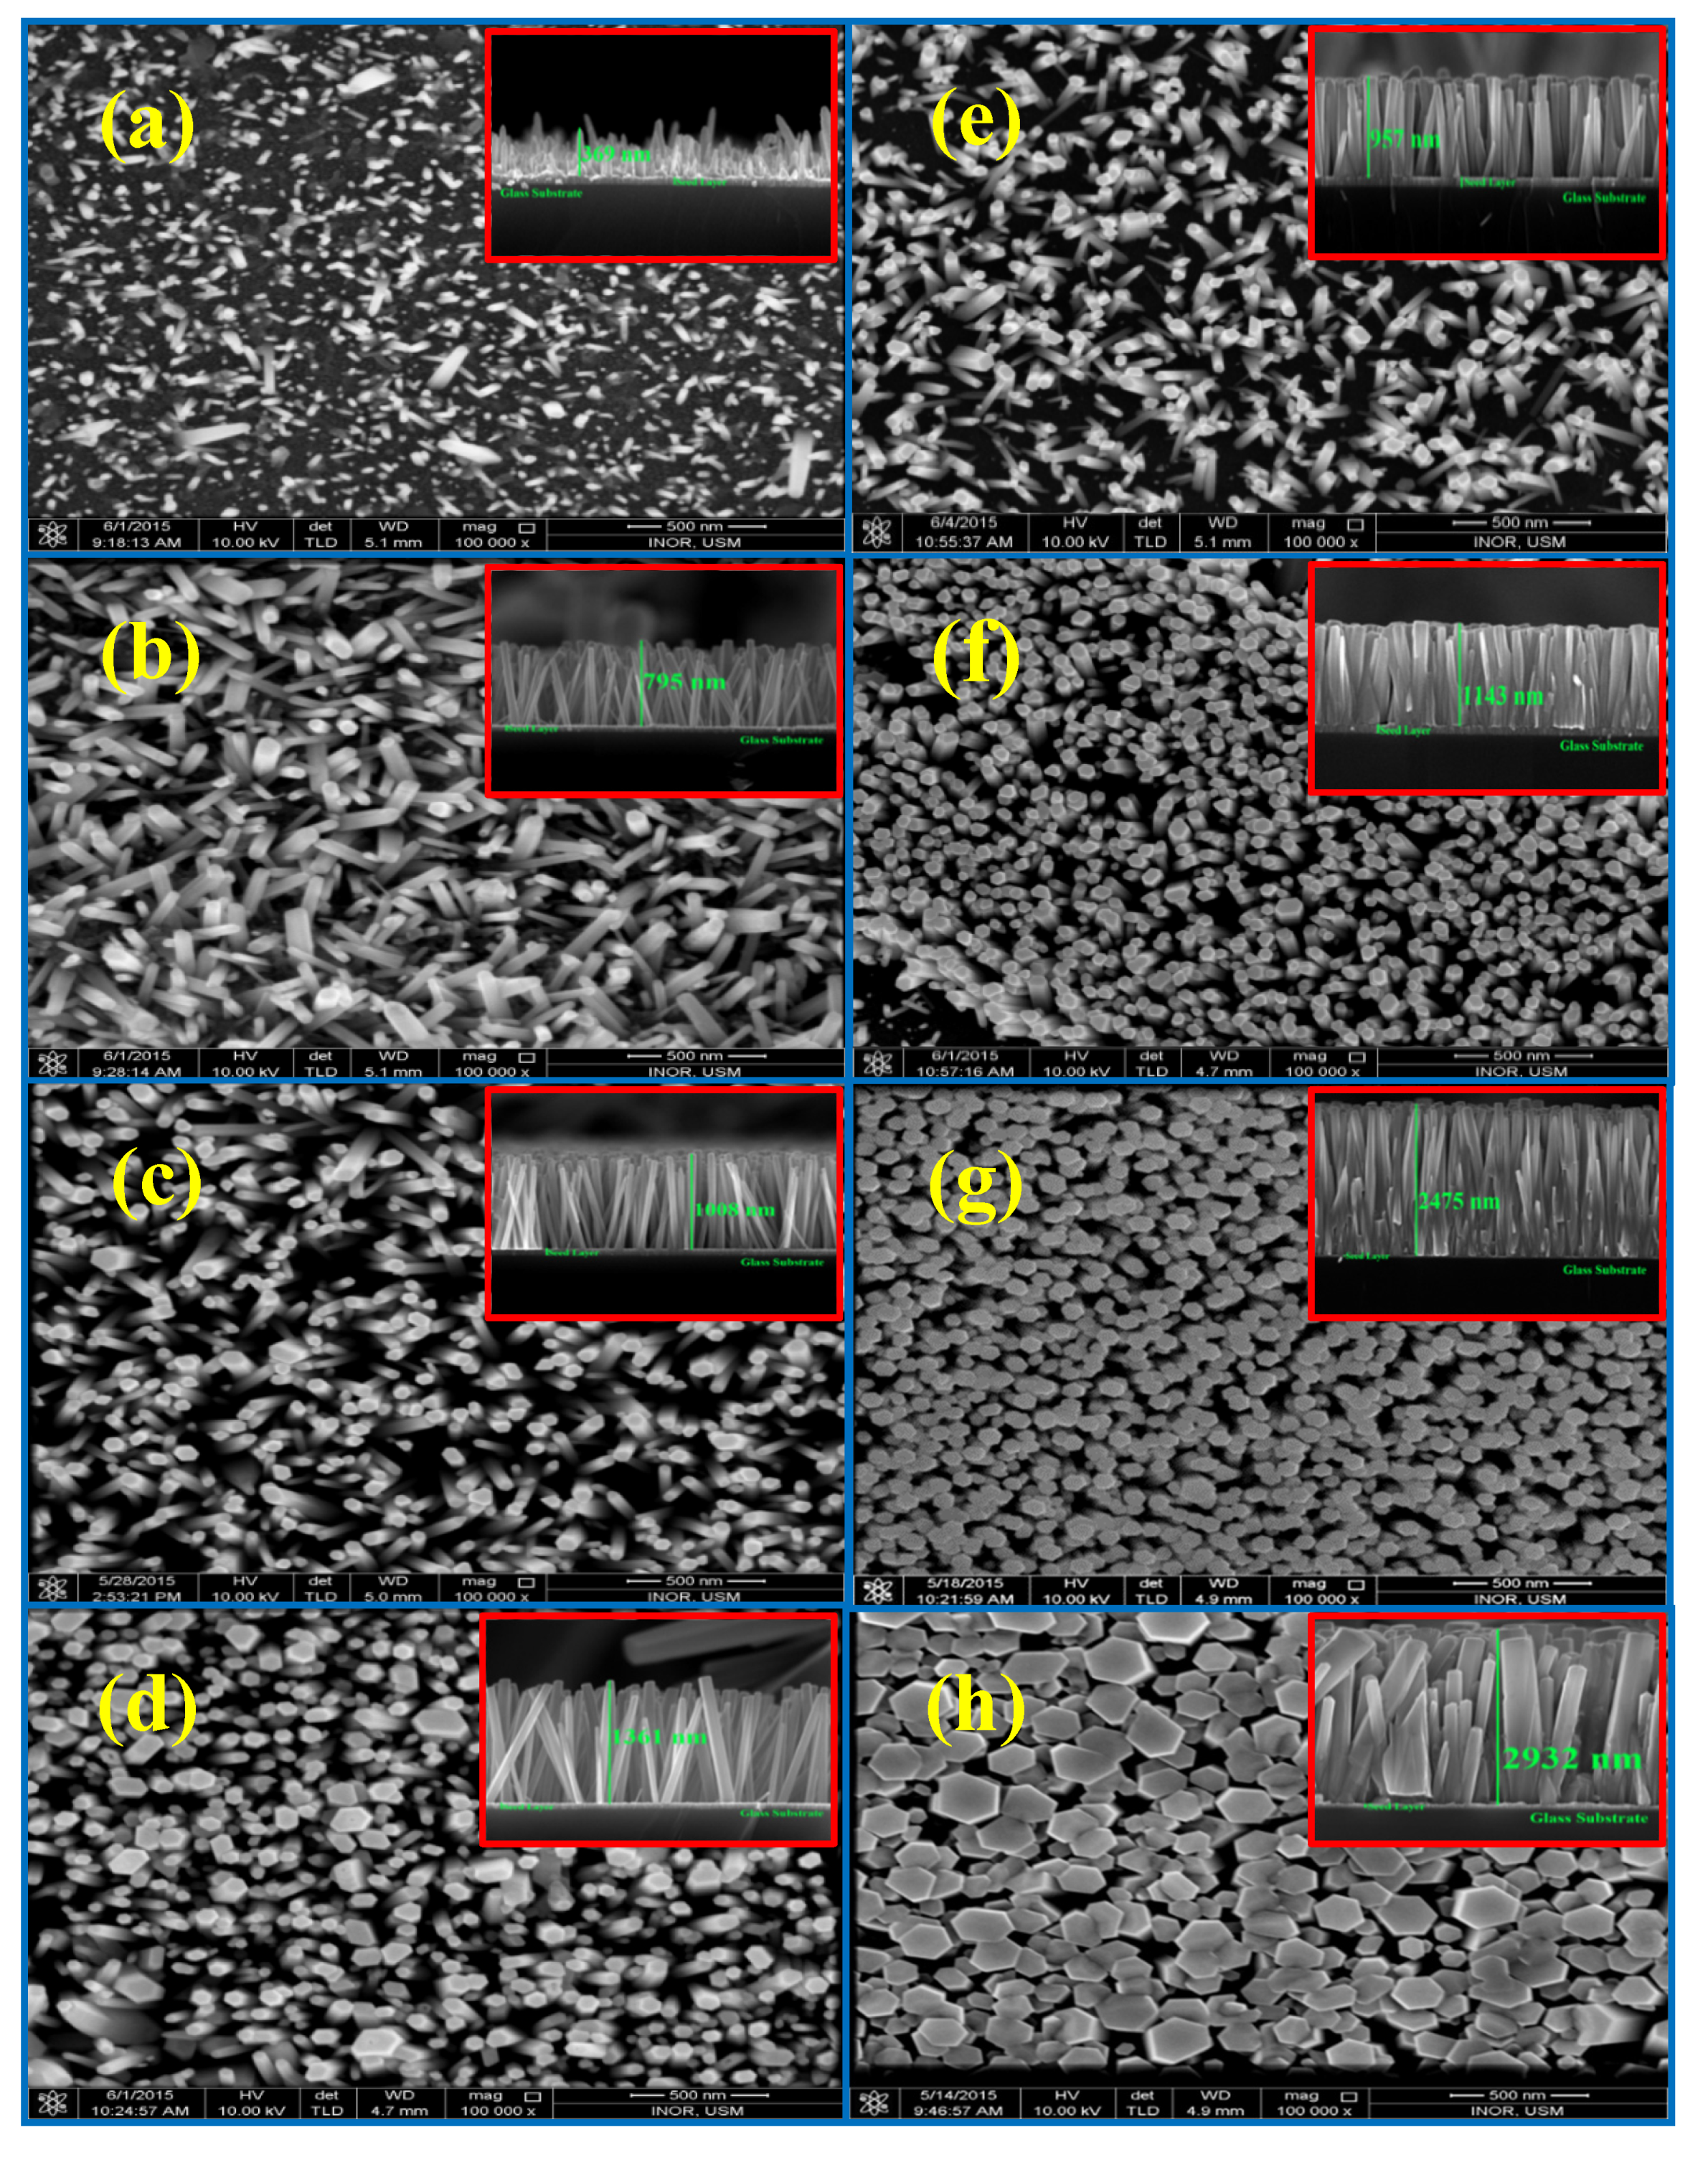
3.1. Morphology Characteristics

The FESEM images of ZnO NRs synthesized on glass substrates for both modified and conventional CBD methods at several precursor concentrations are shown in Figure 2. From the morphologic graphs of ZnO NRs, two different preparation methods are shown in Figure 2a–d and Figure 2e–h concerning the influence of several precursor concentrations on the surface morphology (diameter, shape, length, orientation, alignment, density and distribution). Obviously, at low precursor concentration of 0.01 M as shown in Figure 2a, short length, low density, incompletely grown, nonuniform ZnO NRs was grown with random orientation and inhomogeneous distribution over the entire glass substrate. However, with increasing precursor concentrations, a remarkable change in surface morphology of ZnO NRs concerning the size and length [44,45], shape, density distribution and alignment are seen in Figure 2b–d. It is obvious from Figure 2b–d the grown ZnO NRs characterized by better density distribution, uniform, vertically aligned, hexagonally shaped and bigger in size. But as seen in Figure 2e–f, where air bubble involved in growth solution, the grown ZnO NRs were uniformly and homogeneously distributed over the glass substrate, denser, longer in length, bigger in size, well-aligned, vertically oriented and almost perfectly hexagonally shaped in comparison with the case where no air bubble involved. This may be associated to the fact that without air bubble the deposition solution was not homogenized because there was no agitation for the reactants and a heavy precursor precipitated under most of the bottom of the vessel. But by introducing the air bubble gives a continuously gentle mixing with homogenous solution during CBD growth process as well as helps to overcome the precipitation of heavy precursors at the bottom of the container during the preparation processes of ZnO NRs. This caused a high growth rate and more aligned ZnO nanorods. Clearly seen in Figure 2, in the case where no air bubbles were present, nonuniform distribution of the ZnO NRs over entire the glass substrate were noticed, while in the presence of the bubbles of air the synthesized ZnO NRs were, well-aligned, bigger, longer and get the complete hexagonal orientation and distributed uniformly over entire substrates. At very high precursor concentrations especially was high (0.75 M) in both CBD methods of preparation, some of ZnO NRs were combined (joined) together making growth in groups in both CBD growth process. The diameter dependence on precursor concentration was due to the aggregation of the adjoining rods creating new rods with wide diameters [46,47]. This can be demonstrated that the OH¯ group concentration would become better when increasing the precursor concentration, which could have partially suppressed the growth of ZnO NRs along the c-axis direction [48,49]. In addition, when the precursor concentration (molarity) of growth solution was changed from low to high, the grown ZnO NRs were more closely arranged (close-packed). Thus, the distance and space among ZnO NRs array would be reduced [44]. The FESEM images of synthesized ZnO NRs in the case where air bubbles did not exist were in good agreement with the former researches [34,50,51,52]. Initially, the alignment of the ZnO NRs was still not good enough for the duration of the initial deposition step. This was perhaps due to the truth that the lateral deposition was competing with axial growth [53]. In addition, one can conclude that the ZnO NRs synthesized with higher precursor concentration of the reactant demonstrated a higher degree of alignment than the NRs grown with lower concentrations [34].
The average diameter, average length, aspect ratio which indicates the average length to the average diameter as well as the growth rate of the synthesized ZnO NRs for several precursor concentrations using both conventional and modified preparation methods were calculated from the surface and side views of FESEM images (Figure 2) are shown in Figure 3. Figure 3a shows the average diameter of grown ZnO NRs. The main features were the increase of the diameter of the nanorods with increasing precursor concentration in both cases, but with different amounts, the bigger the diameter using the modified method in comparison with the conventional method of preparation. In the conventional method of preparation, sudden change is observed in the diameter size at the beginning up to 0.025 M then the gradual increase is seen with increasing concentration up to 0.075 M while in modified CBD method, the average diameter is gradually increased up to the precursor concentration of 0.05 M, and then abrupt increase in nanorods diameter is observed could be attributed to the fact that air bubbles stimulate the process of NRs production laterally (size) and vertically (length). Figure 3b shows the average length of ZnO NRs grown by modified and conventional CBD methods at different precursor concentrations. In general, the average length increases with increasing precursor concentration for both air and non-air bubbles participation in the preparation processes. The average length of the ZnO NRs grown by using the modified CBD method was higher than the average length of the ZnO NRs grown by using the conventional CBD method. In addition, the precursor concentration had a significant influence on the average length of the ZnO NRs. In the modified CBD method, the precursor concentration rate reduced to about 0.04 M for growing same length compared with the CBD method. For example, one can obtain nearly the same length of ZnO NRs at different precursors, at 0.01 M using a modified method while using 0.05 M with the conventional one. The average length and diameter results using the conventional CBD method were consistent with the previous researches [22,34,36]. The change in the aspect ratio of ZnO NRs versus precursor concentrations using both fabrication methods is shown in Figure 3c. Generally, the aspect ratio of synthesized ZnO NRs at several different precursor concentrations steadily extended with increasing the precursor concentration from 0.01 M to 0.05 M. With further increasing of the precursor concentration to 0.075 M, the aspect ratios for the two cases rapidly decreased. The unexpected alternate in the aspect ratio may additionally be due to a clear distinction in average diameter and the average length of the ZnO NRs in each method of synthesis. The behavior aspect ratio variation in the absence of air bubbles is in good agreement with the previous studies [31,34,41]. From Figure 3c, we noticed that the higher aspect ratio is corresponding to the precursor concentration of 0.05 M. The ZnO NRs grown with higher aspect ratio created well-aligned ZnO NRs [37,38,54]. The obtained aspect ratios of ZnO NRs were 11 and 25 for conventional and modified CBD methods, respectively. This was a good indication of better crystallization of nanorods in the presence of air bubbles rather than their absence. The excessive aspect ratio can be viewed as a key issue in finding out the energy-conversion efficiency of photovoltaic cells consists of such structures [55,56]. The growth rates versus precursor concentrations for the two cases are shown in Figure 3d. It was observed that the growth rate increased with precursor concentration, and a higher growth rate was observed in the modification CBD method. This may be due to ZnO NRs being grown longer by using the modified method, than ZnO NRs grown by using conventional methods. This means that one can produce longer nanorods with lower precursor concentration in the modified CBD method. The growth rate behaviors (results) versus precursor concentration for the conventional methods are in good agreement with the literature [22,38,57].

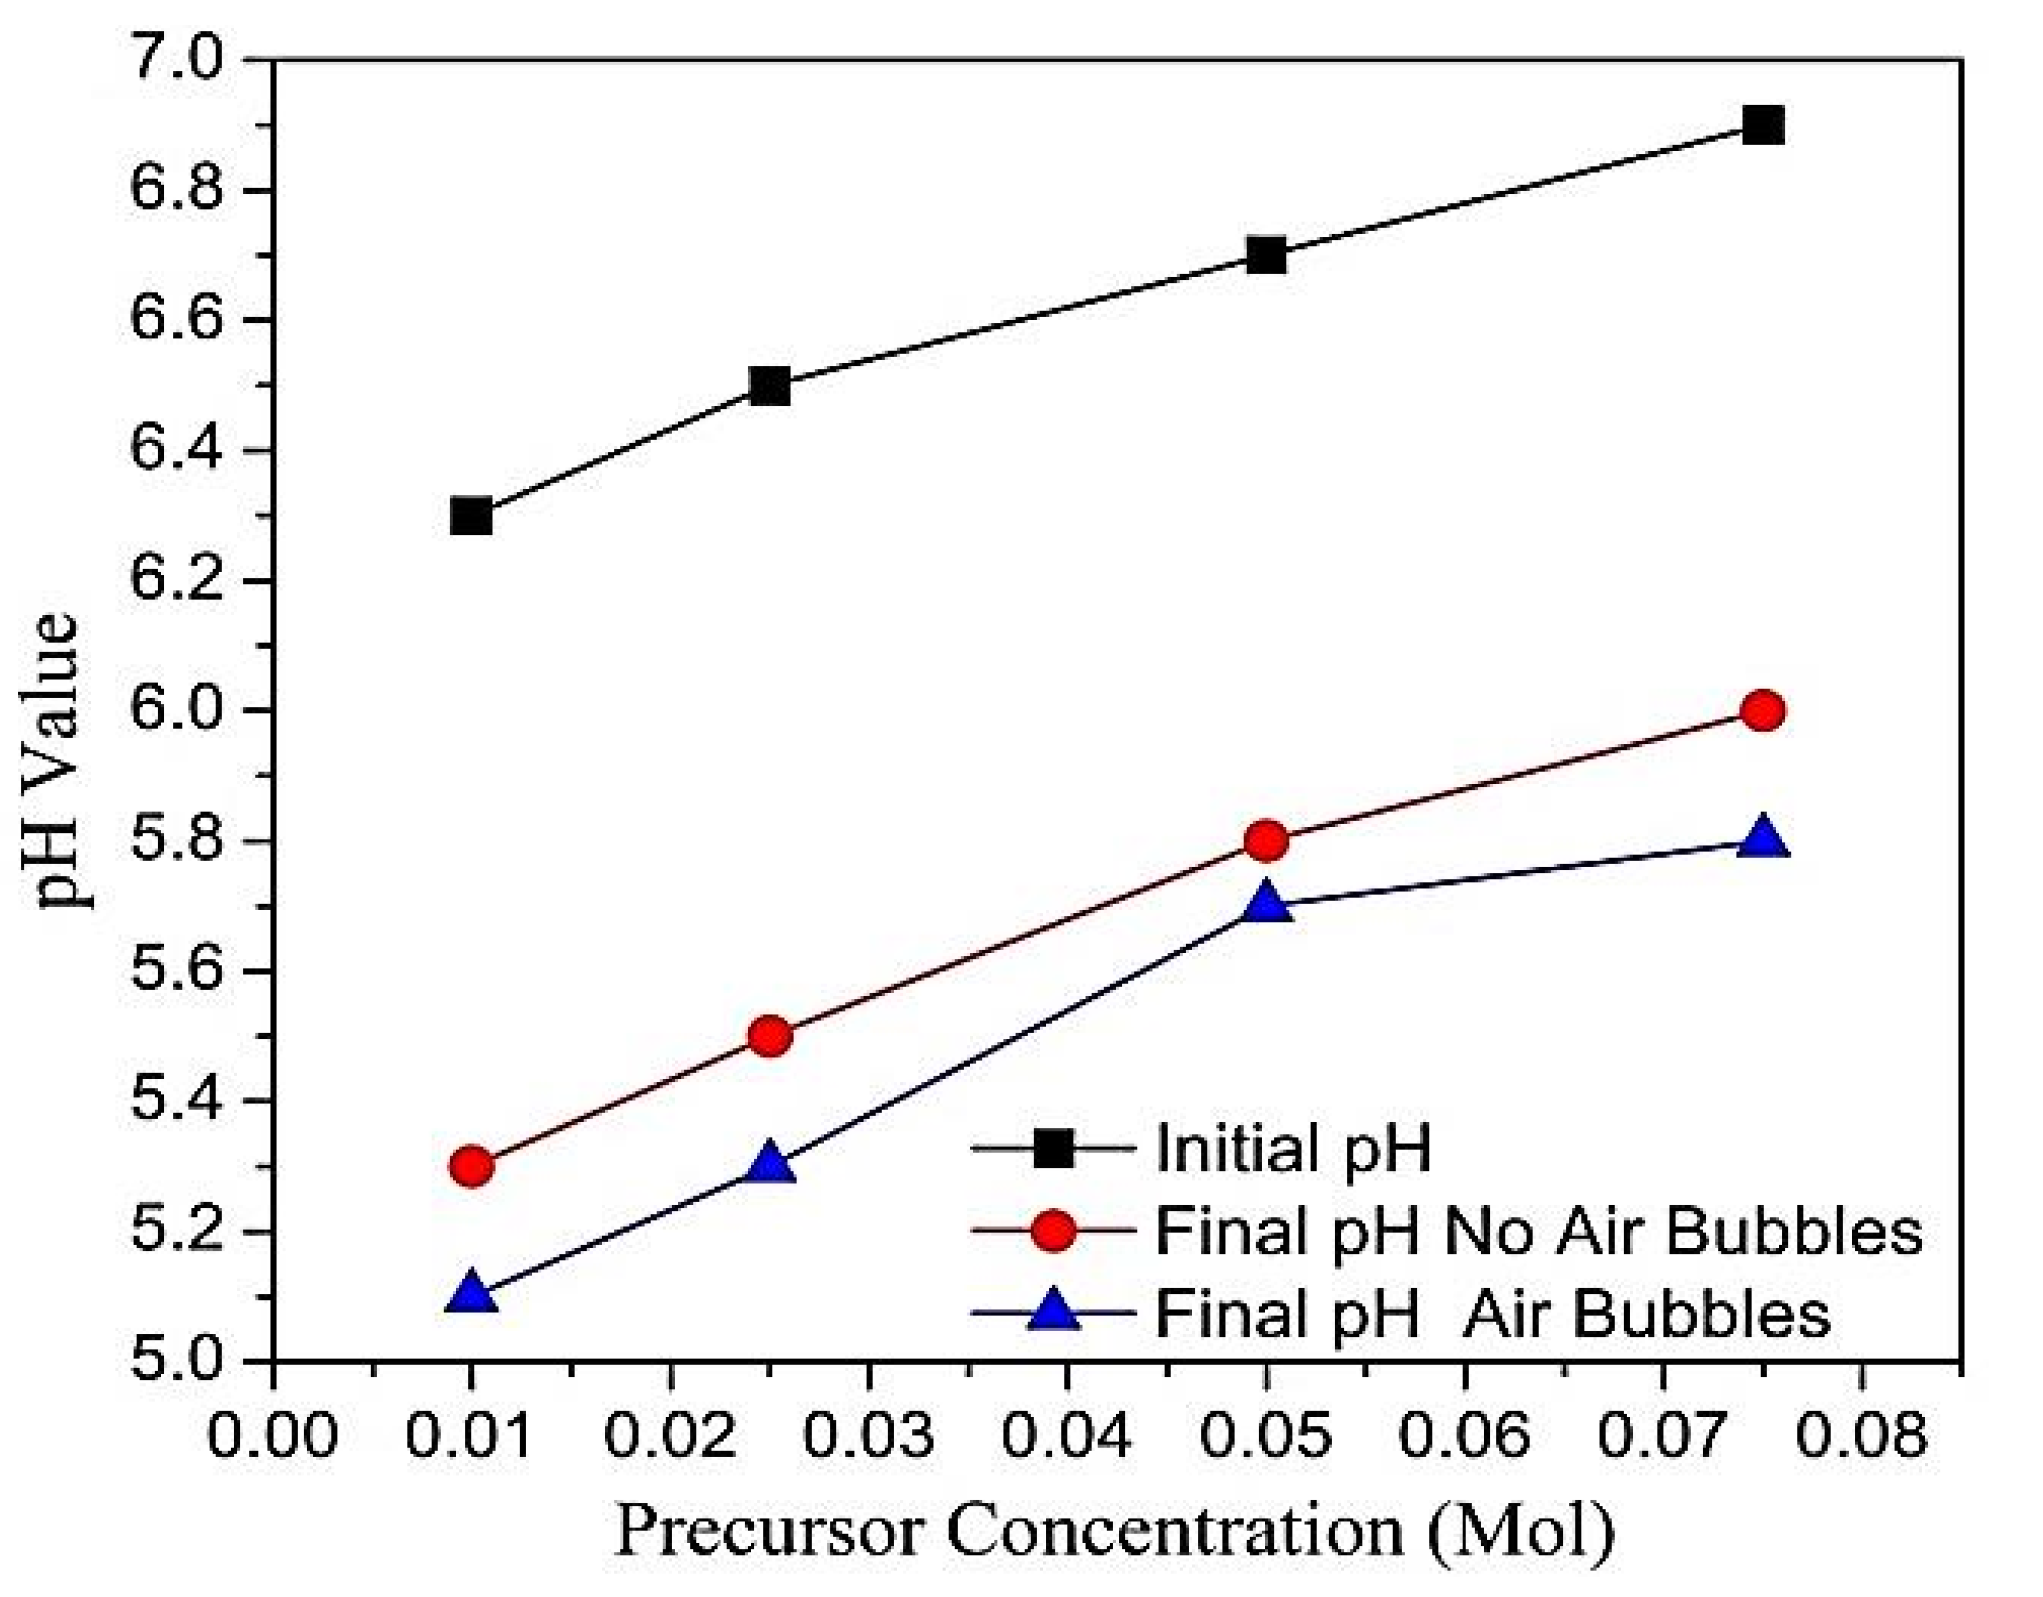
3.2. The pH Values of the Growth Solutions

Figure 4 shows the initial and final pH values of the solution for several precursor concentrations using both methods of synthesis, conventional and modified CBD methods. The initial pH values of the deposition solution for the two cases increased from 6.3 to 6.9 as the precursor concentration increased from 0.01 M to 0.075 M. The increased numbers of OH¯ ions reflects raising the pH value of the deposition solution as the precursor concentration are increased [22,58]. After ending deposition process, the final pH values of the deposition solution decreases with several amount and same behavior, due to the fact that the growth solution contains lower OH ions in the solution [22,59]. The CBD deposition process of the ZnO NRs can be deemed as a rivalry between the precursor concentration rate and dissolution rate existing in the solution [60].
The higher precursor concentration gives a higher dissolution rate, which means higher pH value. In addition, the final pH value when modified CBD was used was lower than the final pH for the CBD method. This may be due to the agitation of the growth solutions and providing more homogeneity during the growth process. These results supported the results of higher growth rate, higher aspect ratio, higher density, vertically well-aligned, perfect hexagonal ZnO NRs shape, same sizes and homogeneity of ZnO nanorods.

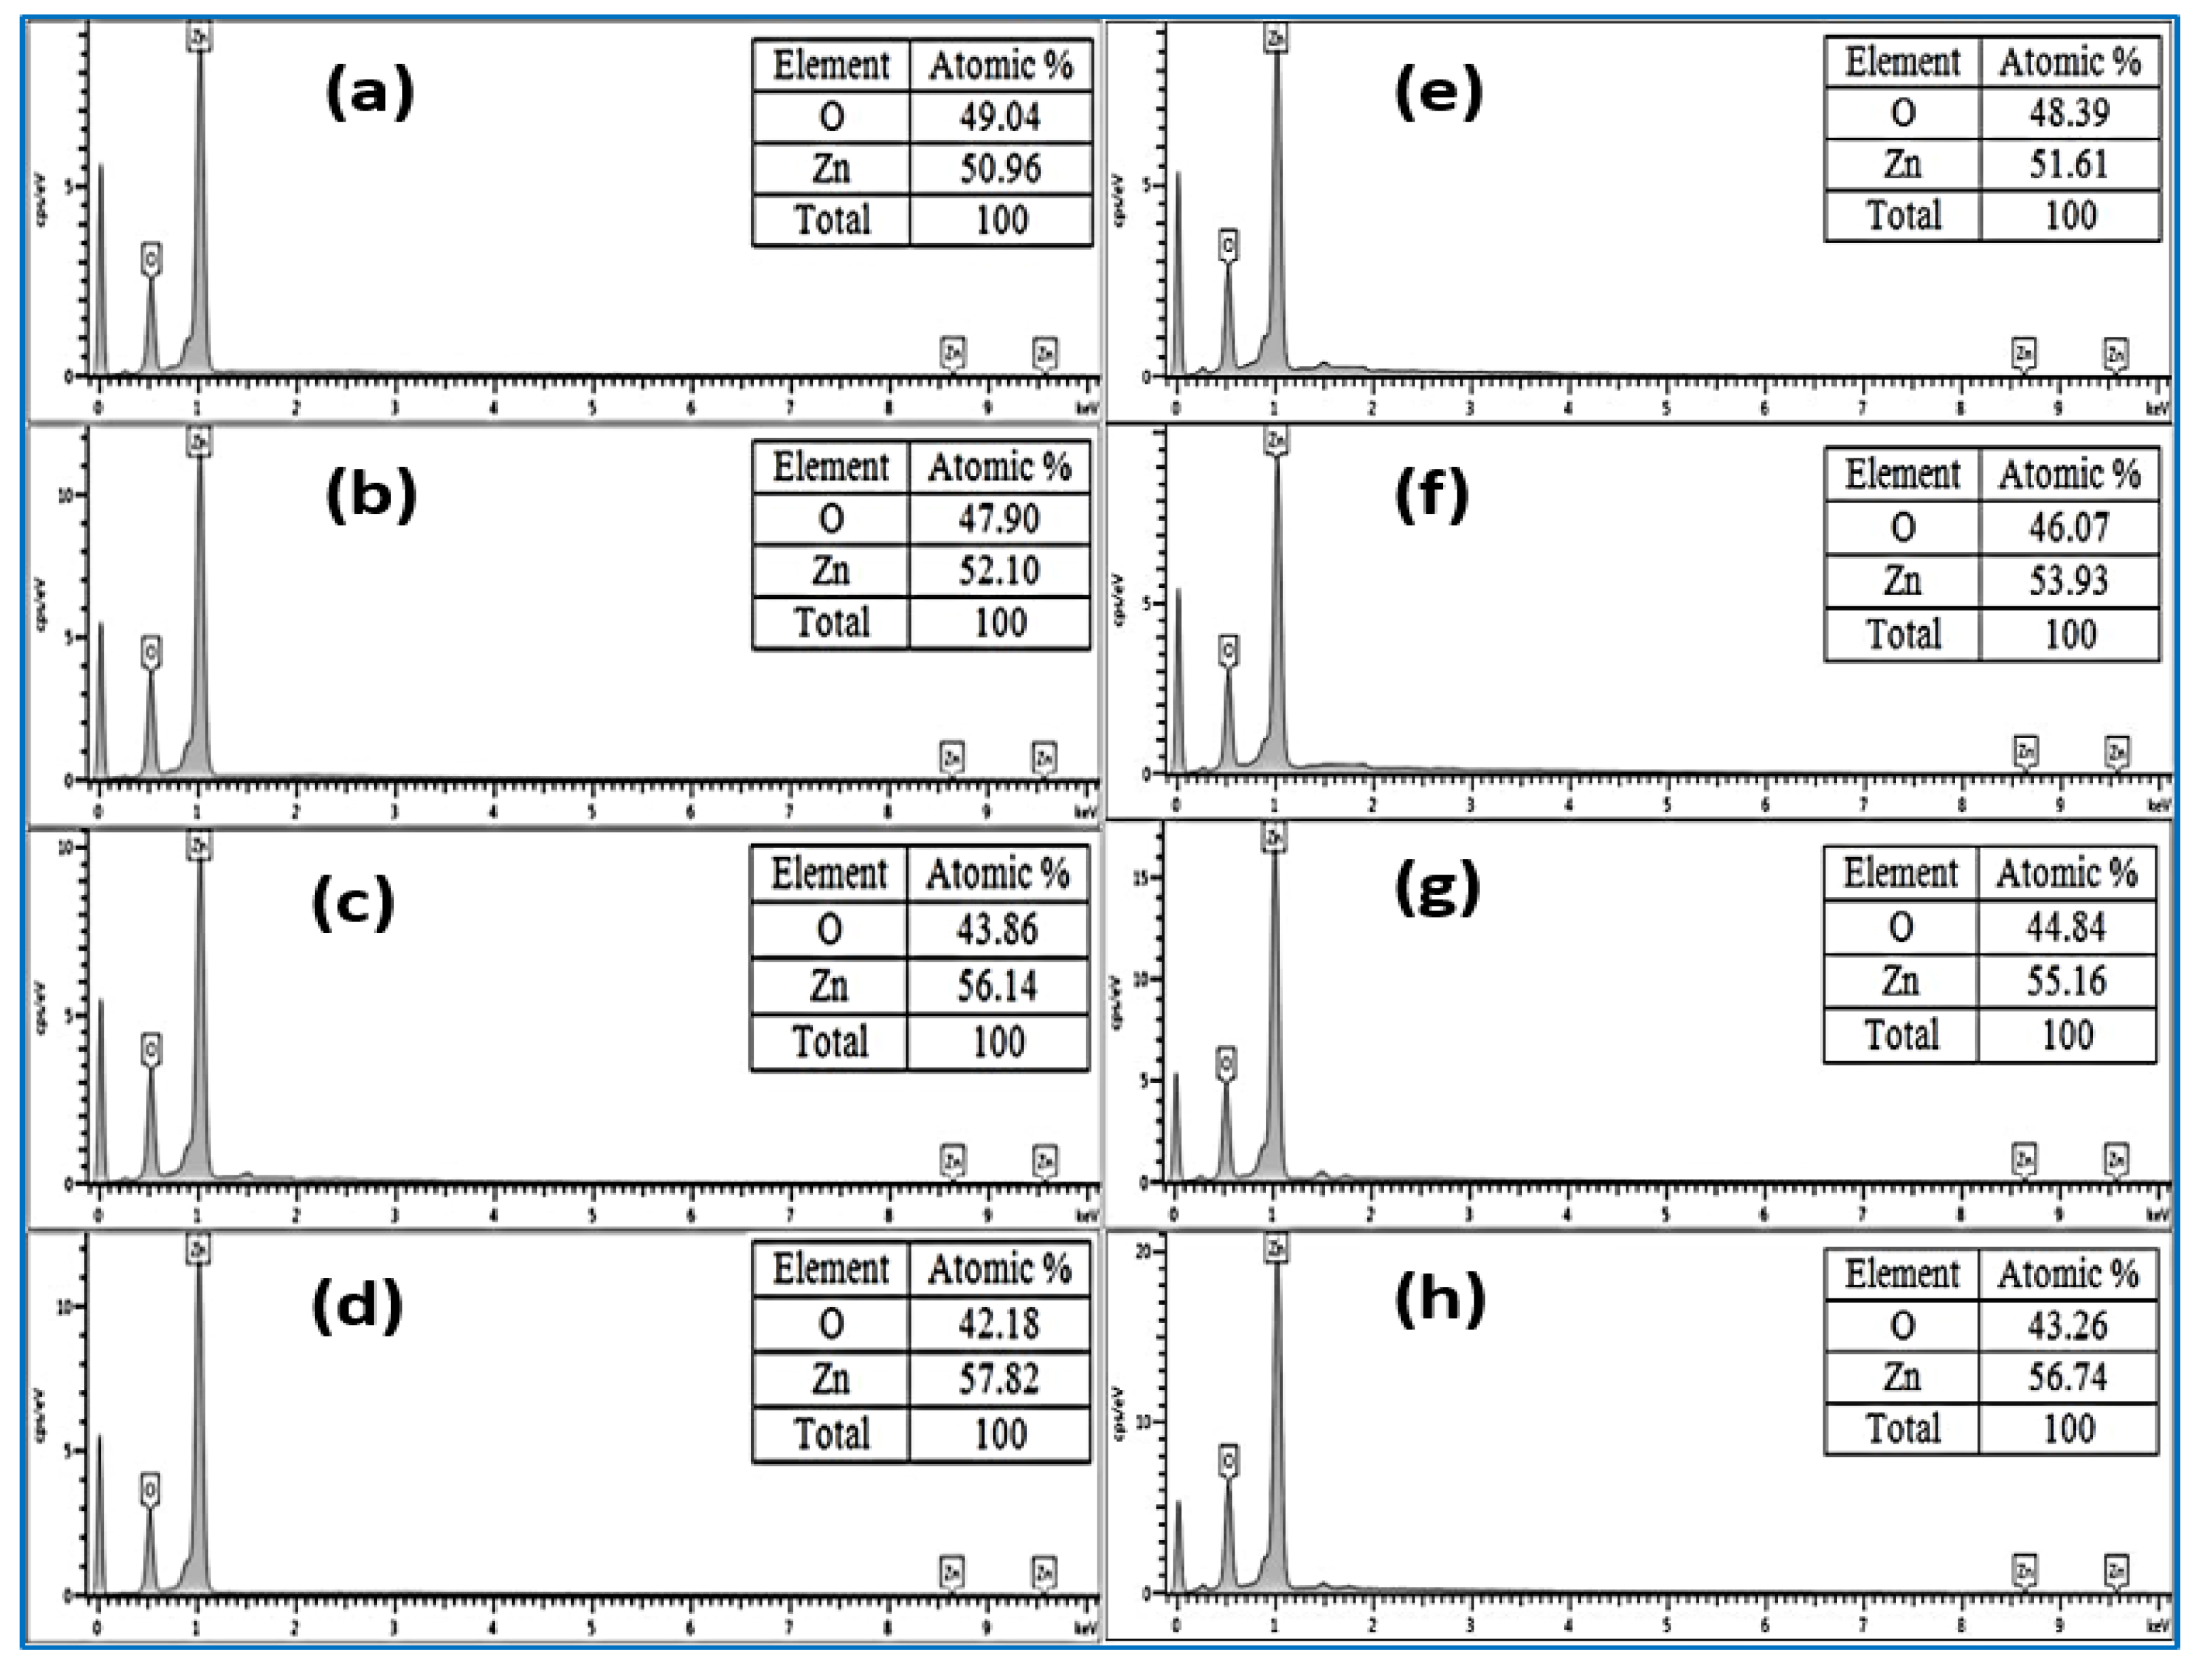
3.3. Chemical Analysis of the Grown ZnO Nanorods

The elemental chemical compositions using EDX analysis of the as-grown ZnO NRs at several precursor concentrations for both methods of preparations are in Figure 5. The EDX technique shows the presence of O and Zn, which matches to the attribute composition of ZnO, barring the existence of any defects or substrate sign in accordance with EDX limitations. The ratio between O and Zn was once nearly equal for all the produced samples grown for one of kind molarity on glass substrates. The molecular ratio of Zn and O of the synthesized NRs are present with the same ratio or that it has an excess of Zn in some cases. It was likely that the crystalline ZnO have produced, as also proved by XRD measurements which are shown later on in the XRD section. It can be stated that the air bubbles and precursor concentration have important results on the Zn and O ratios. In Figure 5c,e,g,h, a very small two peaks are appeared and one of them was Kα of aluminum (1.486 keV) and the second one is Kα of silicon (1.739 keV) and two peaks. These peaks belong to the glass substrate and do not belong to the any other contamination.

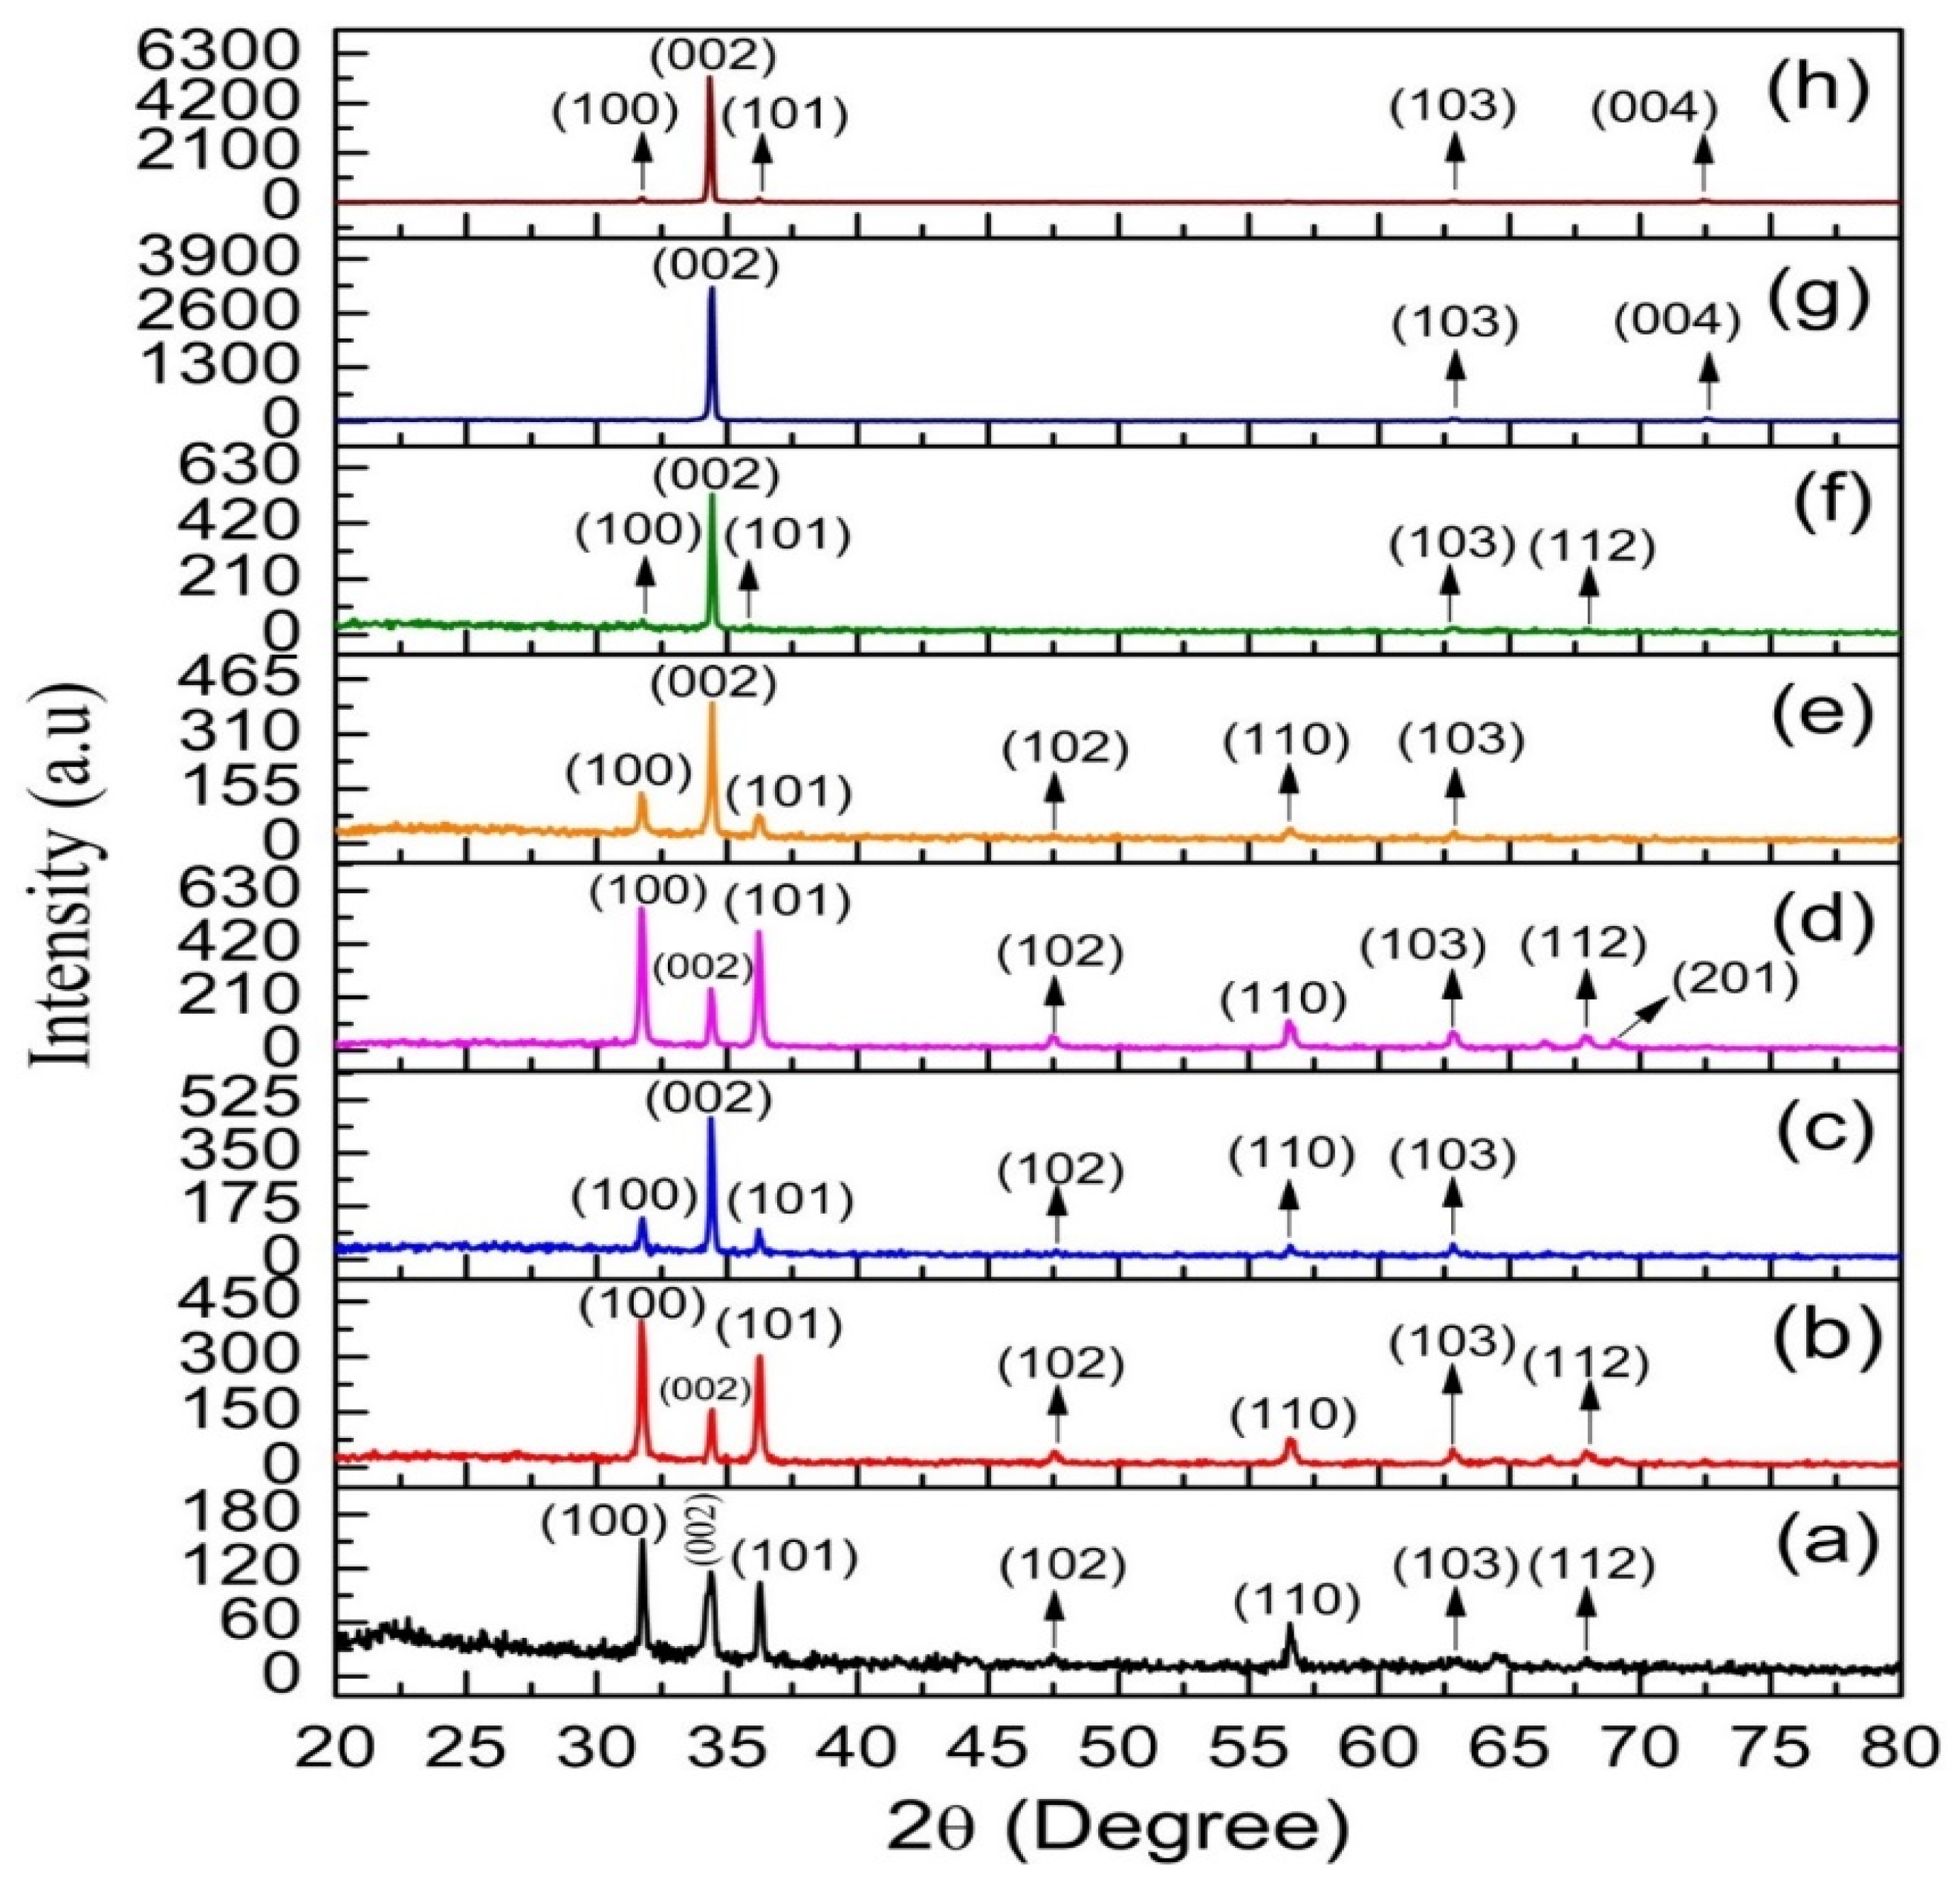
3.4. X-ray Diffraction (XRD) Analysis

XRD patterns of synthesized ZnO NRs at several precursor concentrations of deposition solution using both methods of preparations are shown in Figure 6. All diffraction peaks in all the XRD patterns for two cases are listed as the wurtzite hexagonal phase of ZnO, matched to the typical spectrum (JCPDS cards No. 01–080–0074). However, no diffraction peaks from other impurities were obtained; suggesting that the high purity of ZnO nanocrystal phases was carried out. For all of the examined ZnO NRs in the two preparation methods, a peak was observed at 2θ = 34.3 and 34.4 matching to ZnO (002), exposing the preferentially oriented growth alongside the c-axis. The ZnO NRs resorted to growing in the (002) orientation due to the fact the surface free energy density of this orientation was lowest in a ZnO crystal in contrast with the (100) and (101) planes [61,62,63]. Thus, it appears well-aligned c-axis oriented ZnO NRs as the amount of precursor concentration increases. In case of air bubbles not existed (conventional CBD), XRD patterns appear (see Figure 6a,b,d) that the (100) diffraction peak was the generality prevailing peak for synthesized ZnO NRs at all precursor concentration. The (100) peaks are showed at 2θ values of (31.775, 31.725 and 31.725) for precursor concentrations of 0.01 M, 0.025 M and 0.075 M, respectively are mostly sharp and strong. In addition, the large diffraction peaks from other surfaces or planes are observed in the XRD patterns for the mentioned precursor concentrations. This assures the improved alignment of the most ZnO NRs grown not vertically or grown in various preferred orientations on the entire of the substrate [21].
The diffraction peaks intensity along (100) plane raises with increasing the precursor concentrations. Figure 6c shows strong and sharp diffraction peak (002) for ZnO nanorods produced of 0.05 M at 2θ value of 34.425 and some other weak diffractions peaks from other planes or surfaces. This assures the improved alignment of the most ZnO nanorods grown well vertically over the entire substrate [33,34,64,65]. The XRD pattern results in the case where air bubbles are not present in good agreement with FESEM results and with the previous studies [33,34,64,65]. However, in case of involving air bubbles in the growth solution during CBD process, the diffraction peak (002) of the synthesized ZnO NRs in all XRD patterns was prevailing for all precursor concentration from 0.01 M to 0.075 M, as displayed in Figure 6e–h). The strong, narrow and sharp ZnO (002) peak in the XRD patterns was investigated. Fortunately, the ZnO NRs were synthesized preferentially along the c-axis of the hexagonal wurtzite structure which support the vertical growth of ZnO NRs over entire glass substrates [33,34,64] From the analysis of the investigated results of vertically well-aligned ZnO NRs, one can observe that air bubbles play a significant role in the growth of the crystal structure.

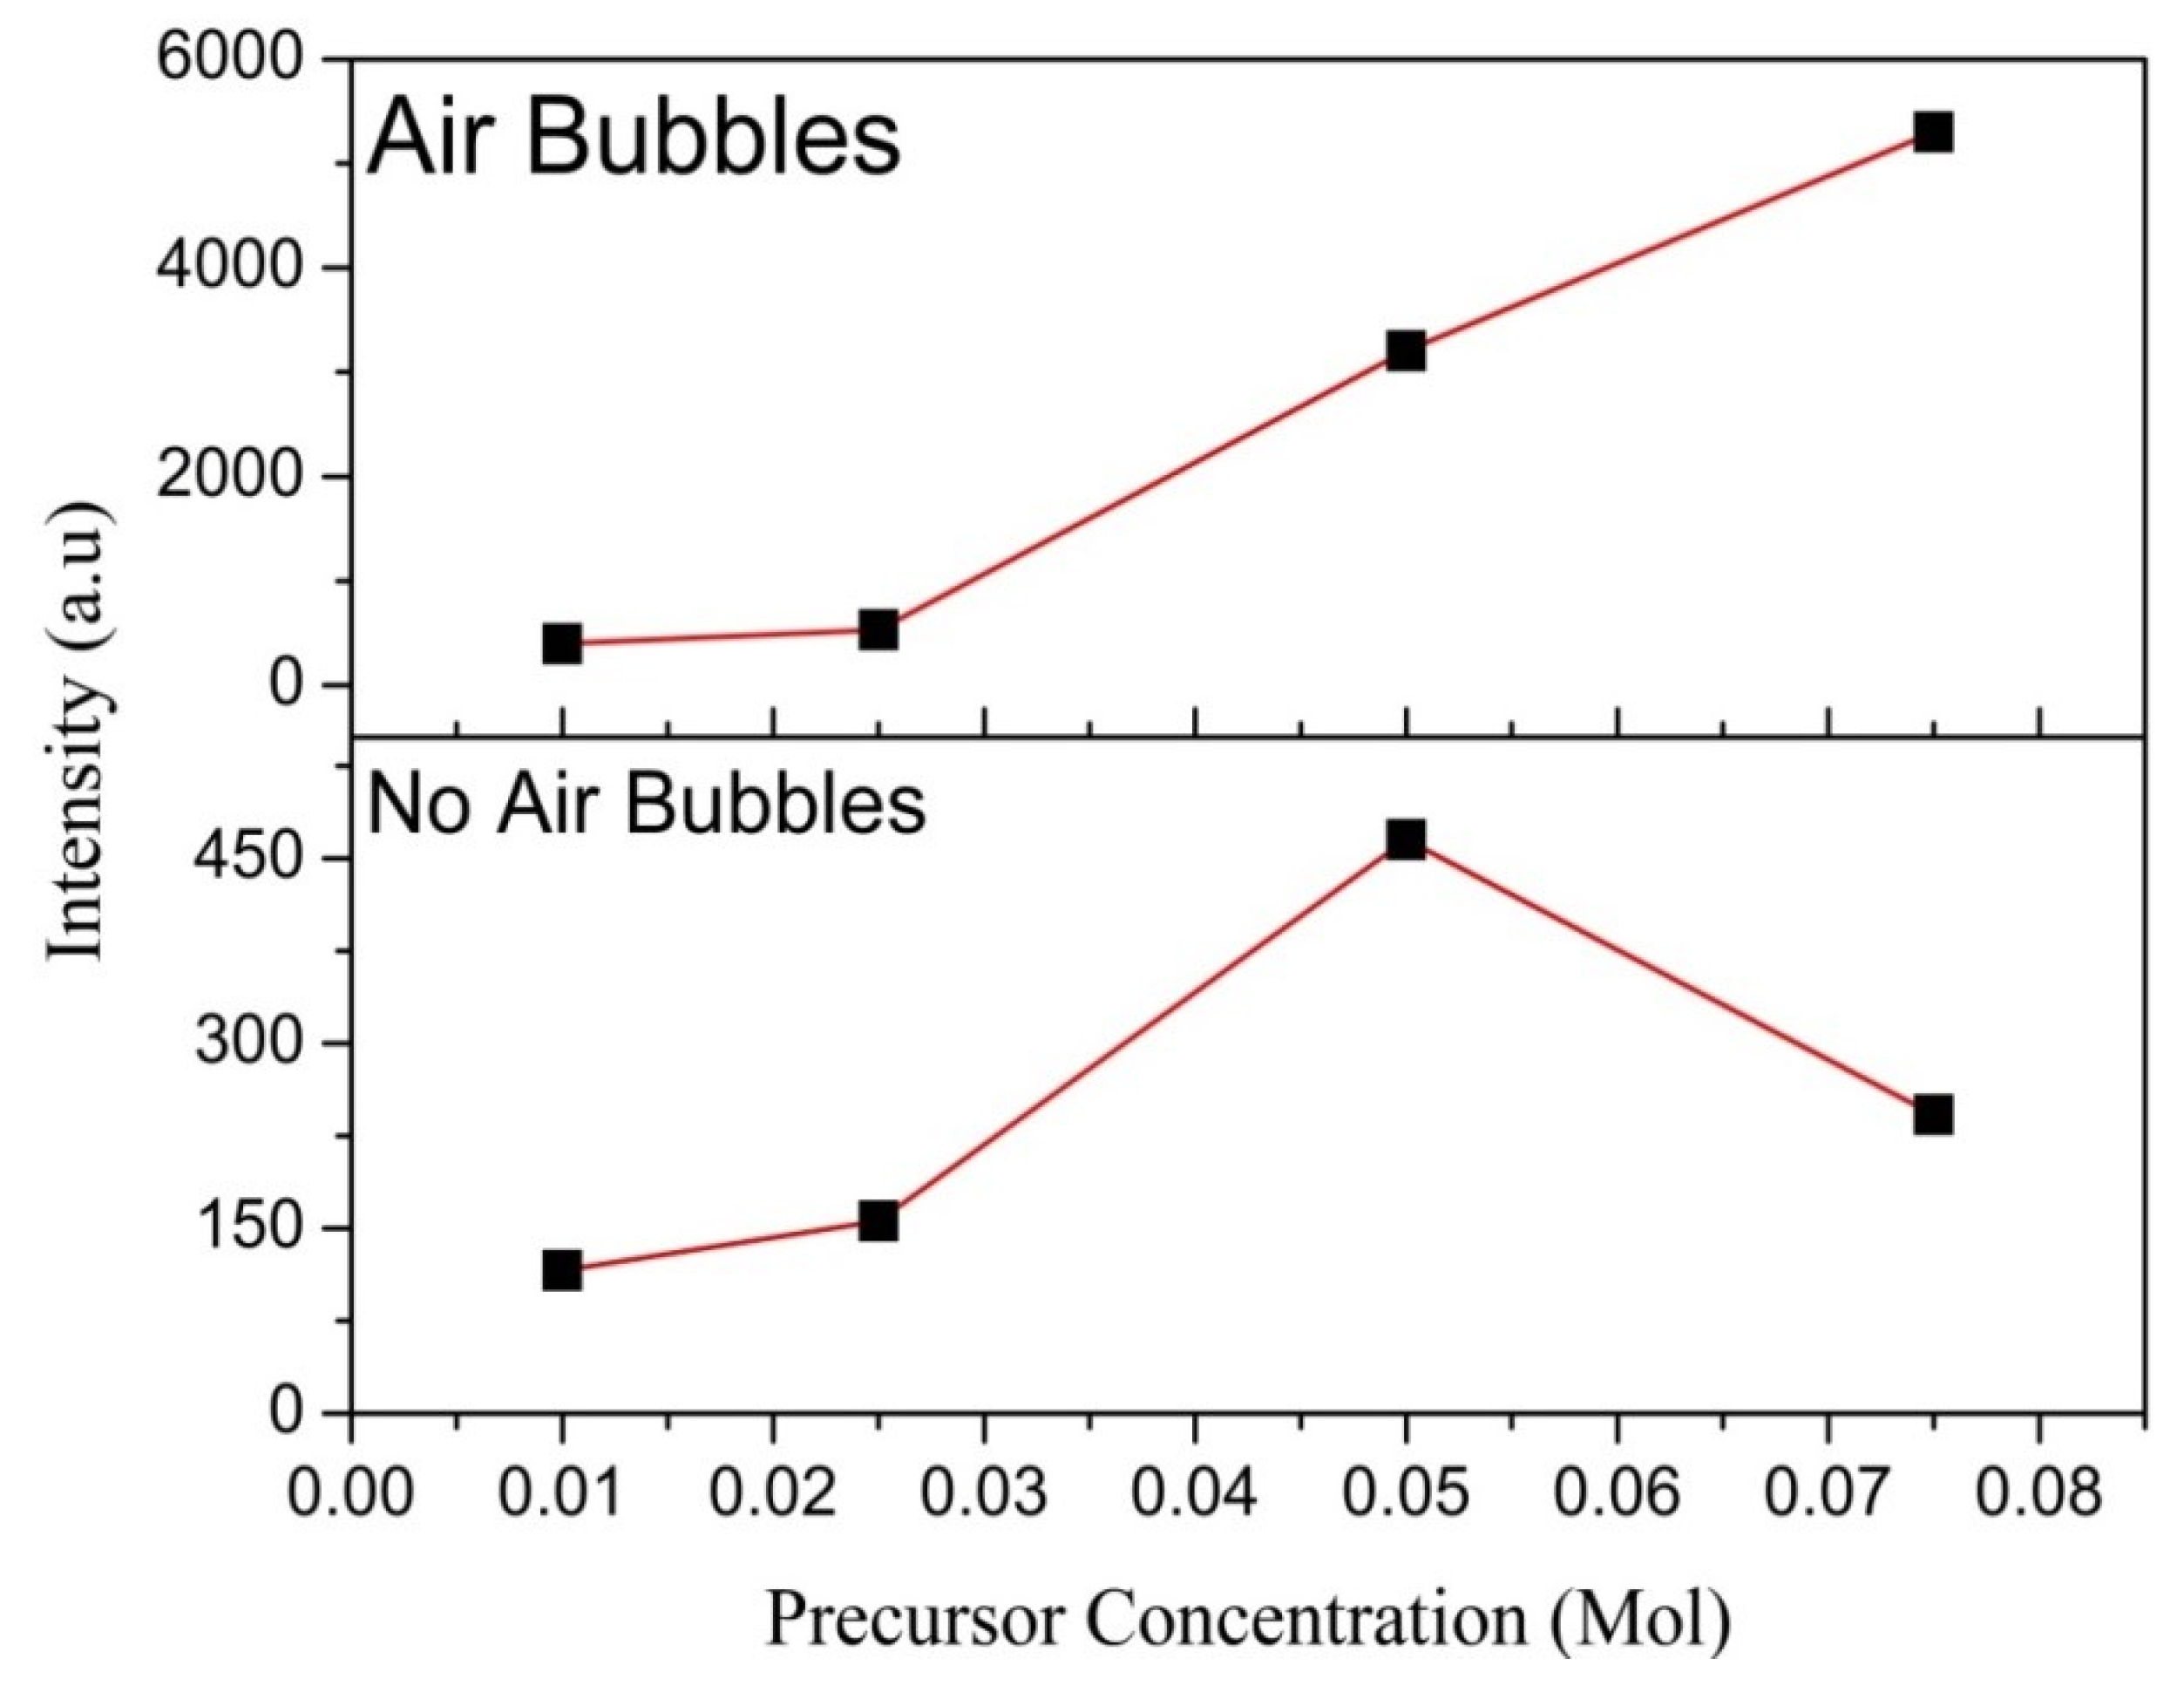
3.4.1. The Intensity of Diffraction Peak (002) Variation

The variation of (002) peak intensity with several precursor concentrations is shown in Figure 7. Generally, the peak intensity raises with increasing precursor concentration for both modified and conventional methods of preparation with several amounts, except the concentration of 0.075 M where air bubbles not involved in the growth solution during CBD process, and the investigated results are inconsistent with the previous studies [52,57]. It is should be noted that the diffraction peaks (002) become higher and narrower as precursor concentrations increases, suggesting that the ZnO crystalline quality when air bubbles involved enhances with increasing precursor concentration range from 0.01 M to 0.075 M, and where air bubbles are not involved in the deposition solution through CBD process the crystalline quality going better only from 0.01-M to 0.05-M precursor concentrations [33,34,64,65].
In addition, when air bubbles are involved in the deposition solution during the process of CBD, the intensity of ZnO NRs (002) peak along c-axis is higher than the intensity of (002) peaks when air bubbles are not involved, obtaining that the ZnO NRs crystalline quality is more better when air bubbles are involved for several precursor concentration could be attributed to the precipitation and incomplete growth CBD processes.

3.4.2. The Structural Properties and Lattice Parameters

Table 1 and Table 2 show the results of the structural properties, peak position (θ), intensity, lattice constants (a & c), and the strains (Ƹc and Ƹa) of the ZnO wurtzite hexagonal structure along diffractions (002) peak synthesized for both preparation methods where no air bubbles and for air bubbles is involved in the growth solution during CBD process, respectively.
The lattice constants (a & c) of the ZnO hexagonal wurtzite structure along (002) peaks are determined using Bragg’s law and are around 3 A and 5.2 A, respectively ass seen in Table 1 and Table 2 [66]:
a = 1   3   λ sin θ  
c = λ sin θ
Where λ is the X-ray source wavelength and θ is the angle of the diffraction peak.
The strain (Ƹa) and (Ƹc) of the synthesized ZnO NRs for the two cases along a-axis and c-axis, respectively are estimated from the following equations [67]:
ε a = a a o a o × 100 %
The strain (εc) of ZnO NRs along c-axis can be evaluated by [67]:
ε c = c c o c o × 100 %
where ao and co are represented the typical lattice constants for unstrained ZnO NRs and nanostructures that which presence in the database.
In the case where no air bubbles are present, the strain (Ƹa) of ZnO NRs along a-axis is largely decreased as the precursor concentration increasing from 0.01 M to 0.05 M and then steeply increased at 0.075 M as listed in Table 1. But for the case of air bubbles are involved in the deposition solution during the CBD process, the strain (Ƹa), of ZnO NRs along a-axis dramatically decreases with raising the precursor concentration from 0.01 M to 0.075 M as listed in Table 2. The strains (Ƹc) of ZnO NRs along the c-axis in the two cases are largely decreased as the precursor concentrations are increased from 0.01 M to 0.075 M as listed in Table 1. But for the case of air bubbles are existence the strain (Ƹa), of ZnO NRs along a-axis dramatically decreases with increasing the precursor concentrations are raised from 0.01 M to 0.075 M. This variation in strain values is due to a variation in the values of the inter planer spacing and peak position. The observed negative value of both (Ƹa) and (Ƹc), are concerned with the compressive strain denoting contraction of lattice, while the positive values of strain are concerned with the tensile strain stating an expansion in lattice constant. In our results in the cases of air bubbles, there is a negative strain which indicates that there is a compressive strain. But for the case of no air bubbles are involved, the positive and negative strains values are obtained expresses the expansion in lattice constant and compressive strains, respectively. From Table 1 and Table 2, the strains (Ƹc) and (Ƹa) are lower where air bubbles are involved than the strains when no air bubbles are involved. This means that the ZnO nanorods crystalline quality grown is better than the case when air bubbles are not involved.
The inter planer distance of the hexagonal wurtzite structure of synthesized ZnO NRs along (002) peak was calculating by using Bragg’s law [43], and its results are summarized in Table 1 and Table 2 for the two fabrication methods.
1 d 2 = 4 3 ( h 2 + hk + k 2 a 2 ) + l 2 c 2
where a and c are the lattice constants.

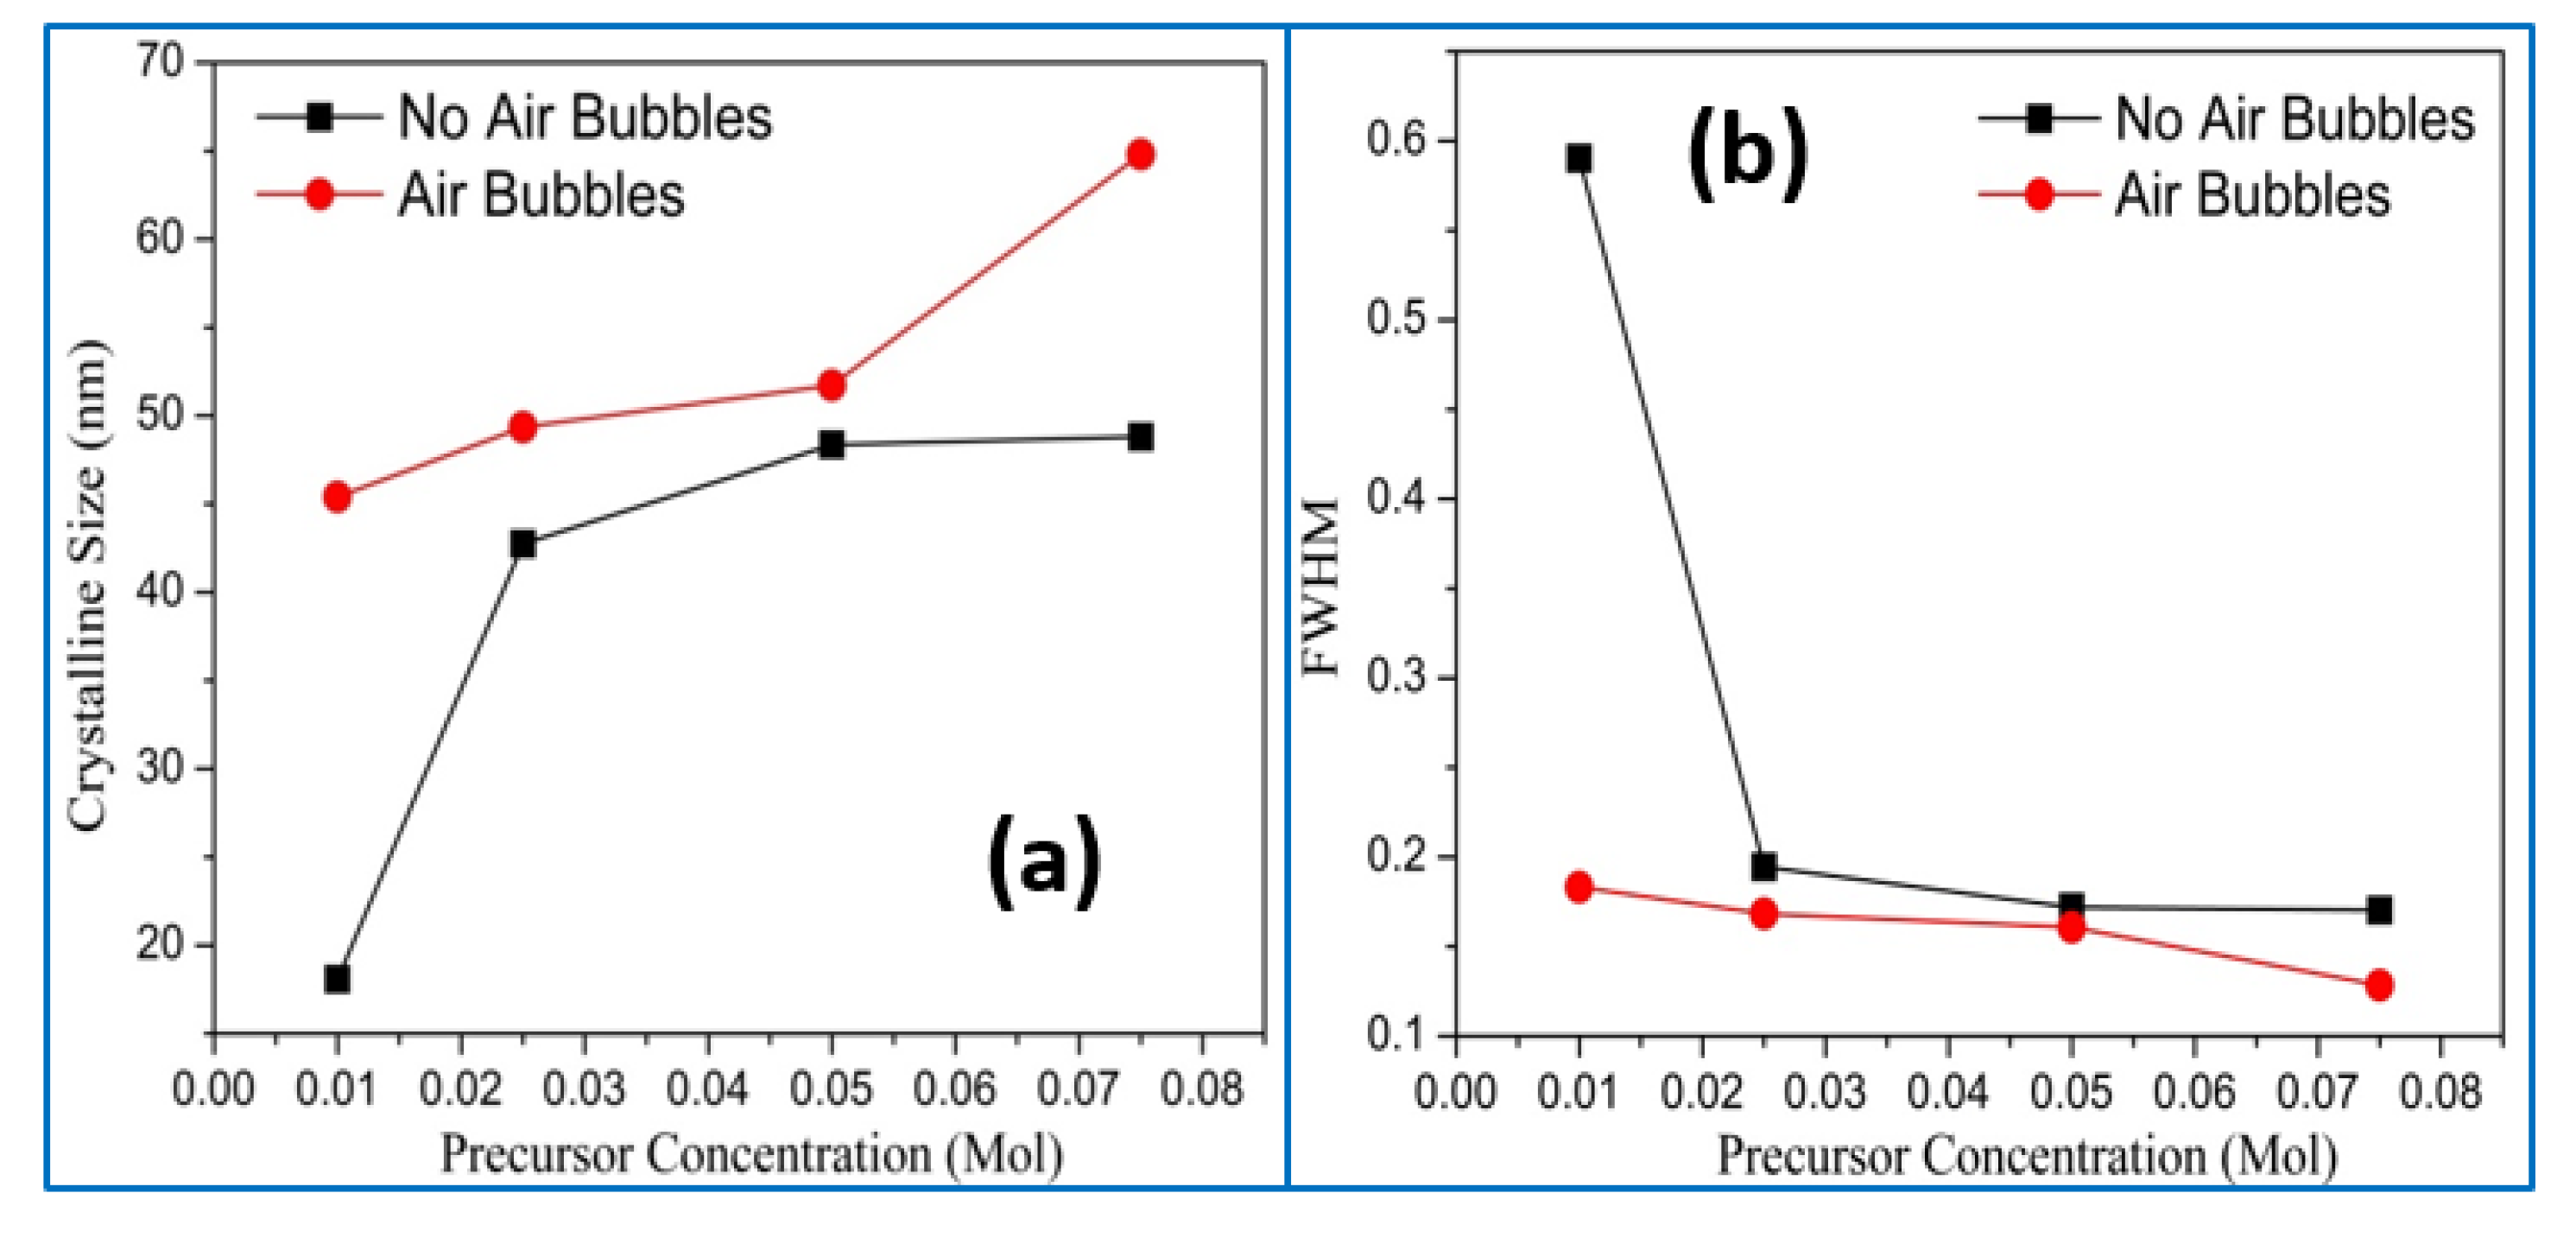
3.4.3. The Crystal Size of ZnO Nanorods

The average crystal size of the synthesized ZnO NRs is estimated from the formula of Debye Scherer at diffraction peak (002) as a function of several precursor concentrations is shown in Figure 8a [43].
D = k λ β cos θ
where k is a constant equal to 0.9, λ is the X-ray source wavelength, β is full width at half maximum (FWHM) in radian and θ is the Bragg diffraction angle.
In both methods of synthesis of ZnO NRs, the average crystal size is raised with increasing precursor concentration. In the conventional method the sudden change at the beginning then gradual change were observed, while for in the modified method where air bubbles exist, the average crystalline size of ZnO NRs is smoothly increase as the precursor concentrations are increased. From Figure 8a, the average crystalline size of ZnO NRs of diffraction peak (002) prepared using the modified method showing a larger size than the one in a conventionally. According to the Dedye–Scherrer formula, the decrease in FWHM values at diffraction peak (002) with increasing precursor concentration leads to an increase in crystalline size values [52,68] as seen in Figure 8b. The effects of FWHM is clearly seen on crystalline size in Figure 8b. With raising the precursor concentrations, the amount of the zinc salt increased in the deposition solution. Hence, the electrostatic potential interplay between the zinc salt particles increased. This phenomenon will increase the likelihood of a mixture of zinc salt particles to shape a grain. Thus, as the increases in concentration, the crystalline size also increases [69]. The average crystalline size results for the case of no air bubbles are in well agreement with the preceding researches [49,52,69,70]
The dislocation density (δ) is represented amount of defect in the crystal which proportional inversely to the square of crystal size along diffraction peak (002) is shown in Figure 9 and is determined from following below equation [71]:
δ = 1 D 2
where D is crystal size
For the case of no air bubbles involved, dislocation density increased with increasing precursor concentration from 0.01 M to 0.025 M, and then decreased as the precursor concentration increased from 0.025 M to 0.075 M. However, in the case of the existence of air bubbles, dislocation density decreased dramatically with increasing precursor concentrations from 0.01 M to 0.075 M, parallel with increasing the crystal quality and also the increase in the crystalline size [21]. In addition, the dislocation density for air bubbles was lower than the dislocation density for no air bubbles than for different precursor concentrations. This indicated that the ZnO nanorods that were grown when air bubbles inside growth solution during the CBD process had a better crystalline quality than the ZnO nanorods that were synthesized when no air bubbles were involved.

3.4.4. The Volume and Bond Length of ZnO Nanorods

The influence of the several precursor concentrations on the volume of the hexagonal cell and bond length of synthesized ZnO NRs in two preparation methods as shown in Figure 10a,b. The bond length and the volume of the cell were calculated from the following equation [72]:
L = a 2 3 + ( 1 2 u ) 2 c 2  
where u is the positional parameter in the wurtzite hexagonal structure which is concerned to c/a ratio, u is a measure of the quantity by which each atom is appeared with respect to the next, along the ‘c’ axis and is given by [72]:
u = a 2 3 c 2 + 0.25
The volume (V) of the hexagonal cell was evaluated by equation [72]:
V = 3 2 a 2 c
where a and c are the lattice constants.
The results show that both bond length and volume of ZnO NRs followed a similar trend of variation. For non-existence of air bubbles, the volume and bond length smoothly decreased as the precursor concentration increased from 0.01 M to 0.05 M and then increased abruptly at 0.075 M. However, for the existence of air bubbles, the volume and bond length dramatically decreased as the precursor concentrations are increased up to 0.075 M. This variation of values of both volume and bond length was due to the variation in the peaks position value of 2θ along (002) peak because both depended directly on lattice parameters a & c and the lattice parameters depended on the value of 2θ.

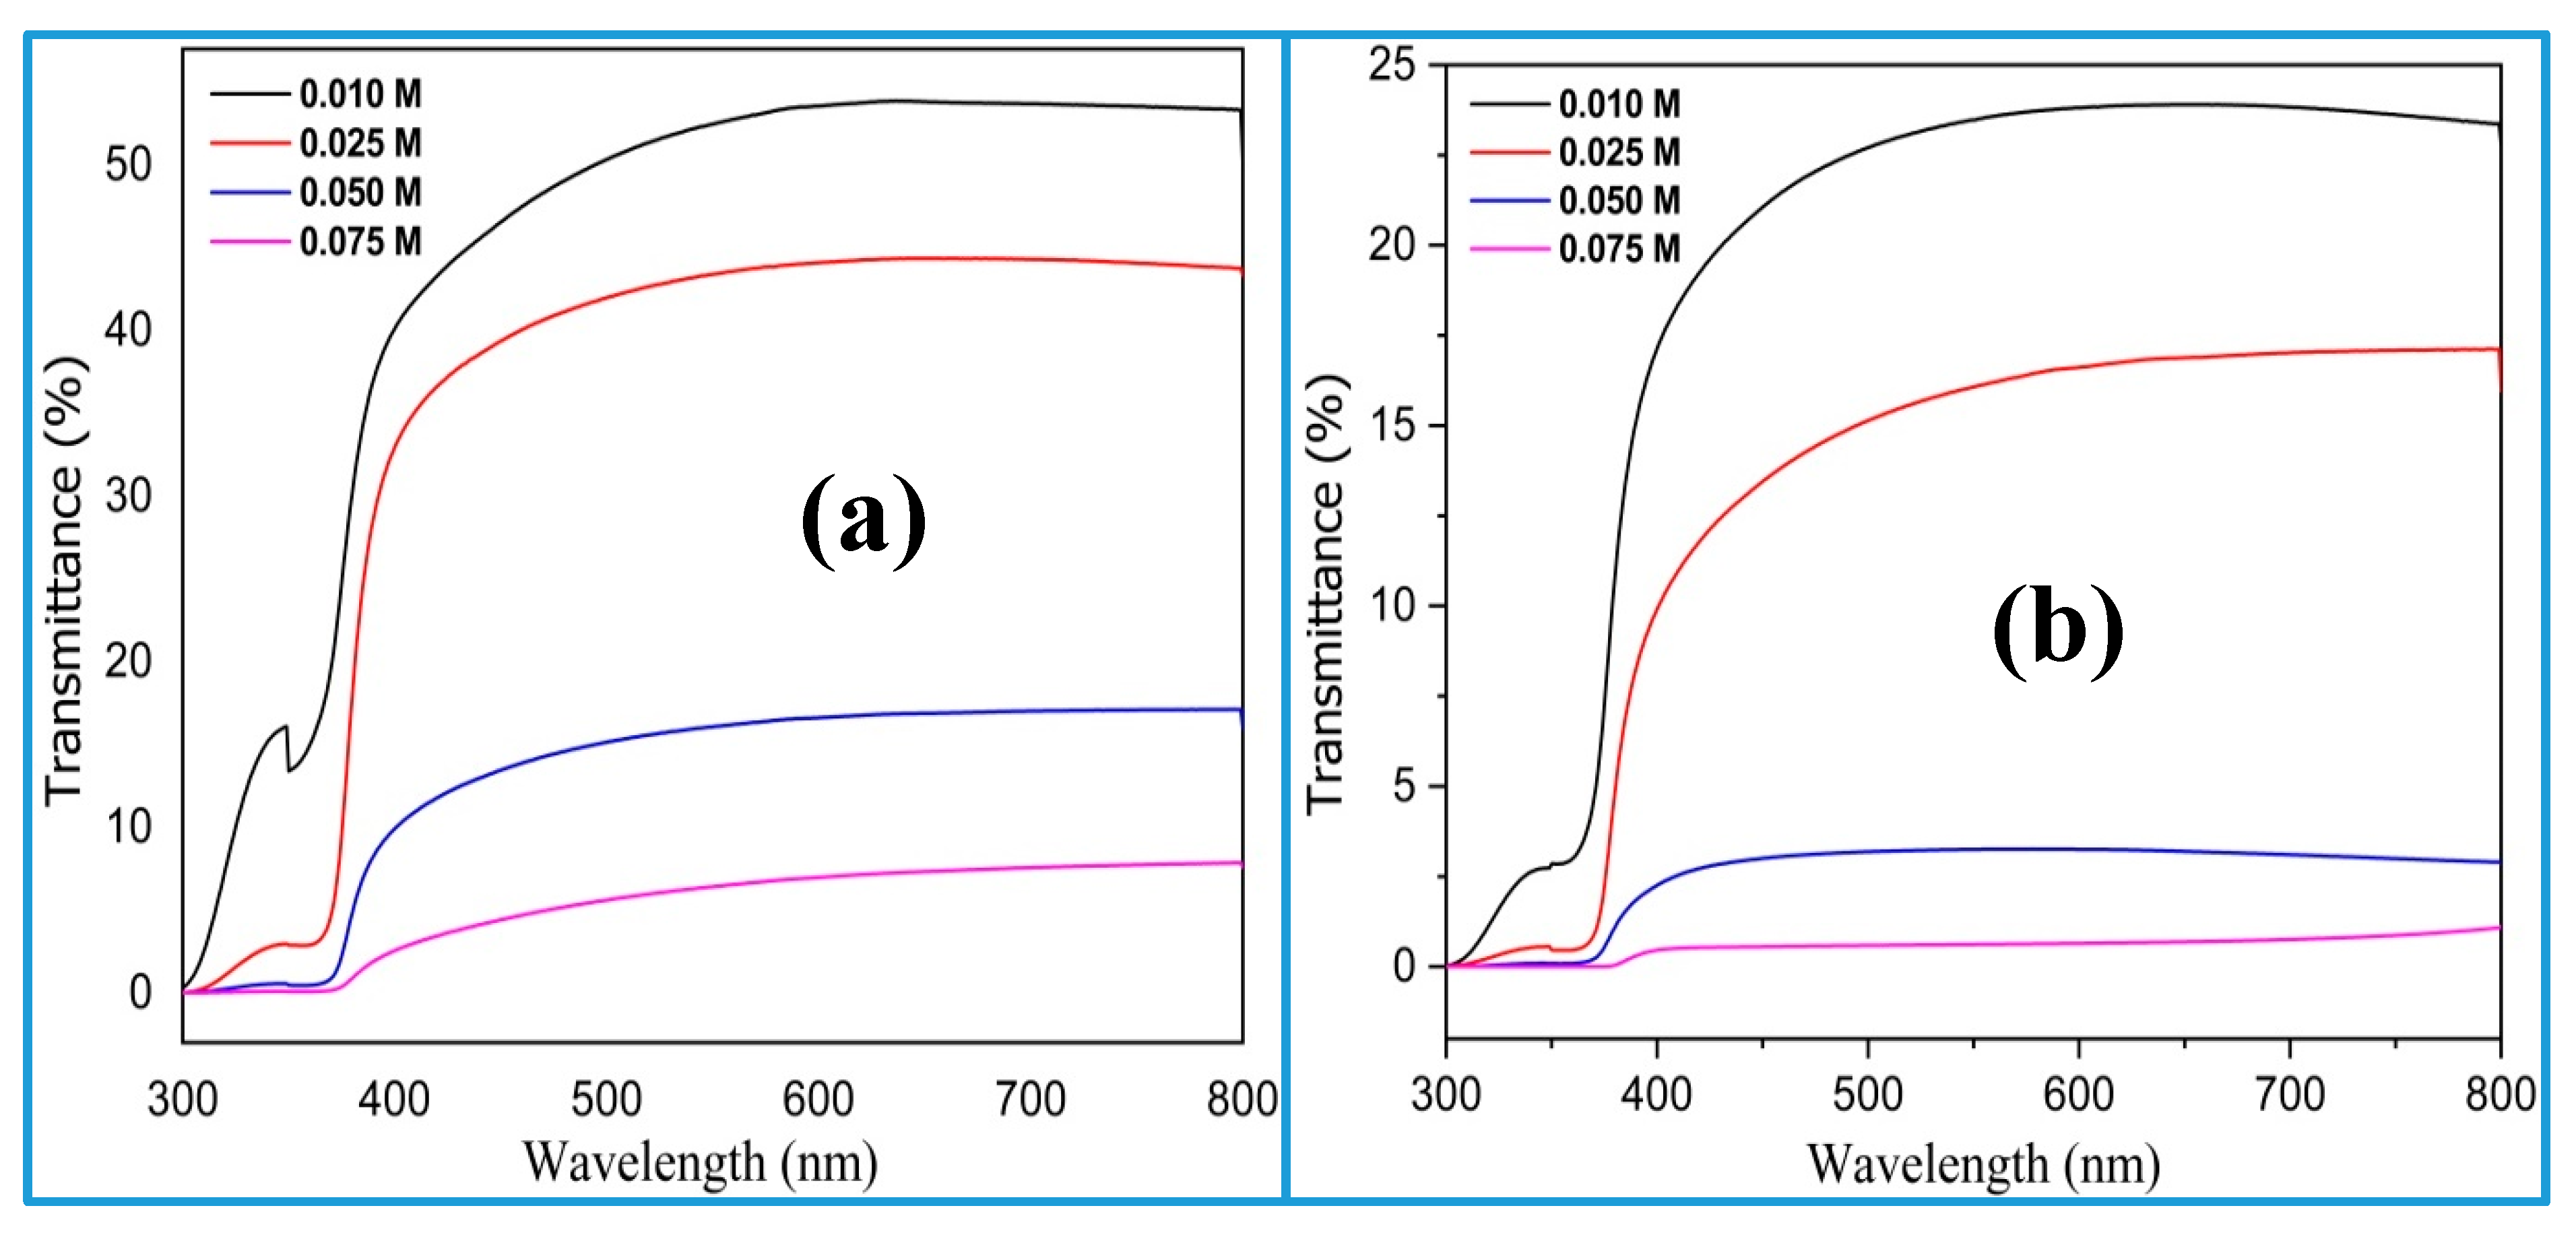
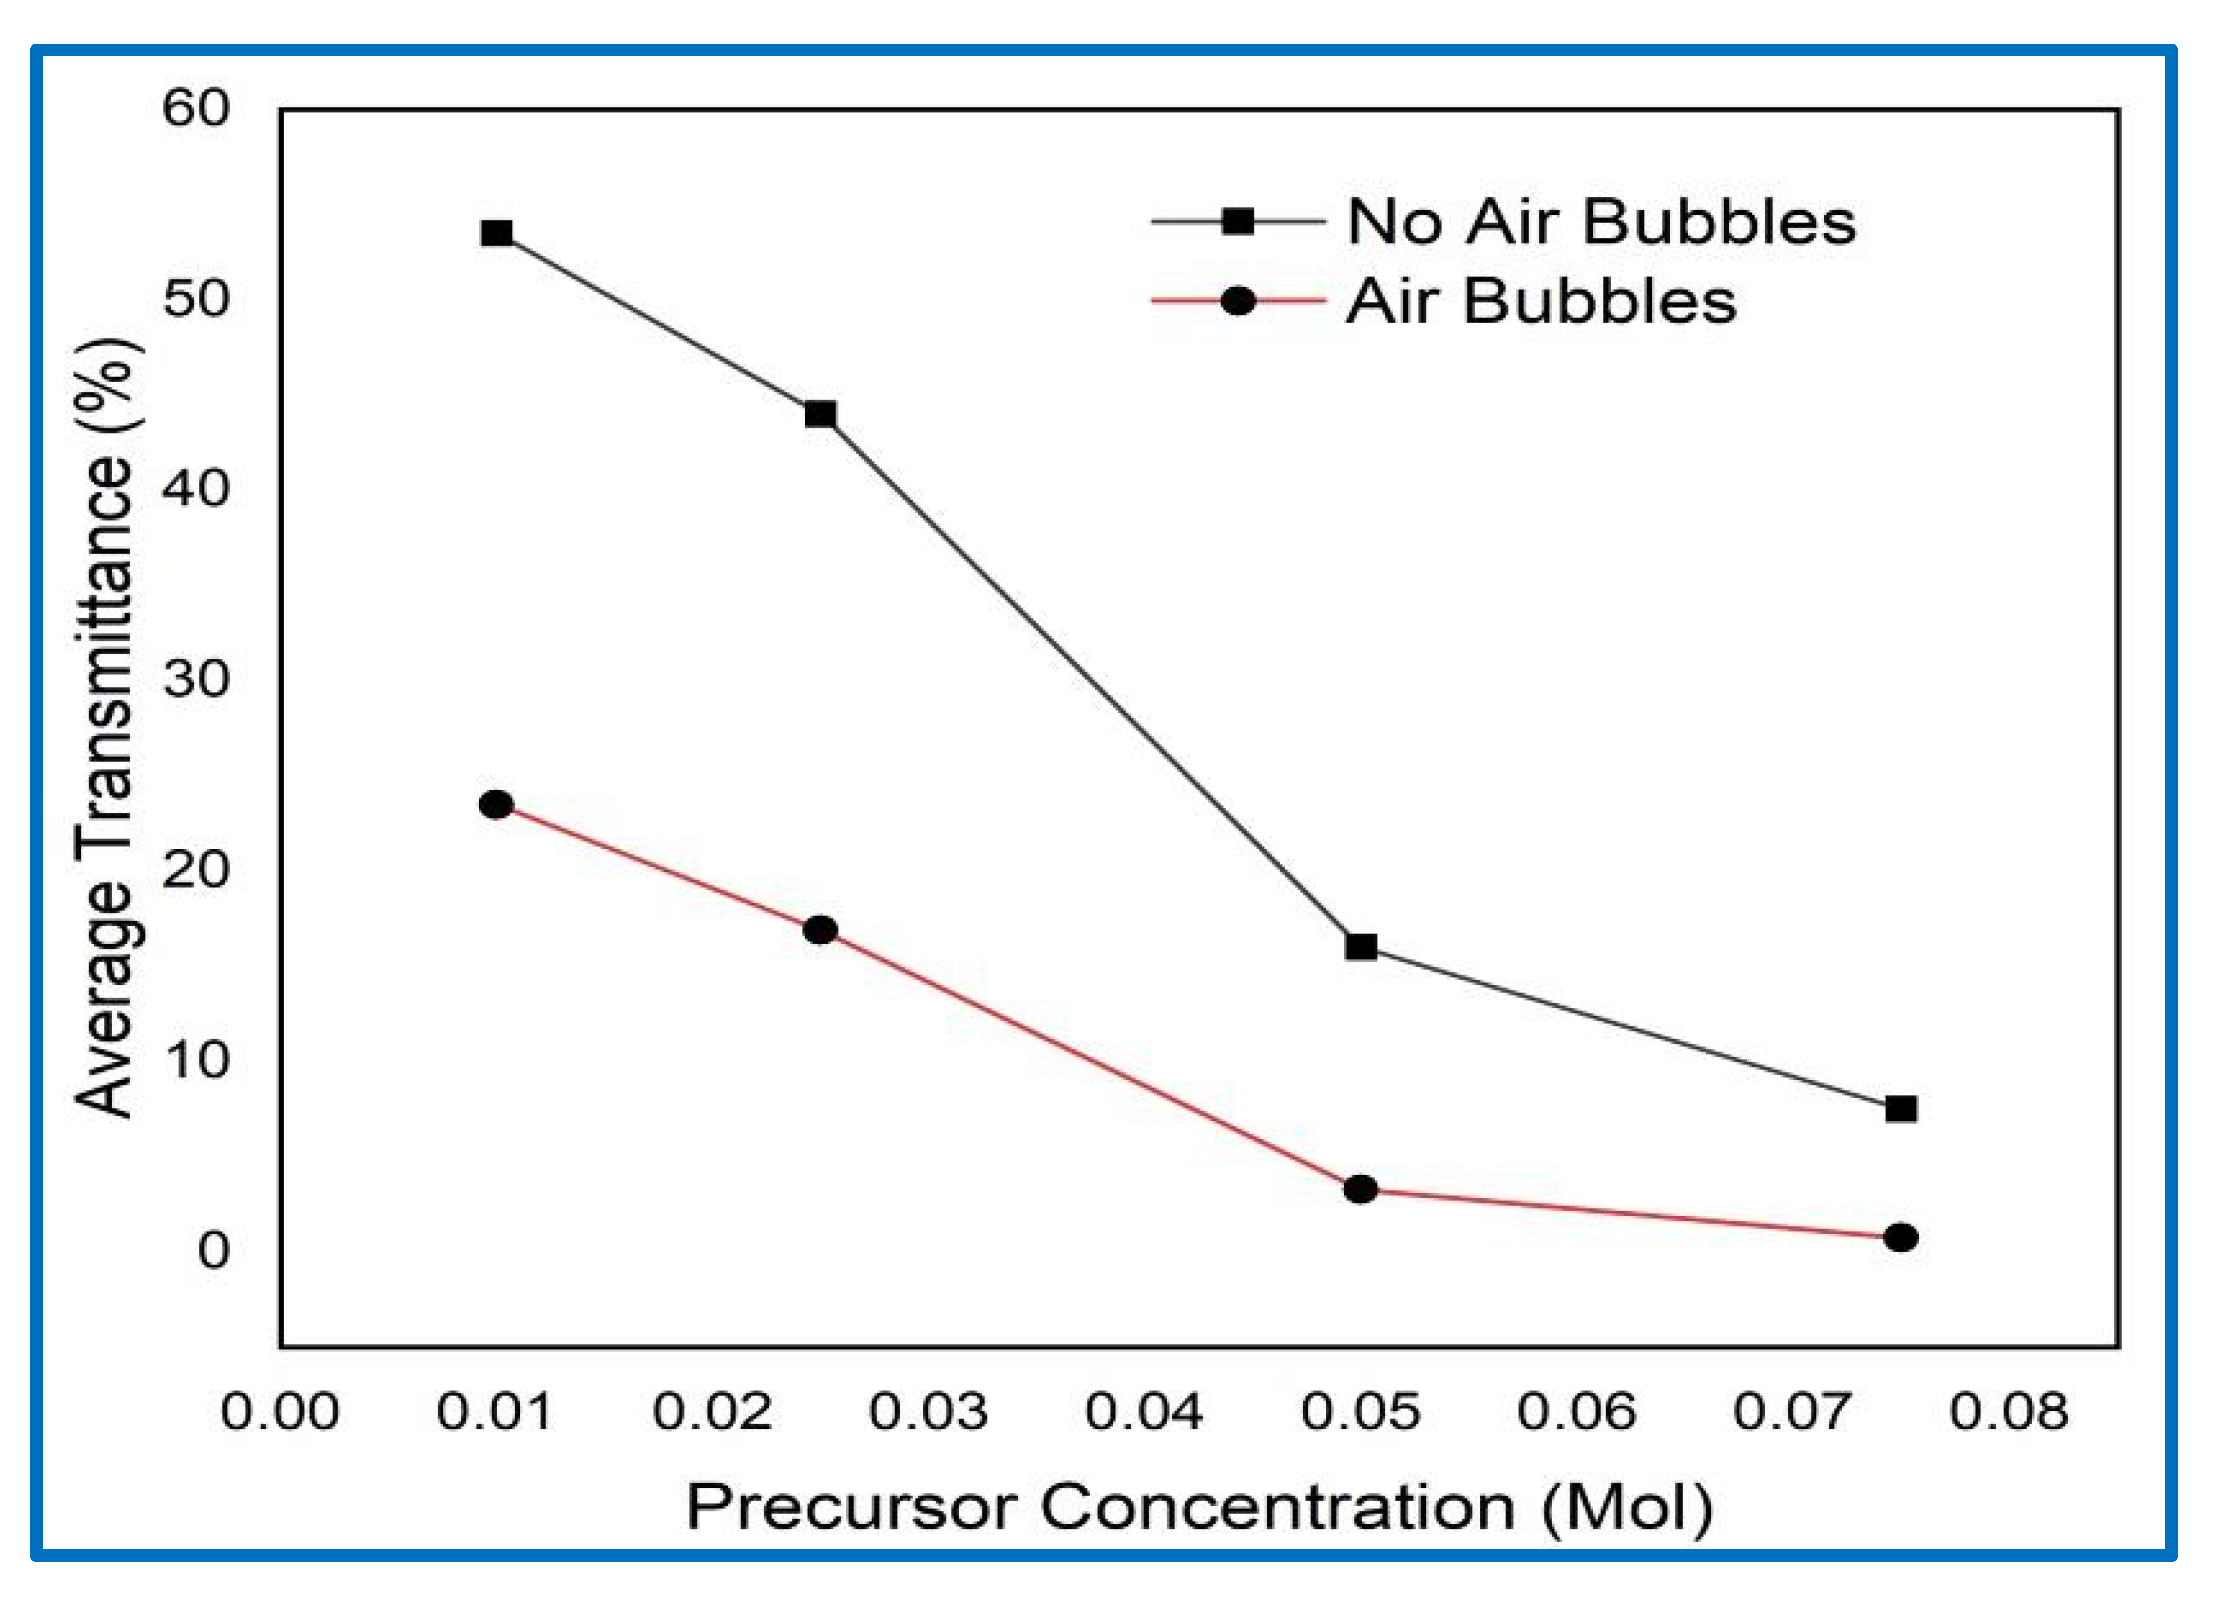
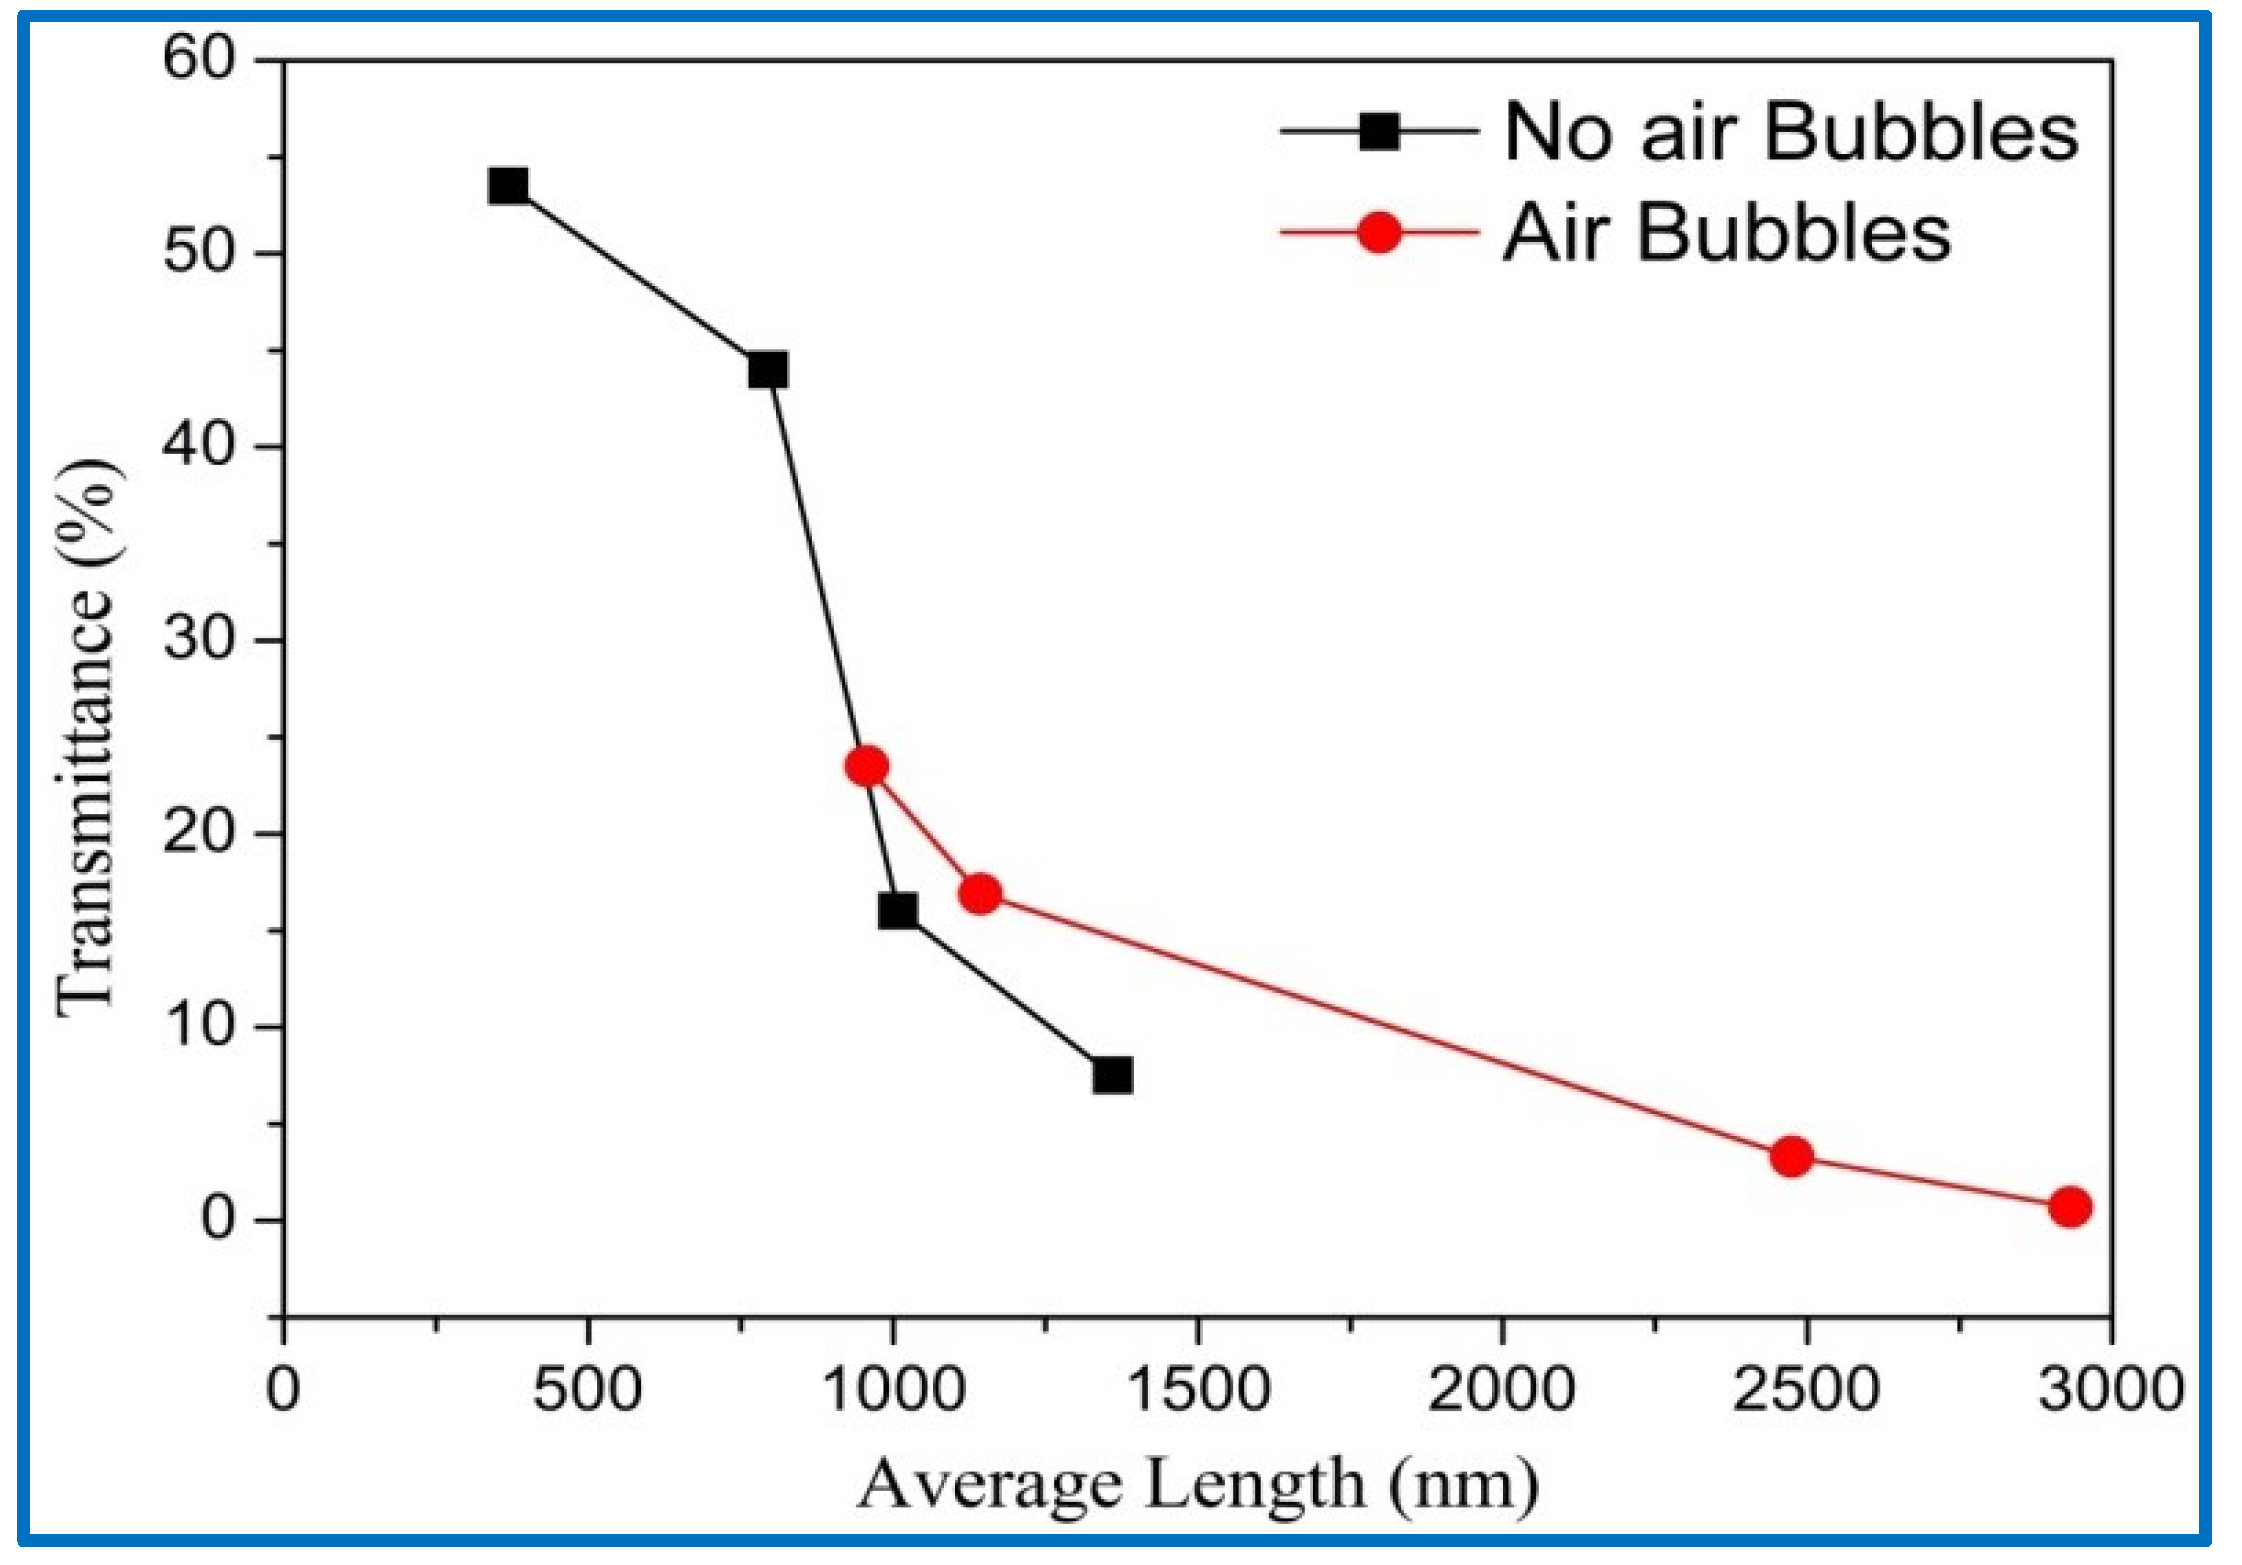
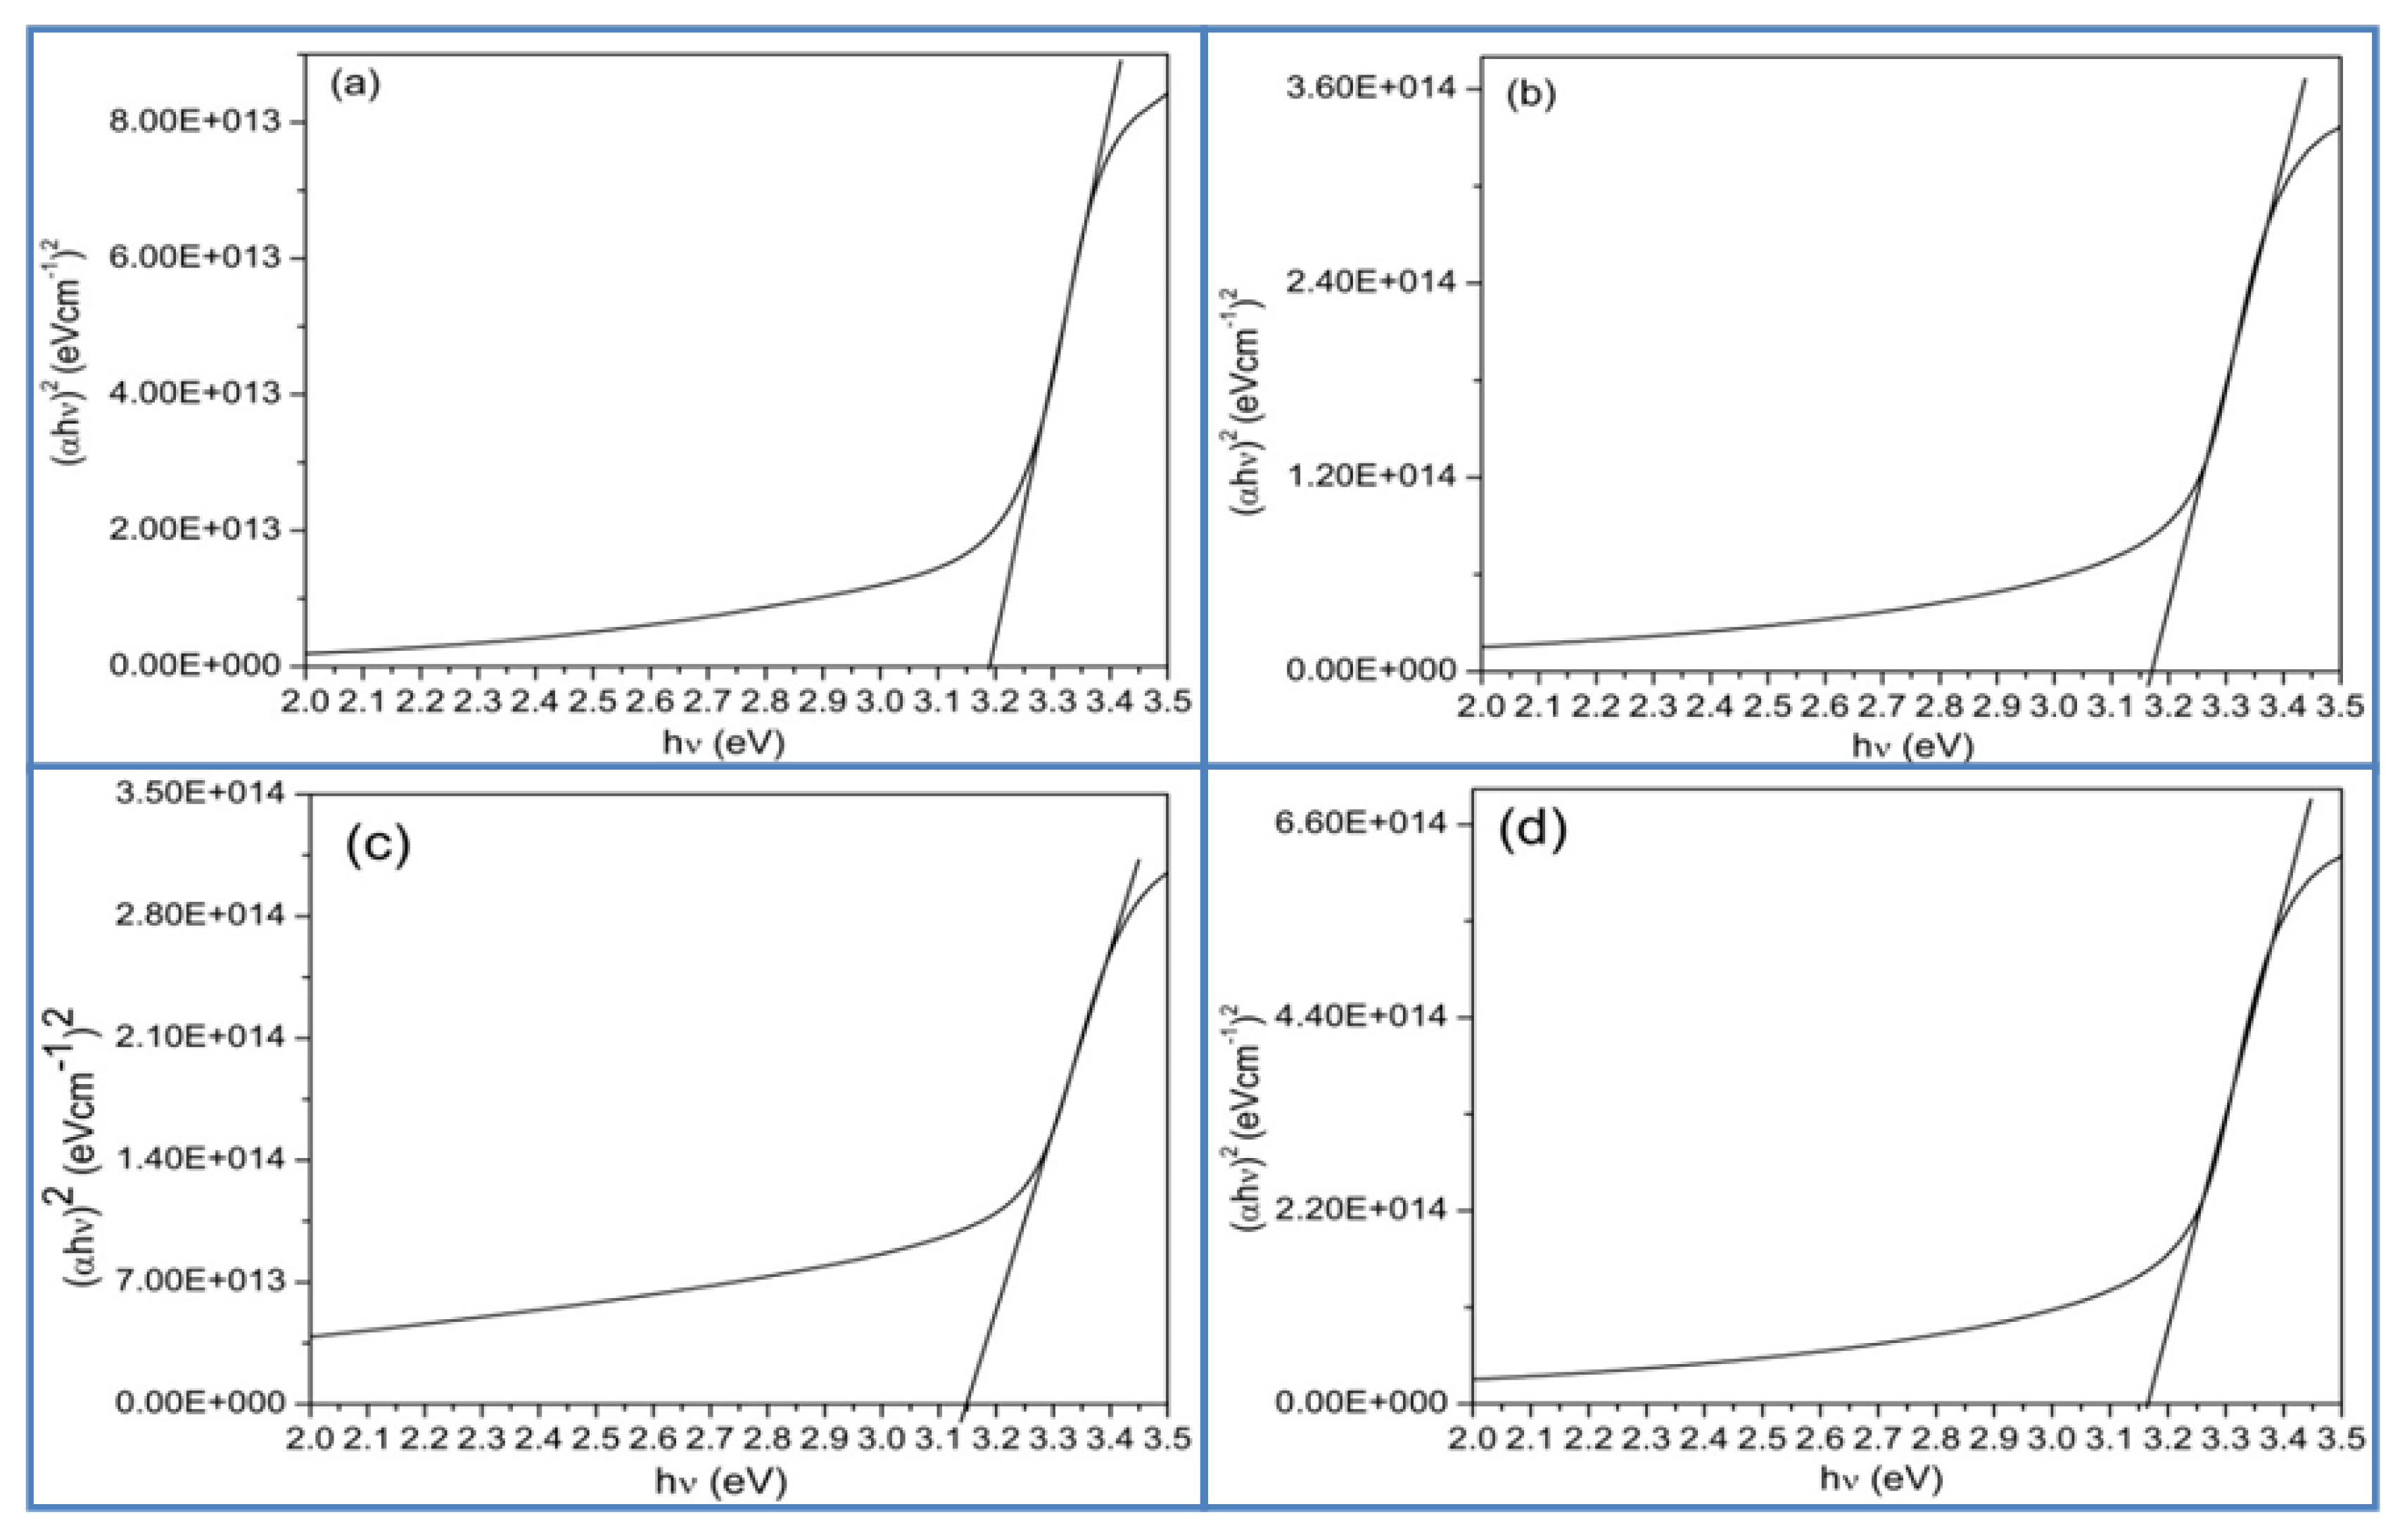
3.5. Optical Properties of ZnO Nanorods

The ultraviolet-visible spectrometer is used to study the influence of the different precursor concentrations on the optical properties of synthesized ZnO NRs over entire glass substrates for both methods of preparation. The optical transmittance spectrum from 300 nm to 800 nm of synthesized ZnO NRs at several precursor concentrations from 0.01 M to 0.075 M are shown in Figure 11. Clearly, From Figure 11a,b, the lower transmittance appears in the ultraviolet region and high transmittance is observed in the visible region for all synthesized ZnO NRs with non-participation and participation of air bubbles in growth CBD process, respectively. In general, the spectrum shows the decrease of transmittance with increasing precursor concentration as seen in Figure 12. This may due to the rise of the optical scattering prompted by the increase in thickness film and grain boundaries of ZnO NRs thin film which had hexagonal grain size and large surface roughness [52,64,7375]. The transmittance at each concentration more than two times higher than the transmittance of ZnO NRs synthesized in case of air bubbles were not involved in the growth process as shown in Figure 12. The obtained results of transmittance for the synthesized ZnO NRs where no air bubbles were associated in the growth process were in good agreement with the previous studies [33,40,52,74]. For the case air bubbles, the average transmittances for different precursor concentrations were much lower than the average transmittance in case of no air bubbles as shown in Figure 12. The reason behind this may attribute to different parameters. The first parameter is the length of ZnO NRs as seen in Figure 12, the longest in length the greater the optical scattering leading to decreasing the transmittance of ZnO NRs synthesized when air bubbles assist NRs fabrication in the modified method. The second parameter could be the energy band gap which is a little bit smaller when increases the absorption level. The smaller the crystalline size the smaller the optical scattering causes the higher the transmittance of the films.
From Figure 11, it can be seen with increasing precursor concentration, the transmission spectra of ZnO nanorods grown through both mentioned methods shifted to the longer wavelength. The absorption edge is shifted to higher wavelength which is caused by the reduction of the transition distance between levels of energy usually called Eg [76] and can also be attributed to the inside stress produced in the film and the light scattering influence in the films precipitated through the random distribution of the NRs array [77]. The amount of the shift is greater where the air bubbles were involved in growth for example at 0.05 M, the transmittance decreased sharply around 393.65 nm while where the air bubbles were not involved the transmittance decreases sharply at 385 nm. Mostly, the transmittance of ZnO NRs samples is affected by three factors such as oxygen vacancies, centers defect and surface roughness [78]. In the current study, the transmittance of synthesized ZnO NRs is decreased with increasing precursor concentration. This may concern to the higher thickness of ZnO NRs grown with increasing concentration which had hexagonal grain size and large surface roughness as shown in Figure 13. And higher absorption for thicker ZnO NRs thin films [75].
The linear portion extrapolation of (αhν)2 versus hν plots [67] and is derived from the transmittance spectrum were employed to calculate the energy band gap (Eg) of synthesized ZnO NRs by two mentioned fabrication methods at several precursor concentrations from 0.01 M to 0.075 M are shown in Figure 14 and Figure 15, respectively.
( α hv ) 2 = A ( hv E g ) n
where α is the coefficient of absorption, hν is the photon energy, A is constant, Eg is the optical energy band-gap and n depends on the type of transmission (n= 1/2 due to ZnO has direct transmission). For the transmittance spectrum the (α) coefficient can be calculated by [79].
α = ln ( 1 T ) d
where T is the ZnO NRs samples transmittance and d is the thickness of ZnO NRs.
Figure 11 shows the transition region were about 3.2 eV and 3.15 eV for ZnO NRs synthesized where air not involved and air involved, respectively. The Eg is related to the grain size, state of stress and carrier concentration in the material [80]. The investigated Eg of the synthesized ZnO NRs by conventional CBD method were about 3.24 eV, 3.26 eV, 3.221 eV and 3.20 eV at several precursor concentrations of 0.01 M, 0.025 M, 0.05 M and 0.075 M, respectively. While, the estimated Eg of the synthesized ZnO NRs by the modified CBD method were 3.19 eV, 3.17 eV, 3.15 eV and 3.16 eV at several precursor concentrations of 0.01 M, 0.025 M, 0.05 M and 0.075 M, respectively.
In case where air bubbles did not exist, the Eg increased with increasing the precursor concentration from 0.01 M to 0.025 M and then decreased with increasing precursor concentrations from 0.025 M to 0.075 M. But in case of air bubbles were present; the Eg is decreased as the precursor concentrations increased from 0.01 M to 0.05 M, and then increased slightly at 0.075 M. This may be attributed to the similar ionic radius between O and Zn [81,82]. The widening of Eg is related to an increase in the transition tail width [83,84]. The increase in the compressive strain alongside the c-axis and decreases with an increase in tensile strain causes an increase in Eg [85,86]. The investigating results show an increase in Eg and a decrease in the tensile strain as an increase in the precursor concentration [52]. In addition, the Eg of ZnO nanorods synthesized for air bubbles for different precursor concentrations were lower than the Eg when no air bubbles. This decreases in Eg as an increase in the precursor concentration and air bubbles may be due to the increase in the crystal size and the length of the synthesized ZnO NRs which is induced via the quantum size effect. Generally, the Eg of synthesized ZnO NRs in the two cases were lower than ZnO bulk, this is due to the optical confinement effect of the creation of ZnO NRs [87]. The investigated Eg results in the case of conventional CBD method were in well agreement with other previous works [40,64,68].

4. Conclusions

In summary, high crystal quality and vertically well-aligned ZnO NRs were successfully synthesized on glass substrates by using the low-cost modified and conventional CBD methods for different precursor concentration. The experimental results of the two growth CBD methods demonstrate that the precursor concentration has significant and remarkable effect on the synthesis of ZnO NRs. In addition, the characteristics properties of ZnO NRs grown by using the modified CBD method showed significantly improved and enhanced. The FESEM and XRD studies indicated that the ZnO nanorods were achieved in uniform hexagonal shape with a preferential growth direction along [002] orientation. The ZnO NRs were synthesized by using the modified methods were grown longer than the ZnO NRs grown by using conventional method and were in the range of 957–2932 nm and 369–1361 nm, respectively. The ZnO NRs synthesized at 0.05 M by using a modified method were grown with a higher aspect ratio than the ZnO NRs grown in the conventional method which is (25) and (11), respectively. In addition, the growth rate increased with increasing precursor concentration, and the growth rate of ZnO NRs synthesized by the modified method was higher than the growth rates of ZnO NRs synthesized by using the conventional method. The final pH value of different precursor concentrations, in case of air bubbles, is existence is less than the final pH value in case of no air bubbles. The XRD pattern results show that the of ZnO NRs sample grown were nanorods-like in shape and possessed a hexagonal wurtzite structure with a high crystal quality. No other phases from the impurity were investigated. The XRD pattern showed that the diffraction peaks along (002) plane became higher, sharper and narrower as precursor concentration increases, founding that the crystalline quality of ZnO NRs grown by modified CBD method going more enhanced and better than the conventional method. However, the optical studied shows that the transmittance at each concentration more than two times higher than the transmittance was using the modified CBD method. The ZnO NRs have direct Eg in the range of (3.2–3.26) eV and (3.15–3.19) eV for modified and conventional methods, respectively. It was investigated from modified CBD method that the ZnO NRs grown with precursor concentration 0.05 M is the most favorable result since the NRs have a best homogenous, uniform hexagonal shape, uniform size and uniform distribution with higher aspect ratio more than 25, high crystal quality, crystal size about (50 nm) and Eg (3.15 eV).

Author Contributions

Conceptualization, A.F.A. and S.M.A.; methodology, A.F.A., S.M.A. and N.M.A.; formal analysis, A.F.A.; investigation, A.F.A., S.M.A., N.M.A. and M.A.A.; resources, A.F.A.; data curation, A.F.A., S.M.A., N.M.A. and M.A.A.; writing—original draft preparation, A.F.A.; writing—review and editing; A.F.A. and S.M.A.; visualization, A.F.A. and S.M.A.; Supervision, S.M.A. and N.M.A. All authors have read and agreed to the published version of the manuscript.

Funding

This research received no external funding.

Acknowledgments

The authors wish to gratefully thank the University of Zakho, Kurdistan Region-Iraq and Nano Optoelectronic Research & Technology Laboratory School of Physics, University Sains Malaysia for their support of this work.

Conflicts of Interest

The authors declare no conflicts of interest.

References

  1. Shinde, V.R.; Lokhande, C.D.; Mane, R.S.; Han, S.H. Hydrophobic and textured ZnO films deposited by chemical bath deposition: Annealing effect. Appl. Surf. Sci. 2005, 245, 407–413. [Google Scholar] [CrossRef]
  2. Lupan, O.; Chow, L.; Chai, G.; Roldan, B.; Naitabdi, A.; Schulte, A.; Heinrich, H. Nanofabrication and characterization of ZnO NRs arrays and branched microrods by aqueous solution route and rapid thermal processing. Mater. Sci. Eng. B Solid State Mater. Adv. Technol. 2007, 145, 57–66. [Google Scholar] [CrossRef]
  3. Gimenez, A. ZnO−paper based photoconductive UV sensor. J. Phys. 2010, 2, 282–287. [Google Scholar] [CrossRef]
  4. Zhang, Q.; Dandeneau, C.S.; Zhou, X.; Cao, G. ZnO nanostructures for dye-sensitized solar cells. Adv. Mater. 2009, 21, 4087–4108. [Google Scholar] [CrossRef]
  5. Lei, A.; Qu, B.; Zhou, W.; Wang, Y.; Zhang, Q.; Zou, B. Facile synthesis and enhanced photocatalytic activity of hierarchical porous ZnO microspheres. Mater. Lett. 2012, 66, 72–75. [Google Scholar] [CrossRef]
  6. Lee, C.Y.; Lin, M.Y.; Wu, W.H.; Wang, J.Y.; Chou, Y.; Su, W.F.; Chen, Y.F.; Lin, C.F. Flexible ZnO transparent thin-film transistors by a solution-based process at various solution concentrations. Semicond. Sci. Technol. 2010, 25, 105008. [Google Scholar] [CrossRef]
  7. Jha, S.K.; Kutsay, O.; Bello, I.; Lee, S.T. ZnO nanorod based low turn-on voltage LEDs with wide electroluminescence spectra. J. Lumin. 2013, 133, 222–225. [Google Scholar] [CrossRef]
  8. Huang, M.H.; Mao, S.; Feick, H.; Yan, H.; Wu, Y.; Kind, H.; Weber, E.; Russo, R.; Yang, P. Room-temperature ultraviolet nanowire nanolasers. Science 2001, 292, 1897. [Google Scholar] [CrossRef] [Green Version]
  9. Park, W.I.; Kim, D.H.; Jung, S.W.; Yi, G.C. Metal organic vapor-phase epitaxial growth of vertically well-aligned ZnO NRs. Appl. Phys. Lett. 2002, 80, 4232. [Google Scholar] [CrossRef]
  10. Suh, H.W.; Kim, G.Y.; Jung, Y.S.; Choi, W.K.; Byun, D. Growth and properties of ZnO nanoblade and nanoflower prepared by ultrasonic pyrolysis. J. Appl. Phys. 2005, 97, 044305. [Google Scholar] [CrossRef]
  11. Yi, G.C.; Wang, C.; Park, W.I. ZnO nanorods: Synthesis, characterization and applications. Semicond. Sci. Technol. 2005, 20, S22. [Google Scholar] [CrossRef]
  12. Montenegro, D.N.; Hortelano, V.; Martínez, O.; Martínez-Tomas, M.C.; Sallet, V.; Muñoz-Sanjosé, V.; Jiménez, J. Influence of metal organic chemical vapor deposition growth conditions on vibrational and luminescent properties of ZnO nanorods. J. Appl. Phys. 2013, 113, 143513–143519. [Google Scholar] [CrossRef]
  13. Choi, J.H.; Tabata, H.; Kawai, T. Initial preferred growth in zinc oxide thin films on Si and amorphous substrates by a pulsed laser deposition. J. Cryst. Growth 2001, 226, 493–500. [Google Scholar] [CrossRef]
  14. Yang, P.; Yan, H.; Mao, S.; Russo, R.; Johnson, J.; Saykally, R.; Morris, N.; Pham, J.; He, R.; Choi, H.J. Controlled growth of ZnO nanowires and their optical properties. Adv. Funct. Mater. 2002, 12, 323. [Google Scholar] [CrossRef]
  15. Lee, J.Y.; Choi, Y.S.; Kim, J.H.; Park, M.O.; Im, S. Optimizing n ZnO/P Si hetero junctions for photodiode applications. Thin Solid Films 2002, 403, 553. [Google Scholar] [CrossRef]
  16. Shabannia, R.; Abu-Hassan, H. Vertically aligned ZnO nanorods synthesized using chemical bath deposition method on seed-layer ZnO/polyethylene naphthalate (PEN) substrates. Mater. Lett. 2013, 90, 156–158. [Google Scholar] [CrossRef]
  17. Ryu, Y.; Lee, T.S.; Lubguban, J.A.; White, H.W.; Kim, B.J.; Park, Y.S.; Youn, C.J. Next generation of oxide photonic devices: ZnO-based ultraviolet light emitting diodes. Appl. Phys. Lett. 2006, 88, 241108. [Google Scholar] [CrossRef]
  18. Abdulrahman, A.F.; Ahmed, S.M.; Ahmed, N.M. investigation of optical properties of ZnO nanorods grown on different substrates. Sci. J. Univ. Zakho 2018, 6, 160–165. [Google Scholar] [CrossRef]
  19. Mcpeak, K.M.; Baxter, J.B. Microreactor for high-yield chemical bath deposition of semiconductor nanowires: ZnO nanowire case study. Ind. Eng. Chem. Res. 2009, 48, 5954–5961. [Google Scholar] [CrossRef]
  20. Jung, J.Y.; Park, N.K.; Han, S.Y.; Han, G.B.; Lee, T.J.; Ryu, S.O.; Chang, C.H. The growth of the flower-like ZnO structure using a continuous flow microreactor. Curr. Appl. Phys. 2008, 8, 720–724. [Google Scholar] [CrossRef]
  21. Abdulrahman, A.F.; Ahmed, S.M.; Ahmed, N.M.; Almessiere, M.A. Novel process using oxygen and air bubbling in chemicalbath deposition method for vertically well aligned arrays of ZnO nanorods. Dig. J. Nanomater. Biostruct. 2016, 11, 1073–1082. [Google Scholar]
  22. Amin, G.; Asif, M.H.; Zainelabdin, A.; Zaman, S.; Nur, O.; Willander, M. Influence of pH, precursor concentration, growth time, and temperature on the morphology of ZnO nanostructures grown by the hydrothermal method. J. Nanomater. 2011, 2011. [Google Scholar] [CrossRef] [Green Version]
  23. Syrrokostas, G.; Govatsi, K.; Yannopoulos, S.N. High-quality, reproducible ZnO nanowire arrays obtained by a multiparameter optimization of chemical bath deposition growth. Cryst. Growth Des. 2016, 16, 2140–2150. [Google Scholar] [CrossRef]
  24. Tao, Q.; Li, S.; Zhang, Q.Y.; Kang, D.W.; Yang, J.S.; Qiu, W.W.; Liu, K. Controlled growth of ZnO nanorods on textured silicon wafer and the application for highly effective and recyclable SERS substrate by decorating Ag nanoparticles. Mater. Res. Bull. 2014, 54, 6–12. [Google Scholar] [CrossRef]
  25. Govatsi, K.; Seferlis, A.; Neophytides, S.G.; Yannopoulos, S.N. Influence of the morphology of ZnO nanowires on the photoelectrochemical water splitting efficiency. Int. J. Hydrog. Energy 2018, 43, 4866–4879. [Google Scholar] [CrossRef]
  26. Nair, P.K.; Nair MT, S.; Fernandez, A.; Ocampo, M. Prospects of chemically deposited metal chalcogenide thin films for solar control applications. J. Phys. D Appl. Phys. 1989, 22, 829. [Google Scholar] [CrossRef]
  27. Suryanarayana, C.V.; Lakshmanan, A.S.; Subramanian, V.; Krishnakumar, R. Preparation of thin film electrodes for electrochemical solar cells-chemical bath deposition. Bull. Electrochem. 1986, 2, 57–58. [Google Scholar]
  28. Parize, R.; Garnier, J.D.; Appert, E.; Chaix-Pluchery, O.; Consonni, V. Effects of polyethylenimine and its molecular weight on the chemical bath deposition of ZnO nanowires. ACS Omega 2018, 3, 12457–12464. [Google Scholar] [CrossRef]
  29. Shakernejad, R.; Khayatian, A.; Ramazani, A.; Akhtarianfar, S.F.; Kashi, M.A. The role of different initial rest times on synthesized buffer layer and UV sensing of ZnO nanorods grown on rotational substrate. J. Mat. Sci. Mat. Electron. 2018, 29, 8303–8312. [Google Scholar] [CrossRef]
  30. Jia, G.; Wang, Y.; Yao, J. Growth mechanism of ZnO nanostructure using chemical bath deposition. J. Ovonic Res. 2010, 6, 303–307. [Google Scholar]
  31. Li, Q.; Bian, J.; Sun, J.; Wang, J.; Luo, Y.; Sun, K.; Yu, D. Controllable growth of well-aligned ZnO nanorod arrays by low-temperature wet chemical bath deposition method. Appl. Surf. Sci. 2010, 256, 1698. [Google Scholar] [CrossRef]
  32. Wahab, R.; Kim, Y.S.; Lee, K.; Shin, H.S. Fabrication and growth mechanism of hexagonal zinc oxide nanorods via solution process. J. Mater. Sci. 2010, 45, 2967–2973. [Google Scholar] [CrossRef]
  33. Lee, Y.-M.; Yang, H.-W. Optimization of processing parameters on the controlled growth of ZnO nanorod arrays for the performance improvement of solid-state dye-sensitized solar cells. J. Solid State Chem. 2011, 184, 615–623. [Google Scholar] [CrossRef]
  34. Tong, F.; Kim, K.; Wang, Y.; Thapa, R.; Sharma, Y.; Modic, A.; Ahyi, A.; Issacs-Smith, T.; Williams, J.; Park, H.; et al. Growth of ZnO nanorod arrays on flexible substrates: Effect of precursor solution concentration. ISRN Nanomater. 2012, 2012. [Google Scholar] [CrossRef] [Green Version]
  35. Shabannia, R.; Abu Hassan, H. Growth of aligned ZnO Nanorods grown on polyethylene naphthalate substrates: Effect of the growth duration. Adv. Mater. Res. 2014, 925, 195–199. [Google Scholar] [CrossRef]
  36. Patil, G.R.; Gaikwad, R.S.; Shelar, M.B.; Mane, R.S.; Han, S.H.; Pawar, B.N. Role of concentration and temperature on well-aligned ZnO nanorod by low- temperature wet chemical bath deposition method. Arch. Phys. Res. 2012, 3, 401–406. [Google Scholar]
  37. Shabannia, R.; Abu Hassan, H. Controllable vertically aligned ZnO nanorods on flexible polyethylene naphthalate (PEN) substrate using chemical bath deposition synthesis. Appl. Phys. A Mater. Sci. Process. 2014, 114, 579–584. [Google Scholar] [CrossRef]
  38. Chee, C.Y.; Nadarajah, K.; Siddiqui, M.K.; Wong, Y. Optical and structural characterization of solution processed zinc oxide nanorods via hydrothermal method. Ceram. Int. 2014, 40, 9997–10004. [Google Scholar] [CrossRef]
  39. Thambidurai, M.; Muthukumarasamy, N.; Velauthapillai, D.; Lee, C. Chemical bath deposition of ZnO nanorods for dye sensitized solar cell applications. J. Mater. Sci. Mater. Electron. 2013, 24, 1921. [Google Scholar] [CrossRef]
  40. Fuad, A.; Fibriyanti, A.A.; Mufti, N.; Taufiq, A. Effect of precursor concentration ratio on the crystal structure, morphology, and band gap of ZnO nanorods. IOP Conf. Ser. Mater. Sci. Eng. 2017, 202, 012074. [Google Scholar] [CrossRef] [Green Version]
  41. Chen, S.H.; Yu, C.F.; Chien, C.S. Nanoscale electrical properties of ZnO nanorods grown by chemical bath deposition. Microsc. Res. Tech. 2017, 80, 671–679. [Google Scholar] [CrossRef] [PubMed]
  42. Abuelsamen, A.A.; Mahmud, S.; Seeni, A.; Kaus NH, M.; Farhat, O.F. Effects of precursor concentrations on the optical and morphological properties of ZnO nanorods on glass substrate for UV photodetector. Superlattices Microstruct. 2017, 111, 536–545. [Google Scholar] [CrossRef]
  43. Abdulrahman, A.F.; Ahmed, S.M.; Ahmed, N.M. The influence of the growth time on the size and alignment of Zno nanorods. Sci. J. Univ. Zakho 2017, 5, 128–135. [Google Scholar] [CrossRef] [Green Version]
  44. Feng, Q.; Tang, D.; Jiang, E.; Gu, S.; Han, S. Solution growth of vertical aligned ZnO nanorod arrays on ZnO seed layers fabricated by Langmuir-Blodgett method. J. Alloys Compd. 2013, 578, 228. [Google Scholar] [CrossRef]
  45. Kim, K.H.; Utashiro, K.; Abe, Y.; Kawamura, M. Growth of zinc oxide nanorods using various seed layer annealing temperatures and substrate materials. Int. J. Electrochem. Sci. 2014, 9, 2080. [Google Scholar]
  46. Fang, M.; Liu, Z.W. Controllable size and photoluminescence of ZnO nanorod arrays on Si substrate prepared by microwave-assisted hydrothermal method. Ceram. Int. 2017, 43, 6955. [Google Scholar] [CrossRef]
  47. Baruah, S.; Dutta, J. pH-dependent growth of zinc oxide nanorods. J. Cryst. Growth 2009, 311, 2549–2554. [Google Scholar] [CrossRef]
  48. Wang, Z.L.; Kong, X.Y.; Ding, Y.; Gao, P.; Hughes, W.L.; Yang, R.; Zhang, Y. Semiconducting and piezoelectric oxide nanostructures induced by polar surfaces. Adv. Funct. Mater. 2004, 14, 943–956. [Google Scholar] [CrossRef]
  49. Huang, C.Y.; Wu, T.H.; Cheng, C.Y.; Su, Y.K. Homogeneous ZnO nanostructure arrays on GaAs substrates by two-step chemical bath synthesis. J. Nanopart. Res. 2012, 14, 866. [Google Scholar] [CrossRef]
  50. Kumar, P.S.; Sundaramurthy, J.; Zhang, X.; Mangalaraj, D.; Thavasi, V.; Ramakrishna, S. Superhydrophobic and antireflecting behavior of densely packed and size controlled ZnO nanorods. J. Alloys Compd. 2013, 553, 375–382. [Google Scholar] [CrossRef]
  51. Fang, X.; Peng, L.; Shang, X.; Zhang, Z. Controlled synthesis of ZnO branched nanorod arrays by hierarchical solution growth and application in dye-sensitized solar cells. Thin Solid Films 2011, 519, 6307–6312. [Google Scholar] [CrossRef]
  52. Malek, M.F.; Mamat, M.H.; Sahdan, M.Z.; Zahidi, M.M.; Khusaimi, Z.; Mahmood, M.R. Influence of various sol concentrations on stress/strain and properties of ZnO thin films synthesised by sol-gel technique. Thin Solid Films 2013, 527, 102–109. [Google Scholar] [CrossRef]
  53. Han, Z.; Chu, J.; Li, S.; Chen, Y. Controlled growth of well-aligned ZnO nanowire arrays using the improved hydrothermal method. J. Semicond. 2013, 34. [Google Scholar] [CrossRef]
  54. Kim, K.H.; Umakoshi, T.; Abe, Y.; Kawamura, M.; Kiba, T. Determination of effective growth time for zinc oxide nanorods using chemical solution deposition. Superlatti. Microstruct. 2015, 88, 150. [Google Scholar] [CrossRef]
  55. Law, M.; Greene, L.E.; Johnson, J.C.; Saykally, R.; Yang, P. Nanowire dye-sensitized solar cells. Nat. Mater. 2005, 4, 455–459. [Google Scholar] [CrossRef]
  56. Elias, J.; Tena-Zaera, R.; Lévy-Clément, C. Electrodeposition of ZnO nanowires with controlled dimensions for photovoltaic applications: Role of buffer layer. Thin Solid Films 2007, 515, 8553–8557. [Google Scholar] [CrossRef]
  57. Lee, T.H.; Ryu, H.; Lee, W.J. Fast vertical growth of ZnO nanorods using a modified chemical bath deposition. J. Alloys Compd. 2014, 597, 85–90. [Google Scholar] [CrossRef]
  58. Roza, L.; Fairuzy KA, J.; Dewanta, P.; Umar, A.A.; Rahman MY, A.; Salleh, M.M. Effect of molar ratio of zinc nitrate: Hexamethylenetetramine on the properties of ZnO thin film nanotubes and nanorods and the performance of dye-sensitized solar cell (DSSC). J. Mater. Sci. Mater. Electron. 2015, 26, 7955–7966. [Google Scholar] [CrossRef]
  59. Chae, K.W.; Zhang, Q.; Kim, J.S.; Jeong, Y.H.; Cao, G. Low-temperature solution growth of ZnO nanotube arrays. Beilstein J. Nanotechnol. 2010, 1, 128–134. [Google Scholar] [CrossRef] [Green Version]
  60. Yang, L.; Zhao, Q.X.; Willander, M. Size-controlled growth of well-aligned ZnO nanorod arrays with two-step chemical bath deposition method. J. Alloys Compd. 2009, 469, 623–629. [Google Scholar] [CrossRef] [Green Version]
  61. Lv, J.; Zhu, J.; Huang, K.; Meng, F.; Song, X.; Sun, Z. Tunable surface wettability of ZnO nanorods prepared by two-step method. Appl. Surf. Sci. 2011, 257, 7534–7538. [Google Scholar] [CrossRef]
  62. Liang, S.; Bi, X. Structure, conductivity, and transparency of Ga-doped ZnO thin films arising from thickness contributions. J. Appl. Phys. 2008, 104, 1–6. [Google Scholar] [CrossRef]
  63. Singh, P.; Kumar, A.; Kaur, D. Growth and characterization of ZnO nanocrystalline thin films and nanopowder via low-cost ultrasonic spray pyrolysis. J. Cryst. Growth 2007, 306, 303–310. [Google Scholar] [CrossRef]
  64. Nagayasamy, N.; Gandhimathination, S.; Veerasamy, V. The effect of ZnO thin film and its structural and optical properties prepared by sol-gel spin coating method. Open J. Met. 2013, 3, 8–11. [Google Scholar] [CrossRef] [Green Version]
  65. Ab Aziz, A.; Khusaimi, Z.; Rusop Mahmood, M. Effect of precursor concentration in the synthesization of ZnO nanostructures by solution-immersion method. Adv. Mater. Res. 2013, 667, 501–506. [Google Scholar] [CrossRef]
  66. Abdulrahman, A.F.; Ahmed, S.M.; Ahmed, N.M.; Almessiere, M.A. Fabrication, characterization of ZnO nanorods on the flexible substrate (Kapton tape) via chemical bath deposition for UV photodetector applications. AIP Conf. Proc. 2017, 1875, 020004. [Google Scholar]
  67. Abdulrahman, A.F.; Ahmed, S.M.; Almessiere, M.A. Effect of the growth time on the optical properties of Zno nanorods grown by low temperature method. Dig. J. Nanomater. Biostruct. 2017, 12, 1001–1009. [Google Scholar]
  68. Siregar, N.; Marlianto, E.; Gea, S. The effect of concentration of structure and optical properties of thin films synthesized by sol-gel methods spin coating. IJSBAR 2015, 22, 428–434. [Google Scholar]
  69. Endo, H.; Sugibuchi, M.; Takahashi, K.; Goto, S.; Sugimura, S.; Hane, K.; Kashiwaba, Y. Schottky ultraviolet photodiode using a ZnO hydrothermally grown single crystal substrate. Appl. Phys. Lett. 2007, 90, 88–91. [Google Scholar] [CrossRef]
  70. Benramache, S.; Belahssen, O.; Guettaf, A.; Arif, A. Correlation between crystallite size-optical gap energy and precursor molarities of ZnO thin films. J. Semicond. 2014, 35, 042001. [Google Scholar] [CrossRef]
  71. Abdulrahman, A.F.; Ahmed, S.M.; Ahmed, N.M.; Almessiere, M.A. Different substrates effects on the topography and the structure of the Zno nanorods grown by chemical bath deposition method. Dig. J. Nanomater. Biostruct. 2016, 11, 1007–1016. [Google Scholar]
  72. Gusatti, M.; Campos, C.E.M.; Souza, D.A.R.; Moser, V.M.; Kuhnen, N.C.; Riella, H.G. Effect of reaction parameters on the formation and properties of ZnO nanocrystals synthesized via a rapid solochemical processing. J. Nanosci. Nanotechnol. 2013, 13, 8307–8314. [Google Scholar] [CrossRef] [PubMed]
  73. Kashif, M.; Hashim, U.; Ali, M.E.; Ali SM, U.; Rusop, M.; Ibupoto, Z.H.; Willander, M. Effect of different seed solutions on the morphology and electrooptical properties of ZnO NRs. J. Nanomater. 2012. [Google Scholar] [CrossRef]
  74. Zahedi, F.; Dariani, R.S.; Rozati, S.M. Structural, Optical and Electrical Properties of ZnO Thin Films Prepared by Spray Pyrolysis: Effect of Precursor Concentration. Bull Mater Sci 2014, 37, 433–439. [Google Scholar] [CrossRef] [Green Version]
  75. Ting, C.C.; Li, C.H.; Kuo, C.Y.; Hsu, C.C.; Wang, H.C.; Yang, M.H. Compact and vertically-aligned ZnO nanorod thin films by the low-temperature solution method. Thin Solid Films 2010, 518, 4156. [Google Scholar] [CrossRef]
  76. Akhiruddin, A.; Sugianto, S.; Irmansyah, I. The influence of hydrothermal duration on structures and optical properties of ZnO nanoparticles. J. Mater. Phys. Chem. 2015, 2, 34–37. [Google Scholar] [CrossRef]
  77. Malek, M.F.; Mamat, M.H.; Soga, T.; Rahman, S.A.; Bakar, S.A.; Ismail, A.S.; Ruziana, M.; Salman, A.H.A.; Haseeb, A.K.; Mahmood, M.R. Thickness-controlled synthesis of vertically aligned c -axis oriented ZnO nanorod arrays: Effect of growth time via novel dual sonication sol–gel process. Jpn. J. Appl. Phys. 2016, 55. [Google Scholar] [CrossRef] [Green Version]
  78. Mohamed, S.H.; El-Rahman, A.A.; Salem, A.M.; Pichon, L.; El-Hossary, F.M. Effect of rf plasma nitriding time on electrical and optical properties of ZnO thin films. J. Phys. Chem. Solids 2006, 67, 2351–2357. [Google Scholar] [CrossRef]
  79. Farhat, O.F.; Halim, M.M.; Abdullah, M.J.; Ali, M.K.; Allam, N.K. Morphological and structural characterization of single-crystal ZnO nanorod arrays on flexible and non-flexible substrates. Beilstein J. Nanotechnol. 2015, 6, 720–725. [Google Scholar] [CrossRef] [Green Version]
  80. Roza, L.; Rahman MY, A.; Umar, A.A.; Salleh, M.M. Direct growth of oriented ZnO nanotubes by self-selective etching at lower temperature for photo-electrochemical (PEC) solar cell application. J. Alloys Compd. 2015, 618, 153–158. [Google Scholar] [CrossRef]
  81. Benramache, S.; Benhaoua, B.; Bentrah, H. Preparation of transparent, conductive ZnO:Co and ZnO:In thin films by ultrasonic spray method. J. Nanostruct. Chem. 2013, 3, 54. [Google Scholar] [CrossRef]
  82. Subramanian, M.; Tanemura, M.; Hihara, T.; Ganesan, V.; Soga, T.; Jimbo, T. Magnetic anisotropy in nanocrystalline Co-doped ZnO thin films. Chem. Phys. Lett. 2010, 487, 97–100. [Google Scholar] [CrossRef]
  83. Li, Y.; Gong, J.; McCune, M.; He, G.; Deng, Y. I–V characteristics of the p-n junction between vertically aligned ZnO nanorods and polyaniline thin film. Synth. Met. 2010, 160, 499–503. [Google Scholar] [CrossRef]
  84. Jain, A.; Sagar, P.; Mehra, R.M. Band gap widening and narrowing in moderately and heavily doped n-ZnO films. Solid State Electron. 2006, 50, 1420–1424. [Google Scholar] [CrossRef]
  85. Onem, H.; Nadaroglu, H. Preparation and properties of purified phytase from oakbug milkcap (lactarius quietus) immobilised on coated chitosan with iron nano particles and investigation of its usability in food industry. J. Food Nutr. Res. 2014, 2, 938–945. [Google Scholar] [CrossRef] [Green Version]
  86. Srikant, V.; Speck, J.S.; Clarke, D.R. Mosaic structure in epitaxial thin films having large lattice mismatch. J. Appl. Phys. 1997, 82, 4286–4295. [Google Scholar] [CrossRef]
  87. Foo, K.L.; Hashim, U.; Muhammad, K.; Voon, C.H. Sol–gel synthesized ZnO nanorods and their structural and optical investigation for optoelectronic application. Nanoscale Res. Lett. 2014, 9, 429. [Google Scholar] [CrossRef] [Green Version]
Figure 1. Schematic of Modified and Conventional CBD Method.
Crystals 10 00386 g001
Figure 2. FESEM images of ZnO nanorods grown for different precursor concentrations, no air bubbles: (a) 0.01 M, (b) 0.025 M, (c) 0.05 M & (d) 0.075 M and Air Bubble: (e) 0.01 M, (f) 0.025 M, (g). 0.05 M and (h) 0.075 M. The insets at the upper right corner represent the cross-section of ZnO nanorods for each concentration representing the cross-section of nanorods.
Crystals 10 00386 g002
Figure 3. Effect of different precursor concentrations on ZnO nanorods grown using conventional and modified methods: (a) average diameter, (b) average length, (c) aspect ratio and (d) growth rate.
Crystals 10 00386 g003
Figure 4. Effect of precursor concentration on the initial and final growth solution pH values for ZnO nanorods synthesized in the presence and absence of air bubbles.
Crystals 10 00386 g004
Figure 5. Typical EDX analysis of ZnO nanorods for different precursor concentrations in the absence of air bubbles: (a) 0.01 M, (b) 0.025 M, (c) 0.05 M and (d) 0.075 M and the presence of air bubbles: (e) 0.01 M, (f) 0.025 M, (g) 0.05 M and (h) 0.075 M.
Crystals 10 00386 g005
Figure 6. X-ray diffraction (XRD) patterns of ZnO nanorods for different precursor concentrations in the absence of air bubbles: (a) 0.01 M, (b) 0.025 M, (c) 0.05 M and (d) 0.075 M and the presence of air bubbles: (e) 0.01 M, (f) 0.025 M, (g) 0.05 M and (h) 0.075 M.
Crystals 10 00386 g006
Figure 7. Precursor concentrations versus intensity of ZnO nanorods along diffraction peak (002) plane in the presence and absence of air bubbles.
Crystals 10 00386 g007
Figure 8. (a) Variation of crystalline size and (b) full-width at half-maximum FWHM along diffraction peak (002) at precursor concentrations of ZnO nanorods grown in in the presence and absence of air bubbles.
Crystals 10 00386 g008
Figure 9. Variation of dislocation density at several precursor concentrations for both preparation methods, conventional and modified CBD, respectively.
Crystals 10 00386 g009
Figure 10. Effect of precursor concentration on (a) volume of hexagonal cell (b) bond length along diffraction peak (002) of synthesized ZnO nanorods in the presence and absence of air bubbles.
Crystals 10 00386 g010
Figure 11. Optical transmittance spectrum of ZnO nanorods synthesized at different precursor concentration in the (a) absence and (b) presence of air bubbles.
Crystals 10 00386 g011
Figure 12. Precursor concentration versus average transmittance of synthesized ZnO nanorods in the presence and absence of air bubbles.
Crystals 10 00386 g012
Figure 13. Optical transmittance spectrums versus average length of ZnO nanorods grown by both conventional and modified CBD methods at different precursor concentrations.
Crystals 10 00386 g013
Figure 14. Variation of (αhν)2 versus applied energy (hν) of the synthesized ZnO nanorods using conventional CBD method at several precursor concentration, (a) 0.01 M, (b) 0.025 M, (c) 0.05 M and (d) 0.075 M.
Crystals 10 00386 g014
Figure 15. Variation of (αhν)2 versus applied energy (hν) of the synthesized ZnO nanorods using modified CBD method at several concentration, (a) 0.01 M, (b) 0.025 M, (c) 0.05 M and (d) 0.075 M.
Crystals 10 00386 g015
Table 1. Lattice parameters and structure properties of diffraction peak (002) at different precursor concentrations of ZnO nanorods synthesized by conventional CBD method.
Precursor Concentration
(Mol)
I
(a. u)
a
(Å)
c
(Å)
Ƹa%Ƹc%d
(Å)
0.01034.331163.0135.219−7.380.0752.609
0.02534.361563.0115.215−7.450.00792.607
0.05034.424653.0065.206−7.62−0.06912.603
0.07534.402423.0085.209−7.55−0.10062.605
Table 2. Lattice parameters and structure properties of diffraction peak (002) at different precursor concentrations of ZnO nanorods synthesized by modified CBD method.
Precursor Concentration
(Mol)
I
(a. u)
a
(Å)
c
(Å)
Ƹa%Ƹc%d
(Å)
0.01034.363983.0105.214−7.47−0.0152.607
0.02534.385293.0095.212−7.50−0.0492.606
0.05034.4032063.0085.209−7.55−0.1022.605
0.07534.4253003.0065.206−7.61−0.1702.603

