Systematic Investigations on Continuous Fluidized Bed Crystallization for Chiral Separation


1
Max Planck Institute for Dynamics of Complex Technical Systems, Sandtorstraße 1, 39106 Magdeburg, Germany
2
Sulzer Chemtech Ltd., Gewerbestraße 28, 4123 Allschwil, Switzerland
3
Otto von Guericke University Magdeburg, Institute of Process Engineering, 39106 Magdeburg, Germany
*
Author to whom correspondence should be addressed.
Crystals 2020, 10(5), 394; https://0-doi-org.brum.beds.ac.uk/10.3390/cryst10050394
Submission received: 27 April 2020
/
Revised: 8 May 2020
/
Accepted: 11 May 2020
/
Published: 14 May 2020
(This article belongs to the Special Issue Advances in Industrial Crystallization)
Abstract
:A recently developed continuous enantioseparation process utilizing two coupled fluidized bed crystallizers is systematically investigated to identify essential correlations between different operation parameters and the corresponding process performance on the example of asparagine monohydrate. Based on liquid phase composition and product crystal size distribution data, it is proven that steady state operation is achieved reproducibly in a relatively short time. The process outputs at steady state are compared for different feed flow rates, supersaturations, and crystallization temperatures. It is shown that purities >97% are achieved with productivities up to 40 g/L/h. The size distribution, which depends almost exclusively on the liquid flow rate, can be easily adjusted between 260 and 330 µm (mean size) with an almost constant standard deviation of ±55 µm.
1. Introduction
Recently, continuous crystallization has again become the focus of many research activities. Efforts have been made to develop design rules based on comparing it with the corresponding batch process [1,2] or to elucidate basic mechanisms, for example, the impurity incorporation and carryover [3]. Additionally, novel concepts, applying to example slug-flow [4], oscillatory baffled [5,6], Couette-Taylor [7,8] or fluidized bed crystallizers [9,10,11,12], as well as columns with static mixers [1] or coiled flow inverters [13], have been developed lately. These concepts exploiting tubular crystallizers in general are not superior nor applicable for every substance system or separation problem. They have specific benefits and drawbacks [1] compared to the well-known mixed-suspension, mixed-product removal (MSMPR) concept but have given new input to the topic of continuous crystallization and have widened the field of application for the food, agriculture, and pharmaceutical industries.
Fluidized bed crystallizers (FBCs) have recently been successfully exploited in wastewater treatment to recover phosphate [9,10], sulfates and magnesia [11], or boron [12] from diluted aqueous solutions. All of these studies aimed at a full conversion of the pollutant ions in the liquid phase to form a salt and utilized afterward the surface of fluidized, inert particles to collect the fine precipitate. FBCs can be also applied, however, for separations where the substance of interest has a similar or the same concentration as the impurity, as is the case for enantioseparations [14].
This process is then based on Preferential Crystallization, which is often applied as an efficient and inexpensive option for the production of pure enantiomers from the racemic, i.e., 50:50, mixture [2,15]. The classical variant is, nevertheless, an unstable process carried out in the metastable zone of the respective ternary substance system, consisting in this case of two enantiomers, D and L, dissolved in a solvent. Seeds of the desired enantiomer are utilized to selectively remove this species from the liquid phase. Hence, the dissolved mass of the seeded component decreases while the mass fraction of the counter-enantiomer increases. Consequently, the supersaturation of the counter-enantiomer also increases in most cases, which forces this species to nucleate after a certain induction time. A complete separation with the maximum yield is, hence, only achievable if the process is interrupted at the right time shortly before the nucleation.
To increase robustness, productivity, and yield of the classical variant, two opposite Preferential Crystallizations can be carried out in two vessels only connected via a continuous liquid phase exchange [16]. In this way, the selective removal of the enantiomers in the respective crystallizer is counterbalanced and a racemic liquid phase composition maintained, which reduces the risk of nucleation.
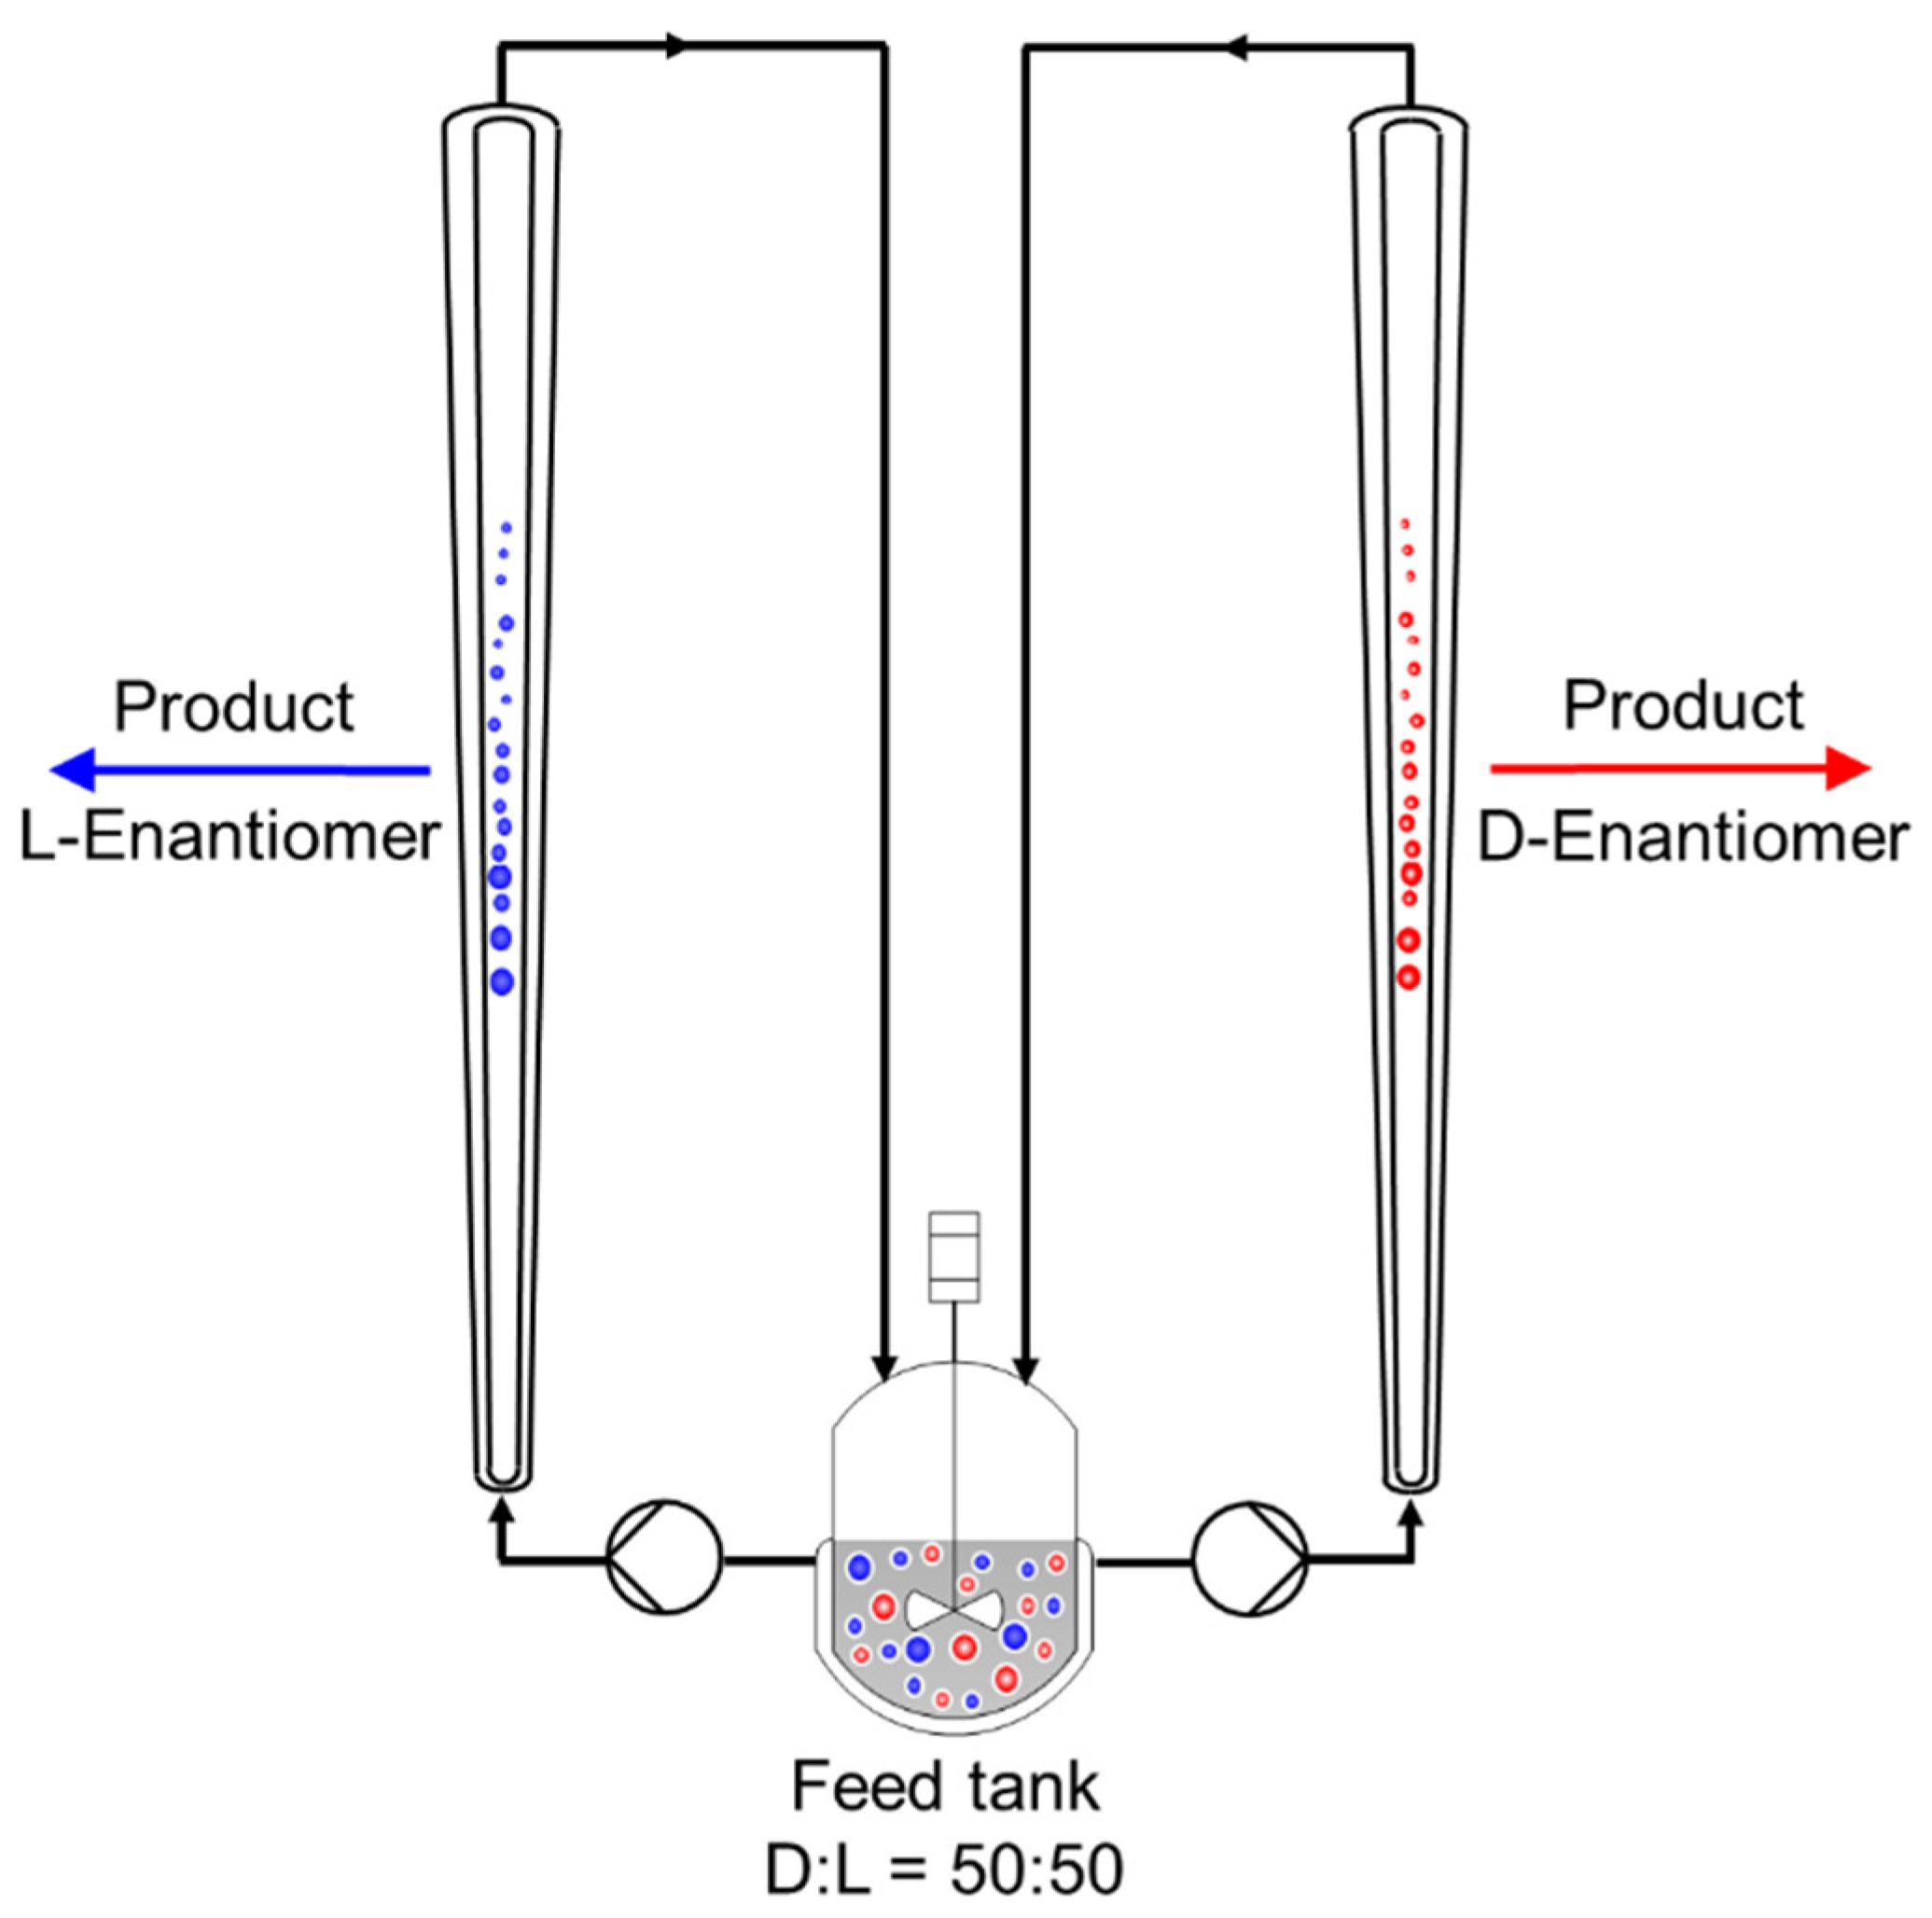
The application of fluidized bed crystallizers together with the coupled Preferential Crystallization principle, as shown in Figure 1, provides two additional benefits. Firstly, the flow rate of the feed entering the columns from the bottom drags small crystals out of the process at the top. Hence, contamination of the product can be avoided to a certain extend even if the counter enantiomer nucleates since the nuclei follow the liquid flow. Secondly, a product classification can be achieved by a conical shape of the columns. Then the liquid velocity profile varies over the height of the crystallizers and only a specific crystal size is present at the product outlet. This process allows, hence, for a continuous production of pure enantiomers with a high productivity and a specific, adjustable product crystal size. In previous studies, the feasibility of steady-state operation of this process was shown without considering the process dynamics [17] and only based on the liquid phase composition for a specific operation point [14,17]. However, no systematic investigation also based on the periodically harvested product crystals has been conducted.
In this work we, first, prove the achievability of steady-state operation on the example of D-/L-asparagine monohydrate based on the liquid phase composition as well as the periodically harvested product crystal size distribution. Furthermore, the required startup time to reach the steady-state will be estimated for different operation conditions and the high reproducibility of the results will be demonstrated. On this basis, consecutively the dependence of productivity, purity, and yield on the process conditions, feed flow rate, supersaturation, and crystallization temperature, will be systematically studied.
2. Materials and Methods
2.1. Substances
For the fluidized bed crystallization experiments, racemic asparagine monohydrate (rac Asn∙H2O) and the respective enantiopure D- and L-Asn∙H2O were purchased from Sigma Aldrich (Purity >99%, Steinheim, (Baden-Württemberg), Germany). Both were used without further treatment. Deionized water (Millipore, Milli-Q Advantage A10) was used as solvent and for washing of the crystalline product together with ethanol, which was purchased from VWR Chemicals (Purity >99.7%, Fontenay-sous-Bois, France).
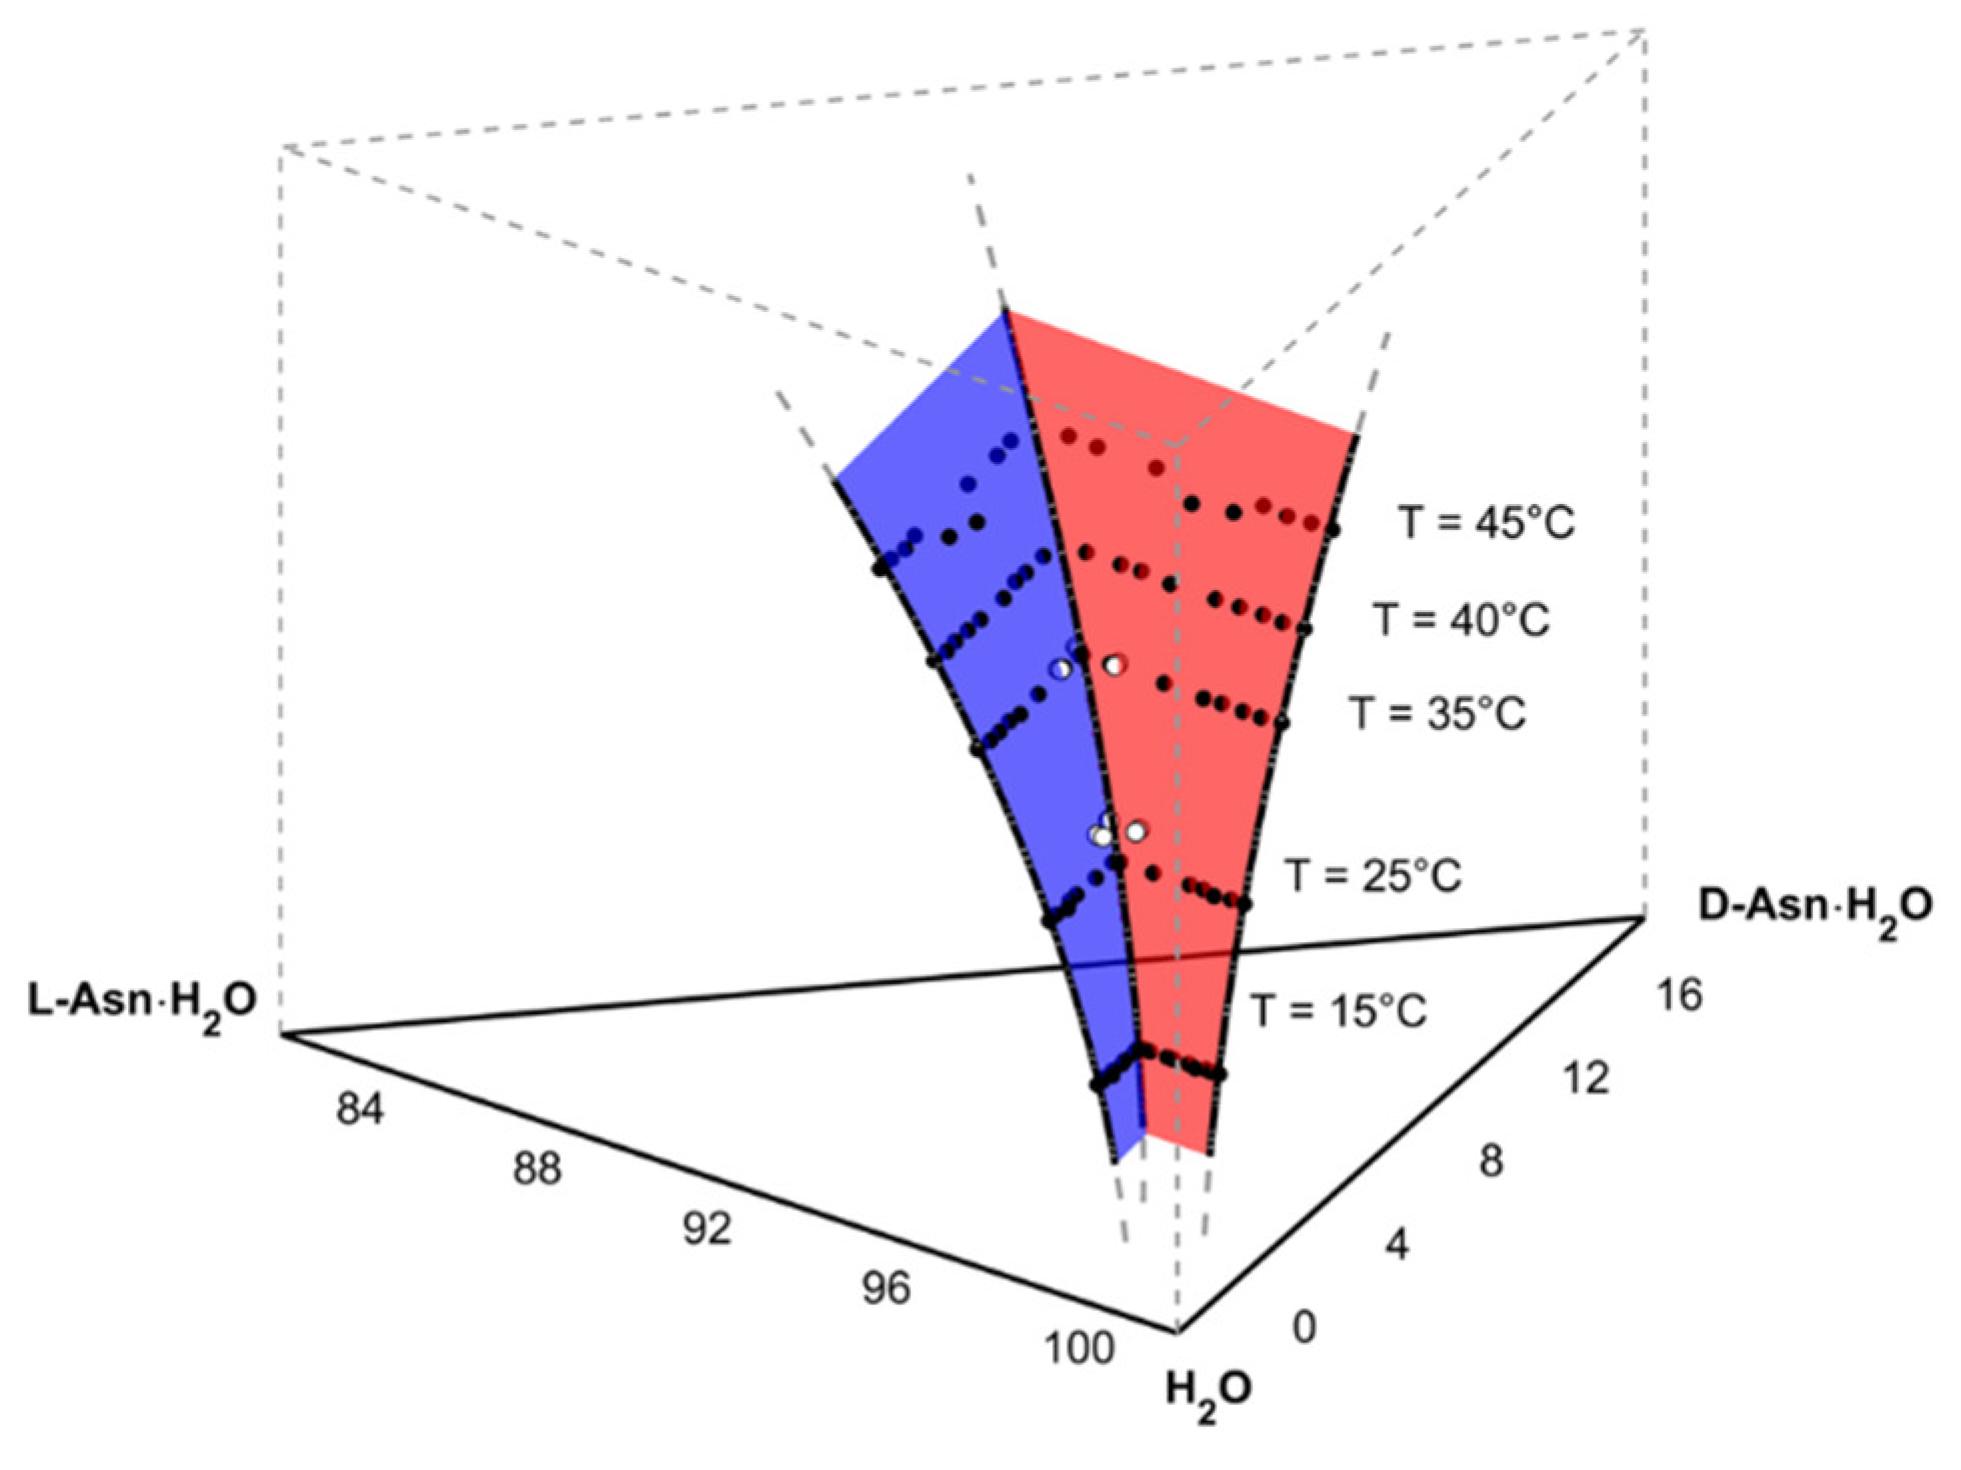
Solubility data of the D-/L-Asn∙H2O/ water system was mainly determined in [18]. The accuracy was confirmed by additional measurements in [19] where also the parameters of polynomial (Equation (1)) were estimated to describe the saturation concentration, xsat, as a function of temperature and composition. As shown in Figure 2, asparagine monohydrate forms a conglomerate, as a requirement for the application of Preferential Crystallization directly from a supersaturated racemic liquid phase.
where
for
T = temperature [°C]
x = mass fraction [-]
i = D-Asn∙H2O, L-Asn∙H2O and j = D-Asn∙H2O, L-Asn∙H2O ≠ i
The selective removal of the seeded enantiomer during Preferential Crystallization leads to an altering of the liquid phase composition during the course of the separation process. Hence, the driving forces of both enantiomers change and a different supersaturation calculation also need to be applied. Thus, Equation (2) is utilized in the present study to describe the supersaturation, S, as a function of temperature and composition.
for
i = D-Asn∙H2O, L-Asn∙H2O and j = D-Asn∙H2O, L-Asn∙H2O ≠ i
2.2. Experimental Setup
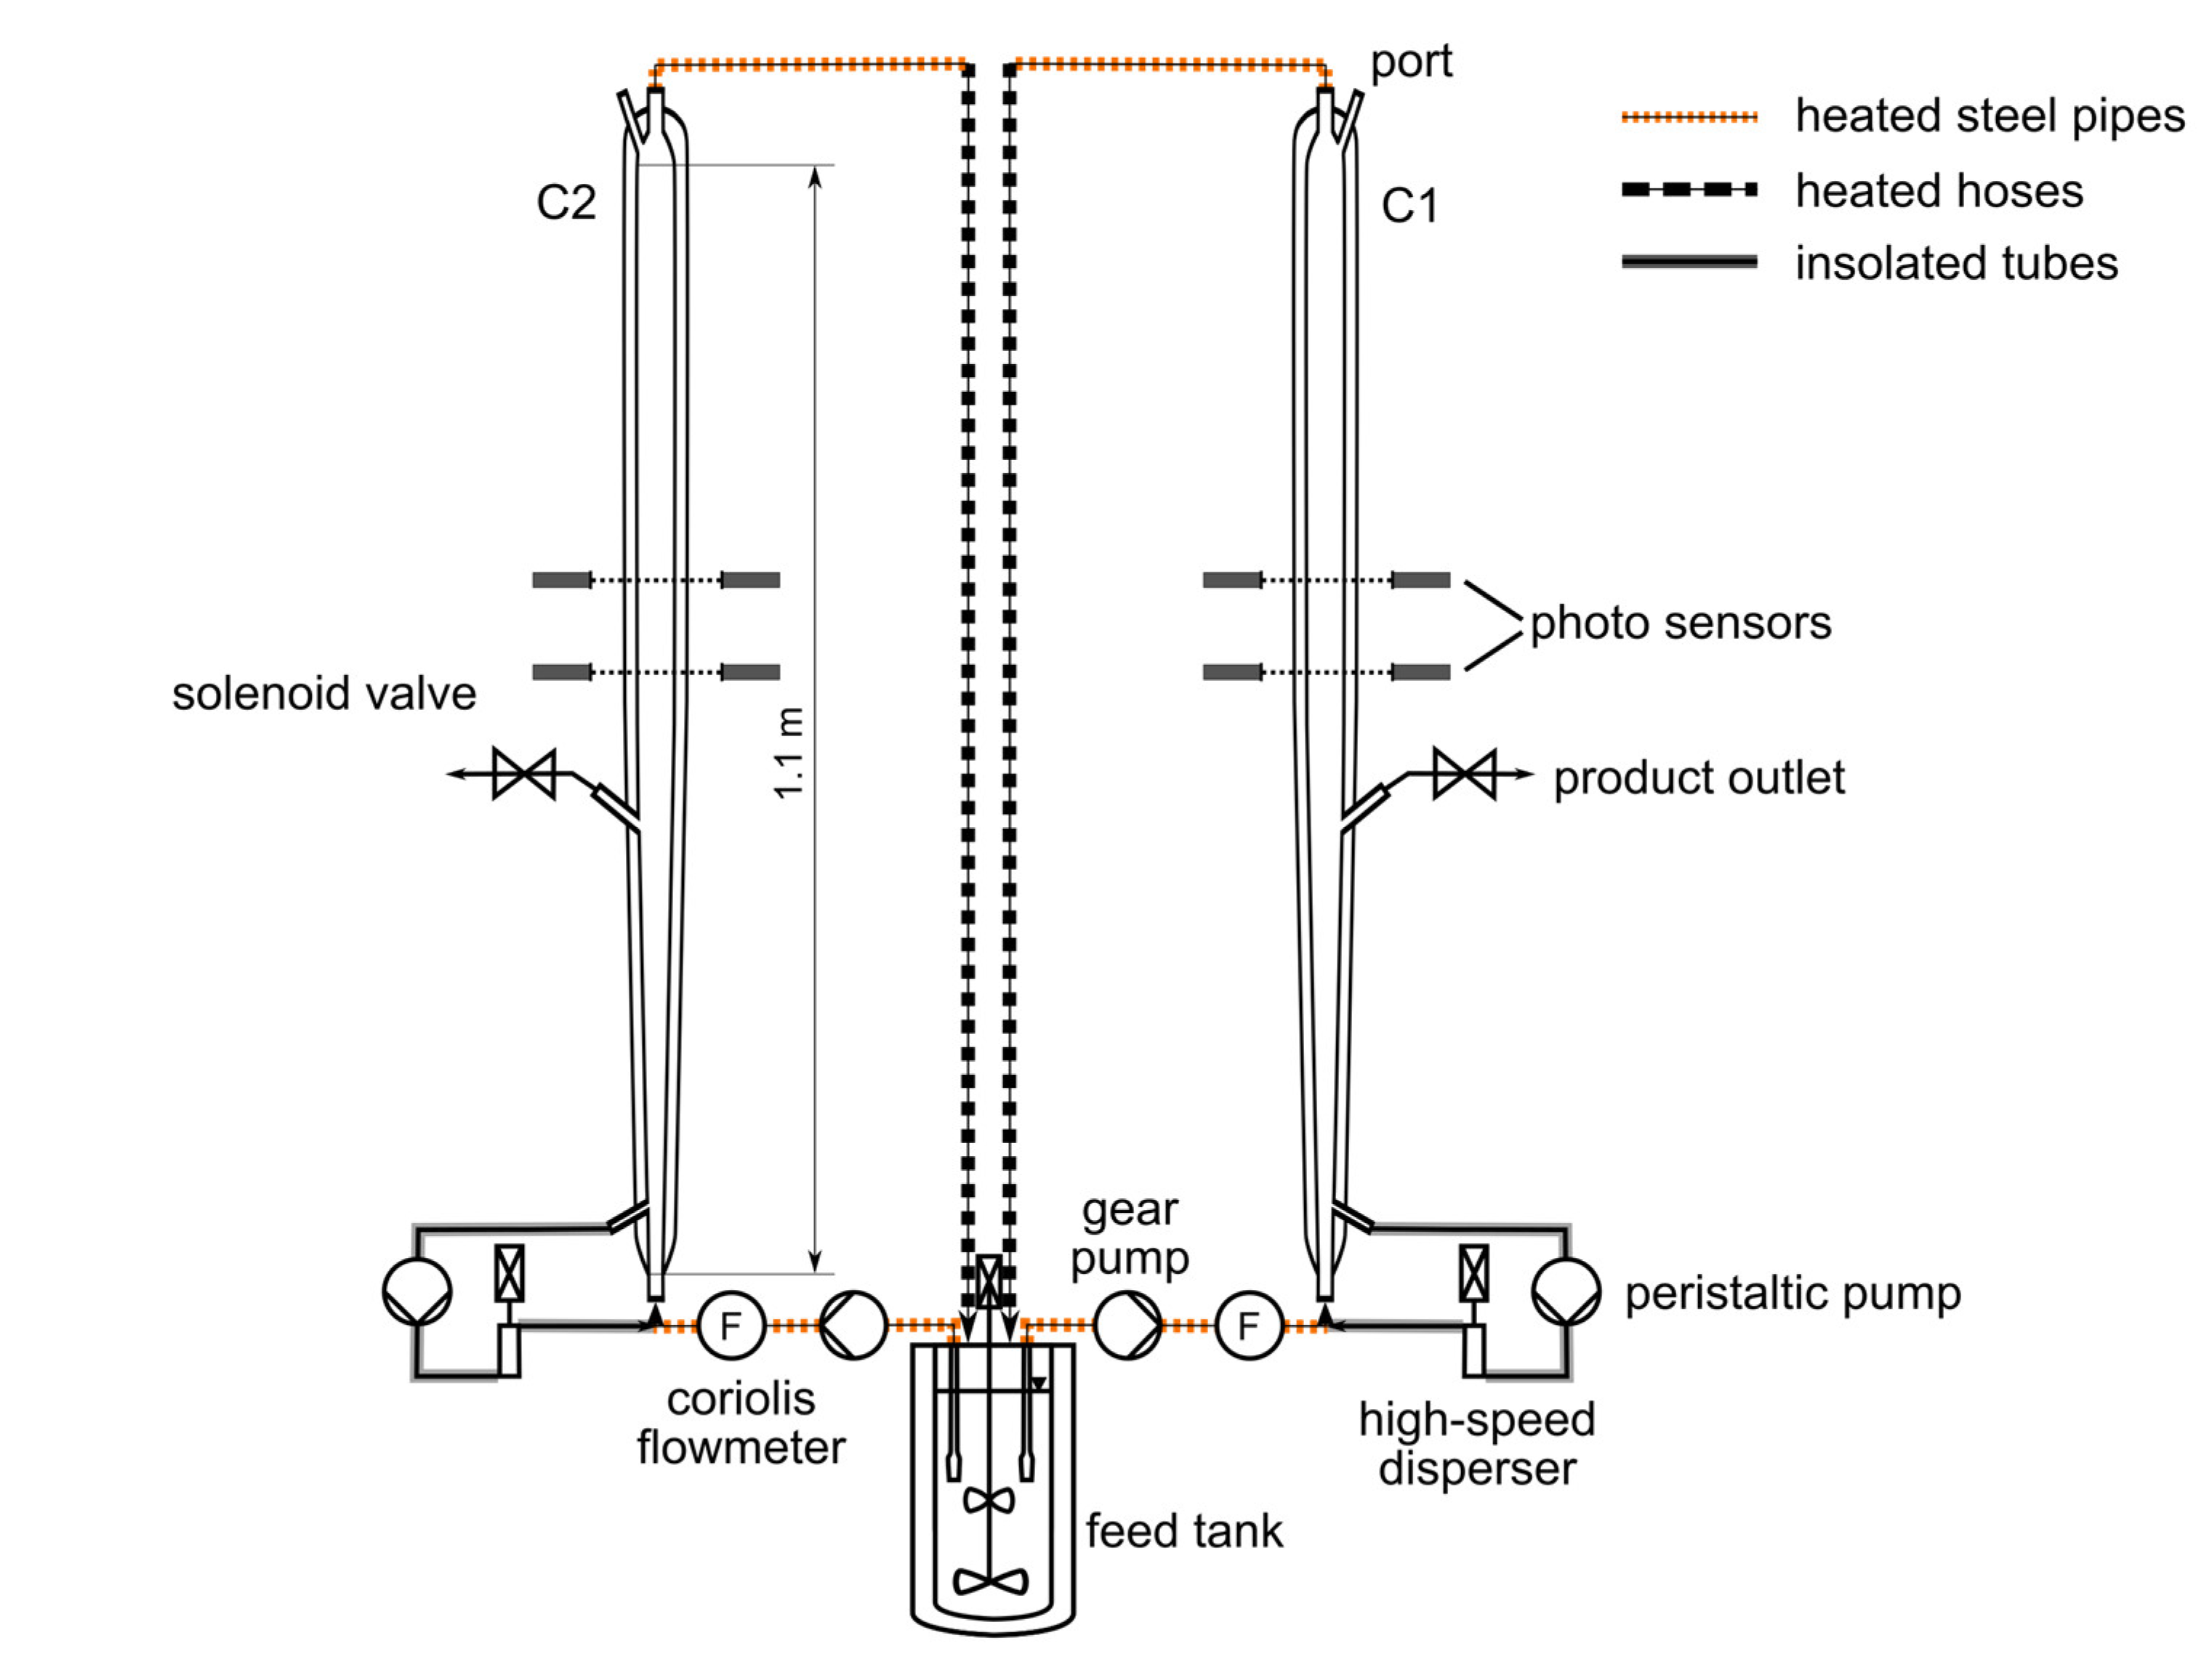
All separation experiments were performed in the setup shown in Figure 3. The plant consisted of two tubular crystallizers (C1 and C2, Figure 3) with an individual volume of approximately 0.5 L and a total height of 1130 mm. Each double-jacketed tubular crystallizer was composed of a conical section in the lower part and a cylindrical section in the upper part of the columns. Thus, the fluid velocity of a liquid phase passing through the crystallizers changes with the height of the columns due to the increasing diameter in the conical section. At the transition between the upper and lower section, where the diameter is the largest, the fluid velocity becomes constant again over the height of the cylindrical part.
The temperature inside the columns was measured at the inlet, in the middle, and at the outlet via resistance thermometers (Pt100s). Temperature control was ensured by two thermostats connected to the respective middle Pt100s. In this study, the middle temperature is referred to as the crystallization temperature for the sake of simplicity, even though a temperature gradient will be present over the height of the columns due to the fluid flow.
Both crystallizers were coupled via heated steel pipes and flexible heated hoses with a double-jacketed feed tank on the scale of 7.5 L. A propeller-type stirrer was utilized in this tank during the separation experiments to suspend a certain excess mass of racemic solid phase in a solution saturated at a defined initial temperature. This excess of solid phase served to re-saturate the depleted mother liquors from the crystallizers during the process to ensure constant initial conditions at the inlet of the columns. The temperature within the feed tank was again measured by a Pt100 and controlled by a thermostat.
Clear saturated racemic solution was withdrawn during the process from the feed tank via glass filters and was pumped continuously from the bottom through the tubular crystallizers using gear pumps. The rotation speed of these gear pumps was controlled by Coriolis mass flowmeters to ensure a constant volumetric flowrate.
To harvest the product, each column had a product outlet at a height of 365 mm, close to the end of the conical section. The product removal was realized periodically due to the scale of the plant, using solenoid valves, which were controlled by photoelectric barriers as described in the next section.
Due to the mild mixing conditions of the particulate phase, secondary nucleation will not be sufficient to counterbalance the loss of crystals of the periodically continuous product removal. Hence, a continuous seeding strategy was necessary, which also supports Preferential Crystallization by providing enantiopure crystals. Thus, the largest particles present at the bottom of the crystallizer columns were withdrawn via peristaltic pumps into a bypass. They were pumped, subsequently, through high-speed dispersers, which were utilized as mills working on the rotor-stator principle. Afterward, the ground crystals were fed back as seed material to the process.
2.3. Experimental Procedures and Operation Parameters
In the following the experiments performed are described with their operation parameters and objectives, and performance parameters for process evaluation are introduced (Section 2.3.1). Since starting and operation procedure is crucial for achieving a successful continuous racemate resolution, the procedure along each experiment, especially the crystallization progress and the periodical product removal, are explained and the used analytics are depicted (Section 2.3.2)
2.3.1. Study of Operation Parameters and Process Evaluation
Altogether, seven experiments were planned and carried out for 8 h in this first attempt to systematically investigate the influence of the operation conditions on the process performance. In continuation of the previous study [14], a saturation temperature of 35 °C was chosen for most of the experiments (Tsat, Table 1). The first three processes (Exps. 1–3, Table 1) were used to determine the operation window of the process with respect to the crystallization temperature (Tcrys, Table 1).
The data of Exp. 2 were additionally utilized to determine the required time to reach steady-state operation. It was found that after two product withdrawals (process time approximately 2 h) all process characteristics became constant. Hence, some of the later experiments were split into two periods, where two sets of process parameters (compared, for example, to the volume flow of Exp. 4) were tested for 4 h each, to enhance the time efficiency of the investigation. Exps. 4 and 5 were carried out to evaluate stepwise the influence of the volume flow rate (F, Table 1) between 10 and 14 L/h. In Exp. 6, the supersaturation was kept constant but the saturation and crystallization temperature were reduced by approximately 10 K to investigate the influence of reduced crystallization kinetics. In Exp. 7 the central test point was run again, Tsat = 35 °C, Tcrys = 30 °C, and F = 12 L/h, to evaluate the standard deviation of all process characteristics for a longer time period.
Every reached operation point was evaluated based on the normalized volume related product crystal size distributions, q3 (Equation (3)), their mean sizes, (Equation (4)), and their respective standard deviation, sL3 (Equation (5)), as well as the achieved yields, Y, and productivities, Pr (Equations (6) and (7), respectively) calculated from the product masses and the time window between two withdrawals.
where
where
| µk = mass fraction of sieve class k [-] |
| zk = characteristic length of sieve class k [µm] |
| Δzk = width of sieve class k [µm] |
| mprod = mass of withdrawn product crystals [g] |
| mtheo = theoretical maximum of product mass [g] |
| Δt = time window between two withdrawals [h] |
| Vtot = total volume of tubular crystallizer [L] |
| (C1 = 0.478 L, C2 = 0.511 L) |
2.3.2. Start and Operation Procedure, Crystallization Progress, and Analytics Used
The starting point of all experiments was the preparation of the feed suspension. Therefore, the solvent was filled into the feed tank and circulated via the gear pumps through the columns and via the peristaltic pumps through the comminution bypasses. The required racemic solute mass for saturating the aqueous solution at the desired temperature of each experiment (Table 1, Tsat) plus 200 g racemic excess solid was afterward filled in the feed tank, and the suspension heated to Tsat, which was kept constant throughout the whole experiments. To avoid any risk of nucleation within the columns during the preparation step, the coolant temperature of the double jackets was set to one Kelvin above Tsat. After the mother liquor within the feed tank reached Tsat, the coolant temperature of the double jackets was set to one Kelvin below Tsat. In parallel, the heating hoses were set to 40 °C to prevent any nucleation or clocking within the tubes: all other steel pipes (Figure 3) were appropriately heat traced to prevent clocking. The liquid flow was stopped for seeding each column from the top (Figure 3, port) with a certain mass (Table 1, mSeed) of one of the pure, crystalline enantiomer once the respective temperatures were reached. In all experiments, crystallizer C1 was seeded with D-Asn∙H2O and crystallizer C2 with L-Asn∙H2O. Immediately after seed addition, the pumps were started again to fluidize the present crystals and to prevent nucleation in the stagnant fluid phase. After this initial seeding, both crystallizers were subsequently cooled to the planned operation temperature (Table 1, Tcrys). The fluidized seed crystals in both columns started to grow according to the present supersaturation. Hence, they settled constantly due to their increasing mass towards the crystallizers’ bottoms. All crystals, which reach the fluid phase inlet, were withdrawn into the inline seeding bypass, where they were ground. The generated crystal fragments were fed back to the process merged with the liquid inlet stream.
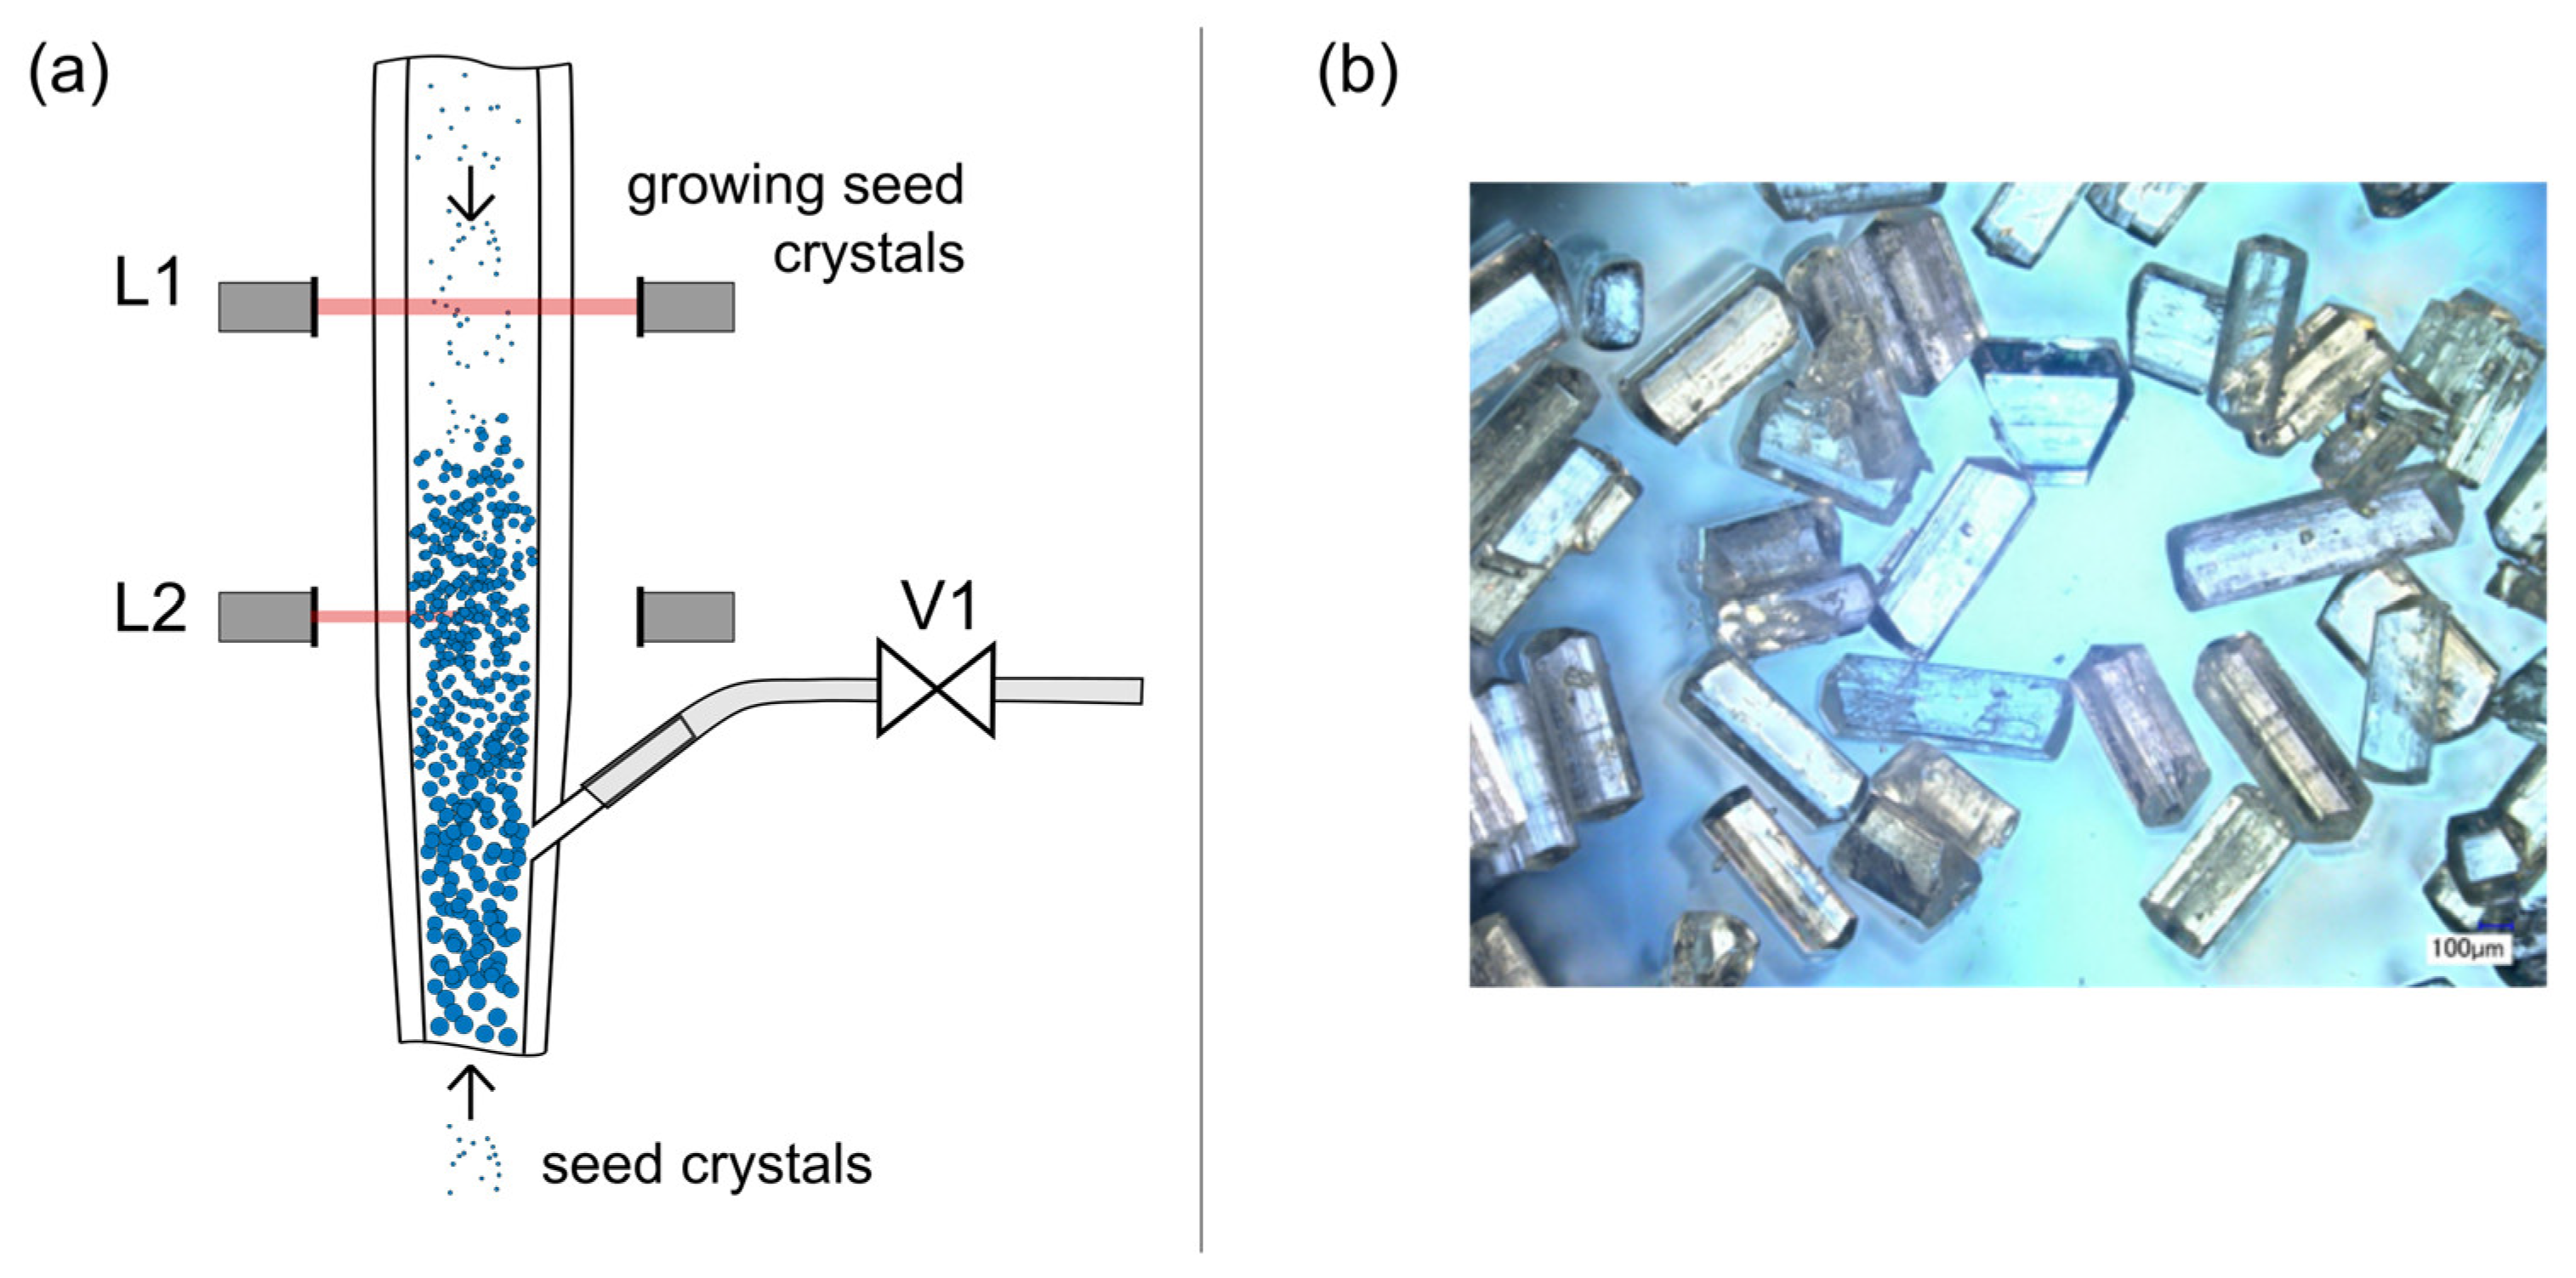
If the process conditions are chosen appropriately, the crystal fragments will grow (Figure 4a) large enough to settle within the cylindrical part and thus stay in the process. Then the overall crystal mass increases and the process progresses. The growing seeds start to settle, subsequently, on the top of the initial solid mass and the crystal bed increases in height.
The product withdrawal was initiated when the crystal bed first blocks the upper photoelectric barrier (L1, Figure 4a). The solenoid valve (V1, Figure 4a) was opened at this point and the crystal product is harvested until the lower photoelectric barrier (L2, Figure 4a) was not blocked by the fluidized crystal phase anymore. Afterward, the valves were closed and the crystallization progressed until the crystal bed height was large enough for the next product withdrawal. This periodic procedure continued and the process progressed towards its dynamic steady-state. Immediately after the product withdrawal, the product crystals were filtered and washed with an ethanol-water mixture (40 wt% EtOH, 60 wt% H2O). The dried product crystals (Figure 4b) were afterwards analyzed via high performance liquid chromatography (HPLC), X-ray powder diffraction (XRPD), and sieve analysis to evaluate each operation point with respect to process performance parameters (purity, yield, productivity, and size distribution, Equations (3)–(7)). The specifications of the applied analytics are given in Table 2.
The recycled, concentration-depleted mother liquor causes partial dissolution of the solid racemic excess within the feed tank. To minimize additional distortions of the feed concentration, and thus of the process, a piecewise addition of new solid excess material is required. Since the average product crystal mass of one withdrawal is approximately 20 g per column, subsequently, 50 g of racemic solid excess material was added to the feed tank after every product withdrawal.
3. Results and Discussion
3.1. Continuous Operation and Steady-State Analysis
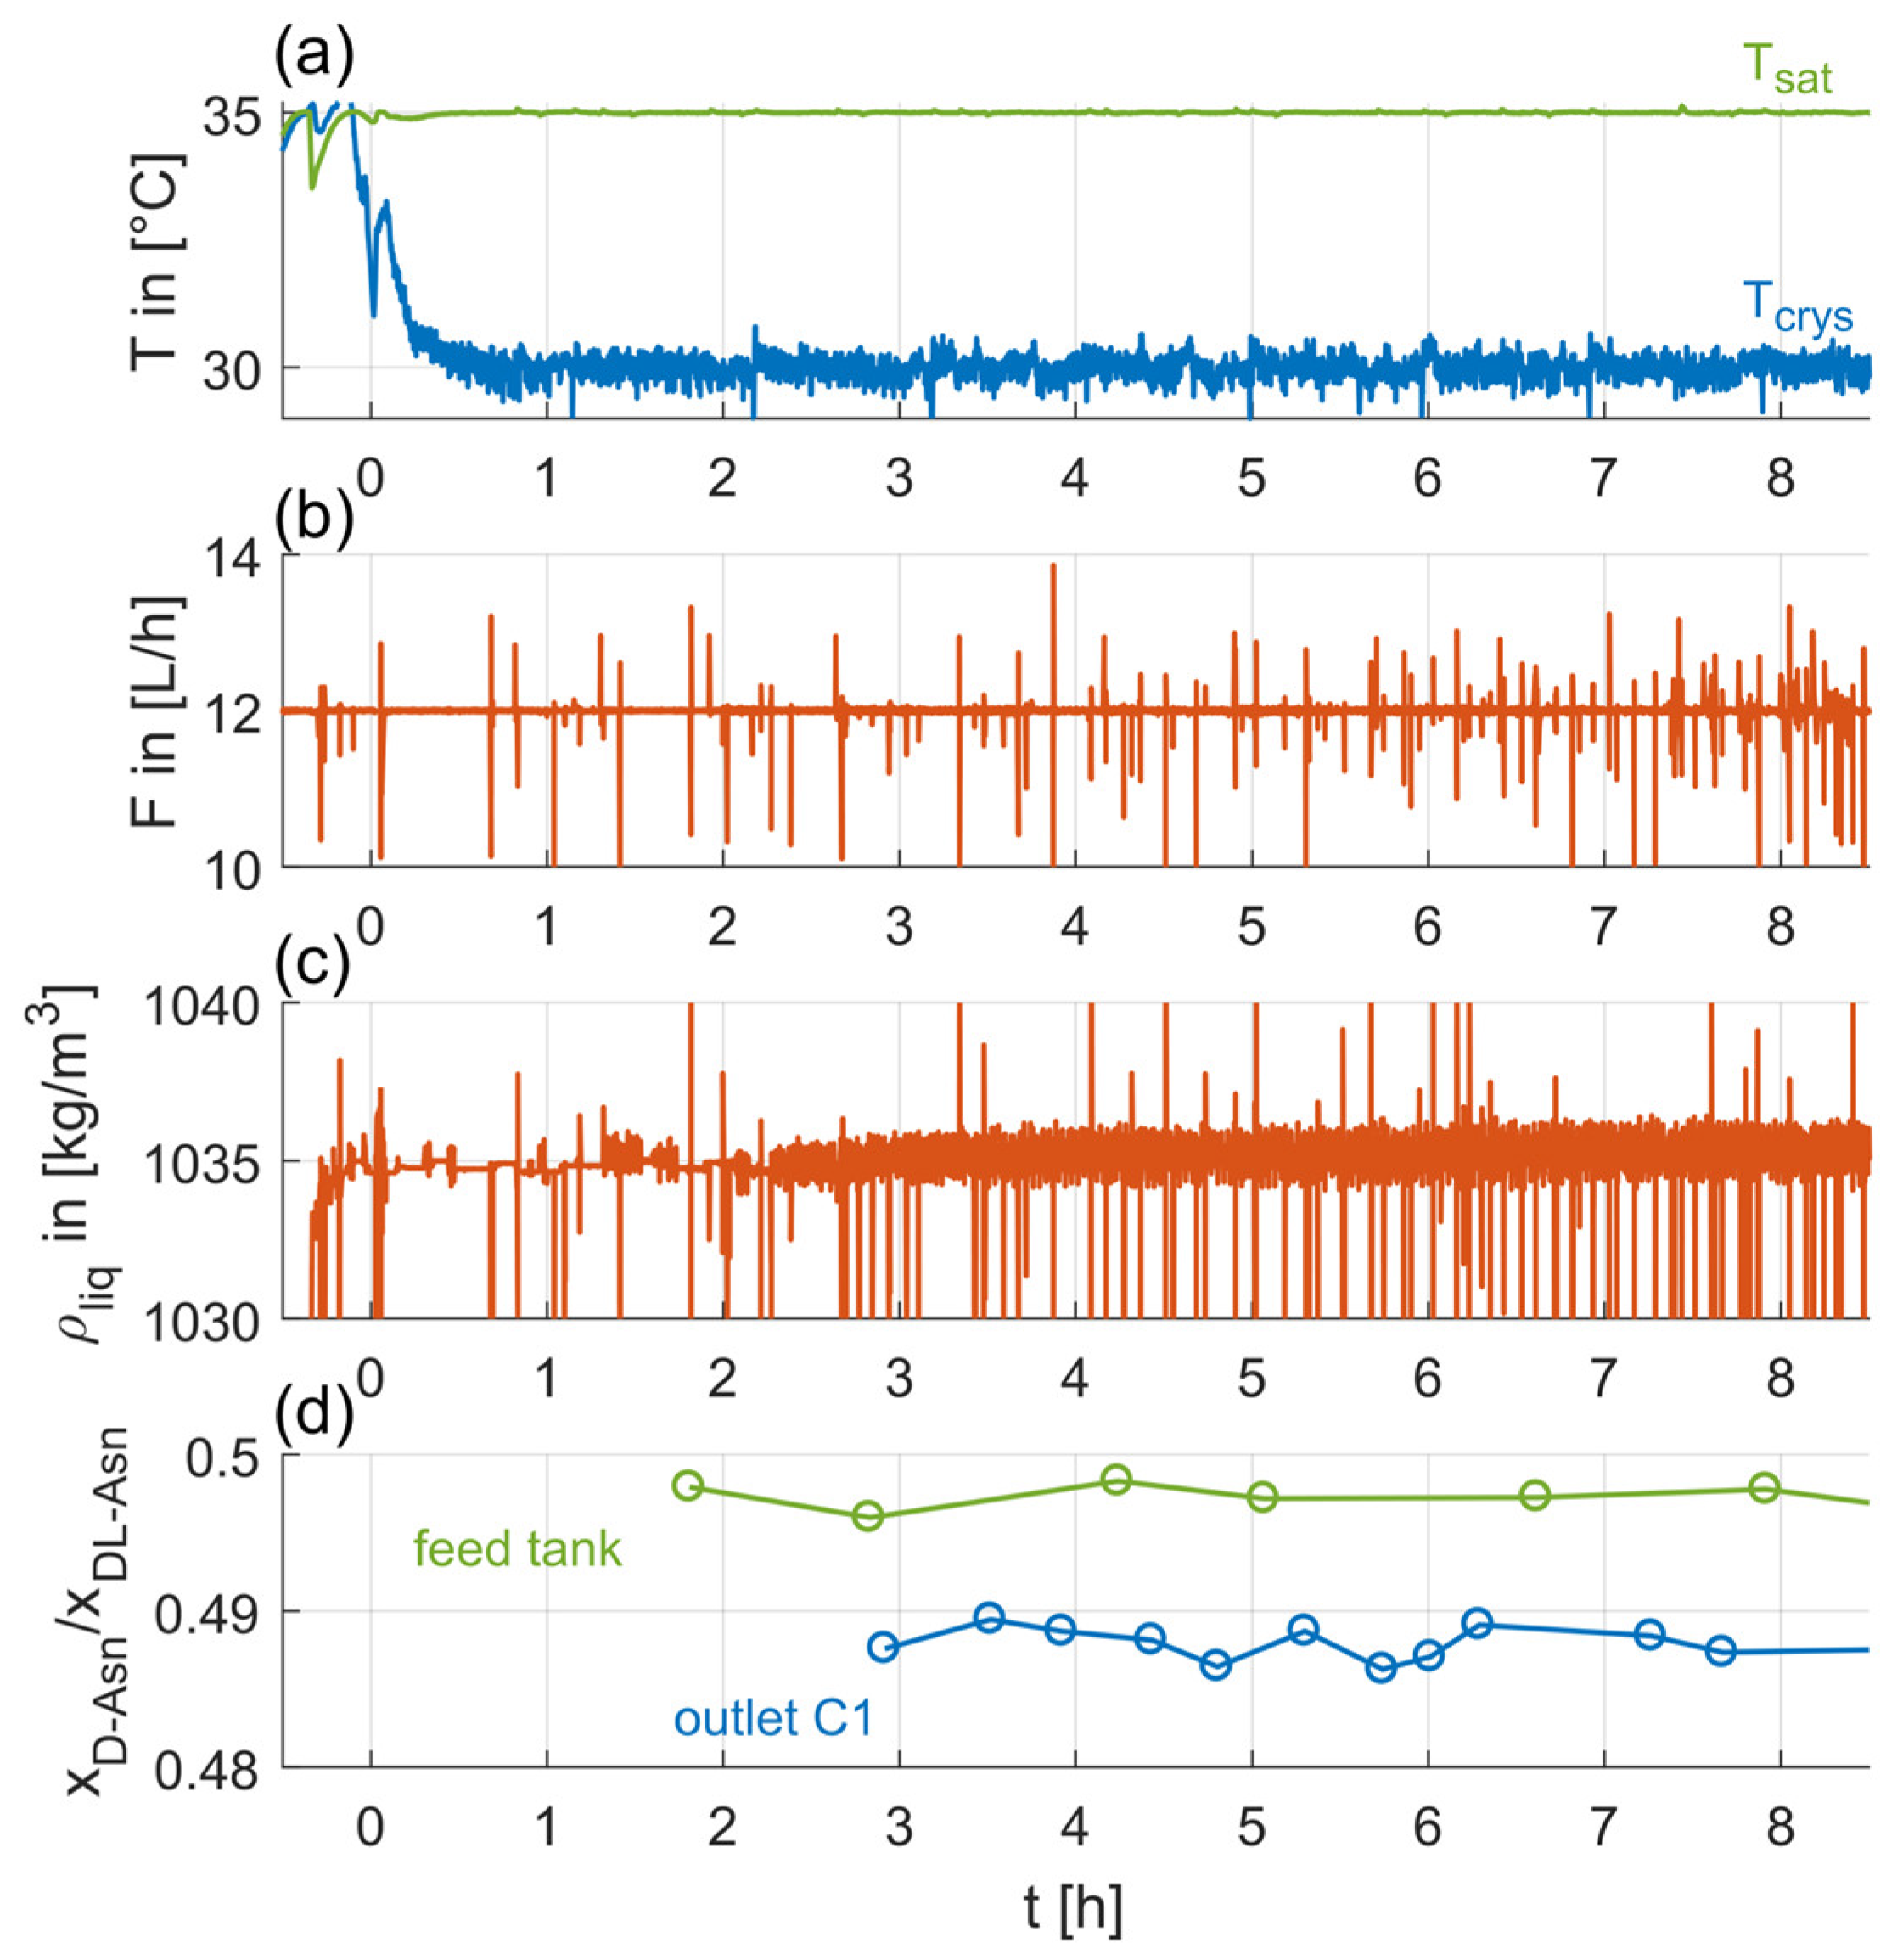
Along the continuous operation, quantities of the liquid phase, such as volumetric flowrate and local temperatures, were measured and, as seen in Figure 5a,b, controlled appropriately. Figure 5 also depicts the temporal evolution of the fluid density (Figure 5c), measured via the Coriolis mass flowmeter, and the D-Asn enantiomeric proportion of the liquid phase within the feed tank and at the crystallizer outlet (Figure 5d), determined via HPLC offline samples. As seen in Figure 5c,d, these measured quantities also show no discernible trends during the whole experiment. Thus, the applied operation procedure successfully prevents fluctuations or depletions of the feed concentration. Furthermore, the depleted D-Asn enantiomeric proportion at the crystallizer outlet indicates the selective removal of the seeded enantiomer due to the Preferential Crystallization.
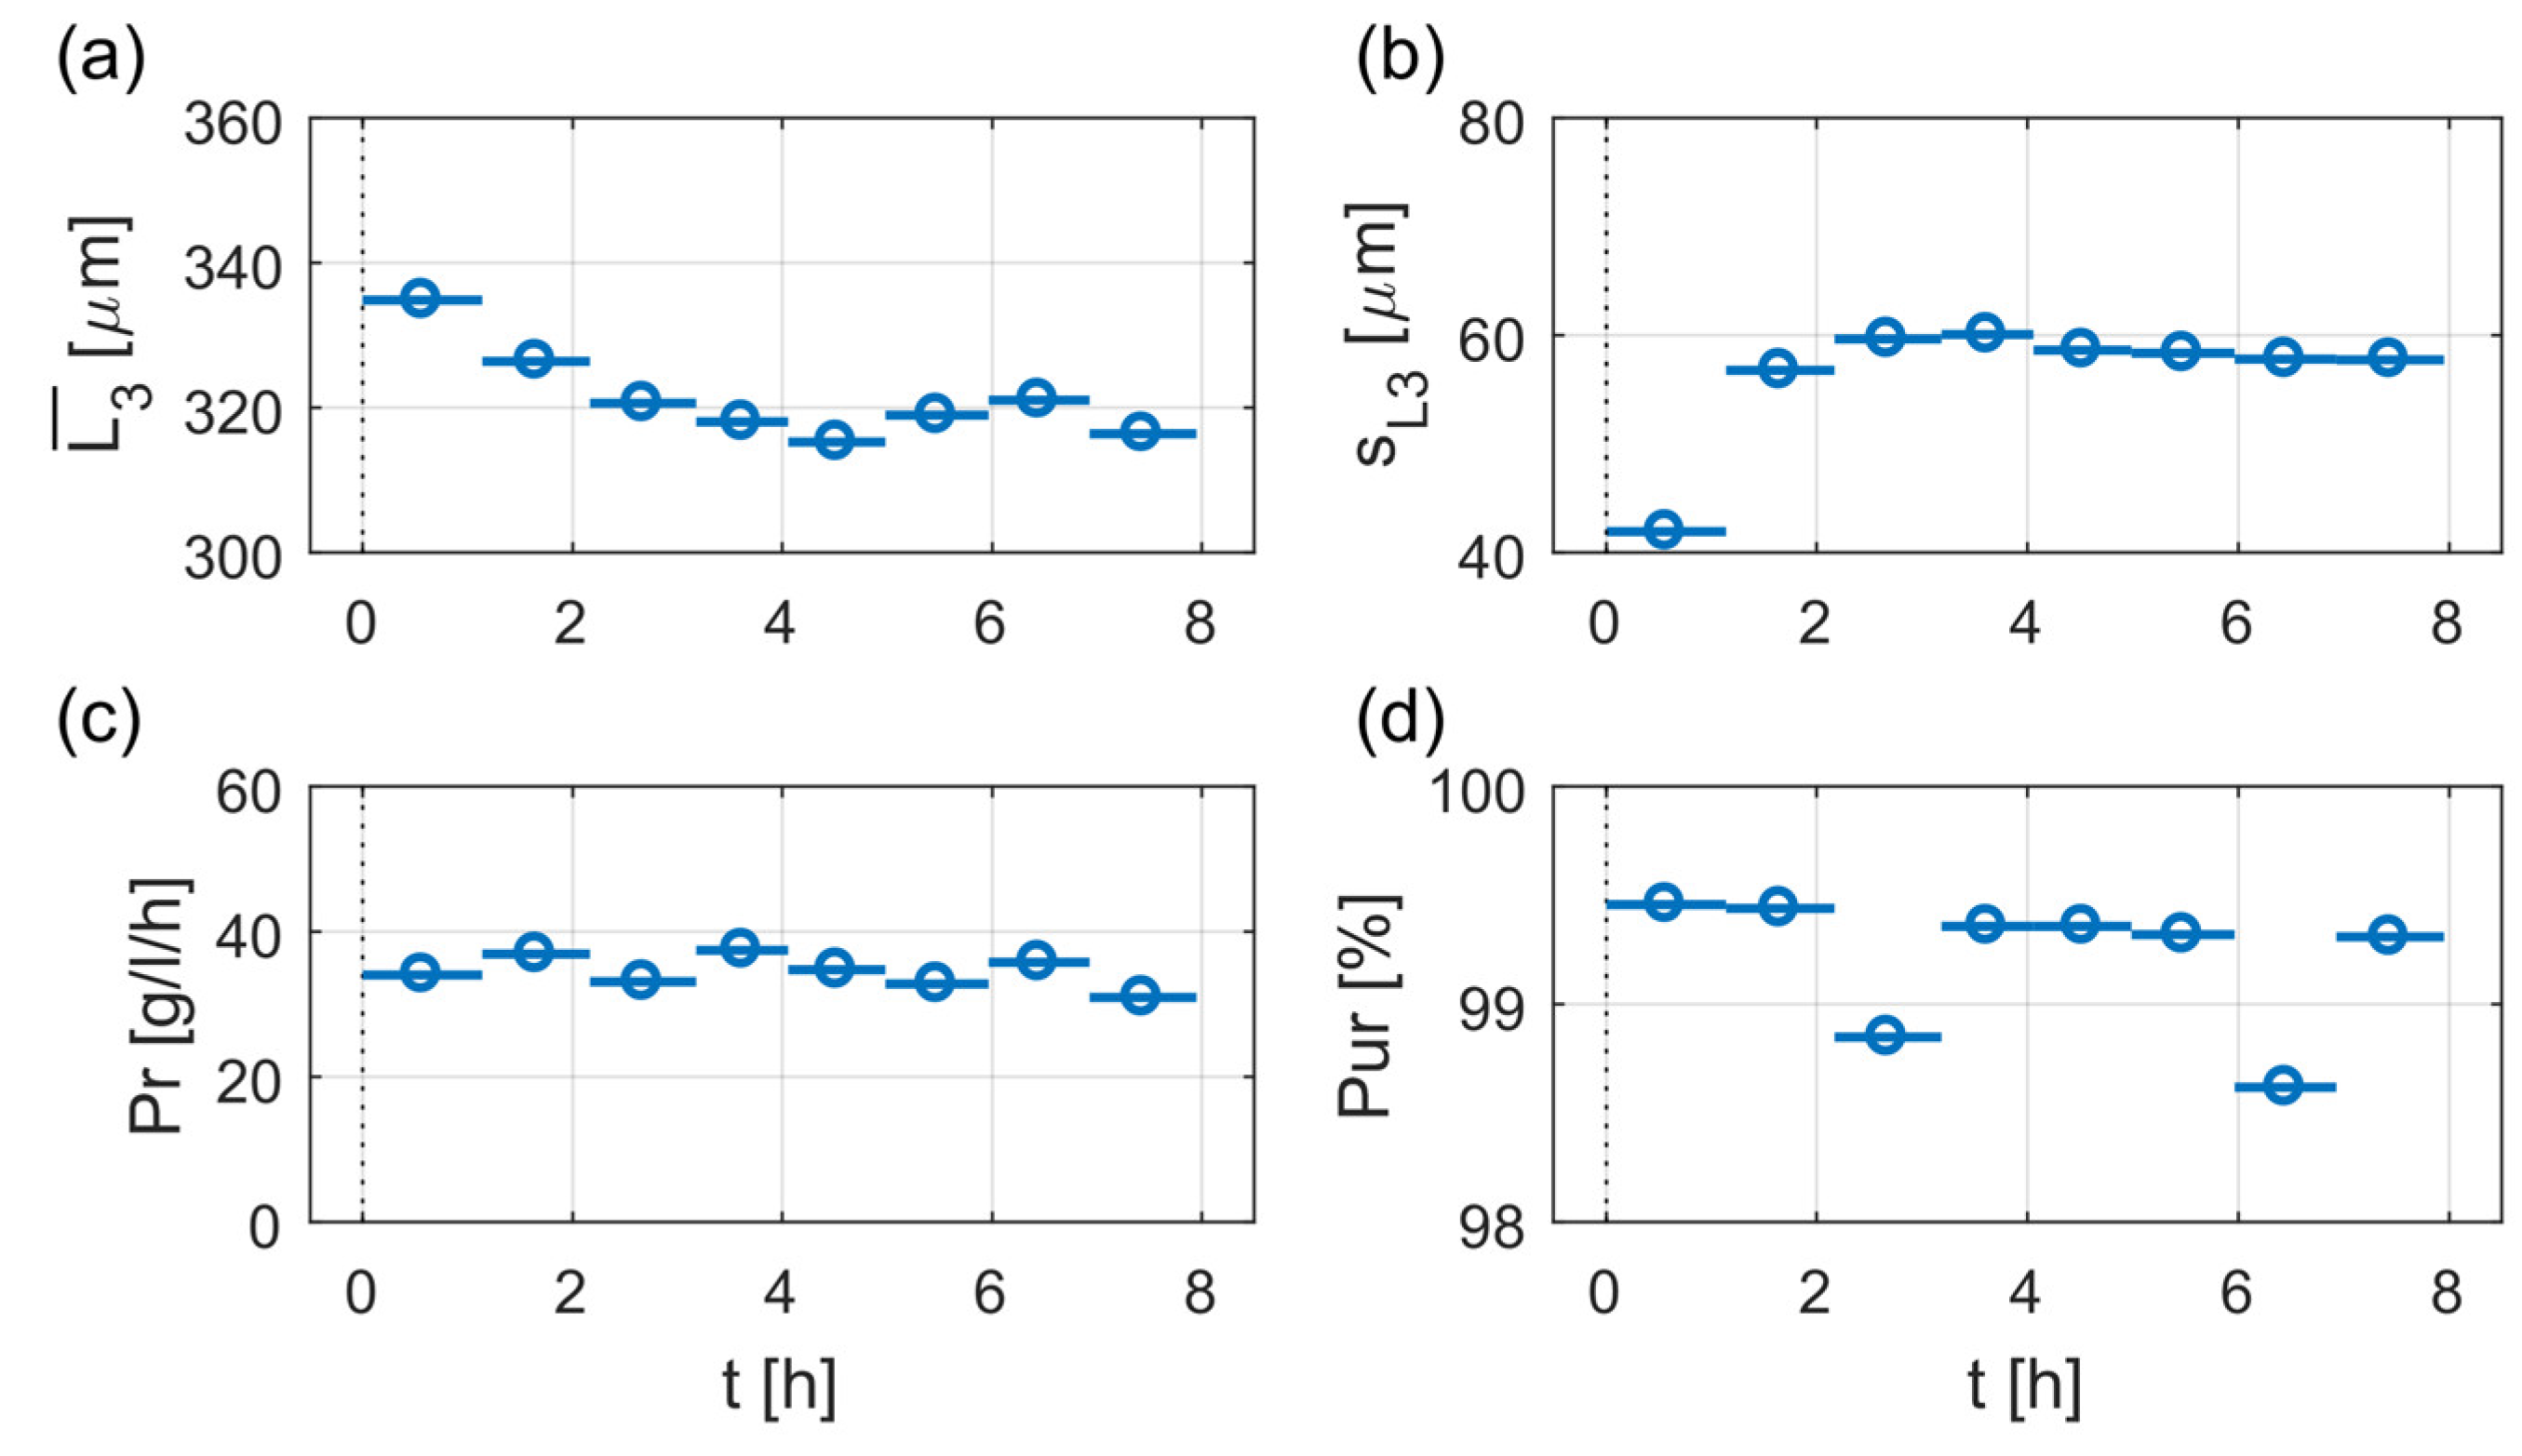
The temporal evolution of the above introduced process performance parameters, product crystal mean size, , standard deviation of the product crystal size distribution, sL3, and productivity, Pr, are illustrated in Figure 6 for Exp. 7. As shown in Figure 6, all process performance characteristics reached almost constant values after approximately 2 h process time. During the following 6 h operation time the mean product crystal size varies between 315 to 321 µm with a respective standard deviation between 57 and 60 µm. The calculated productivities range in the same time between 30 and 37 g/L/h, while the product purity exceeds 98% for the whole experiment.
3.2. Reproducibility of Steady-State Results
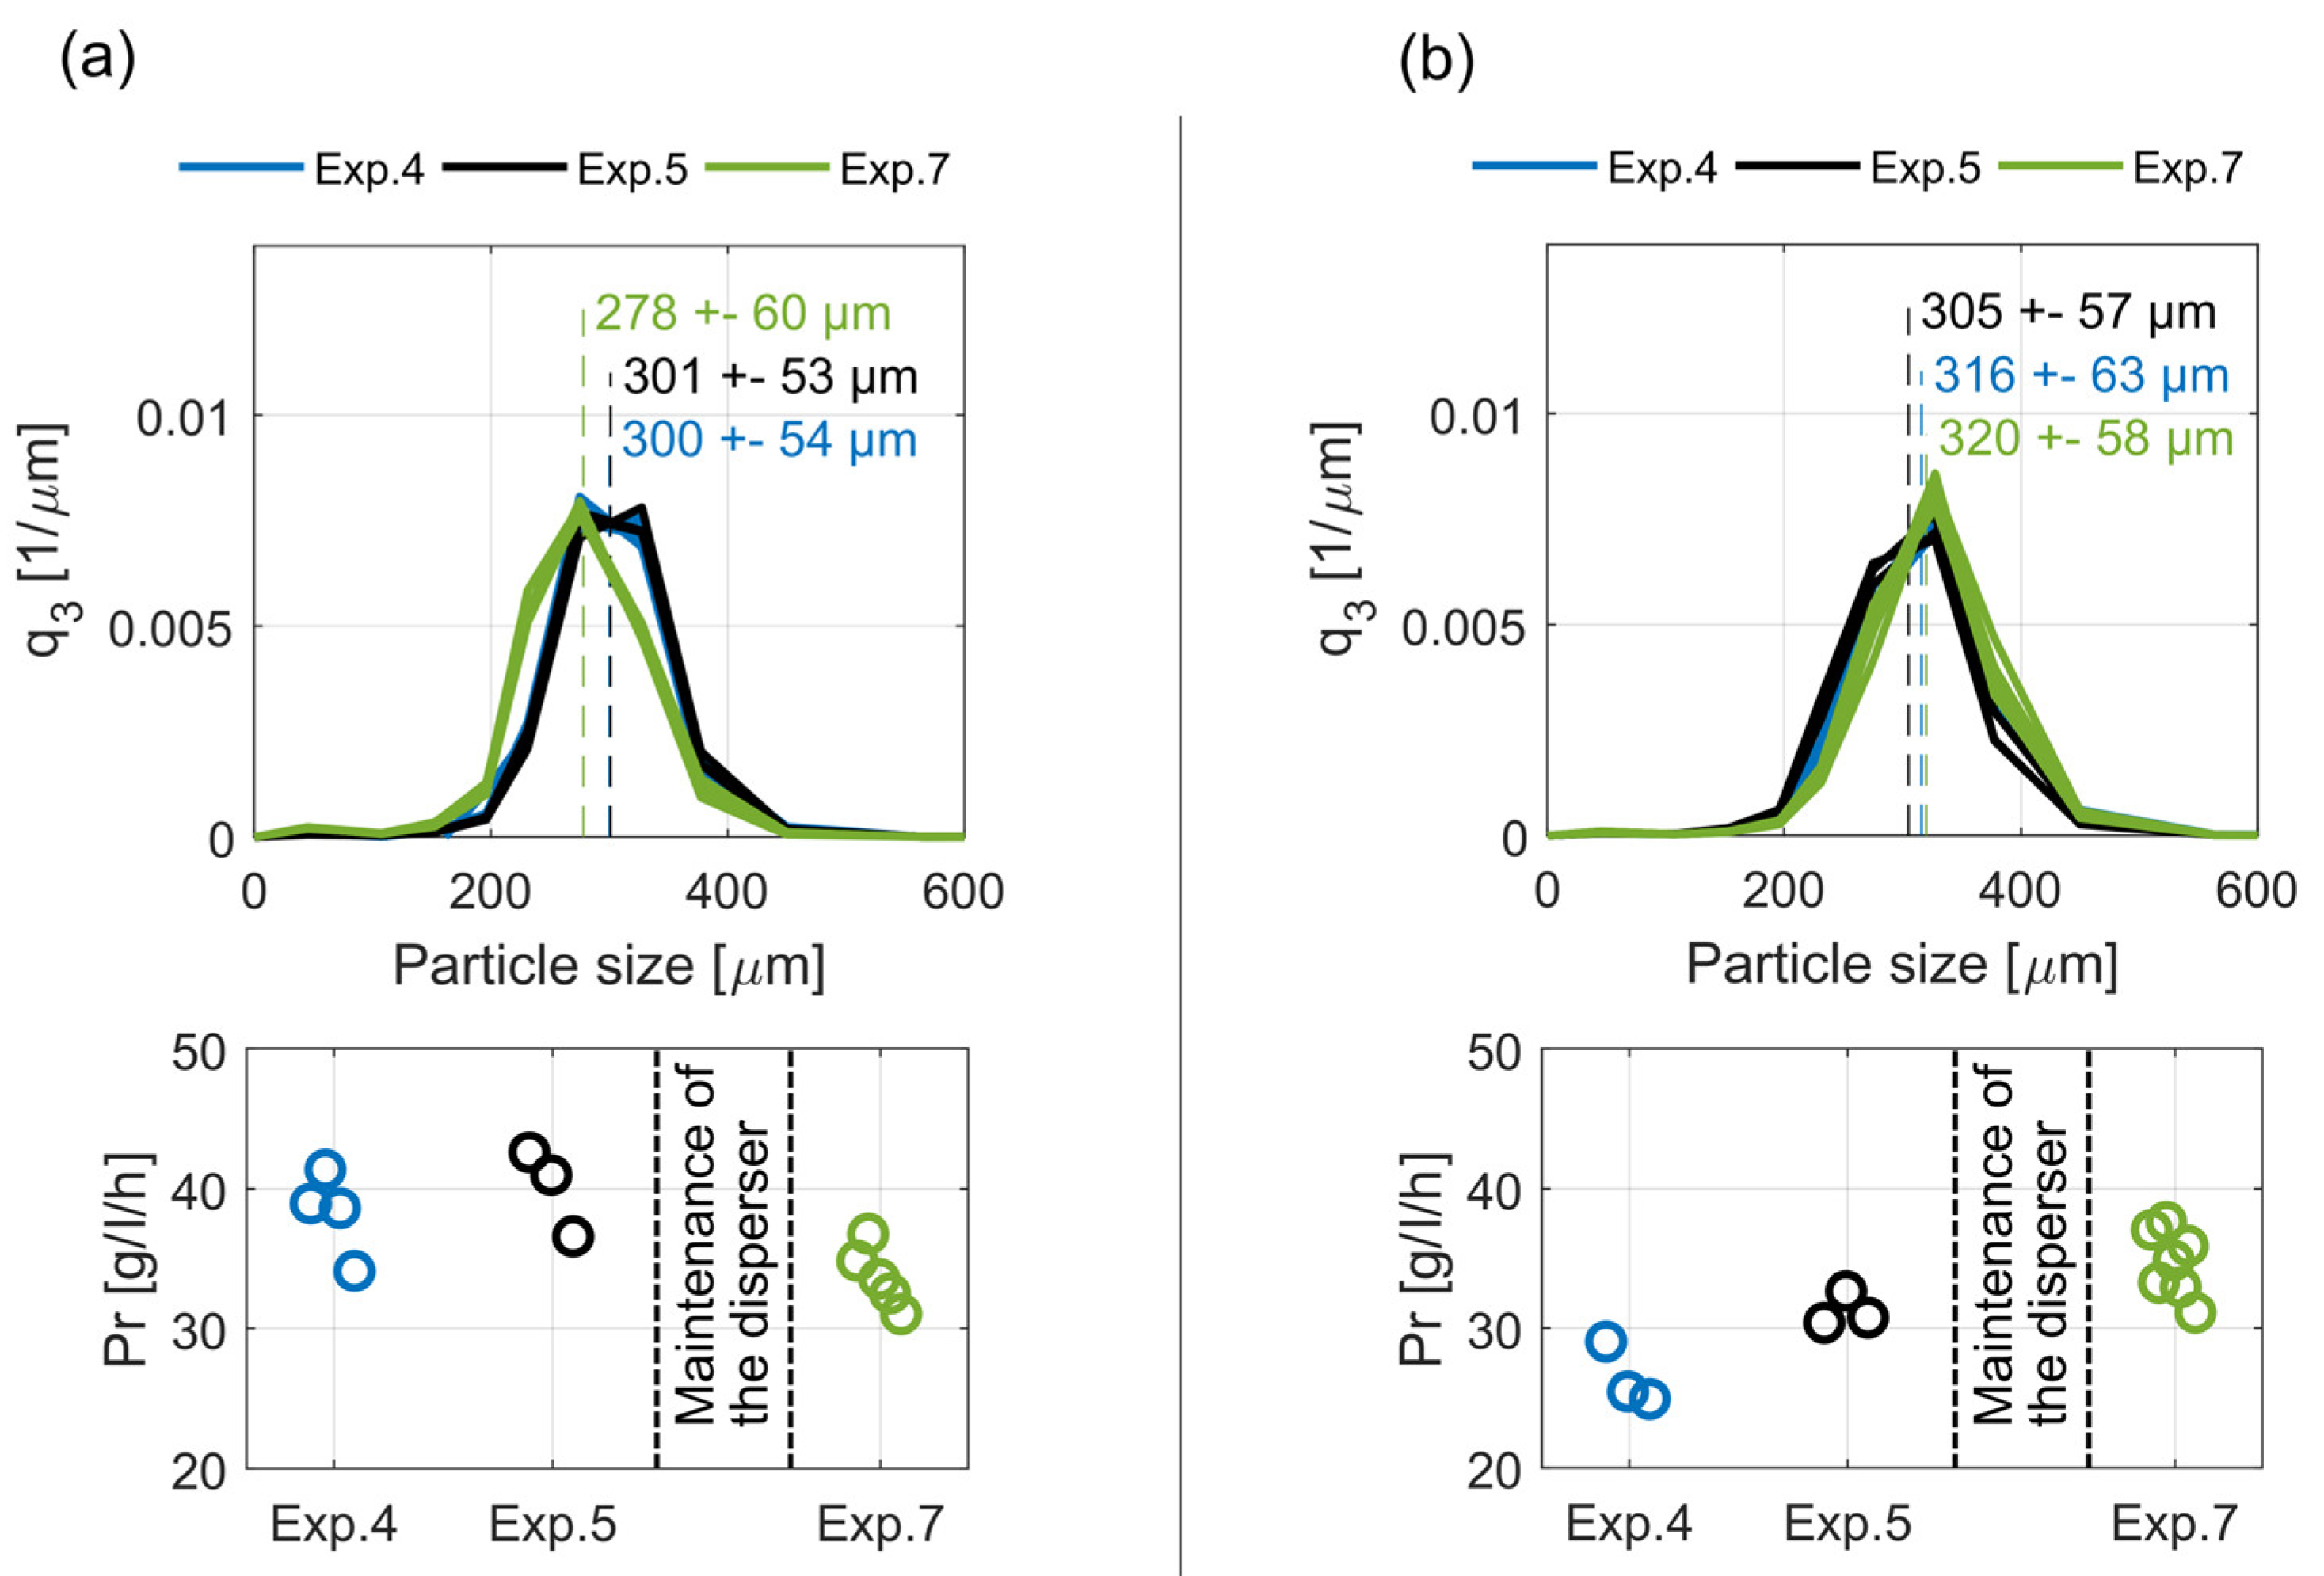
The central point (DoE, design of experiments) of the investigated operation window (operation parameters, Tsat = 35 °C, Tcrys = 30 °C and F = 12 L/h) was evaluated during Exps. 4, 5, and 7. The corresponding operation parameters were used for the first period of experiments 4 and 7 (4 h), though different seed crystal sizes (Exp. 4: 212–300 µm, Exp. 7: 250–355 µm) were added for initialization. In Exp. 5, another operation point was tested before going to the central point. Figure 7 depicts the steady-state product crystal size distribution, q3 (Equation (3)), and the steady-state productivity, Pr, for both crystallizers, C2 and C1 (Figure 7a,b) for the three experiments. The average mean values, , and standard deviations, sL3, of the steady-state product crystal size distribution are also given. The comparison of Exps. 4 and 5 shows that differences between the product crystal sizes are below 4% and thus negligible. In contrast, the scattering range of the productivity values for each evaluated operation point is approximately 8–10 g/L/h (≈ 30%). Responsible for this broad scattering are the dynamics of the periodic product withdrawal, since during each withdrawal an unknown and varying crystal mass remains within the outlet ports of the crystallizer. This crystal mass is removed from the tube after each withdrawal via a cleaning step with pure solvent and is, thus, not quantifiable. Several experimentations to capture and quantify this crystal mass led to the assumption that it varies between 1 and 3 g, which consequently reduces the evaluated productivity by approximately 2–10 g/L/h. However, the productivity values of Exps. 4 and 5 scatter within a common range, considering the previously mentioned deviation.
As indicated in Figure 7, the high-speed dispersers were maintained before Exp. 7. During the process, the maintained disperser tools were placed in cylindrical steel vessels, through which the suspended crystals of the bypass flow. Since the disperser tools do not cover the whole cross section area of these vessels, crystals carried by the surrounded flow might not be comminuted. Thus, the maintenance could cause changes in the amount and size distribution of the generated seed crystals and affect the cyclic steady-state and its reproducibility. As seen in Figure 7, the product crystal size distributions and the productivities of Exp. 7 slightly differ from the respective results of Exps. 4 and 5, which shows exceptionally good reproducibility.
Comparing the results of crystallizer C2 with the corresponding data of crystallizer C1 (Figure 7a,b) shows that C2 produces somewhat smaller product crystals with higher productivities. This trend was persistent throughout all experiments. It indicates that both crystallizers differ in their hydrodynamics due to small differences resulting from their hand manufacturing. Furthermore, the total volume of C2 is 511 ml and, thus, significantly larger than C1 with a total volume of 478 ml. Due to the classifying effect of the conically shaped crystallizers, a larger diameter of C2 would lead to smaller product crystals assuming similar flow rates. These smaller crystals have a higher specific crystal surface, which enhance the total crystallization rate and, thus, the productivity.
The comparison of Exps. 4, 5, and 7 prove that the utilized pilot plant generates reproducible results. Furthermore, the three experiments clearly prove that, when starting from different initial conditions, the same operation points can be independently reproduced. The reproducibility of a further operation point (operation parameters, Tsat = 35 °C, Tcrys = 30 °C, and F = 10 L/h) was also verified (see Appendix A, Figure A1).
3.3. Influence of Volumetric Flowrate
To study the influence of the volumetric flowrate and the resulting residence time of the liquid phase, three operation points with different volumetric flowrates, F = 10, 12, and 14 L/h, were investigated during Exps. 2, 4, 5, and 7. A constant saturation temperature (35 °C) and a constant crystallization temperature (30 °C), were ensured during all experiments. It was observed that at the lowest flowrate, F = 10 L/h, incrustations at the top of both crystallizers occurred and spread significantly faster than at the other operation points. The incrustation layer detached after a certain time, and settled towards the crystallizer bottom and the milling bypasses, where they were comminuted. The subsequently detected decrease of the product purity indicates that the incrustations are induced by nucleation of the counter-enantiomer. To achieve a successful racemate resolution at lower flowrates and, thus, higher residence time of the liquid phase, the risk of nucleation could be reduced by setting lower supersaturation.
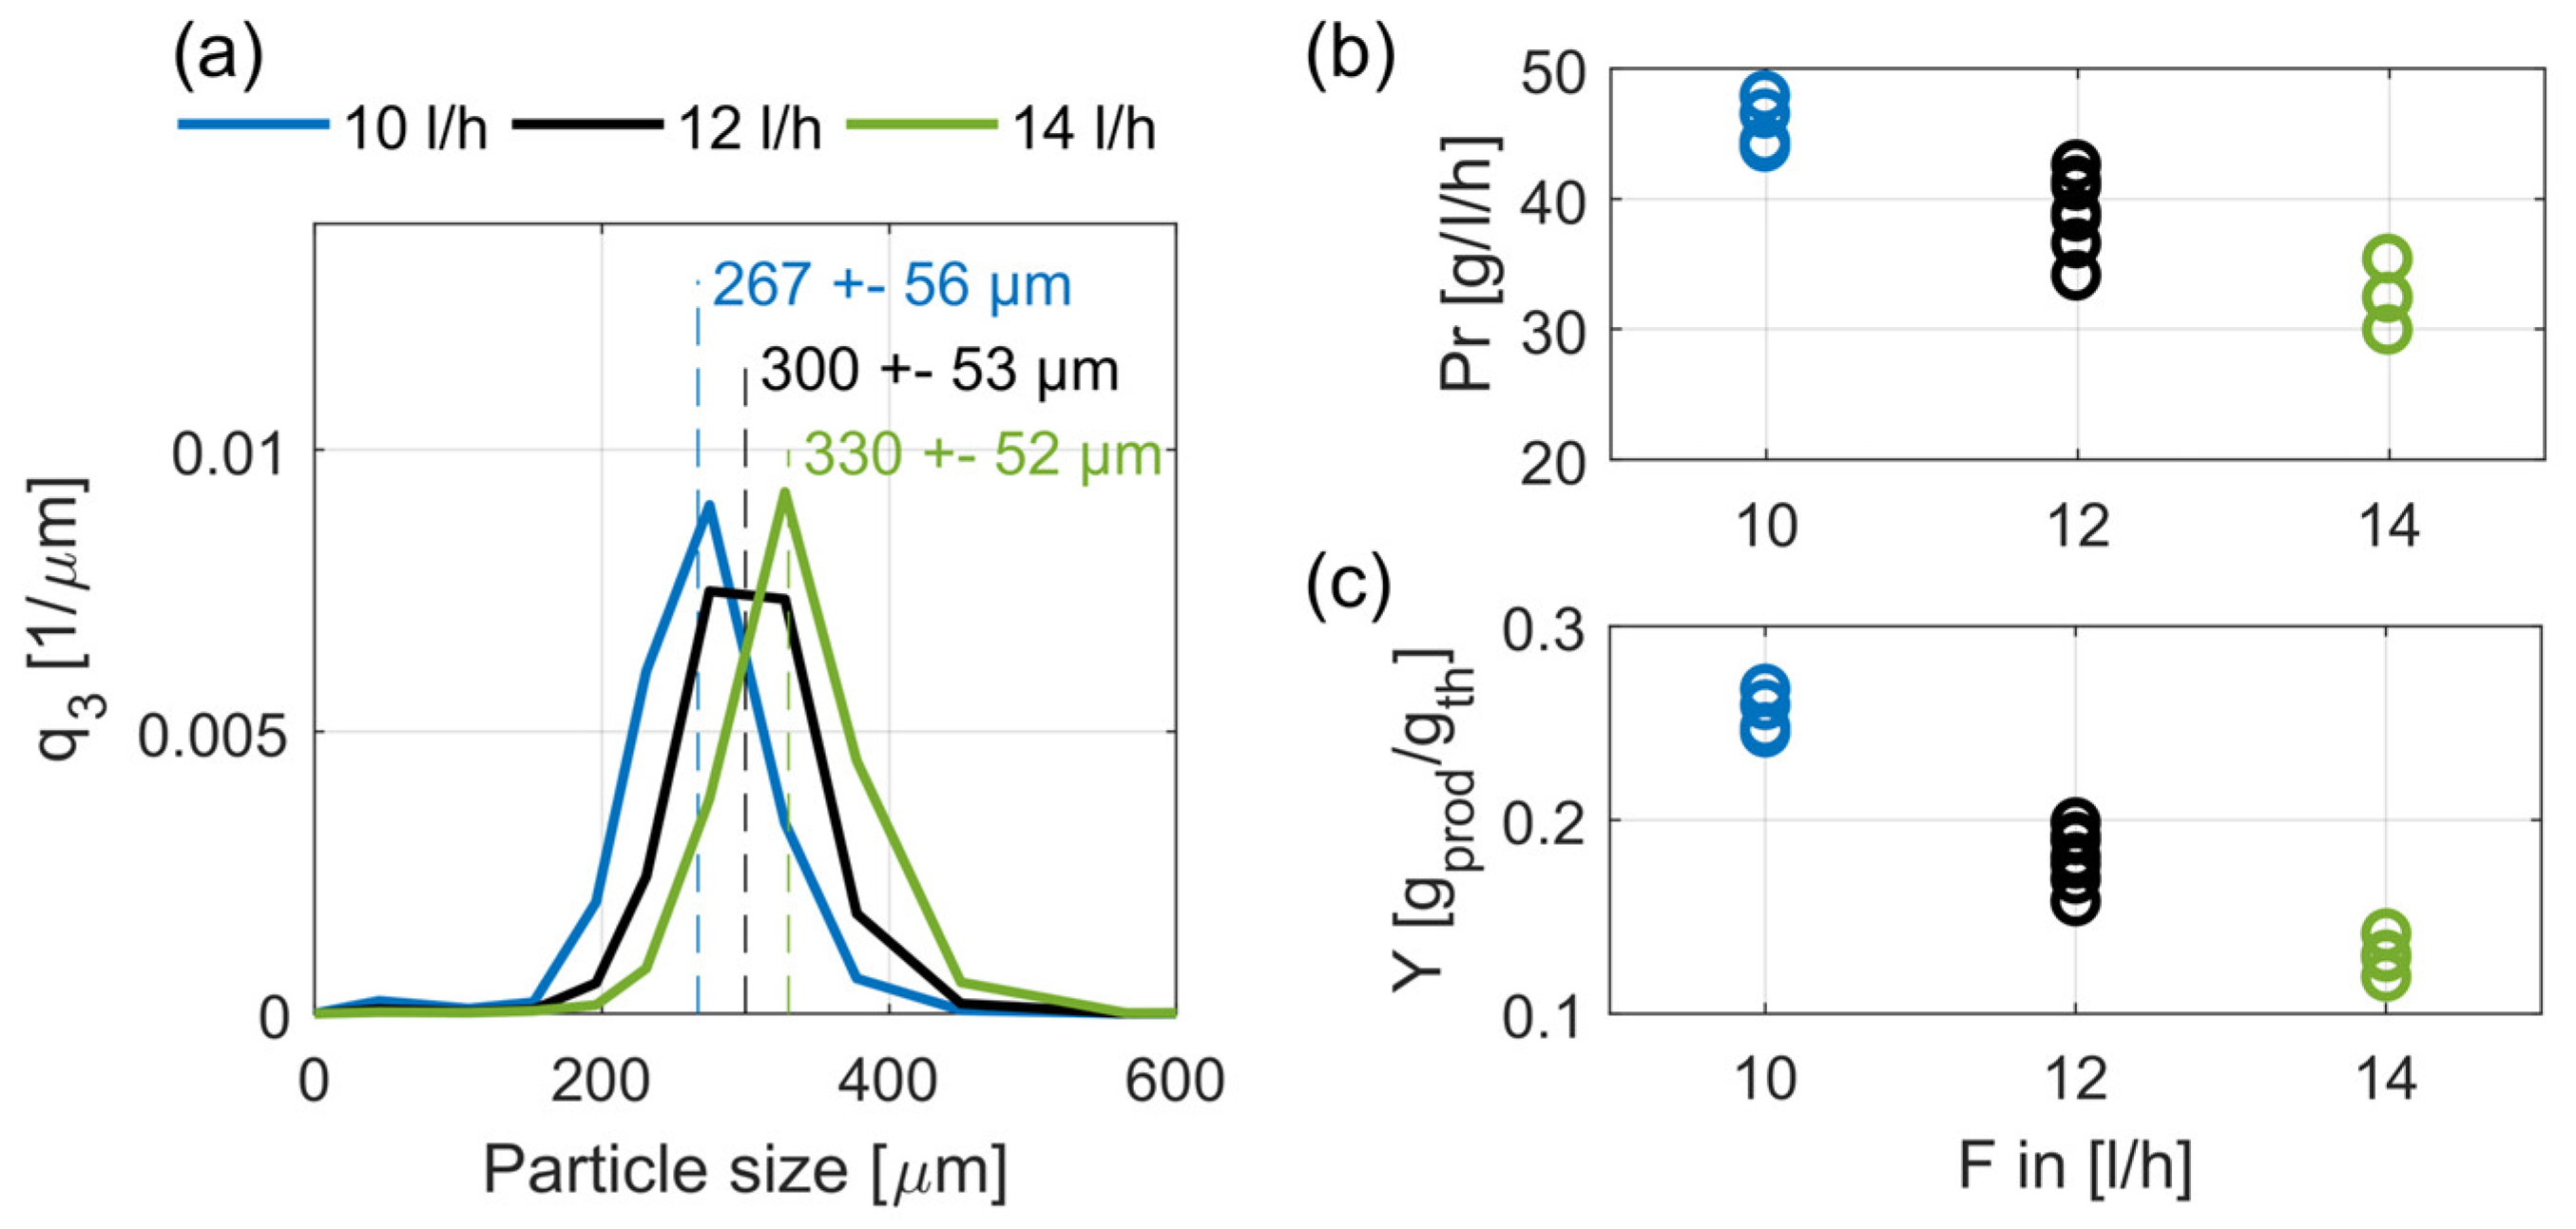
Figure 8a depicts the mean product crystal size distributions with their respective mean values and standard deviations for the three volumetric flowrates, from Exps. 4 and 5. As seen, the product crystal size distributions differ regarding the obtained product crystal size; with increasing flowrate the mean crystal size increases significantly from 267 to 300 and 330 µm. As expected, higher volumetric flowrates and, thus, higher fluid velocities, cause larger product crystals. Thus, our results verify the results of former studies [17].
Figure 7b,c shows the influence of the volumetric flowrate on productivity and yield. As shown, a higher volumetric flowrate leads to lower productivity and yield. This can be correlated to the larger crystals and the resulting lower total crystal surface of the fluidized bed. A second reason is that the higher volumetric flowrate reduces the residence time of the seed crystals and, thus, reduces their growing period. Consequently, a higher amount of seed crystals is discharged at the top of the crystallizers. Comparing productivity and yield with respect to the total decrease shows that productivity decreases by approximately 33% whereby yield decreases by approximately 50%. This disproportion is attributed to the increasing throughput rate of the mother liquor, and consequently its decreased depletion.
3.4. Influence of Supersaturation
The first three experiments (Exps. 1–3, Table 1) were utilized to identify a suitable operation window and, hence, four different supersaturation values were tested. A constant volumetric flowrate (10 L/h) and saturation temperature (35 °C) were ensured during all three experiments. The crystallization temperature was set to Tcrys = 27, 30, 31, and 32 °C, which corresponds to supersaturations of S = 1.40, 1.23, 1.18, and 1.13, respectively. Significant gain of the fluidized crystal bed height was not observed during 90 min operation time using the lowest driving force (1.13), and, thus, no product withdrawal could be realized. Previous studies [19] proved that crystal growth of Asn∙H2O still takes place at this supersaturation. The absent gain of the crystal bed height could be explained by the reduced growth rate of the seed crystals, which are mainly discharged at the top of the crystallizer as a consequence. Nucleation within the tubular crystallizers and a significant decrease of the product purity were observed at the highest supersaturation (1.40). Thus, the operation window is limited by a maximum supersaturation, where nucleation of the counter-enantiomer prevents continuous racemate resolution, as well as a minimal supersaturation, where seed crystals are mainly discharged due to insufficient growth.
The steady-state results of the applied supersaturations are presented in Figure 9 regarding the product crystal size distributions and their characteristics (Figure 9a), productivity (Figure 9b), and yield (Figure 9c). As depicted in Figure 9a, the influence of the supersaturation on the product crystal size is negligible, which again verifies the classifying effect of the fluidized bed. The standard deviation of the product crystal size distribution increases slightly at higher supersaturations. Figure 9b,c shows that the supersaturation clearly enhances both productivity and yield, which correlates with the growth kinetics (dotted lines) of the given substance system [19].
3.5. Influence of Crystallization Temperature
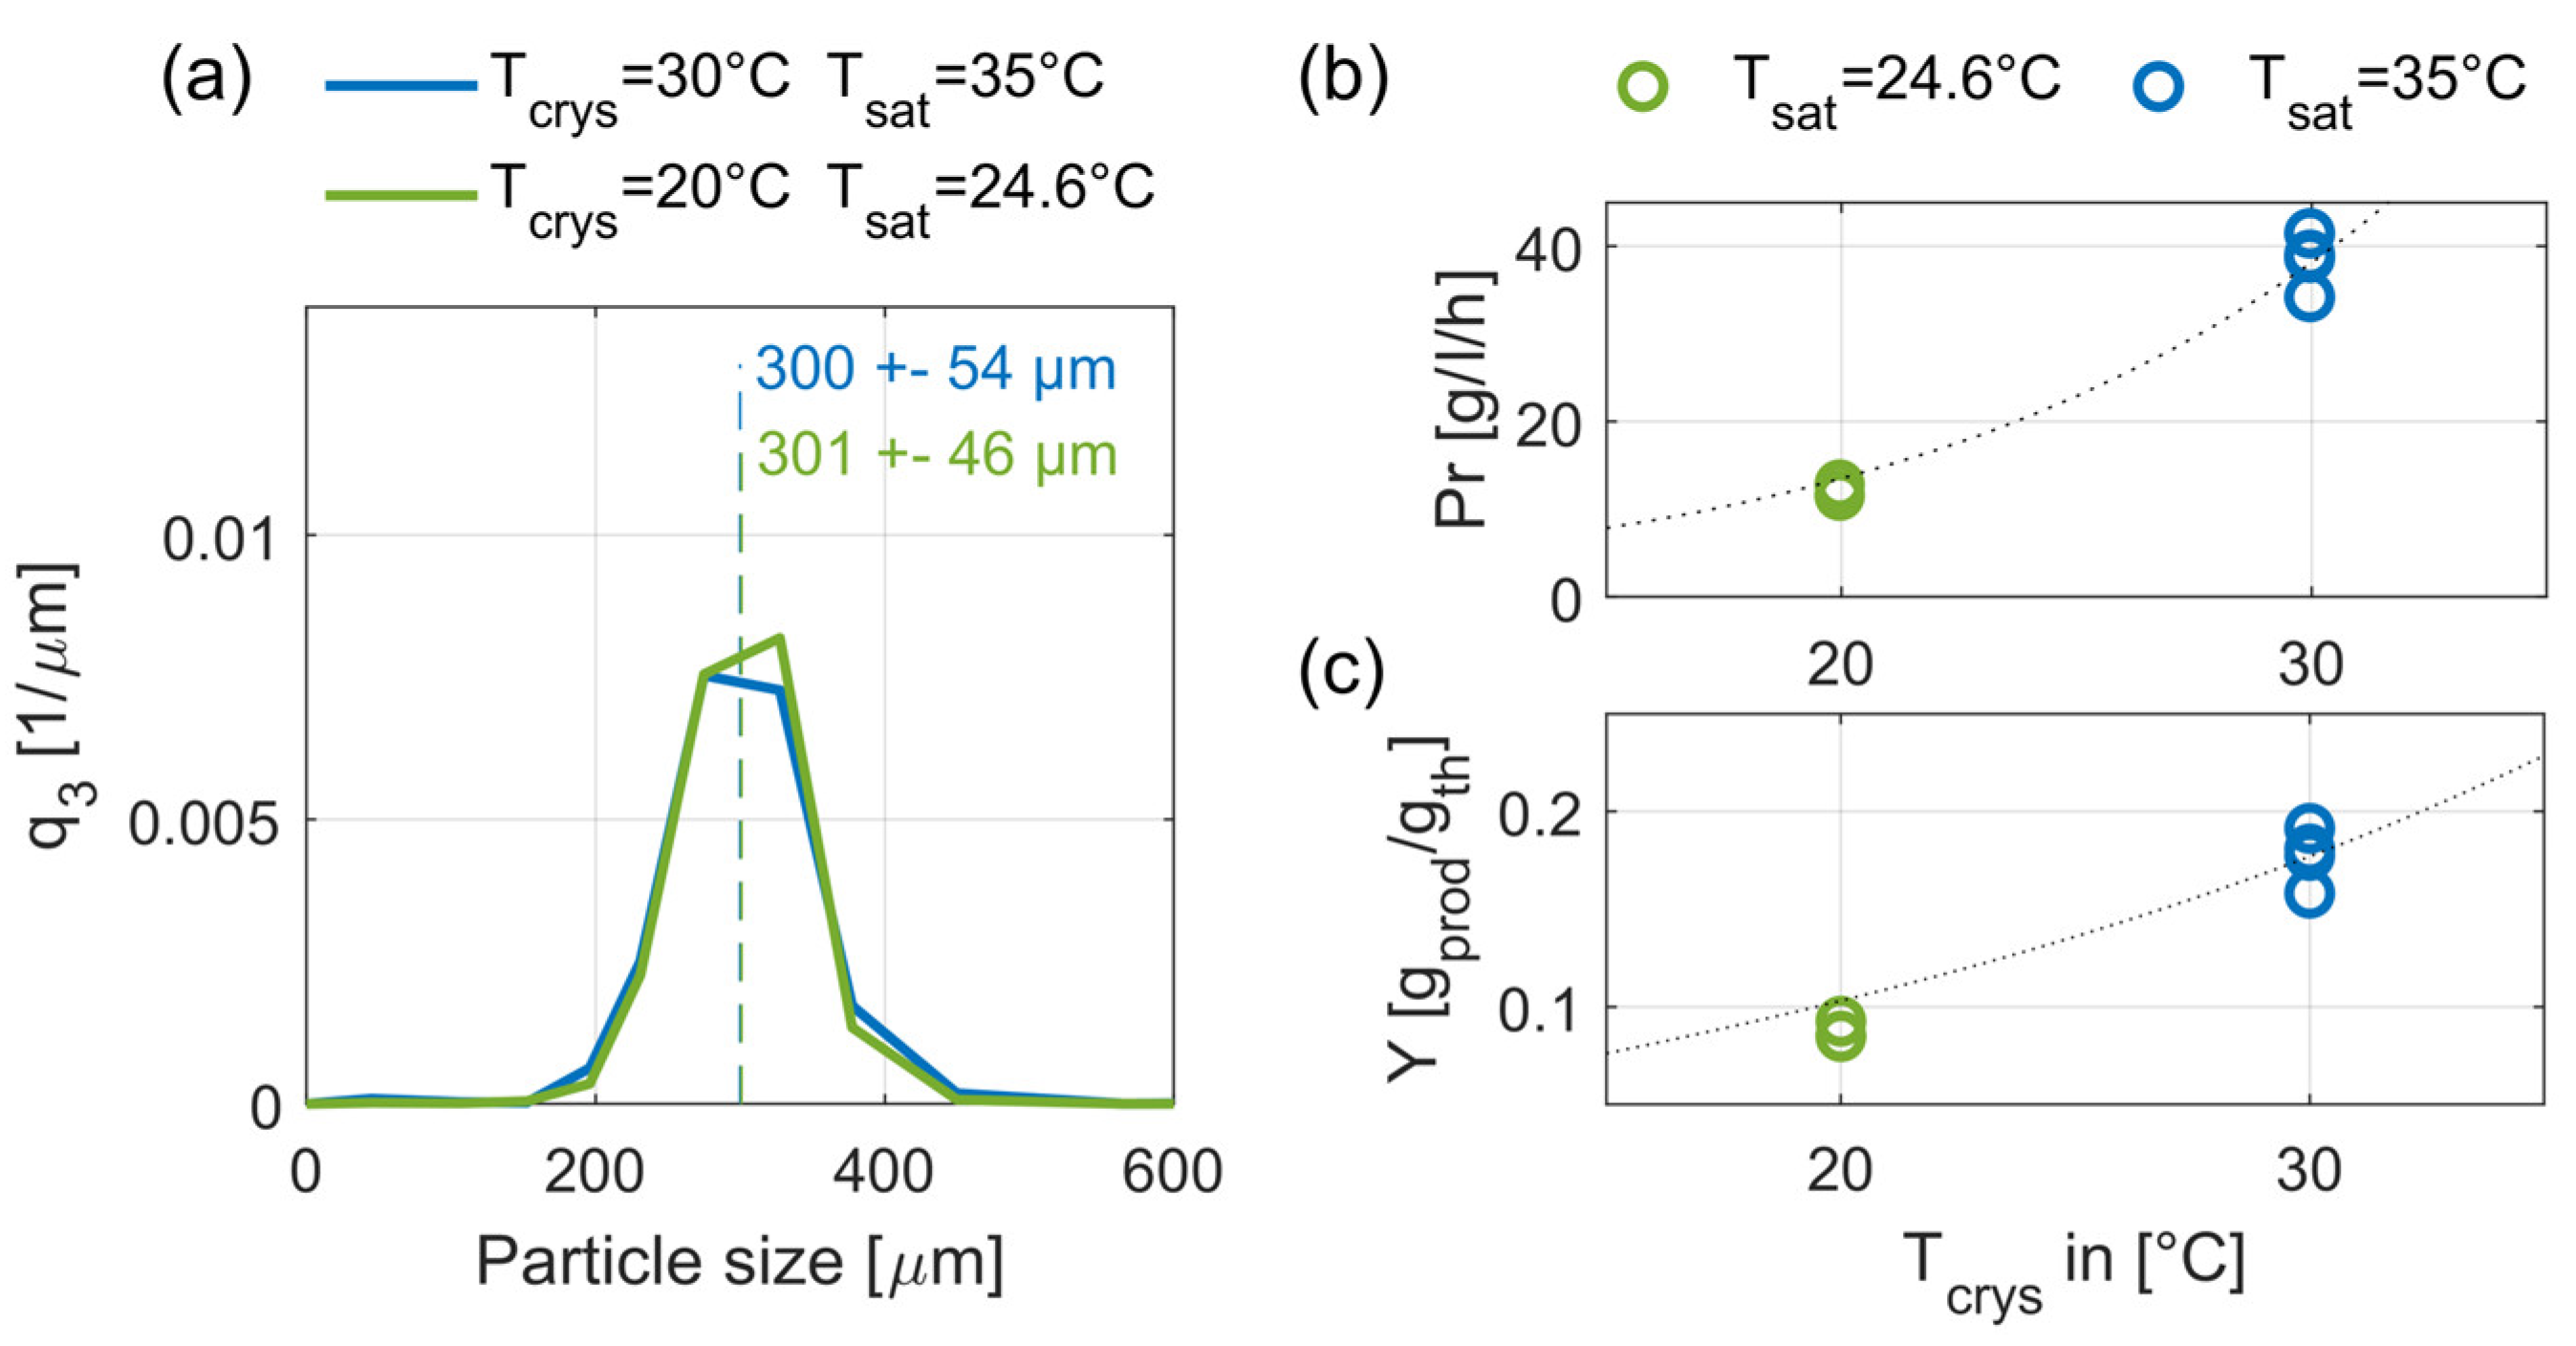
In Exp. 6 the crystallization temperature was reduced to Tcrys = 20 °C. To guarantee an approximately constant supersaturation of 1.23, the saturation temperature was adjusted to 24.6 °C. Figure 10 depicts the steady-state results of Exp. 6 together with the respective results of Exp. 4 (Tcrys = 30 °C, Tsat = 35 °C) for the same volumetric flowrate (12 L/h).
As seen in Figure 10a, an influence of the crystallization temperature on the product crystal size was not observed. At the lower crystallization temperature, the standard deviation decreases by almost 15%, hence, the selectivity of the size classifying effect is improved. Since the crystal growth rate decreases with the crystallization temperature, the crystal growth and the standard deviation show the same correlation as in the previous section. This correlation leads to the assumption that the crystal growth counteracts the size-classifying effect and thus its selectivity. The influences of the crystallization temperature on productivity and yield are depicted in Figure 10b,c. As expected, a lower crystallization temperature leads to both lower productivity and yield. The observed decreases of productivity and yield are in good agreement with the studied correlation between crystal growth kinetics (dotted lines) and crystallization temperature [19].
4. Conclusions
In the present experimental parameter study, seven experiments were performed to investigate the continuous fluidized bed crystallization at twice 0.5 L scale for racemate resolution at its steady-state. Each experiment was conducted for 8 hours to ensure constant conditions. As verified, after a relatively short operation time (approximately 2 hours), the utilized pilot plant reaches a cyclic steady-state, where product crystals with constant crystal size distribution and productivity can be periodically withdrawn. The reproducibility of the steady-state results was proven and sensitivities of the utilized pilot plant on the steady-state results were identified. In particular, it was observed that changes of the high-speed disperser slightly effect the steady-state results in terms of productivity and product crystal size distribution. Nevertheless, the steady-state results were shown in the present study to have exceptionally good reproducibility.
It was proven that the steady-state product crystal size mainly depends on the volumetric flowrate, and thus can be easily adjusted (in this work between 260 and 330 µm). All products, withdrawn at steady-state, have a narrow crystal size distribution (standard deviation <60 µm) and a low fines content. Thus, the size classifying effect of the conically shaped tubular crystallizers and its selectivity is verified. Productivity and yield increase with supersaturation, whereby it was shown that the continuous racemate resolution is limited by a certain maximal and minimal supersaturation. At too low supersaturation, the seed crystals grow insufficiently and are mainly discharged at the top of the crystallizer. At too high supersaturation, the respective counter-enantiomer nucleates and, thus, contaminates the resolution product. Furthermore, the limitations regarding the supersaturation are not fixed values and also depend on the volumetric flowrate. In particular, the nucleation probability increases with higher supersaturation and lower volumetric flowrates. A decrease of productivity was observed at lower supersaturation and higher volumetric flowrates, and thus, higher fluid velocities. These observed correlations enhance the expectation that the location and width of the operation window and, thus, the process performance, are tunable via geometrical aspects of the conically shaped tubular crystallizer [20].
The utilized pilot plant enables continuous racemate resolution with enantiomer purities above 97% and productivities up to 40 g/L/h for each enantiomer, which is far above productivities documented by other studies [14,21]. Since the process was not optimized at all, productivities higher than 40 g/L/h are to be expected. Thus, the coupled fluidized bed crystallization was proven to be an excellent technology for continuous enantioseparation, which facilitates high purities and the robust production of both enantiomers simultaneously.
Author Contributions
Conceptualization, H.L. and A.S.-M.; methodology, E.T. and J.G.; investigation, formal analysis, validation, data curation and visualization, J.G.; writing—original draft preparation, E.T. and J.G.; writing—review and editing, E.T., H.L. and A.S.-M.; supervision, H.L. and A.S.-M.; project administration and funding acquisition, A.S.-M. All authors have read and agreed to the published version of the manuscript.
Funding
This research was funded by Deutsche Forschungsgemeinschaft (DFG) within the Research Program SPP 1679 “Dynamische Simulation vernetzter Feststoffprozesse”.
Acknowledgments
The authors thank Jacqueline Kaufmann and Stefanie Leuchtenberg for their analytical support as well as Detlef Franz, Klaus-Dieter Stoll, Stefan Hildebrandt and Steve Haltenhof for their technical support.
Conflicts of Interest
The authors declare no conflict of interest. The funders had no role in the design of the study; in the collection, analyses, or interpretation of data; in the writing of the manuscript, or in the decision to publish the results.
Appendix A
Figure A1.
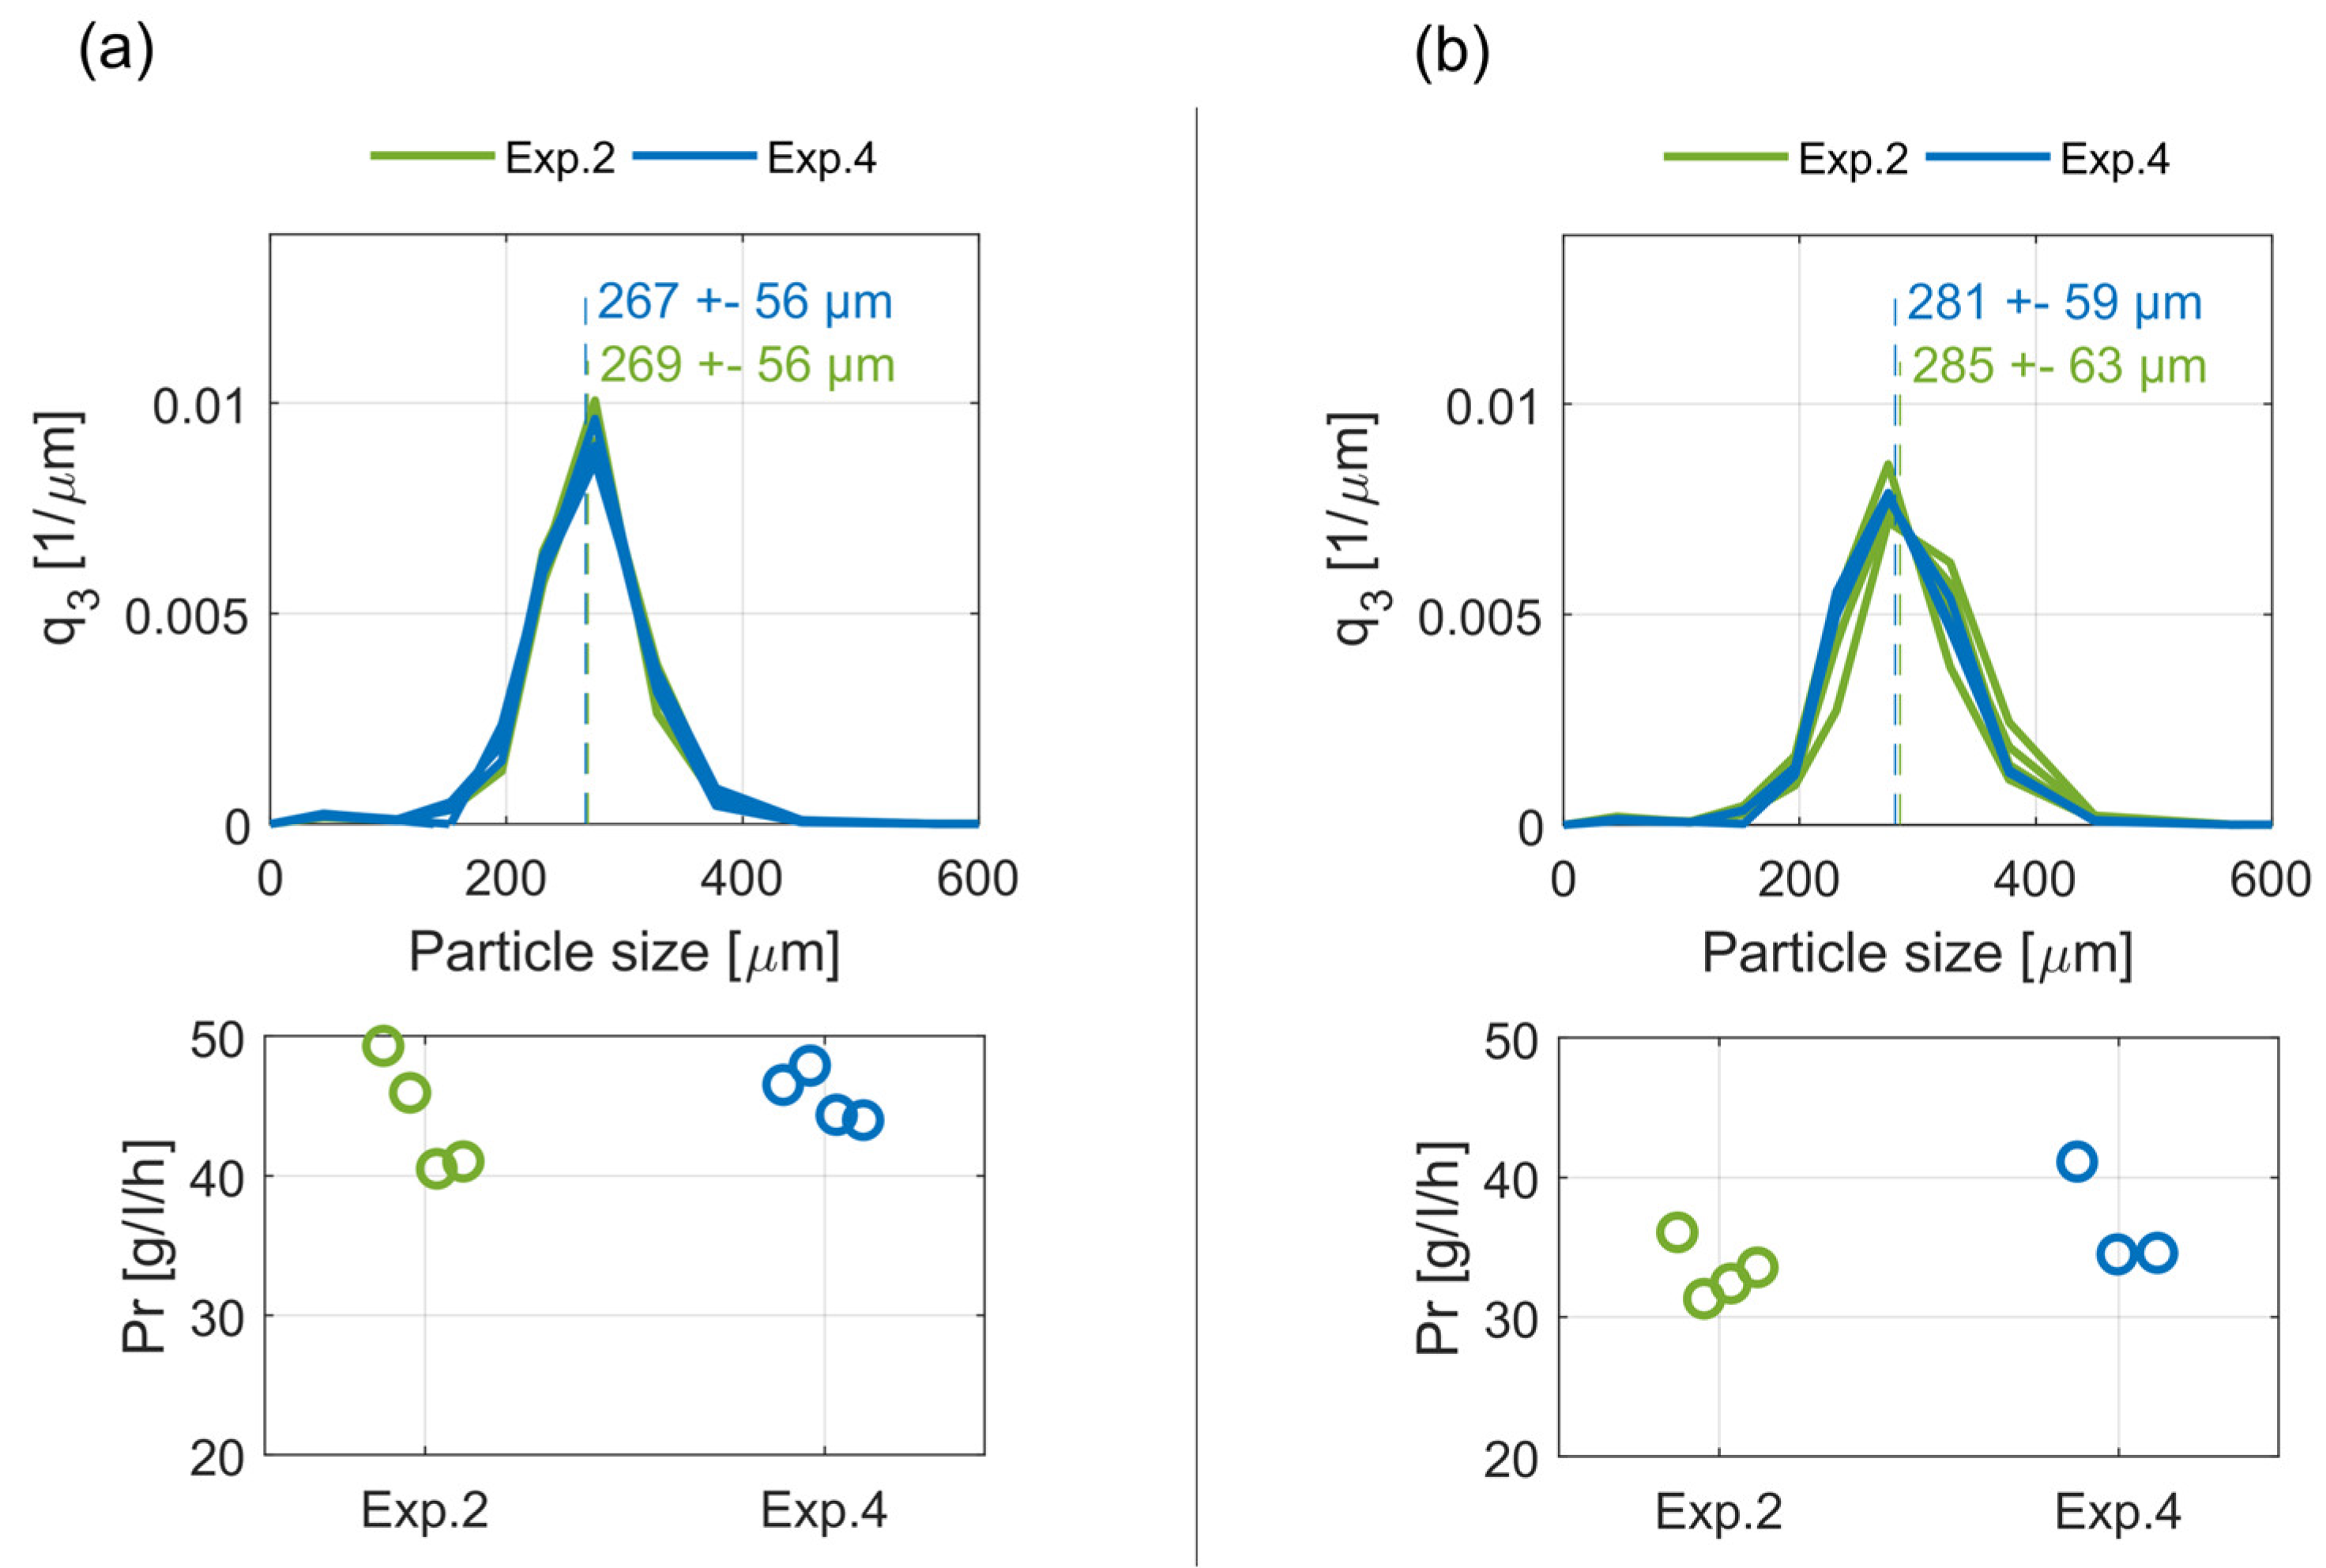
Steady-state crystal size distributions, q3, with their respective mean values and standard deviations as well as the corresponding productivities, Pr, of crystallizer C2 (a) and C1 (b) for Exps. 2, 4.
Figure A1.
Steady-state crystal size distributions, q3, with their respective mean values and standard deviations as well as the corresponding productivities, Pr, of crystallizer C2 (a) and C1 (b) for Exps. 2, 4.

References
- Jiang, M.; Braatz, R.D. Designs of continuous-flow pharmaceutical crystallizers: Developments and practice. Cryst. Eng. Comm. 2019, 21, 3534–3551. [Google Scholar] [CrossRef] [Green Version]
- Lorenz, H.; Temmel, E.; Seidel-Morgenstern, A. Continuous Enantioselective Crystallization of Chiral Compounds. In The Handbook of Continuous Crystallization, 1st ed.; Yazdanpanah, N., Nagy, Z.K., Eds.; Royal Society of Chemistry: Cambridge, UK, 2020; Volume 1, pp. 422–468. [Google Scholar] [CrossRef]
- Darmali, C.; Mansouri, S.; Yazdanpanah, N.; Woo, M.W. Mechanisms and Control of Impurities in Continuous Crystallization: A Review. Ind. Eng. Chem. Res. 2018, 58, 1463–1479. [Google Scholar] [CrossRef]
- Su, M.; Gao, Y. Air–Liquid Segmented Continuous Crystallization Process Optimization of the Flow Field, Growth Rate, and Size Distribution of Crystals. Ind. Eng. Chem. Res. 2018, 57, 3781–3791. [Google Scholar] [CrossRef]
- Kacker, R.; Maaß, S.; Emmerich, J.; Kramer, H.J.M. Application of inline imaging for monitoring crystallization process in a continuous oscillatory baffled crystallizer. AIChE J. 2018, 64, 2450–2461. [Google Scholar] [CrossRef]
- Onyemelukwe, I.; Benyahia, B.; Reis, N.M.; Nagy, Z.K.; Rielly, C. The heat transfer characteristics of a mesoscale continuous oscillatory flow crystalliser with smooth periodic constrictions. Int. J. Heat Mass Transf. 2018, 123, 1109–1119. [Google Scholar] [CrossRef] [Green Version]
- Nguyen, A.-T.; Kim, W.-S. Influence of feeding mode on cooling crystallization of L-lysine in Couette-Taylor crystallizer. Korean J. Chem. Eng. 2017, 34, 2002–2010. [Google Scholar] [CrossRef]
- Kim, J.-E.; Kim, W.-S. Synthesis of Core–Shell Particles of Nickel–Manganese–Cobalt Hydroxides in a Continuous Couette-Taylor Crystallizer. Cryst. Growth Des. 2017, 17, 3677–3686. [Google Scholar] [CrossRef]
- Shih, Y.-J.; Abarca, R.R.; De Luna, M.D.G.; Huang, Y.-H.; Lu, M.-C. Recovery of phosphorus from synthetic wastewaters by struvite crystallization in a fluidized-bed reactor: Effects of pH, phosphate concentration and coexisting ions. Chemosphere 2017, 173, 466–473. [Google Scholar] [CrossRef]
- Priambodo, R.; Shih, Y.-J.; Huang, Y.-H. Phosphorus recovery as ferrous phosphate (vivianite) from wastewater produced in manufacture of thin film transistor-liquid crystal displays (TFT-LCD) by a fluidized bed crystallizer (FBC). RSC Adv. 2017, 7, 40819–40828. [Google Scholar] [CrossRef] [Green Version]
- Maharaj, C.; Chivavava, J.; Lewis, A. Treatment of a highly-concentrated sulphate-rich synthetic wastewater using calcium hydroxide in a fluidised bed crystallizer. J. Environ. Manag. 2018, 207, 378–386. [Google Scholar] [CrossRef] [PubMed]
- Vu, X.; Lin, J.-Y.; Shih, Y.-J.; Huang, Y.-H. Reclaiming Boron as Calcium Perborate Pellets from Synthetic Wastewater by Integrating Chemical Oxo-Precipitation within a Fluidized-Bed Crystallizer. ACS Sustain. Chem. Eng. 2018, 6, 4784–4792. [Google Scholar] [CrossRef]
- Hohmann, L.; Greinert, T.; Mierka, O.; Turek, S.; Schembecker, G.; Bayraktar, E.; Wohlgemuth, K.; Kockmann, N. Analysis of Crystal Size Dispersion Effects in a Continuous Coiled Tubular Crystallizer: Experiments and Modeling. Cryst. Growth Des. 2018, 18, 1459–1473. [Google Scholar] [CrossRef]
- Binev, D.; Seidel-Morgenstern, A.; Lorenz, H. Continuous Separation of Isomers in Fluidized Bed Crystallizers. Cryst. Growth Des. 2016, 16, 1409–1419. [Google Scholar] [CrossRef]
- Lorenz, H.; Seidel-Morgenstern, A. Processes to Separate Enantiomers. Angew. Chem. Int. Ed. 2014, 53, 1218–1250. [Google Scholar] [CrossRef] [PubMed]
- Elsner, M.P.; Ziomek, G.; Seidel-Morgenstern, A. Simultaneous preferential crystallization in a coupled batch operation mode. Part II: Experimental study and model refinement. Chem. Eng. Sci. 2011, 66, 1269–1284. [Google Scholar] [CrossRef]
- Binev, D.; Seidel-Morgenstern, A.; Lorenz, H. Study of crystal size distributions in a fluidized bed crystallizer. Chem. Eng. Sci. 2015, 133, 116–124. [Google Scholar] [CrossRef]
- Petrusevska-Seebach, K. Overcoming Yield Limitations when Resolving Racemates by Combination of Crystallization and/or Chromatography with Racemization. Ph.D. Thesis, Otto-von-Guericke-Universität, Magdeburg, Germany, 2012. [Google Scholar]
- Temmel, E.; Gänsch, J.; Lorenz, H.; Seidel-Morgenstern, A. Measurement and Evaluation of the Crystallization Kinetics of l-Asparagine Monohydrate in the Ternary l-/d-Asparagine/Water System. Cryst. Growth Des. 2018, 18, 7504–7517. [Google Scholar] [CrossRef] [Green Version]
- Mangold, M.; Khlopov, D.; Temmel, E.; Lorenz, H.; Seidel-Morgenstern, A. Modelling geometrical and fluid-dynamic aspects of a continuous fluidized bed crystallizer for separation of enantiomers. Chem. Eng. Sci. 2017, 160, 281–290. [Google Scholar] [CrossRef] [Green Version]
- Köllges, T.; Vetter, T. Design and Performance Assessment of Continuous Crystallization Processes Resolving Racemic Conglomerates. Cryst. Growth Des. 2018, 18, 1686–1696. [Google Scholar] [CrossRef] [Green Version]
Figure 1.
Principle scheme of a coupled Preferential Crystallization carried out in two fluidized bed crystallizers for the separation of the D- and L-enantiomer from the racemic (50:50) mixture provided in the feed tank (adapted from [2]).
Figure 1.
Principle scheme of a coupled Preferential Crystallization carried out in two fluidized bed crystallizers for the separation of the D- and L-enantiomer from the racemic (50:50) mixture provided in the feed tank (adapted from [2]).

Figure 2.
Upper 20% section of the ternary phase prism of the asparagine monohydrate enantiomers in water at different temperatures. All axes are given in mass fractions × 100 (wt%). Black and white dots—solubility data from [18] and [19], respectively. Red and blue surface—fitted solubility surface of D-Asn·H2O and L-Asn·H2O, respectively. Reprinted with permission from [19]. Copyright 2020 American Chemical Society.

Figure 3.
Process scheme with the main components of the utilized continuous fluidized bed plant.

Figure 4.
(a) Schematic detail drawing of the progressing process at the height of the product outlet. The seed crystals move through the fluidized crystal bed until they are grown to a size at which they settle at the top of the bed. (b) Microscope photograph of washed product crystals.
Figure 4.
(a) Schematic detail drawing of the progressing process at the height of the product outlet. The seed crystals move through the fluidized crystal bed until they are grown to a size at which they settle at the top of the bed. (b) Microscope photograph of washed product crystals.

Figure 5.
Evolution of the saturation temperature, Tsat, crystallization temperature, Tcrys (a), volumetric flowrate (b), liquid phase density of the feed solution, ρliq (c), and enantiomeric proportion of the D-Asn∙H2O in the liquid phase at the crystallizer outlet and within the feed tank (d), of Exp. 7 (C1) over time, with t = 0 indicating the initial seeding point. Spikes occurring in the flowrate and solution density courses can be attributed to air bubbles passing the Coriolis mass flowmeter (data shown are raw data without any curve treatment).

Figure 6.
Evolution of mean product crystal size, (a), its respective standard deviation, sL3 (b), productivity, Pr (c), and product purity, Pur (d), of Exp. 7 (C1) over time, with t = 0 indicating the initial seeding point. Illustrated are the values of the process characteristics for every product withdrawal as points with their corresponding time window as line.

Figure 7.
Steady-state crystal size distributions, q3, with their respective mean values and standard deviations, as well as the corresponding productivities, Pr, of crystallizer C2 (a) and C1 (b) for Exps. 4, 5, 7.
Figure 7.
Steady-state crystal size distributions, q3, with their respective mean values and standard deviations, as well as the corresponding productivities, Pr, of crystallizer C2 (a) and C1 (b) for Exps. 4, 5, 7.

Figure 8.
Mean steady-state crystal size distributions, q3, with their respective mean values and standard deviations (a), productivities, Pr (b), and yields, Y (c), for three different volumetric flowrates, F = 10, 12, and 14 L/h. Given results are from crystallizer C2 for Exps. 4 and 5.
Figure 8.
Mean steady-state crystal size distributions, q3, with their respective mean values and standard deviations (a), productivities, Pr (b), and yields, Y (c), for three different volumetric flowrates, F = 10, 12, and 14 L/h. Given results are from crystallizer C2 for Exps. 4 and 5.

Figure 9.
Mean steady-state crystal size distributions, q3, with their respective mean values and standard deviations (a), productivities, Pr (b), and yields, Y (c), for four different supersaturations, S = 1.40, 1.23, 1.18, and 1.13, and the same saturation temperature and volumetric flowrate. The respective crystallization temperatures, Tcrys = 27, 30, 31, and 32 °C, are indicated. The dotted lines (b and c) represent the change with respect to the operation point at Tcrys = 30 °C, assuming the withdrawn product mass is proportional to the growth rate [19]. Given results are from crystallizer C1 for Exps. 1–3.

Figure 10.
Mean steady-state crystal size distributions, q3, with their respective mean values and standard deviations (a), productivities, Pr (b), and yields, Y (c), for two different crystallization temperatures, Tcrys = 20 and 30 °C, at the same supersaturation and volumetric flowrate. The dotted lines (b) indicate the change with respect to the central point at Tcrys = 30 °C, assuming the withdrawn product mass is proportional to the growth rate [19]. Given results are from crystallizer C2 for Exps. 4, 6.


Table 1.
Process conditions and objectives of all experiments.
| Exp. | Tsat [°C] | Tcrys [°C] | F [L/h] | Initial Seed Crystals | Objective of Investigation | |
|---|---|---|---|---|---|---|
| Sieve Fraction [µm] | mSeed [g] | |||||
| 1 | 35 | 27 | 10 | 90–125 | 6.28 | steady-state, operation window |
| 2 | 35 | 30 | 10 | 212–300 | 15 | steady-state, operation window |
| 3 | 35 | 31, 32 | 10 | 90–125 | 6.28 | operation window |
| 4 | 35 | 30 | 10, 12 | 212–300 | 15 | volumetric flowrate, residence time |
| 5 | 35 | 30 | 12, 14 | 212–250 | 15 | volumetric flowrate, residence time |
| 6 | 24.6 | 20 | 12 | 250–355 | 20 | crystallization temperature |
| 7 | 35 | 30 | 12 | 250–355 | 20 | steady-state |
Table 2.
Specifications of the applied analytics.
| Analysis | Specification |
|---|---|
| HPLC | Crownpak CR(+) (4 × 150 mm, particle size 5 μm) column with Dionex Ultimate 3000 system (Thermo Scientific). Perchloric acid/ water (pH = 1) as the eluent. The flow rate, UV wave length, column temperature and injection volume were 0.4 ml/min, 200 nm, 5 °C and 1 µL, respectively. |
| XRPD | X’Pert Pro diffractometer (PANalytical GmbH, Germany), 2-theta range of 5–40°, step size 0.017°, step time 50 s |
| Sieve analysis | Retsch, AS 200 digit, amplitude 1.8 mm, sieving time 20 min, sieve mesh widths: 0, 90, 125, 180, 212, 250, 300, 355, 400, 500, 630, 710, 800 µm. |
© 2020 by the authors. Licensee MDPI, Basel, Switzerland. This article is an open access article distributed under the terms and conditions of the Creative Commons Attribution (CC BY) license (http://creativecommons.org/licenses/by/4.0/).
Share and Cite
MDPI and ACS Style
Temmel, E.; Gänsch, J.; Seidel-Morgenstern, A.; Lorenz, H. Systematic Investigations on Continuous Fluidized Bed Crystallization for Chiral Separation. Crystals 2020, 10, 394. https://0-doi-org.brum.beds.ac.uk/10.3390/cryst10050394
AMA Style
Temmel E, Gänsch J, Seidel-Morgenstern A, Lorenz H. Systematic Investigations on Continuous Fluidized Bed Crystallization for Chiral Separation. Crystals. 2020; 10(5):394. https://0-doi-org.brum.beds.ac.uk/10.3390/cryst10050394
Chicago/Turabian StyleTemmel, Erik, Jonathan Gänsch, Andreas Seidel-Morgenstern, and Heike Lorenz. 2020. "Systematic Investigations on Continuous Fluidized Bed Crystallization for Chiral Separation" Crystals 10, no. 5: 394. https://0-doi-org.brum.beds.ac.uk/10.3390/cryst10050394
Note that from the first issue of 2016, this journal uses article numbers instead of page numbers. See further details here.