Article

In Situ X-ray Diffraction Study of Xe and CO2 Adsorption in Y Zeolite: Comparison between Rietveld and PCA-Based Analysis

1
Dipartimento di Scienze e Innovazione Tecnologica, Università degli Studi del Piemonte Orientale, viale T. Michel, 11-15121 Alessandria, Italy
2
Nova Res s.r.l., Via D. Bello 3, 28100 Novara, Italy
*
Author to whom correspondence should be addressed.
Submission received: 7 April 2020 / Revised: 27 May 2020 / Accepted: 29 May 2020 / Published: 5 June 2020
(This article belongs to the Special Issue Multivariate Analysis Applications to Crystallography)

Abstract

:
New very fast and efficient detectors, installed both on laboratory instruments and synchrotron facilities, allow the monitoring of solid-state reactions from subsecond to minute scales with the production of large amounts of data. Traditional “one-by-one” pattern refinement needs complementary approaches, useful to handle hundreds to thousands of X-ray patterns. Principal-component analysis (PCA) has been applied to these fields in the last few years to speed up analysis with the specific goals of assessing data quality, identifying patterns where a reaction occurs, and extracting the kinetics. PCA is applied to the adsorption/desorption of Xe and CO2 within a Y zeolite. CO2 sequestration is a key issue in relation to climate change, while Xe is a critical raw material, and its purification is an important topic for the industry. At first, results were compared to traditional sequential Rietveld refinement. CO2-Y data were also compared with in situ single crystal data to investigate the different potentialities of PCA in the two cases. Two CO2 adsorption sites were confirmed, while three Xe sites were identified. CO2 showed a more linear adsorption trend with decreasing temperature, while Xe showed a more sigmoidal-like trend. Xe only showed site-dependent behavior in adsorption. Finally, PCA and correlation analysis, applied to analyze the parameters obtained from Rietveld refinement, highlighted finer details: in particular, this approach showed that the Y zeolite framework responded differently to CO2 and Xe adsorption.

1. Introduction

The study of microporous [1] and layered [2,3] materials by X-ray powder diffraction (XRPD) can give useful structural and dynamic information on these systems, making it very interesting for many industrial applications. Detectors with high spatial and energy resolution, both 2D [4] and 1D, installed both on lab instruments [5] and synchrotron facilities [6], allow the monitoring of solid-state reactions by in situ X-ray powder diffraction from subsecond to minute scales, with the production of large amounts of data. Analysis can also be carried out in microdiffraction conditions, with a data matrix with intensity values (I) depending on one crystallographic variable ( 2 θ ), one time-dependent variable (temperature or time itself), and two spatial variables ( x , y of the analyzed surface) [7]. The complexity of the space and the amount of data represent the typical issue of the XXI century crystallographer, i.e., how to quickly and efficiently analyze thousands of X-ray datasets, possibly combined with data from other probes [8]. Traditional “one-by-one” pattern refinement needs complementary approaches that are useful to handle hundreds to thousands of X-ray patterns. As pointed out by Rajan et al. [9], multivariate methods still have huge undiscovered potentialities in material sciences in general and crystallography in particular [10]. The scope is, in general, to mine and better exploit the information coming from different databases and experiment data, as clearly described for the Ti–Al alloy example [11]. In this paper, we intended to exploit a similar approach but adding the time variable, thus using principal-component analysis (PCA) to retrieve the properties of materials, in particular the crystal structure, as a function of an external stimulus, in this case temperature. In the last few years, new methods of analysis of in situ XRD data were developed, starting from the concept of modulation-enhanced diffraction (MED) [12], applied to gas adsorption in zeolites [13]. To overcome the limitation of MED [14], the use of principal component analysis (PCA) as a new tool for in situ XRPD data analysis was explored. The adsorption of the simplest possible gas (monoatomic Xe) into an MFI zeolite [15,16] was studied at first, and then more complex solid-state reactions [17] were faced, comparing the results to the traditional approach [18]. Recently, the approach was extended to multiprobe analysis in presence of complex adsorbates such as indigo within palygorskite to form Maya blue [19]. CO2 desorption from a Y zeolite was already studied by in situ single-crystal diffraction, and the data were analyzed by both the traditional approach (manual or semiautomatic refinement) and PCA [8]. This work highlighted the problems and potentialities of PCA in the single-crystal experiment where the amount of information is much larger than that in powder diffraction. In this paper, PCA is applied to in situ XRPD data collected during the adsorption and desorption of Xe and CO2 within a Y zeolite. CO2 sequestration is a key issue in relation with climate change [20], while Xe is an important raw material, and its purification and storage are important issues for the industry [21,22]. At first, PCA results were compared to those from traditional Rietveld refinement. CO2-Y in situ XRPD results were then compared with in situ single-crystal data to clarify potentialities and limitations in the two different techniques in the study of gas adsorption in microporous materials in particular and material sciences in general. The combined Rietveld/PCA approach was exploited to deeply analyze the structural features of Xe and CO2 adsorption within a Y zeolite and the corresponding response of the Y framework. The framework/cations/gas interactions have been deeply studied in previous works, especially for the CO2 case [23,24]. The present work is mainly focused on the structural response of the zeolite during temperature ramp and gas absorption, a topic where many questions are still open.

2. Results

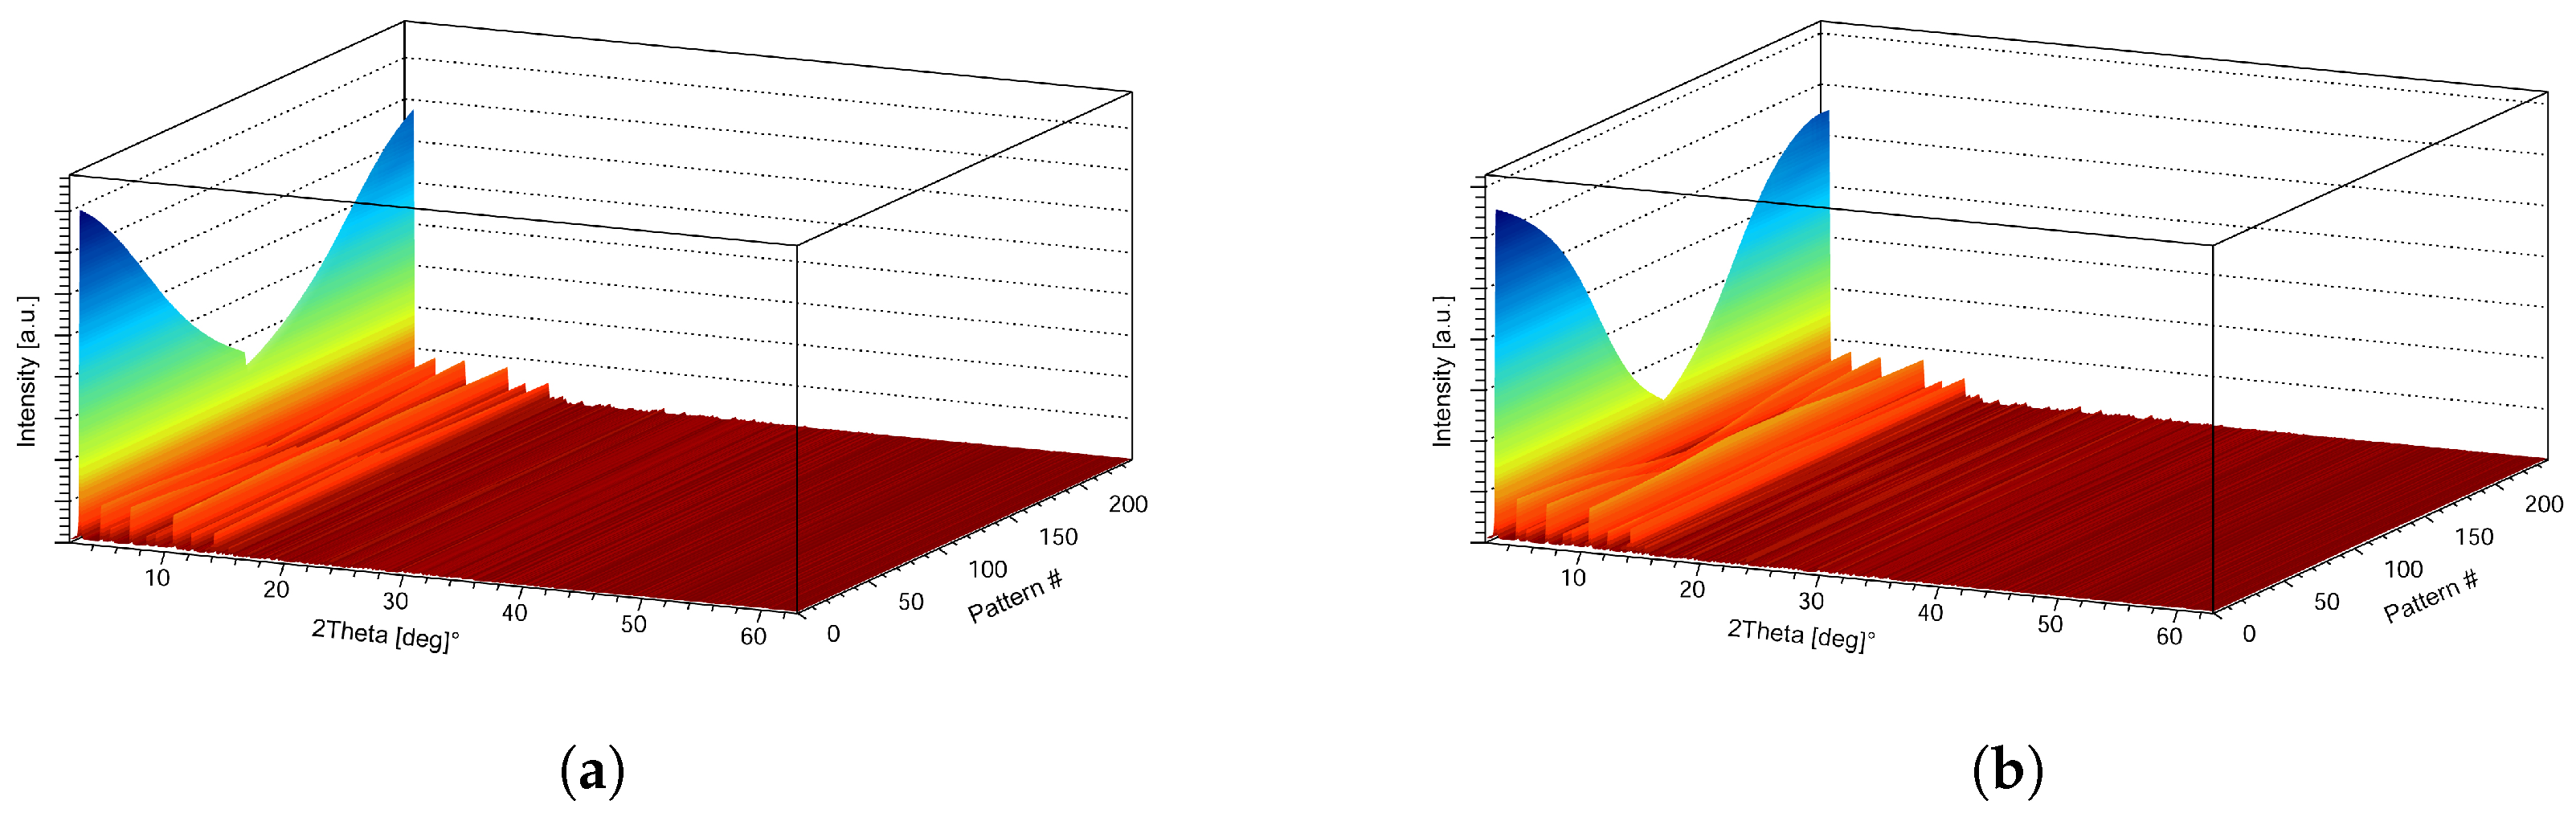
2.1. In Situ XRPD Data on CO2 and Xe Adsorption/Desorption within Y Zeolite

In situ XRPD data were collected from 300 K to 200 K and back to 300 K to fully explore both the adsorption and the desorption process. Data are reported in Figure 1. Visual inspection of the data indicated that the main change is the expected modification of the basal peak at 2 θ = 2.8 . Only a small difference between Xe and CO2 main peak variation could be observed by first-sight analysis of the data matrix, Xe being less linear than CO2.
Data were analyzed by the traditional Rietveld refinement approach in Section 2.2. PCA was carried out on raw in situ XRPD data (Section 2.3) pointing out the capacity of PCA to efficiently extract dynamic information from in situ XRPD data without the need of a priori information on the crystal structure. PCA and Rietveld analysis are discussed together (Section 3), using PCA to also examine parameters coming from Rietveld refinement. This approach with correlation analysis (Section 3.3) allowed for a deep investigation of CO2 and Xe adsorption behaviors and of the Y zeolite framework response.

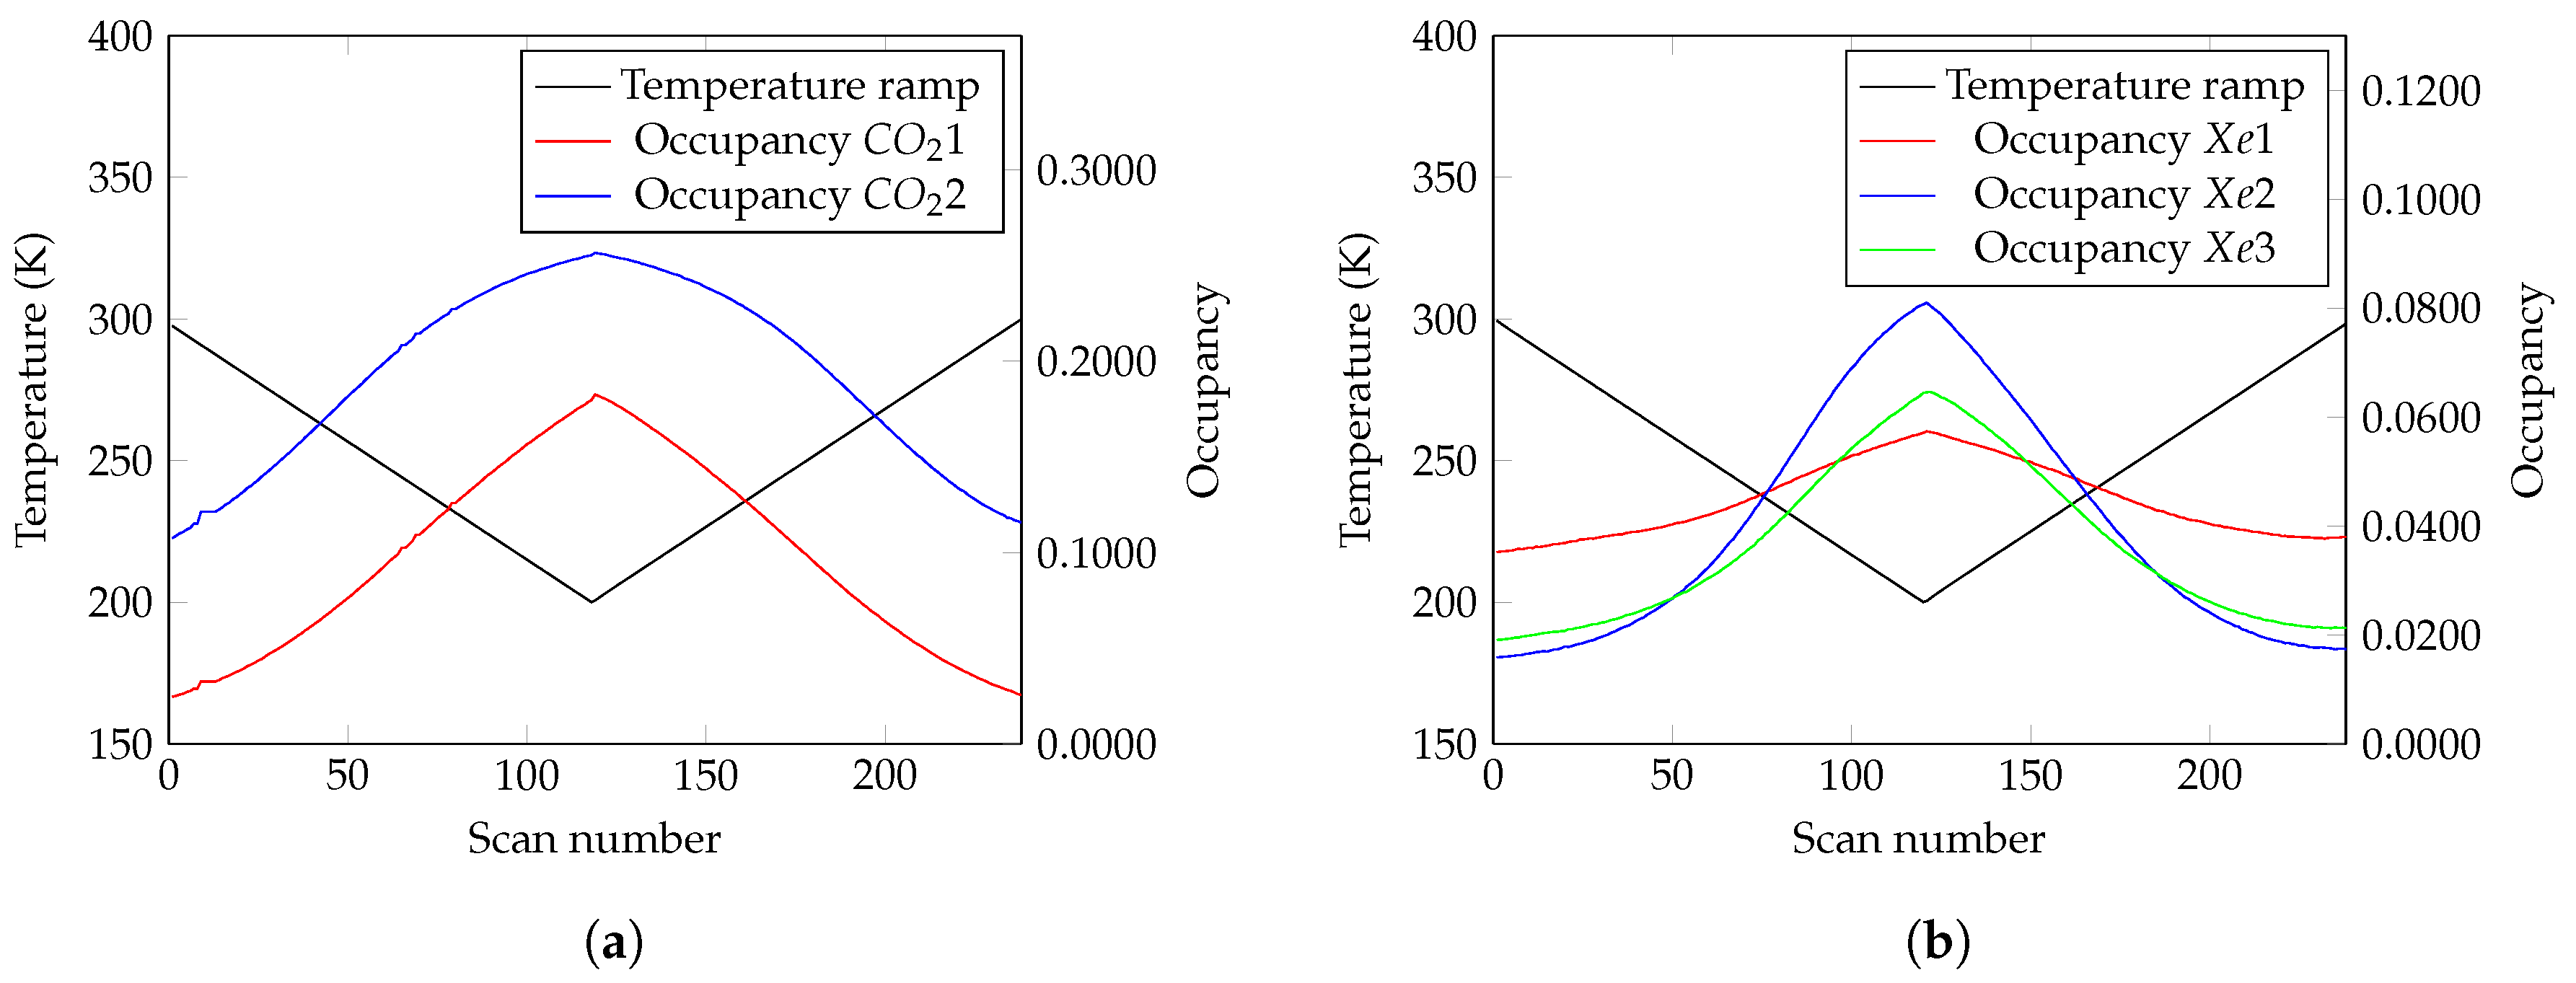
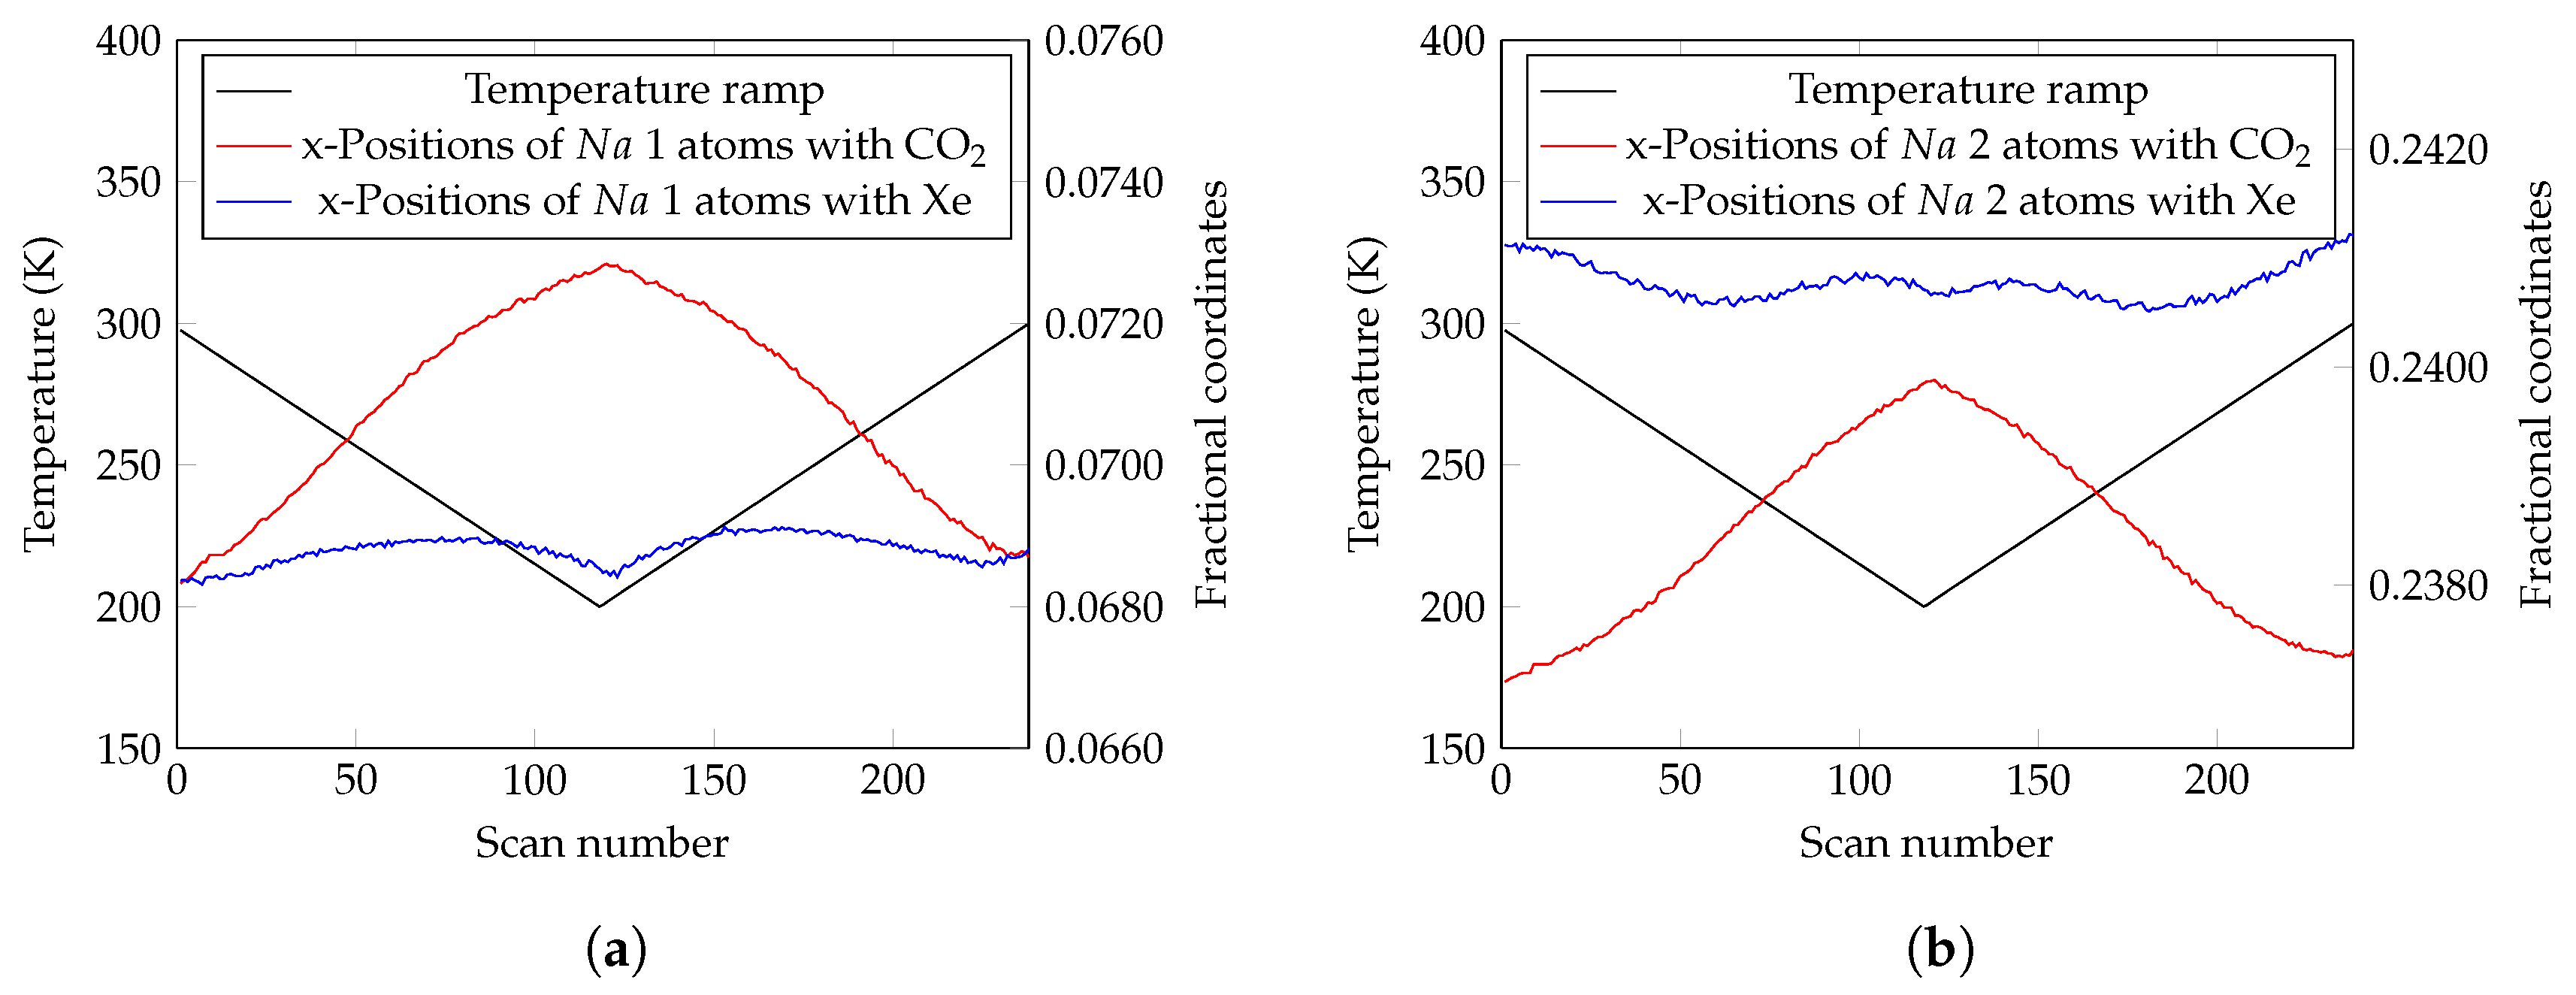
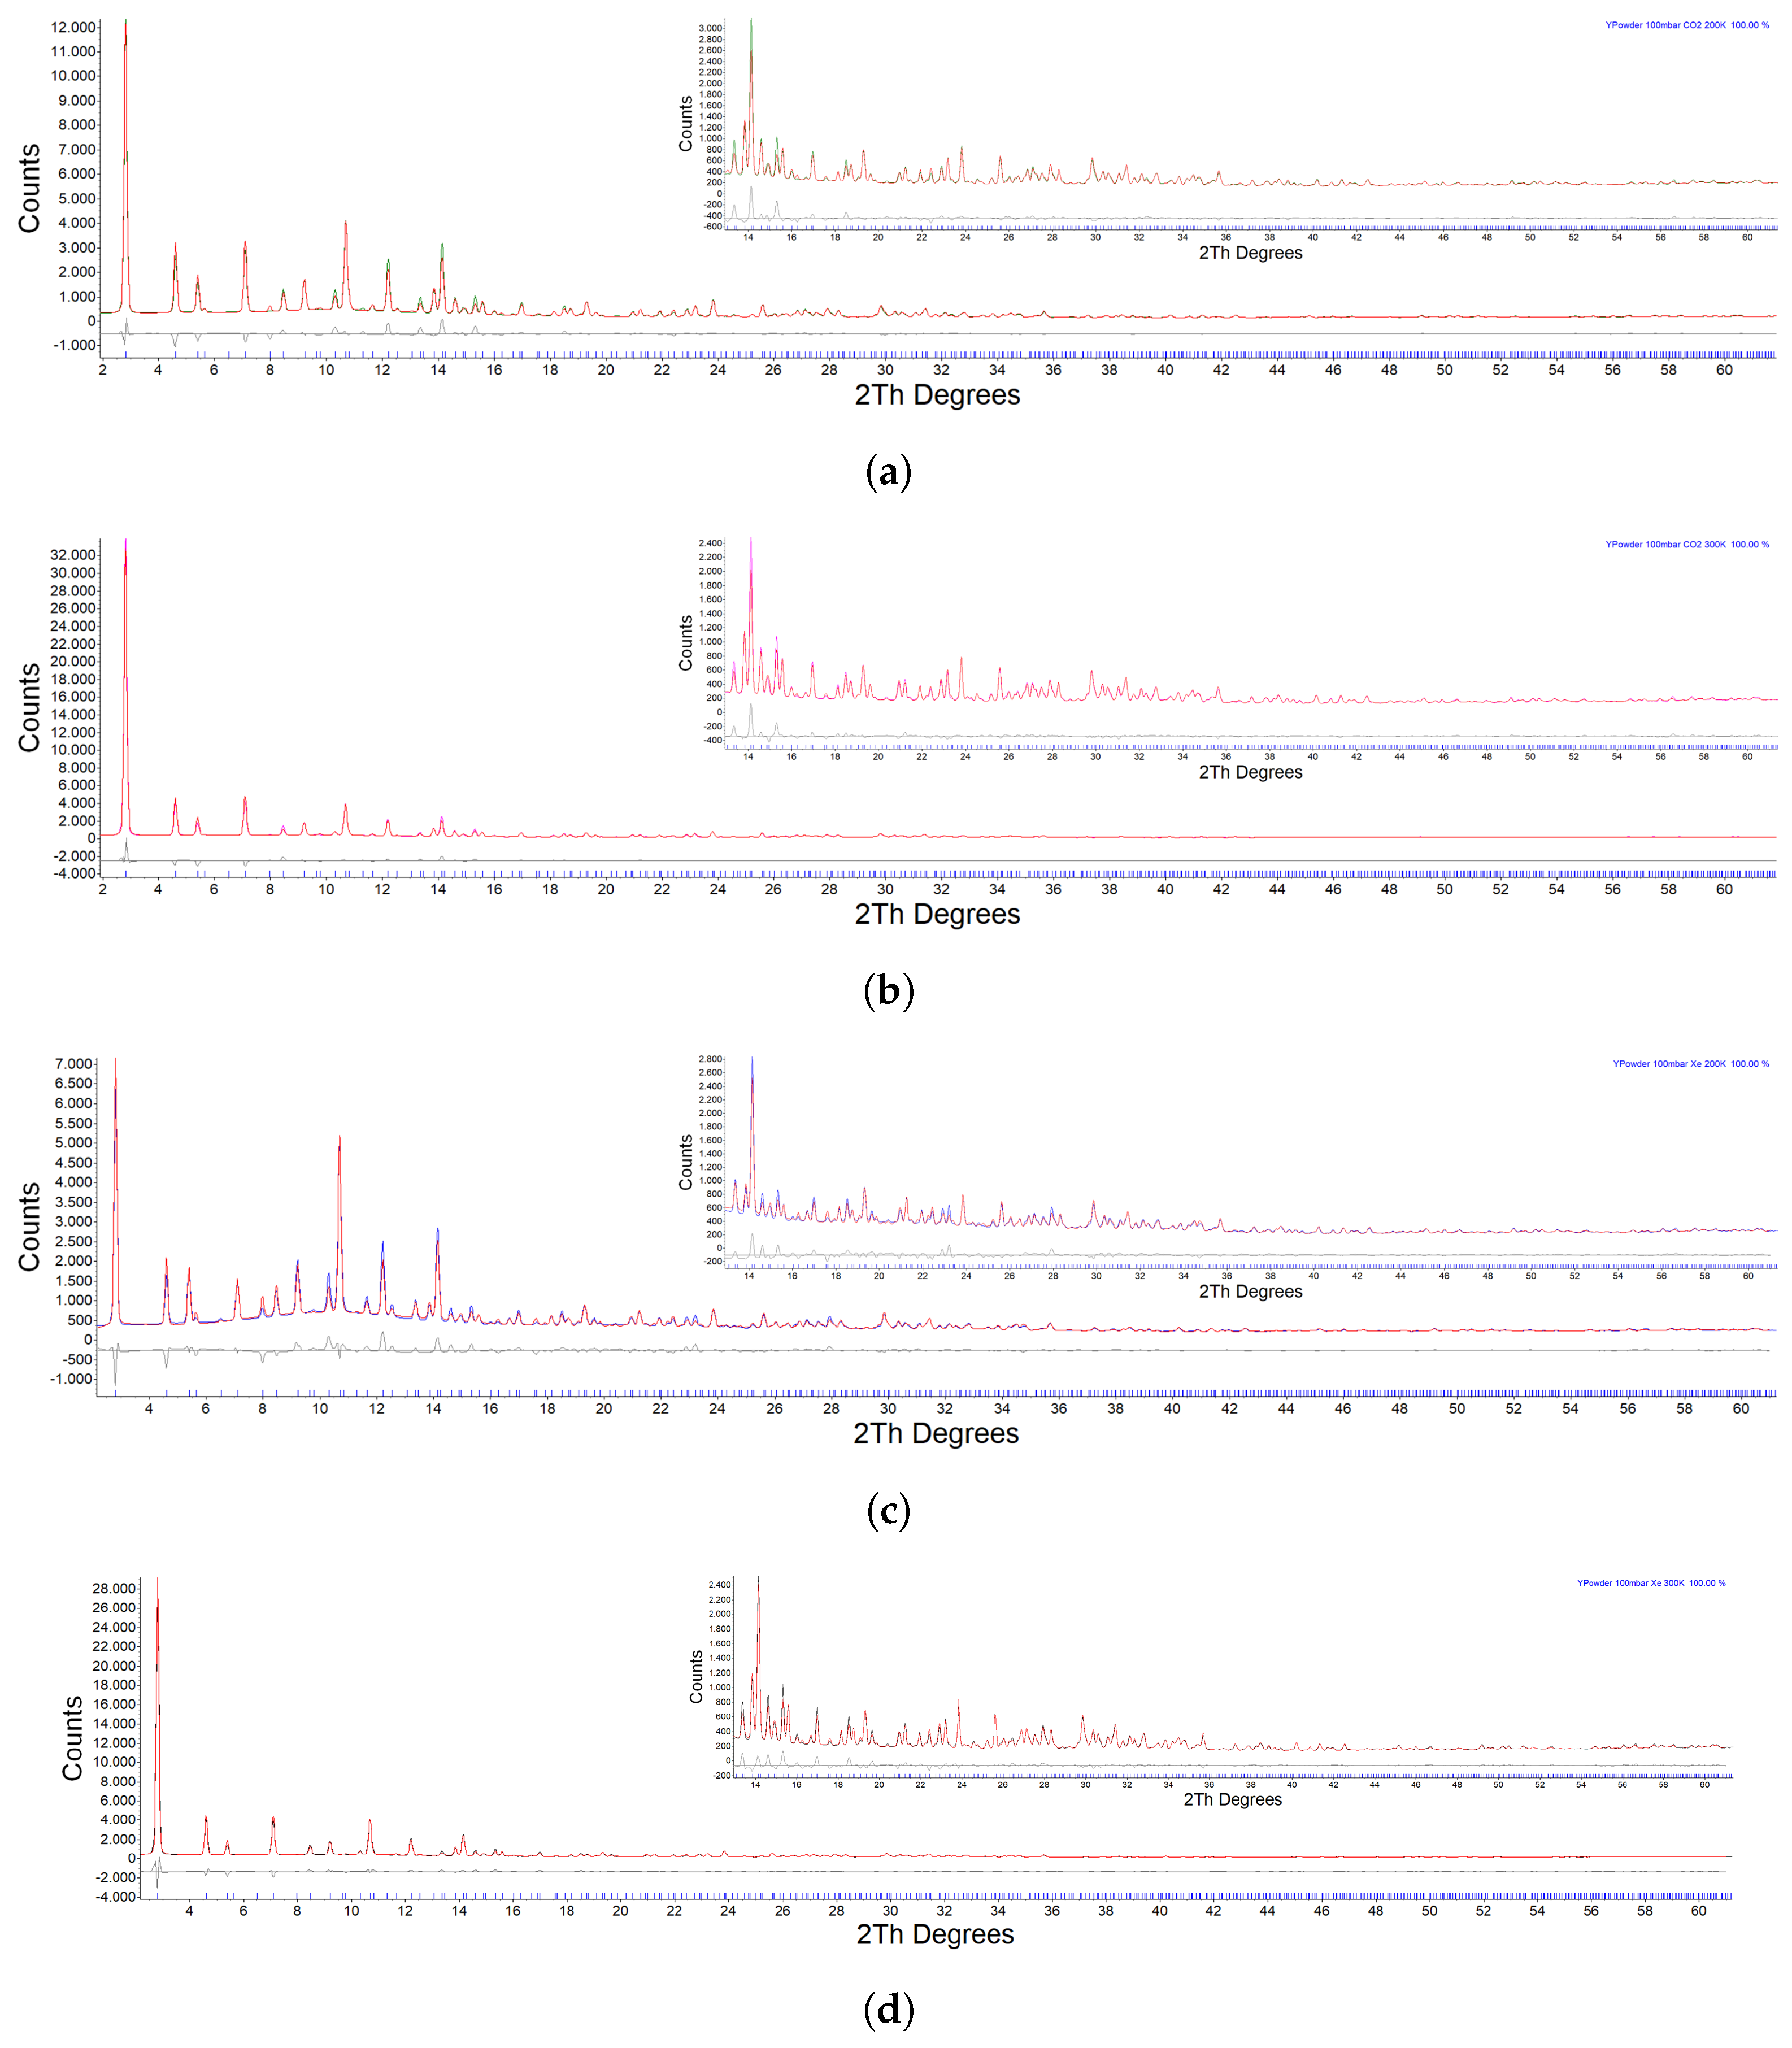
2.2. Rietveld Analysis of In Situ XRPD Data

Sequential analysis of in situ XRPD data was carried out with the approach reported by some of us [25]. The agreement indices showed small variations that were rather regular and small enough (Table 2) to confirm that data collection and analysis were properly carried out, and refinements were rather stable and consistent with each other. The variation of the refined parameters was not linear on the one hand because of the nonlinear behaviors of the diffracted intensities and experimental parameters, and, on the other hand, because of the peculiar phenomena occurring at low temperatures, when chemical adsorption is more evident, on both cases. Analysis of Xe or CO2 occupancy and positions gave very interesting information of the adsorption/desorption process (Figure 2). CO2 behavior is more linear, while Xe needs an induction period since the interaction is weaker, and absorption is marked only at lower temperatures. However, evident differences could be seen among adsorption sites. The two CO2 molecules showed similar variations, close to linear with the temperature, with different absolute values (Figure 2a). The three Xe sites showed less linear behavior, with one site (Xe1) with a very small occupancy change (Figure 2b).
The first and more evident response to gas absorption is from Na+ ions, showing remarkable changes in their position, with behaviors showing trends similar to those of gas occupancy in the CO2 case (Figure 3, red curves). Conversely, in the case of Xe adsorption, Na+ ions showed only small position variations (Figure 3, blue curves).
The Y zeolite framework responded to Na+ ion and gas movements. Si and O atoms move with complex behavior depending on temperature variations. These subtle effects are discussed in more detail in Section 3.3.

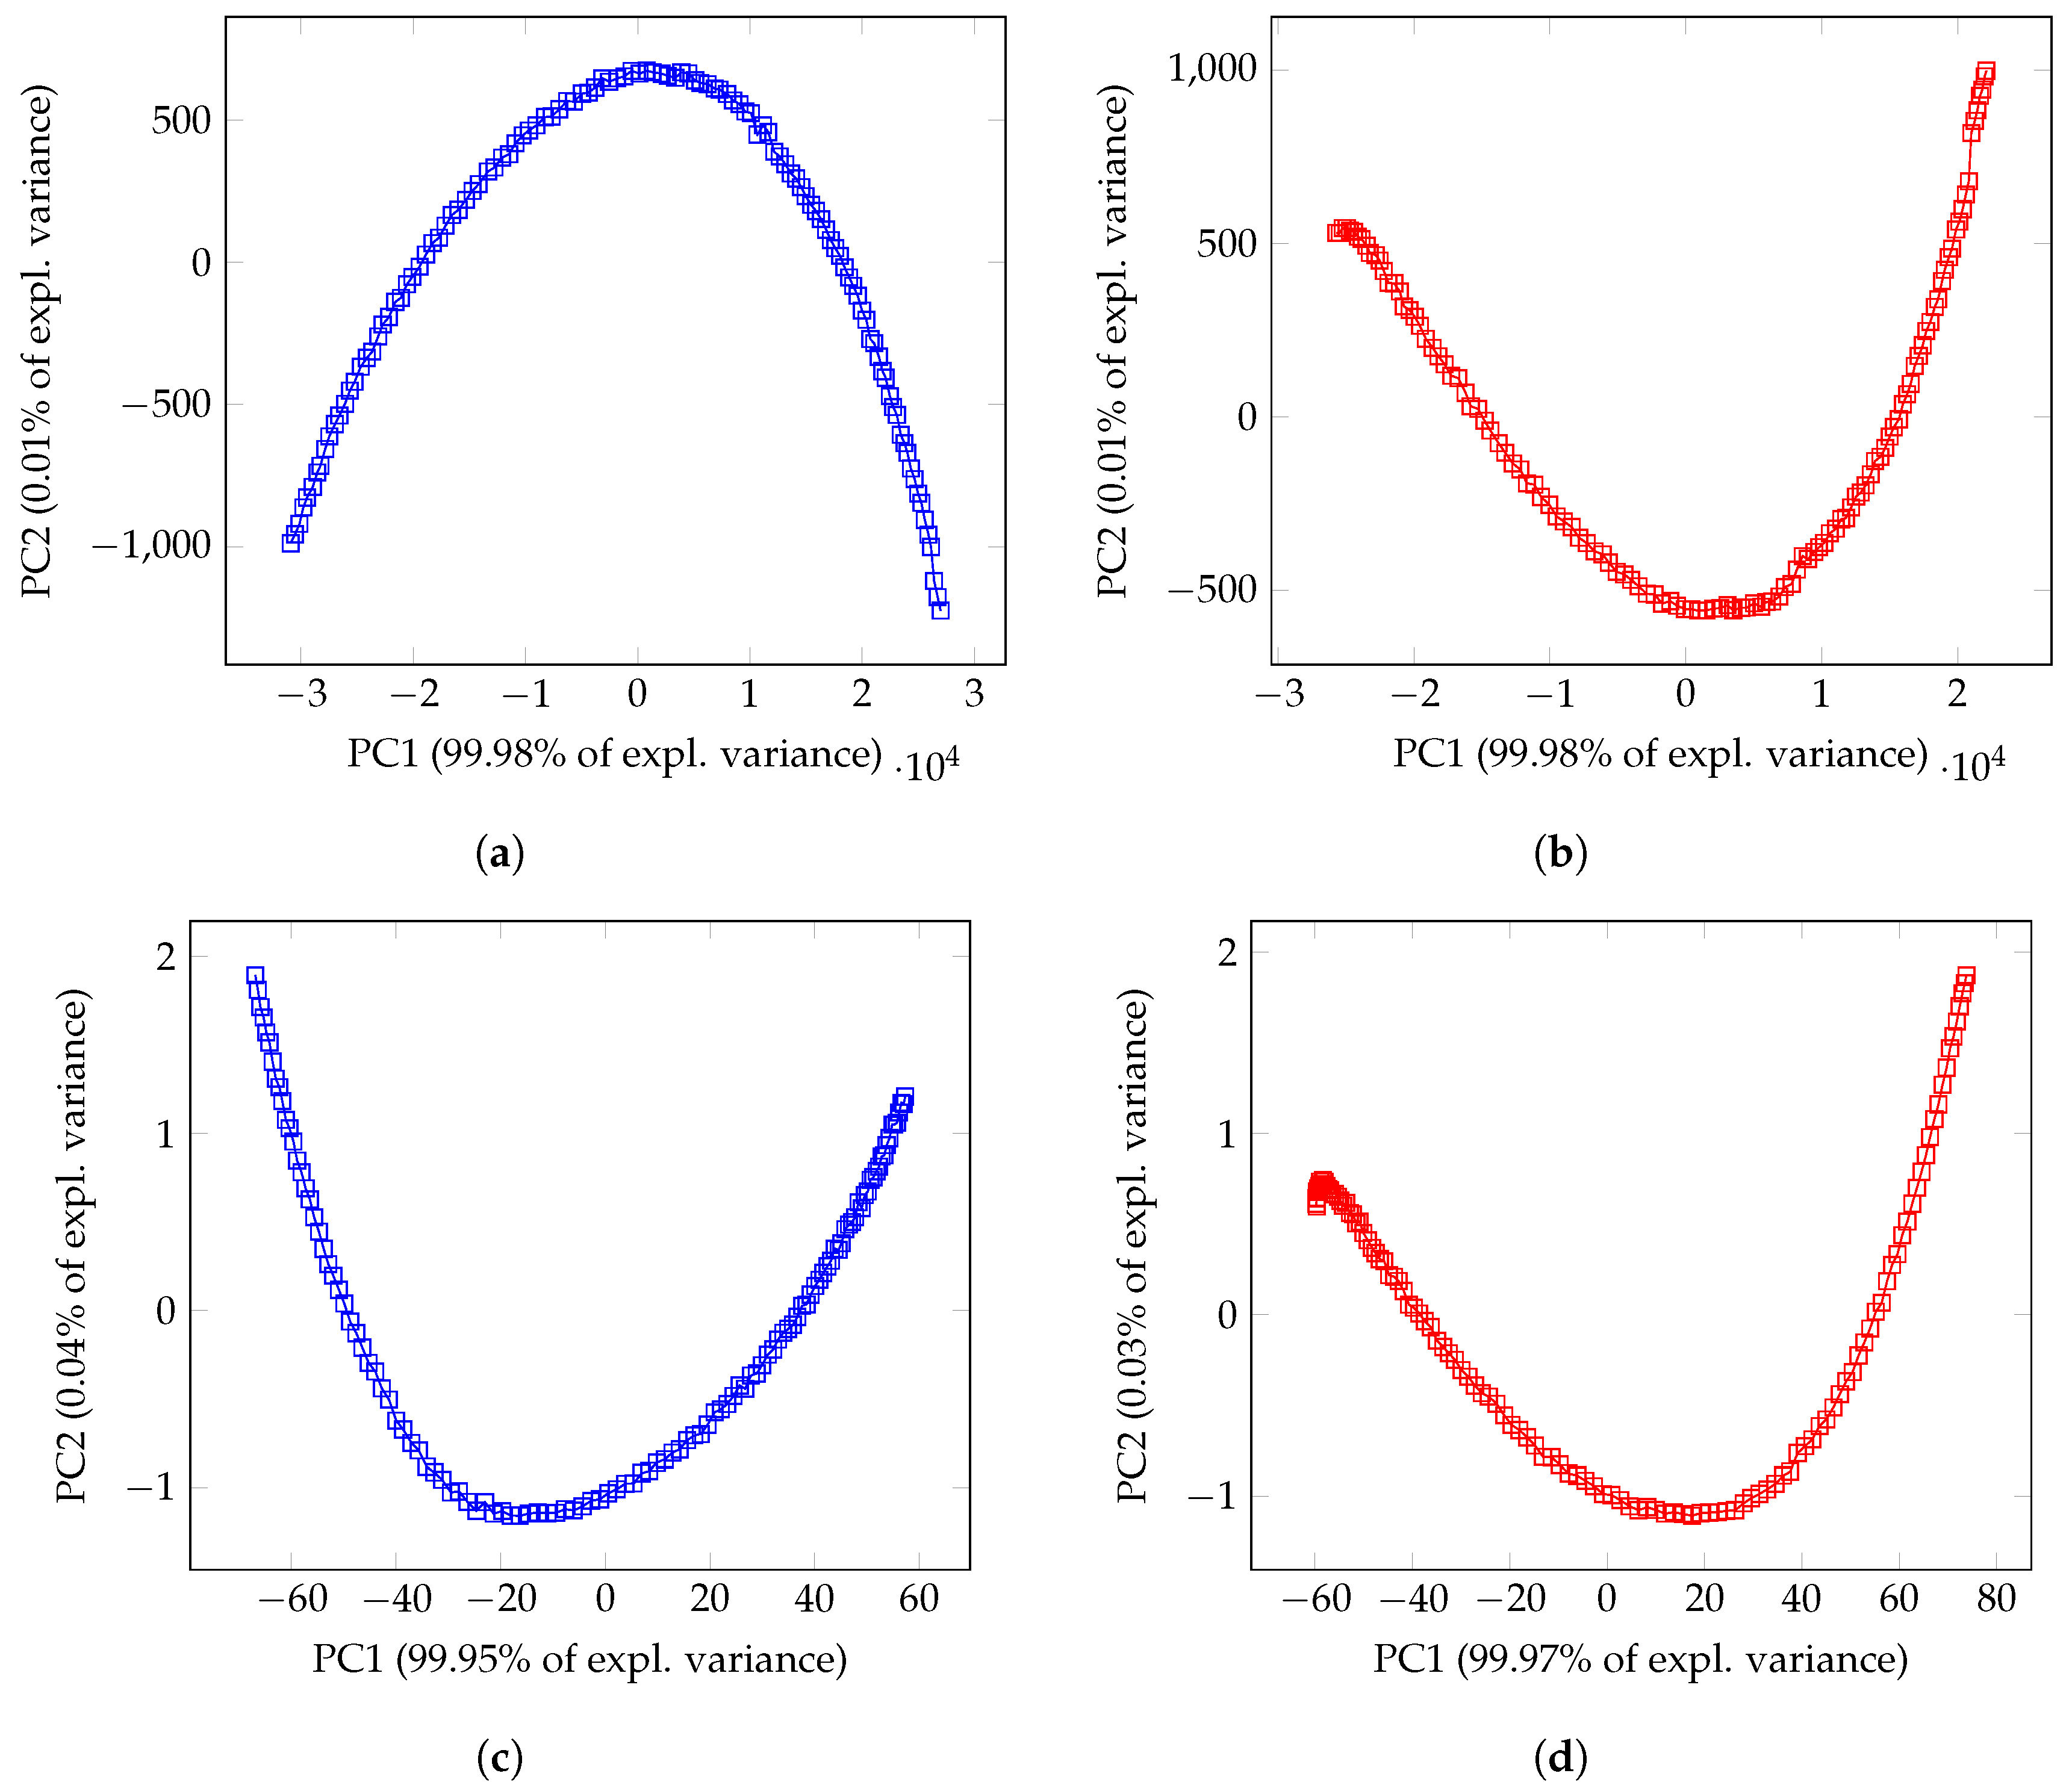
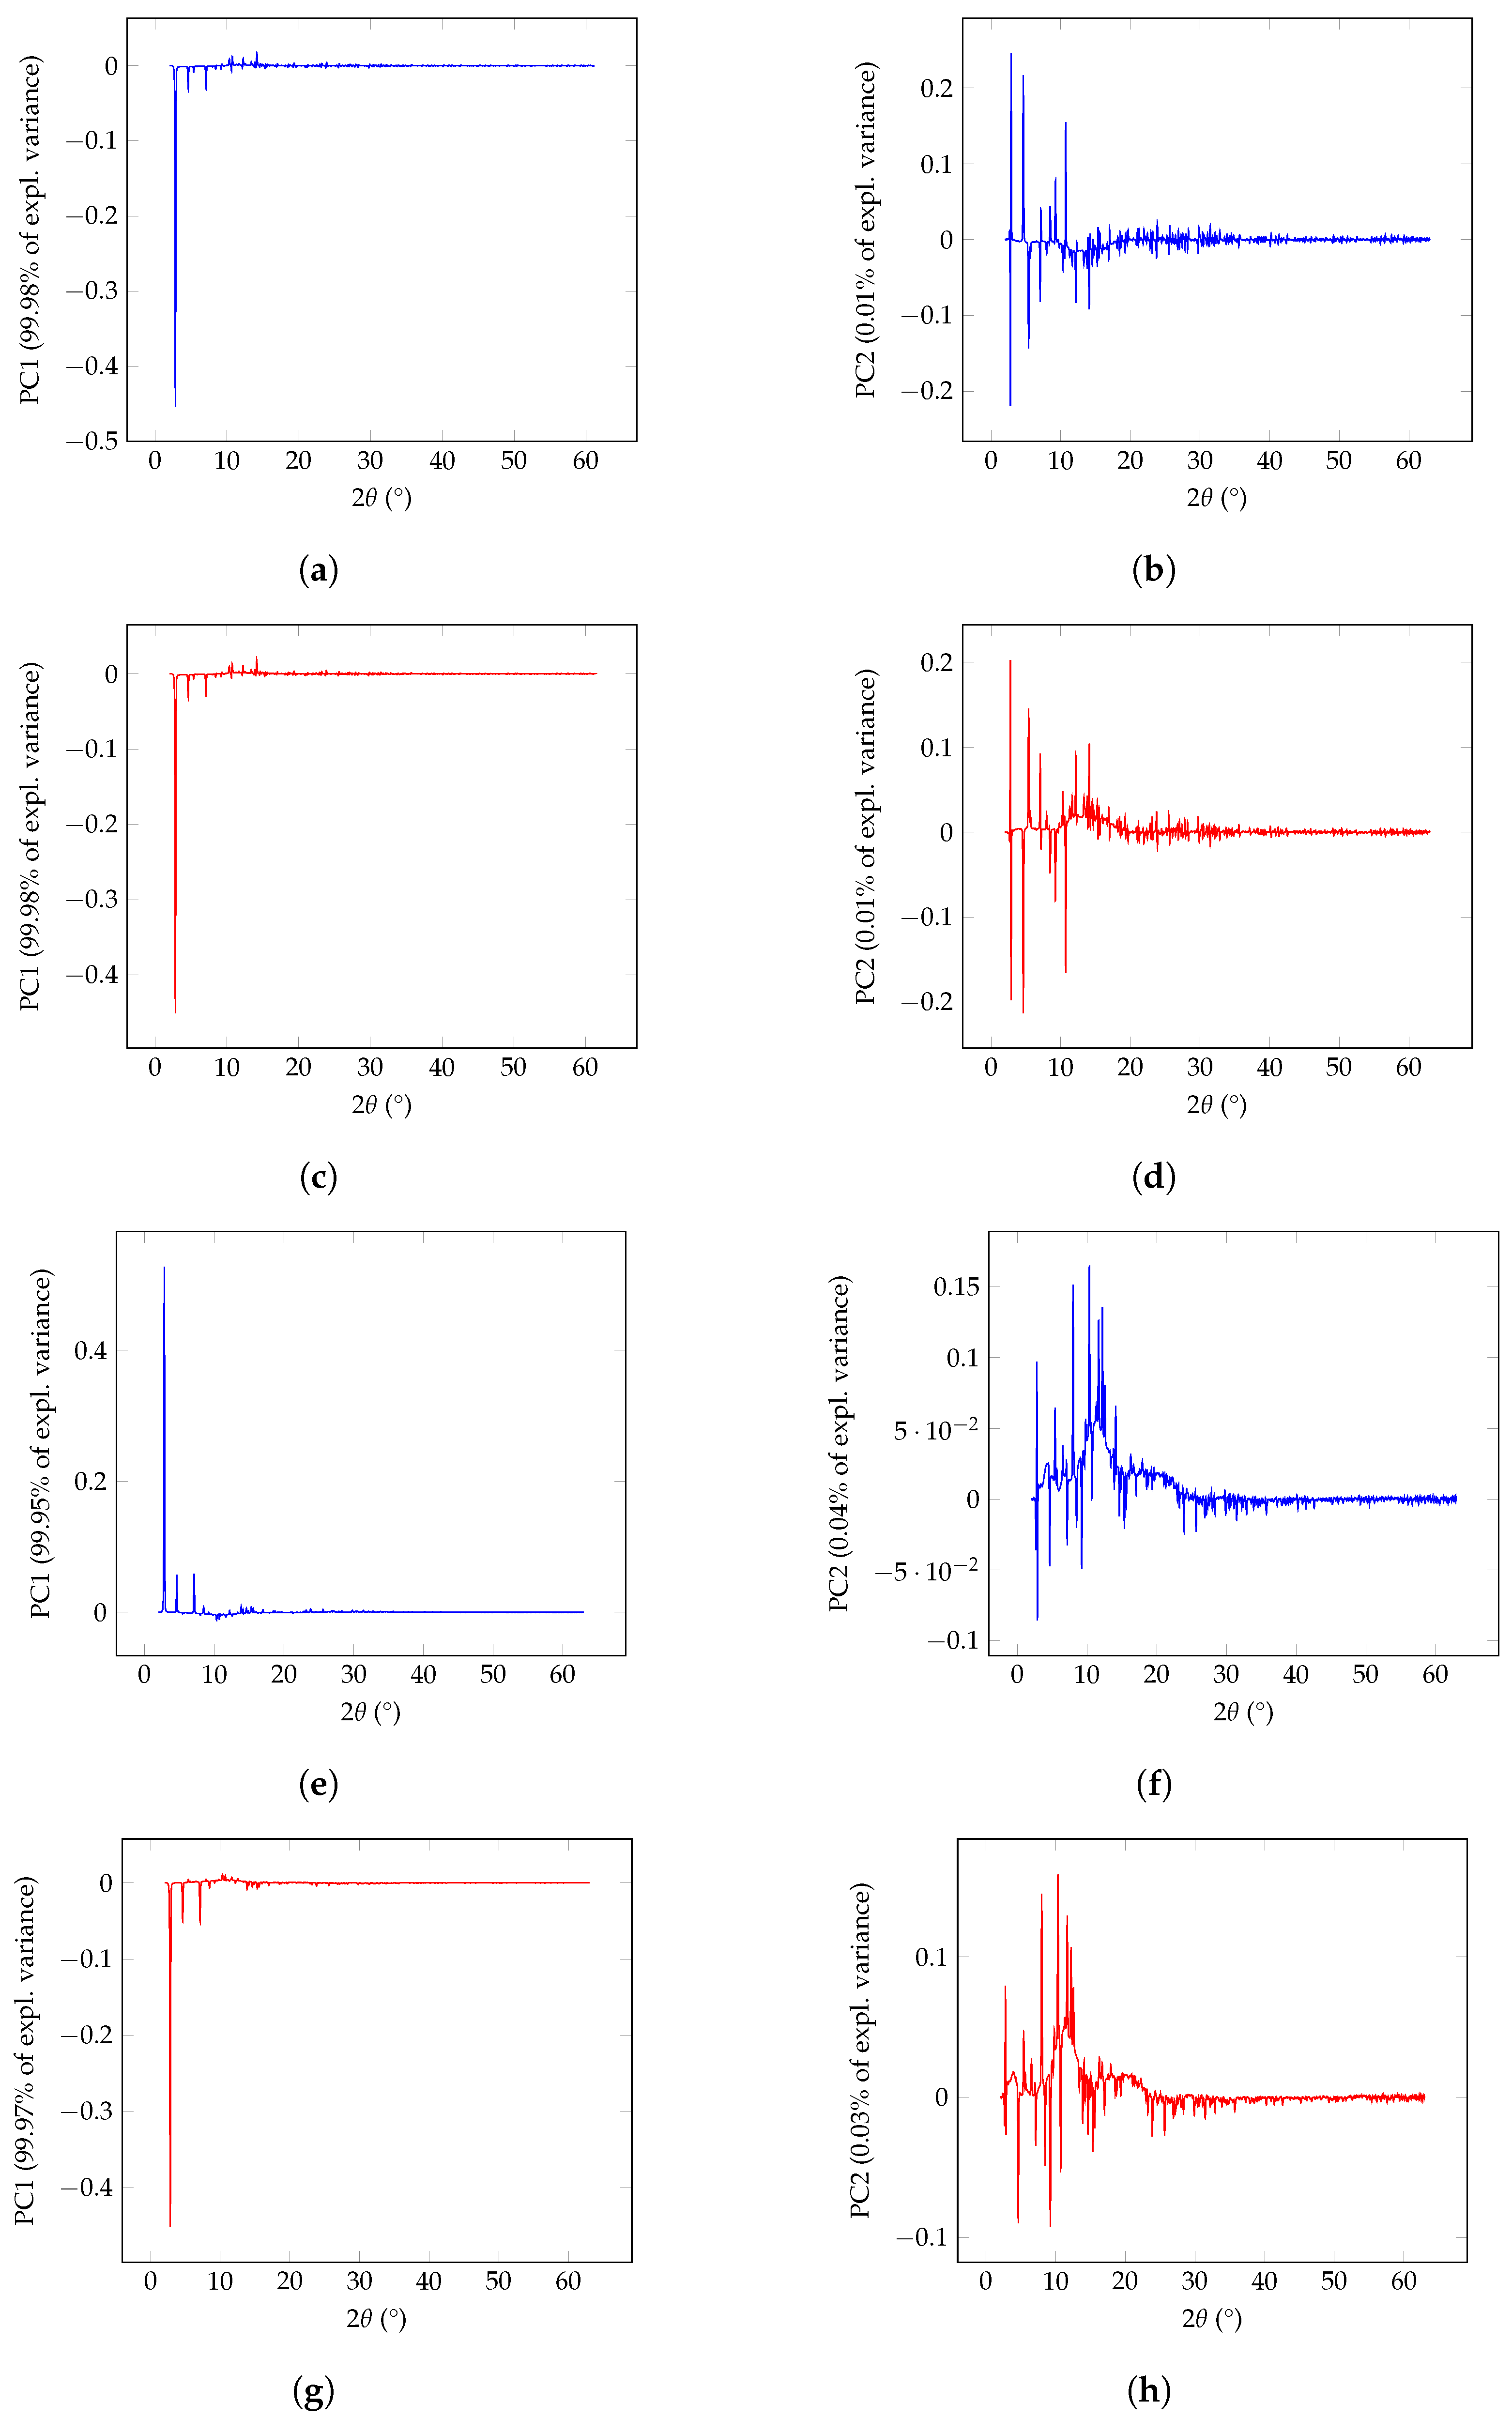
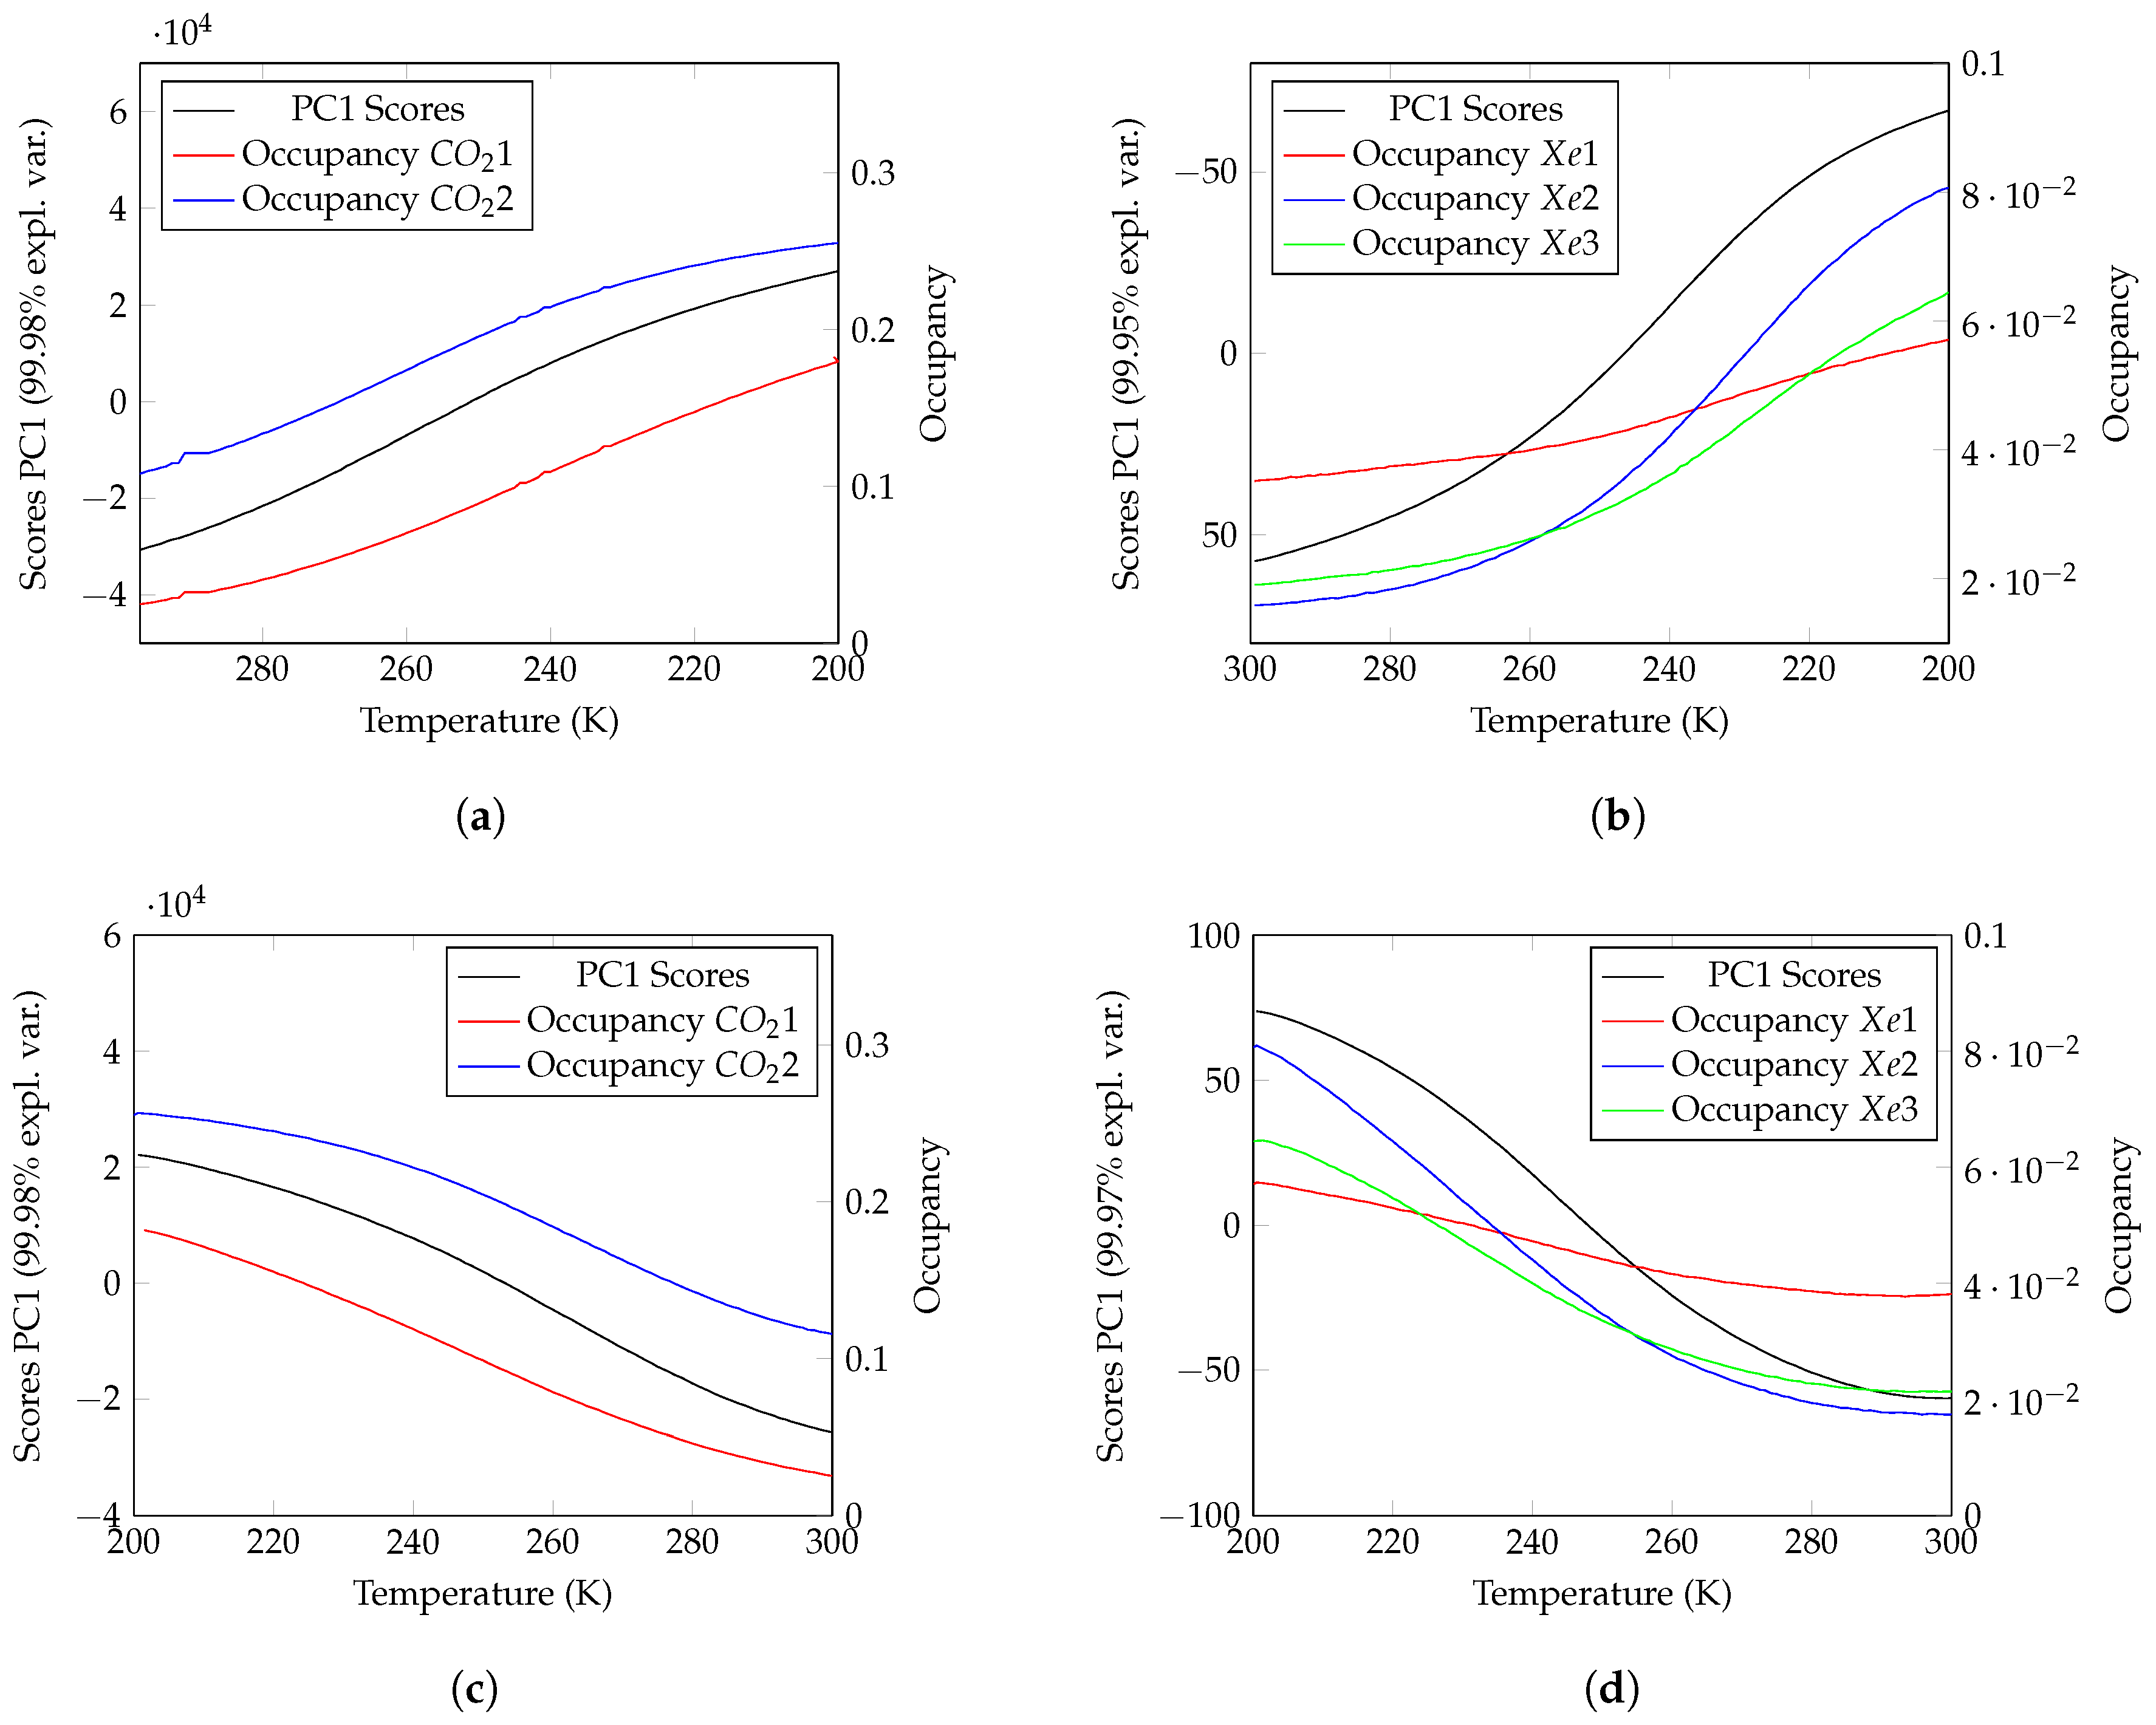
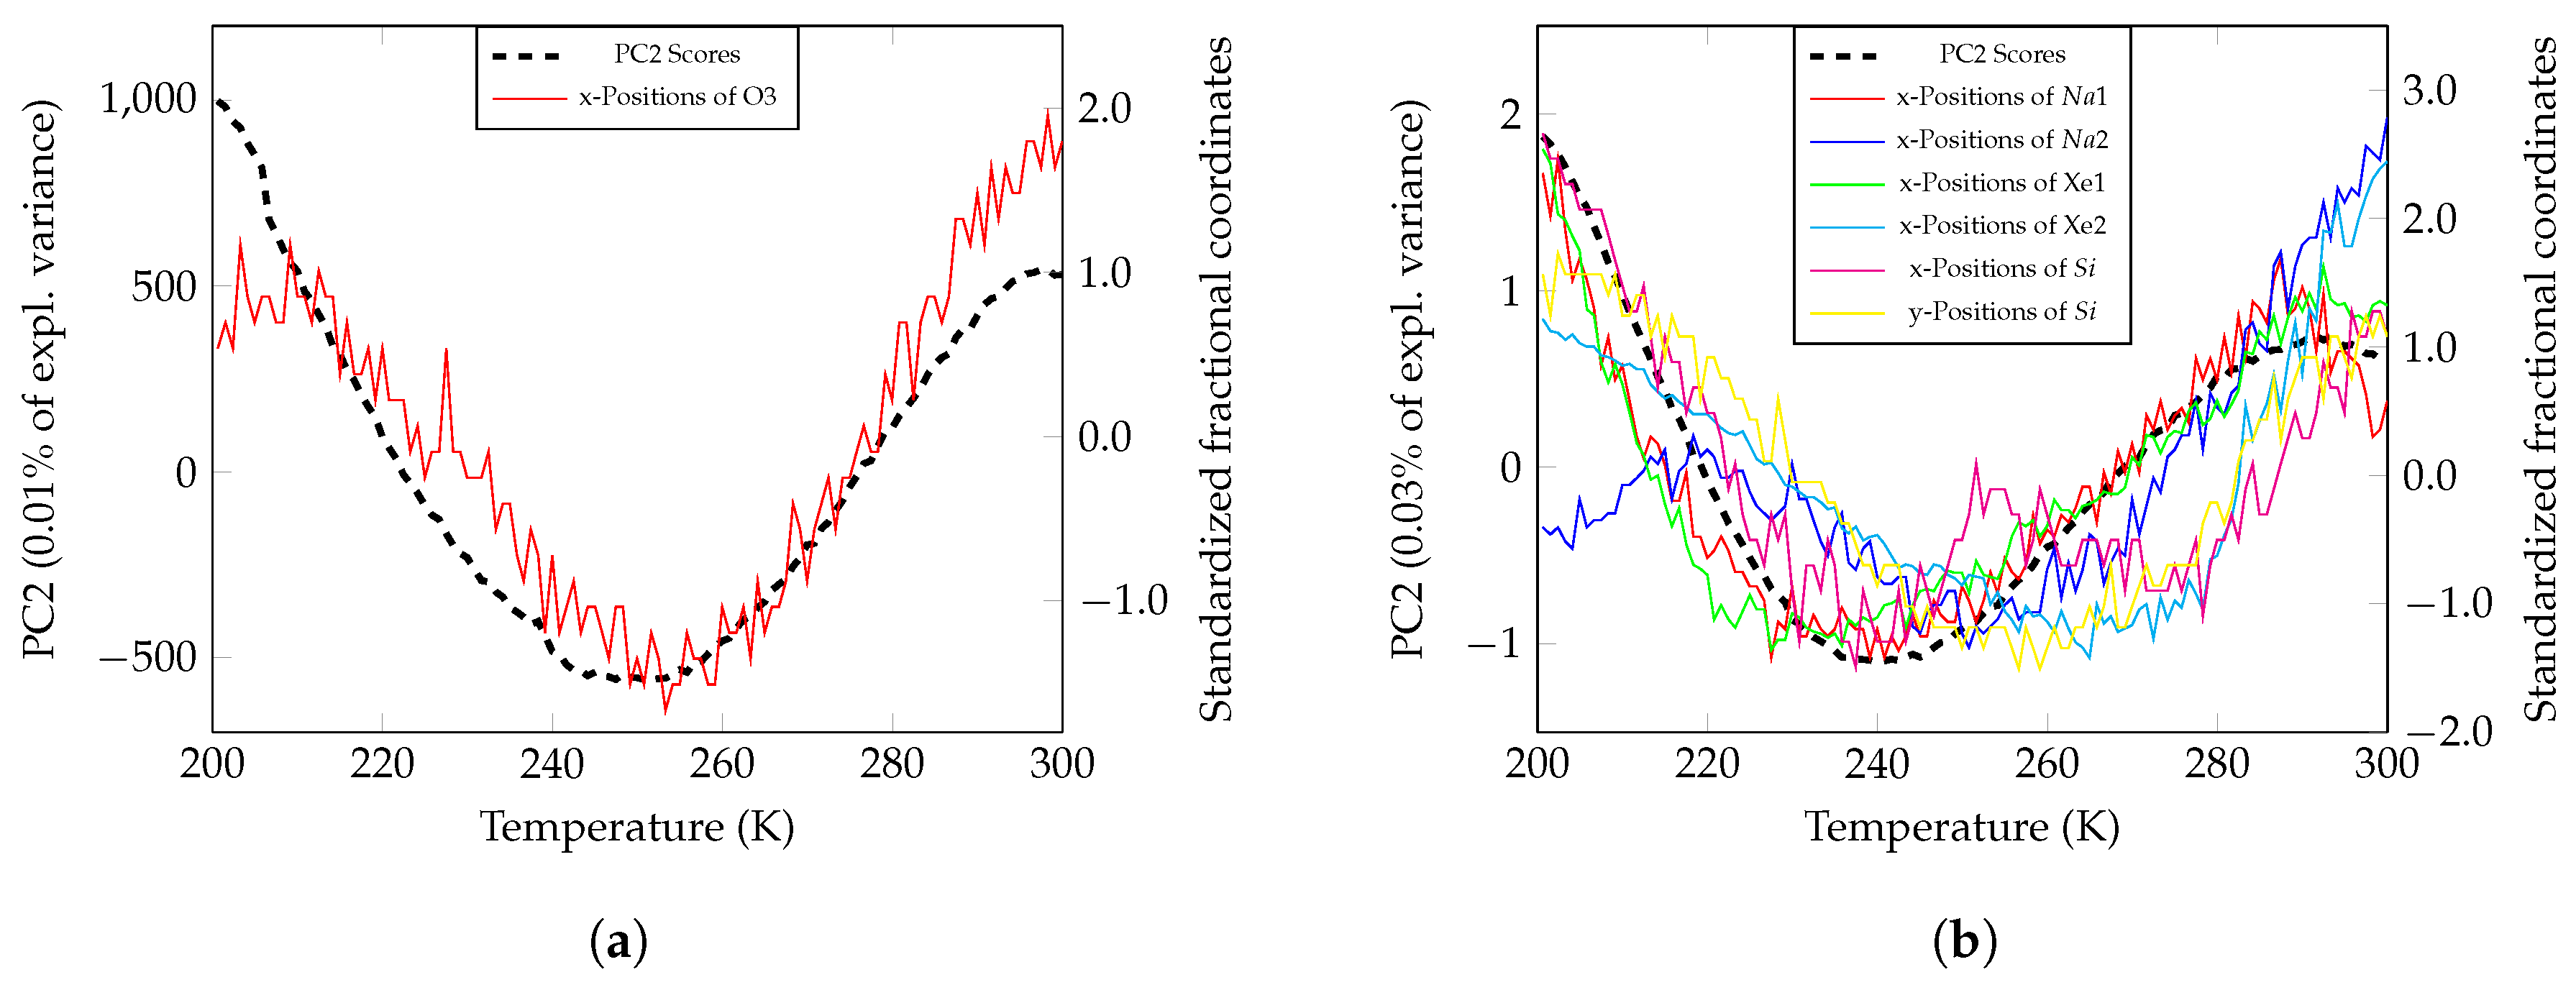
2.3. PCA of Raw In Situ XRPD Data

PCA was carried out as detailed in our previous papers [8,15,17], confirming its capacity in detecting system dynamics in a few seconds. According to MED theory and its correspondence to PCA [15], two PCs describe most of the variance (PC1 always around 99% and PC2 the remaining 1% or less) of the data: PC1 vs. PC2 scores showed parabolic behavior (Figure 4). While in MED the parabolic behavior of PC2 vs PC1 (Figure 4) is expected because the same active atoms contribute to both the mixed term (captured by PC1 and depending linearly by time) and to the active term (captured by PC2 and depending by the time squared) in the present data, instead PC1 is dominated by occupancy variations of Xe ions/CO2 molecules (Figure 7), while PC2 is dominated by the oscillations of the atoms from the framework (Figure 7). This indicated that PC1 scores (Figure 6) followed the dynamics of the system, dominated by CO2 and Xe occupancies during adsorption, while PC2 showed the details of active atoms responding to the stimulus (temperature variation). This peculiar parabolic behavior of PC1 vs. PC2 scores can be, at first sight, referred as the Guttman or “horseshoe effect” [26]. This effect can be given by a Toeplitz data matrix or other kinds of diagonal band matrices (e.g., those that show a Guttman scale) [27]. Nevertheless, in this case, we were in the presence of a temperature stimulus, and this behavior was thus a genuine effect like others previously observed [28]. Moreover, the parabolic relationship between first and second harmonics in in situ XRPD data was forecast by modulation-enhanced-diffraction theory (MED; Equation (3) and its discussion in [12]). The correspondence highlighted by Palin et al. in [15] between PCA and MED confirmed that, when the horseshoe effect is seen in PCA of in situ XRPD (and not only) data, PCA is extracting information about system dynamics in a MED-like fashion, with PC1 describing the system dynamics (i.e., the direct response of the system to the stimulus), and PC2 describing the behavior of the active part of the structure. One difference from the MED approach is that PC2 loadings are not of definite sign (Figure 5), as expected from MED decomposition. Considering that the sign of PC loadings is arbitrary (parabola opening up or down being nonsignificant), small changes could at first be observed when comparing the Xe and CO2 plots in Figure 4, because of the different adsorption features of the two gases. Small differences were evident between the ramp up and down of the same gas, suggesting non fully reversible behavior and a small hysteresis effect. The data explained by PC1 and PC2 are evident in Figure 5. PC1 was dominated by the low angle peak, the typical indicator of channel occupancy in Y zeolite, and PC2 by medium angle peaks. The much more pronounced background of Xe data in Figure 5f,h can be explained by the more disordered behavior of Xe and its much larger scattering power, resulting in a much bigger non-Bragg scattering component. With the PCA approach we can see here that different types of active atoms are present, which vary their parameters in a coordinated way as a fuction of temperature. These coordinated variations are captured by the first two principal components, giving rise to contributions mimicking MED decomposition. The PCA scores being related to the dynamics of the system are discussed in comparison with the Rietveld refinement results in the next section.

3. Discussion

3.1. Comparison between PCA Carried Out on Raw In Situ XRPD Data and Rietveld Refinements

PC1 scores and gas occupancies by Rietveld refinements, after proper scaling since the PCA scale is arbitrary, followed similar trends (Figure 6). PCA was thus confirmed to be a powerful tool to extract the system dynamics from in situ XRPD (and not only) data. PC1 exactly followed the CO2 occupancies because the two CO2 behaved identically. Conversely, in the case of Xe, PC1 was dominated by the behavior of Xe2 (the site showing the larger changes). Therefore, looking to PCA, only minor differences between Xe occupancies were lost. In fact, PCA results must be interpreted by the user since no direct physical meaning can be directly given to each PC, differently from Rietveld analysis.
PCA is thus able to retrieve system dynamics in agreement with Rietveld data without the need for any a priori knowledge of the structure. As a drawback, PCA-extracted dynamics must be interpreted since no direct physical meaning can be ascribed to such behavior. In this way, PCA is a complementary approach to Rietveld, able to check and screen huge amounts of in situ XRPD data in a few minutes. It can thus be very useful as an online quality check on collected data, and as a screening method to select the datasets that are more interesting for Rietveld analysis, which is much more informative but also much more time-demanding and with an absence or very few degrees of automation.
PC2 scores, according to the PCA–MED correspondence [15], describe the behavior of the active part of the structure. PC2 scores followed similar trends to those of the atom positions in the zeolite structure (Figure 7). A possible interpretation is that the response of the zeolite to gas adsorption is the oscillation of its atoms’ position moving back and forth near the starting position due to the competitive effect of temperature variation and gas adsorption–desorption.

3.2. Comparison between Powder and Single-Crystal Data on CO2 Adsorption within Y Zeolite

A comparison between the application of PCA to in situ single-crystal and powder diffraction data could be carried out for the CO2 case, since a paper was published on the topic by some of us [2]. The more striking difference is that single-crystal data were much richer of information, and two PCs were not enough to describe a significant amount of data variance. In the PCA of single-crystal data, it was possible to obtain trends with which different groups of atoms were moving; from XRPD data, it was only possible to extract a general trend, as described above for CO2 occupancies. Moreover, in single-crystal data analysis, PC1 vs. PC2 did not show a precise parabolic behavior (Figure S13 in the ESI file of [8]). The downside of this richness is complexity. PCA results obtained from single-crystal experiments are more difficult to understand and explain, and one could need to know the structure or to solve and refine it. The other main difference is the type of information that can be obtained. The collection of a complete dataset from a single crystal requires a certain amount of time (at the very least, a few minutes at synchrotron facilities and tenths of minutes with lab instrumentation); therefore, the experiment is much slower, and each dataset during a ramp is collected at the equilibrium. With the advent of fast detectors [29], the collection of a powder pattern is completed in less than one second, allowing to perform kinetic analysis. Therefore in the case of a single crystal, PCA trends are related to the thermodynamic aspects of the reaction, while in the case of powder diffraction, PCA trends are related to kinetics. It can be concluded that the failure of MED–PCA correspondence in a single crystal [8] was related to the richness of information of single-crystal data. In powder-diffraction data, the limited spatial and 2theta resolution makes the trend simpler, and the situation more similar to that depicted by MED, i.e., an atom subset being active and able to respond to the stimulus, while the remaining part is a silent spectator. Besides these methodological differences, the comparison between single crystal and powder data must also take into account the different diffusivity in the two cases. Gas diffusion into a large crystal is slower and more difficult than into a microcrystalline powder, which has a larger surface-area-to-volume ratio.

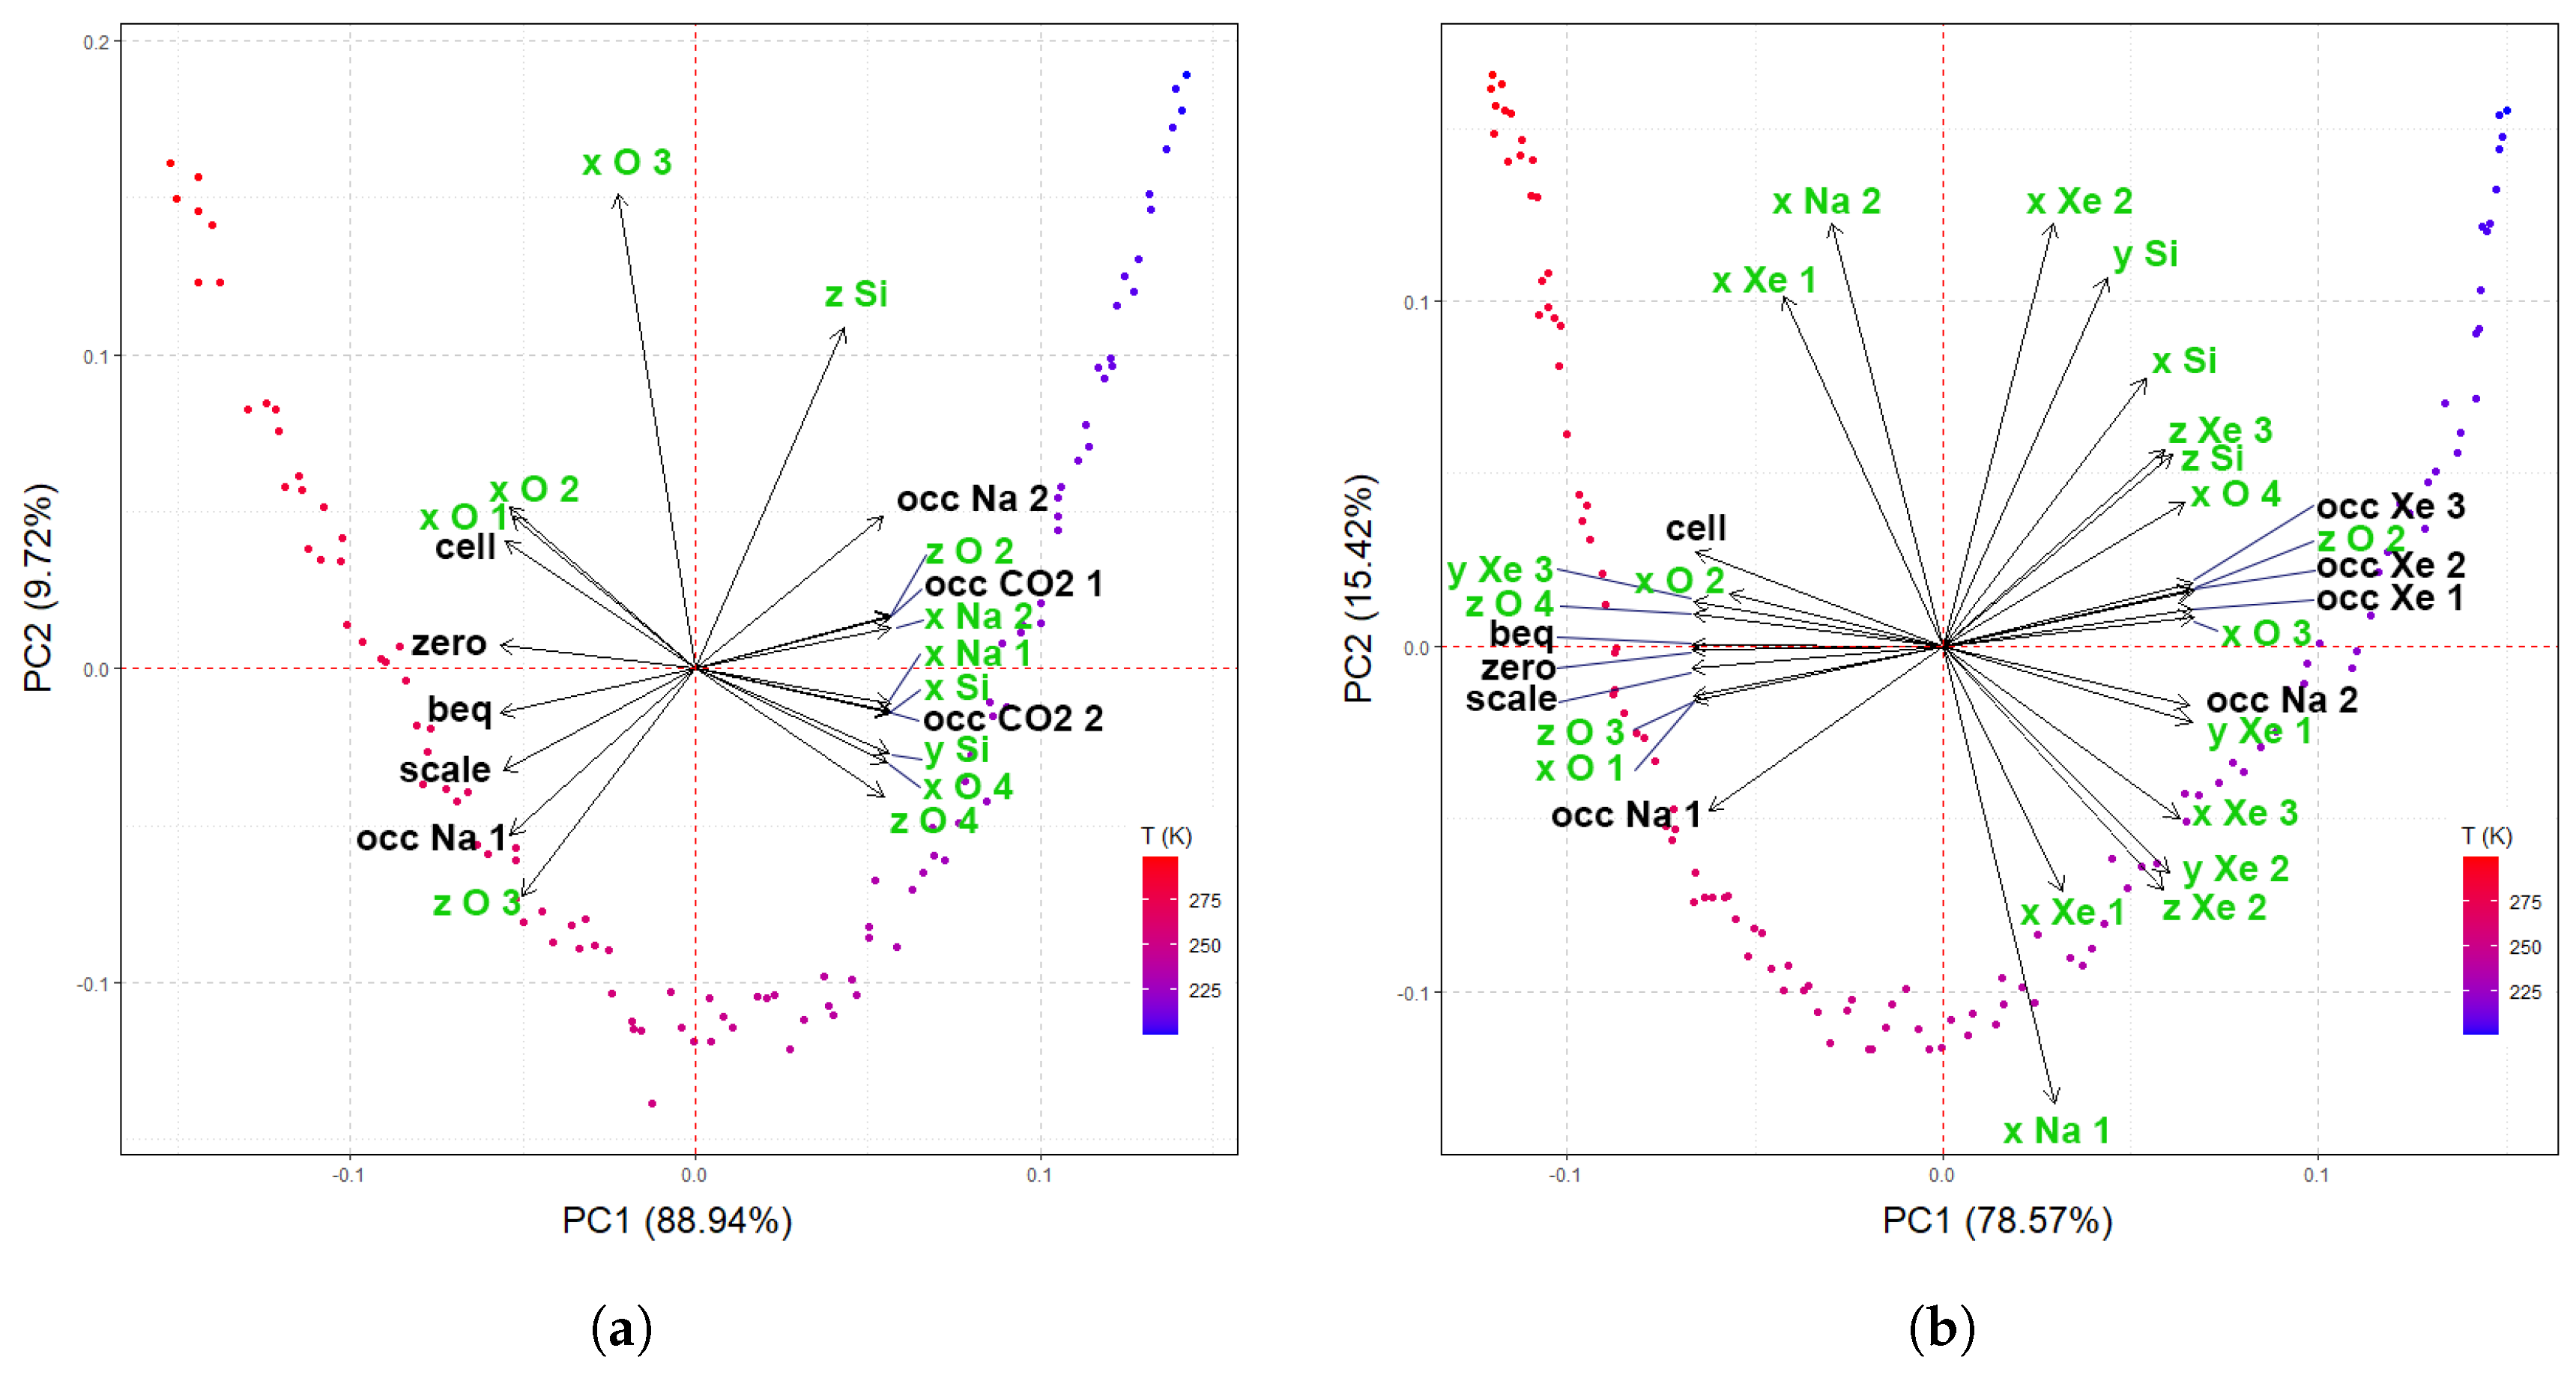
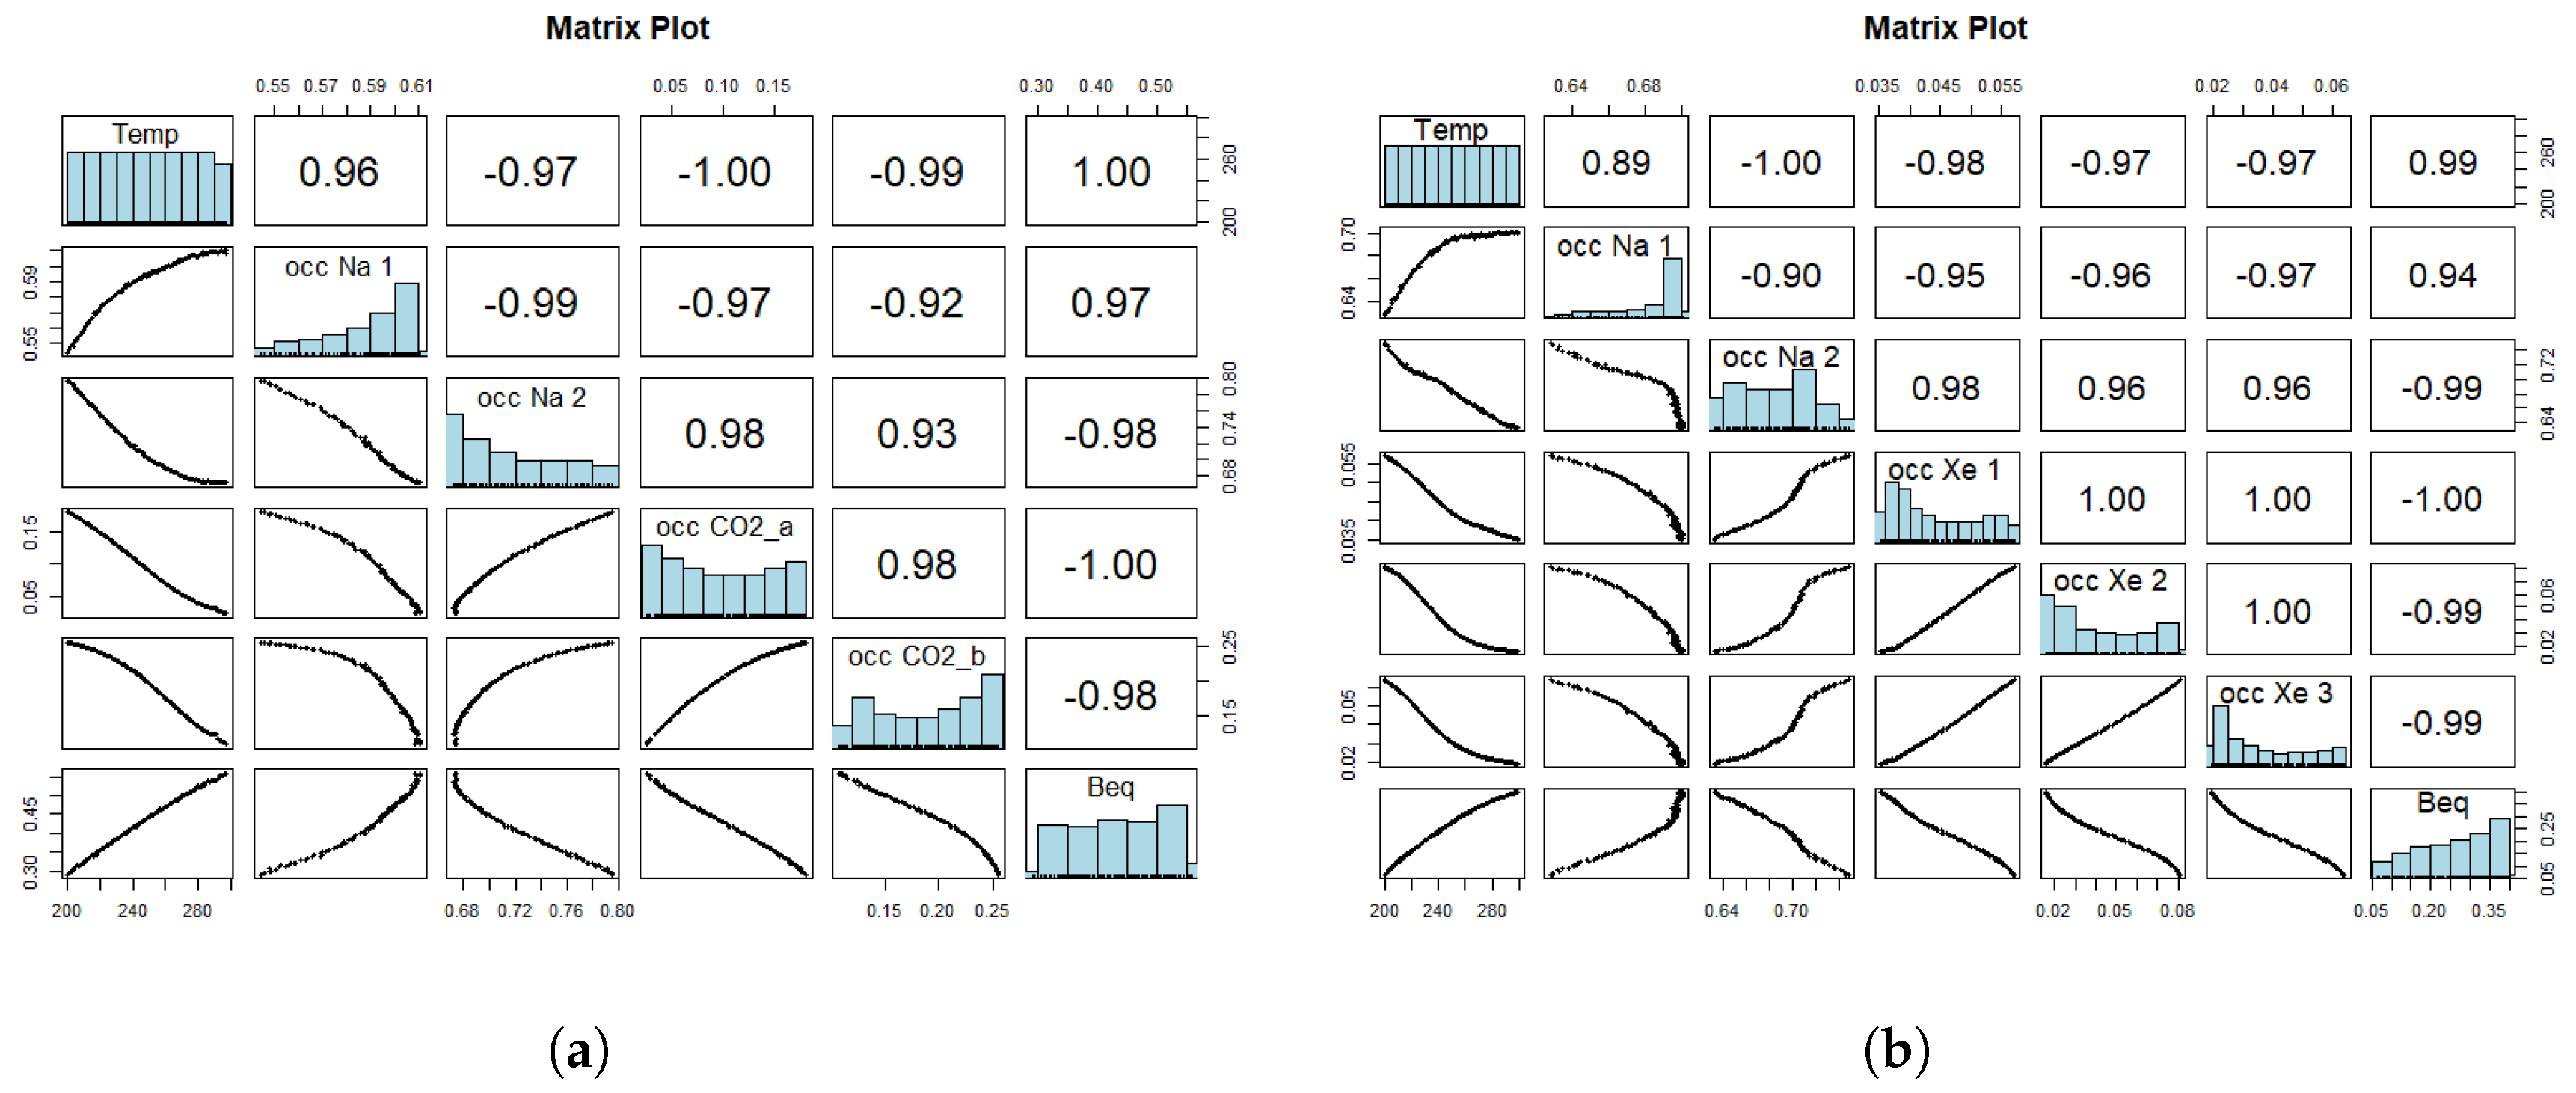
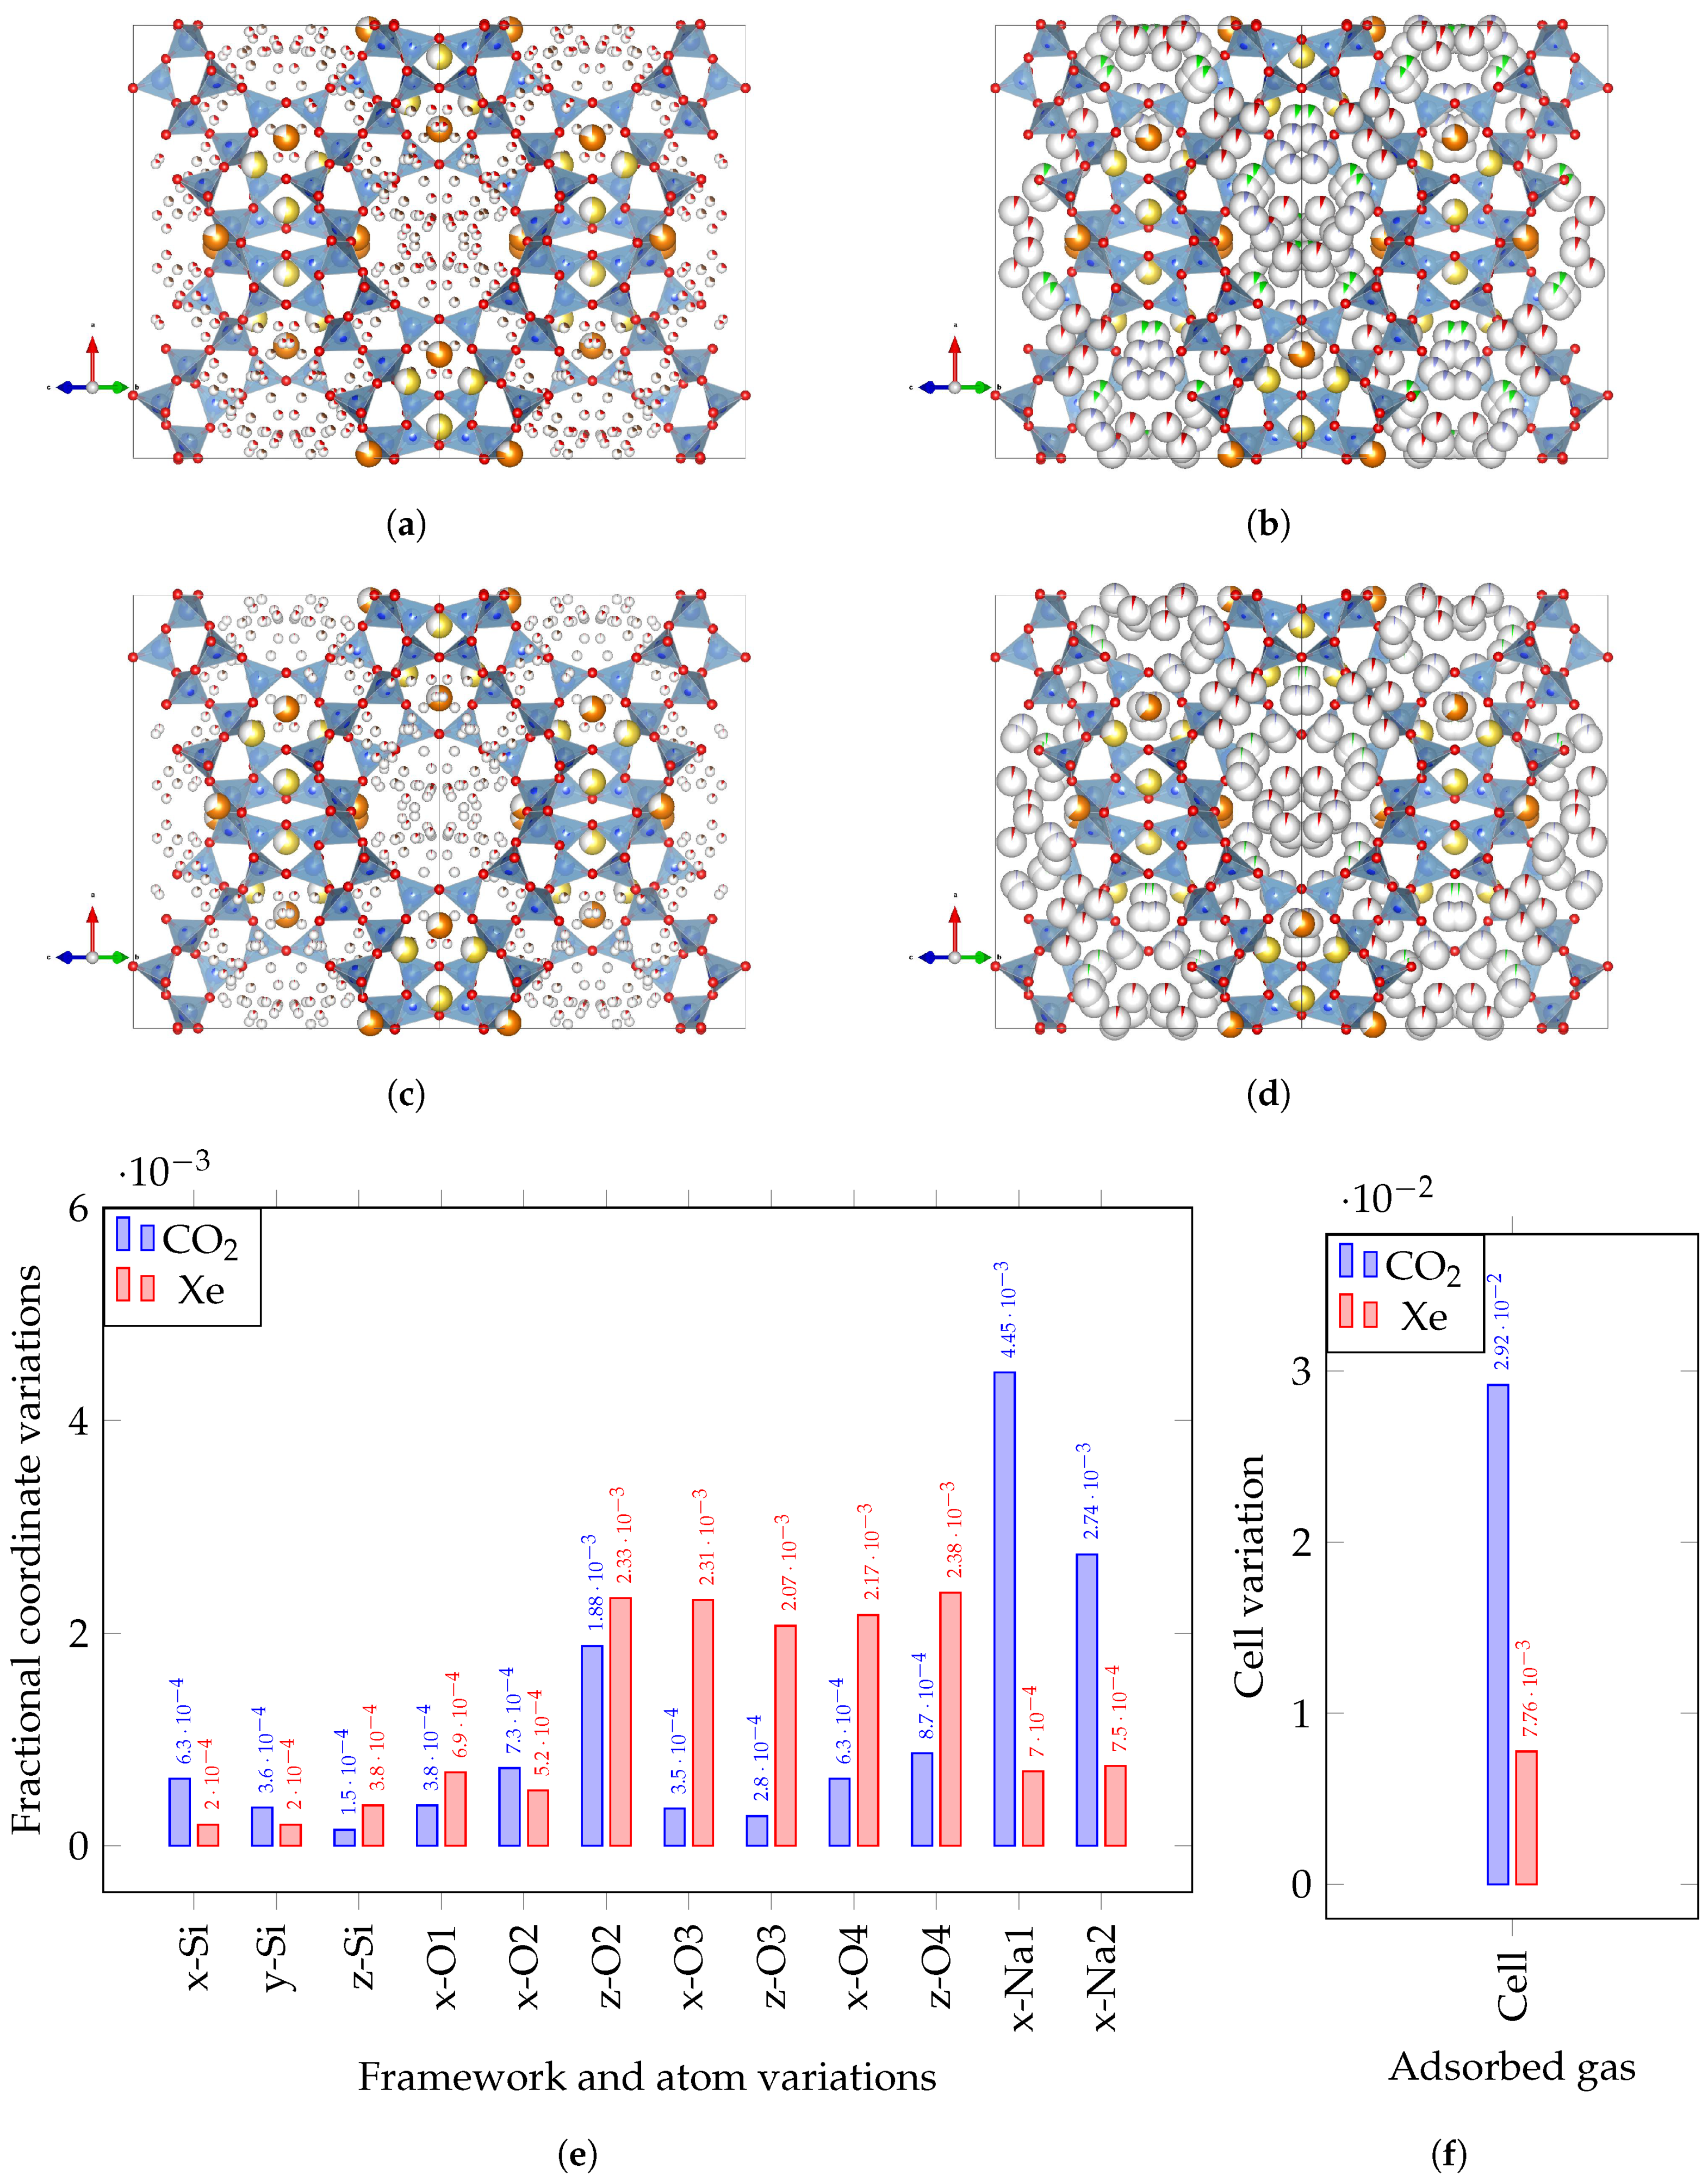
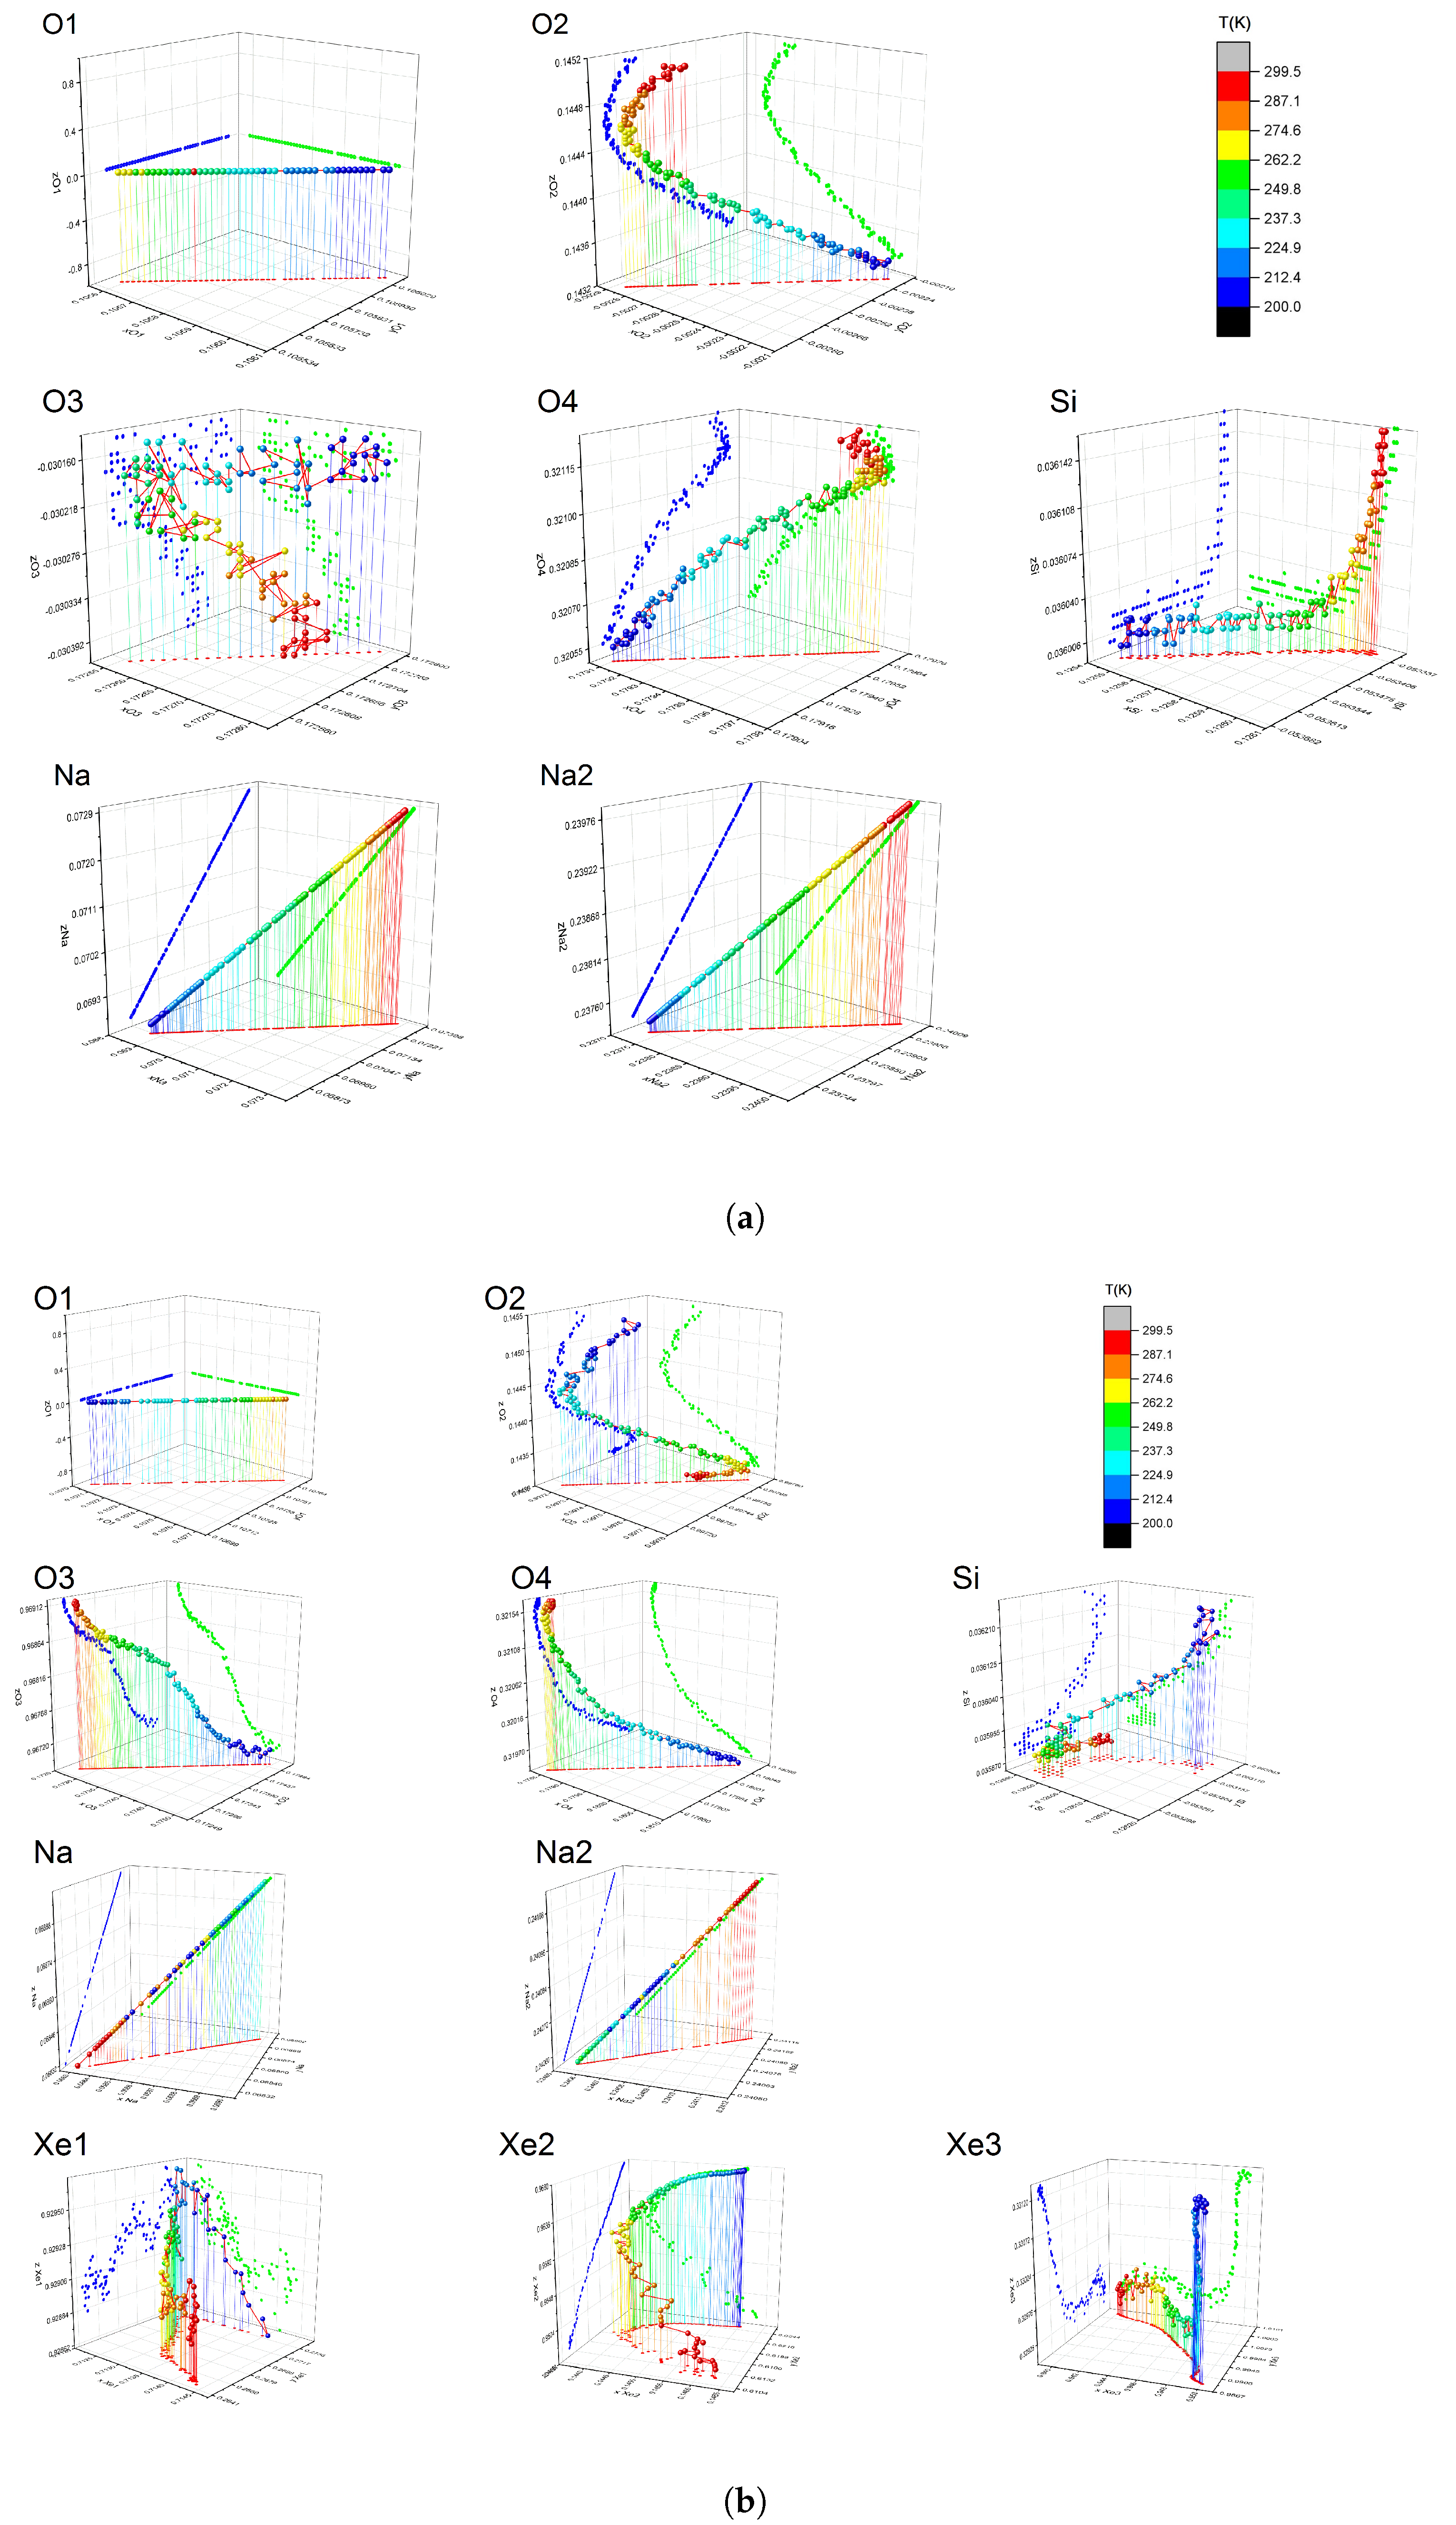
3.3. PCA and Statistical Analysis of Obtained Parameters after Rietveld Refinement: Clear and Fine View of Zeolite Response to Gas Adsorption

Statistical analysis could be carried out on the obtained parameters after Rietveld refinement to obtain a very accurate view of structural changes during the in situ experiments and the relations among trends followed by parameters during gas adsorption/desorption. At first, PCA was carried out using as data matrix the parameters obtained by Rietveld refinement as a temperature function. Biplots with loading and scores were used to comment on the results (Figure 8). The main variance in the data matrix was due to parameters aligned along PC1, i.e., the occupancy of Xe and CO2 moieties, as expected. Parameters clustered in Figure 8 close to Xe and CO2 occupancy varied similarly to them. Parameters clustered at negative PC1 values varied in an opposite fashion with respect to gas occupancy. Distribution along the PC2 direction gave information on the secondary effects observed during thermal treatment. PC2 directions highlighted atoms x-O3 for CO2 and x-Na1, x-Na2, x-Xe1, x-Xe2, x-Si, y-Si for Xe, and agreed with the PC2 score plot onto raw data (Figure 7a,b, respectively) Differences in the two biplots indicated that the response of the Y zeolite was different during the adsorption of the two gases. PC2 scores of the Rietveld variables also highlighted the atoms that were moving back and forth near the starting position due to the competitive effect of temperature variation and gas adsorption–desorption.
As rotation is arbitrary in PCA, the sign of the correlation was not relevant. What was important was that parameters falling at the far opposites along one PC were negatively correlated, those falling on the same side were correlated, and those falling near to zero were not represented by that PC. Therefore, in this case, the zero error was negatively correlated to all parameters falling on the opposite side of PC1 (which have high positive weights instead). A high value on PC1 and close to zero on PC2 meant that the variability of that parameter is explained mostly by PC1. If another parameter, like z-O3, falls near 0 on PC1 and at high values on PC2, that would mean that the variance of that parameter is explained mostly by PC2. Parameters that are orthogonal are uncorrelated. Differences in the two biplots indicated that the response of the Y zeolite was different during the adsorption of the two gases. PC2 scores of Rietveld variables also highlighted atoms that were moving back and forth near the starting position due to the competitive effect of temperature variation and gas adsorption–desorption. PCA highlighted how the system responds to the the external stimulus, in this case, a temperature ramp. PCA alone showed trends on the basis of the PC1 and PC2 scores, but it was not possible to attribute a chemical/structural sense to the investigated data; PCA performed directly onto raw data just underlined the main variations of the dataset. Coupling this information with PCA performed onto Rietveld variables allowed to understand what the variables were that behaved as the PCA score plot. It was then possible to discover that part of the structure responded as in Figure 6, and some other atoms showed oscillatory behavior as in Figure 7. Such behavior without this combined approach (PCA and Rietveld) is very difficult to visualize directly from the huge amount of data coming from the output of the sequential Rietveld refinement. To further clarify the relation between parameter-variation trends, each refined parameter and temperature are plotted against each other refined parameter. Since the refined parameters were N, after adding the temperature, ( N + 1 ) 2 plots were obtained. These plots are very useful to see which parameters vary in phase, antiphase, or different behaviors. The correlation plots of occupancy parameters, Beq, and temperature are reported in Figure 9. Since the temperature ramp was linear during the experiment, it is clear which parameters varied linearly or with an inverse relation with T, and which ones showed strong nonlinear behavior. As a first consideration, thermal parameters (Beq) varied linearly with temperature, confirming the stability and reliability of the Rietveld refinement. In the phase behavior of the three Xe occupancies, Na occupancy varied in a nonlinear way and was not correlated to Xe occupancies. Conversely, CO2 occupancies varied less linearly, but the Na response was very similar to those of the two CO2 moieties. This is probably due to the stronger adsorption of CO2 being able to directly influence Na occupancy.
The movements of the framework and Na atoms within the unit cell are visualized in Figure 10, where the parameter-variation value over the associated mean error of the variable is plotted. In the Xe experiment, the oxygen atoms from the framework were more mobile compared to those in the CO2 experiment, where the cell and Na atom variations were more pronounced instead. With the exception of the z-O3 co-ordinate, the displacement values were larger than 1.75 e.s.d. Excluding atoms in special positions, movements were, in general, rather complex and involved all three dimensions (Figure 11). Some of the atoms showed reversible movements, and their position at 200 K was recovered at 300 K as highlighted from the PC2 score plots. A step was observed from the matrix plot in the correlation curves (Figure 9) between Na2 and Xe1,2,3 occupancies. Gas absorption and temperature variation in the experiment ramp perturbed the electron density of the zeolite framework and caused Na+ migration from Site I (Na1) to Site III (Na2), while Xe was simultaneously filling the channels. The dynamics of this phenomenon was different in the range of 245–217 K compared to the two ranges of 300–245 K and 217–200 K . In the range of 245–217 K , for each new atom of sodium in Position III, we observed around 4 times more Xe atoms filling the channels compared to other ranges of the temperature ramps (Table 1). This effect was not observed in the case of the CO2 ramp. The details of the framework atom movements in the 3D space can be observed in Figure 11. The response of the Y zeolite was different in the case of CO2 or Xe gas adsorption, and this can be visually appreciated in the animated .gif files, available as Supplementary Materials.

4. Conclusions

PCA was used to highlight structural changes due to Xe and CO2 adsorption in a Y zeolite. It was applied directly to raw intensities coming from in situ XRPD experiments, and to parameters obtained by Rietveld refinement. A clear picture emerged for the behavior of both gases. CO2 was adsorbed in two sites with very similar trends. As a response, Na ions changed their position, and, within the framework atoms, only z-O3 showed remarkable changes. Xe was adsorbed in three sites, with especially one site showing rather different behavior. Conversely to the CO2 case, as a response, the framework atoms showed rather larger motions, while Na ions much smaller ones. These behaviors were related to the much more chemical adsorption of CO2 with respect to Xe. Occupancy of the gas molecule inside the zeolite channels behaved according to temperature variation, but Xe atoms and some of the zeolite-framework atoms oscillated from their position, moving back and forth near the starting position due to the competitive effect of temperature variation and gas adsorption–desorption. From a methodological viewpoint, PCA was, on the one hand, a powerful tool for both obtaining the main dynamic trends in an in situ XRPD experiment in a few seconds and without the need of any structural model. On the other hand, PCA was very helpful in identifying and attributing all changes occurring during the adsorption/desorption experiments. A much wider application of PCA can thus be foreseen for in in situ X-ray diffraction in particular, and in material sciences in general.

5. Materials and Methods

The experiment of Xe absorption into a Y zeolite (purchased by Tosoh Corporation 3-8-2 Shiba, Minato-ku, Tokyo 105-8623, with commercial name HSZ-320NAA) was carried out as described in [15] and references therein. A capillary containing equilibrated Y zeolite was thermally evacuated at 400 K , filled with Xe or CO2 at a pressure of 100 mbar, and subjected to a heating–cooling cycle in the range of 200–300 K , for a total of 120 measurements for each ramp. The 200–300 K window was chosen on the basis of a previous study (Palin et al. [15]), where the temperature range (both amplitude and extremes) was deeply explored because it was the intermediate between the low temperatures (below 200 K ) where strong chemical adsorption occurred, and above 300 K , where outgassing was observed. Below 200 K , chemical adsorption induces nonreversible adsorption effects, and up–down measurements would give different results with hysteresis effects and problems in data interpretation. Above 300 K , very low occupancies with instabilities in gas occupancy and positions were observed. The range of 200–300 K is where adsorption/desorption is reversible with observable and remarkable changes in gas occupancies. Experiments were carried out at the SNBL beamline at the ESRF synchrotron in Grenoble (FR), by using a wavelength of 0.70077(1) Å. Data reduction was carried out by Bubble software [30], normalizing the data by the monitor count controlling the X-ray beam.
Rietveld refinements of in situ XRPD data were carried out by Topas TA v5 [31]. The Rietveld refinements gave good agreement values, as reported for the extreme dataset at 200 K and 300 K for Xe and CO2 cases (Table 2). The experiment, calculated, and residual profiles are reported in Figure 13, further confirming the quality of the data, and the stability and reliability of the refinements. Selected .cif files after Rietveld refinement were deposited within the COD database with deposition numbers 3000262 (Xe 200 K ), 3000263 (Xe 300 K ), 3000264 (CO2 200 K ), and 3000265 (CO2 200 K ). The same data were then processed by the RootProf [32] and R [33] software to carry out PCA. R [33] and LATEX were used to produce the plots. VESTA 3 [34] was used to produce 3D images of the crystal structure.

Supplementary Materials

Animated .gif files showing the structure changes during thermal treatment are available online at https://0-www-mdpi-com.brum.beds.ac.uk/2073-4352/10/6/483/s1. Figure S1: Zeo_Y_Xe_Na.gif; Figure S2: Zeo_Y_CO2_Na.gif; Figure S3: Zeo_Y_Xe_framework.gif; Figure S4: Zeo_Y_CO2_framework.gif.

Author Contributions

Conceptualization, E.C., M.L., and L.P.; data curation, E.C., M.L., and L.P.; formal analysis, E.C. and L.P.; funding acquisition, L.P.; investigation, E.C., and L.P.; methodology, E.C. and L.P.; validation, M.L.; writing—original draft, E.C., M.L. and L.P.; Writing—review and editing, E.C., M.L and L.P. All authors have read and agreed to the published version of the manuscript.

Funding

The authors acknowledge FINPIEMONTE for funding their bursaries within the Programma Pluriennale Attività Produttive 2015 / 2017 Misura 3.1 “Contratto d’lnsediamento” for project “Sviluppo di tecnologia applicata alla costruzione di cabine radiografiche per l’ispezione di componenti per il settore industriale e aerospaziale” (project code 208-105).

Acknowledgments

Wouter van Beek and Vadim Dyadkin (SNBL@ESRF, Grenoble France) are acknowledged for the support during data collection and reduction, respectively.

Conflicts of Interest

The authors declare no conflict of interest.

References

  1. Palin, L.; Croce, G.; Viterbo, D.; Milanesio, M. Monitoring the Formation of H-MCM-22 by a Combined XRPD and Computational Study of the Decomposition of the Structure Directing Agent. Chem. Mater. 2011, 23, 4900–4909. [Google Scholar] [CrossRef]
  2. Conterosito, E.; Benesperi, I.; Toson, V.; Saccone, D.; Barbero, N.; Palin, L.; Barolo, C.; Gianotti, V.; Milanesio, M. High-Throughput Preparation of New Photoactive Nanocomposites. ChemSusChem 2016, 9, 1279–1289. [Google Scholar] [CrossRef]
  3. Palin, L.; Milanesio, M.; van Beek, W.; Conterosito, E. Understanding the Ion Exchange Process in LDH Nanomaterials by Fast In Situ XRPD and PCA-Assisted Kinetic Analysis. J. Nanomater. 2019, 2019, 1–9. [Google Scholar] [CrossRef] [Green Version]
  4. Kraft, P.; Bergamaschi, A.; Broennimann, C.; Dinapoli, R.; Eikenberry, E.; Henrich, B.; Johnson, I.; Mozzanica, A.; Schlepütz, C.; Willmott, P.; et al. Performance of single-photon-counting PILATUS detector modules. J. Synchrotron Radiat. 2009, 16, 368–375. [Google Scholar] [CrossRef] [PubMed]
  5. Kurdzesau, F. Energy-dispersive Laue experiments with X-ray tube and PILATUS detector: Precise determination of lattice constants. J. Appl. Crystallogr. 2019, 52, 72–93. [Google Scholar] [CrossRef]
  6. Shi, X.; Ghose, S.; Dooryhee, E. Performance calculations of the X-ray powder diffraction beamline at NSLS-II. J. Synchrotron Radiat. 2013, 20, 234–242. [Google Scholar] [CrossRef] [PubMed]
  7. Kenel, C.; Grolimund, D.; Li, X.; Panepucci, E.; Samson, V.A.; Sanchez, D.F.; Marone, F.; Leinenbach, C. In situ investigation of phase transformations in Ti-6Al-4V under additive manufacturing conditions combining laser melting and high-speed micro-X-ray diffraction. Sci. Rep. 2017, 7. [Google Scholar] [CrossRef] [Green Version]
  8. Conterosito, E.; Palin, L.; Caliandro, R.; van Beek, W.; Chernyshov, D.; Milanesio, M. CO2 adsorption in Y zeolite: A structural and dynamic view by a novel principal-component-analysis-assisted in situ single-crystal X-ray diffraction experiment. Acta Crystallogr. Sect. A Found. Adv. 2019, 75, 214–222. [Google Scholar] [CrossRef]
  9. Rajan, K.; Rajagopalan, A.; Suh, C. Data Mining and Multivariate Analysis in Materials Science. In Molten Salts: From Fundamentals to Applications; Springer: Berlin, Germany, 2002; pp. 241–248. [Google Scholar] [CrossRef]
  10. Rajan, K. Materials informatics. Mater. Today 2005, 8, 38–45. [Google Scholar] [CrossRef]
  11. Broderick, S.R.; Aourag, H.; Rajan, K. Data mining of Ti–Al semi-empirical parameters for developing reduced order models. Phys. B Condens. Matter 2011, 406, 2055–2060. [Google Scholar] [CrossRef]
  12. Chernyshov, D.; van Beek, W.; Emerich, H.; Milanesio, M.; Urakawa, A.; Viterbo, D.; Palin, L.; Caliandro, R. Kinematic diffraction on a structure with periodically varying scattering function. Acta Cryst. A 2011, 67, 327–335. [Google Scholar] [CrossRef] [PubMed]
  13. Caliandro, R.; Chernyshov, D.; Emerich, H.; Milanesio, M.; Palin, L.; Urakawa, A.; van Beek, W.; Viterbo, D. Patterson selectivity by modulation-enhanced diffraction. J. Appl. Crystallogr. 2012, 45, 458–470. [Google Scholar] [CrossRef]
  14. Urakawa, A.; Beek, W.V.; Monrabal-Capilla, M.; Galán-Mascarós, J.R.; Palin, L.; Milanesio, M. Combined Modulation Enhanced X-ray Powder Diffraction and Raman Spectroscopic Study of Structural Transitions in the Spin Crossover Material [Fe(Htrz)2(trz)](BF4). J. Phys. Chem. C 2010, 115, 1323–1329. [Google Scholar] [CrossRef]
  15. Palin, L.; Caliandro, R.; Viterbo, D.; Milanesio, M. Chemical selectivity in structure determination by the time dependent analysis of in situ XRPD data: A clear view of Xe thermal behavior inside a MFI zeolite. Phys. Chem. Chem. Phys. 2015, 17, 17480–17493. [Google Scholar] [CrossRef] [PubMed]
  16. Guccione, P.; Palin, L.; Milanesio, M.; Belviso, B.D.; Caliandro, R. Improved multivariate analysis for fast and selective monitoring of structural dynamics by in situ X-ray powder diffraction. Phys. Chem. Chem. Phys. 2018, 20, 2175–2187. [Google Scholar] [CrossRef]
  17. Palin, L.; Conterosito, E.; Caliandro, R.; Boccaleri, E.; Croce, G.; Kumar, S.; van Beek, W.; Milanesio, M. Rational design of the solid-state synthesis of materials based on poly-aromatic molecular complexes. CrystEngComm 2016, 18, 5930–5939. [Google Scholar] [CrossRef]
  18. Kumar, S.; Carniato, F.; Arrais, A.; Croce, G.; Boccaleri, E.; Palin, L.; van Beek, W.; Milanesio, M. Investigating Surface vs Bulk Kinetics in the Formation of a Molecular Complex via Solid-State Reaction by Simultaneous Raman/X-ray Powder Diffraction. Cryst. Growth Design 2009, 9, 3396–3404. [Google Scholar] [CrossRef]
  19. Caliandro, R.; Toson, V.; Palin, L.; Conterosito, E.; Aceto, M.; Gianotti, V.; Boccaleri, E.; Dooryhee, E.; Milanesio, M. New Hints on the Maya Blue Formation Process by PCA-Assisted In Situ XRPD/PDF and Optical Spectroscopy. Chem. A Eur. J. 2019, 25, 11503–11511. [Google Scholar] [CrossRef]
  20. Lee, S.Y.; Park, S.J. A review on solid adsorbents for carbon dioxide capture. J. Ind. Eng. Chem. 2015, 23, 1–11. [Google Scholar] [CrossRef]
  21. Dmochowski, I. Xenon out of its shell. Nat. Chem. 2009, 1, 250. [Google Scholar] [CrossRef] [Green Version]
  22. Sanloup, C.; Schmidt, B.; Chamorro, P.E.; Jambon, A.; Gregoryanz, E.; Mezouar, M. Retention of xenon in quartz and Earth’s missing xenon. Science 2005, 310, 1174–1177. [Google Scholar] [CrossRef] [PubMed]
  23. Polisi, M.; Grand, J.; Arletti, R.; Barrier, N.; Komaty, S.; Zaarour, M.; Mintova, S.; Vezzalini, G. CO2 Adsorption/Desorption in FAU Zeolite Nanocrystals: In Situ Synchrotron X-ray Powder Diffraction and in Situ Fourier Transform Infrared Spectroscopic Study. J. Phys. Chem. C 2019, 123, 2361–2369. [Google Scholar] [CrossRef]
  24. Bordiga, S.; Lamberti, C.; Bonino, F.; Travert, A.; Thibault-Starzyk, F. Probing zeolites by vibrational spectroscopies. Chem. Soc. Rev. 2015, 44, 7262–7341. [Google Scholar] [CrossRef] [PubMed]
  25. Agostini, G.; Lamberti, C.; Palin, L.; Milanesio, M.; Danilina, N.; Xu, B.; Janousch, M.; van Bokhoven, J.A. In Situ XAS and XRPD Parametric Rietveld Refinement To Understand Dealumination of Y Zeolite Catalyst. J. Am. Chem. Soc. 2010, 132, 667–678. [Google Scholar] [CrossRef] [PubMed]
  26. Diaconis, P.; Goel, S.; Holmes, S. Horseshoes in multidimensional scaling and local kernel methods. Ann. Appl. Stat. 2008, 2, 777–807. [Google Scholar] [CrossRef]
  27. Le Roux, B.; Murtagh, F. B. Le Roux and H. Rouanet, Geometric Data Analysis, From Correspondence Analysis to Structured Data Analysis, Dordrecht, Kluwer, 2004, pp. xi + 475. J. Classif. 2008, 25, 137–141. [Google Scholar] [CrossRef] [Green Version]
  28. Morton, J.T.; Toran, L.; Edlund, A.; Metcalf, J.L.; Lauber, C.; Knight, R. Uncovering the Horseshoe Effect in Microbial Analyses. mSystems 2017, 2. [Google Scholar] [CrossRef] [PubMed] [Green Version]
  29. Conterosito, E.; Van Beek, W.; Palin, L.; Croce, G.; Perioli, L.; Viterbo, D.; Gatti, G.; Milanesio, M. Development of a Fast and Clean Intercalation Method for Organic Molecules into Layered Double Hydroxides. Cryst. Growth Design 2013, 13, 1162–1169. [Google Scholar] [CrossRef]
  30. Dyadkin, V.; Pattison, P.; Dmitriev, V.; Chernyshov, D. A new multipurpose diffractometer PILATUS@SNBL. J. Synchrotron Radiat. 2016, 23, 825–829. [Google Scholar] [CrossRef]
  31. Coelho, A.A. TOPAS and TOPAS-Academic: An optimization program integrating computer algebra and crystallographic objects written in C++. J. Appl. Crystallogr. 2018, 51, 210–218. [Google Scholar] [CrossRef] [Green Version]
  32. Caliandro, R.; Belviso, D.B. RootProf: Software for multivariate analysis of unidimensional profiles. J. Appl. Crystallogr. 2014, 47, 1087–1096. [Google Scholar] [CrossRef]
  33. R Core Team. R: A Language and Environment for Statistical Computing; R Foundation for Statistical Computing: Vienna, Austria, 2018. [Google Scholar]
  34. Momma, K.; Izumi, F. VESTA for three-dimensional visualization of crystal, volumetric and morphology data. J. Appl. Crystallogr. 2011, 44, 1272–1276. [Google Scholar] [CrossRef]
Figure 1. In situ X-ray powder-diffraction (XRPD) data during adsorption and desorption of CO2 (left) and Xe (right) into a Y zeolite. (a) Data matrix of CO2. (b) Data matrix of Xe.
Crystals 10 00483 g001
Figure 2. Occupancy variations of CO2. (a) CO2 and (b) Xe occupancy.
Crystals 10 00483 g002
Figure 3. Position variations of Na atoms. (a) x positions of Na1 (x,x,x) with CO2 (mean error: 0.0002) and Xe (mean error: 0.0003). (b) x positions of Na2 (x,x,x) with CO2 (mean error: 0.0002) and Xe (mean error: 0.0003).
Crystals 10 00483 g003
Figure 4. PC1 vs. PC2 scores during ramp up (left) and down (right) within CO2 (top) and Xe (bottom) adsorption. (a) Ramped-down CO2 PC1 vs. PC2. (b) Ramped-up CO2 PC1 vs. PC2. (c) Ramped-down Xe PC1 vs. PC2. (d) Ramped-up Xe PC1 vs. PC2.
Crystals 10 00483 g004
Figure 5. PC1 (left) and PC2 loadings (right) vs. 2 θ during ramp down (blue) and up (red) within CO2 (top four) and Xe (bottom four) adsorption. (a) Ramped-down CO2 loadings of PC1 vs. 2 θ . (b) Ramped-down CO2 loadings of PC2 vs. 2 θ . (c) Ramped-up CO2 loadings of PC1 vs. 2 θ . (d) Ramped-up CO2 loadings of PC2 vs. 2 θ . (e) Ramped-down Xe loadings of PC1 vs. 2 θ . (f) Ramped-down Xe loadings of PC2 vs. 2 θ . (g) Ramped-up Xe loadings of PC1 vs. 2 θ . (h) Ramped-up Xe loadings of PC2 vs. 2 θ .
Crystals 10 00483 g005
Figure 6. Superposition of PC1 scores with CO2 (left) and Xe (right) occupancy during ramp down (top) and up (bottom). (a) PC1 scores vs. CO2 occupancy. (b) PC1 scores vs. Xe occupancy. (c) PC1 scores vs. CO2 occupancy. (d) PC1 scores vs. Xe occupancy.
Crystals 10 00483 g006
Figure 7. PC2 scores vs. standardized fractional co-ordinates of different atoms for both gases. Fractional co-ordinates were standardized to enhance variation of each atom avoiding scale errors. In (b), the curve relative to Na1 (red curves) had the sign changed, as its position chances was negatively-correlated with PC2. (a) PC2 scores vs. standardized fractional co-ordinates of O3 atom for CO2 ramp-up data. (b) PC2 scores vs. standardized fractional co-ordinates of different atoms for Xe ramp-up data.
Crystals 10 00483 g007
Figure 8. Biplots obtained by PCA of parameters refined by Rietveld for Xe and CO2 adsorption. Biplot of (a) CO2 and (b) Xe data.
Crystals 10 00483 g008
Figure 9. Matrix scatter plot: bivariate scatter plots below diagonal, histograms on diagonal, and Pearson correlation above diagonal. Considered variables were sodium and gas occupancy, and framework thermal factors refined by Rietveld analysis for CO2 (left) and Xe (right). (e.g., element of matrix plot of CO2 [4,2] and [2,4] are, respectively, scatter plot and Pearson correlation of Occ Na1 and Occ CO21). Matrix plots of (a) CO2 and (b) Xe data.
Crystals 10 00483 g009
Figure 10. Refined crystal structures (top) and more relevant atom-position variations (bottom). For atom labelling, refer to Figure 12. (a) Y-Zeolite with CO2 at 200 K. (b) Y-Zeolite with Xe at 200 K. (c) Y-Zeolite with Xe at 300 K. (d) Y-Zeolite with CO2 at 300 K. (e) Framework and atom variations. (f) Cell variation.
Crystals 10 00483 g010
Figure 11. Gas and atom movements during CO2 and Xe adsorption in the ramp down from 300 K to 200 K . (a) Atom movements during CO2 adsorption. (b) Atom movements during Xe adsorption.
Crystals 10 00483 g011
Figure 12. Y-Zeolite with Xe at 200 K with labels.
Crystals 10 00483 g012
Figure 13. Rietveld refinement of XRPD pattern at 200 K and 300 K for CO2 (a,b) and Xe (c,d). (a) 200 K CO2; (b) 300 K CO2; (c) 200 K Xe; (d) 300 K Xe.
Crystals 10 00483 g013
Table 1. Xe/Na2 no. of atoms per cell ratio.
Xe1Xe2Xe3SUM
Xe/Na2 n.atom per cell variation (300–245 K )0.82.01.34.1
Xe/Na2 n.atom per cell variation (245–217 K )2.79.26.017.9
Xe/Na2 n.atom per cell variation (217–200 K )0.72.01.74.5
Table 2. Weighed profile R factor of Rietveld refinement performed on Y zeolite samples.
Gas R wp
CO2 200 K 5.57
CO2 300 K 5.12
Xe 200 K 4.86
Xe 300 K 5.04

