1. Introduction
Liquid crystals have attracted great interest in recent years owing to their applications, such as in optical displays. Liquid crystals possess both the fluidity of a liquid-like state and the order of a crystalline state. The ordering of the molecular reorientation in a liquid crystal enables us to study its formation process using statistical mechanics. Scaling with size, which is commonly used in statistical mechanics, has been discussed in experimental studies of samples that are confined within nanometer-sized porous materials [
1,
2,
3]. Controlled-pore glasses (CPGs), which are often used as porous materials, exhibit 1-D cylindrical pore geometries comprising pores with silica walls. When a liquid crystal is confined within CPG pores, the size in the radial direction is limited by the size of the pore radius. In contrast, the size in the axial direction is hardly limited at all. In the case of confinement in such a cylindrical pore, it has been reported that molecules in the liquid-crystal state are aligned in the axial direction, i.e., parallel to the pore walls. However, the pores of CPGs and other porous silica-gel materials are connected to each other in the perpendicular direction, like a jungle gym (see
Figure 1) [
1,
4]. This three-dimensionally-networked structure yields many connection points, wherein frustration of the molecular orientation in the liquid crystal disturbs the alignment of molecular orientations. However, the detailed effects of the connections among the 3-D-networked pores has not been thoroughly investigated. Mesoporous silica—for example FSM-16 or SBA-15—has uniform-sized mesopores, which are synthesized using surfactants as templates. The pore geometry is 1-D cylindrical with a 2-D hexagonal stacking (see
Figure 1) [
5]. In these cases, the pores do not connect with each other, in contrast to CPG, although some holes exist in the pore walls of SBA-15. Thus, a liquid crystal confined within mesoporous silica is considered an ideal model system for discussing the statistical mechanics of a system confined within a 1-D cylindrical space. However, the pore size of mesoporous silica is quite small compared with that of CPG or other silica-gel materials with 3-D-networked pore architectures.
In this study, differential scanning calorimetry (DSC) measurements of liquid crystals confined within mesoporous silica MSU-H and FSM series with 1-D cylindrical pores and confined with silica-gel CARiACT Q series with 3-D-networked pores, were performed. We discuss the phase transitions and dynamics of liquid crystal molecules confined in the mesoscopic regions with different type of pore architecture. A liquid crystal material confined within porous materials is
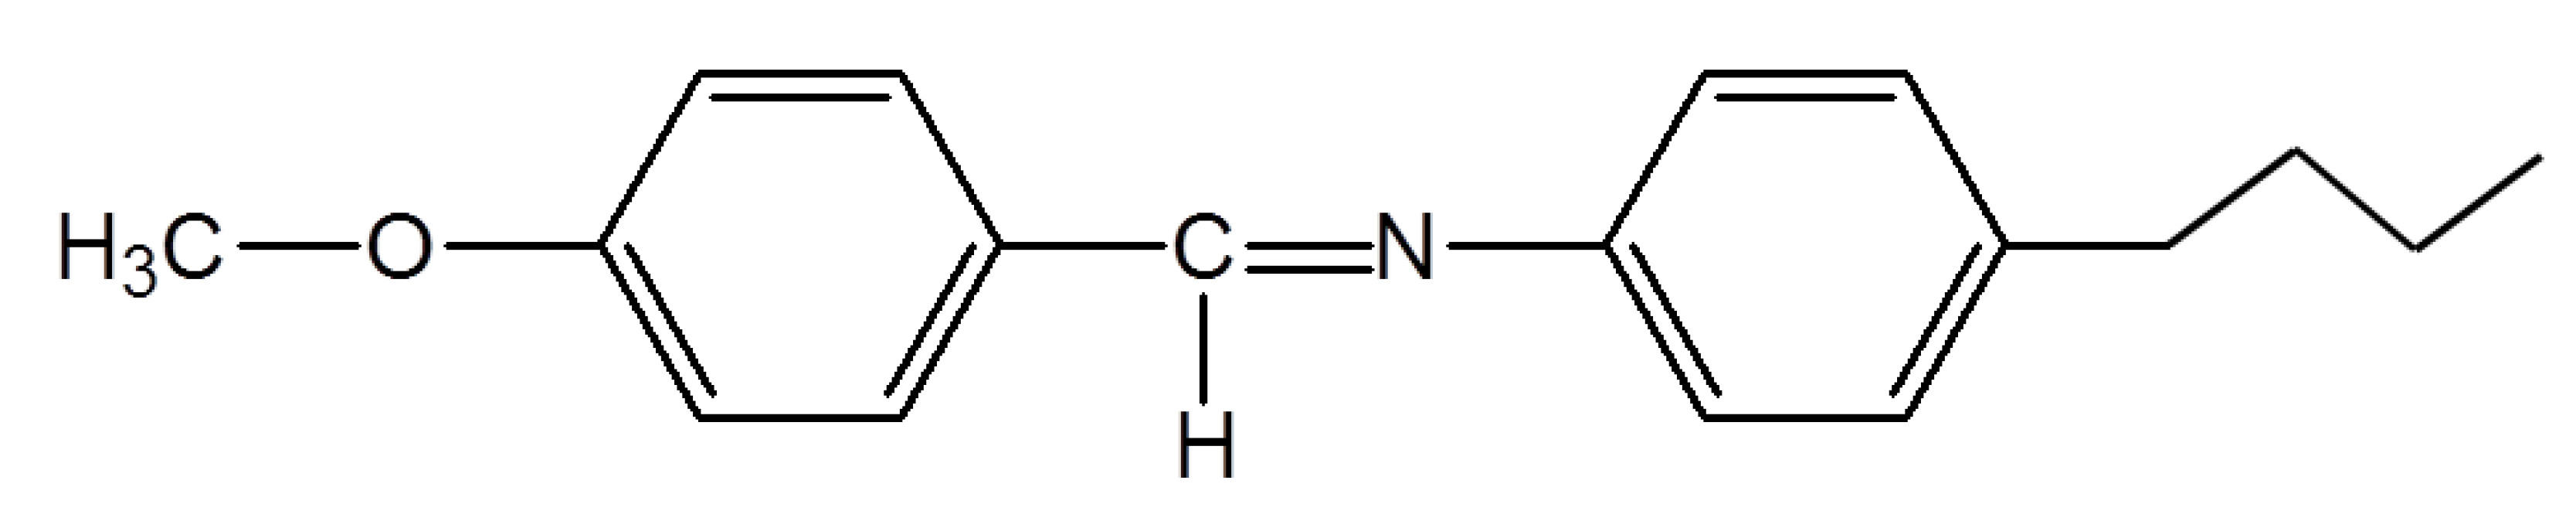
N-(4-methoxybenzylidene)-4-butylaniline (MBBA), which is a well-known thermotropic liquid crystal that forms a nematic phase at room temperature.
Figure 2 shows the molecular structure of MBBA. The transition of bulk MBBA from the metastable crystalline (C′) phase to the nematic (N) phase (
TC′N) occurs at 294 K, from the stable crystalline phase (C) to the nematic phase (
TCN) at 295.3 K, and from the nematic phase to the isotropic liquid (I) phase (
TNI) at 317 K [
6]. In addition, MBBA forms multiple metastable crystalline phases and the glass transition of the supercooled nematic phase is observed at
Tg = 205 K. The appearance of the metastable crystalline phase depends on the thermal history of the cooling process, as investigated by NMR, DSC, X-ray, Raman, and dielectric experiments [
7,
8,
9,
10,
11]. Mansare et al. [
12] used controlled-pore glasses with different pore sizes to investigate the effects of confined space on phase transitions of liquid crystals.
2. Materials and Methods
MBBA was purchased from Tokyo Chemical Industry Co. Ltd. (Tokyo, Japan) and used without further purification. Porous materials CARiACT Q and FSM series were provided by Fuji Silysia Chemical Ltd. (Kasugai Aichi, Japan), and MSU-H was purchased from Sigma-Aldrich Japan Inc. (Tokyo, Japan). The CARiACT Q series has a 3-D-networked pore architecture and comprises five types of samples of Q50, Q30, Q15, Q10, and Q6 with different pore sizes. The FSM series has a 2-D hexagonal-stacked 1-D cylindrical pore architecture and comprises three types of samples FSM16, FSM12, and FSM8, which are classified by the carbon number of the surfactants used as pore templates. MSU-H is characterized as mesoporous silica with 1-D cylindrical pores having relatively large pore diameters compared to the FSM series [
13]. The values of the pore diameters of all pore materials were determined through N
2 adsorption measurements with the BJH method, and they are summarized in
Table 1.
All porous materials were dried under vacuum at 200 °C and an approximately 80% amount of MBBA for the pore volume was added to the dried pore materials and were mixed through stirring for 30 min, respectively.
DSC measurements were performed with SEIKO Instruments DSC 120 and Perkin Elmer DSC 8500 from 140 K to 333 K along to heating direction with a heating rate of 3 K min−1 after the premeasuring treatment of cooling with the average rate of 10 K min−1. Sealed aluminum pans were used in all experiments. An empty aluminum pan was used as the reference.
3. Results and Discussion
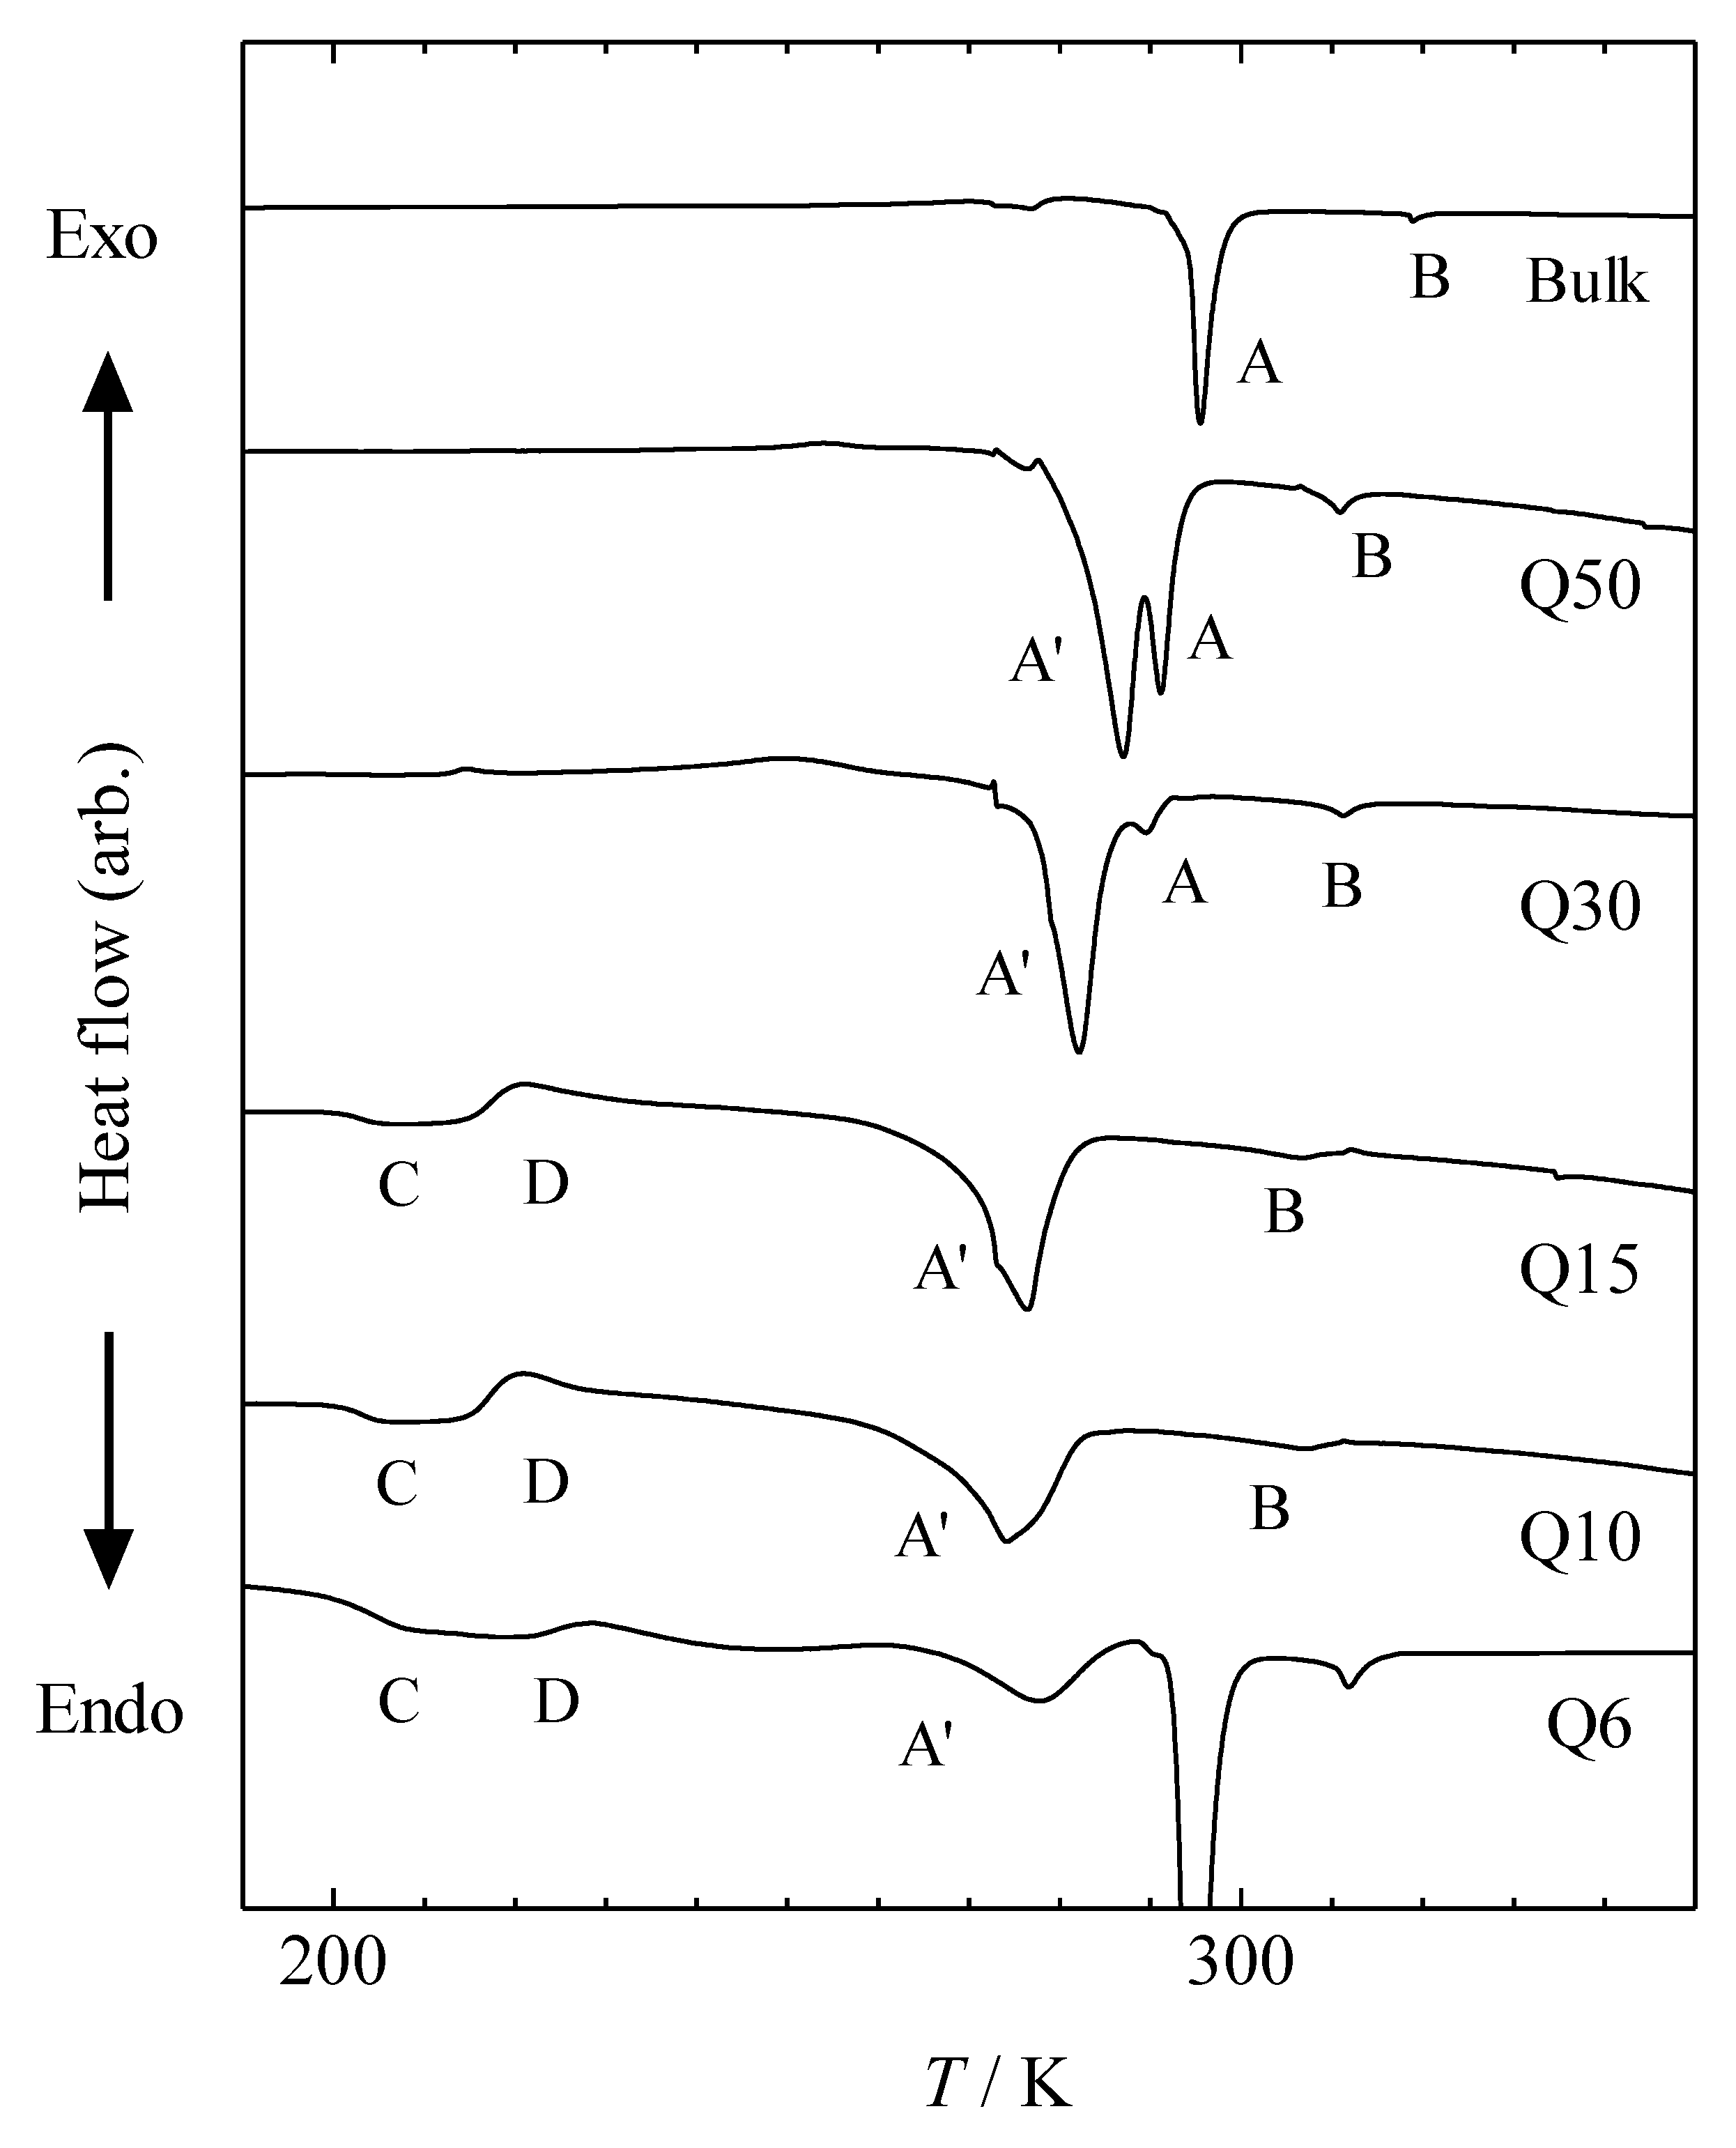
Figure 3 and
Figure 4 show the DSC measurement results of bulk MBBA and MBBA confined within the 1-D and 3-D silica pores. Peak A and peak B observed in bulk MBBA were due to endothermic anomalies corresponding to the phase transition from the crystalline phase to the nematic phase (C-N) and from the nematic phase to the isotropic liquid phase (N-I), respectively. Mayer et al. previously reported that two C-N peak were observed [
6]. These two peaks are associated with the transition to the nematic phase from the stable crystalline phase (C) and metastable crystalline phase (C′), and their difference is approximately 1 K. In this study, only one observed peak is associated with the C-N transition for a bulk sample. Thus, it is difficult to determine whether this peak is associated with the transition from the crystalline or metastable crystalline phase.
For the sample confined within Q6, large endothermic peaks were observed, which were also observed in the bulk sample (see
Figure 3). This implies that a part of the MBBA was not introduced into the pores and remained on the grain surface of the porous material. Thus, it is difficult to discuss the Q6 sample quantitatively. However, other samples confined within 1-D and 3-D pores did not exhibit such endothermic peaks (see
Figure 3 and
Figure 4). Thus, we conclude that in those cases, the added MBBA was introduced into the pores of the samples.
As shown in
Figure 3, for samples confined within CARiACT Q50 and Q30, three endothermic peaks, A, A′, and B, were observed. For samples confined within CARiACT Q15 and Q10, peaks A′ and B were observed. For the sample confined within CARiACT Q6 peak A′ was observed, and peak B was not observed because of the existence of a large endothermic peak for the bulk sample. Thus, it has remained unclear whether peak B also exists in the sample confined within Q6. Generally, the transition from the metastable crystalline phase is observed at a temperature lower than that from the stable crystalline phase. Thus, peaks A and A′ correspond to the transition from the stable crystalline phase and metastable crystalline phases, respectively. Peak A decreases and peak A′ increases with the decreasing pore size. This suggests that crystallization of the MBBA into its stable crystalline phase has been disturbed by the decreasing pore size. The disturbing effect is relatively strong for the stable crystalline phase compared with that of the metastable crystalline phase.
The exothermic peak D is caused by the cold crystallization of supercooled MBBA in the nematic phase. This indicates that the crystallization of MBBA has been disturbed by the decrease in the pore size, which corresponds to a decrease in the correlation length of both crystals. The glass transition (C in
Figure 3) was observed in CARiACT Q15, Q10, and Q6 with small pore sizes. The glass transition temperatures
Tg of the samples are the same as those previously reported for quenched MBBA in the nematic phase [
6]. However, not all of the MBBA in small pores is vitrified because the exothermic peak D is smaller than the sum of the endothermic peaks A and A′. Moreover, it has been unclear whether MBBA confined within small pores crystallizes completely or only partially through cold crystallization at peak D. Therefore, this result suggests that the average pore diameter does not correspond to the size of the crystalline phase of confined MBBA when it is confined within small pores, as in Q 6, Q10, and Q15. Owing to their larger pore sizes, the CARiACT Q series provides situations in which a single sample of MBBA crystallizes in large pores and vitrifies in small pores.
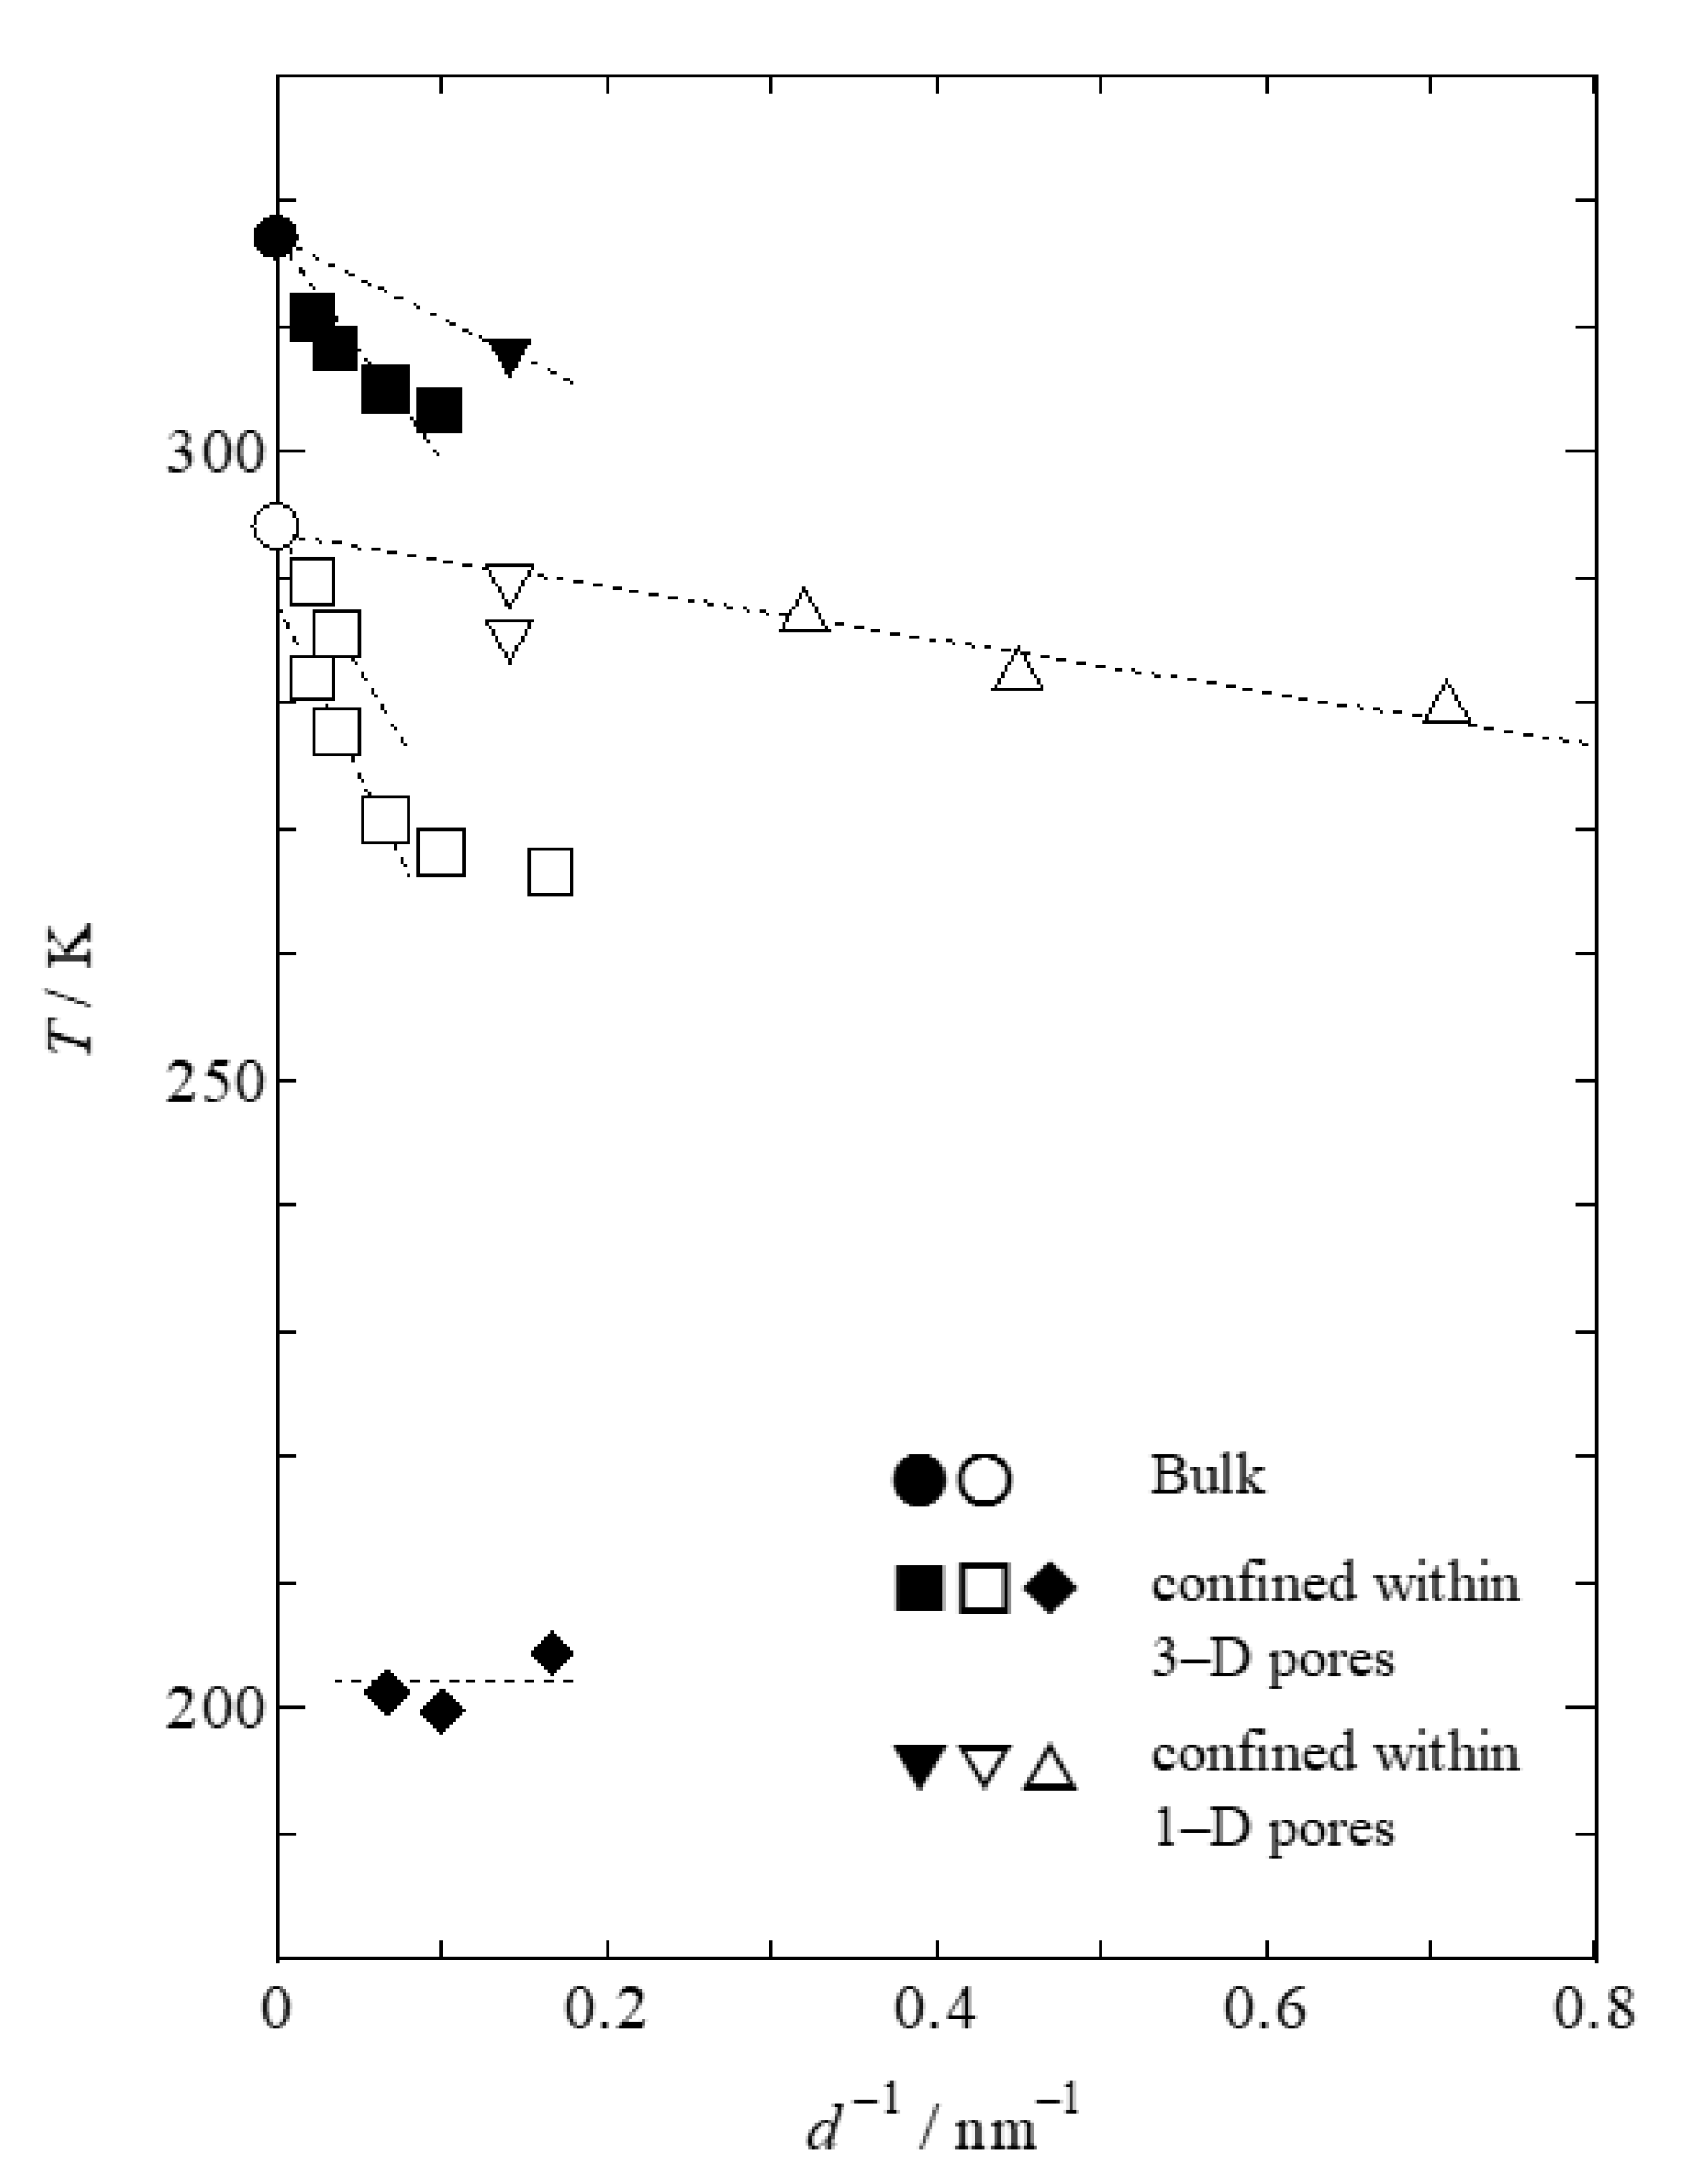
Figure 5 shows the pore-size dependences of the transition temperatures of MBBA confined within 1- and 3-D silica pores.
TCN (peaks A and A′) and
TNI (peak B) for the 3-D pores linearly shift toward lower temperatures with the inverse of the pore size. This linearity has been reported for MBBA confined within CPG and for other materials confined within various silica pores [
12,
14]. In addition,
TCN for samples confined within the small pores of Q10 and Q6 diverges from linearity. This indicates that the value of the average pore diameter (the horizontal axis of
Figure 5) differs from the effective size of the crystalline phase. Moreover, we found that
Tg for the nematic phase confined within 3-D pores does not exhibit a simple pore-size dependence, unlike the behavior of static-phase-transition temperatures. The confinement effect of MBBA in the nematic phase within 3-D pores is evidently not sufficiently strong to shift
Tg.
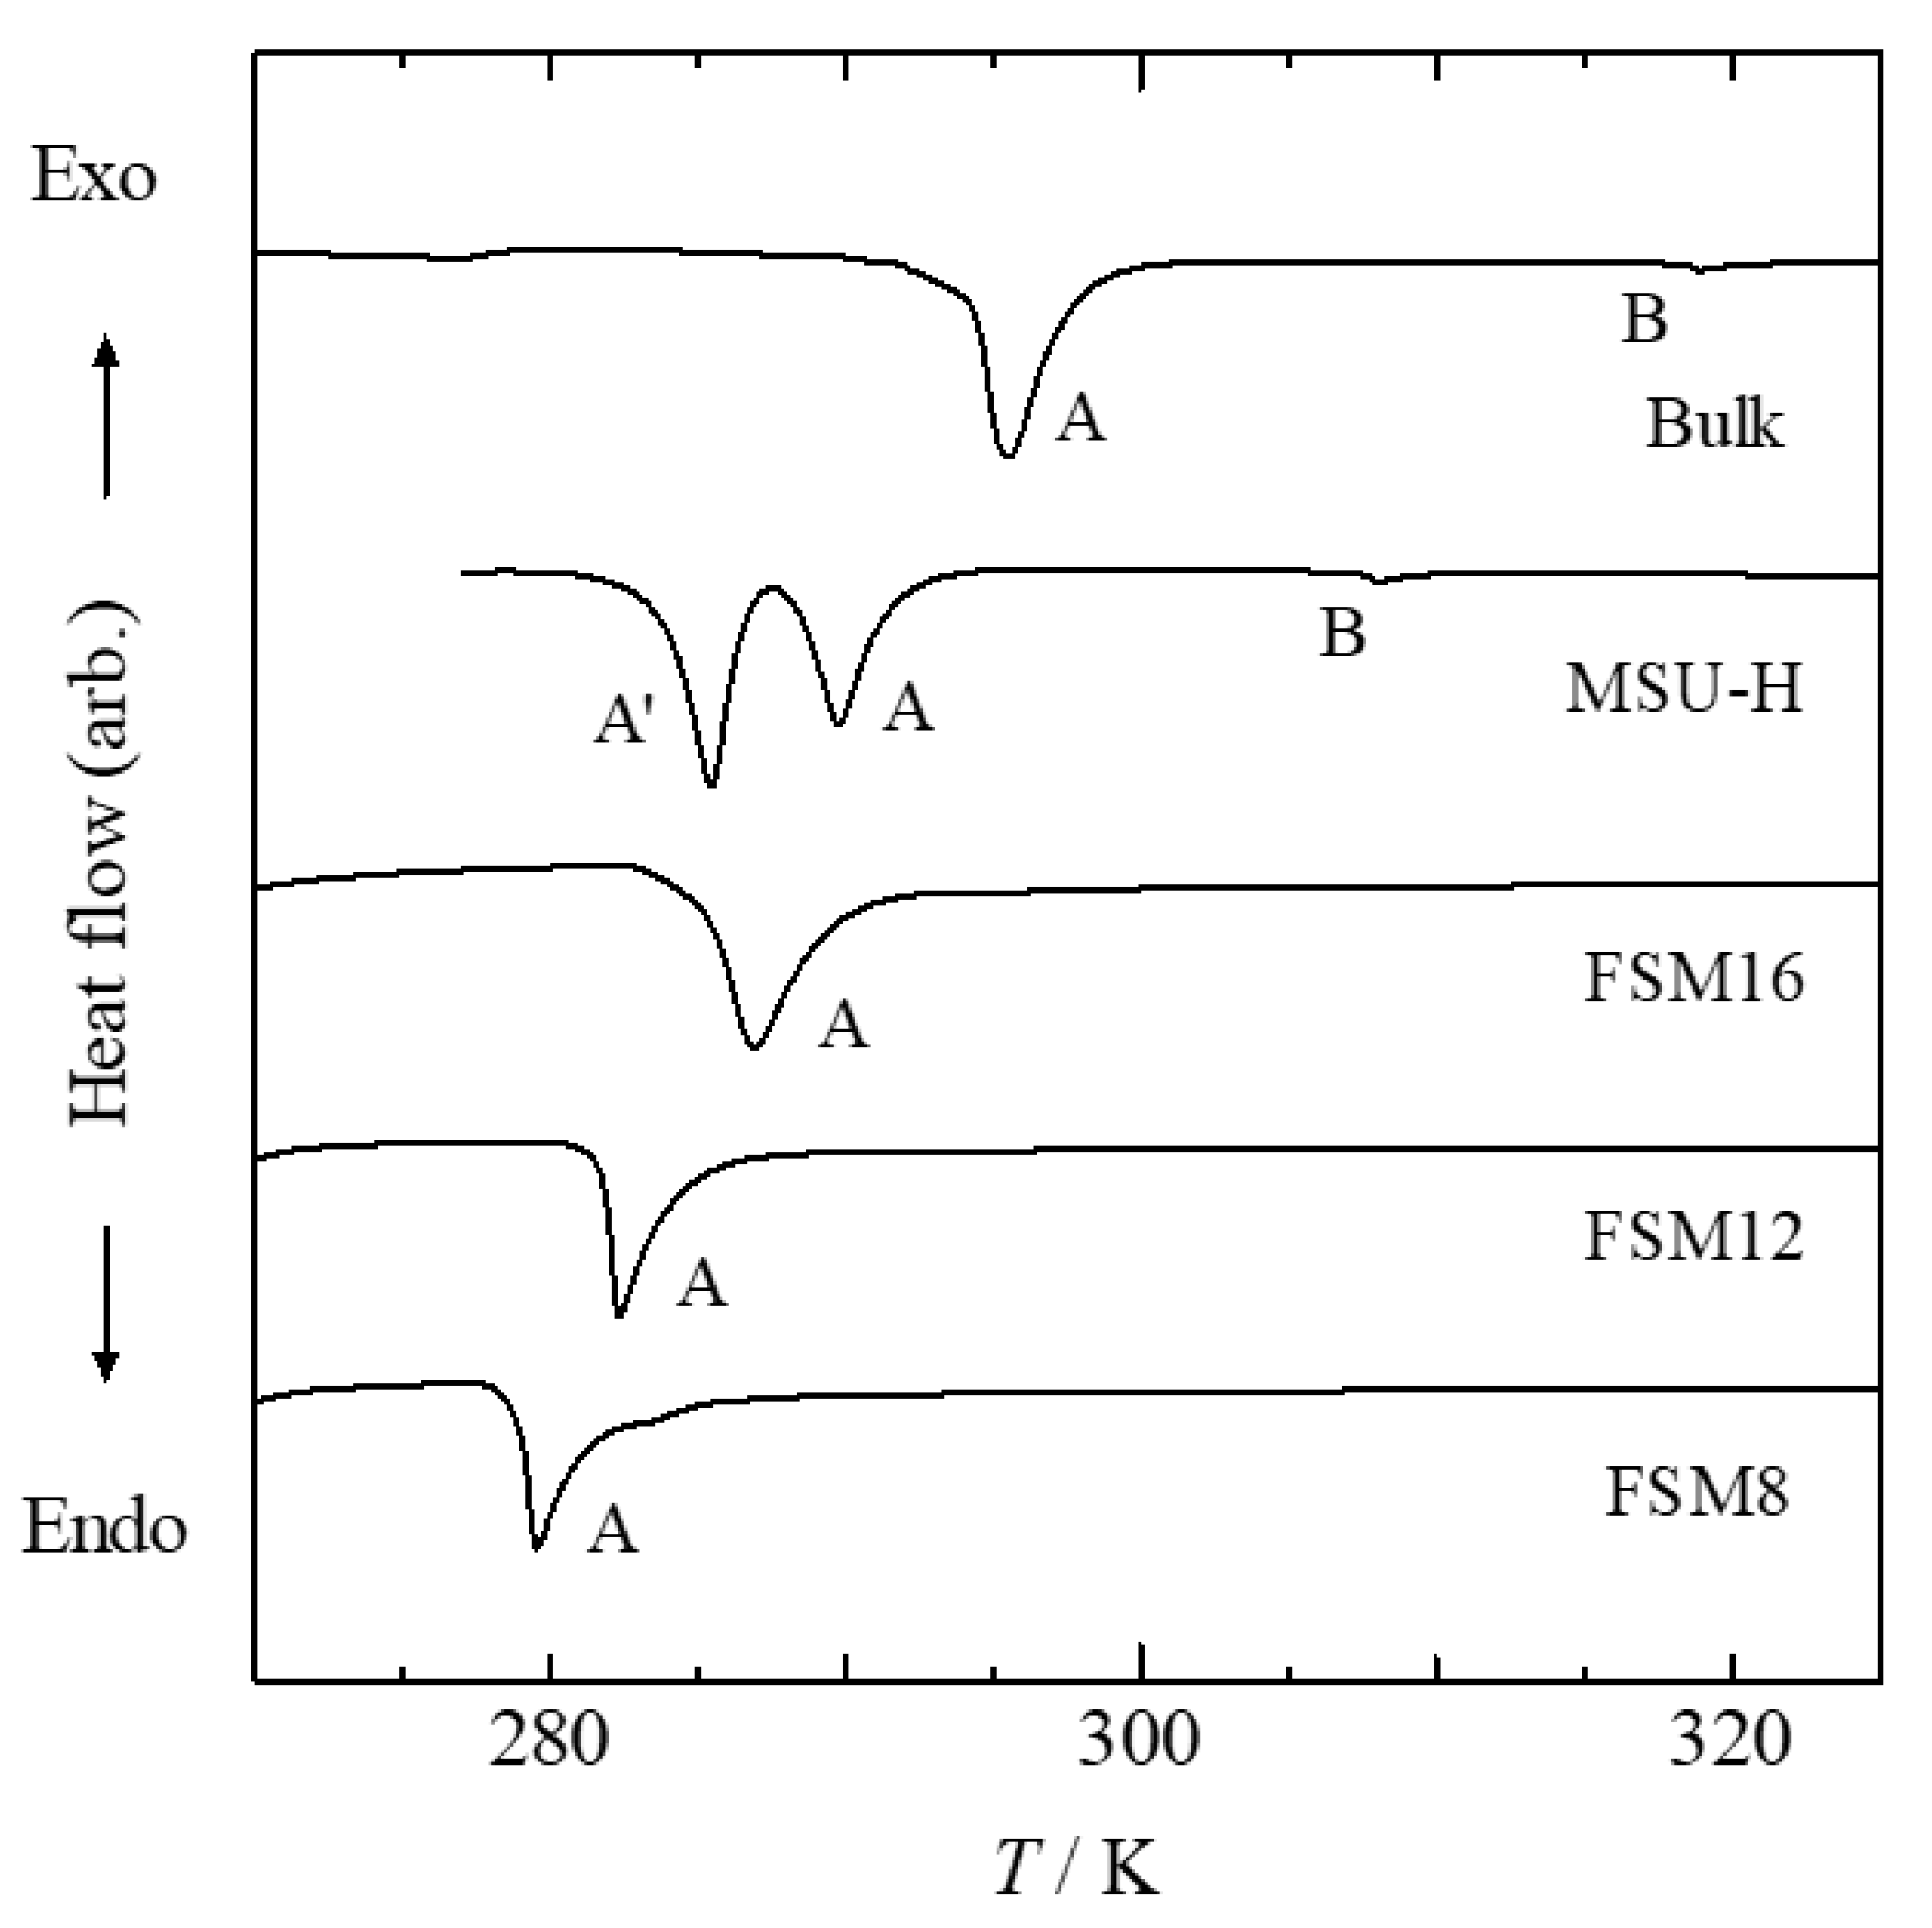
As shown in
Figure 4, for the sample confined within MSU-H, three endothermic peaks were observed: A, A′, and B. For samples confined within FSM16, FSM12, and FSM8, only peak A was observed. None of the samples confined within 1-D pores showed endothermic peaks owing to a phase transition of a bulk sample located outside the pores. Thus, the added MBBA was introduced into the pores during preparation. Peaks A and A′ of MSU-H correspond to the phase transitions C-N and C′-N, respectively. The single peak A observed in the FSM16 sample is located at a higher temperature than that of peak A′ in the MSU-H sample. Generally, the transition shifts toward lower temperatures when the sample is confined within smaller pores. Thus, peak A of the FSM16 sample corresponds to the C-N phase transition. As shown in
Figure 5,
TCN for the 1-D pores shifted to lower temperatures linearly with the inverse of the pore size without exhibiting peak A′ of the MSU-H sample. Thus, peak A of FSM12 and FSM8 also correspond to the transition from the stable crystalline phase to the nematic phase. When MBBA is confined within the 1-D pores of the FSM series, neither the phase transition to the metastable crystalline phase nor the glass transition are observed. This indicates that neither the formation of a metastable crystalline phase nor the vitrification of a part of the nematic phase occur. We conclude that the confinement effect of FSM does not disturb the crystallization of the stable crystalline phase, unlike that of confinement within 3-D pores. It was previously reported that holes exist on the pore walls of SBA-15, which is analogous to MSU-H. The holes connect the pores with each other and provide a similar situation to samples confined within 3-D pores. We speculate that holes in the pore walls of MSU-H accelerate the formation of the metastable crystalline phase or disturb the formation of the stable crystalline phase.
In
Figure 5, the pore-size dependence of
TCN for MBBA confined within 1-D pores is different from that confined within 3-D pores. The
TCN of MBBA confined within 3-D pores rapidly decreases with the inverse of the pore diameter than that of MBBA confined within 1-D pores. We emphasize that
TCN of MBBA confined within FSM pores with smaller pore sizes is higher than that of MBBA confined within 3-D pores, despite the larger pore size. This difference results from the difference in the architecture of the silica pores. Frustration at points connecting the 3-D pores disturbs the crystallization of the stable crystalline phase and accelerates vitrification, which is the basis for the kinetic aspect described above. Moreover, this frustration destabalizes the stable crystalline phase on the basis of a static aspect.
The thermal anomaly associated with the N-I phase transition was not observed for MBBA confined within FSM pores. It was previously reported that a peak in the specific heat due to the phase transition from a liquid-crystal phase to an isotropic liquid phase became broader and smaller when it was confined within CPG [
1,
2,
3]. This broadening of the peak is due to coupling between the liquid-crystal molecules and the pore walls. This suggests that MBBA molecules confined within FSM are arranged in the direction of the 1-D pores, avoiding random orientations because of the constraints imposed by the pore walls. Therefore, the difference between the nematic and isotropic liquid phases in the confined state becomes small. Thus, the transition entropy corresponding to the peak area in a DSC chart becomes small, and it is hardly detectable in
Figure 4.
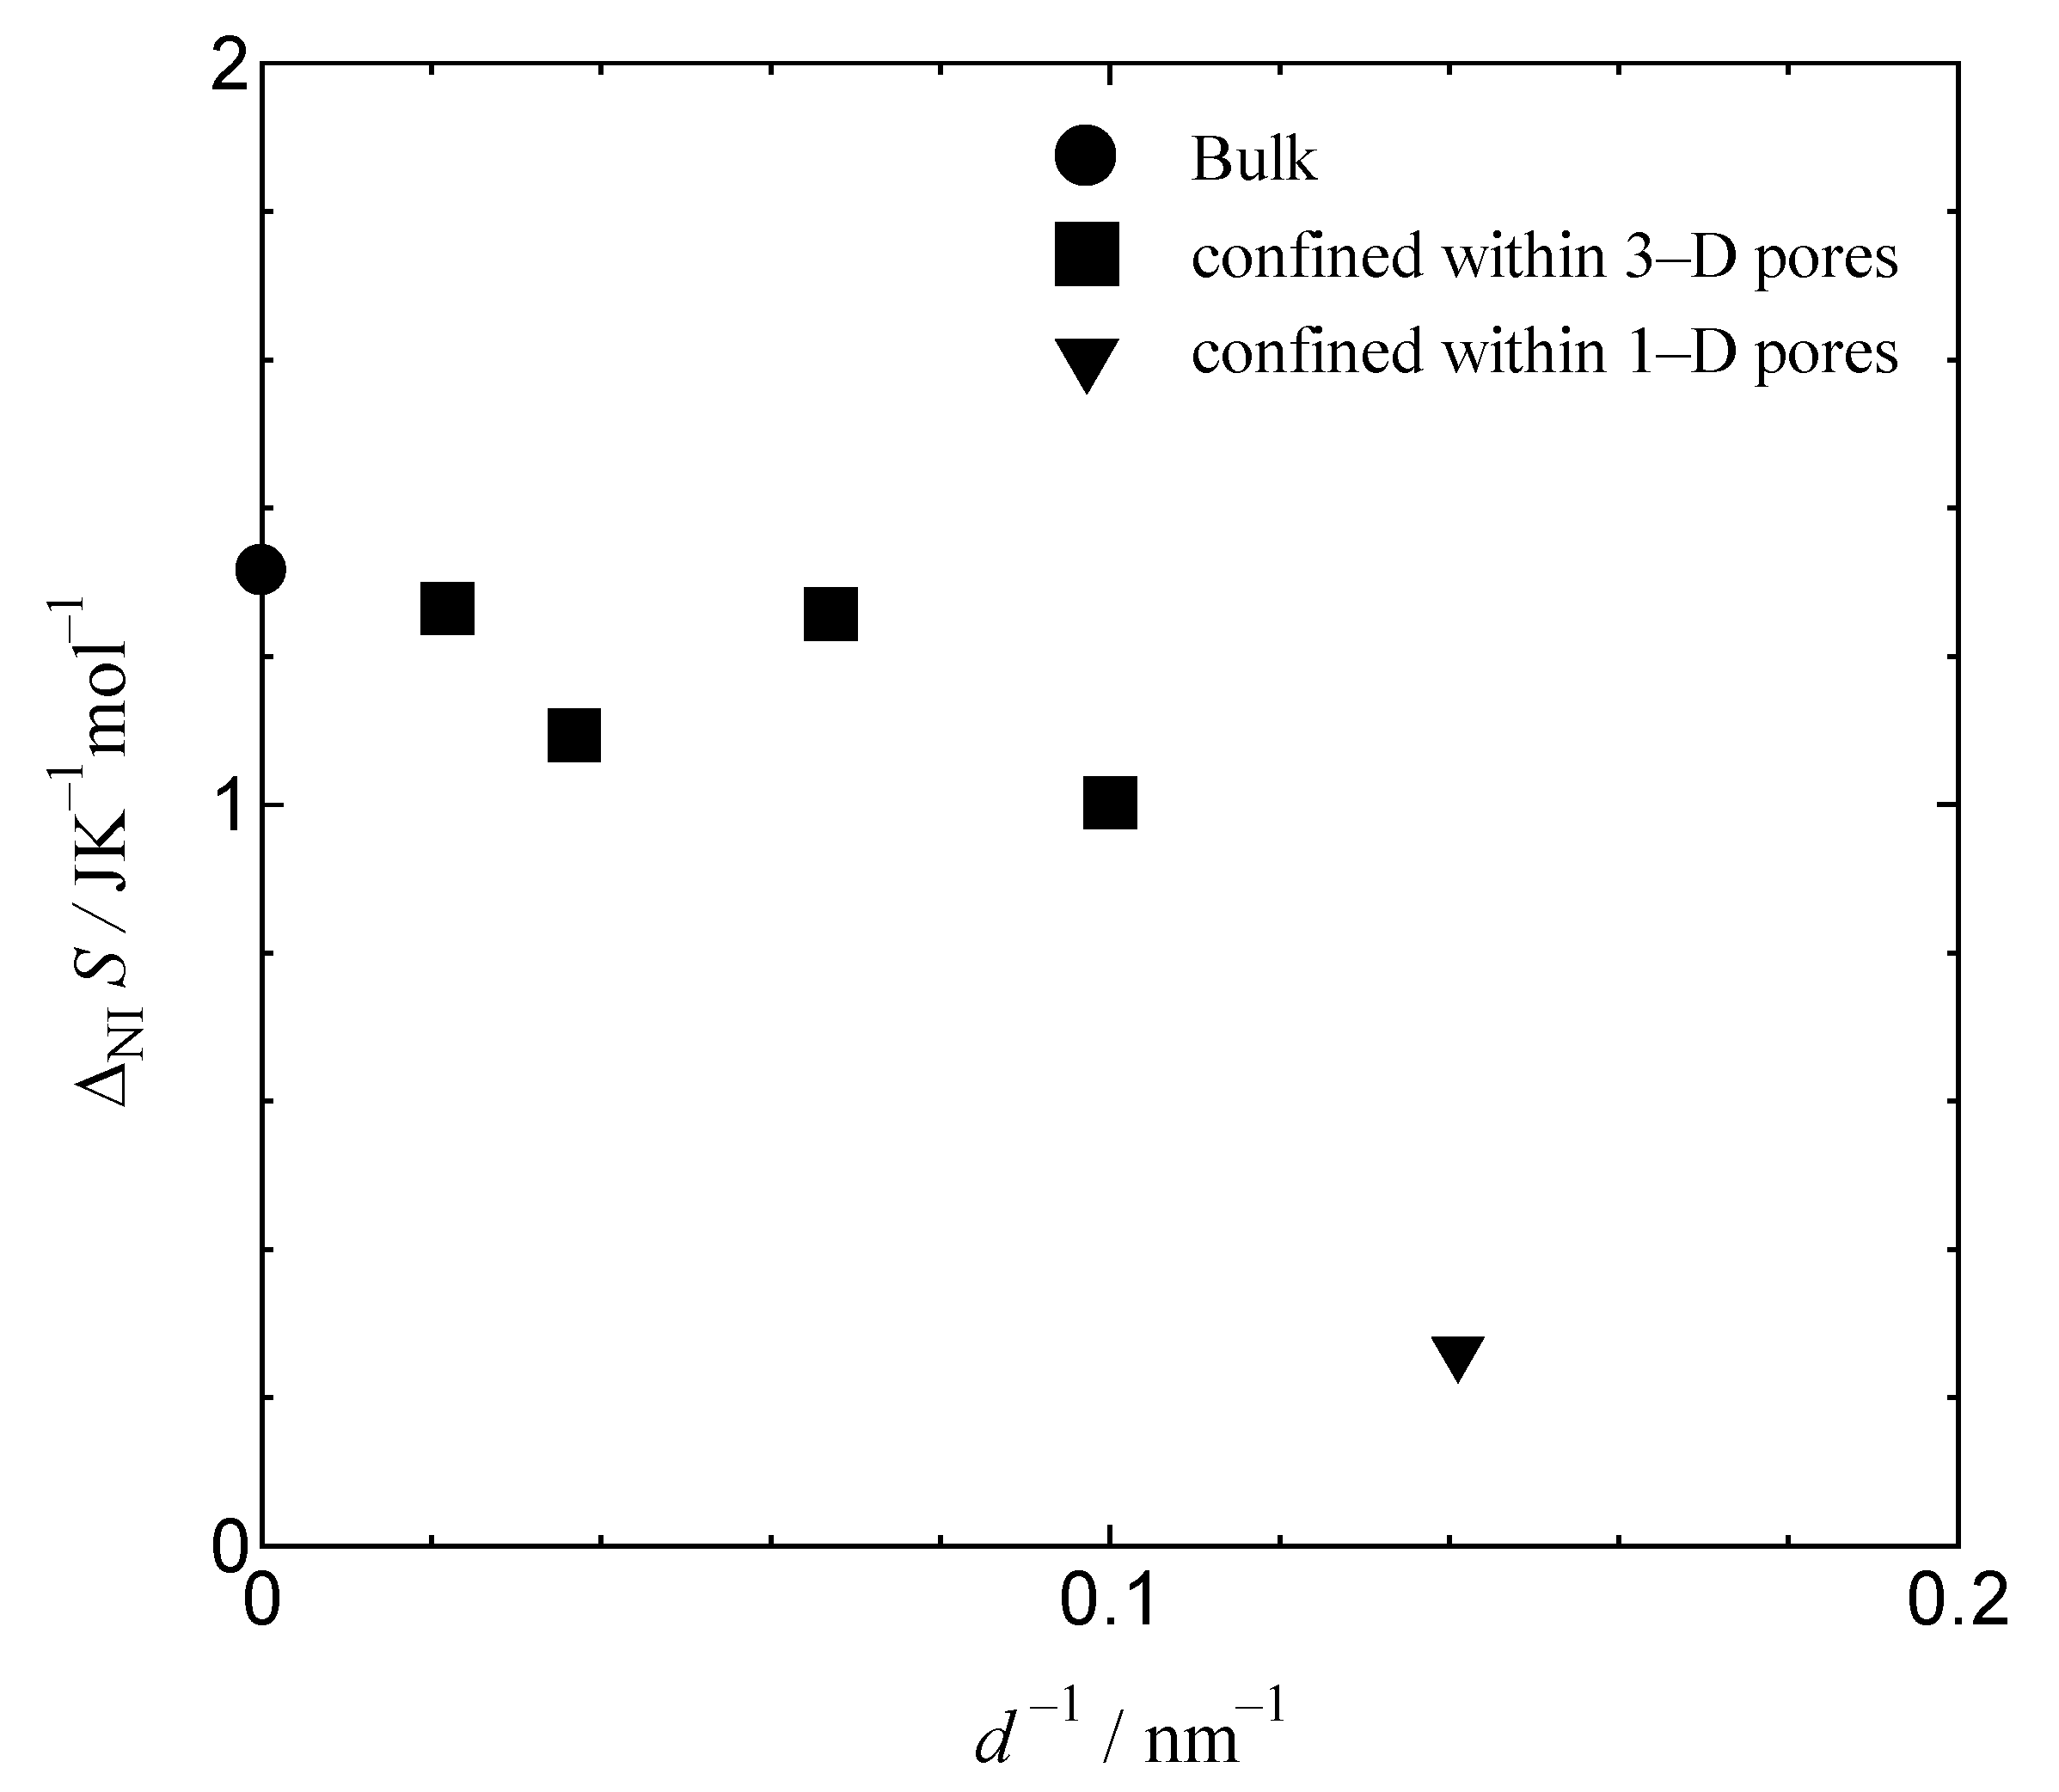
Figure 6 shows the pore-size dependence of the transition entropy from the nematic to the isotropic liquid phase for bulk MBBA and for MBBA confined within 1-D and 3-D pores. The transition entropy of bulk MBBA agrees well with the experimental results of Shinoda et al. [
14]. The transition entropies of MBBA confined within 3-D pores gradually decreasedwith the decreasing pore size, which is consistent with previous work [
1,
2,
3]. In addition, the transition entropy of MBBA confined within MSU-H is minuscule compared with the extrapolated value of the 3-D pore behavior. The transitions in MBBA confined within FSM pores are smaller, and thus, more difficult to detect through DSC measurements. This suggests that the effect of coupling between liquid crystals and pore walls for samples confined within 1-D pores is stronger than that of samples confined within 3-D pores. Frustration at points connecting the 3-D pores disturbs the effect.
The transition entropy of the C-N phase transition is not discussed in this paper because identifying the weight percentages of the metastable and stable crystalline phases of confined MBBA is difficult. In future work, these crystalline phases can be identified using X-ray diffraction and NMR.
4. Conclusions
The phase-transition temperatures of MBBA confined within silica porous materials with 1-D (MSU-H, FSM series) and 3-D (CARiACT Q series) pore architectures declines with the inverse of the pore size, compared to that of bulk MBBA. Each phase transition temperature shifts to a lower temperature when MBBA is confined within 1-D and 3-D pores. However, TCN of MBBA confined within 3D pores drastically decreased compared with that confined within 1-D pores. In addition, for the sample confined within the FSM series, the thermal anomaly associated with the N-I phase transition was not observed in the DSC chart. Experimental results and theoretical analyses of the N-I phase-transition peak becoming broader and smaller under confinement have been previously reported. However, the phenomenon appears more strongly in samples confined within 1-D pores. This indicates that 1-D cylindrical mesoporous silica pores provide ideal conditions for confinement within a 1-D cylindrical space and that there is a critical size of the 1-D cylindrical space for the N-I phase transition. In contrast, 3-D pores contain connection points where frustration of the molecular alignment disturbs the kinetic and static aspects of crystallization and accelerates the vitrification of confined materials.
Further structural analysis using NMR and X-ray diffraction is necessary to investigate the changes in the molecular mobility and intermolecular interactions of liquid crystal molecules in the bulk state and under nanoscale confinement. Although we observed changes in the phase transition temperature and transition entropy of MBBA due to the confinement in mesoporous silica, elucidating phase formation mechanism of liquid crystals will be addressed in a follow-up study.

 and
and 


