Intramolecular Hydrogen Bond Energy and Its Decomposition—O–H∙∙∙O Interactions


1
Polimero eta Material Aurreratuak: Fisika, Kimika eta Teknologia, Kimika Fakultatea, Euskal Herriko Unibertsitatea UPV/EHU & Donostia International Physics Center (DIPC) PK 1072, 20080 Donostia, Spain
2
IKERBASQUE, Basque Foundation for Science, 48011 Bilbao, Spain
Crystals 2021, 11(1), 5; https://0-doi-org.brum.beds.ac.uk/10.3390/cryst11010005
Submission received: 24 November 2020
/
Revised: 14 December 2020
/
Accepted: 20 December 2020
/
Published: 23 December 2020
(This article belongs to the Special Issue Hydrogen Bonds in Crystals)
Abstract
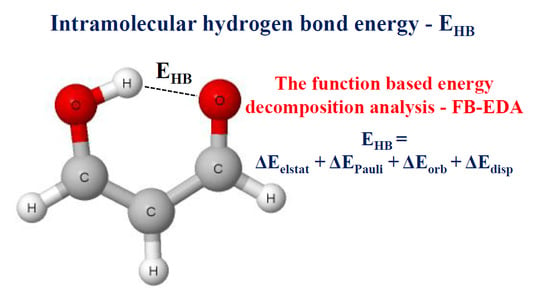
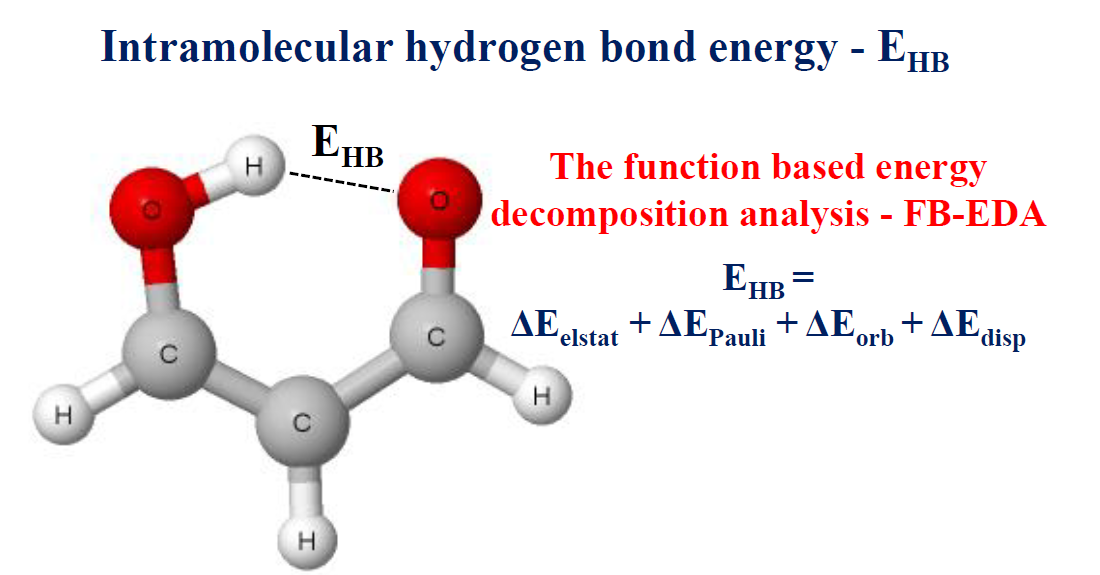
:The method to calculate the energy of intramolecular hydrogen bond is proposed and tested for a sample of malonaldehyde and its fluorine derivatives; the corresponding calculations were performed at the ωB97XD/aug-cc-pVTZ level. This method based on relationships found for related intermolecular hydrogen bonds is compared with other approaches which may be applied to estimate the intramolecular hydrogen bond energy. Particularly, methods based on the comparison of the system that contains the intramolecular hydrogen bond compared with corresponding conformations where such interaction does not occur are discussed. The function-based energy decomposition analysis, FB-EDA, of the intramolecular hydrogen bonds is also proposed here.
1. Introduction
It is well known that the hydrogen bond interactions play a crucial role in numerous physical, chemical and biological processes [1,2]. Special attention is often paid on the intramolecular hydrogen bond (hereafter often marked as intraHB). According to the monograph of Jeffrey [2], it seems that intraHBs were identified very early, in 1924, by Sidgwick and Callow [3]. They found that these interactions are responsible for differences in physical properties between ortho-substituted phenols where they occur, and meta-substituted as well as para-substituted phenols where they are not observed. The distinct properties were also observed between some 1,2 disubstituted benzenes and their 1,3 as well as 1,4 disubstituted counterparts. This was explained by the formation of intramolecular rings for the former species [3]. Several examples of intraHB systems were discussed in this early study; in o-chlorophenol the hydroxyl hydrogen is attached to the chlorine; however, if the chlorine center is replaced by the methyl group, there is no intramolecular energetically stabilizing link.
The latter example of the o-chlorophenol refers to the five-member ring closed by the intramolecular O–H∙∙∙Cl hydrogen bond. However, it was discussed that six-member rings closed by the O–H∙∙∙O hydrogen bonds occur most often, especially in crystal structures [4]; it was pointed out that such six-member rings are more stable than their five-member ring counterparts [5,6]. These motifs are designated as S(6) in the graph-set assignments [4,7,8]. The stability is also characteristic for the sub-class of such systems that are classified as the resonance-assisted hydrogen bonds (RAHBs) [9,10]; for RAHBs the conjugated double π-bonds and single bonds are closed by the intramolecular hydrogen bond. It was pointed out that the intermolecular RAHBs also occur, for example, in dimers of carboxylic acids, or amides [9]. In RAHB systems, the equalization of single and double bonds is observed that leads to the strengthening of hydrogen bonds. This is why numerous six-member rings with intraHBs are stable, and malonaldehyde is an example often analyzed [11,12,13,14]. The RAHB concept is often contested [15,16,17]; however, for so-called RAHB systems, the rearrangement of charge distribution occurs that leads to the increase in importance of attractive electrostatic, polarization and charge transfer interaction energy terms [18].
There are numerous experimental studies on RAHB systems, especially on intramolecular interactions: the use of RAHBs for regioselective nucleophilic attacks [19]; the influence of intramolecular RAHBs on the aromaticity of the adjacent pirydyl group [20]; the influence of RAHBs on the reactivity of aldehyde group of benzothiazole receptors [21]; the study on the excited-state intramolecular proton transfer sensing mechanism [22]; and the study that RAHB systems are often the driving force in synthesis [23].
Numerous intramolecular hydrogen bonds in S(6) systems are very strong and they often possess characteristics of covalent bonds [10,14]. Such interactions are often classified as short strong hydrogen bonds (SSHBs) [24] and/or as low barrier hydrogen bonds (LBHBs) [25,26]. It is discussed that they often play a crucial role in enzymatic catalysis [27,28,29]. One can also refer to the intramolecular hydrogen bonds that occur in proton sponge species [30,31]. The study concerning the localization of deuterons in proton sponges by NMR spectroscopy may be mentioned [32], or the study where the NMR chemical shift difference of protons for inter- and intramolecular hydrogen bonds was used for the estimation of the hydrogen bond energy and geometry [33]. Hence, there are numerous broad areas of investigations in chemistry, and particularly in biochemistry, that are related to the intramolecular hydrogen bond interaction. One of these areas concerns the estimation of energy of intramolecular hydrogen bonds which is not clear-cut, and which raises a number of controversies and discussions.
Thus, the aim of this study was the comparison of several approximations that lead to the evaluation of the energy of intraHBs, as well as the presentation of a new method of its evaluation. The following parts of the analysis of results presented here may be indicated.
- -
- The analysis of intraHBs in simple species; malonaldehyde and its fluoro-derivatives.
- -
- The comparison of the above species with similar types in crystal structures.
- -
- The critical analysis of the estimation of intraHB energy that is based on comparison of the conformation containing this interaction with conformations that do not possess it.
- -
- The proposal of the new method to calculate intraHB energy. Following steps may be indicated here: (1) the choice of structures with intraHBs for which such energies are to be calculated; (2) finding of relationships between HB energy and other parameters for related complexes linked by intermolecular hydrogen bonds; (3) the application of the latter relationships for intraHBs being the subject of analysis.
- -
- The comparison of the above new method with other approaches.
- -
- Additionally, the method of the decomposition of energy of interaction for intraHB systems is proposed in this study, apparently for the first time.
2. Models to Calculate Energies of Intramolecular Hydrogen Bonds
There are numerous ways to estimate the intramolecular hydrogen bond energy. An extensive survey of various methods that are often used to evaluate the energies of intraHBs has been performed [34]. In the study presented here, the main methods that have been applied are briefly mentioned for comparison with new approaches proposed here. In one of such approaches, the energy is calculated as the difference between the energy of the so-called cis closed conformation where the intraHB occurs and the trans open conformation where such interaction is not observed [35,36]. The energy of intraHBs may be also calculated by considering isodesmic reactions as the difference in energies of substrates and products [13]. There is also a group of methods based on relationships between various parameters describing the hydrogen bond interaction. One such approach is based on the relationship between the hydrogen bond energy, EHB, and the topological characteristic, i.e., the potential electron energy density at the bond critical point, VBCP (Equation (1)) [37,38].
Both EHB and VBCP values are expressed here in atomic units; this relationship concerns the dependence determined for the intermolecular O–H∙∙∙O hydrogen bonds in crystal structures [37,38].
In another approach that takes into account conformers of a system analyzed which do not contain intraHBs [39], the intramolecular hydrogen bond energy is expressed by the following equation:
The ZZ conformer designates the cis-enol form which is characterized by the existence of intraHB. The EZ conformer is formed by rotation of the proton donor group and corresponds to the abovementioned open configuration. The EE conformation is formed from the ZZ configuration by the rotation of both proton donor and proton acceptor groups. Equation (2) is slightly modified in relation to the original expression [39]; the negative value of the energy of intramolecular hydrogen bond expressed by Equation (2) indicates the stabilizing interaction, while according to the original study positive values correspond to stabilizing interactions. The EEZ,f and EEE,f are energies of EZ and EE conformers, respectively; they are called “fictitious” because their bonds and angles are the same as in the ZZ corresponding structure, only conformations are changed.
The exponential relationship was also proposed by Musin and Mariam [40] to calculate the hydrogen bond energy (Equation (3)).
R is the O...X distance, where X = O or N in the above equation because O–H∙∙∙O, N–H∙∙∙O and O–H∙∙∙N hydrogen bonds are taken into account in this model. R is expressed in angstroms, while the calculated energy is given in kcal/mol. The approximate relationship that concerns the O–H∙∙∙O hydrogen bonds was proposed by Gilli and Gilli (Equation (4)) [41].
The R distance (the O∙∙∙O distance of the O–H∙∙∙O intraHB) is given in angstroms; Θ is the O–H∙∙∙O angle (in degrees) and the calculated intraHB energy is expressed in kcal/mol.
The molecular tailoring seems to be an important approach that is useful to estimate a strength of intramolecular hydrogen bonds and that leads to reliable results [42,43]. Unfortunately, it is not applied often to analyze hydrogen bond interactions. Few studies of the application of the tailoring approach are known; for example, the O–H∙∙∙O=C interactions in a very large number of hydroxycarbonyl aliphatic compounds were analyzed [44] or an estimation of intramolecular hydrogen bond energies in a sample of similar RAHB systems was performed [45].
It is worth to mention that there is a series of studies of Afonin and co-workers [46,47,48,49] concerning intramolecular hydrogen bonds, especially RAHB systems. The authors indicated two main groups of approaches to evaluate the energy of intraHB systems [49], function-based approaches, FBAs, and the molecular tailoring approaches, MTAs. The methods based on equations 1, 3 or 4 may be classified as the FBA approaches while the method proposed by Gadre and co-workers [42,43] may be classified as the MTA approach. One can also mention the relationships between the hydrogen bond energy and the electron density at the corresponding proton–proton acceptor distance [50,51], which may be classified as the FBA approaches, the following hydrogen bonds were analyzed with the use of such relationships; O–H∙∙∙O, N–H∙∙∙O, O–H∙∙∙N, and O–H∙∙∙C [50].
3. Computational Methods
The calculations for species analyzed in this study have been performed with the use of Gaussian16 set of codes [52]. The ωB97XD functional [53] with the aug-cc-pVTZ basis set [54] were applied. It has been justified that the ωB97XD functional offers more reliable results in comparison with other commonly applied functionals [53]. It was also checked that for the analysis of interactions, this functional, especially in conjunction with the aug-cc-pVTZ basis set provides results superior to other functionals and basis sets [55]. Frequency calculations have been carried out at the same ωB97XD/aug-cc-pVTZ level for all systems considered; imaginary frequencies were not found for fully optimized species. The calculations were performed for malonaldehyde and its fluoro-derivatives where intramolecular O–H∙∙∙O hydrogen bonds occur. However, calculations were also carried out for conformers where such interactions do not exist as well as for complexes with similar systems of formally single and double bonds as those that occur in species with intramolecular hydrogen bonds. As mentioned above, the optimized structures with intra- and intermolecular hydrogen bonds correspond to energetic minima. The Counterpoise Correction approach was applied to estimate the basis set superposition error, BSSE [56], for complexes, i.e., the systems linked by intermolecular O–H∙∙∙O hydrogen bonds. The interaction energy is calculated here as the difference between the energy of complex and the sum of energies of monomers possessing geometries taken from the complex.
The Quantum Theory of ‘Atoms in Molecules’ (QTAIM) [57,58] was applied to analyze characteristics of bond critical points (BCPs) of the intra- and intermolecular O–H∙∙∙O links. The AIMAll program [59] was used to carry out QTAIM calculations. The decomposition energy calculations were performed at BP86-D3/TZ2P level for complexes connected by O–H∙∙∙O hydrogen bonds and possessing geometries resulting from the ωB97XD/aug-cc-pVTZ optimizations. This means that for the decomposition, the BP86 functional [60,61] with the Grimme dispersion corrections [62] and the uncontracted Slater-type orbitals (STOs) as basis functions with triple-ζ quality for all elements [63] were applied. The decomposition energy calculations [64,65] were performed with the use of ADF2013.01 program [65,66]. The total interaction energy in the energy partitioning applied here, ΔEint, is composed of terms according to equation given below.
ΔEint = ΔEelstat + ΔEPauli + ΔEorb + ΔEdisp
The term ΔEelstat is usually attractive (negative) and it corresponds to the quasi-classical electrostatic interaction between the unperturbed charge distributions of atoms. The Pauli repulsion, ΔEPauli, is the energy change associated with the transformation from the superposition of the unperturbed electron densities of the isolated fragments to the wave function that properly obeys the Pauli principle through antisymmetrization and renormalization of the product wave function. The orbital interaction, ΔEorb, corresponds to the charge transfer and polarization effects, briefly speaking to the electron charge shifts resulting from the complex formation. The additional dispersion term, ΔEdisp, is included in the total interaction energy.
4. Results and Discussion
4.1. Characteristics of Intramolecular Hydrogen Bonds
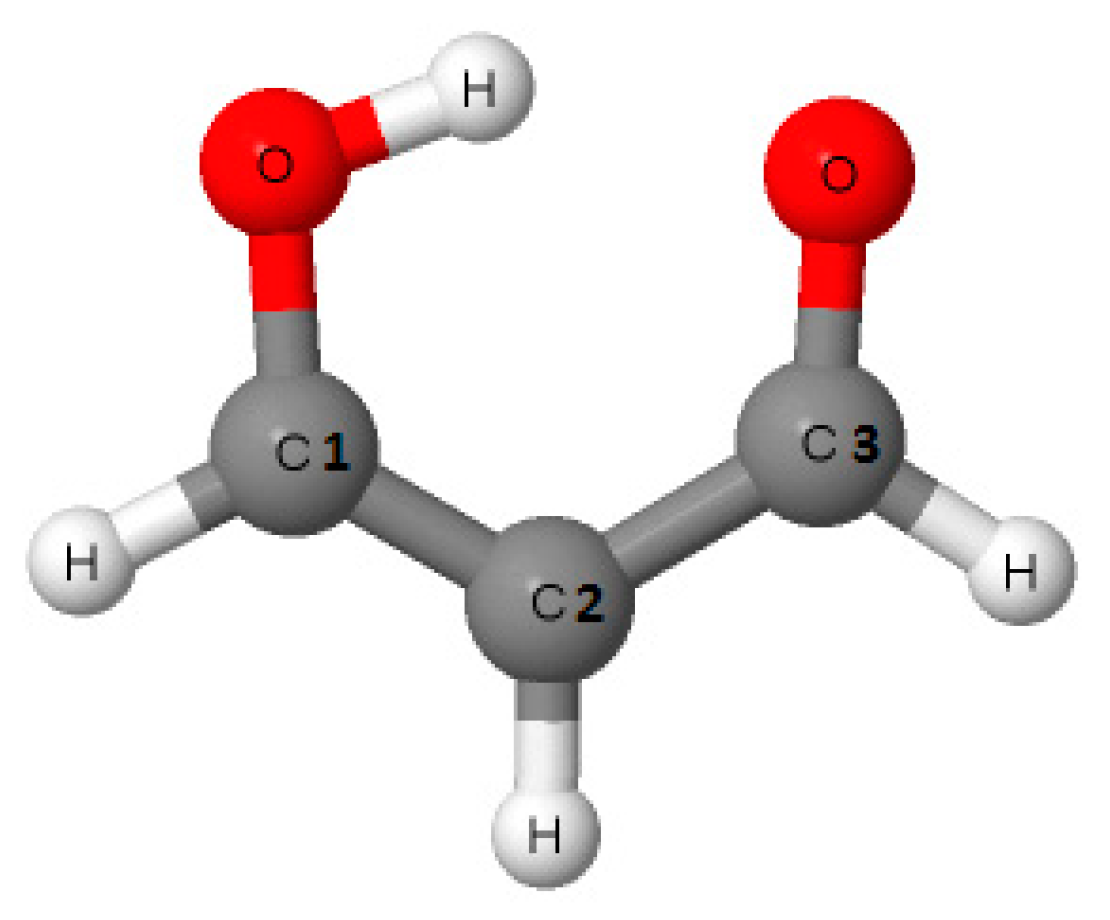
The malonaldehyde species (Scheme 1) and its simple fluorine derivatives that are often classified as the resonance assisted hydrogen bonds, RAHBs [9,10], are discussed in this study. This choice was dictated by the frequent occurrence of six-member rings closed by the intramolecular O–H∙∙∙O hydrogen bonds, especially in crystal structures [4,7,8].
Analyses performed here are based on the ωB97XD/aug-cc-pVTZ results; the choice of the level of calculations was justified in the former section. The goal of this study was to compare various methods to estimate the energy of intramolecular hydrogen bond within the same level, and not the calculation of accurate interaction energies. Table 1 presents geometrical parameters of the intramolecular O–H∙∙∙O hydrogen bonds of the species analyzed. The fluorine substituents in malonaldehyde influence the π-electron delocalization, and consequently on the hydrogen bond strength [10,67,68]. For example, for the M-1 structure, the F-substituent (at C1) withdraws the electron charge from the OH group that results in the O–H bond elongation and the proton shift closer to the carbonyl oxygen. Consequently, it leads to the increase in the strength of the hydrogen bond. On the other hand, in the M-3 structure, the F-substituent (at C3) withdraws the electron charge from the carbonyl oxygen that leads to the weakening of the O–H∙∙∙O hydrogen bond.
The above expectations concerning hydrogen bond strength are confirmed by results of Table 1. If we assume that the O–H bond length as well as the H∙∙∙O and O∙∙∙O distances indicate the strength of the O–H∙∙∙O hydrogen bond [9,14], the M-1 structure is characterized by the strongest O–H∙∙∙O interaction because the longest O–H bond and the shortest H∙∙∙O and O∙∙∙O distances are observed here. In contrast, the shortest O–H proton donating bonds and the longest H∙∙∙O and O∙∙∙O distances occur for the M-3 and M-23 structures because of the F-substituent located at the carbonyl group. This may mean that the weakest O–H∙∙∙O hydrogen bonds occur for these structures.
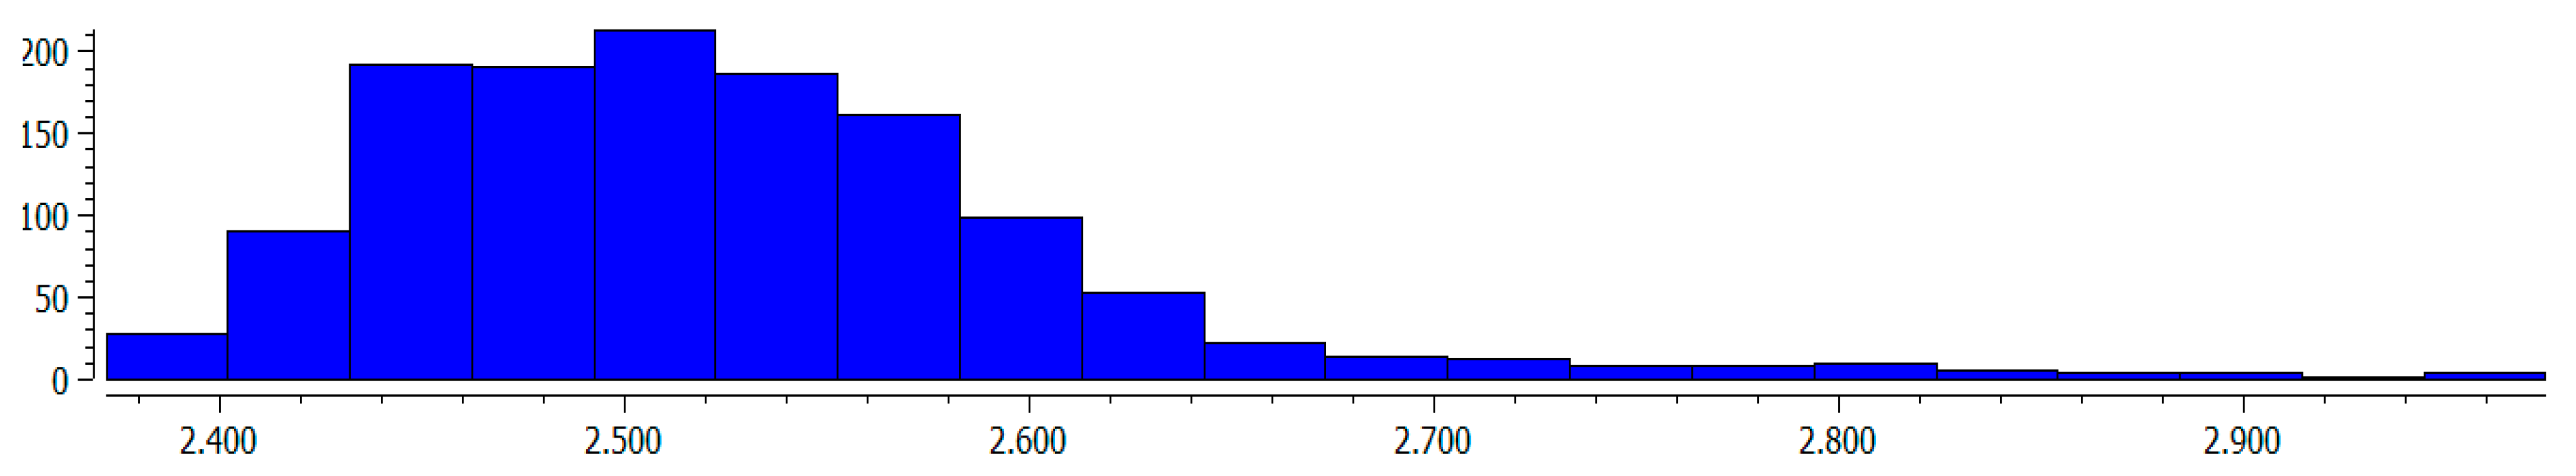
The geometrical parameters presented in Table 1 are in agreement with the experimental results concerning crystal structures. The Cambridge Structural Database, CSD [69,70], search (August 2020 release) has been performed to find the S(6) motifs, i.e., H–O–C=C–C=O conjugated systems closed by the intramolecular O–H∙∙∙O hydrogen bond. In other words, the same systems were searched as in Scheme 1, but not only H- or F-atoms connected with carbon centers were considered; other substituents were taken into account. The following criteria were applied for this search: exclude structures with unresolved errors, exclude powder structures, no polymeric structures, non-disordered structures, only single crystal structures, R ≤ 7%, e.s.d.’s (estimated standard deviations) for CC bond lengths are less than or equal to 0.005Å. 1080 crystal structures fulfilling the search criteria were found that contain 1293 S(6) motifs mentioned above. Figure 1 presents histogram of the O∙∙∙O distances of the O–H∙∙∙O intraHBs related to this search: one can see that the maximum number of systems occurs for distances around 2.5 Å. The following descriptive statistics for these distances of the sample are considered; minimum and maximum values of 2.372 Å and 2.975 Å, respectively, the mean value—2.525 Å, variance—0.007 Å2, median—2.514 Å, and lower and upper quantiles equal to 2.465 Å and 2.567 Å, respectively. The theoretical results for fluoro-derivatives of malonaldehyde (Table 1) are in agreement with experimental data (Figure 1). However, one can see that the broader spectrum of experimental systems is moved more towards shorter O∙∙∙O distances than theoretical results.
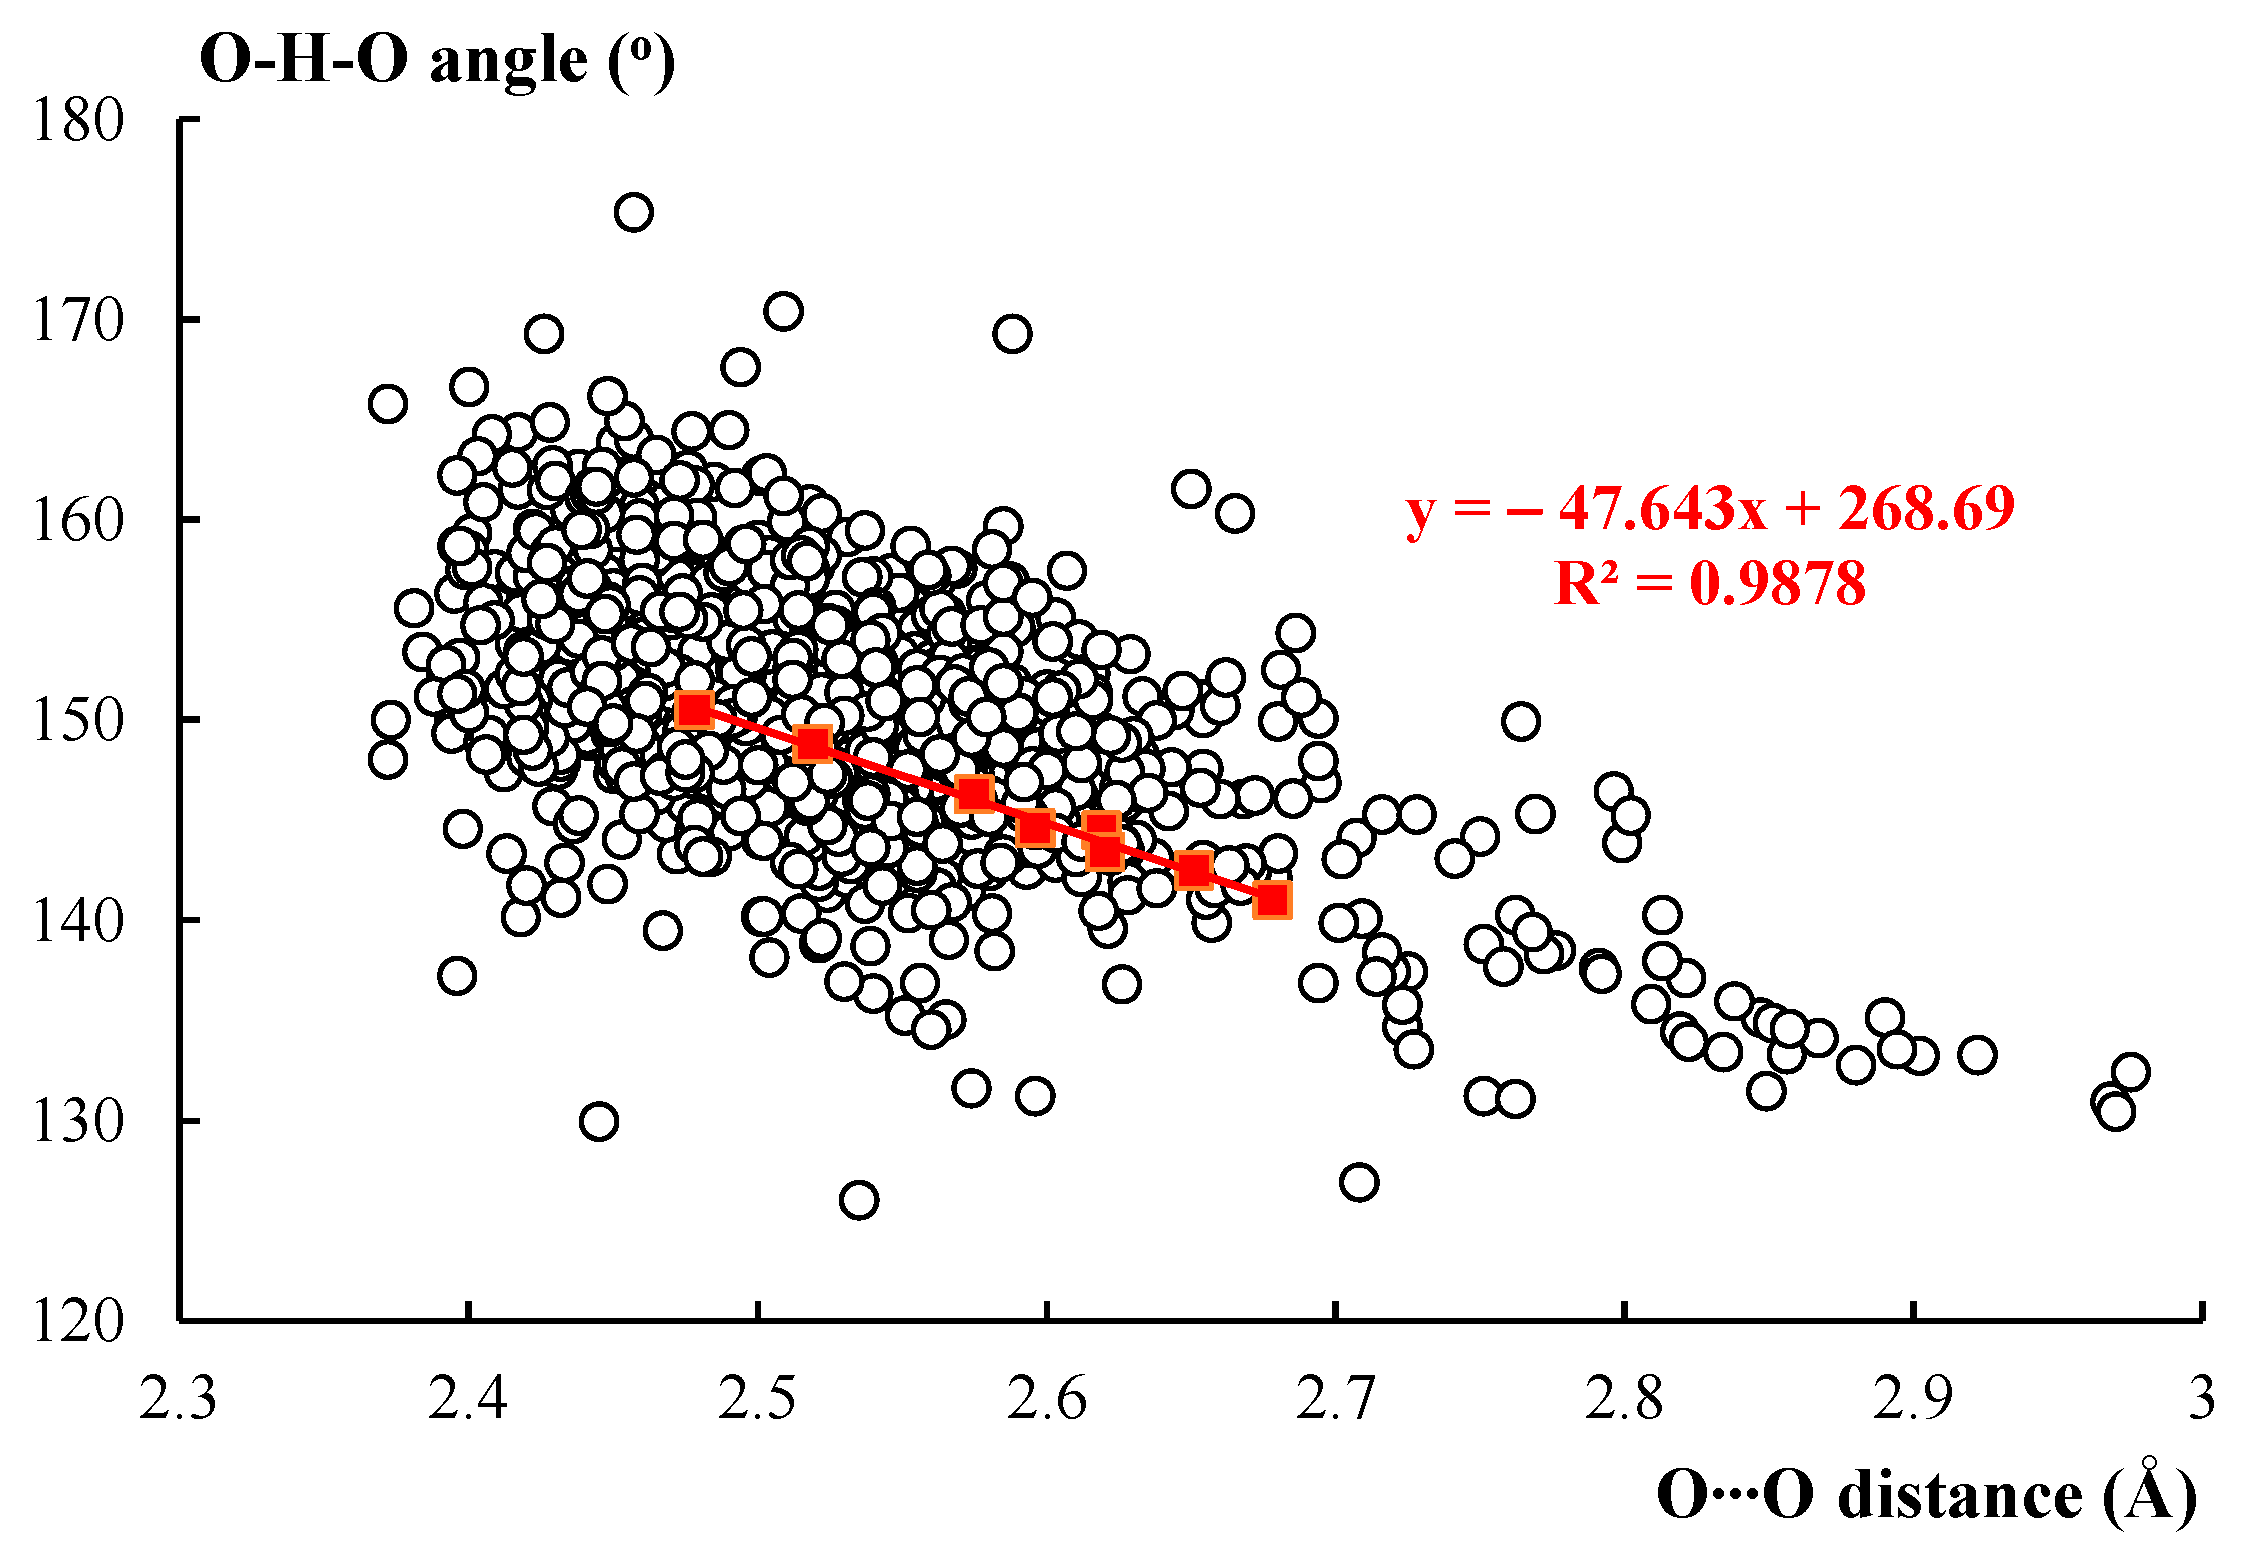
Figure 2 presents the relationship between the O∙∙∙O distance and the O–H∙∙∙O angle. The experimental results are expressed by the white circles; the tendency of the increase in the angle with the shortening of the O∙∙∙O distance are observed. The red squares that are shown in this figure correspond to theoretical values collected in Table 1. All information related to theoretical results is expressed in red color in this figure. The theoretical geometrical parameters are well inserted within experimental parameters and an excellent linear correlation for theoretical results is observed because R2 = 0.9878 for the O∙∙∙O distance vs the O–H∙∙∙O angle relationship. For the theoretical results, the narrow range of O∙∙∙O distances is also observed. In the case of experimental results concerning crystal structures, the scatter of points (Figure 2) is observed and the range of the O∙∙∙O distances is much broader. This may result from the variety of species considered as well as the diversity of environmental effects in crystals. One should also take into account the accuracy of the X-ray determination of hydrogen atoms positions, which are most often affected by the spherical approximation of the atomic electron densities that result in the spherical symmetry of atomic scattering factors [71]; the latter leads to the low precision of O–H∙∙∙O angle values considered here.
For example, the influence of environmental effects is evident even for the structure of (FHF)− anion where extremely strong hydrogen bond occurs that is commonly accepted as the strongest known hydrogen bond [1,72]. In the gas phase, the stable linear structure of the (FHF)− anion is characterized by the F∙∙∙F distance of 2.304 Å with the H-atom located in its mid-point (infrared diode laser spectroscopy was applied for the analysis of this anion) [73]. However, other studies have shown that the environmental effects in solvent [74] or in crystals [75] may significantly influence this geometry. Particularly, in crystal structures, the D∞h symmetry is often broken; for the sample of precise determined crystal structures, the range of F∙∙∙F distances from 2.194 Å to 2.382 Å is observed, the proton is often moved from the central position, and the system even loses linearity [75].
The majority of experimental intramolecular O–H∙∙∙O hydrogen bonds discussed here corresponds to strong and very strong interactions, because short O∙∙∙O distances were observed for them. The O∙∙∙O distance roughly expresses the strength of the hydrogen bond [14]; extremely strong O–H∙∙∙O hydrogen bonds possess O∙∙∙O distances of about 2.4 Å. For the experimental sample considered in this study, 22 crystal structures possessing hydrogen bonds characterized by distances lower than 2.4 Å were found. In two cases this distance amounted only 2.372 Å, in one case 2.373 Å. Two structures characterized by the shortest O∙∙∙O distance are presented in Figure 3, these are the crystal structure of 2-cyano-4,4,5,5,6,6,6-heptafluoro-3-hydroxy-N-methyl-N-phenylhex-2-enamide [76] and of 3-amino-3-hydroxy-2-nitroprop-2-enamide [77].
4.2. Quantum Theory of ‘Atoms in Molecules’ Parameters
Table 2 presents the Quantum Theory of ‘Atoms in Molecules’, QTAIM, parameters, i.e., characteristics of the H∙∙∙O bond critical point, BCP. It was found in numerous studies that such characteristics may often be treated as measures of the strength of the hydrogen bond [14,37,38]. Particularly the electron density at the bond critical point, ρBCP, of the pair of atoms being in contact is a good measure of such a strength. In the case of malonaldehyde and its derivatives considered here the properties of H∙∙∙O BCP inform of the nature of the corresponding intramolecular O–H∙∙∙O hydrogen bond. The greatest ρBCP value observed for the M-1 structure indicates the strongest O–H∙∙∙O interaction that is in agreement with the geometrical results discussed in the previous section. Similarly, the lowest ρBCP values observed for M-3 and M-23 structures corresponding to the longest O∙∙∙O and H∙∙∙O distances and to the shortest O–H bond indicate the weakest interactions. The Laplacian of the electron density at H∙∙∙O BCP, ∇2ρBCP, is positive for all species analyzed which shows that the H∙∙∙O contacts are not typical covalent bonds [57,58]. However, in all cases, the total electron energy density at H∙∙∙O BCP, HBCP, is negative that informs of the partially covalent interaction [14,78,79]. The “most negative” HBCP value is observed for the M-1 structure, while for the M-23 and M-3 structures these values are very close to zero.
The six-member rings closed by intramolecular hydrogen bonds for systems analyzed here are characterized by the existence of ring critical points, RCPs. It was found in early studies that characteristics of RCPs may also be treated as measures of the strength of interaction because they correlate with other geometrical parameters as well as with the characteristics of the corresponding BCP [80,81,82]. The similar situation is observed here (Table S1 in the Supplementary Materials presents characteristics of RCPs for the species discussed). The greatest value of the electron density at RCP, ρRCP, is observed for the M-1 structure; the lowest values for the M-3 and M-23 structures. It is in line with other observations concerning geometrical parameters (Table 1) and characteristics of BCP (Table 2). It is worth mentioning that the linear correlation between the ρBCP value (Table 2) and the corresponding ρRCP value (Table S1) is observed because the squared linear correlation coefficient R2 is equal to 0.947. There are also other linear correlations between corresponding characteristics of BCP and RCP, for example between VBCP and VRCP as well as between GBCP and GRCP.
4.3. Intramolecular Hydrogen Bonds and the Choice of Reference Systems
The main problem connected with the calculation of the energy of intramolecular hydrogen bond concerns the reference system. The conformer of the analyzed system possesses intramolecular hydrogen bonds, while in the reference system this interaction does not occur. The intraHB is usually a stabilizing interaction, thus conformers characterized by the lack of this interaction often possess higher energies, i.e., these energies are “less negative”. Figure 4 presents possible conformers of the malonaldehyde species where intraHBs do not occur that may be treated as reference systems. Similar systems are considered here for all fluorine derivatives of malonaldehyde. Conformation 3 (Figure 4) is most often applied as the reference system; it is formed from the conformer containing intraHBs by the rotation of the O–H hydroxyl group by 180° around the neighboring C–O bond. The question is whether this is the best choice of reference system, because one may expect additional repulsive interactions between oxygen atoms for conformer 3. The similar situation occurs for the HH conformation (Figure 4) where the H∙∙∙H intramolecular contact may disturb the evaluation of the intramolecular hydrogen bond if this conformation is chosen as the reference system.
Table 3 presents the differences in energies between the conformer containing intraHBs and one where such interactions do not exist. The latter conformer is characterized by the same bonds and angles as those in the corresponding conformer containing intraHBs. For example, for malonaldehyde (Scheme 1) being in energetic minimum, the previously described rotation by 180° of the O–H group is performed that leads to conformation 3. The remaining geometrical parameters are not changed in conformer 3, and they are the same as in the malonaldehyde. Similarly, other conformers collected in Figure 3 may be obtained by appropriate rotations and/or changes of dihedral angles in the malonaldehyde species. One may say that these conformers possess geometries of the reference malonaldehyde system. In such a way, one may expect that energies collected in Table 3 concern “pure” intraHB interactions because the other processes accompanying opening or closing of the six-member ring containing intraHBs are not taken into account. However, one can see that energies of interactions collected in Table 3 depend on the reference conformer chosen. The differences between energies for the same system sometimes exceed 6 kcal/mol. For example, for the M-3 structure (fluorine substituent at the carbonyl carbon atom), the interaction energy is equal to −9 kcal/mol for conformer 1 as the reference system, while it is equal to −15.2 kcal/mol for conformer 4 as the reference. Thus, one can see that despite the partly preserved structure of the system containing intraHBs in the conformer chosen as the reference, other effects may take place, such as other intramolecular interactions and various electron charge distributions lead to differences in energies.
Table 4 contains so-called binding energies where all conformers obtained from malonaldehyde and its fluorine derivatives were additionally optimized after the appropriate rotations and changes of dihedral angles. These optimized structures correspond to local energetic minima, because imaginary frequencies are not observed there. One may say that in such a way processes connected with the opening of the ring system are fully taken into account. This situation is similar to the evaluation of the intermolecular hydrogen bond energy, where the binding energy contains the deformation energy term related to changes of geometry of monomers resulting from complexation. In the case of intramolecular hydrogen bonds, the interaction energy may be expressed by the following equation.
The is the energy of the reference and “fictitious” structure because its bonds and angles are the same as in the ZZ corresponding structure characterized by the occurrence of intraHBs. In the case of binding energy (Equation (7)) the energy of the reference structure () that does not contain intraHB was optimized and it corresponds to the local energetic minimum.
is the deformation energy for the intramolecular hydrogen bond, and its value is positive. Table 4 contains binding and deformation energies for different structures considered as references, i.e., structures 1–4 and HH (see Figure 4). One can see that Equation (2) corresponding to one proposal of the estimation of intramolecular hydrogen bond energy [39] is very similar to Equation (6) discussed here. In the latter equation, the reference structure is taken into account, with its “fictitious” geometry while in Equation (2) there are two reference structures with their “fictitious” geometries because the arithmetic mean value of their energies is considered.
The results collected in Table 3 and Table 4 show that both interaction and binding energies (Equations (6) and (7)) strongly depend on the choice of the reference system. For the conformation which is most often chosen in the literature (conformation 3), usually the most “negative” energies are observed; more often it is observed for the binding energy than for the interaction energies. The deformation energy also strongly depends on the reference conformation as well as on the species considered; in the case of systems considered here it depends on the location of the fluorine substituent. This energy ranges from 1.8 kcal/mol to 9.4 kcal/mol. Thus, one can see that the estimation of the intramolecular hydrogen bond energy related to the reference system that does not contain intraHBs is rather problematic. The energies collected in Table 3 and Table 4 simply express the energy differences between chosen conformations. There is no reason to prefer any conformer as the reference system. The interaction or binding energies (Equations (6) and (7)) for related species, such as those considered in this study, correlate sometimes with other measures of the hydrogen bond strength. However, such correlations are not good. For example, the interaction energy calculated for conformation 3 as the reference system correlates poorly with the H∙∙∙O distance and with the electron density at the H∙∙∙O bond critical point. The squared linear correlation coefficient R2 values for these dependencies are equal to 0.8383 and 0.8311, respectively.
4.4. Related Intermolecular Hydrogen Bonds
The complexes with intermolecular hydrogen bonds are calculated here. It is one of the first steps of the new method proposed in this study for the evaluation of the energies of intramolecular O–H∙∙∙O hydrogen bonds. Figure S1 (Supplementary Information) presents species analyzed: the complexes of ethenol, formaldehyde and conformations of malonaldehyde that do not contain intramolecular hydrogen bond. They were chosen because they contain the following arrangement, –C=O∙∙∙H–O–C=C–; similar fragment occurs in malonaldehyde and its fluorine derivatives with the intraHB. These complexes do not contain other meaningful links. In all cases, the hydroxyl and carbonyl groups are the proton donor and the proton acceptor, respectively. The analysis of frequencies show that all fully optimized complexes correspond to energetic minima.
Table S2 presents geometrical parameters of the abovementioned intermolecular O–H∙∙∙O systems. These interactions seem to be weaker than the corresponding intraHBs analyzed in the previous section because they are characterized by the lower elongation of the O–H proton donating bond resulting from the hydrogen bond formation, up to 0.98 Å, than their intramolecular analogues (Table 1). Additionally, the H∙∙∙O and O∙∙∙O distances in these complexes (Figure S1) are slightly longer than in intramolecular hydrogen bonds; the H∙∙∙O distances in the range 1.71–1.86 Å are observed. The O–H∙∙∙O angles are closer to linearity for complexes than for the intraHBs in malonaldehyde and derivatives. However, the strain effects are often responsible for the non-linearity of O–H∙∙∙O bridges in the case of intramolecular hydrogen bonds.
Table S3 confirms the above expectations of the strength of these intermolecular hydrogen bonds: the electron density at the H∙∙∙O BCP (ρBCP) ranges from 0.035 au to 0.045 au, while in the case of intramolecular hydrogen bonds this value ranges from 0.038 au to 0.076 au. The ρBCP value that corresponds to the proton-acceptor contact in hydrogen bonds often correlates with various measures of the strength of interaction [14,37,38], thus one may conclude that the intermolecular hydrogen bonds considered here are weaker than the intramolecular counterparts. However, the HBCP values for the intermolecular interactions are negative, as was also observed for intramolecular hydrogen bonds, thus one may classify these interactions as partly covalent in nature [14,78,79].
Table 5 presents interaction energies for complexes analyzed here; the −EintBSSE value, the energy of interaction corrected for BSSE, reaches 12 kcal/mol in two cases. The interaction energies for all complexes (−EintBSSE values) are greater than the corresponding value for the water dimer linked by O–H∙∙∙O hydrogen bonds that is equal to ~4.5–5 kcal/mol, the latter value depending on the level of calculations [83]. The interactions in water dimers are often classified as medium-strength hydrogen bonds. Table 5 shows that the BSSE correction amounts of 0.2–0.3 kcal/mol for complexes considered here. This table also contains the interaction energies evaluated from the relationship proposed by Espinosa and co-workers (Equation (1)) [37,38]. The latter energies are “more negative” than those calculated from the definition. However, there is a good linear correlation between EintBSSE and Eint (Equation (1)) because R2 = 0.984. Hence, one can conclude that the relationship proposed by Espinosa which is based on experimental results properly evaluates the relationship between strengths of interaction for related species in the sample; here for the sample of complexes linked by similar interactions characterized by the same type arrangements, –C=O∙∙∙H–O–C=C–.
Table 6 shows the results of the decomposition of the energy of interaction (Equation (5)) for complexes discussed here. One can see that for all complexes, the electrostatic interaction energy, ΔEelstat, is the most important attractive term of the total interaction energy; followed by the orbital energy, ΔEorb, and by the dispersion energy, ΔEdisp. It was found in early studies that for hydrogen bonds possessing partly covalent character, the significant contribution of the energy term related to the electron density shifts is observed. This term is approximately 50% at least of the electrostatic contribution for such interactions [84]. The other decomposition scheme was applied in the latter study [84], but the significance of electron charge shifts and related energies for partly covalent interactions is announced from time to time in various studies [85,86,87]. For complexes discussed here where the ADF program decomposition was applied [65,66], the ΔEorb/ΔEelstat ratio ranged from 0.61 to 0.67. The total interaction energy, ΔEint, is presented in Table 6. The latter energy was calculated within the decomposition scheme (Equation (5)) with the application of another level of theory from that one applied for energies presented in Table 5. However, there is an excellent linear correlation between ΔEint and EintBSSE because R2 = 0.996.
4.5. The New Method of the Evaluation of the Intramolecular Hydrogen Bond Energy—Estimations Based on Relationships for Intermolecular Interactions
The function-based approaches, FBAs [49], were mentioned earlier here. An FBA may be shortly described as the application of the relationship between parameters found for any sample of species for the evaluation of parameters in another sample that cannot be determined there directly. This type of algorithm is applied here to determine the energies of intramolecular hydrogen bonds. For example, for the sample of complexes linked by the O–H∙∙∙O intermolecular hydrogen bonds that was analyzed in the previous section, numerous relationships between the energy of interaction and other parameters may be found. The linear relationship between the electron density at the H∙∙∙O BCP, and the EintBSSE energy may be mentioned (Equation (9)).
EintBSSE (EHB*) = −407.43 ρBCP + 6.4164 (R2 = 0.984)
The above relationship is based on intermolecular hydrogen bonds in complexes (Figure S1) that are related to the malonaldehyde and its derivatives thus it may be used to estimate the intramolecular hydrogen bond energies analyzed here. The ρBCP values for the H∙∙∙O contacts of intramolecular interactions may be used to calculate their energies with the use of Equation (9). These energies designated as EHB* are presented in Table 7. These energies reflect the properties of fluorine substituents, the strongest hydrogen bond (the “most negative” EHB*) is observed for the M-1 structure, where EHB* = −24.4 kcal/mol. The weakest interactions are observed for M-3 and M-23 structures where EHB* is equal to −9.1 kcal/mol and −7.6 kcal/mol, respectively. For the sample of malonaldehyde and derivatives, the EHB* energy correlates with energy calculated from Equation (6); if conformation 3 is taken into account as the reference and the squared linear correlation coefficient, R2, for relationship between EHB* and EHB (Equation (6)) is equal to 0.956; this is an acceptable value for linear correlation. However, for other reference conformers the R2 value is much lower; for example, it is equal to ~0.4 for the HH conformation (with the H∙∙∙H contact, see Figure 4). The problems connected with the choice of reference system were discussed before here.
Table 7 presents the interaction energies calculated with the use of other approaches that were mentioned earlier here. For example, the R2 value for the linear regression between EHB* and EHB (Equation (2)) values is equal to 0.683; it was mentioned earlier here that the hydrogen bond energy calculated from Equation (2) is related to the mean energy of two conformers. The situation for all other approaches of Table 7 is much better. For example, there is an excellent correlation between EHB* and EHB (Equation (1)) where R2 = 0.999; this relationship is presented in Figure S2 (Supplementary Materials) and indicates that the interaction energies calculated from a very simple relationship of Equation (1) give meaningful results and that Equation (1) may be applied to evaluate the strength of interaction, at least roughly.
It is worth mentioning that all energies, estimated with the use of various approaches and presented in Table 7, correlate between themselves very well, except for the EHB (Equation (2)) approach discussed above. It even concerns the EHB (Equation (4)) energies, despite the fact that they differ significantly from energies calculated with the use of other approaches. It means that the EHB (Equation (4)) approach gives results probably being far from “the real values”, but within the sample of the analyzed hydrogen bonds these values are useful to compare these interactions between themselves. One can make more general conclusions that the estimations of intraHB energies based on reference conformations are rather problematic, while the estimations based on local parameters such as ρBCP, VBCP, or the H∙∙∙O distance may give more reliable results because they concern local interactions directly related to the hydrogen bond.
The way to evaluate the energy of the intramolecular hydrogen bond is proposed here; it concerns EHB* values. The relationship based on the electron density at BCP, ρBCP, that was found for intermolecular interactions, was applied (Equation (9)). However, relationships between energy and other parameters, for example H∙∙∙O or O∙∙∙O distances for the sample of related intermolecular hydrogen bonds may be used. The ρBCP parameter was used here as an example because it is usually accepted in other studies as a good descriptor of the strength of the hydrogen bond. Figure 5 presents an excellent linear correlation between ρBCP and the hydrogen bond energy, where both intermolecular and intramolecular hydrogen bonds were taken into account. For intermolecular interactions, the EintBSSE energies (Table 5) are presented, while for intramolecular interactions, the EHB* (Table 7) energies are shown. The relationship in Figure 5 may be treated as its “artificial improvement” because the intermolecular interactions expressed by Equation (9) as well as the intramolecular hydrogen bonds determined exactly by this equation are considered together.
4.6. The Function-Based Decomposition of the Intramolecular Hydrogen Bond Energy
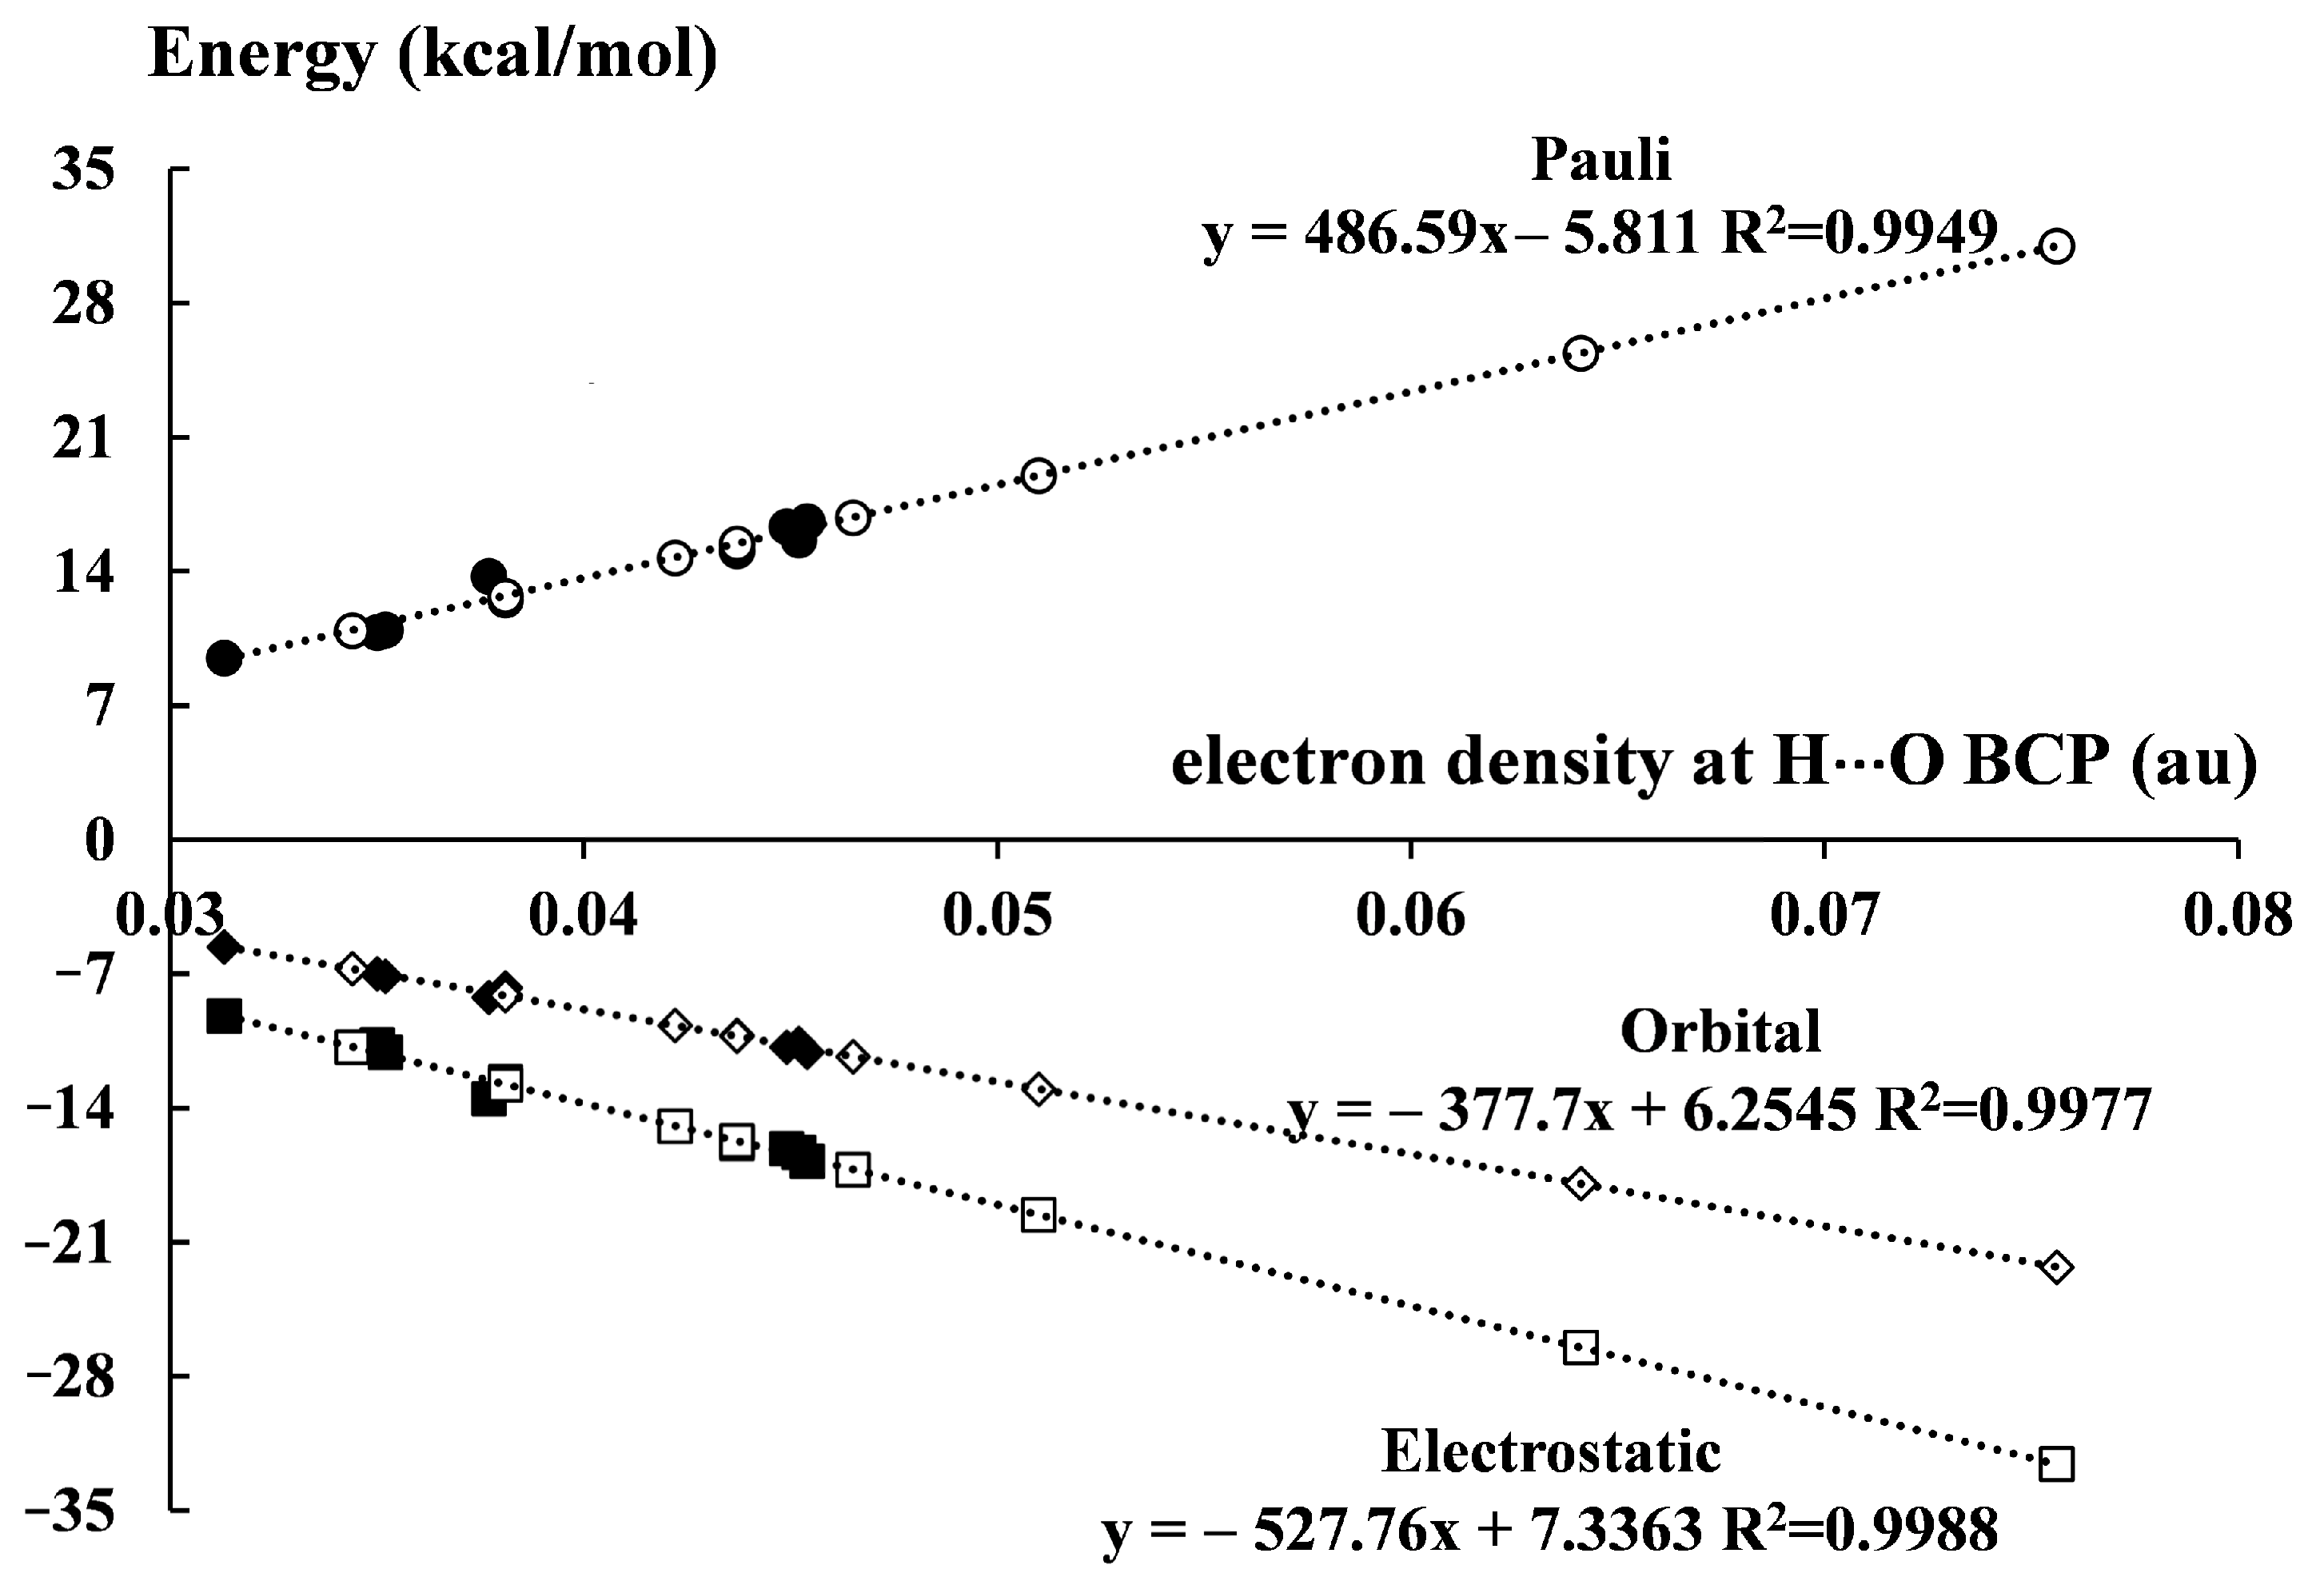
The proposal of the decomposition of the energy of intramolecular hydrogen bonds is presented in this section. The function-based approach is applied to evaluate the interaction energy terms within the decomposition scheme described briefly earlier (Equation (5)). These evaluations are carried out similarly, as was performed for EHB* energies which were estimated from Equation (9). For the decomposition of intraHBs, the following workflow may be described. Firstly, for the intermolecular O–H∙∙∙O hydrogen bonds of complexes (Figure S1), linear correlations were found between the electron density of H∙∙∙O BCP (Table S3) and the interaction energy terms (Table 6). These relationships are presented below (Equation (10)).
ΔEPauli = 486.59 ρBCP − 5.8112 (R2 = 0.9564)
ΔEelstat = −527.76 ρBCP − 7.3363 (R2 = 0.9801)
ΔEorb = −377.7 ρBCP − 6.2543 (R2 = 0.9896)
ΔEdisp = −34.027 ρBCP − 0.2344 (R2 = 0.2695)
ΔEelstat = −527.76 ρBCP − 7.3363 (R2 = 0.9801)
ΔEorb = −377.7 ρBCP − 6.2543 (R2 = 0.9896)
ΔEdisp = −34.027 ρBCP − 0.2344 (R2 = 0.2695)
The above equations (Equation (10)) are next applied to evaluate the interaction energy terms for malonaldehyde and its derivatives (Table 8), from the corresponding H∙∙∙O ρBCP (Table 2); except for the dispersion term, ΔEdisp, where there is no correlation. In the latter case, the mean ΔEdisp value for intermolecular interactions is taken into account, i.e., −1.6 kcal/mol.
Table 8 shows the results of such “function-based energy decomposition analysis”, FB-EDA. These results are in line with those concerning intermolecular hydrogen bonds (Table 6) because similar tendencies are observed here. The Pauli repulsion term (ΔEPauli) is approximately balanced by the electrostatic energy contribution (ΔEelstat) thus one may say that the orbital interaction energy (ΔEorb) related to the electron charge shifts is responsible for the stabilization of both types of systems, complexes and the malonaldehyde and its derivatives. The ΔEorb/ΔEelstat ratio for intraHBs ranges from 0.62 to 0.68, similarly as for intermolecular interactions discussed earlier here where the range between 0.61 and 0.67 was observed. Table 8 contains the total interaction energy (ΔEint) that can be equated with the hydrogen bond energy. It is the approximate evaluation, because the constant term of −1.6 kcal/mol related to the dispersion energy (ΔEdisp) is included in ΔEint. However, for the linear relationships ΔEint vs. EHB* and ΔEint vs. EHB (Equation (1)), R2 =1. The good linear correlations between ΔEint and the interaction energies determined from other approaches (Table 7) are also observed, except for the EHB (Equation (2)) approach.
Figure 6 presents linear correlations between the electron density at H∙∙∙O BCP, ρBCP, and interaction energy terms (only ΔEdisp is excluded) for inter- and intramolecular hydrogen bonds. The ρBCP values are those from QTAIM analyses, while the interaction energy terms come from energy decomposition analysis, EDA (Equation (5)), and FB-EDA, respectively. These correlations are “artificial improvements” because the additional intraHBs (white circles) determined from Equation (10) are added to the intermolecular interactions (black circles) that are described by the same equations. However, one of the goals of the analysis performed here concerns dependencies between energy terms and dependencies between inter- and intramolecular hydrogen bonds. Particularly such dependencies are visualized by the relationships of Figure 5 and Figure 6.
5. Conclusions
The method to evaluate the energy of intramolecular hydrogen bond has been proposed; it may be described as the use of relationships known for related intermolecular hydrogen bonds that are applied to the intramolecular interactions where such energy cannot be calculated directly; this procedure may be classified as the function-based approach (FBA) [49].
One may indicate the following steps of this approach:
- -
- the choice of the sample of systems with intramolecular hydrogen bonds that are to be analyzed, and the performing calculations for the species of this sample;
- -
- the choice of the sample of complexes linked by intermolecular hydrogen bonds and the performing calculations for them, it is important that these complexes are characterized by the same arrangements as those occurring for intramolecular hydrogen bonds;
- -
- the application of the relationships between the hydrogen bond energy and other parameters found for the sample of complexes to evaluate the energies of intramolecular hydrogen bonds.
It was found that energies estimated in such a way are in agreement with energies calculated from other approaches that are often applied in various studies. It is interesting that the simple relationship for O–H∙∙∙O hydrogen bonds proposed by Espinosa and co-workers [37,38] (Equation (1)) gives reasonable results of the hydrogen bond energies. Thus, because of its simplicity, this method may be applied to at least roughly estimate the strength of intramolecular hydrogen bonds. The energy expressed by Equation (1) concerns the local intramolecular hydrogen bond interaction. It may mean that the new approach applied here correctly describes such local interaction and it is “free” of other effects and local interactions. The latter are not reduced sufficiently if the methods of the evaluation of the intramolecular hydrogen bond that are based on the comparison of various conformations are applied. Hence, the latter methods are not recommended; at least, the results discussed here do not support an application of them.
The other methods that give results being in agreement with the new method described here concern specific interactions, for example the relationship expressed by Equation (1) concerns only O–H∙∙∙O hydrogen bonds. It seems that the new method may be applied to any sample of related intramolecular hydrogen bonds, because only the requirement of the choice of similar intermolecular interactions has to be fulfilled.
The method to perform the decomposition of the energy of intramolecular hydrogen bonds is also proposed here. It is named as the function-based energy decomposition analysis, FB-EDA. The steps of this approach are the same as in the new method described above. They are based on the discovery of relationships concerning the interaction energy terms for the simple intermolecular hydrogen bonds and further the application of these relationships for intramolecular hydrogen bonds. It seems this approach produces reasonable results, especially if the functions applied for such decomposition are based on properly chosen related systems containing intermolecular hydrogen bonds.
Supplementary Materials
The following are available online at https://0-www-mdpi-com.brum.beds.ac.uk/2073-4352/11/1/5/s1, Figure S1: Complexes linked by the intermolecular O-H∙∙∙O hydrogen bonds; Figure S2: The linear relationship between the EHB* and EHB (Equation (1)) energies (see caption of Table 7); Table S1: QTAIM parameters, characteristics of the RCP (in au) for malonaldehyde and its fluoro derivatives (designations as in Table 1); ρRCP—electron density at RCP, ∇2ρRCP—Laplacian of electron density, HRCP—total electron energy density at RCP, and its potential and kinetic components, VRCP and GRCP, respectively; Table S2: Geometrical parameters of intermolecular O-H∙∙∙O hydrogen bonds (Å, degrees), numeration of complexes corresponds to that one of Figure S1; Table S3: QTAIM parameters, characteristics of the H∙∙∙O BCP (in au) for complexes considered here; ρBCP—electron density at H∙∙∙O BCP, ∇2ρBCP—Laplacian of electron density, HBCP—total electron energy density at H∙∙∙O BCP, and its potential and kinetic components, VBCP and GBCP, respectively. The numeration of complexes follows Figure S1.
Funding
This research was funded by the Spanish Government MINECO/FEDER, grant number PID2019-109555GB-I00 and Eusko Jaurlaritza, grant number IT-1254-19.
Acknowledgments
Technical and human support provided by Informatikako Zerbitzu Orokora—Servicio General de Informática de la Universidad del País Vasco (SGI/IZO-SGIker UPV/EHU), Ministerio de Ciencia e Innovación (MICINN), European Social Fund (ESF) is gratefully acknowledged.
Conflicts of Interest
The author declares no conflict of interest. The funders had no role in the design of the study; in the collection, analyses, or interpretation of data; in the writing of the manuscript, or in the decision to publish the results.
References
- Jeffrey, G.A.; Saenger, W. Hydrogen Bonding in Biological Structures; Springer: Berlin, Germany, 1991. [Google Scholar]
- Jeffrey, G.A. An Introduction to Hydrogen Bonding; Oxford University Press: New York, NY, USA, 1997. [Google Scholar]
- Sidgwick, N.V.; Callow, R.K. Abnormal Benzene Derivatives. J. Chem. Soc. 1924, 125, 527–538. [Google Scholar] [CrossRef]
- Etter, M.C. Encoding and Decoding Hydrogen-Bond Patterns of Organic Compounds. Acc. Chem. Res. 1990, 23, 120–126. [Google Scholar] [CrossRef]
- Buemi, G. Ab initio study of 2,4-dihalosubstituted malonaldehyde and 2-halo-phenols in gas phase and solution. Chem. Phys. 2002, 277, 241–256. [Google Scholar] [CrossRef]
- Buemi, G. Basis set effects on the energy of intramolecular O-H∙∙∙halogen hydrogen bridges in ortho-halophenols and 2,4-dihalo-malonaldehyde. Chem. Phys. 2004, 300, 107–117. [Google Scholar] [CrossRef]
- Etter, M.C.; MacDonald, J.C.; Bernstein, J. Graph-set analysis of hydrogen-bond patterns in organic crystals. Acta Cryst. 1990, B46, 256–262. [Google Scholar] [CrossRef]
- Bernstein, J.; Davis, R.E.; Shimoni, L.; Cheng, N.-L. Patterns in Hydrogen Bonding: Functionality and Graph Set Analysis in Crystals. Angew. Chem. Int. Ed. 1995, 34, 1555–1573. [Google Scholar] [CrossRef]
- Gilli, G.; Bellucci, F.; Ferretti, V.; Bertolasi, V. Evidence for Resonance-Assisted Hydrogen Bonding from Crystal-Structure Correlations on the Enol Form of the β-Diketone Fragment. J. Am. Chem. Soc. 1989, 111, 1023–1028. [Google Scholar] [CrossRef]
- Bertolasi, V.; Gilli, P.; Ferretti, V.; Gilli, G. Evidence for Resonance-Assisted Hydrogen Bonding. 2. Intercorrelation between Crystal Structure and Spectroscopic Parameters in Eight Intramolecularly Hydrogen Bonded 1,3-Diaryl-1,3-propanedione Enols. J. Am. Chem. Soc. 1991, 113, 4917–4925. [Google Scholar] [CrossRef]
- Cuma, M.; Scheiner, S.; Kar, T. Effect of adjoining aromatic ring upon excited state proton transfer, o-hydroxybenzaldehyde. J. Mol. Struct. (Theochem) 1999, 467, 37–49. [Google Scholar] [CrossRef]
- Korth, H.G.; de Heer, M.I.; Mulder, P. A DFT Study on Intramolecular Hydrogen Bonding in 2-Substituted Phenols: Conformations, Enthalpies, and Correlation with Solute Parameters. J. Phys. Chem. A 2002, 106, 8779–8789. [Google Scholar] [CrossRef]
- Woodford, J.N. Density Functional Theory and Atoms-in-Molecules Investigation of Intramolecular Hydrogen Bonding in Derivatives of Malonaldehyde and Implications for Resonance-Assisted Hydrogen Bonding. J. Phys. Chem. A 2007, 111, 8519–8530. [Google Scholar] [CrossRef] [PubMed]
- Grabowski, S.J. What is the Covalency of Hydrogen Bonding? Chem. Rev. 2011, 11, 2597–2625. [Google Scholar] [CrossRef]
- Alkorta, I.; Elguero, J.; Mó, O.; Yañez, M.; Del Bene, J.E. Do coupling constants and chemical shifts provide evidence for the existence of resonance-assisted hydrogen bonds? Mol. Phys. 2004, 102, 2563–2574. [Google Scholar] [CrossRef]
- Alkorta, I.; Elguero, J.; Mó, O.; Yañez, M.; Del Bene, J.E. Are resonance-assisted hydrogen bonds ´resonance assisted´? A theoretical NMR study. Chem. Phys. Lett. 2005, 411, 411–415. [Google Scholar] [CrossRef]
- Góra, R.W.; Maj, M.; Grabowski, S.J. Resonance-assisted hydrogen bonds revisited. Resonance stabilization vs. charge delocalization. Phys. Chem. Chem. Phys. 2013, 15, 2514–2522. [Google Scholar] [CrossRef]
- Guevara-Vela, J.M.; Romero-Montalvo, E.; Costales, A.; Pendás, A.M.; Rocha-Rinza, T. The nature of resonance-assisted hydrogen bonds: A quantum chemical topology perspective. Phys. Chem. Chem. Phys. 2016, 18, 26383–26390. [Google Scholar] [CrossRef] [Green Version]
- Kopylovich, M.N.; Mahmudov, K.T.; Mizar, A.; Pombeiro, A.J.L. Hydrogen bond assisted activation of a dinitrile towards nucleophilic attack. Chem. Commun. 2011, 47, 7248–7250. [Google Scholar] [CrossRef]
- Su, X.; Lõkov, M.; Kütt, A.; Leito, I.; Aprahamian, I. Unusual para-substituent effects on the intramolecular hydrogen-bond in hydrazone-based switches. Chem. Commun. 2012, 48, 10490–10492. [Google Scholar] [CrossRef]
- Goswami, S.; Manna, A.; Paul, S.; Das, A.K.; Aich, K.; Nandi, P.K. Resonance-assisted hydrogen bonding induced nucleophilic addition to hamper ESIPT: Ratiometric detection of cyanide in aqueous media. Chem. Commun. 2013, 49, 2912–2914. [Google Scholar] [CrossRef]
- Zhang, J.; Guo, W. A new fluorescent probe for gasotransmitter H2S: High sensitivity, excellent selectivity, and a significant luorescence off–on response. Chem. Commun. 2014, 50, 4214–4217. [Google Scholar] [CrossRef]
- Mahmudov, K.T.; Pombeiro, A.J.L. Resonance-Assisted Hydrogen Bonding as Driving Force in Synthesis and a Synthon in the Design of Materials. Chem. Eur. J. 2016, 22, 16356–16398. [Google Scholar] [CrossRef] [PubMed]
- Chan, B.; Del Bene, J.E. What factors determine whether a proton-bound homodimer has a symmetric or an asymmetric hydrogen bond? Mol. Phys. 2009, 107, 1095–1105. [Google Scholar] [CrossRef]
- Madsen, G.K.H.; Iversen, B.B.; Larsen, F.K.; Kapon, M.; Reisner, G.M.; Herbstein, F.-H. Topological Analysis of the Charge Density in Short Intramolecular O-H∙∙∙O Hydrogen Bonds. Very Low Temperature X-ray and Neutron Diffraction Study of Benzoylacetone. J. Am. Chem. Soc. 1998, 120, 10040–10045. [Google Scholar] [CrossRef]
- Madsen, G.K.H.; McIntyre, G.J.; Schiøtt, B.; Larsen, F.K. The Low-Barrier Hydrogen Bond of Deuterated Benzoylacetone Probed by Very Low Temperature Neutron and X-ray Diffraction Studies and Theoretical Calculations. Chem. Eur. J. 2007, 13, 5539–5547. [Google Scholar] [CrossRef] [PubMed]
- Cleland, W.W. Low-Barrier Hydrogen Bonds and Low Fractionation Factor Bases in Enzymatic Reactions. Biochemistry 1992, 31, 317–319. [Google Scholar] [CrossRef] [PubMed]
- Perrin, C.L.; Nielson, J.B. “Strong” Hydrogen Bonds in Chemistry and Biology. Annu. Rev. Phys. Chem. 1997, 48, 511–544. [Google Scholar] [CrossRef] [PubMed]
- Hosur, M.V.; Chitra, R.; Hegde, S.; Choudhury, R.R.; Das, A.; Hosur, R.V. Low-barrier hydrogen bonds in proteins. Crystallogr. Rev. 2013, 19, 3–50. [Google Scholar] [CrossRef]
- Alder, R.W. Strain effects on amine basicities. Chem. Rev. 1989, 89, 1215–1223. [Google Scholar] [CrossRef]
- Staab, H.A.; Saupe, T. “Proton sponges” and the geometry of hydrogen bonds: Aromatic nitrogen bases with exceptional basicities. Angew. Chem. Int. Ed. Engl. 1988, 27, 865–879. [Google Scholar] [CrossRef]
- López, C.; Lorente, P.; Claramunt, R.M.; Marín, J.; Foces-Foces, C.; Llamas-Saiz, A.L.; Elguero, J.; Limbach, H.-H. Localization of hydrogen bond deuterons in proton sponges by dipolar solid state 15N NMR spectroscopy. Ber. Bunsenges. Phys. Chem. 1998, 102, 414–418. [Google Scholar] [CrossRef]
- Tupikina, E.Y.; Sigalov, M.; Shenderovich, I.G.; Mulloyarova, V.V.; Denisov, G.S.; Tolstoy, P.M. Correlations of NHN hydrogen bond energy with geometry and 1H NMR chemical shift difference of NH protons for aniline complexes. J. Chem. Phys. 2019, 150, 114305. [Google Scholar] [CrossRef] [PubMed]
- Jabłoński, M. A Critical Overview of Current Theoretical Methods of Estimating the Energy of Intramolecular Interactions. Molecules 2020, 25, 5512. [Google Scholar] [CrossRef] [PubMed]
- Luth, K.; Scheiner, S. Excited-state energetics and proton-transfer barriers in malonaldehyde. J. Phys. Chem. 1994, 98, 3582–3587. [Google Scholar] [CrossRef]
- Latajka, Z.; Scheiner, S. Proton transfer in the ground and first excited triplet states of malonaldehyde. J. Phys. Chem. 1992, 96, 9764–9767. [Google Scholar] [CrossRef]
- Espinosa, E.; Molins, E.; Lecomte, C. Hydrogen bond strengths revealed by topological analyses of experimentally observed electron densities. Chem. Phys. Lett. 1998, 285, 170–173. [Google Scholar] [CrossRef]
- Espinosa, E.; Molins, E. Retrieving interaction potentials from the topology of the electron density distribution: The case of hydrogen bonds. J. Chem. Phys. 2000, 113, 5686–5694. [Google Scholar] [CrossRef]
- Jabłoński, M.; Kaczmarek, A.; Sadlej, A. Estimates of the energy of intramolecular hydrogen bonds. J. Phys. Chem. A 2006, 110, 10890–10898. [Google Scholar] [CrossRef]
- Musin, R.N.; Mariam, Y.H. An integrated approach to the study of intramolecular hydrogen bonds in malonaldehyde enol derivatives and naphthazarin: Trend in energetic versus geometrical consequences. J. Phys. Org. Chem. 2006, 19, 425–444. [Google Scholar] [CrossRef]
- Gilli, G.; Gilli, P. The Nature of the Hydrogen Bond; Oxford University Press: Oxford, UK, 2009; pp. 75–81. [Google Scholar]
- Babu, K.; Gadre, S.R.; Ghermani, N.E. Tailoring approach for exploring electron densities and electrostatic potentials of molecular crystals. Theor. Chem. Acc. 2004, 111, 255–263. [Google Scholar] [CrossRef]
- Ganesh, V.; Dongare, R.K.; Balanarayan, P.; Gadre, S.R. Molecular tailoring approach for geometry optimization of large molecules: Energy evaluation and parallelization strategies. J. Chem. Phys. 2006, 125, 104109. [Google Scholar] [CrossRef]
- Rusinska-Roszak, D.; Sowinski, G. Estimation of the Intramolecular O–H···O=C Hydrogen Bond Energy via the Molecular Tailoring Approach. Part I: Aliphatic Structures. J. Chem. Inf. Model. 2014, 54, 1963–1977. [Google Scholar] [CrossRef]
- Rusinska-Roszak, D. Intramolecular O–H···O=C Hydrogen Bond Energy via the Molecular Tailoring Approach to RAHB Structures. J. Phys. Chem. A 2015, 119, 3674–3687. [Google Scholar] [CrossRef]
- Afonin, A.V.; Vashchenko, A.V.; Sigalov, M.V. Estimating the energy of intramolecular hydrogen bonds from 1H NMR and QTAIM calculations. Org. Biomol. Chem. 2016, 14, 11199–11211. [Google Scholar] [CrossRef]
- Afonin, A.V.; Vashchenko, A.V. Benchmark calculations of intramolecular hydrogen bond energy based on molecular tailoring and function-based approaches: Developing hybrid approach. Int. J. Quantum Chem. 2019, 119, e26001. [Google Scholar] [CrossRef]
- Afonin, A.V.; Pavlov, D.V.; Vashchenko, A.V. Case study of 2-vinyloxypyridine: Quantitative assessment of the intramolecular C-H⋯N hydrogen bond energy and its contribution to the one-bond 13C-1H coupling constant. J. Mol. Struct. 2019, 1176, 73–85. [Google Scholar] [CrossRef]
- Afonin, A.V.; Vashchenko, A.V. Quantitative decomposition of resonance-assisted hydrogen bond energy in β-diketones into resonance and hydrogen bonding (π- and σ-) components using molecular tailoring and function-based approaches. J. Comput. Chem. 2020, 41, 1285–1298. [Google Scholar] [CrossRef]
- Nikolaienko, T.Y.; Bulavin, L.A.; Hovorun, D.M. Bridging QTAIM with vibrational spectroscopy: The energy of intramolecular hydrogen bonds in DNA-related biomolecules. Phys. Chem. Chem. Phys. 2012, 14, 7441–7447. [Google Scholar] [CrossRef]
- Brovarets, O.O.; Hovorun, D.M. Intramolecular tautomerization of the quercetin molecule due to the proton transfer: QM computational study. PLoS ONE 2019, 14, e0224762. [Google Scholar] [CrossRef]
- Frisch, M.J.; Trucks, G.W.; Schlegel, H.B.; Scuseria, G.E.; Robb, M.A.; Cheeseman, J.R.; Scalmani, G.; Barone, V.; Mennucci, B.; Petersson, G.A.; et al. Gaussian 16, Revision A.03; Gaussian, Inc.: Wallingford, CT, USA, 2016. [Google Scholar]
- Minenkov, Y.; Singstad, A.; Occhipinti, G.; Jensen, V.R. The accuracy of DFT-optimized geometries of functional transition metal compounds: A validation study of catalysts for olefin metathesis and other reactions in the homogeneous phase. Dalton Trans. 2012, 41, 5526–5541. [Google Scholar] [CrossRef]
- Kendall, R.A.; Dunning, T.H., Jr.; Harrison, R.J. Electron Affinities of the First-Row Atoms Revisited. Systematic Basis Sets and Wave Functions. J. Chem. Phys. 1992, 96, 6796–6806. [Google Scholar] [CrossRef] [Green Version]
- Burns, L.A.; Vázquez-Mayagoitia, A.; Sumpter, B.G.; Sherrill, C.D. Density-functional approaches to noncovalent interactions: A comparison of dispersion corrections (DFT-D), exchange-hole dipole moment (XDM) theory, and specialized functionals. J. Chem. Phys. 2011, 134, 084107. [Google Scholar] [CrossRef] [PubMed]
- Boys, S.F.; Bernardi, F. The calculation of small molecular interactions by the differences of separate total energies. Some procedures with reduced errors. Mol. Phys. 1970, 19, 553–561. [Google Scholar] [CrossRef]
- Bader, R.F.W. Atoms in Molecules, a Quantum Theory; Oxford University Press: Oxford, UK, 1990. [Google Scholar]
- Matta, C.; Boyd, R.J. (Eds.) Quantum Theory of Atoms in Molecules: Recent Progress in Theory and Application; Wiley-VCH: Weinheim, Germany, 2007. [Google Scholar]
- Keith, T.A. AIMAll, version 11.08.23; TK Gristmill Software: Overland Park, KS, USA, 2011. [Google Scholar]
- Becke, A.D. Density-functional exchange-energy approximation with correct asymptotic behavior. Phys. Rev. A 1988, 38, 3098–3100. [Google Scholar] [CrossRef] [PubMed]
- Perdew, J.P. Density-functional approximation for the correlation energy of the inhomogeneous electron gas. Phys. Rev. B 1986, 33, 8822–8824. [Google Scholar] [CrossRef]
- Grimme, S.; Antony, J.; Ehrlich, S.; Krieg, H. A consistent and accurate ab initio parametrization of density functional dispersion correction (DFT-D) for the 94 elements H-Pu. J. Chem. Phys. 2010, 132, 154104. [Google Scholar] [CrossRef] [Green Version]
- Van Lenthe, E.; Baerends, E.J. Optimized Slater-type basis sets for the elements 1-118. J. Comput. Chem. 2003, 24, 1142–1156. [Google Scholar] [CrossRef]
- Ziegler, T.; Rauk, A. CO, CS, N2, PF3, and CNCH3 as σ Donors and π Acceptors. A Theoretical Study by the Hartree-Fock-Slater Transition-State Method. Inorg. Chem. 1979, 18, 1755–1759. [Google Scholar] [CrossRef]
- Velde, G.T.E.; Bickelhaupt, F.M.; Baerends, E.J.; Guerra, C.F.; van Gisbergen, S.J.A.; Snijders, J.G.; Ziegler, T. Chemistry with ADF. J. Comput. Chem. 2001, 22, 931–967. [Google Scholar] [CrossRef]
- ADF2013, SCM; Theoretical Chemistry, Vrije Universiteit: Amsterdam, The Netherlands, 2013; Available online: http://www.scm.com/news/adf2013-modeling-suite-released/ (accessed on 16 September 2014).
- Grabowski, S.J. An estimation of strength of intramolecular hydrogen bonds—Ab initio and AIM studies. J. Mol. Struct. 2001, 562, 137–143. [Google Scholar] [CrossRef]
- Sobczyk, L.; Grabowski, S.J.; Krygowski, T.M. Interrelation between H-Bond and Pi-Electron Delocalization. Chem. Rev. 2005, 105, 3513–3560. [Google Scholar] [CrossRef]
- Groom, C.R.; Bruno, I.J.; Lightfoot, M.P.; Ward, S.C. The Cambridge structural database. Acta Cryst. 2016, B72, 171–179. [Google Scholar] [CrossRef] [PubMed]
- Wong, R.; Allen, F.H.; Willett, P. The scientific impact of the Cambridge Structural Database: A citation-based study. J. Appl. Cryst. 2010, 43, 811–824. [Google Scholar] [CrossRef] [Green Version]
- Luger, P. Modern X-ray Analysis on Single Crystals, 2nd fully revised and extended edition; Walter de Gruyter: Berlin, Germany, 2014. [Google Scholar]
- Grabowski, S.J. Understanding Hydrogen Bonds, Theoretical and Experimental Views; The Royal Society of Chemistry: Cambridge, UK, 2021. [Google Scholar]
- Kawaguchi, K.; Hirota, E. Infrared diode laser study of the hydrogen bifluoride anion: FHF- and FDF-. J. Chem. Phys. 1986, 84, 2953–2960. [Google Scholar] [CrossRef]
- Pylaeva, S.A.; Elgabarty, H.; Sebastiani, D.; Tolstoy, P.M. Symmetry and dynamics of FHF- anion in vacuum, in CD2Cl2 and in CCl4. Ab initio MD study of fluctuating solvent–solute hydrogen and halogen bonds. Phys. Chem. Chem. Phys. 2017, 19, 26107–26120. [Google Scholar] [CrossRef] [PubMed] [Green Version]
- Grabowski, S.J. [FHF]-—The Strongest Hydrogen Bond under the Influence of External Interactions. Crystals 2016, 6, 3. [Google Scholar] [CrossRef] [Green Version]
- Kobayashi, Y.; Katagiri, K.; Azumaya, I.; Harayama, T. Trifluoroacetylation-Induced Houben-Hoesch-Type Cyclization of Cyanoacetanilides: Increased Nucleophilicity of CN Groups. J. Org. Chem. 2010, 75, 2741–2744. [Google Scholar] [CrossRef]
- Basheer, A.; Mishima, M.; Rappoport, Z. Enols of 2-nitro- and related 2-substituted malonamides. J. Phys. Org. Chem. 2010, 23, 255–265. [Google Scholar] [CrossRef]
- Cremer, D.; Kraka, E. A Description of the Chemical Bond in Terms of Local Properties of Electron Density and Energy. Croat. Chem. Acta 1984, 57, 1259–1281. [Google Scholar]
- Jenkins, S.; Morrison, I. The chemical character of the intermolecular bonds of seven phases of ice as revealed by ab initio calculation of electron densities. Chem. Phys. Lett. 2000, 317, 97–102. [Google Scholar] [CrossRef]
- Grabowski, S.J. Properties of a ring critical point as measures of intramolecular H-bond strength. Monatsh. Chem. 2002, 133, 1373–1380. [Google Scholar] [CrossRef]
- Rybarczyk-Pirek, A.J.; Grabowski, S.J.; Małecka, M.; Nawrot-Modranka, J. Crystal and Molecular Structures of New Chromone Derivatives as Empirical Evidence of Intramolecular Proton Transfer Reaction; Ab Initio Studies on Intramolecular H-Bonds in Enaminones. J. Phys. Chem. A 2002, 106, 11956–11962. [Google Scholar] [CrossRef]
- Grabowski, S.J.; Małecka, M. Intramolecular H-bonds: DFT and QTAIM studies on 3-(aminomethylene) pyran-2, 4-dione and its derivatives. J. Phys. Chem. A 2006, 110, 11847–11854. [Google Scholar] [CrossRef] [PubMed]
- Scheiner, S. Hydrogen Bonding; A Theoretical Perspective; Oxford University Press: New York, NY, USA, 1997. [Google Scholar]
- Grabowski, S.J.; Sokalski, W.A.; Dyguda, E.; Leszczynski, J. Quantitative classification of covalent and noncovalent H-bonds. J. Phys. Chem. B 2006, 110, 6444–6446. [Google Scholar] [CrossRef] [PubMed]
- Reed, E.; Curtiss, L.A.; Weinhold, F. Intermolecular interactions from a natural bond orbital, donor-acceptor viewpoint. Chem. Rev. 1988, 88, 899–926. [Google Scholar] [CrossRef]
- Weinhold, F.; Landis, C. Valency and Bonding, a Natural Bond Orbital Donor—Acceptor Perspective; Cambridge University Press: Cambridge, UK, 2005. [Google Scholar]
- Grabowski, S.J. Hydrogen bonds, and σ-hole and π-hole bonds—Mechanisms protecting doublet and octet electron structures. Phys. Chem. Chem. Phys. 2017, 19, 29742–29759. [Google Scholar] [CrossRef]
Scheme 1.
Malonaldehyde—an example of the resonance assisted hydrogen bond (RAHB) system; the numeration of C-atoms—1, 2, 3—is applied later in Tables to show the position of substituents in systems (marked as M-structures).
Scheme 1.
Malonaldehyde—an example of the resonance assisted hydrogen bond (RAHB) system; the numeration of C-atoms—1, 2, 3—is applied later in Tables to show the position of substituents in systems (marked as M-structures).

Figure 1.
The histogram of O∙∙∙O distances (Å), the vertical axis shows the number of entries.

Figure 2.
The relationship between the O∙∙∙O distance (Å) and the O–H∙∙∙O angle (o): the white circles correspond to experimental values taken from the Cambridge Structural Database (CSD); red squares correspond to the theoretical results concerning the malonaldehyde and its fluorine derivatives.
Figure 2.
The relationship between the O∙∙∙O distance (Å) and the O–H∙∙∙O angle (o): the white circles correspond to experimental values taken from the Cambridge Structural Database (CSD); red squares correspond to the theoretical results concerning the malonaldehyde and its fluorine derivatives.

Figure 3.
The fragments of crystal structures of (a) 2-cyano-4,4,5,5,6,6,6-heptafluoro-3-hydroxy-N-methyl-N-phenylhex-2-enamide [76], KAJTOG refcode; and (b) of 3-amino- 3-hydroxy-2-nitroprop-2-enamide [77], NMALAM01 refcode.


Figure 4.
Conformations of malonaldehyde where intramolecular hydrogen bond does not occur, designated by 1, 2, 3 and 4 numbers, as well as by HH that corresponds to a conformation characterized by the H∙∙∙H contact.
Figure 4.
Conformations of malonaldehyde where intramolecular hydrogen bond does not occur, designated by 1, 2, 3 and 4 numbers, as well as by HH that corresponds to a conformation characterized by the H∙∙∙H contact.

Figure 5.
The relationship between the electron density at H…O BCP (au) and the EintBSSE (EHB*) energy (kcal/mol); full circles correspond to intermolecular hydrogen bonds while open circles correspond to intramolecular hydrogen bonds; the energies for former interactions are EintBSSE (Table 5), while intramolecular interaction energies are EHB* values (Table 7).

Figure 6.
The relationship between the electron density at H∙∙∙O BCP (au) and the interaction energy terms described by Equation (5) (kcal/mol), three terms are taken into account (without dispersion term); full circles correspond to intermolecular hydrogen bonds while open circles correspond to intramolecular bonds; the energies for former interactions are those of Table 6 while intramolecular interaction energy terms are those of Table 8.


Table 1.
Malonaldehyde and its fluoro-derivatives; conformations with intramolecular O–H∙∙∙O hydrogen bonds; geometrical parameters of hydrogen bonds (Å, degrees), M with number designates fluoro-derivative of malonaldehyde with F-substituent/s at carbon atom/s, 1—at carbon connected with hydroxyl group, 2—at “middle carbon”, 3—at carbonyl group carbon, see Scheme 1.
| Species | O–H | H…O | O…O | OHO |
|---|---|---|---|---|
| Malonaldehyde | 0.991 | 1.690 | 2.575 | 146.3 |
| M-1 | 1.026 | 1.533 | 2.478 | 150.5 |
| M-2 | 0.984 | 1.754 | 2.619 | 144.5 |
| M-3 | 0.980 | 1.807 | 2.651 | 142.5 |
| M-12 | 1.012 | 1.598 | 2.519 | 148.8 |
| M-13 | 0.991 | 1.724 | 2.596 | 144.6 |
| M-23 | 0.976 | 1.848 | 2.678 | 141.0 |
| M-123 | 0.986 | 1.762 | 2.620 | 143.4 |
Table 2.
Quantum Theory of ‘Atoms in Molecules’ (QTAIM) parameters, characteristics of the H∙∙∙O bond critical point (BCP) (in au) for malonaldehyde and its fluoro-derivatives (designations as in Table 1); ρBCP—electron density at H∙∙∙O BCP, ∇2ρBCP—Laplacian of electron density, HBCP—total electron energy density at H∙∙∙O BCP, and its potential and kinetic components, VBCP and GBCP, respectively.
| Species | ρBCP | ∇2ρBCP | VBCP | GBCP | HBCP |
|---|---|---|---|---|---|
| Malonaldehyde | 0.051 | 0.116 | −0.052 | 0.040 | −0.011 |
| M-1 | 0.076 | 0.103 | −0.085 | 0.055 | −0.029 |
| M-2 | 0.044 | 0.113 | −0.042 | 0.035 | −0.007 |
| M-3 | 0.038 | 0.111 | −0.035 | 0.031 | −0.004 |
| M-12 | 0.064 | 0.110 | −0.069 | 0.048 | −0.021 |
| M-13 | 0.047 | 0.114 | −0.045 | 0.037 | −0.008 |
| M-23 | 0.034 | 0.107 | −0.030 | 0.029 | −0.002 |
| M-123 | 0.042 | 0.113 | −0.040 | 0.034 | −0.006 |
Table 3.
Interaction energies of O–H∙∙∙O hydrogen bonds (kcal/mol); 1, 2, 3, 4 and HH correspond to configurations presented in Figure 4 that are referred systems to calculate energies.
Table 3.
Interaction energies of O–H∙∙∙O hydrogen bonds (kcal/mol); 1, 2, 3, 4 and HH correspond to configurations presented in Figure 4 that are referred systems to calculate energies.
| Species | 1 | 2 | 3 | HH | 4 |
|---|---|---|---|---|---|
| Malonaldehyde | −11.8 | −10.9 | −16.7 | −13.6 | −13.2 |
| M-1 | −22.6 | −18.5 | −21.5 | −20.6 | −18.3 |
| M-2 | −8.7 | −8.9 | −14.0 | −13.3 | −11.9 |
| M-3 | −9.0 | −9.7 | −12.9 | −11.6 | −15.2 |
| M-12 | −18.1 | −15.7 | −18.1 | −19.2 | −15.9 |
| M-13 | −15.0 | −19.9 | −14.0 | −15.1 | −17.3 |
| M-23 | −6.7 | −7.4 | −11.1 | −9.7 | −12.8 |
| M-123 | −12.5 | −15.6 | −12.2 | −12.8 | −14.6 |
Table 5.
Interaction energy (Eint) and this value corrected for basis set superposition error (BSSE) (EintBSSE); the interaction energy evaluated from the relationship of Espinosa is also included, Eint (Equation (1)); values for complexes analyzed here in kcal/mol. The numeration of complexes follows Figure S1.
| Complex | Eint | EintBSSE | Eint (Equation (1)) |
|---|---|---|---|
| 1 | −8.4 | −8.2 | −10.2 |
| 2 | −12.6 | −12.3 | −14.0 |
| 3 | −9.4 | −9.2 | −11.0 |
| 4 | −7.9 | −7.7 | −10.1 |
| 5 | −6.5 | −6.3 | −8.6 |
| 6 | −12.2 | −12.0 | −14.0 |
| 7 | −11.8 | −11.5 | −13.8 |
| 8 | −8.8 | −8.7 | −11.2 |
| 9 | −11.8 | −11.6 | −13.5 |
Table 6.
The energy terms for complexes analyzed here that result from the decomposition of the energy of interaction (in kcal/mol); ΔEPauli—the Pauli repulsion, ΔEelstat—the electrostatic term, ΔEorb—the orbital interaction energy, ΔEdisp—the dispersion interaction energy term, ΔEint—the total interaction energy (Equation (5)). The numeration of complexes follows Figure S1.
| Complex | ΔEPauli | ΔEelstat | ΔEorb | ΔEdisp | ΔEint |
|---|---|---|---|---|---|
| 1 | 10.9 | −11.1 | −7.1 | −1.2 | −8.5 |
| 2 | 16.6 | −16.8 | −11.1 | −2.0 | −13.3 |
| 3 | 13.7 | −13.5 | −8.2 | −2.1 | −10.1 |
| 4 | 10.8 | −10.7 | −7.0 | −1.2 | −8.1 |
| 5 | 9.5 | −9.2 | −5.6 | −1.4 | −6.6 |
| 6 | 15.7 | −16.3 | −10.6 | −1.5 | −12.8 |
| 7 | 16.4 | −16.1 | −10.8 | −2.0 | −12.5 |
| 8 | 12.5 | −12.6 | −7.7 | −1.5 | −9.3 |
| 9 | 15.1 | −15.8 | −10.2 | −1.5 | −12.4 |
Table 7.
The energies (in kcal/mol) of intramolecular hydrogen bonds estimated from various approaches; EHB* is the energy calculated from the linear relationship between ρBCP (Table S3) and EintBSSE (Table 5), for complexes linked by intermolecular O–H∙∙∙O hydrogen bonds (Equation (9)). EHB** is the interaction energy calculated from one of relationships of Espinosa [37], EHB** = 6111.11exp(−3.6 r); r is the H∙∙∙O distance in O–H∙∙∙O hydrogen bonds.
| Species | EHB* | EHB (Equation (1)) | EHB** | EHB (Equation (3)) | EHB (Equation (4)) | EHB (Equation (2)) |
|---|---|---|---|---|---|---|
| Malonaldehyde | −14.4 | −16.2 | −13.9 | −13.7 | −4.8 | −11.4 |
| M-1 | −24.4 | −26.5 | −24.5 | −20.5 | −9.0 | −20.6 |
| M-2 | −11.4 | −13.1 | −11.1 | −11.4 | −3.6 | −8.8 |
| M-3 | −9.1 | −10.9 | −9.1 | −10.0 | −2.9 | −9.4 |
| M-12 | −19.7 | −21.5 | −19.4 | −17.3 | −6.9 | −16.9 |
| M-13 | −12.5 | −14.2 | −12.3 | −12.6 | −4.1 | −17.5 |
| M-23 | −7.6 | −9.4 | −7.9 | −9.0 | −2.4 | −7.0 |
| M-123 | −10.8 | −12.5 | −10.7 | −11.4 | −3.5 | −14.0 |
Table 8.
The interaction energy terms for species with intramolecular hydrogen bonds analyzed here (in kcal/mol); ΔEPauli—the Pauli repulsion, ΔEelstat—the electrostatic term, ΔEorb—the orbital interaction energy, ΔEdisp—the dispersion interaction energy term (assumed to be equal to −1.6 kcal/mol for all systems), ΔEint—the total interaction energy.
| Species | ΔEPauli | ΔEelstat | ΔEorb | ΔEint − ΔEdisp | ΔEint |
|---|---|---|---|---|---|
| Malonaldehyde | 19.0 | −19.6 | −13.0 | −13.6 | −15.2 |
| M-1 | 31.0 | −32.6 | −22.3 | −23.9 | −25.5 |
| M-2 | 15.5 | −15.7 | −10.3 | −10.5 | −12.1 |
| M-3 | 12.7 | −12.8 | −8.1 | −8.2 | −9.8 |
| M-12 | 25.4 | −26.5 | −18.0 | −19.1 | −20.7 |
| M-13 | 16.8 | −17.2 | −11.3 | −11.7 | −13.3 |
| M-23 | 10.9 | −10.8 | −6.7 | −6.6 | −8.2 |
| M-123 | 14.7 | −4.9 | −9.7 | −9.9 | −11.5 |
Table 4.
Binding energies and deformation energies (in parentheses) of O–H∙∙∙O hydrogen bonds (both in kcal/mol); 1, 2, 3, 4 and HH correspond to configurations presented in Figure 4 that are referred systems to calculate energies.
Table 4.
Binding energies and deformation energies (in parentheses) of O–H∙∙∙O hydrogen bonds (both in kcal/mol); 1, 2, 3, 4 and HH correspond to configurations presented in Figure 4 that are referred systems to calculate energies.
| Species | 1 | 2 | 3 | HH | 4 |
|---|---|---|---|---|---|
| Malonaldehyde | −9.1 (2.8) | −8.2 (2.8) | −12.8 (3.8) | −9.7 (4.0) | −10.1 (3.1) |
| M-1 | −14.1 (8.5) | −12.2 (6.3) | −14.1 (7.3) | −12.5 (8.1) | −12.1 (6.2) |
| M-2 | −6.4 (2.3) | −6.5 (2.3) | −10.8 (3.2) | −9.8 (3.5) | −9.4 (2.5) |
| M-3 | −6.9 (2.1) | −7.2 (2.5) | −10.2 (2.7) | −4.5 (7.0) | −10.6 (4.6) |
| M-12 | −11.9 (6.2) | −11.0 (4.7) | −12.4 (5.7) | −12.4 (6.8) | −11.3 (4.6) |
| M-13 | −10.5 (4.6) | −11.1 (8.8) | −10.5 (3.5) | −5.7 (9.4) | −11.1 (6.2) |
| M-23 | −4.9 (1.8) | −4.9 (2.5) | −9.0 (2.1) | −4.1 (5.6) | −9.0 (3.8) |
| M-123 | −9.1 (3.4) | −9.3 (6.3) | −9.5 (2.7) | −5.2 (7.6) | −9.7 (4.9) |
Publisher’s Note: MDPI stays neutral with regard to jurisdictional claims in published maps and institutional affiliations. |
© 2020 by the author. Licensee MDPI, Basel, Switzerland. This article is an open access article distributed under the terms and conditions of the Creative Commons Attribution (CC BY) license (http://creativecommons.org/licenses/by/4.0/).
Share and Cite
MDPI and ACS Style
Grabowski, S.J. Intramolecular Hydrogen Bond Energy and Its Decomposition—O–H∙∙∙O Interactions. Crystals 2021, 11, 5. https://0-doi-org.brum.beds.ac.uk/10.3390/cryst11010005
AMA Style
Grabowski SJ. Intramolecular Hydrogen Bond Energy and Its Decomposition—O–H∙∙∙O Interactions. Crystals. 2021; 11(1):5. https://0-doi-org.brum.beds.ac.uk/10.3390/cryst11010005
Chicago/Turabian StyleGrabowski, Sławomir J. 2021. "Intramolecular Hydrogen Bond Energy and Its Decomposition—O–H∙∙∙O Interactions" Crystals 11, no. 1: 5. https://0-doi-org.brum.beds.ac.uk/10.3390/cryst11010005
Note that from the first issue of 2016, this journal uses article numbers instead of page numbers. See further details here.