Article

Acoustic Emission Study on the Damage Evolution of a Corroded Reinforced Concrete Column under Axial Loads

1
POWERCHINA Huadong Engineering Corporation Limited, Hangzhou 310034, China
2
School of Qilu Transportation, Shandong University, Jinan 250002, China
3
College of Civil Engineering and Architecture, Zhejiang University, Hangzhou 310027, China
4
College of Civil Engineering and Architecture, Zhejiang University of Technology, Hangzhou 310034, China
*
Author to whom correspondence should be addressed.
Submission received: 30 December 2020 / Revised: 11 January 2021 / Accepted: 12 January 2021 / Published: 15 January 2021
(This article belongs to the Special Issue Advances in Sustainable Concrete System)

Abstract

:
In this paper, the damage of a reinforced concrete (RC) column with various levels of reinforcement corrosion under axial loads is characterized using the acoustic emission (AE) technique. Based on the AE rate process theory, a modified damage evolution equation of RC associated with the axial load and different corrosion rates is proposed. The experimental results show that the measured AE signal parameters during the loading process are closely related to the damage evolution of the RC column as well as the reinforcement corrosion level. The proposed modified damage evolution equation enables dynamic analysis for the damage of corrosion on a RC column under axial loading for a further real-time quantitative evaluation of corrosion damage on reinforced concrete.

1. Introduction

The safety and durability of reinforced concrete (RC) structures during their service lifetime are mainly dependent on reinforcement corrosion, which can lead to concrete cracking [1,2,3]. Such corrosion-induced cracking will harm the internal concrete structure, resulting in a decline in the service life of the concrete [4,5]. Hence, developing a convenient and precise evaluation method for the corrosion of RC structures has become an urgent problem to be solved [6,7].
Acoustic emission (AE) refers to the phenomenon of elastic waves released during material fracture [8,9,10]. The AE method can capture the generation process of microcracks inside the concrete structure dynamically and in real time [11,12]. It can also detect the internal damage of a concrete structure and provide early warning. Thus, the AE rate process theory has been widely used to quantitatively investigate the internal damage evolution of concrete materials.
Thus far, many efforts have been made to investigate the characteristics of AE parameters during the loading process of concrete [13,14,15]. Ohtsu et al. [16] proposed the AE rate theory to evaluate the compressive strength of actual concrete structures and the process of steel corrosion with the moment tensor theory [17]. Suzuki et al. [18] took samples from an existing bridge structure and performed AE monitoring in the uniaxial compression process. They noted that the variation of damage was consistent with that of the compressive strength. Suzuki et al. [19] also studied the uniaxial compression process of concrete samples, which were taken from a canal wall, by applying the AE monitoring method. Based on the AE rate process theory and the damage mechanism, they put forward the implementation steps to determine the relative damage and further evaluate the damage to the samples. Zhou et al. [20] nondestructively obtained the elastic modulus and initial material damage by combining the AE rate process theory and the basic damage mechanics theory. In order to achieve a real-time quantitative assessment of steel strand damage, Deng et al. [21] assumed the number of AE events and stress levels of steel strands in a mathematical model and established the AE probability density function and damage evolution model for steel strands, enabling the real-time monitoring of the tensile damage of steel strands by AE technology [22].
This research conducted axial load experiments of RC columns with 0%, 5%, 10% and 15% corrosion rates. The corrosion rate and AE parameters were introduced to the AE rate process theory as the damage characteristic parameters of reinforced concrete. Then, a modified damage evolution model of a corroded RC column was proposed. This model provides real-time monitoring of the damage of corroded RC and quantitatively evaluates the damage degree from corrosion.

2. Damage Model

The AE phenomenon can reflect the damage and deterioration of a concrete structure under loading [23]. In the literature [24], the AE rate process theory was introduced into the mathematical model for concrete under uniaxial compression. When the load level increases from V to V + dV, the probability density function f(V) of the AE event can be expressed as follows:
f ( V ) d V = d N / N
where N is the total number of AE events with the load level V increasing from the initial state.
In Ohtsu’s model [16], f(V) can be used to represent the AE rate and is approximately expressed by hyperbolic functions as follows:
f ( V ) = a / V + b
where a and b are experimental parameters. Substituting Equation (2) into Equation (1) will give the relationship between the load level V and the total number of AE events N as follows:
N = c V a exp ( b V )
where a, b and c are AE test parameters, and a reflects the number of microcracks in the material. When a > 0, a higher AE rate can appear at lower stress levels, which indicates multiple cracks. When a < 0, a low AE rate appears at lower stress levels, which corresponds to no cracks or a small number of cracks.
In Dai-Labuz’s model [25], the relationship between V and N can be expressed as follows:
V = a N + c ln ( 1 + q N )
where a, c and q are related parameters for the AE.
After substituting Equation (4) into Equation (2), the probability density function f(V) can be expressed as follows:
f ( V ) = 1 N 0 ( 1 + q N a + c q + a q N )
After integrating the probability density function over a range of load level V, the damage degree of the specimen under this load level can be obtained:
D = 0 V f ( V ) d V
During the loading process of reinforced concrete, a large number of cracks will appear at the internal structure due to steel corrosion. Meanwhile, the corrosion degree of reinforcement will have an influence on the number of cracks on the structure during the entire loading process. However, limited research has been conducted on the damage evolution of corroded reinforced concrete [26], and there is not enough convincing evidence to show the diversity in the structural damage evolution of RC under different corrosion degrees [27]. Thus, it is necessary to fill these gaps. In this research, on the basis of Dai-Labuz’s model [25], the load level and accumulative AE hit number in the loading process can be expressed as follows:
N = s ( V )
where s(V) is determined by experiments.
After taking the derivative of Equation (7) and substituting it into Equation (2), the following equation can be obtained:
f ( V ) = 1 N 0 d s ( V ) d V
where N0 is the accumulative AE hit number when the load level reaches the ultimate load.
Finally, according to Equation (6), the damage degree of RC at load level V can be obtained as follows:
D = 1 N 0 0 V d s ( V )

3. Experimental Program

3.1. Specimen Preparation

Type I (ASTM C150) ordinary Portland cement (OPC) was used [28]. The fine aggregate was river sand with a fineness modulus of 2.6, and the coarse aggregate was crushed limestone with a maximum aggregate size of 20 mm. A commercial high-range water reducer (HRWR) was added to improve the workability and flowability of the concrete. The measured 28-day compressive strength of the concrete was 32.0 MPa on 150 mm cubes. Table 1 presents the mix proportion of the concrete. The longitudinal reinforcements in the concrete beam was a plain bar made of HPB235, with a nominal diameter of 10 mm, and the stirrups comprised a plain bar made of HPB235, with a nominal diameter of 6 mm. Then, eight RC column specimens of 100 mm × 100 mm × 400 mm were cast. A detailed configuration of the specimens is shown in Figure 1.

3.2. Corrosion Acceleration

The impressed current method was adopted to induce reinforcement corrosion in the RC specimens to reach the target level of corrosion. The layout of the corrosion acceleration apparatus is shown in Figure 2. The surfaces of the specimens were wrapped with sponge and further contained in a stainless-steel cage. In order to keep the RC specimens fully wet prior to inducing the impressed current, the specimens were soaked in a 3.5% NaCl solution for 72 h. During accelerated corrosion, the steel embedded in the specimen was connected to an anode of the direct current (DC)-regulated power supply, and the stainless-steel cage was connected to the cathode. A 3.5% NaCl solution was sprayed using a sponge every day.
A total of eight RC column specimens were prepared and divided into four groups with different levels of reinforcement corrosion, namely, 0% (Z-0), noncorroded as a reference; 5% (Z-5); 10% (Z-10); and 15% (Z-15). According to Faraday’s law, electrification duration of 30 days, 60 days and 90 days, respectively, represents the corrosion level of 5%, 10% and 15%.

3.3. Test System

The test system included the AE signal data acquisition system, the loading system and the load and displacement recording system. The DS2-AE acquisition system produced by Beijing Science and Technology Company was adopted in the test. Eight RS-35C sensors with a frequency of 150 kHz and a 40 dB preamplification were used in the AE system. The sampling frequency was set at 3 MHz. As shown in Figure 3, the eight sensors were arranged on the two sides of the columns. The characterization of the AE source was therefore measured and determined by analyzing the features of the waveform [29].
The load and displacement acquisition system consisted of a load sensor, resistance strain gauge, displacement sensor, displacement transmitter and recorder. The details are shown in Figure 4. The loading device was a 100 T high-performance testing machine, and the static loading was executed in the test. According to the standard of the concrete structure test method (GB/T50152-2012) [30], loading in the displacement control was conducted at a rate of 0.5 mm/min.

4. Results and Discussion

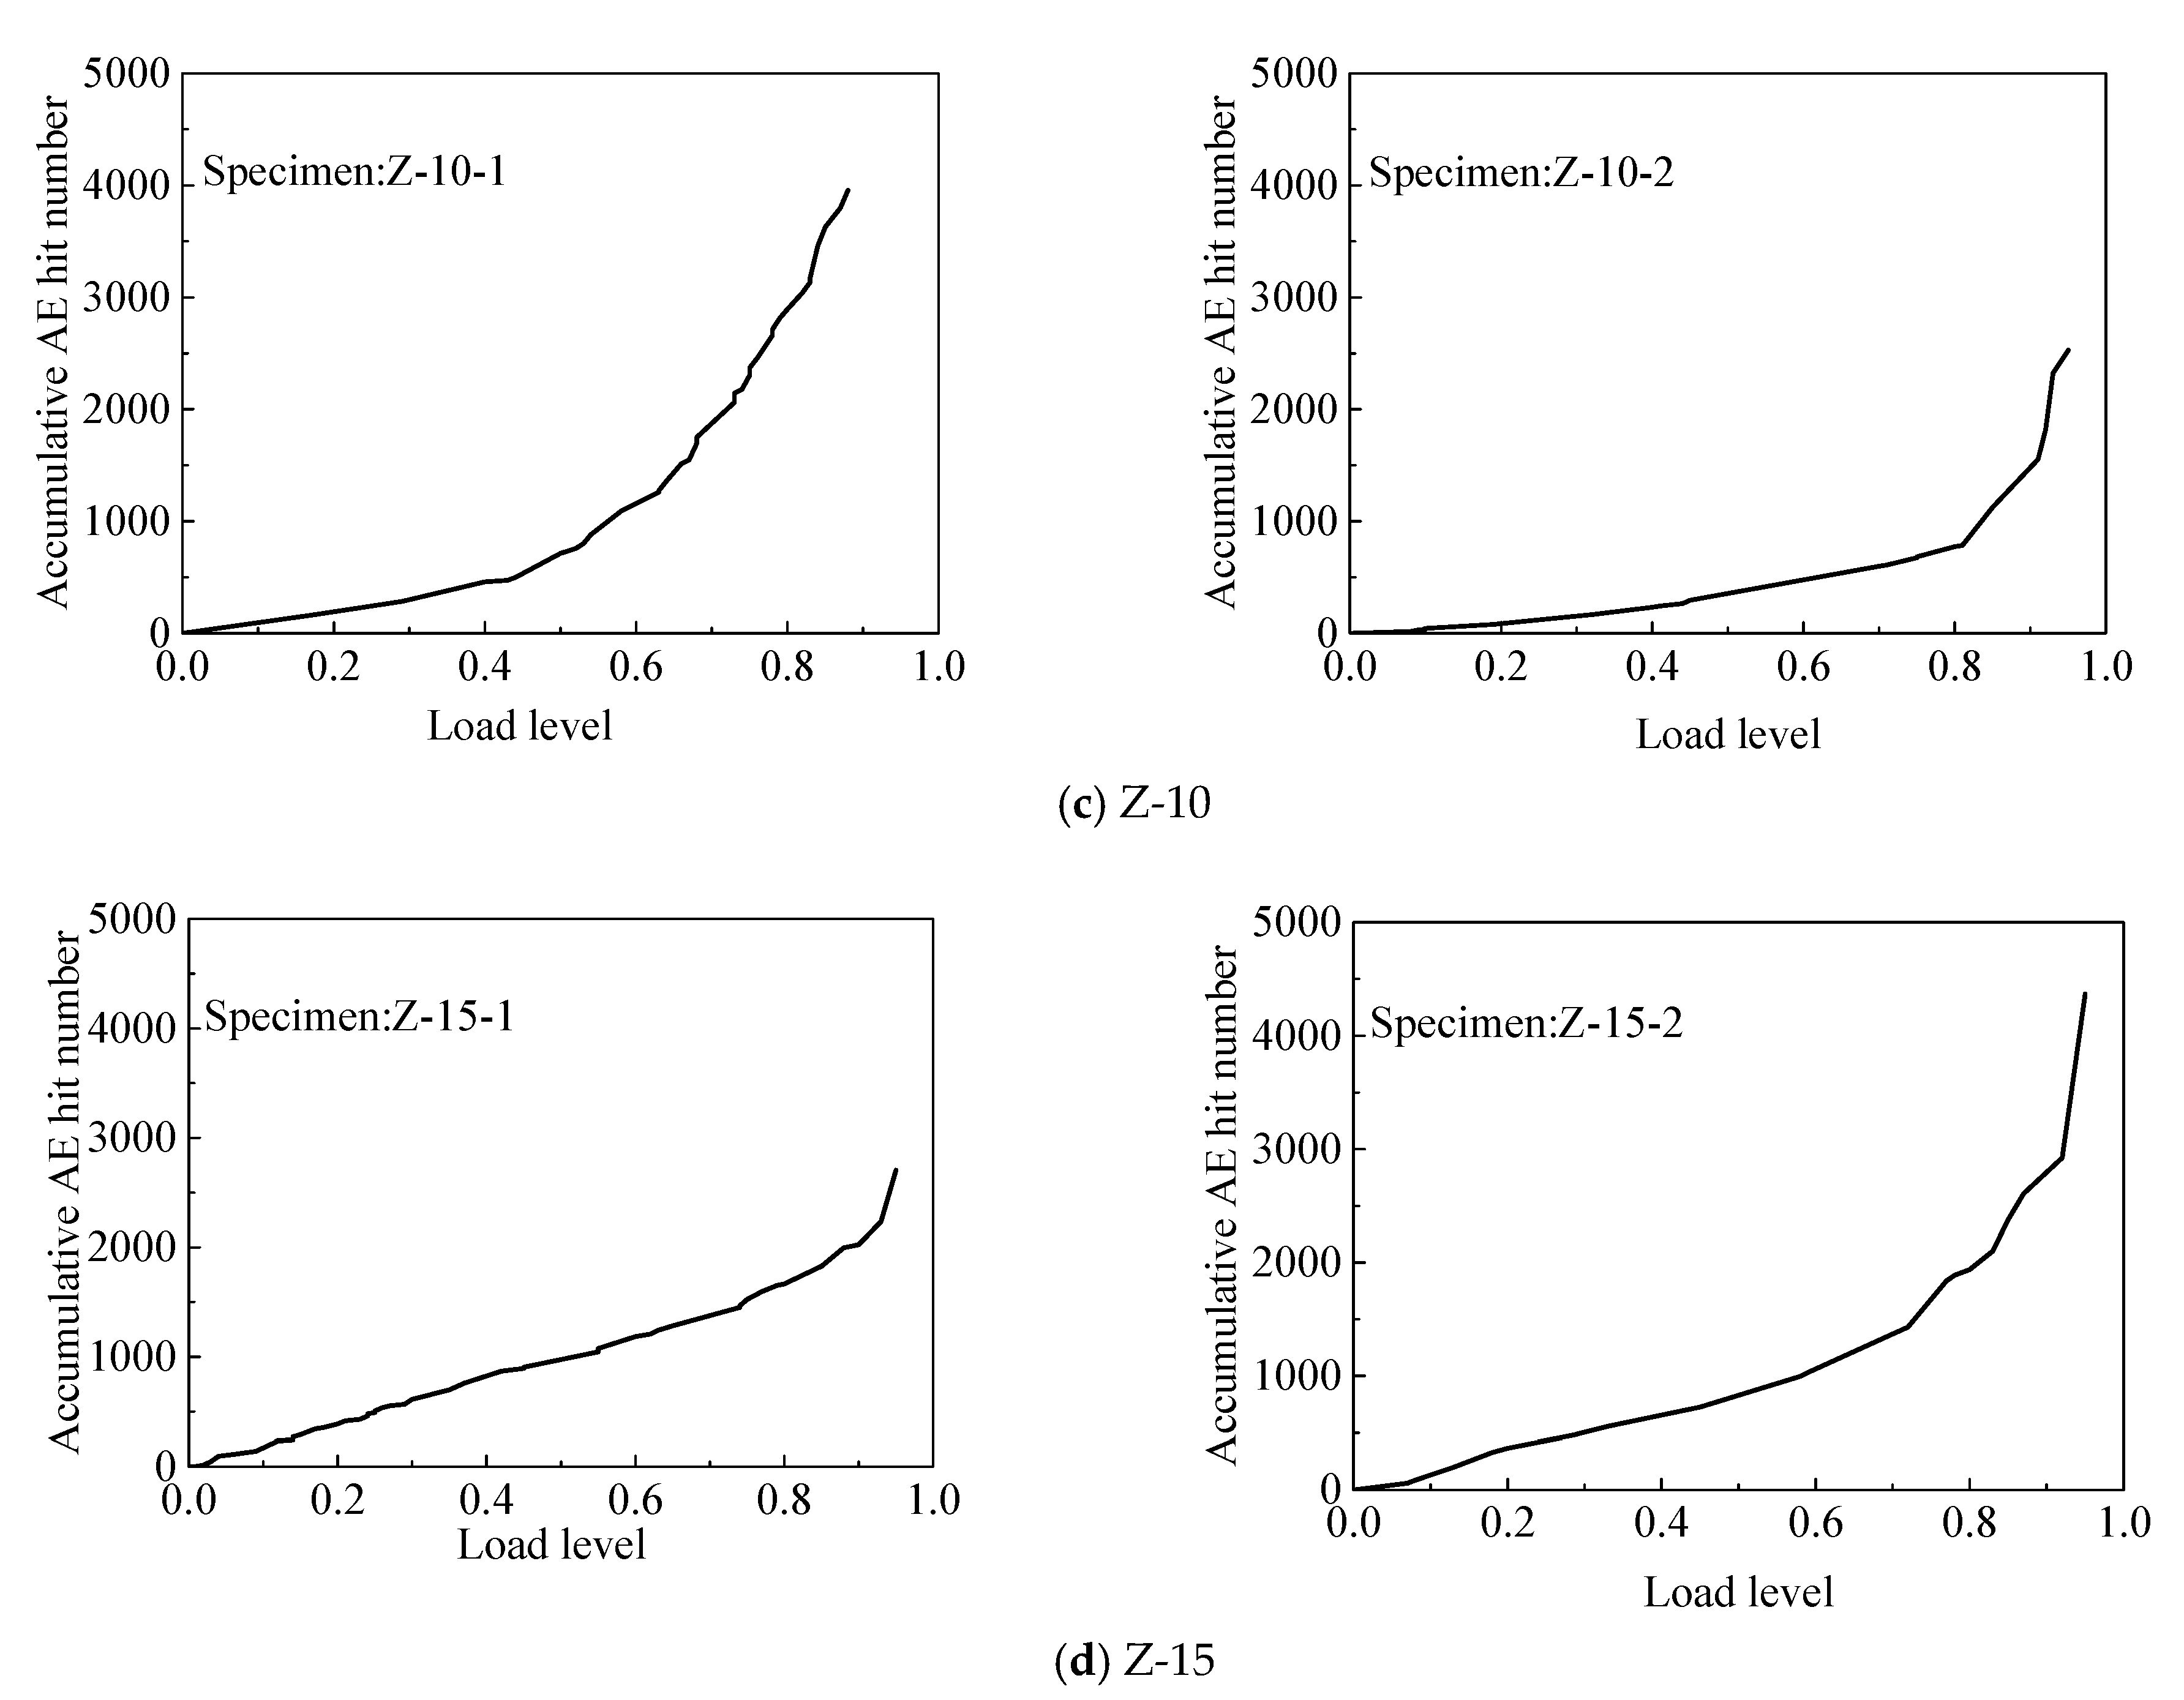
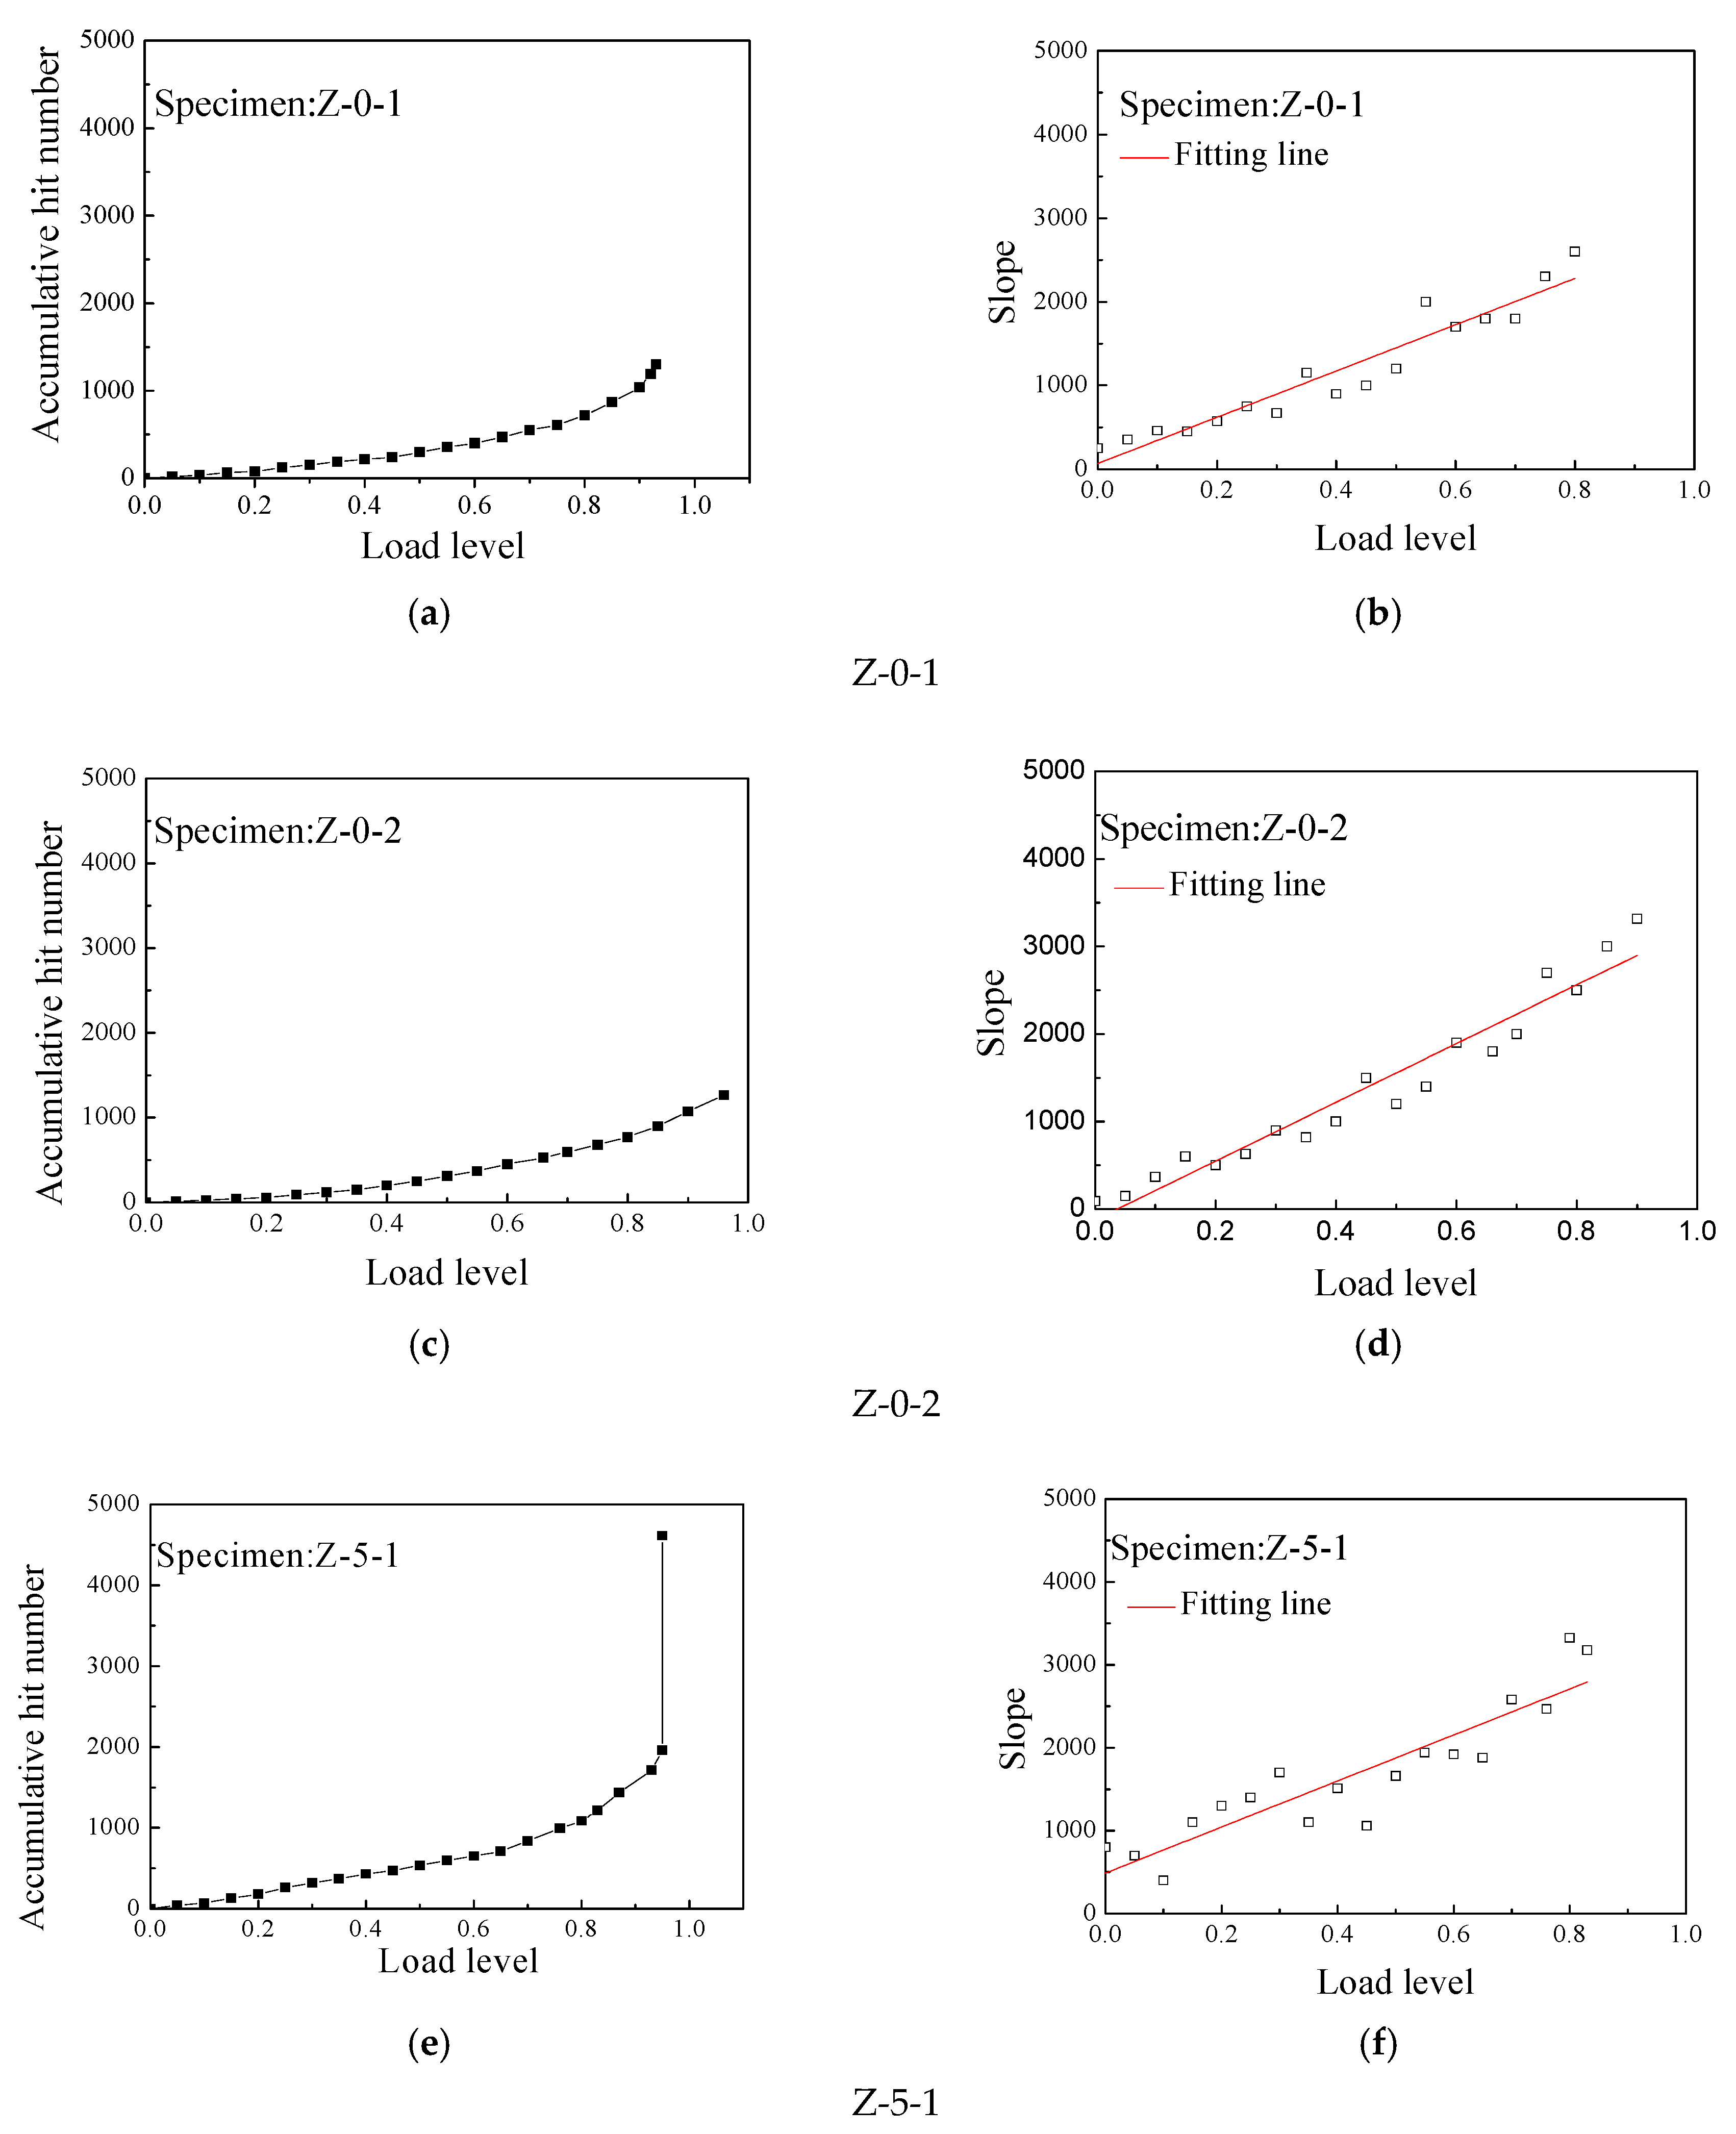
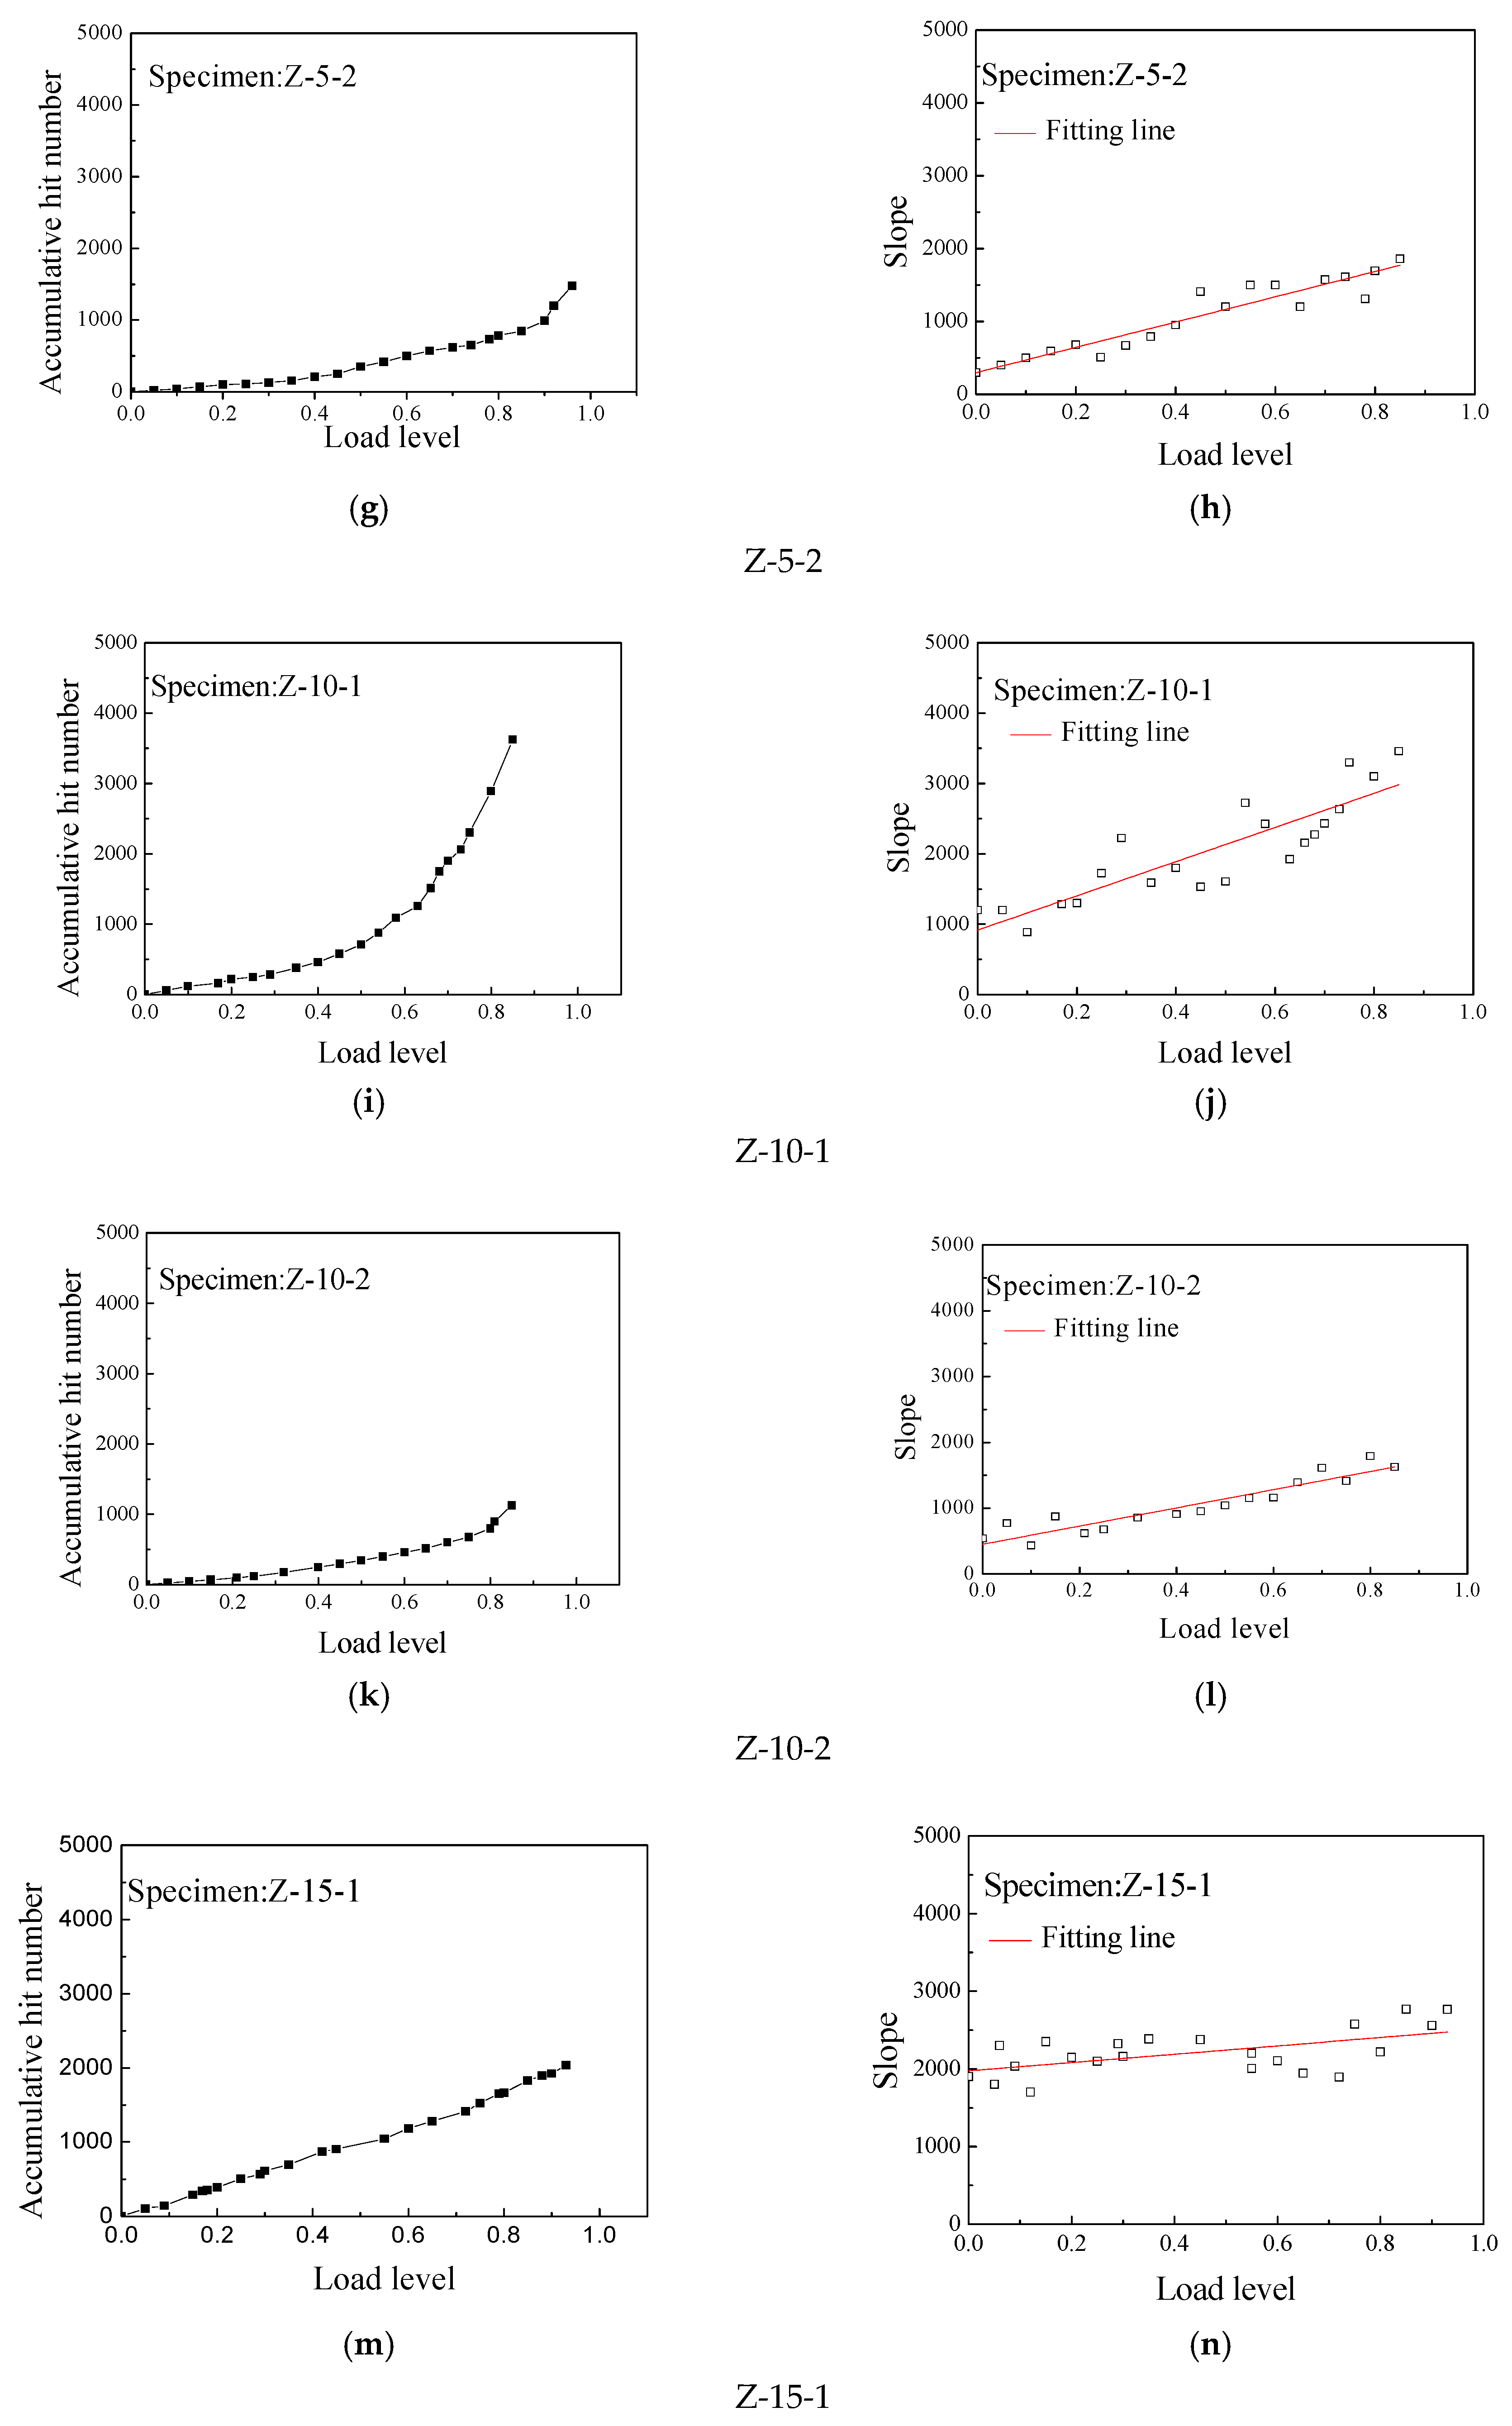
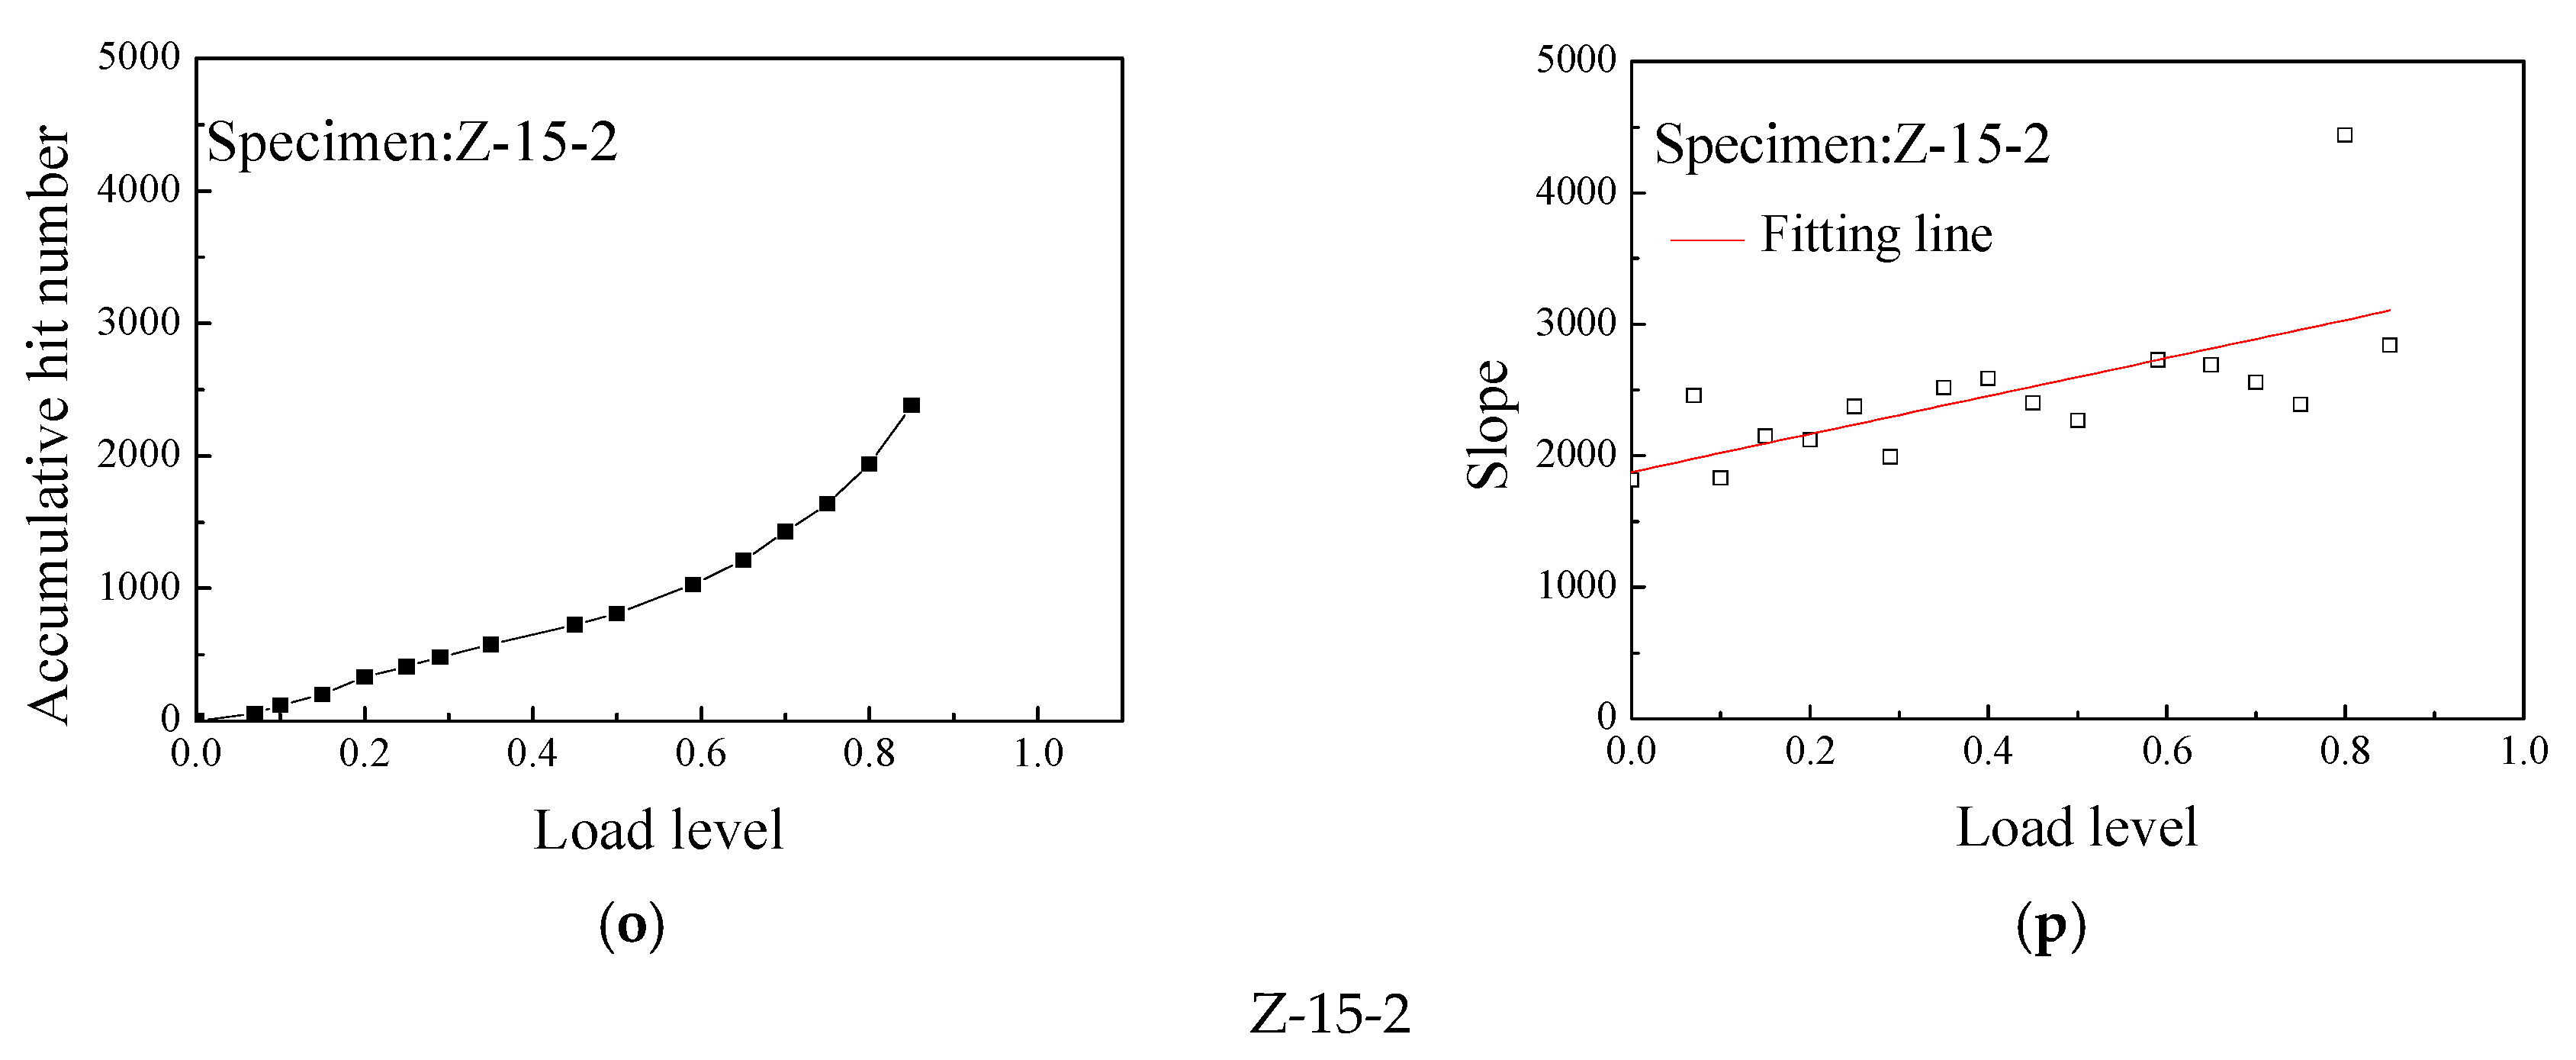
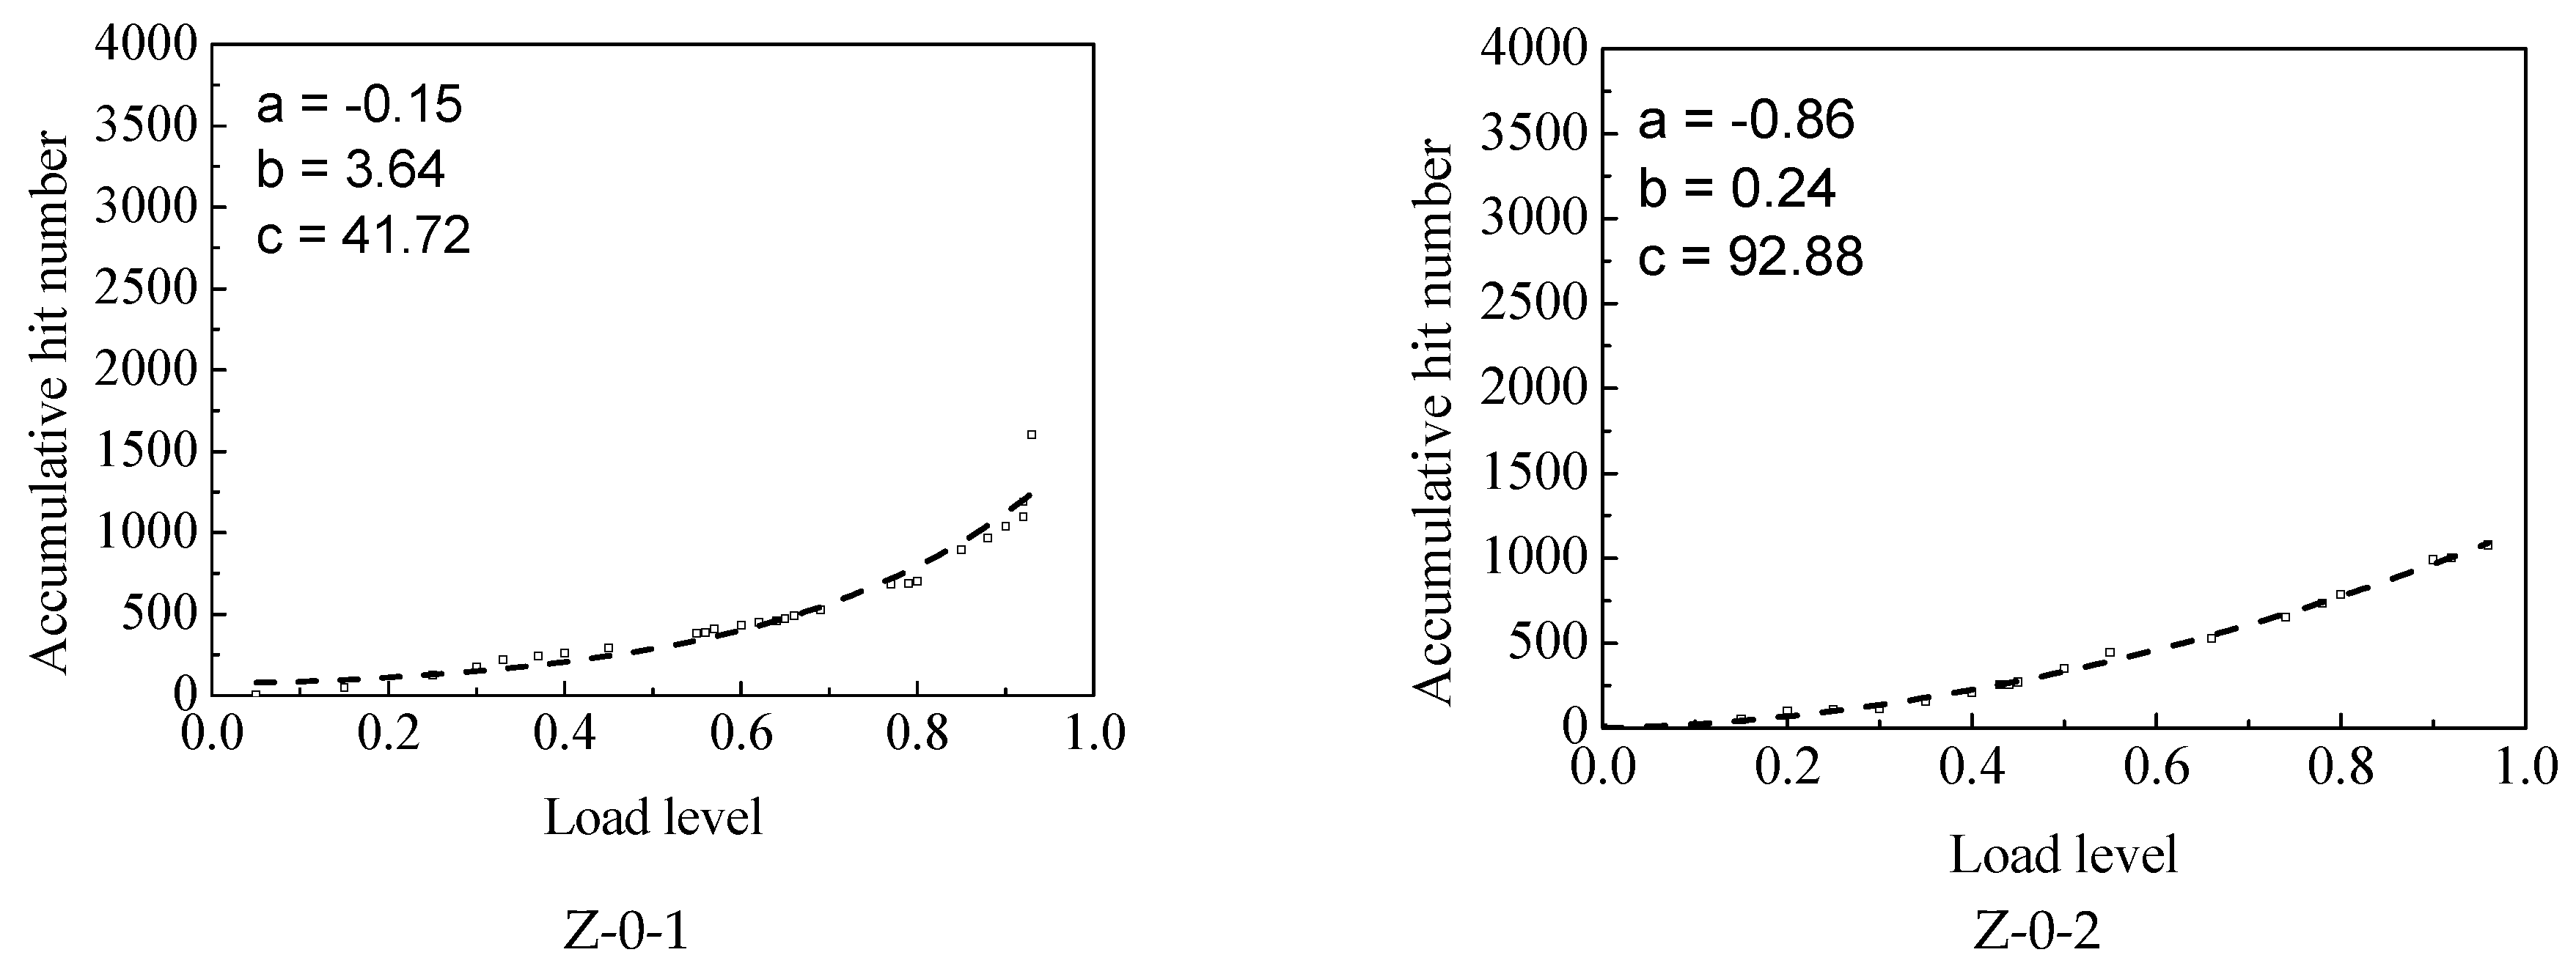
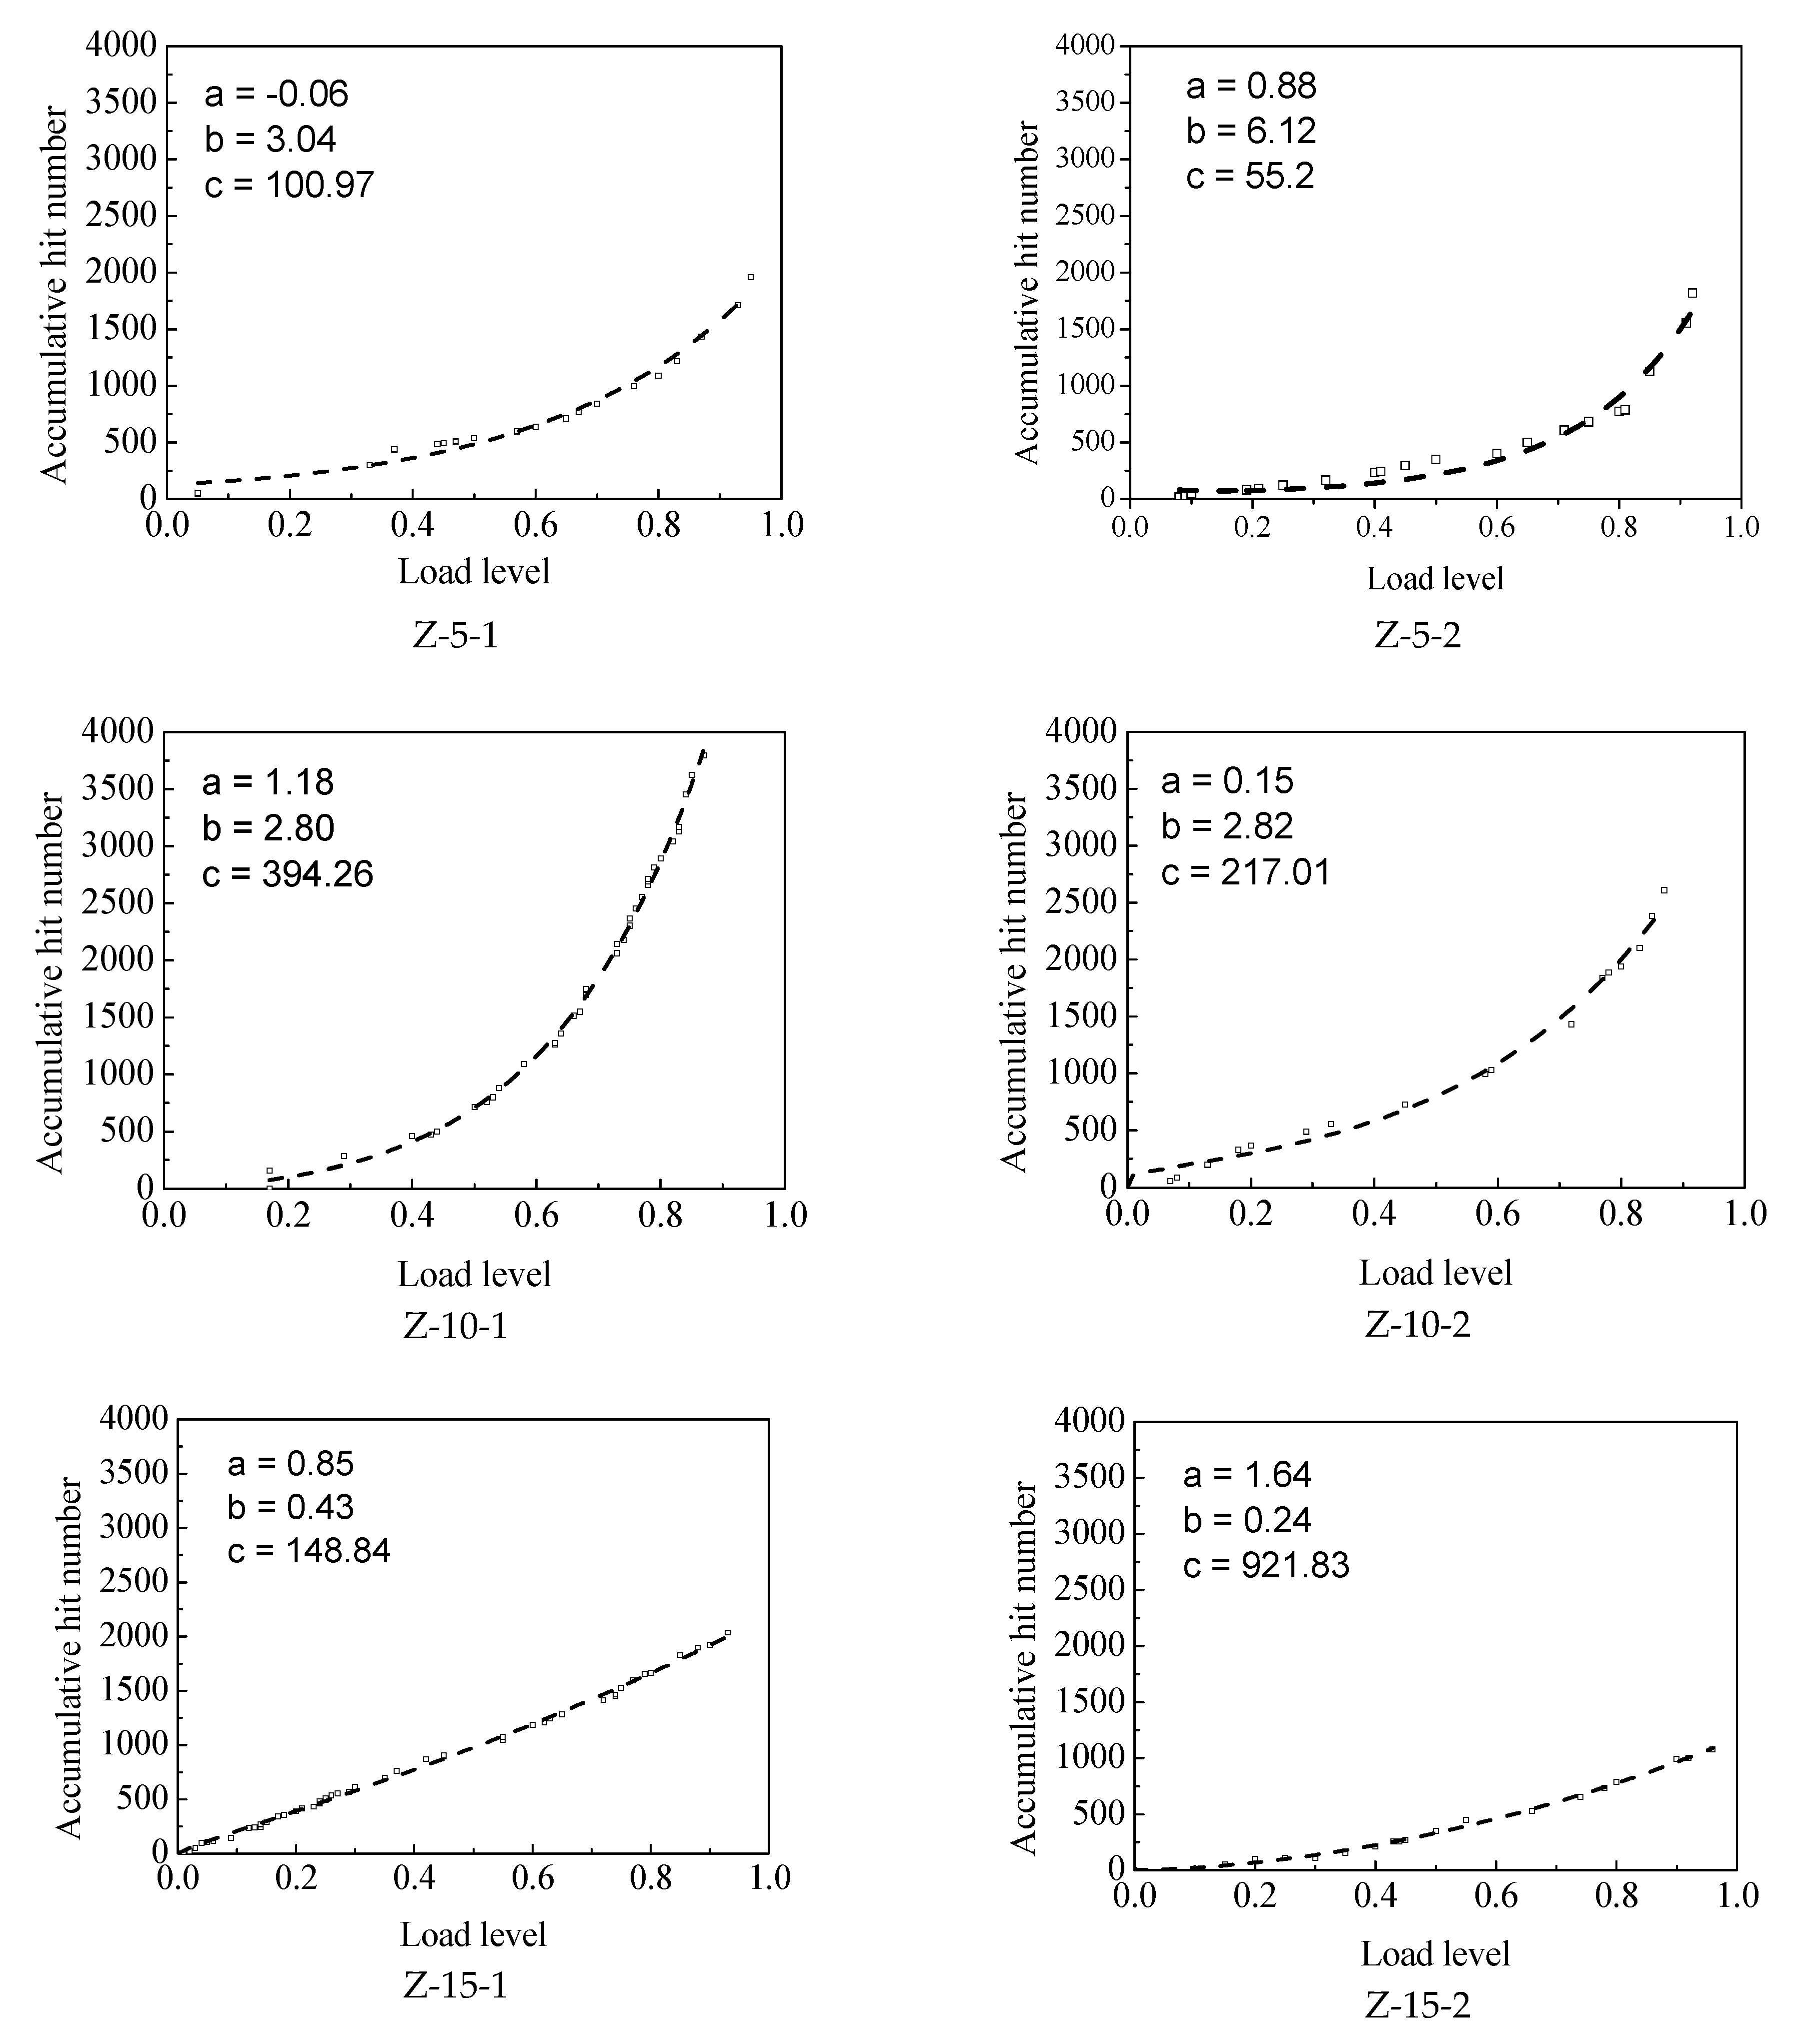
4.1. Accumulative AE Hit Number Analysis

The relationship between the accumulative AE hit number and load levels of the RC columns is shown in Figure 5. The effect of corrosion rate on this relationship is depicted in Figure 5a–d.
It can be seen from Figure 5 that the development of experimental curves in the four groups is similar. The AE accumulative hit number increases with the increase of the load level. However, there are also significant differences in the curves at different corrosion rates. The curve of Z-0 is similar to that of Z-5. Both curves in these groups show slow growth in the beginning, and a sharp increase occurs when the load level reaches 0.9. This indicates that, when the corrosion rate is below 5%, the internal damage accumulation is slower and lasts for a longer time during the loading process. Therefore, these two groups of specimens show a brittle characteristic, which means internal microcracks are rare before loading. It should be noted that although there is little variation between the two specimens for each group, the trends among different corrosion rates are significant.
Compared to the previous two groups’ tests (Z-0, Z-5), the curves of Z-10 and Z-15 are significantly different, showing no obvious turning points. This reveals that the AE signals of these two groups increase in the whole loading process. The initial growth rate of the AE signals is stable and increases until specimen failure. It can be found that with the increase of the corrosion rate, the curve shape changes from steep growth to steady growth. This is because the corrosion of the steel causes a large number of corrosion cracks in the columns [31]. The greater the corrosion rate, the more the cracks occur. During the loading process, with the increase of the load level, the propagation speed of the cracks increases, which leads to a significant increase in the acoustic emission signal.

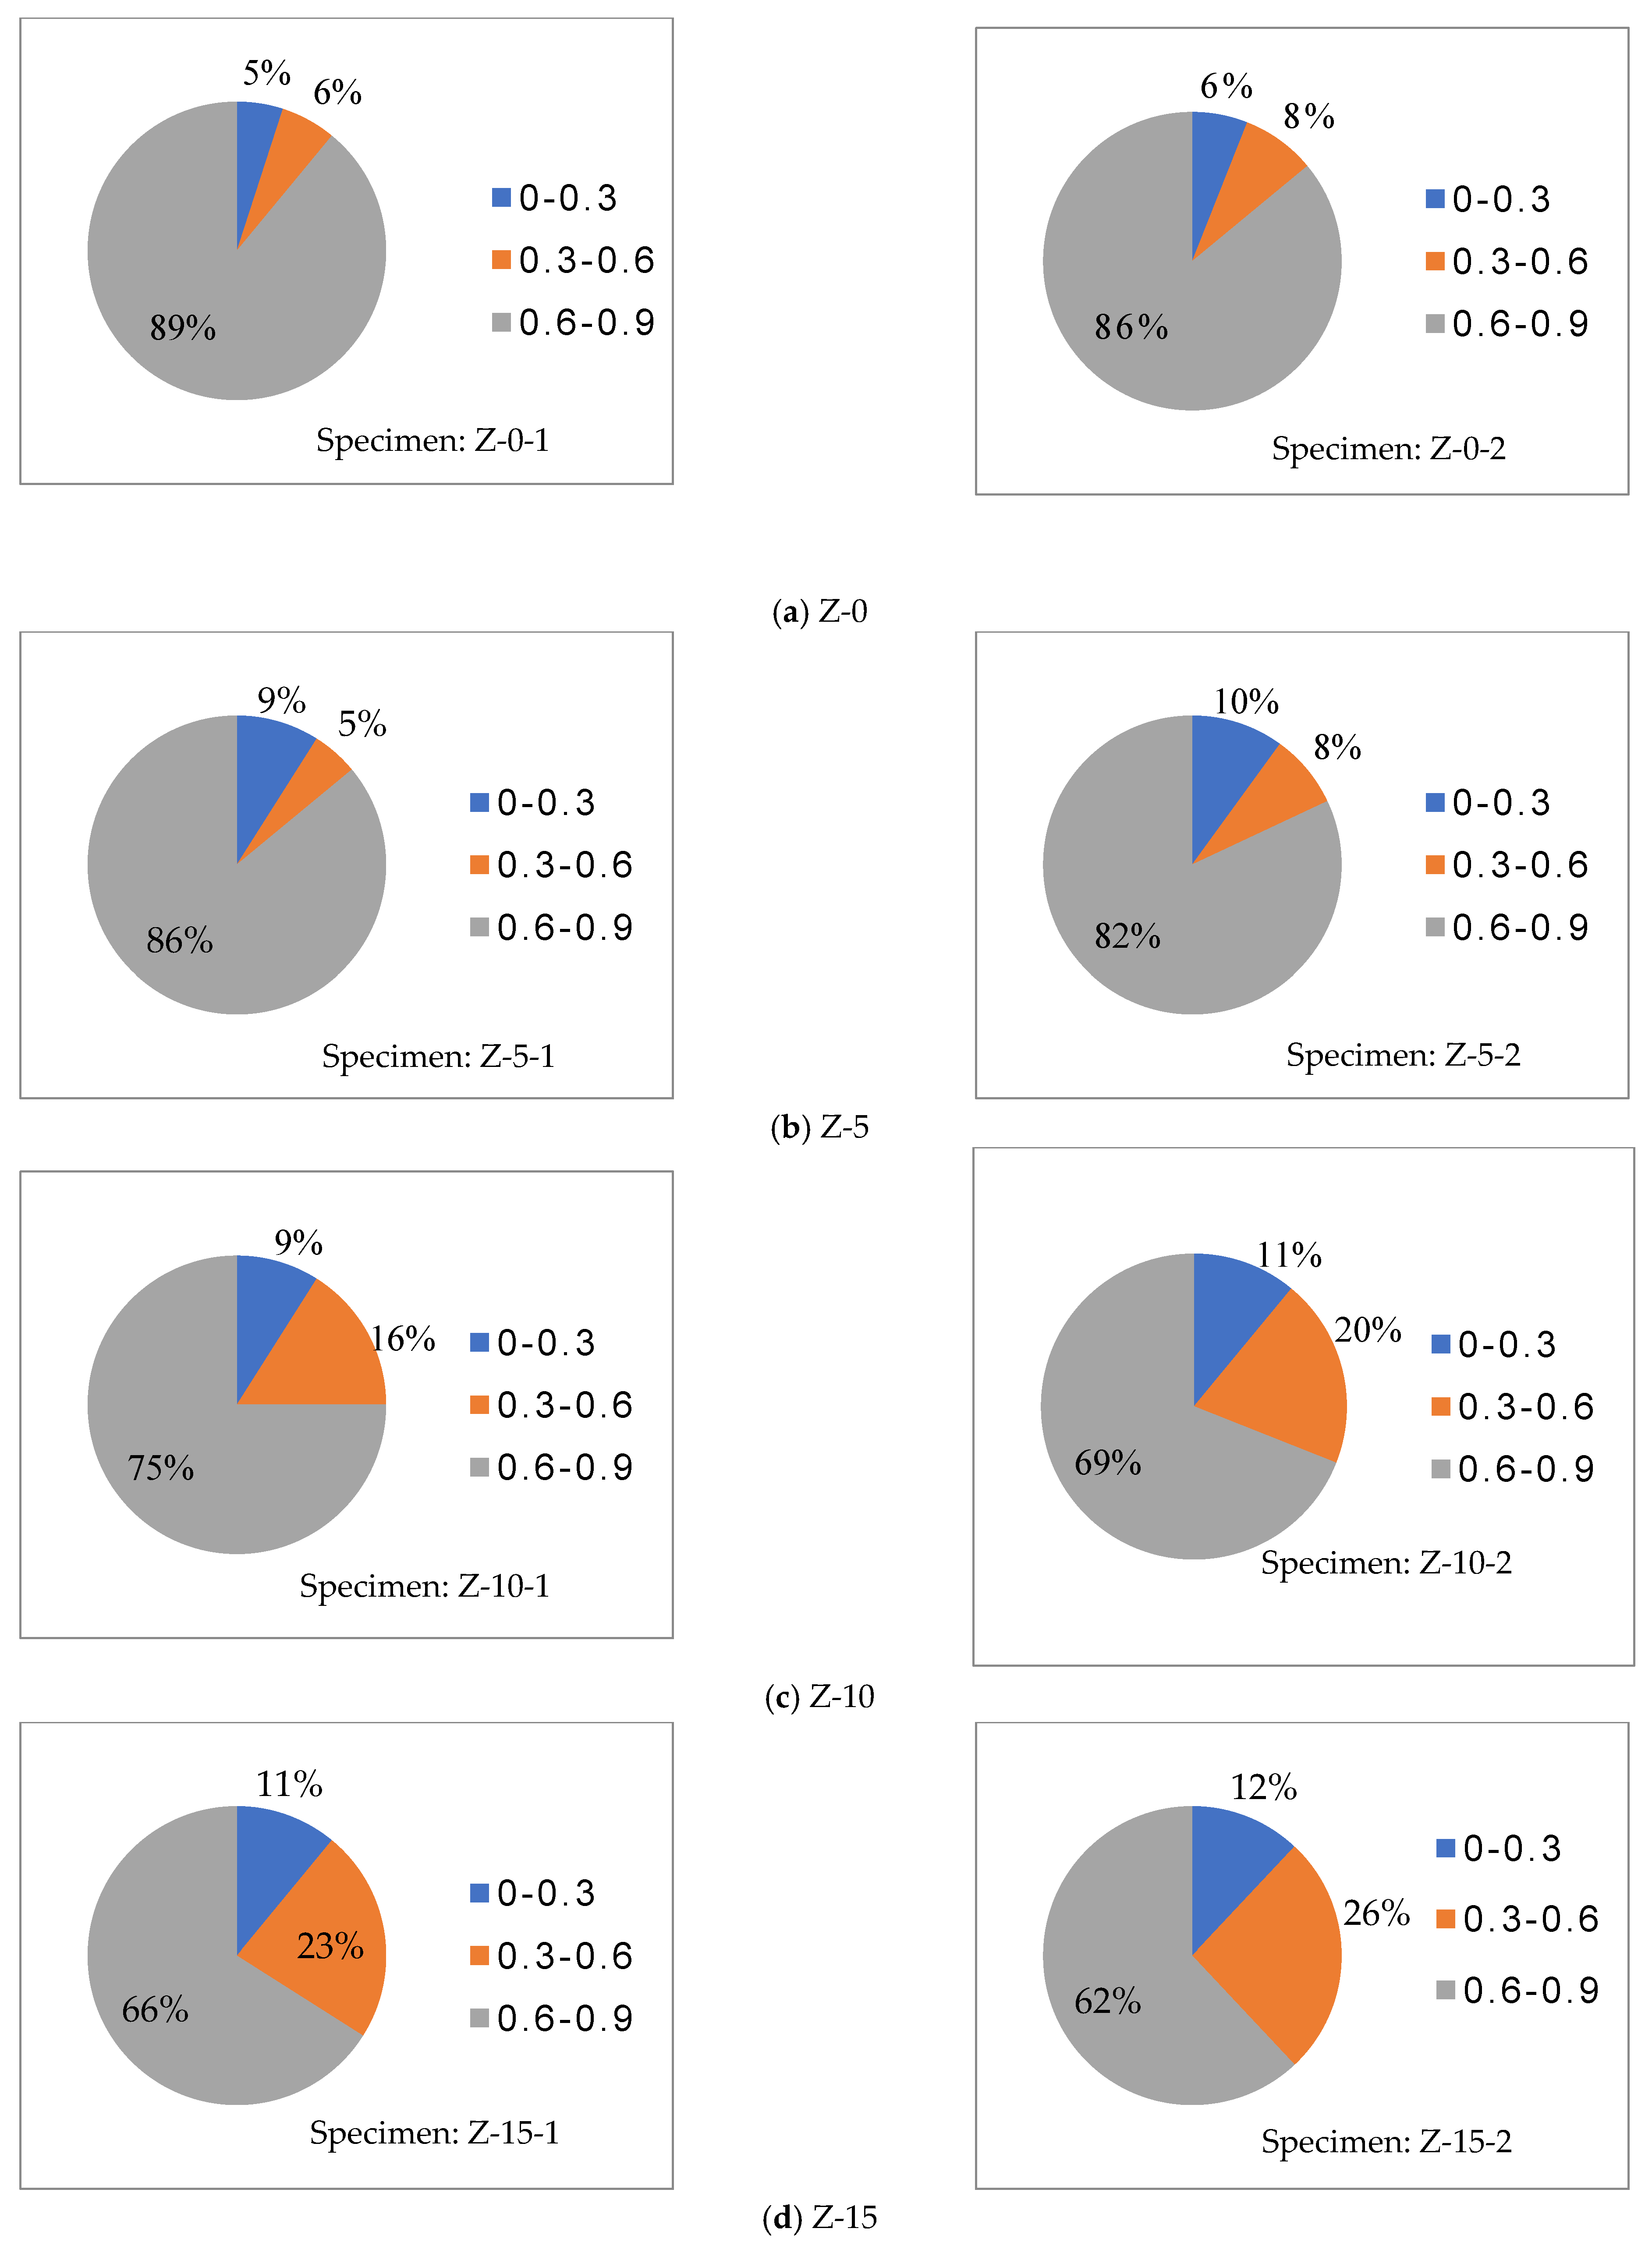
4.2. Analysis of AE Energy Distribution

From the data in Figure 5, the AE accumulative energy distribution of the RC column was calculated on the area under three ranges of the load level (0–0.3, 0.3–0.6 and 0.6–0.9), as shown in Figure 6. In order to reduce the influence of machine error and environmental noise on the critical failure, this paper focuses on the analysis of energy release within the load level of 0–0.9 [32]. The loading process is divided into three phases: preloading (0–0.3), middle loading (0.3–0.6) and late loading (0.6–0.9). The proportion of the AE accumulative energy in three phases is calculated accordingly.
As shown in Figure 6, regardless of the degree of corrosion, the proportion of energy released in the late loading period is the largest but the smallest in the preloading period. The result shows that the internal damage degree of the RC column increases with the increase of the load level. Comparing among the four groups, the energy proportion of Z-0 is 5% and 6%. When the corrosion rate reaches 15% (Z-15), the preloading energy proportion only increases by 6%, which indicates that the corrosion of the reinforcement has little impact on internal damage in the preloading period. Although the internal crack increases with the increment of the corrosion degree on the reinforcement, the crack propagation is not obvious due to the low load level, which may explain the small increase in energy [33].
In the middle loading period, the energy proportion of Z-0 is 6% and 8%. As the corrosion rate increases, the energy proportion in the middle loading period can increase to 26% and 23% at a growth rate of 20%. This indicates that the load in the middle loading period can enlarge the original microcracks, resulting in a large AE energy release. The corrosion in Z-10 and Z-15 is much more than Z-0 and Z-5, which strengthens the release of AE energy from Z-5 to Z-10. In this case, the AE signals before the middle loading period can be affected by the corrosion degree of specimens. Hence, the AE signals in the middle loading period can reflect the initial health condition of the corroded RC column.

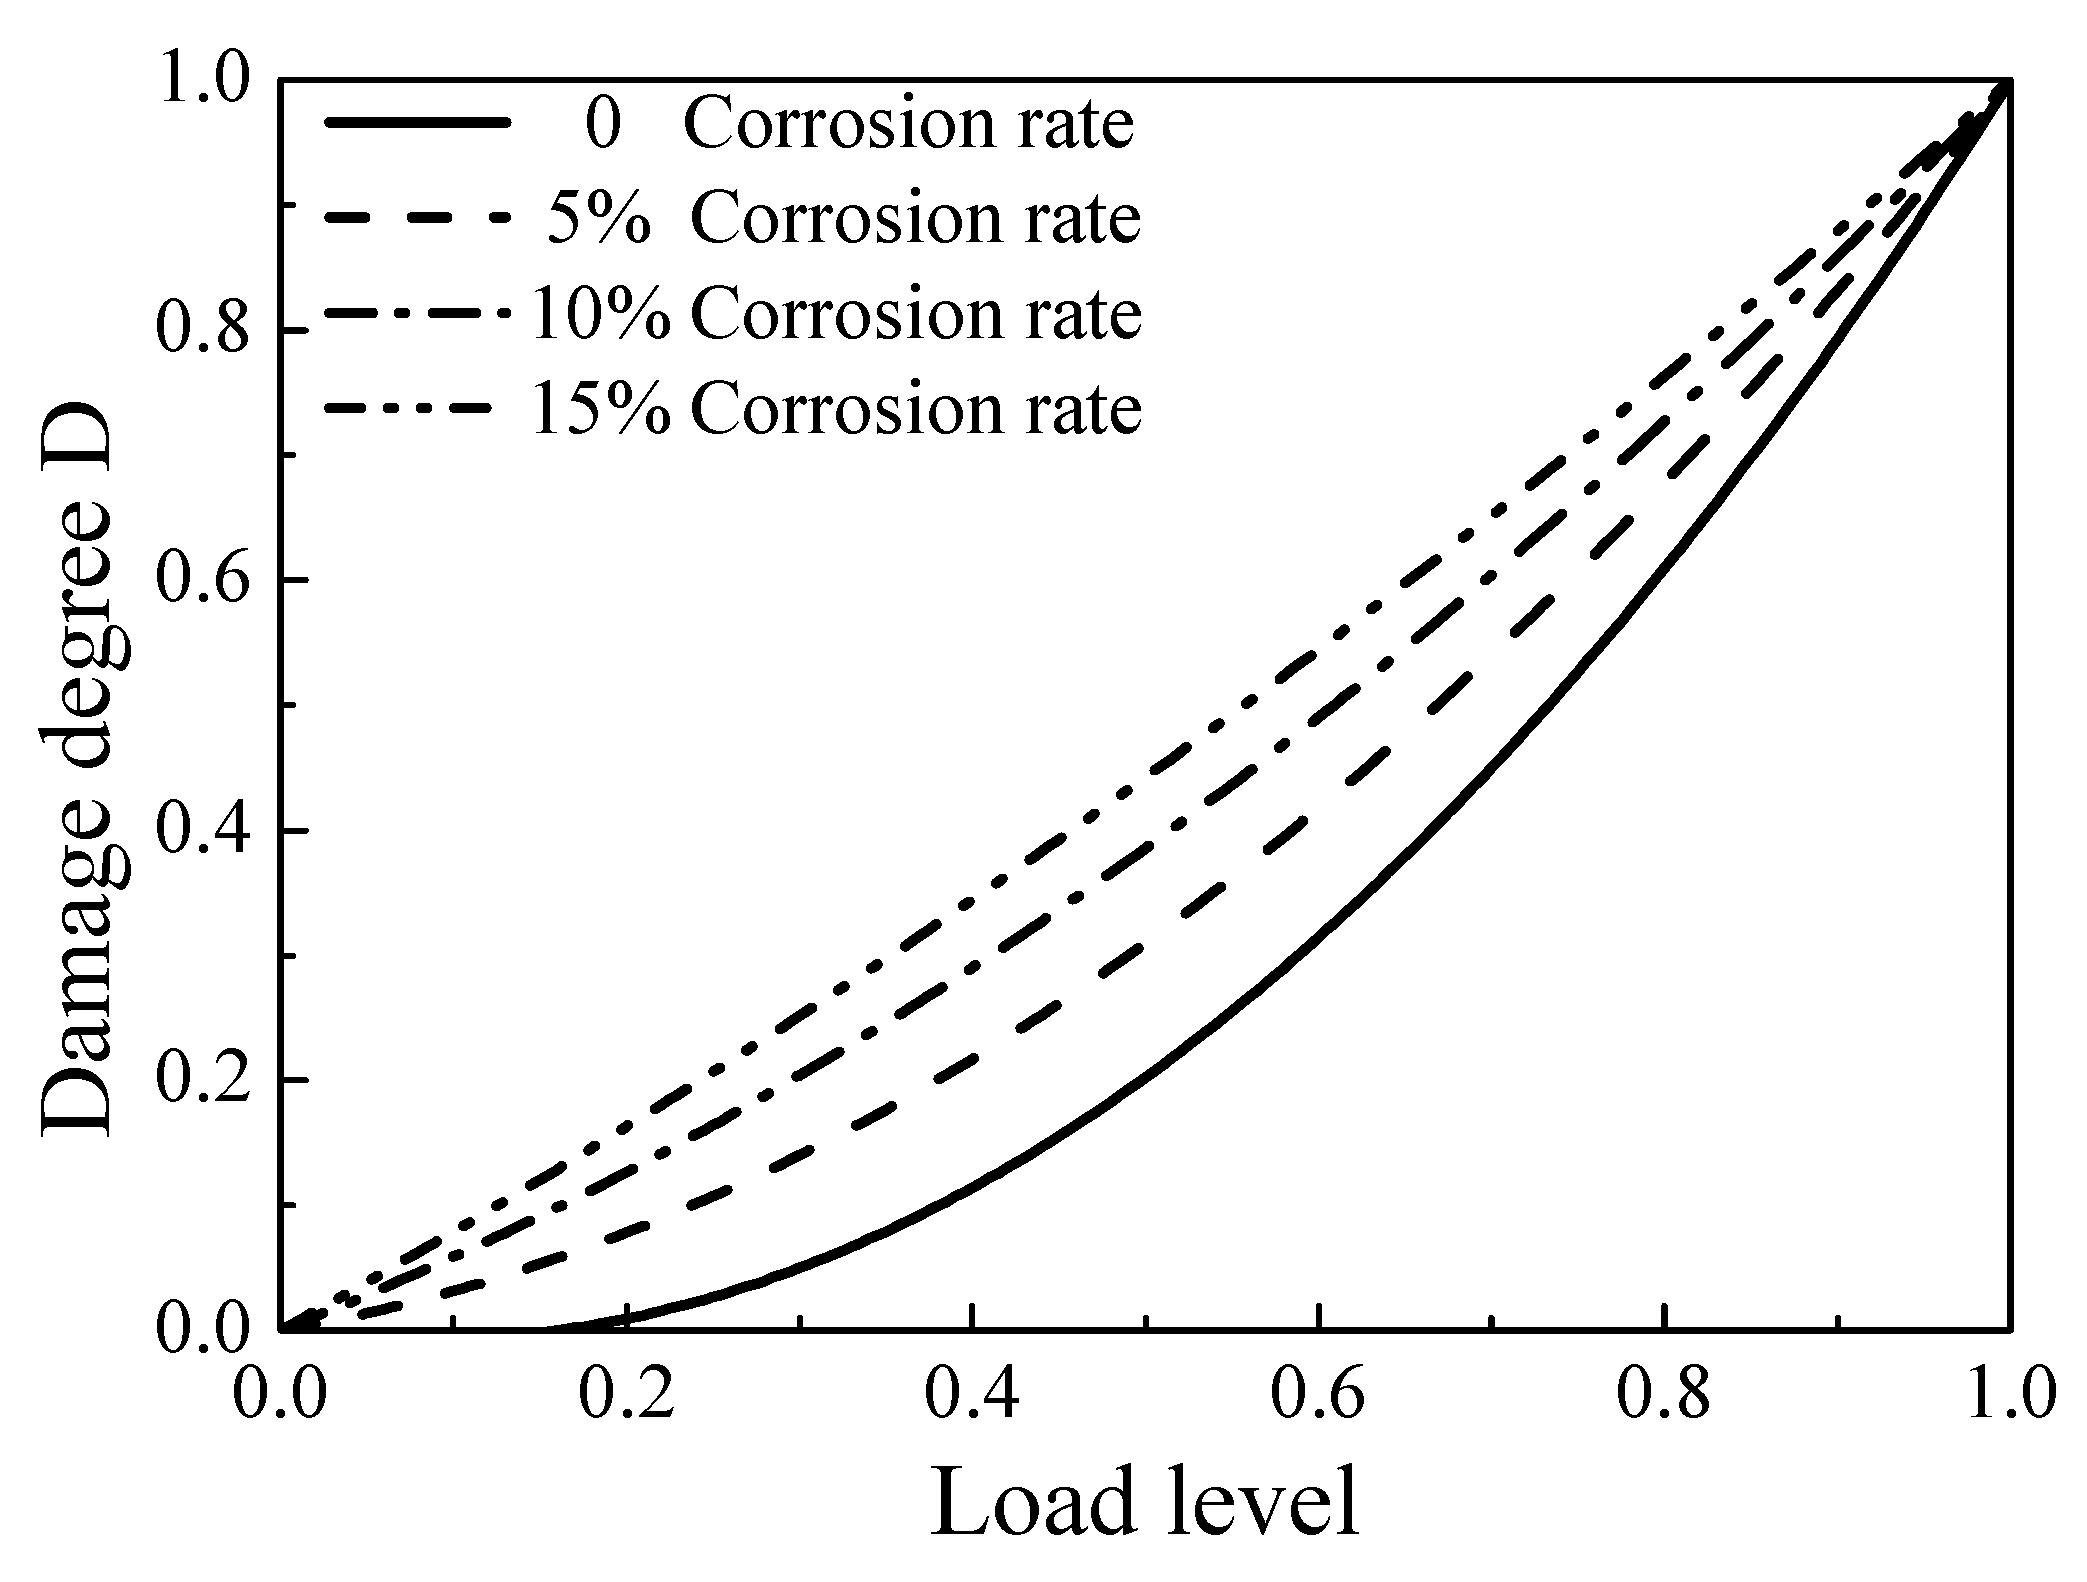
4.3. Damage Evolution Model of Corroded RC

After taking the derivative of the curve shown in Figure 7a, the curve of slope change could be obtained, shown in Figure 7b. It can be seen that as the corrosion rate increases, at the load level of 0.9, the curve form changes from exponential to linear. As shown in Figure 7b, the slope of the load over the accumulative hit curve increases linearly with the increase of the load level. According to the results of the experiment, the corrosion rate also has an effect on the initial slope. The initial slopes of Z-0, Z-5, Z-10 and Z-15 are 125, 500, 800 and 1700, respectively. It can be found that within a certain corrosion rate range, the higher the corrosion rate, the greater the initial slope of the AE accumulation signal can be achieved. Meanwhile, since the initial slope represents AE activity at the initial low load level, a higher corrosion rate refers to stronger AE activity of the RC columns during the initial loading period. Although there is little variation between the two specimens for each corrosion rate, trends among different corrosion rates are apparent.
Comparing the slope changes of each group, it can be seen that the slope of Z-0 increases from 125 to 2750. The slope of the Z-15 increases little from 1750 to 2800, but the growth rate remains at a high level. Therefore, it can be inferred that corrosion of the reinforcement can affect the whole service life of RC columns. When the corrosion rate is low or zero, the deterioration of internal damage is a dynamic process, from slow to fast. As a response, the AE signal changes from low to high. With the increase of the corrosion rate, the internal damage evolution of the RC column is accelerated, and the AE signal maintains a high level.
After considering the slope change trend, two slope relationship models are selected to fit the data [31]. The fitting results are shown in Table 2. Comparing these two models, the R2 value of N = p e V + q is generally lower than that of N = m V + n . Therefore, based on the characteristics of the above relationships, the binomial is adopted to establish the slope relation curve.
N = m V + n
where N’ is the slope of accumulative AE hit number, and m and n are the AE accumulative parameters, which can be obtained by fitting, as shown in Table 3.
The variation of the parameters with the corrosion rate is shown in Figure 8. As the corrosion increases, m decreases from 3500 to 540, and at the same time, n increases from –120 to 2000. This indicates that parameters m and n are related to the change of the corrosion rate, and their approximate linear function can be expressed as [34]:
m = 2931 134 ρ
n = 234 + 118 ρ
where ρ is the corrosion rate. By substituting m and n into Equation (10), N’ can be expressed as N = m V + n = 2931 V 234 ρ ( 134 V 118 ) .
By integrating Equation (13), the relationship between load and accumulative hit can be expressed as follows:
N = 1 2 m V 2 + n V = 1465 V 2 234 V ρ ( 67 V 2 118 V )
where N is the accumulative AE hit number, V is the load level, ρ is the corrosion rate and m and n are the AE accumulative parameters. Combining Equations (14) and (2), the probability density function of the AE event can be obtained [35]:
f ( V ) = 1 N 0 d s ( V ) d V = 2931 V 234 ρ ( 134 V 118 ) N 0
The integral of Equation (15) is the damage evolution model of corroded RC:
D = 1 N 0 0 V d s ( V ) = N N 0
The relationship of the load and damage degree under different corrosion rates for the RC column is shown in Figure 9. It can be seen that corrosion of reinforcement has a great influence on the damage evolution of the RC column. At the beginning, at the lower load level, the damage evolution is very slow. As the load level increases, the internal damage increases until the late loading period. Compared with the uncorroded specimens at the lower load level, with the increase in the corrosion rate, the damage factor of specimens is significantly increased, which leads to great damage accumulation before initial loading.

4.4. Initial Damage of Corroded RC

The number of AE events in different corrosion rates is shown in Figure 10. In order to reduce the effect of system noise and eliminate the instability of the failed concrete, the AE signal is collected under the load level of 0.1–0.9. Based on Ohtsu’s model, the data at different corrosion rates are fitted. The fitting parameters a, b and c are shown in Figure 10.
It can be seen that the values of the uncorroded column are −0.15 and −0.86, which indicates that the AE rate of the specimens is very low at the lower load level. The initial microcracks of the two uncorroded columns are very few. The values of specimens at a 5% corrosion rate are −0.06 and 0.88. The AE rate increased with the increase of the corrosion rate, indicating that the number of microcracks also increased. The values of a for specimens at a 10% and 15% corrosion rate are both greater than 0, and the microcracks propagated. Therefore, comparing the results of the AE rate process theory theoretically proves that the different reinforcement corrosion degrees cause different initial damage to RC columns before axial compression. As a result, the diversity in the internal damage evolution of the corroded column obtained by Equation (10) is verified.

5. Conclusions

Based on the experimental investigation, the following findings can be drawn from this study:
  • The corrosion degree of reinforcement in RC can be monitored by the AE signal in the whole loading process. The greater corrosion degree causes a stronger AE signal in the middle loading period, which means the initial damage of the RC columns is accelerated in this period.
  • The corrosion rate can be used as a parameter in the V–N model. After regression comparison, the developed model has a high agreement with the actual data.
  • Based on the AE rate process theory and the influence of the corrosion rate, the damage evolution model of the corroded RC column with different corrosion rates is established. It can be used to monitor the internal damage of RC columns at different corrosion rates and quantitatively evaluate the damage degree of the loading process.

Author Contributions

Conceptualization, Y.C. and S.Z.; investigation, Y.C.; data curation, C.F., Y.L. and S.Y.; methodology, X.J.; visualization, Y.L.; formal analysis, D.W.; software, C.F.; writing—original draft, Y.C. and S.Z.; writing—review and editing, Y.L., G.Z., N.D., X.J. and S.Z.; project administration, Y.C.; funding acquisition, C.F.; validation, X.J., Y.L. and G.Z.; resources, Y.C. All authors have read and agreed to the published version of the manuscript.

Funding

The financial support from the National Key R&D Program of China (No. SQ2019YFB160077), and the Natural Science Foundation of Zhejiang Province (Grant No. LR21E080002, LZ20E080003), and the National Natural Science Foundation (Grant Nos. 51678529 and 51978620) are gratefully acknowledged.

Conflicts of Interest

The authors declare no conflict of interest.

References

  1. Jiang, G.; Keller, J.; Bond, P.L.; Yuan, Z. Predicting concrete corrosion of sewers using artificial neural network. Water Res. 2016, 92, 52–60. [Google Scholar] [CrossRef] [PubMed] [Green Version]
  2. Fu, C.; Jin, X.; Ye, H.; Jin, N. Theoretical and experimental investigation of loading effects on chloride diffusion in saturated concrete. J. Adv. Concr. Technol. 2015. [Google Scholar] [CrossRef] [Green Version]
  3. Li, B.; Cai, L.; Zhu, W. Predicting Service Life of Concrete Structure Exposed to Sulfuric Acid Environment by Grey System Theory. Int. J. Civ. Eng. 2018, 16, 1017–1027. [Google Scholar] [CrossRef]
  4. Fu, C.; Ling, Y.; Wang, K. An innovation study on chloride and oxygen diffusions in simulated interfacial transition zone of cementitious material. Cem. Concr. Compos. 2020. [Google Scholar] [CrossRef]
  5. Huo, L.; Li, X.; Chen, D.; Li, H. Structural health monitoring using piezoceramic transducers as strain gauges and acoustic emission sensors simultaneously. Comput. Concr. 2017, 20, 595–603. [Google Scholar] [CrossRef]
  6. Mather, B. Concrete durability. Cem. Concr. Compos. 2004, 26, 3–4. [Google Scholar] [CrossRef]
  7. Zohari, M.H.; Epaarachchi, J.A.; Lau, K.T. Modal Acoustic Emission investigation for progressive failure monitoring in thin composite plates under tensile test. In Key Engineering Materials; Trans Tech Publications Ltd.: Baech, Switzerland, 2013; Volume 558, pp. 65–75. [Google Scholar] [CrossRef] [Green Version]
  8. Aggelis, D.G.; Shiotani, T.; Momoki, S.; Hirama, A. Acoustic emission and ultrasound for damage characterization of concrete elements. ACI Mater. J. 2009, 106, 509–514. [Google Scholar] [CrossRef]
  9. Iturrioz, I.; Lacidogna, G.; Carpinteri, A. Acoustic emission detection in concrete specimens: Experimental analysis and lattice model simulations. Int. J. Damage Mech. 2014, 327–358. [Google Scholar] [CrossRef]
  10. Nair, A.; Cai, C.S. Acoustic emission monitoring of bridges: Review and case studies. Eng. Struct. 2010, 32, 1704–1714. [Google Scholar] [CrossRef]
  11. Abouhussien, A.A.; Hassan, A.A.A. Evaluation of damage progression in concrete structures due to reinforcing steel corrosion using acoustic emission monitoring. J. Civ. Struct. Heal. Monit. 2015, 5, 751–765. [Google Scholar] [CrossRef]
  12. Vidya Sagar, R.; Raghu Prasad, B.K. A review of recent developments in parametric based acoustic emission techniques applied to concrete structures. Nondestruct. Test. Eval. 2012, 27, 47–68. [Google Scholar] [CrossRef]
  13. Desa, M.S.M.; Ibrahim, M.H.W.; Shahidan, S.; Ghadzali, N.S.; Misri, Z. Fundamental and assessment of concrete structure monitoring by using acoustic emission technique testing: A review. In Proceedings of the 4th International Conference on Civil and Environmental Engineering for Sustainability (IConCEES 2017), Langkawi, Malaysia, 4–5 December 2017; Volume 140. [Google Scholar] [CrossRef]
  14. Asamene, K.; Hudson, L.; Sundaresan, M. Influence of attenuation on acoustic emission signals in carbon fiber reinforced polymer panels. Ultrasonics 2015, 59, 86–93. [Google Scholar] [CrossRef] [PubMed]
  15. Mainali, G.; Dineva, S.; Nordlund, E. Experimental study on debonding of shotcrete with acoustic emission during freezing and thawing cycle. Cold Reg. Sci. Technol. 2015, 111, 1–12. [Google Scholar] [CrossRef]
  16. Masayasu, O.; Watanabe, H. Construction and Building Materials -Quantitative damage estimation of concrete by acoustic emission. Constr. Build. Mater. 2001, 15, 217–224. [Google Scholar] [CrossRef]
  17. Ji, H.; Zhang, T.; Cai, M.; Zhang, Z. Experimental study on concrete damage by dynamic asurement of acoustic emission. Chin. J. Rock Mech. Eng. 2000, 19, 165–168. [Google Scholar]
  18. Suzuki, T.; Ohtsu, M.; Shigeishi, M. Relative damage evaluation of concrete in a road bridge by AE rate-process analysis. Mater. Struct. Constr. 2007, 40, 221–227. [Google Scholar] [CrossRef]
  19. Suzuki, T.; Ogata, H.; Takada, R.; Aoki, M.; Ohtsu, M. Use of acoustic emission and X-ray computed tomography for damage evaluation of freeze-thawed concrete. Constr. Build. Mater. 2010, 24, 2347–2352. [Google Scholar] [CrossRef]
  20. Zhou, X.; Yang, Y.; Li, X.; Zhao, G. Acoustic emission characterization of the fracture process in steel fiber reinforced concrete. Comput. Concr. 2016, 18, 923–936. [Google Scholar] [CrossRef]
  21. Deng, Y.; Ding, Y.; Li, A. Experimental study on damage evolution of steel strands based on acoustic emission signals and rate process theory. J. Southeast Univ. (Nat. Sci. Ed.) 2010, 40, 1238–1242. [Google Scholar] [CrossRef]
  22. Li, X.; Huo, L.S.; Li, H.N. AE monitoring for the loading test of reinforced concrete column. J. Vib. Shock 2014, 33, 12–15. [Google Scholar] [CrossRef]
  23. Li, X.W. Application of working face rock burst prediction of grey modeling cusp catastrophe analysis based on the acoustic emission. Appl. Mech. Mater. 2013, 373–375, 689–693. [Google Scholar] [CrossRef]
  24. Qiang, L.I.; Zhonggou, C.H.E.N.; Dan, W.U. Temporal and Spatial Evolution of Acoustic Emission in the Damage Process of Reinforced Concrete Column. Appl. Mech. Mater. 2014, 638–640, 275–278. [Google Scholar] [CrossRef]
  25. Dai, S.T.; Labuz, J.F. Damage and failure analysis of brittle materials by acoustic emission. J. Mater. Civ. Eng. 1997, 9, 200–205. [Google Scholar] [CrossRef]
  26. Barrios, F.; Ziehl, P.H. Cyclic load testing for integrity evaluation of prestressed concrete girders. ACI Struct. J. 2012, 109, 615–624. [Google Scholar] [CrossRef]
  27. Wiedmann, A.; Weise, F.; Kotan, E.; Müller, H.S.; Meng, B. Effects of fatigue loading and alkali–silica reaction on the mechanical behavior of pavement concrete. Struct. Concr. 2017, 18, 539–549. [Google Scholar] [CrossRef]
  28. ASTM C150/C150M: Standard Specification for Portland Cement; ASTM International: West Conshohocken, PA, USA, 2020.
  29. Ohno, K.; Ohtsu, M. Crack classification in concrete based on acoustic emission. Constr. Build. Mater. 2010, 24, 2339–2346. [Google Scholar] [CrossRef]
  30. GB/T50152-2012: Standard for Test Method of Concrete Structures; TransForyou Co., Ltd.: Beijing, China, 2012.
  31. Rodríguez, P.; Celestino, T.B. Application of acoustic emission monitoring and signal analysis to the qualitative and quantitative characterization of the fracturing process in rocks. Eng. Fract. Mech. 2019, 210, 54–69. [Google Scholar] [CrossRef]
  32. Mostafapour, A.; Davoodi, S.; Ghareaghaji, M. Acoustic emission source location in plates using wavelet analysis and cross time frequency spectrum. Ultrasonics 2014, 54, 2055–2062. [Google Scholar] [CrossRef]
  33. Fan, X.; Hu, S.; Lu, J. Damage and fracture processes of concrete using acoustic emission parameters. Comput. Concr. 2016, 18, 267–278. [Google Scholar] [CrossRef]
  34. Abdelrahman, M.A.; ElBatanouny, M.K.; Rose, J.R.; Ziehl, P.H. Signal processing techniques for filtering acoustic emission data in prestressed concrete. Res. Nondestruct. Eval. 2019, 30, 127–148. [Google Scholar] [CrossRef]
  35. Liu, X.; Zhang, W.; Gu, X.; Ye, Z. Probability distribution model of stress impact factor for corrosion pits of high-strength prestressing wires. Eng. Struct. 2021, 230, 111686. [Google Scholar] [CrossRef]
Figure 1. Reinforcement configuration (units mm).
Crystals 11 00067 g001
Figure 2. Accelerated corrosion test.
Crystals 11 00067 g002
Figure 3. Sensor location in the reinforced concrete.
Crystals 11 00067 g003
Figure 4. Experimental system.
Crystals 11 00067 g004
Figure 5. Correlation curve of the acoustic emission (AE) accumulative hit number and load for different corrosion rates
Crystals 11 00067 g005aCrystals 11 00067 g005b
Figure 6. AE accumulative energy distribution of the reinforced concrete column for different corrosion rates (two specimens per corrosion rate).
Crystals 11 00067 g006
Figure 7. Load accumulative hit curve and slope curve for different corrosion rates (two specimens per corrosion rate).
Crystals 11 00067 g007aCrystals 11 00067 g007bCrystals 11 00067 g007c
Figure 8. Parameter variation with the corrosion rate. (a) m variation with corrosion rate, (b) n variation with corrosion rate
Crystals 11 00067 g008
Figure 9. Correlation curve of the load and damage degree.
Crystals 11 00067 g009
Figure 10. AE events in different corrosion rates and N–V fitting curves.
Crystals 11 00067 g010aCrystals 11 00067 g010b
Table 1. Mix proportions of concrete.
OPC
(kg/m3)
Fine Aggregate
(kg/m3)
Coarse Aggregate
(kg/m3)
HRWR
(kg/m3)
Water
(kg/m3)
37269811163.71175
Table 2. Fitting results of the slope.
Group NumberFitting EquationR2
Z-0-1 N = m V + n 0.91057
N = p e V + q 0.80362
Z-0-2 N = m V + n 0.92083
N = p e V + q 0.84135
Z-5-1 N = m V + n 0.88712
N = p e V + q 0.80169
Z-5-2 N = m V + n 0.84131
N = p e V + q 0.75148
Z-10-1 N = m V + n 0.77161
N = p e V + q 0.71694
Z-10-2 N = m V + n 0.63221
N = p e V + q 0.55148
Z-15-1 N = m V + n 0.60132
N = p e V + q 0.45985
Z-15-2 N = m V + n 0.58443
N = p e V + q 0.40871
Table 3. AE accumulative parameters.
ParameterZ-0Z-0Z-5Z-5Z-10Z-10Z-15Z-15
m2985332416841935188513826831256
n−1202425650483245018331836
Publisher’s Note: MDPI stays neutral with regard to jurisdictional claims in published maps and institutional affiliations.

