
One-Step Multi-Doping Process for Producing Effective Zinc Oxide Nanofibers to Remove Industrial Pollutants Using Sunlight

 ,
,  , ,
, ,  and
and 
Abstract
:1. Introduction
2. Materials and Methods
3. Results
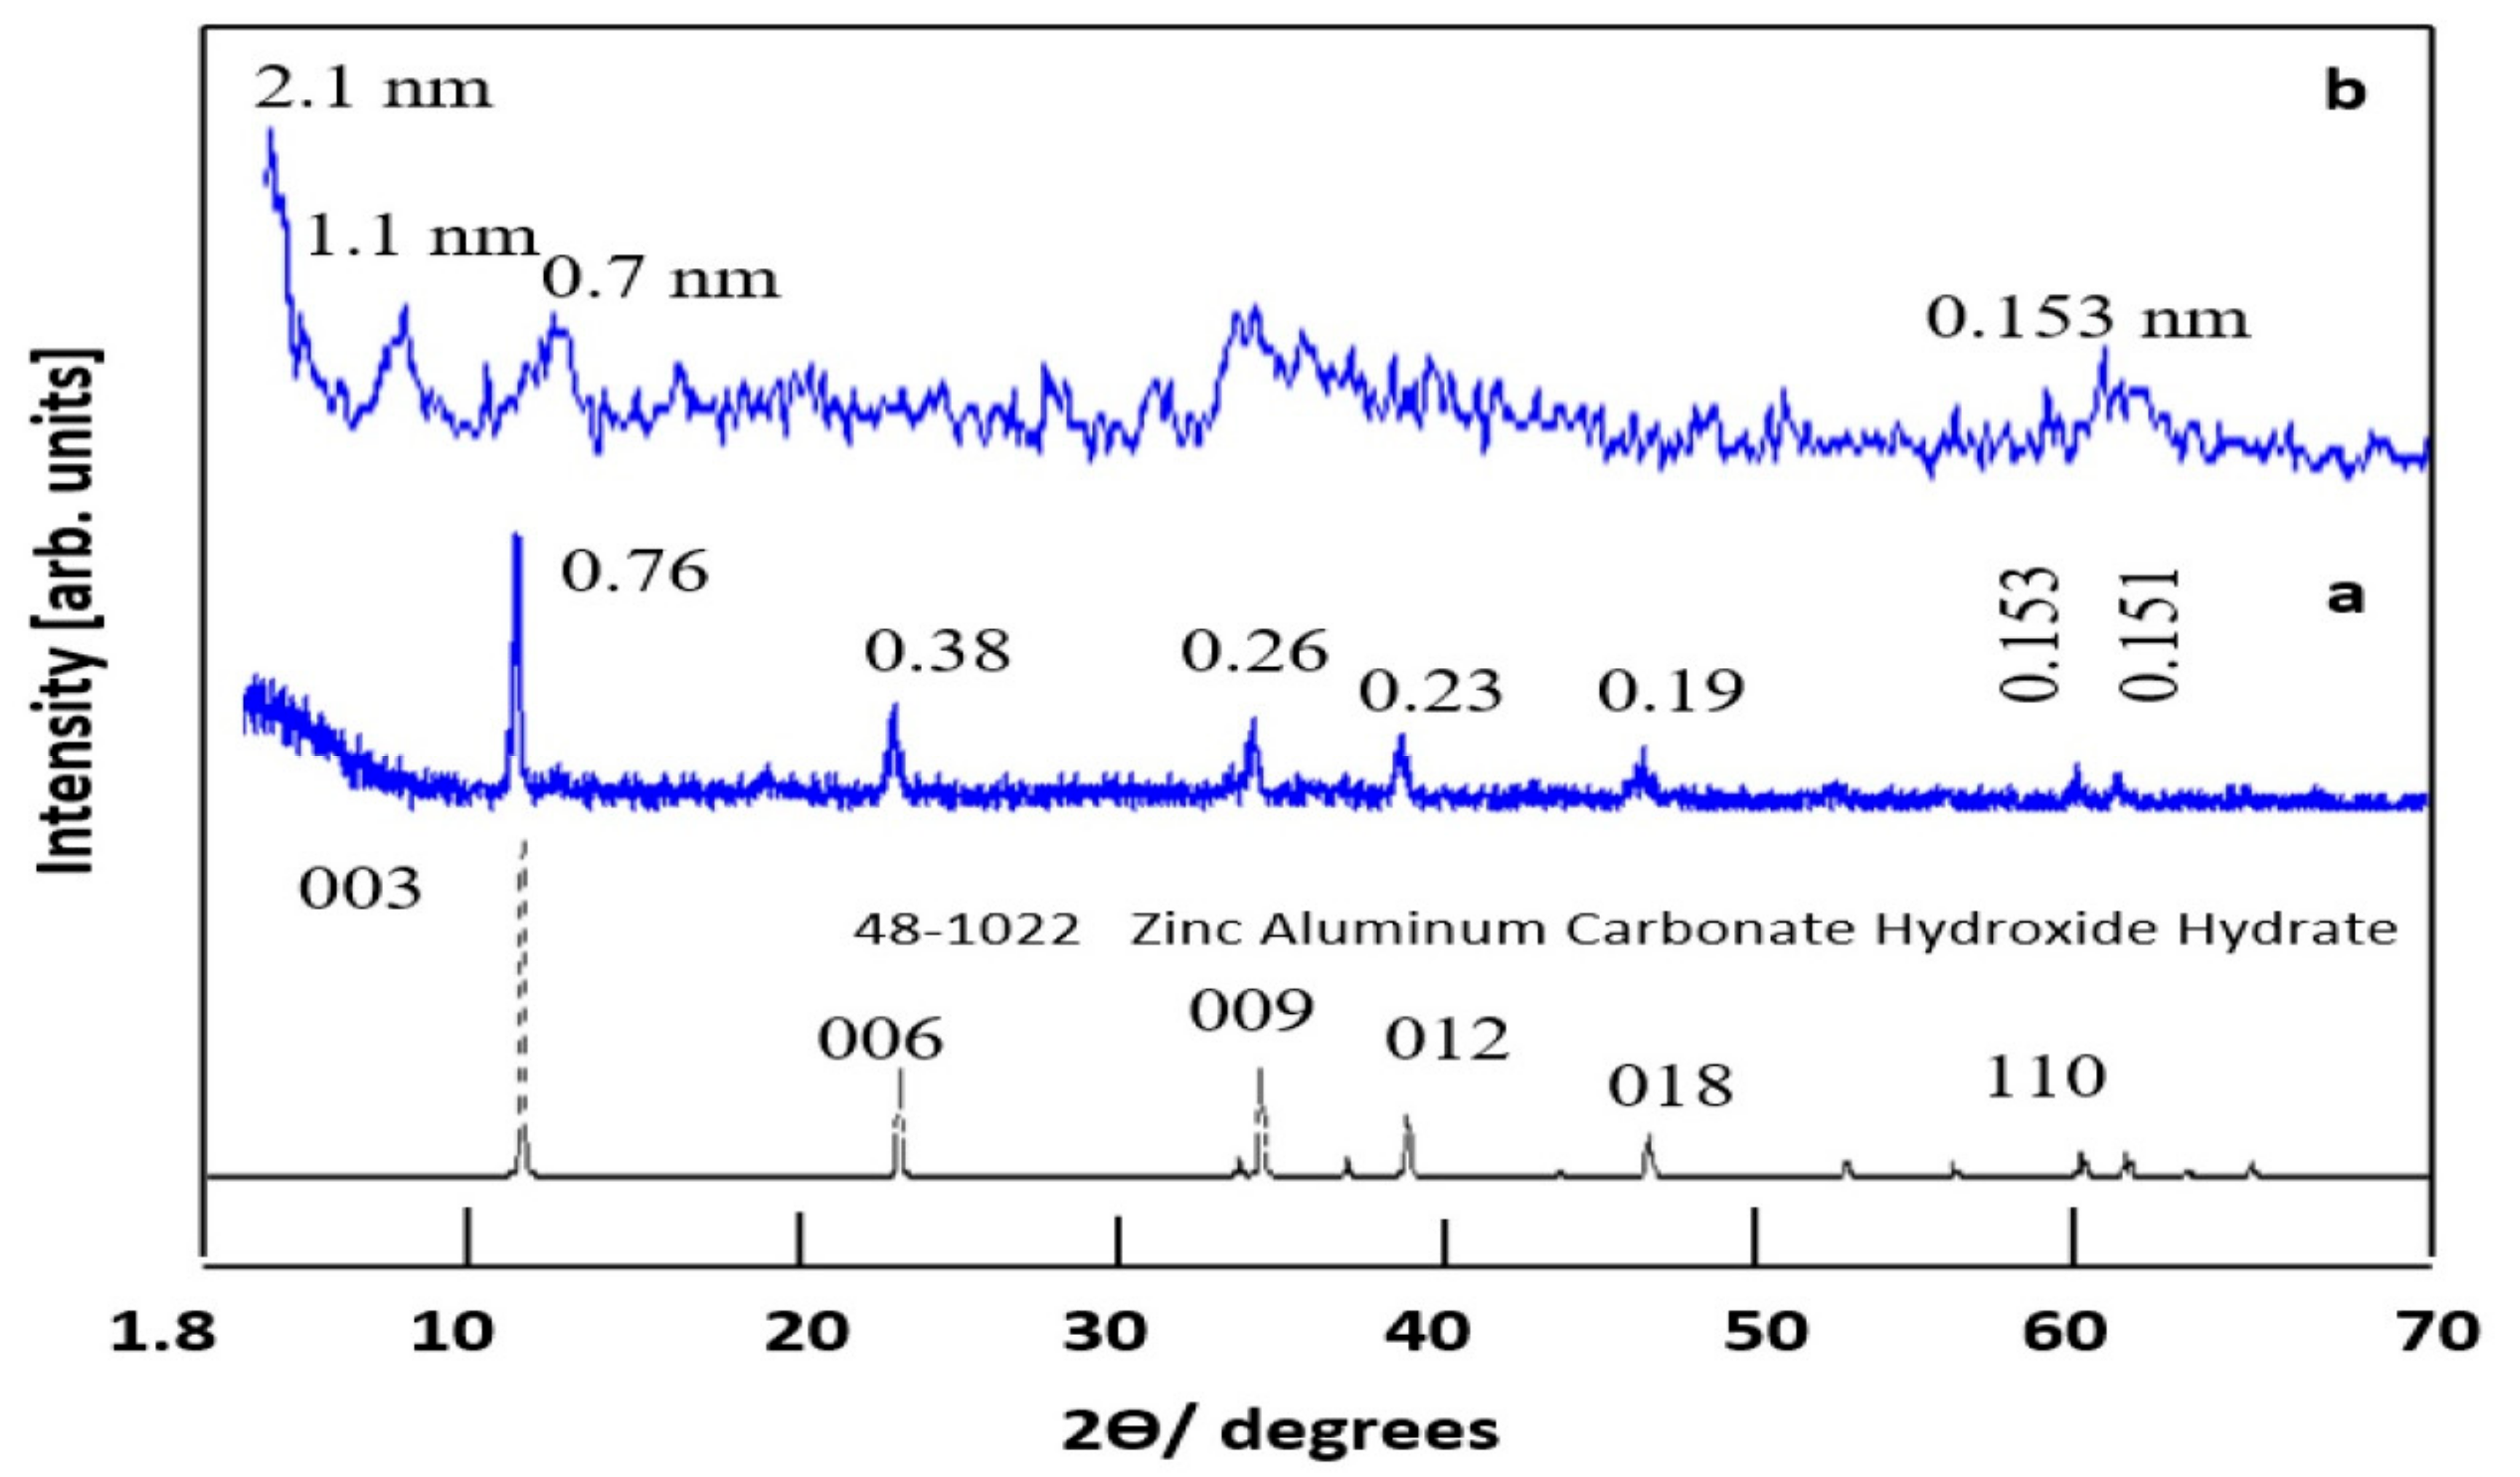
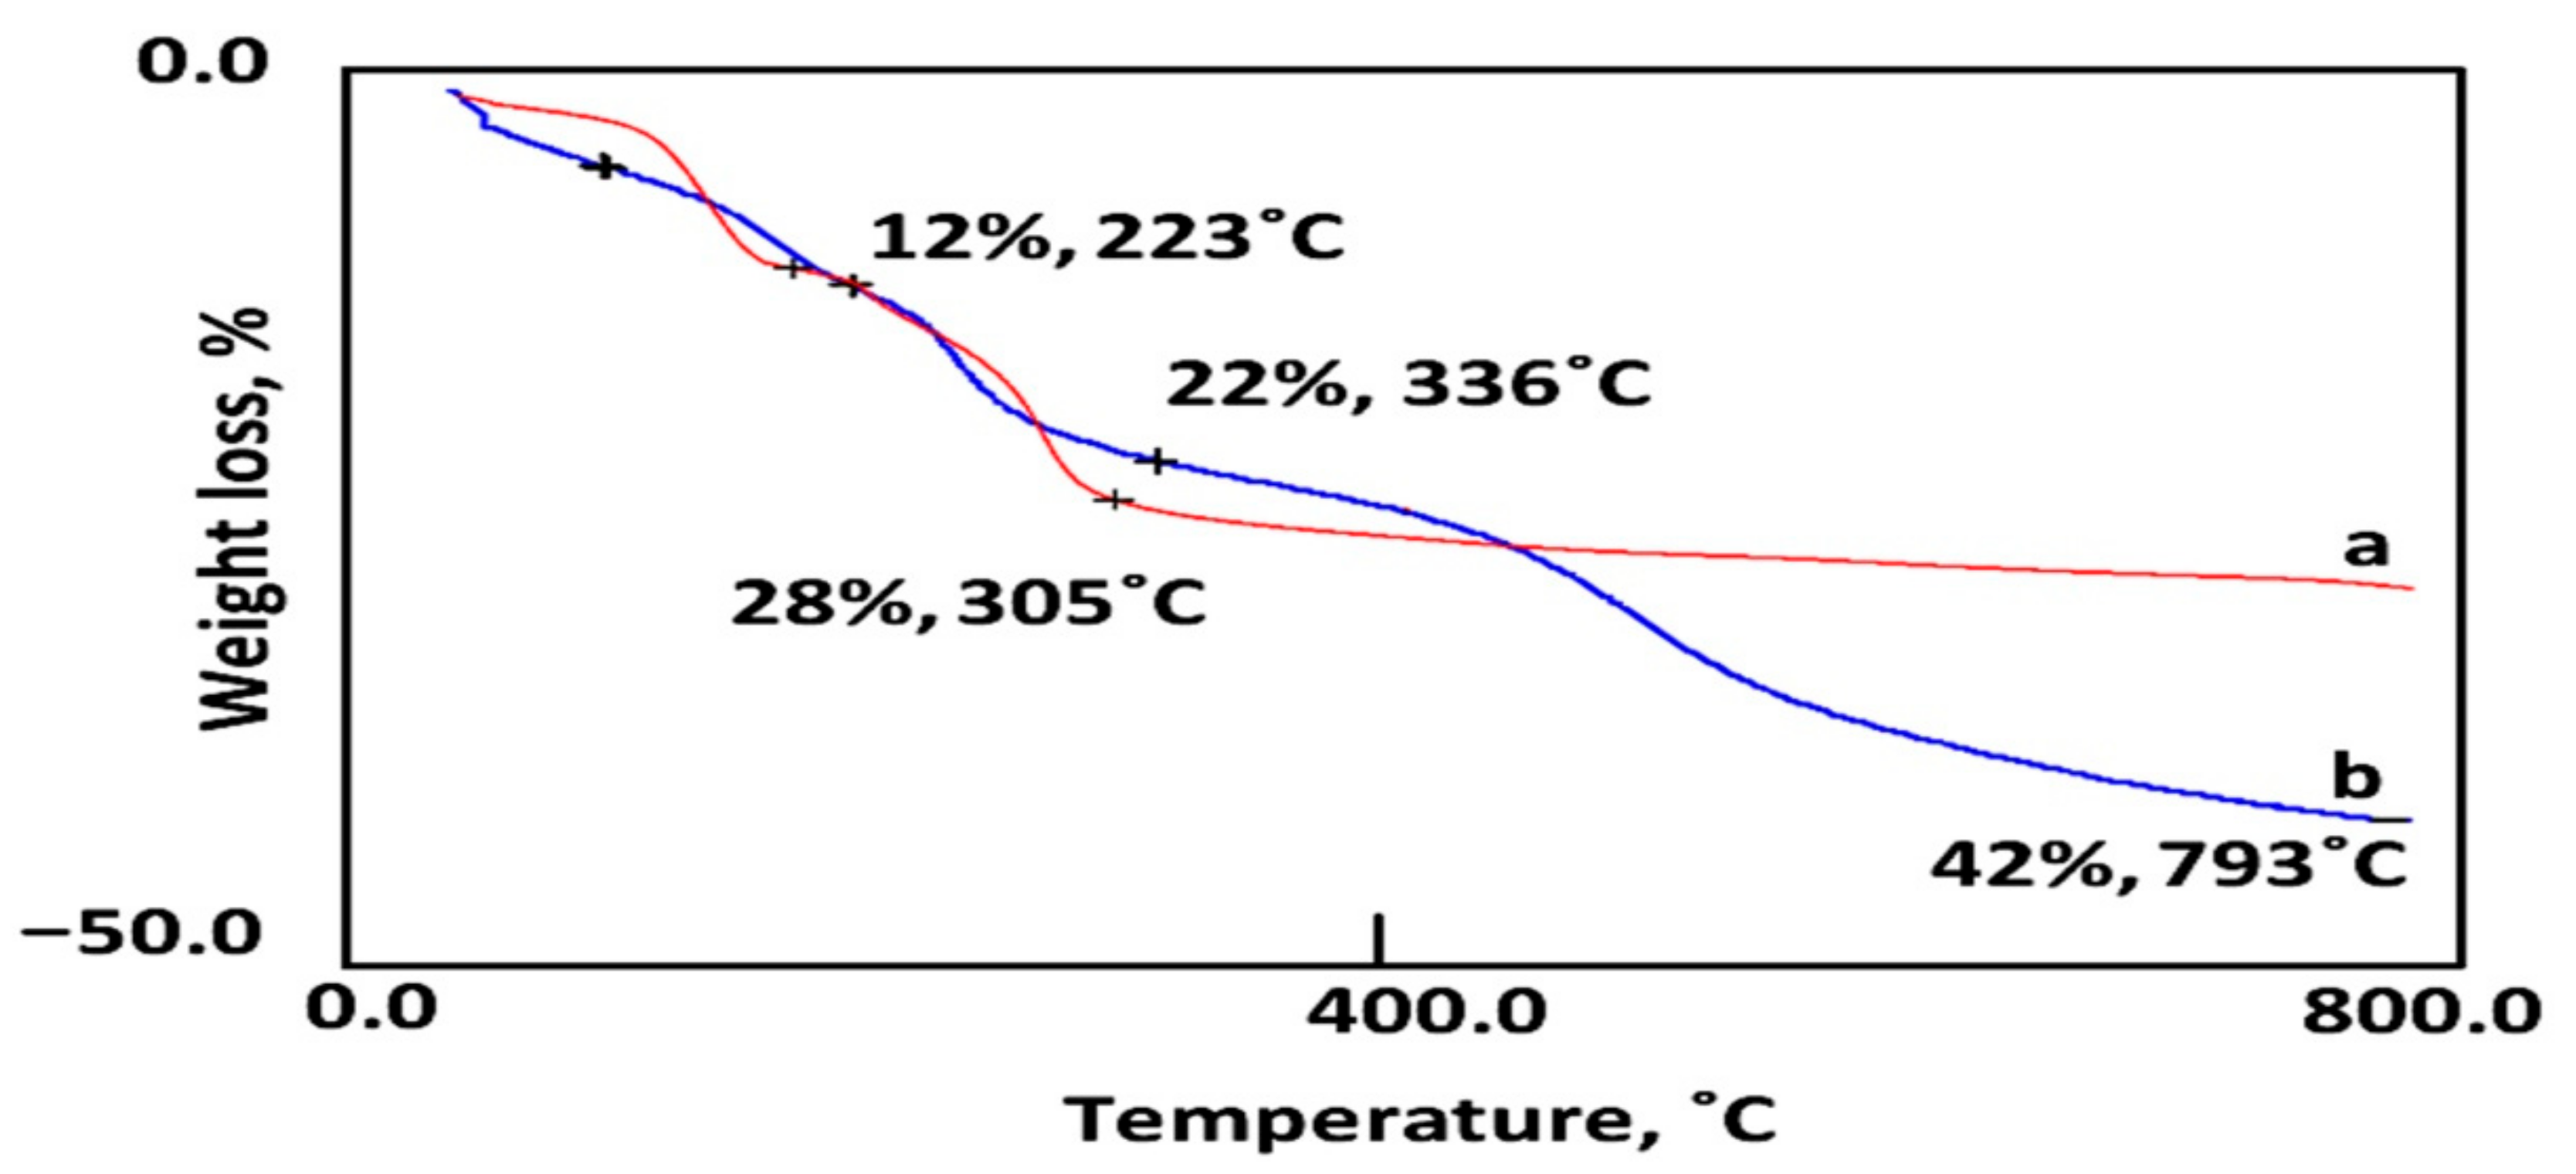
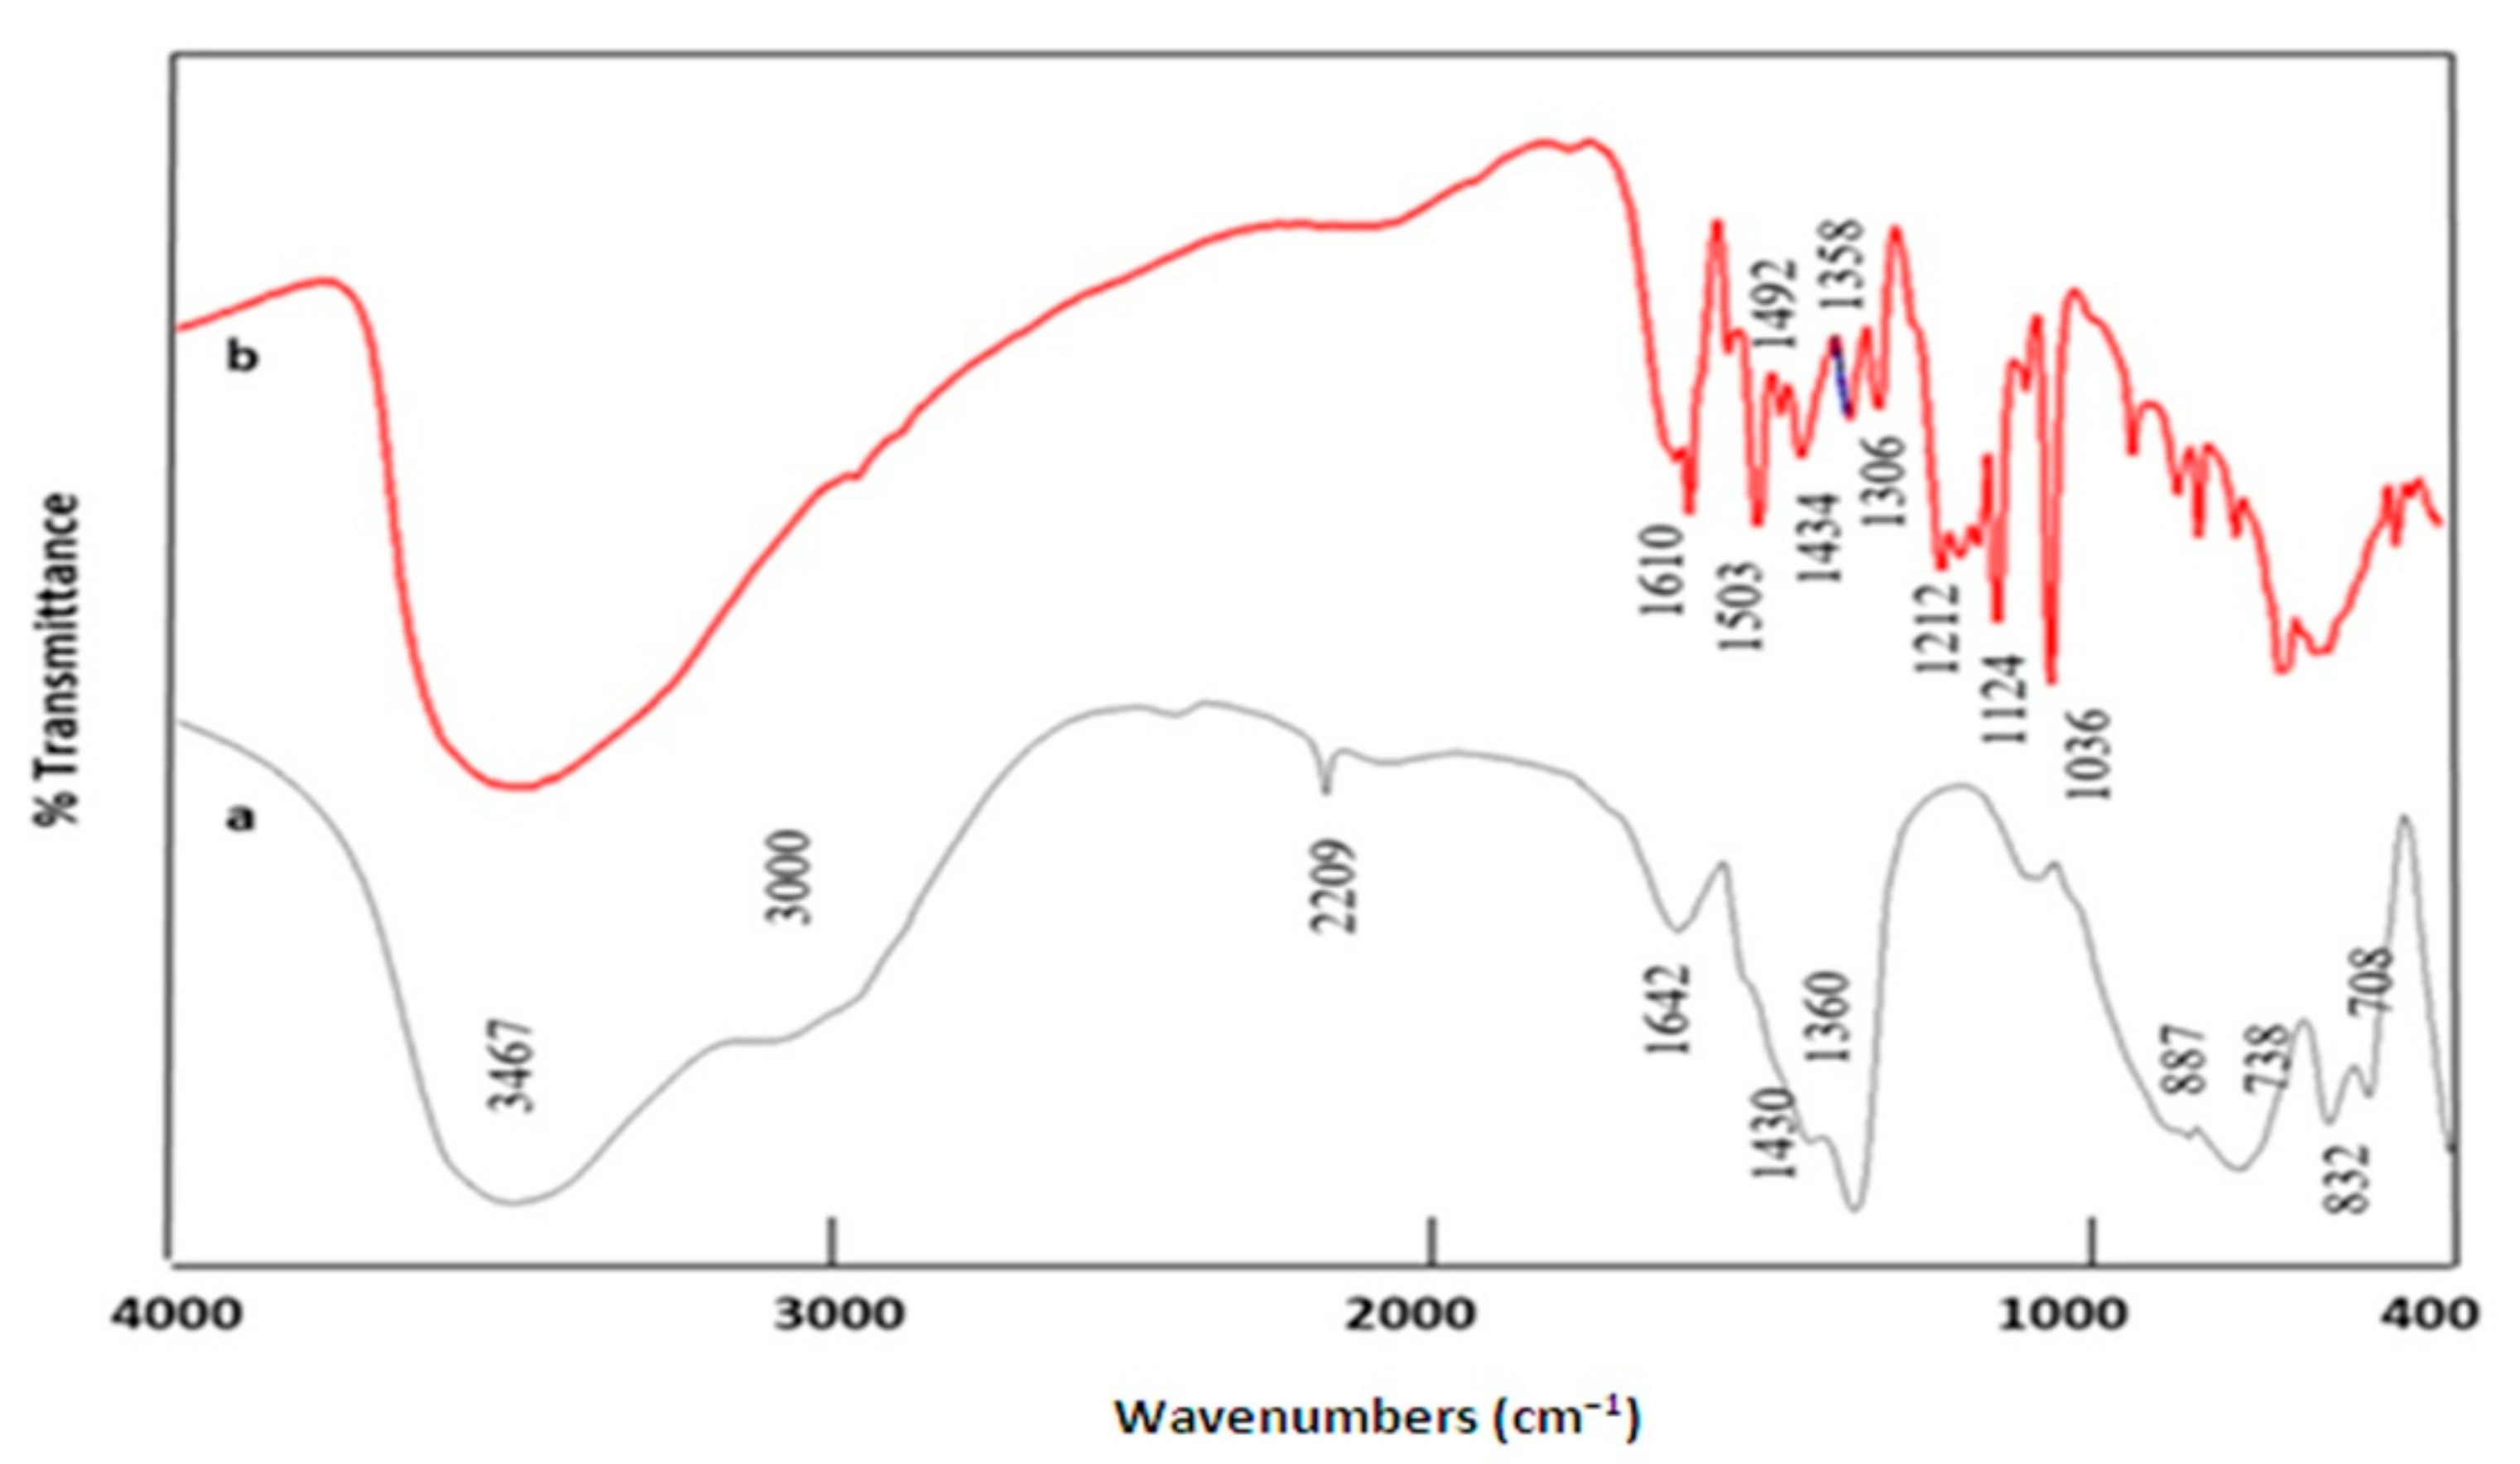
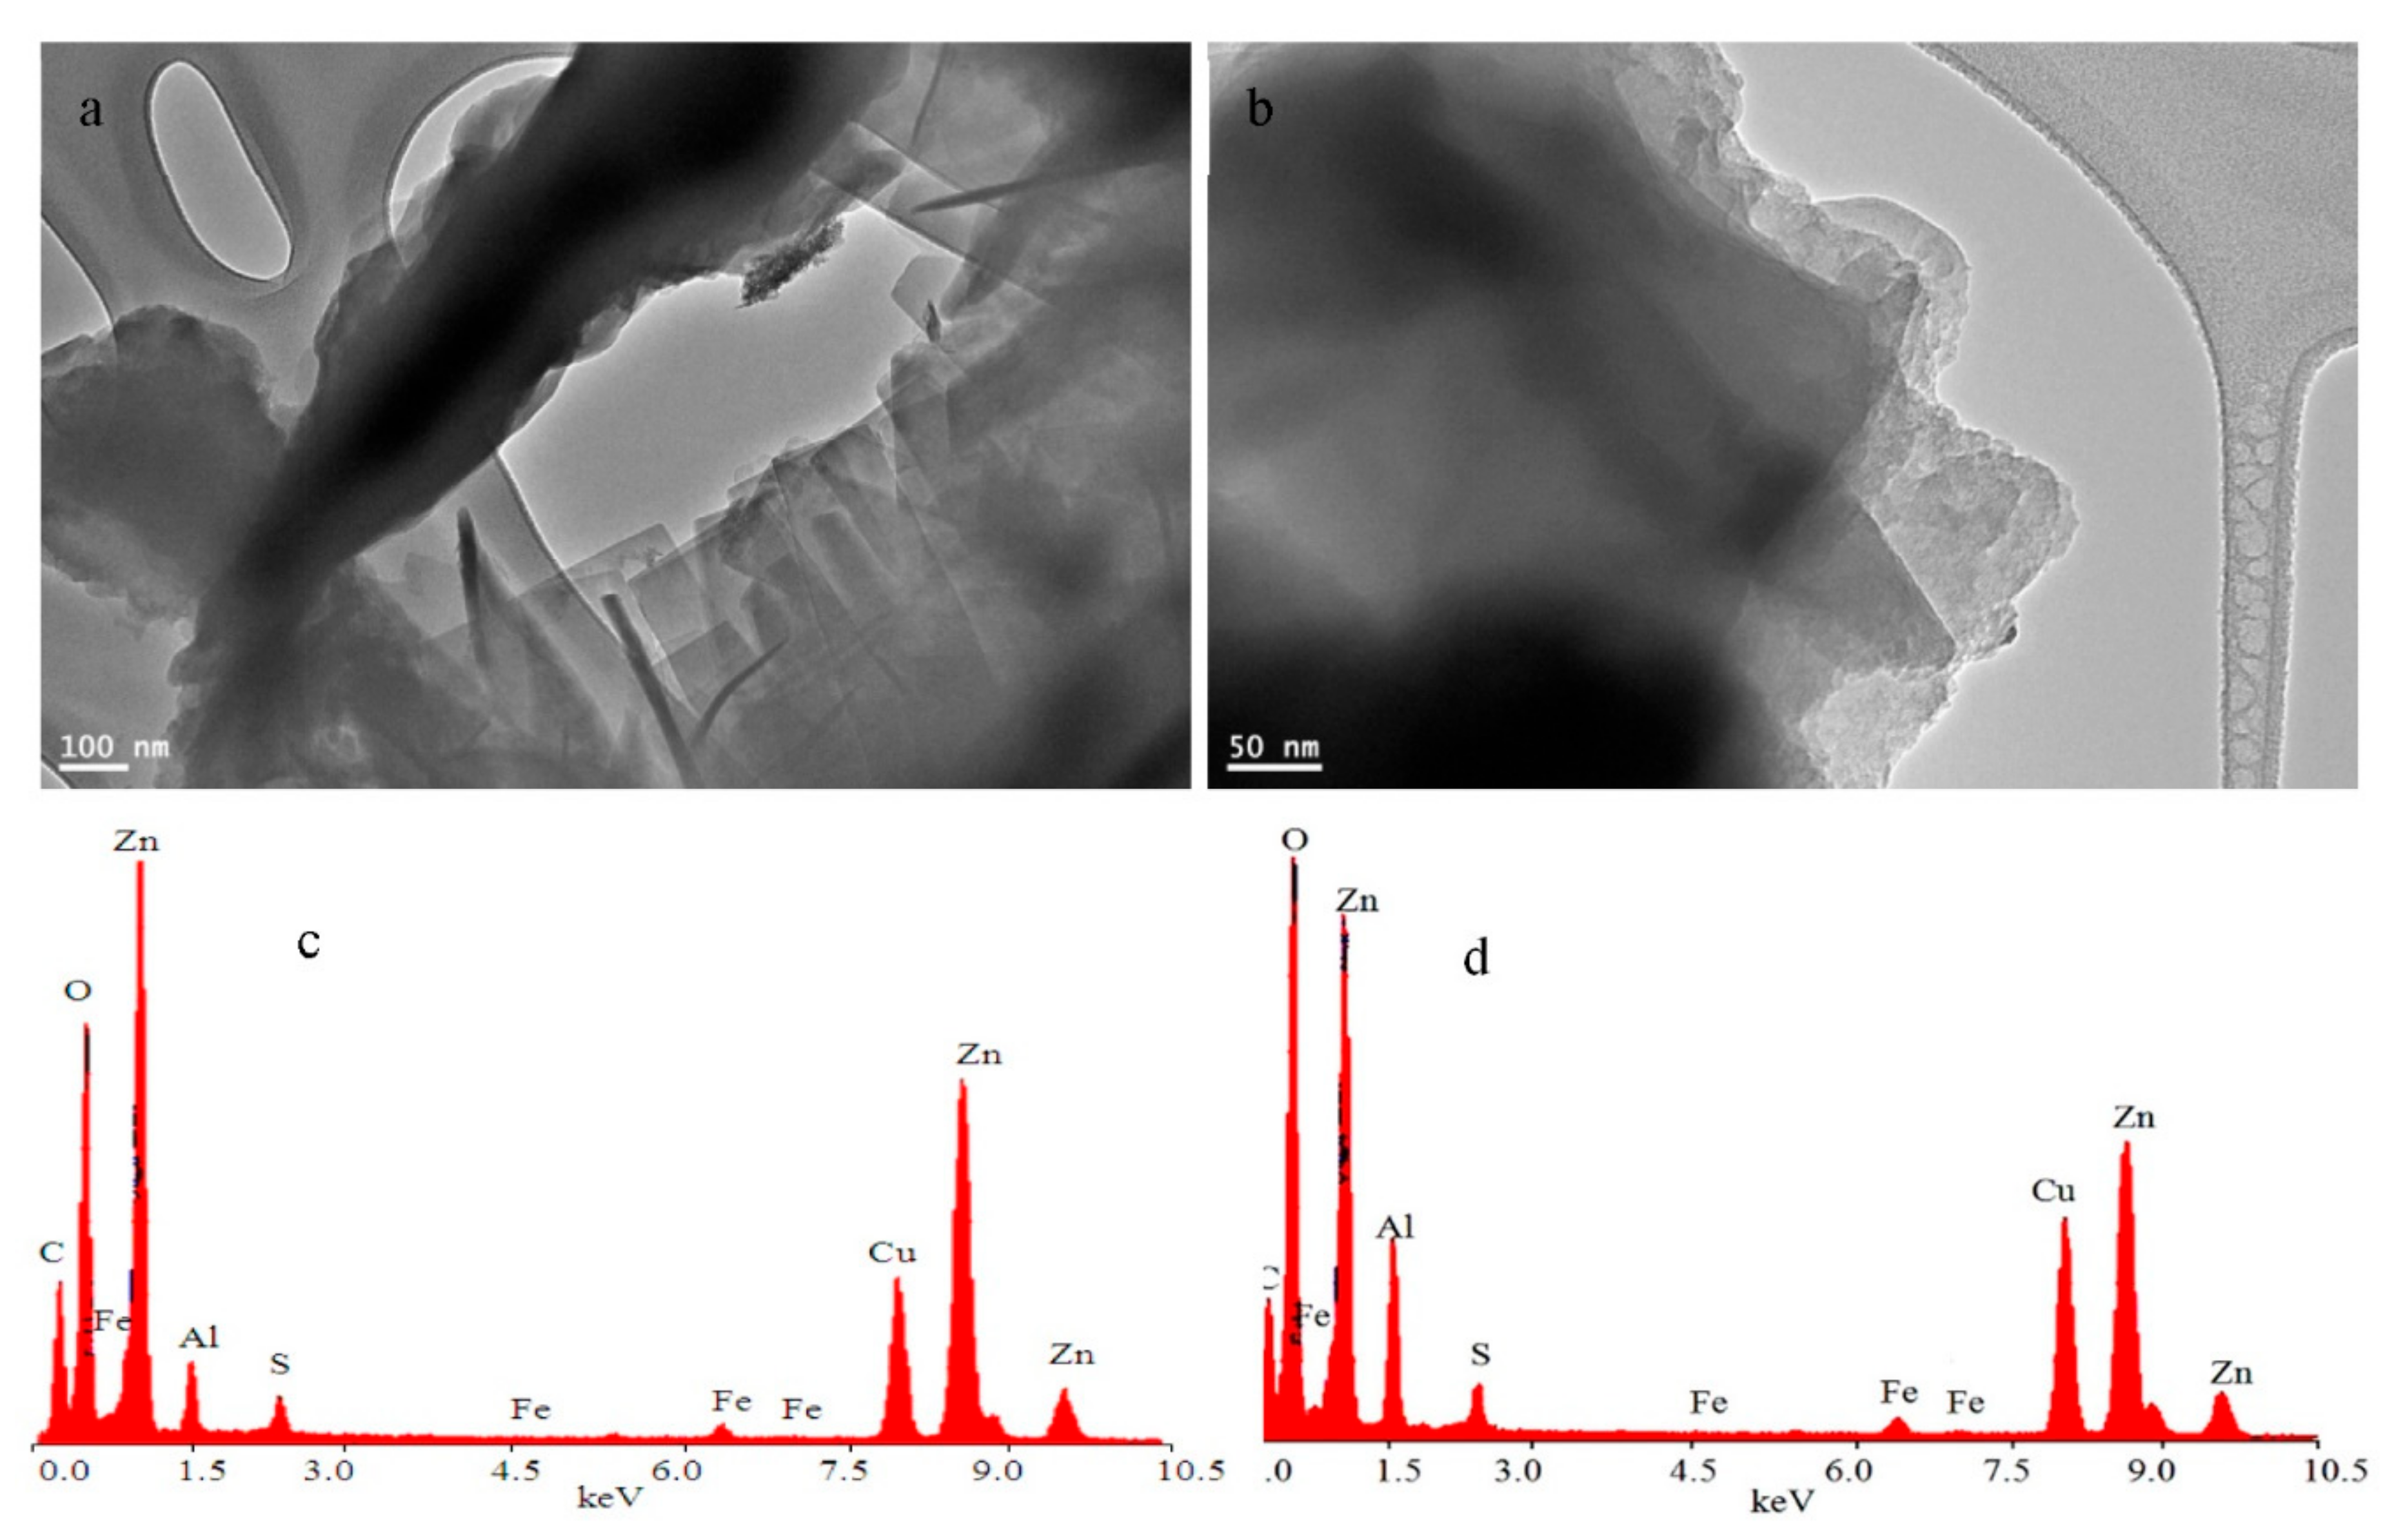
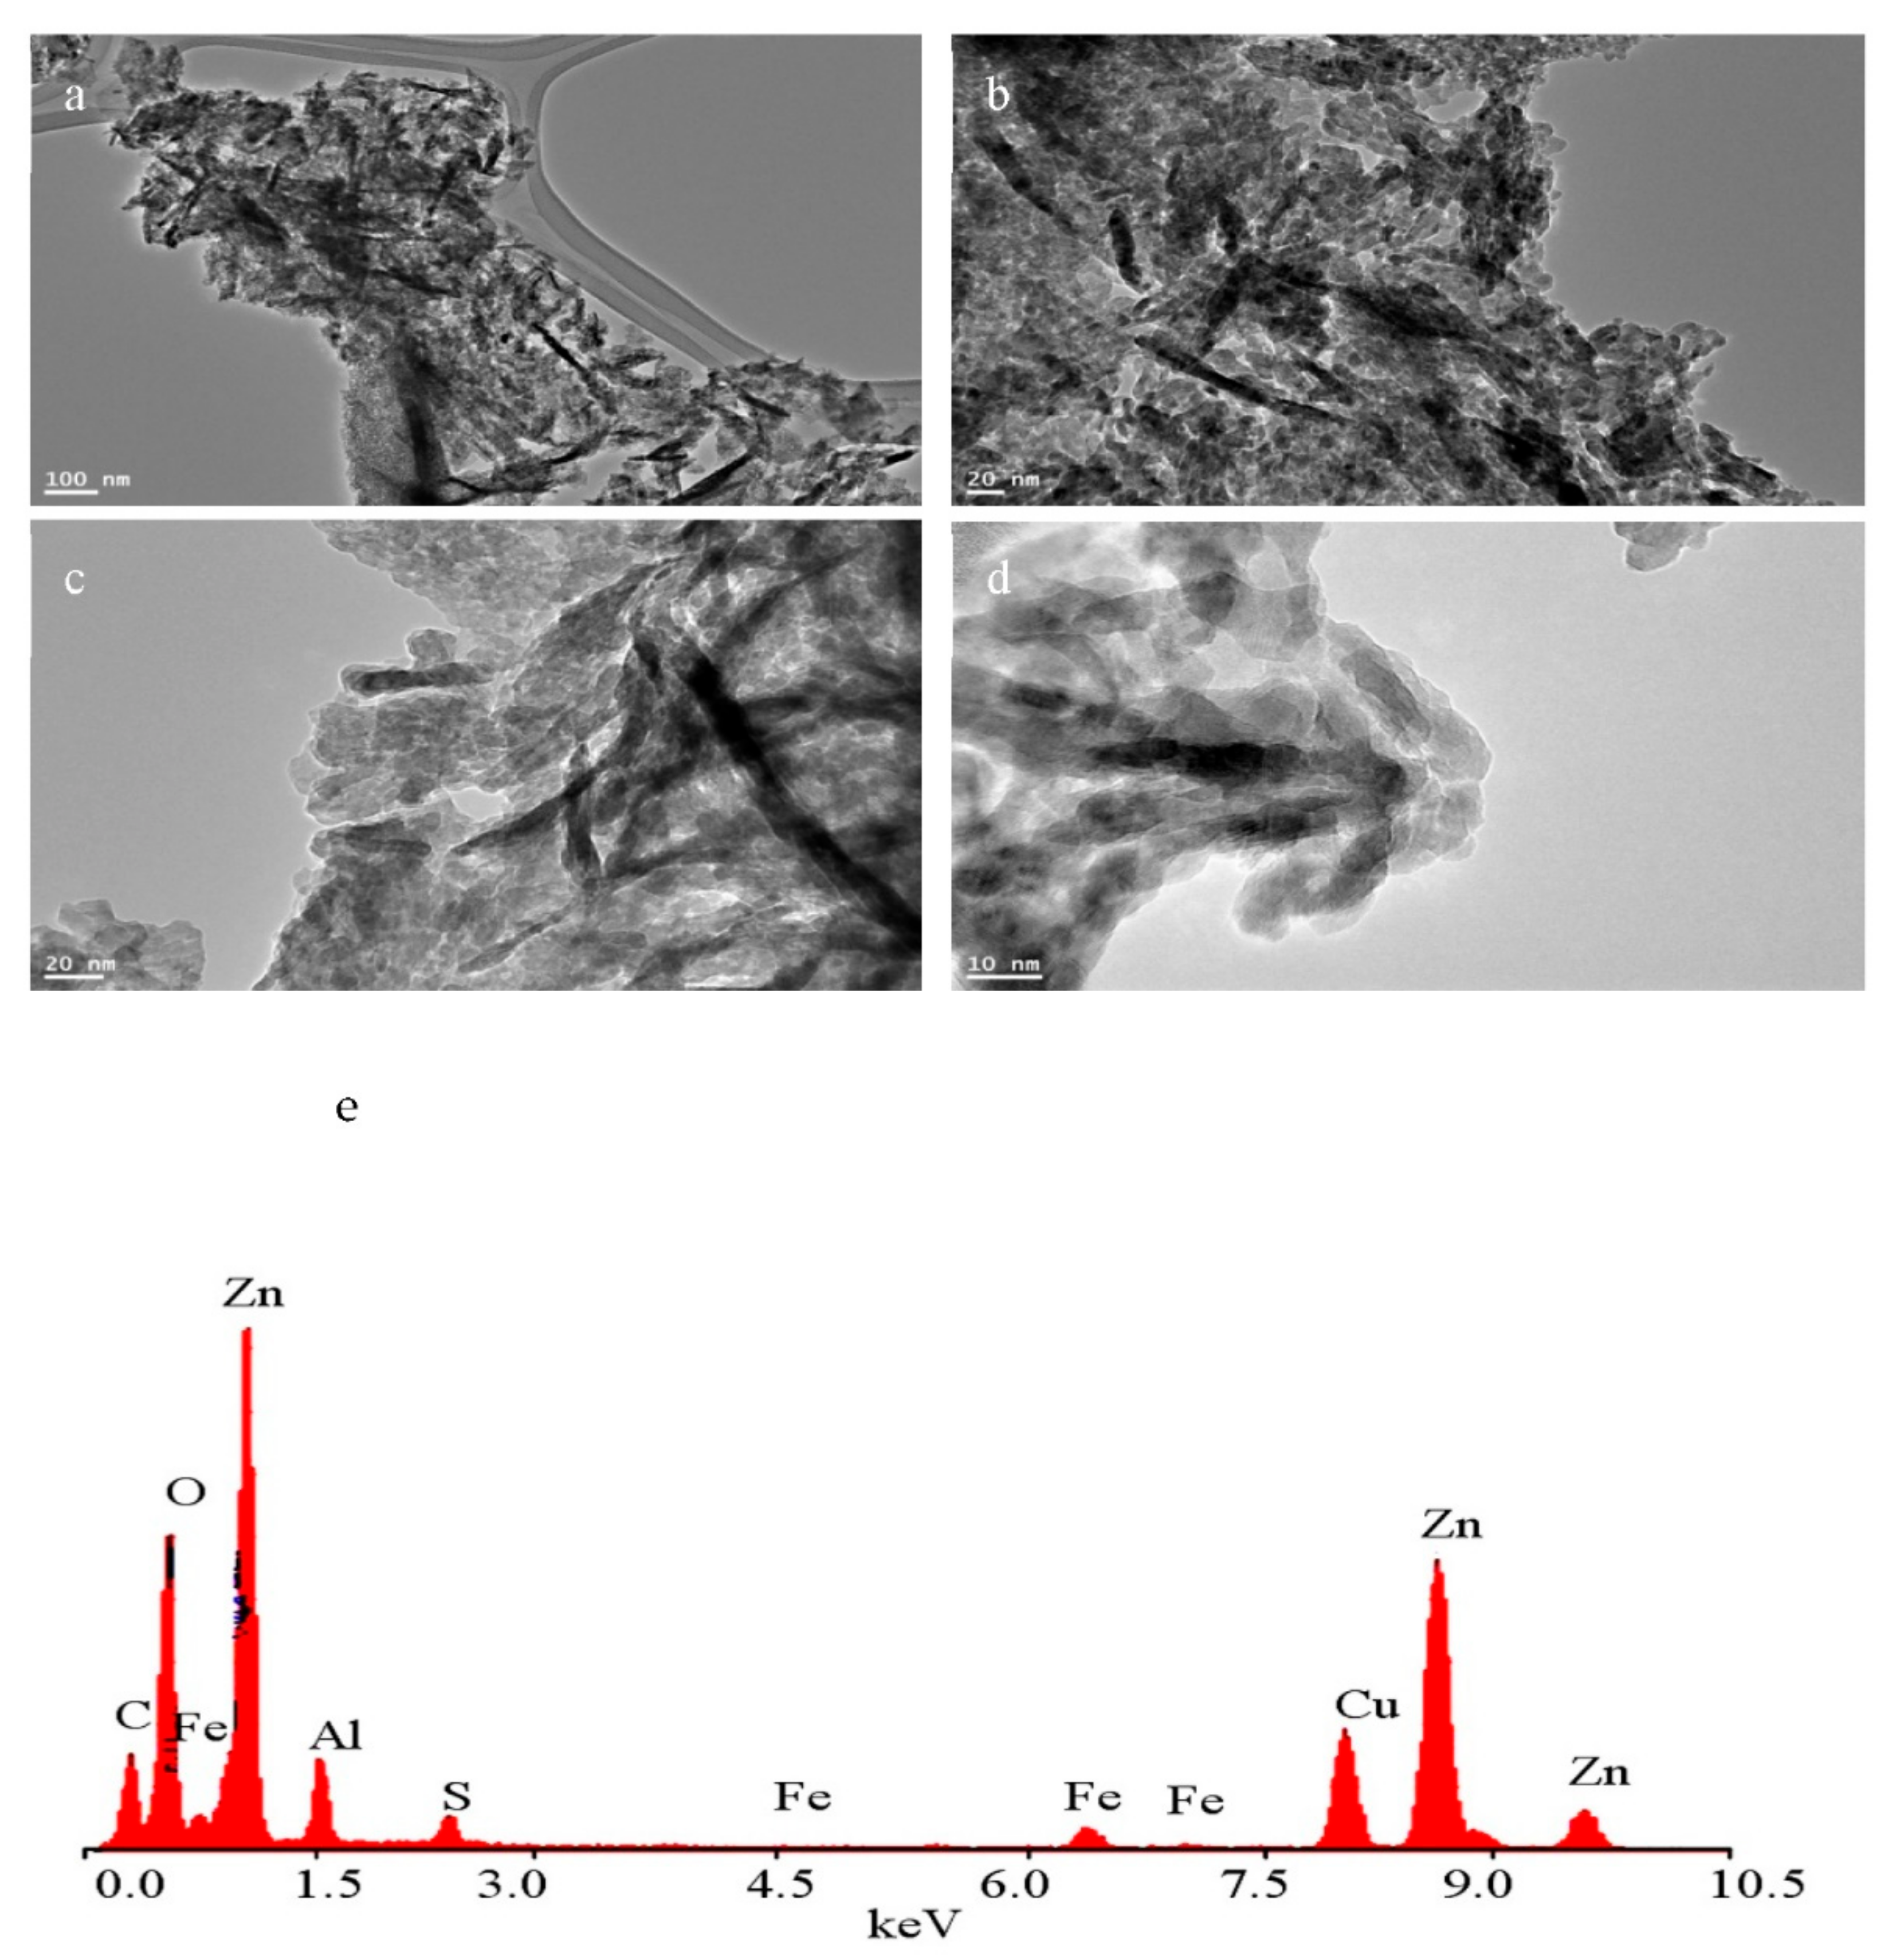
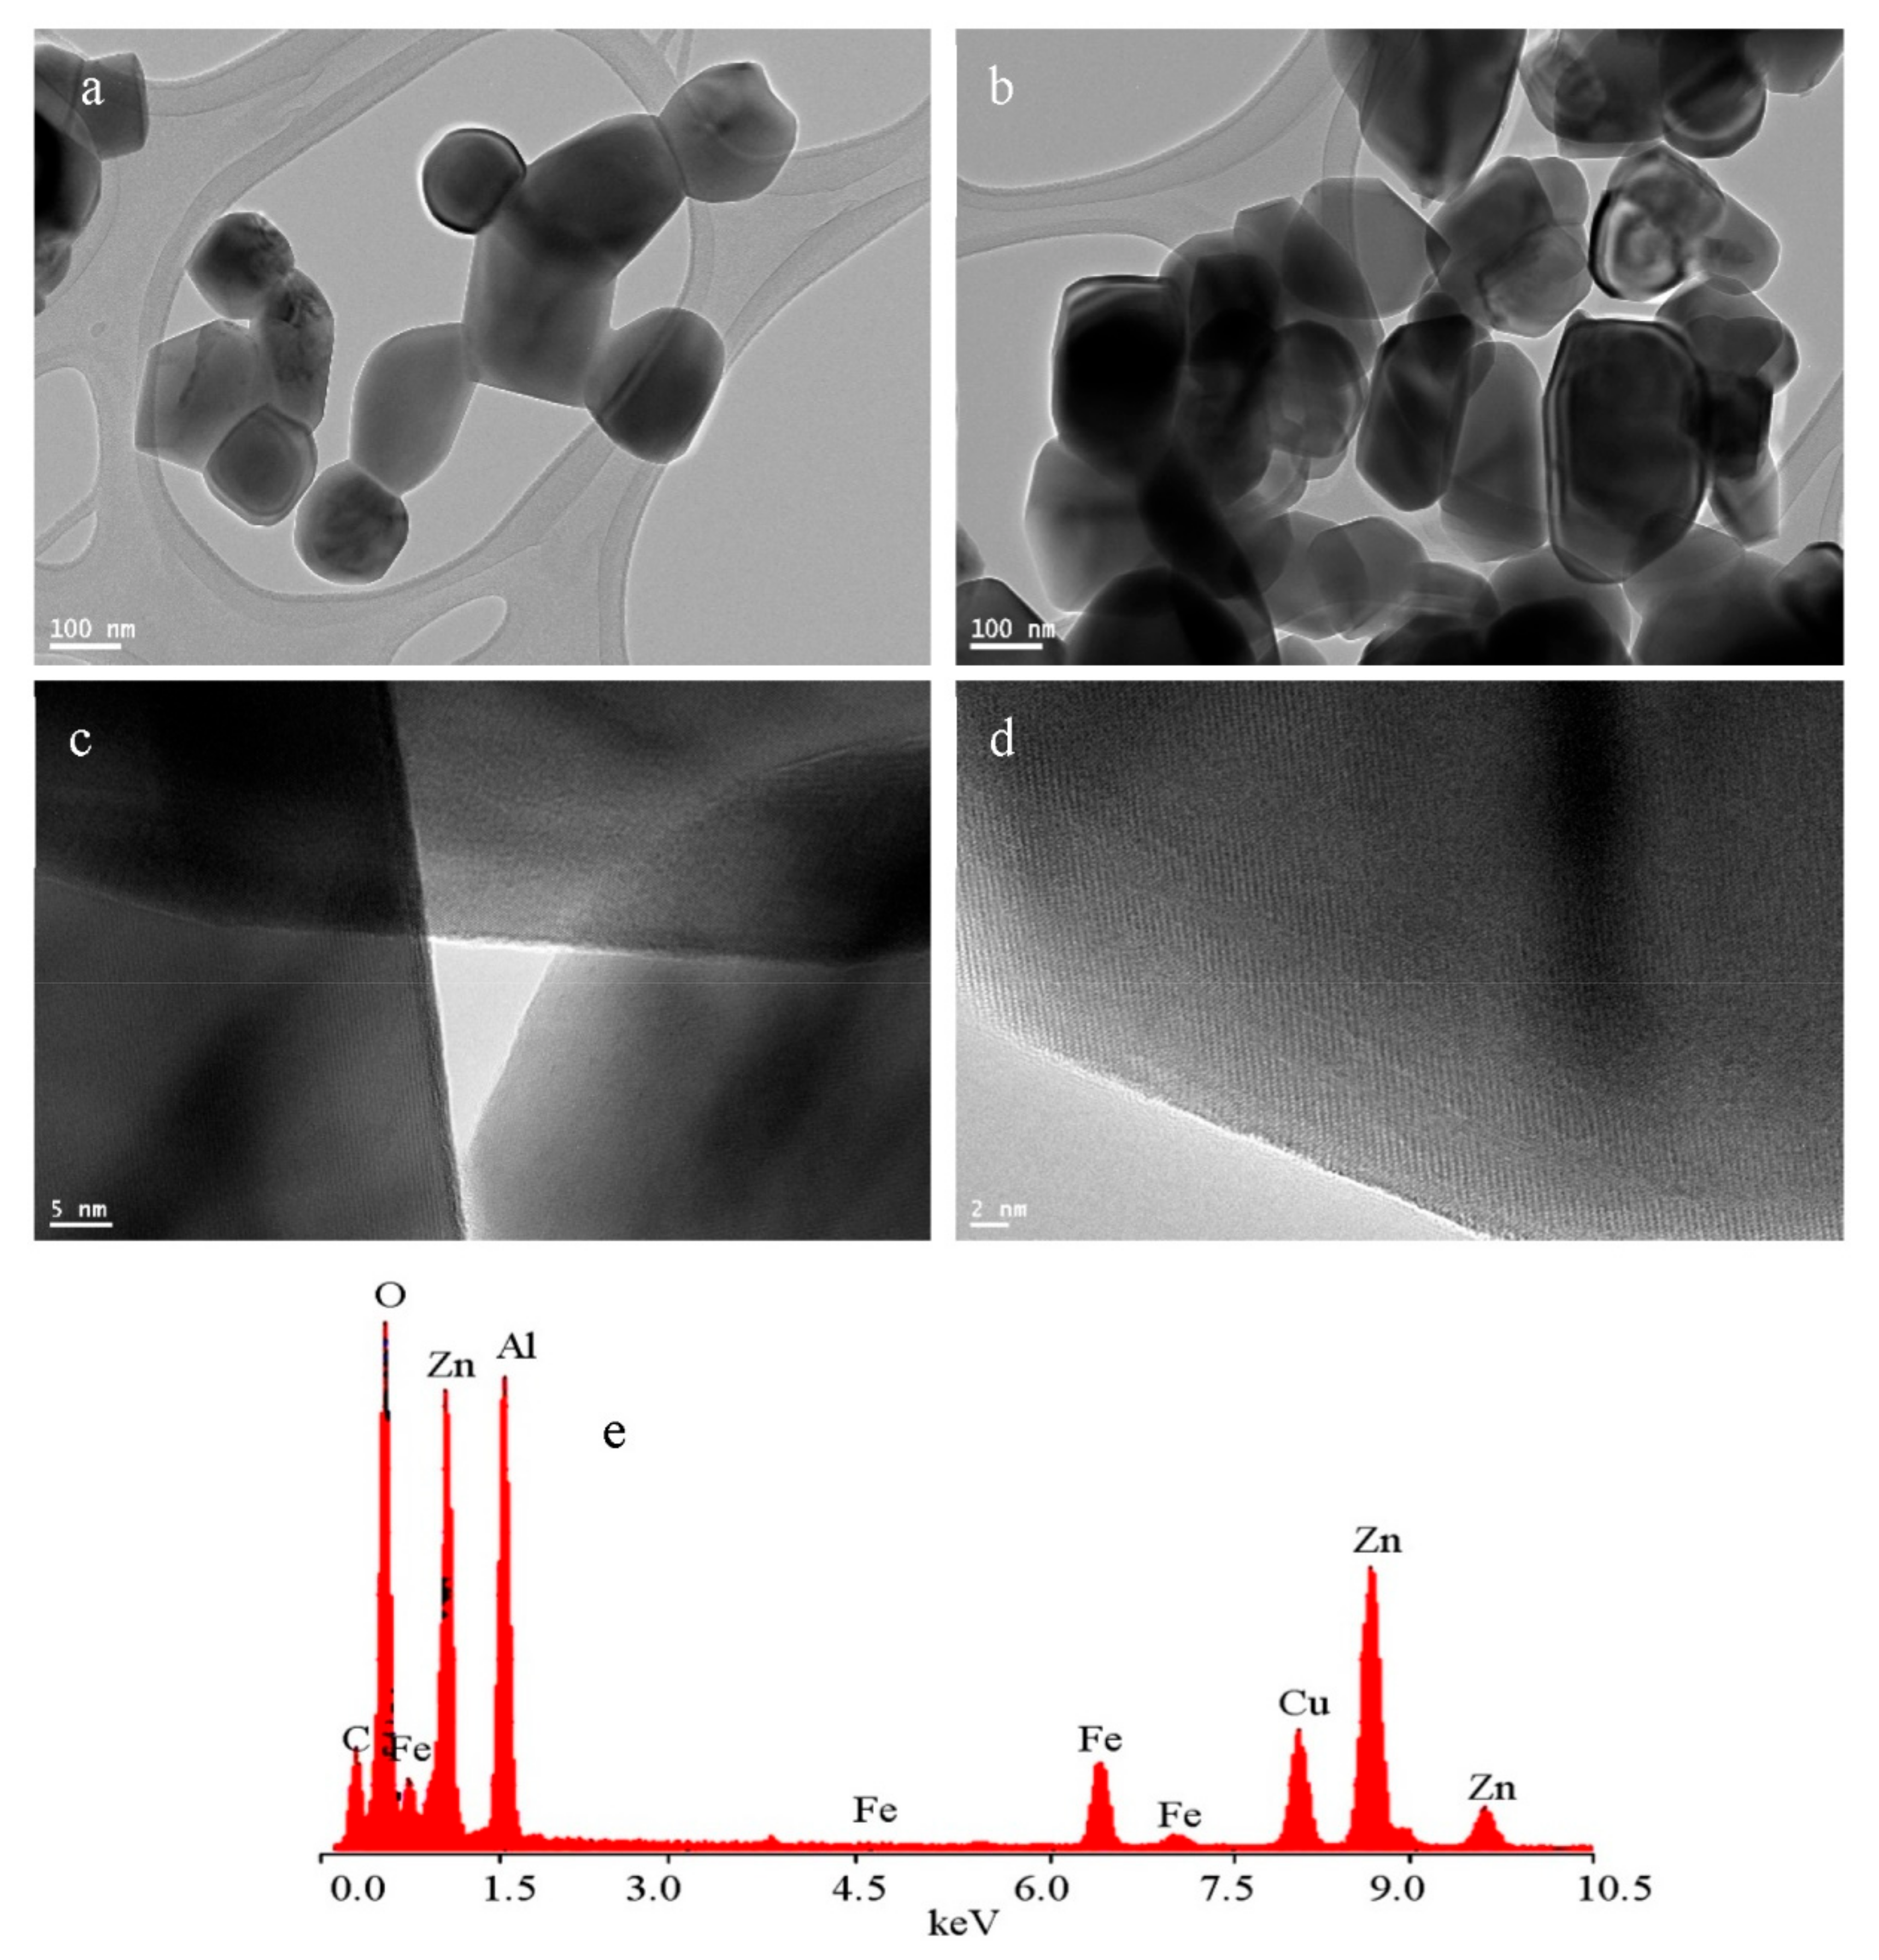
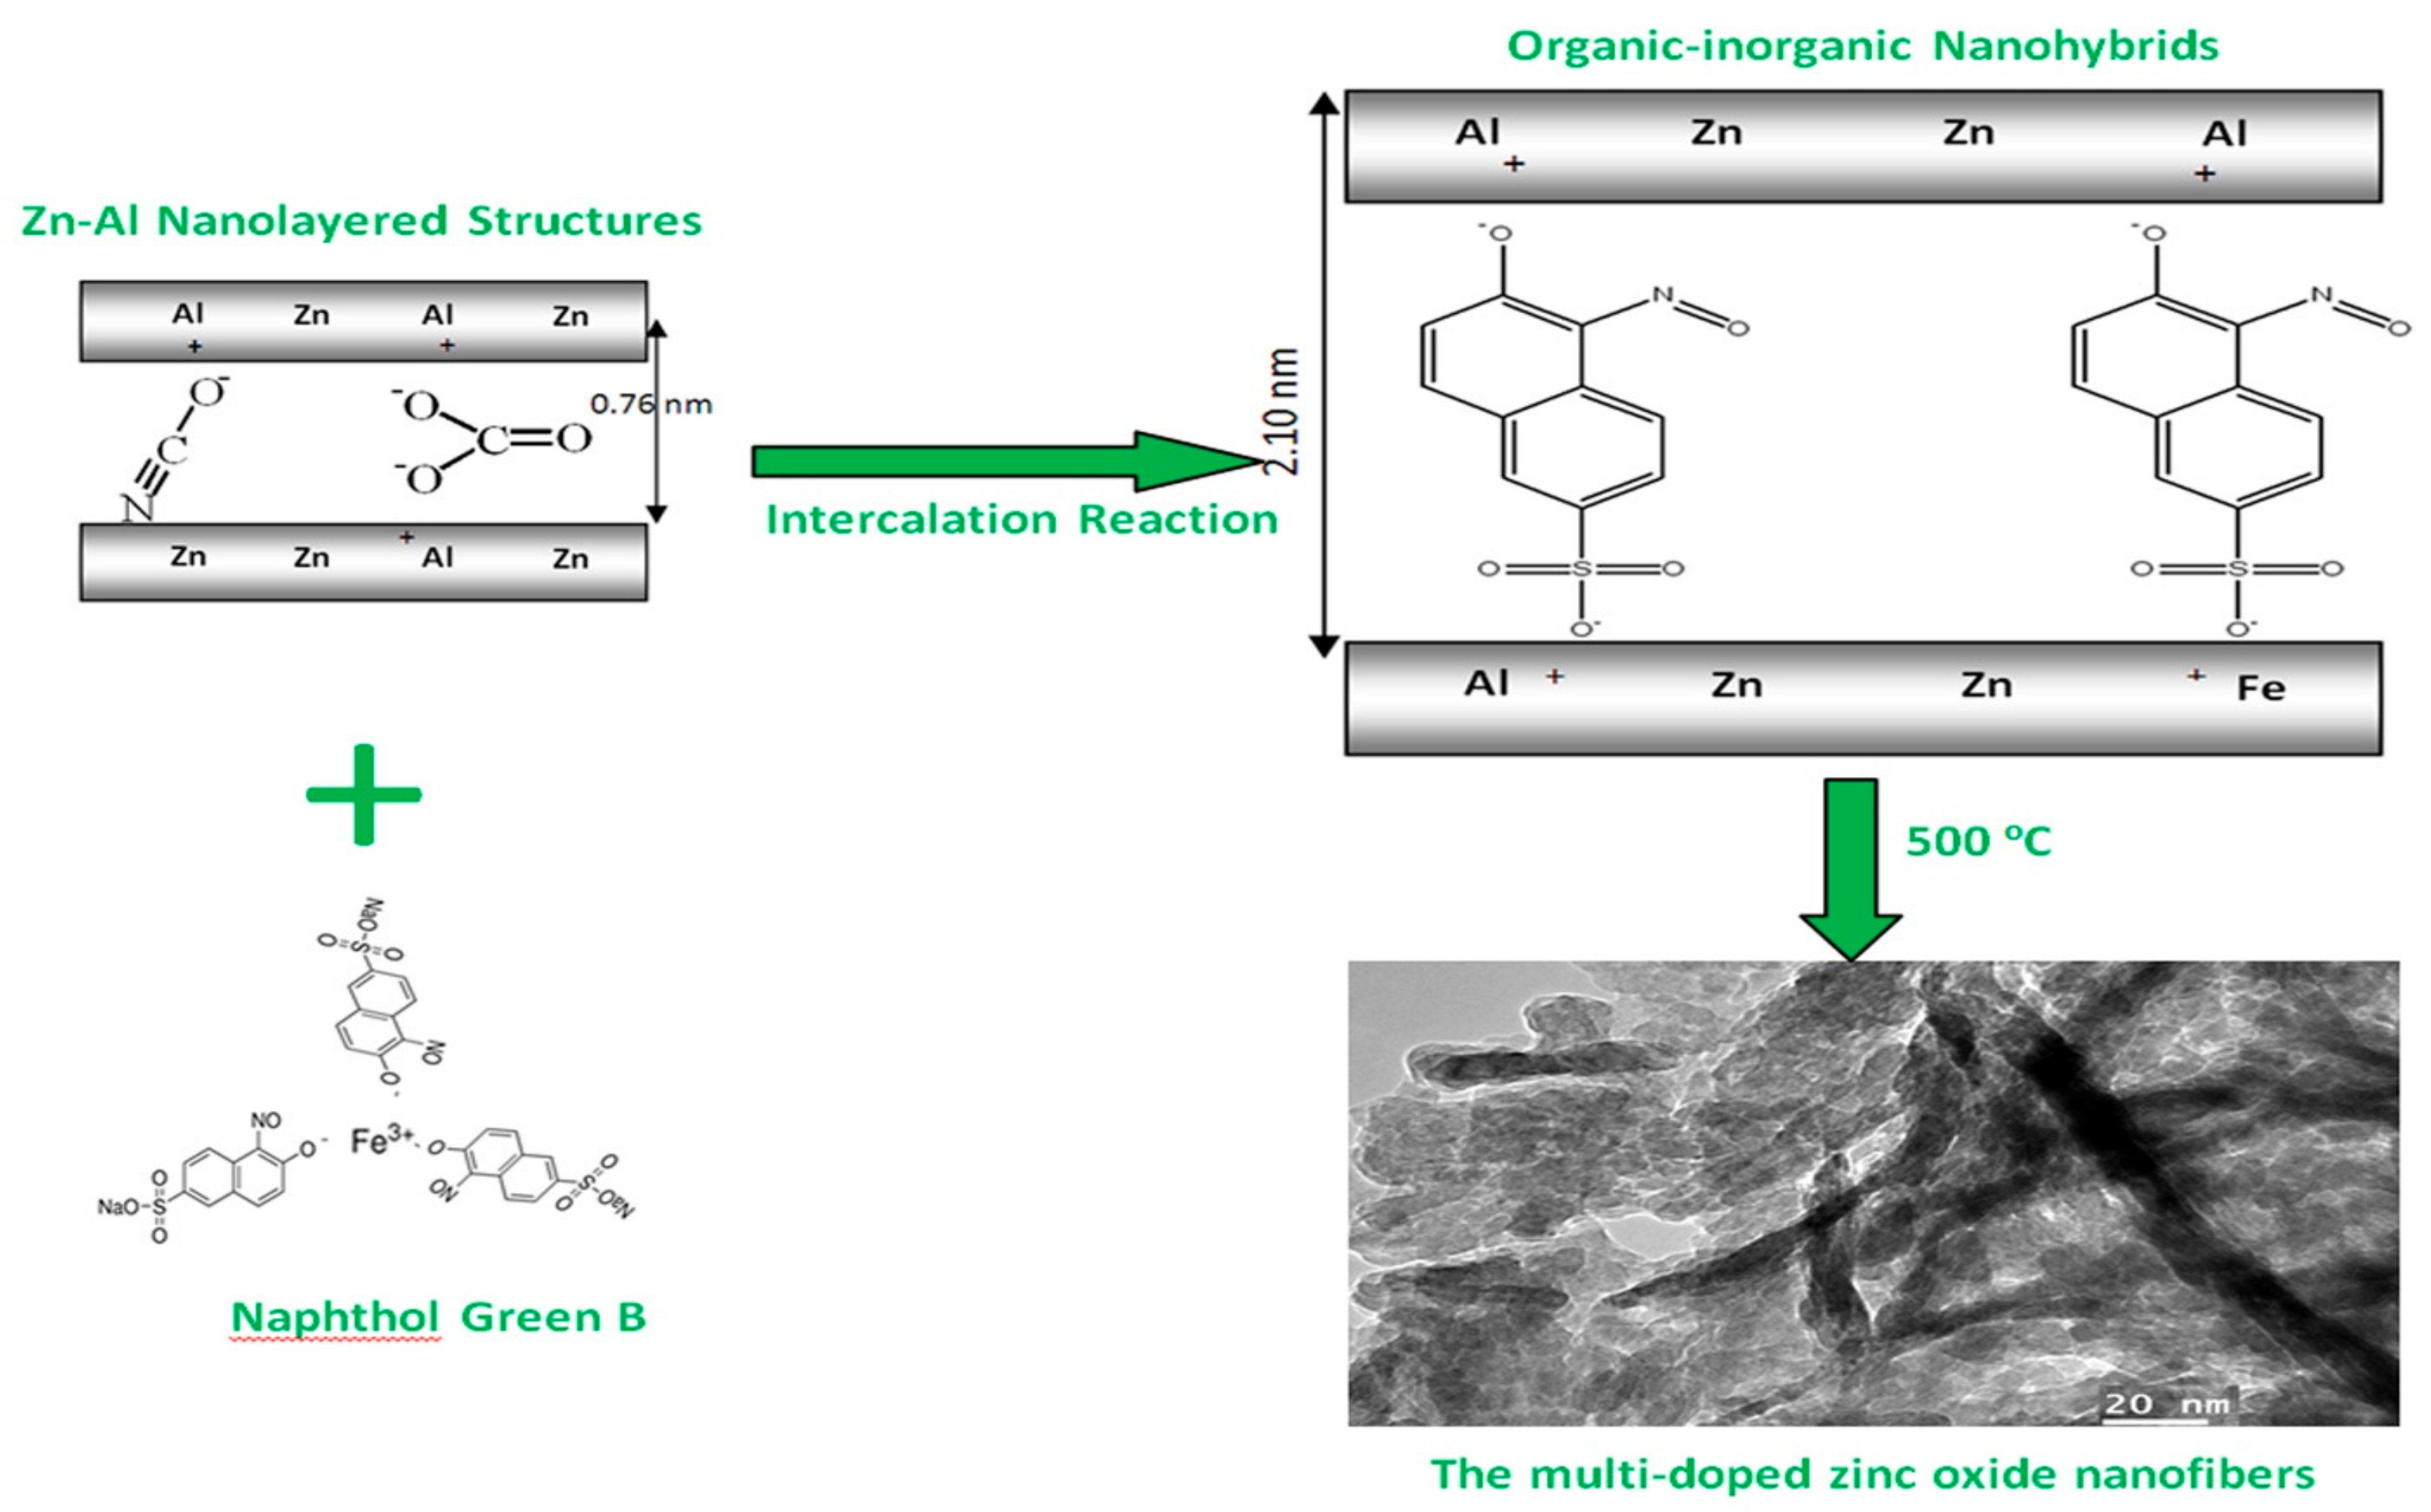
3.1. Host–Guest Interactions for Building Nanohybrids
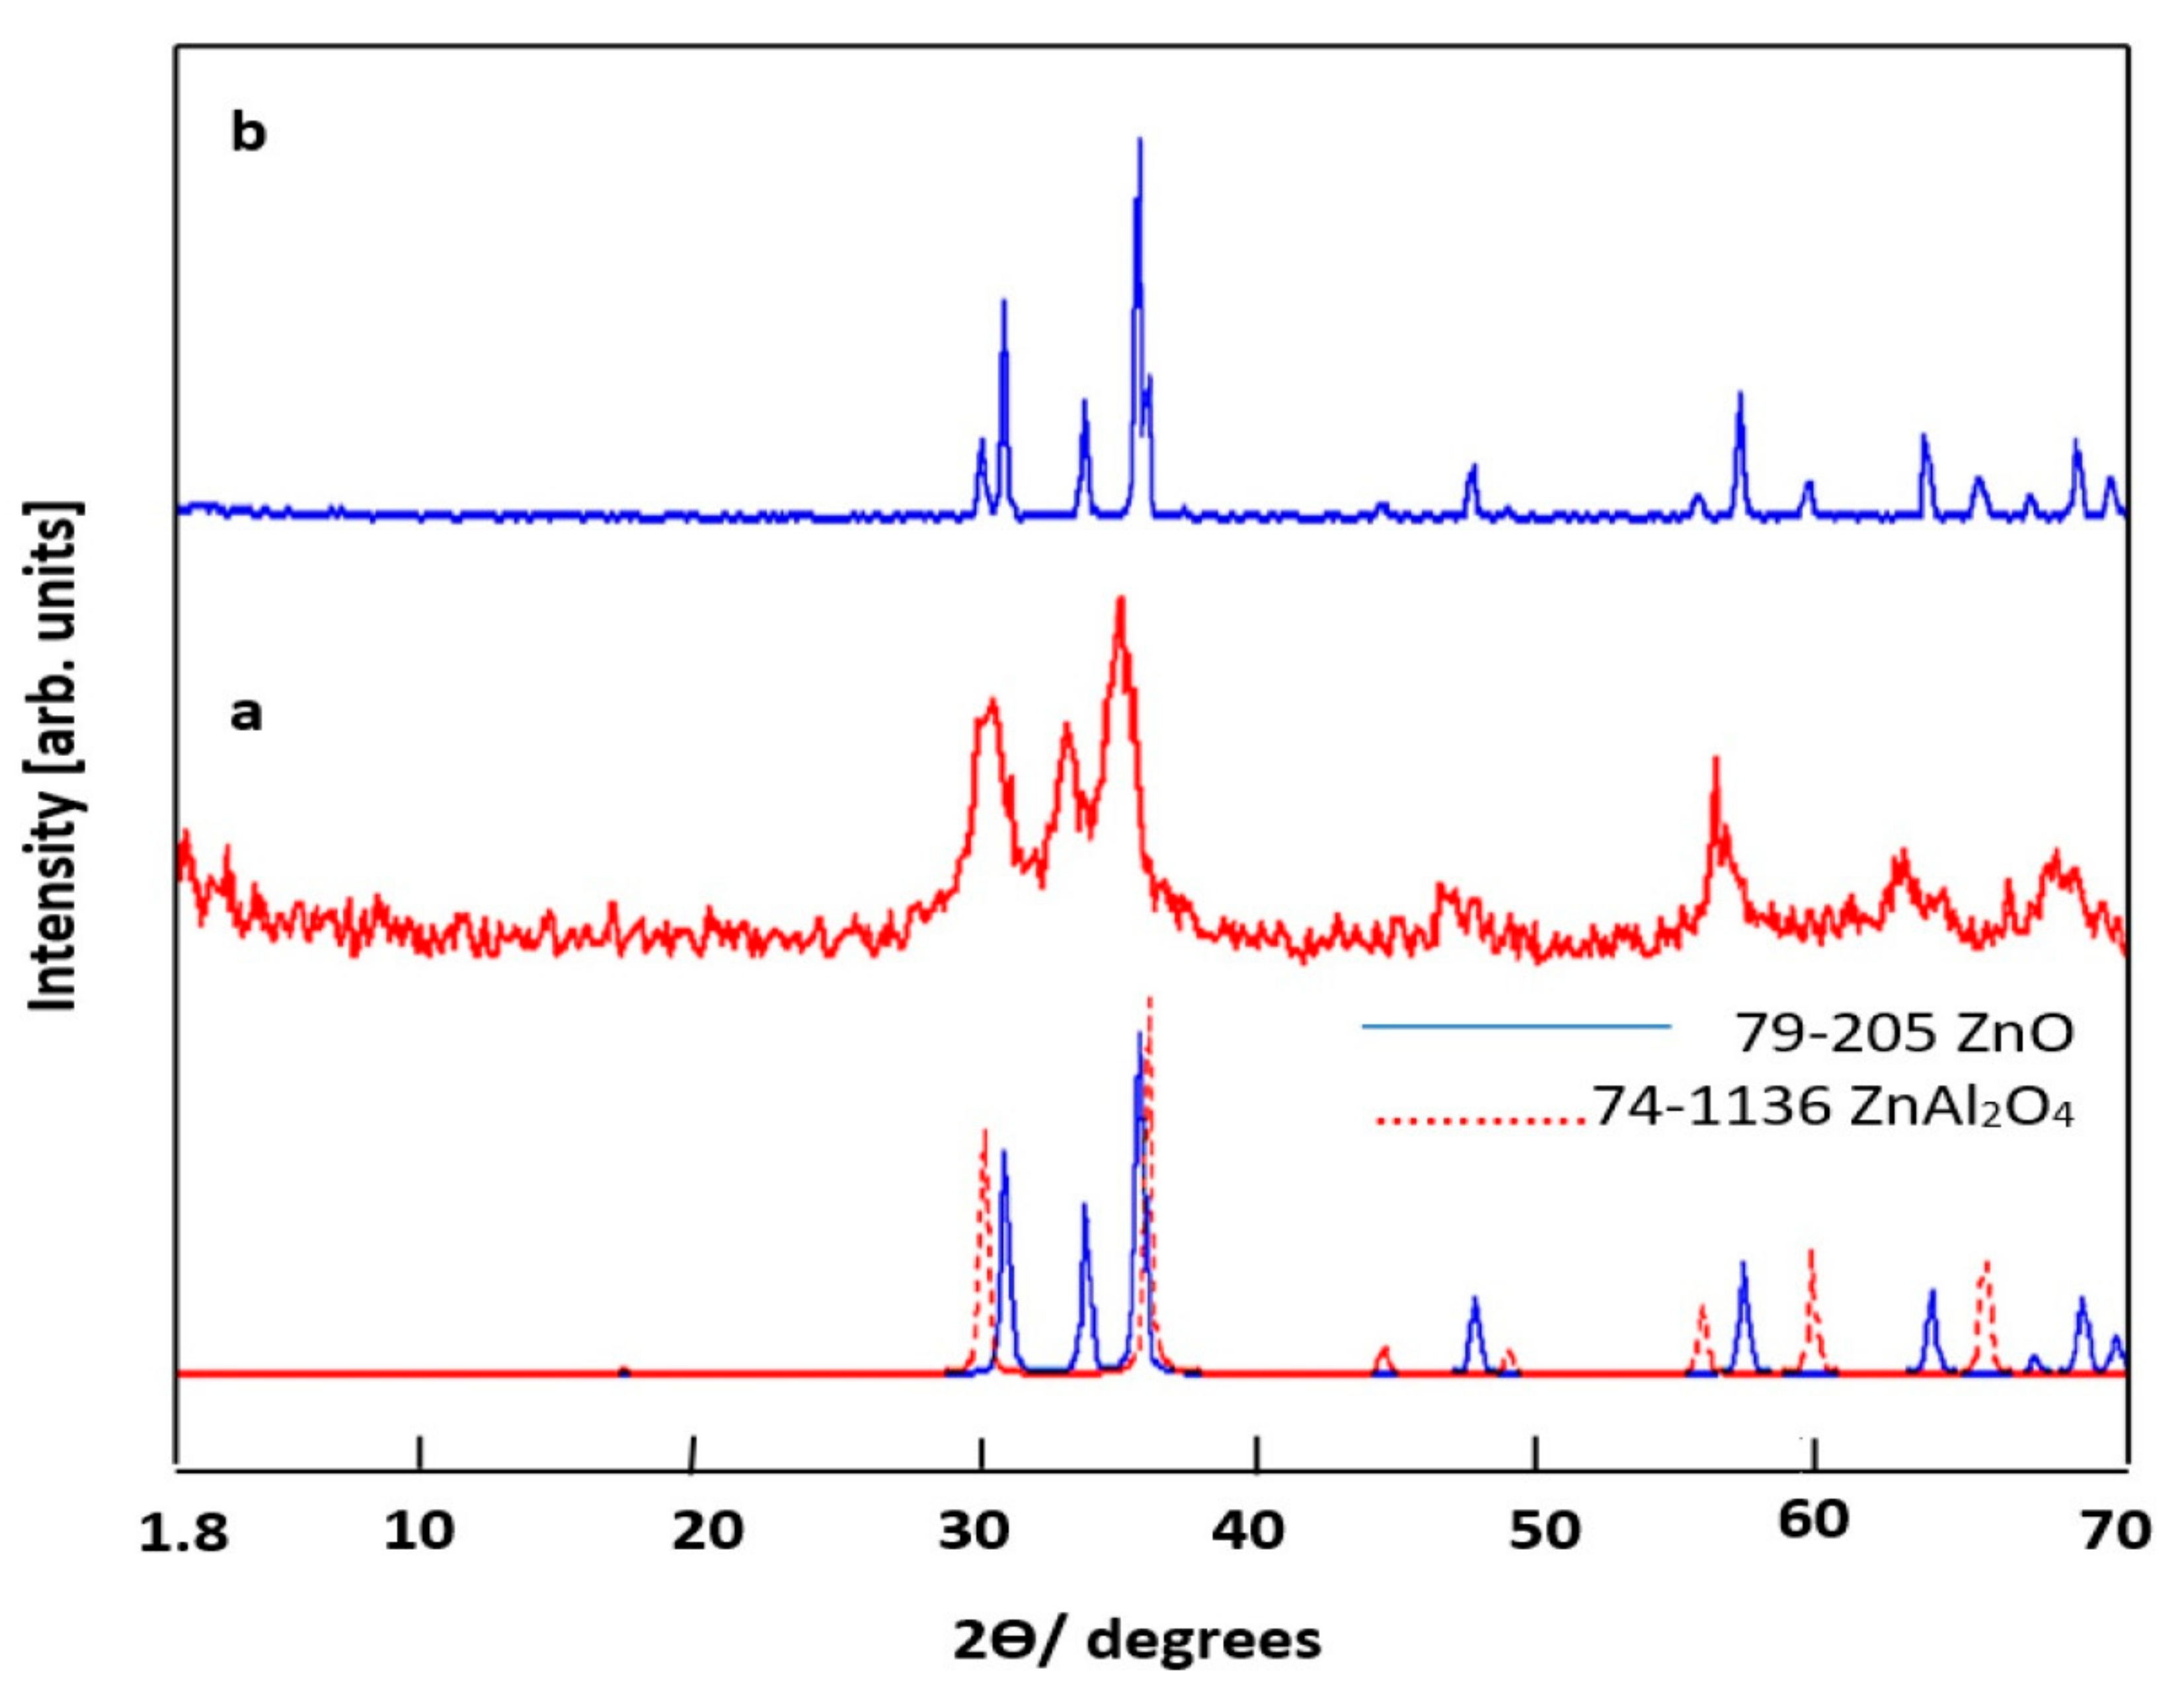
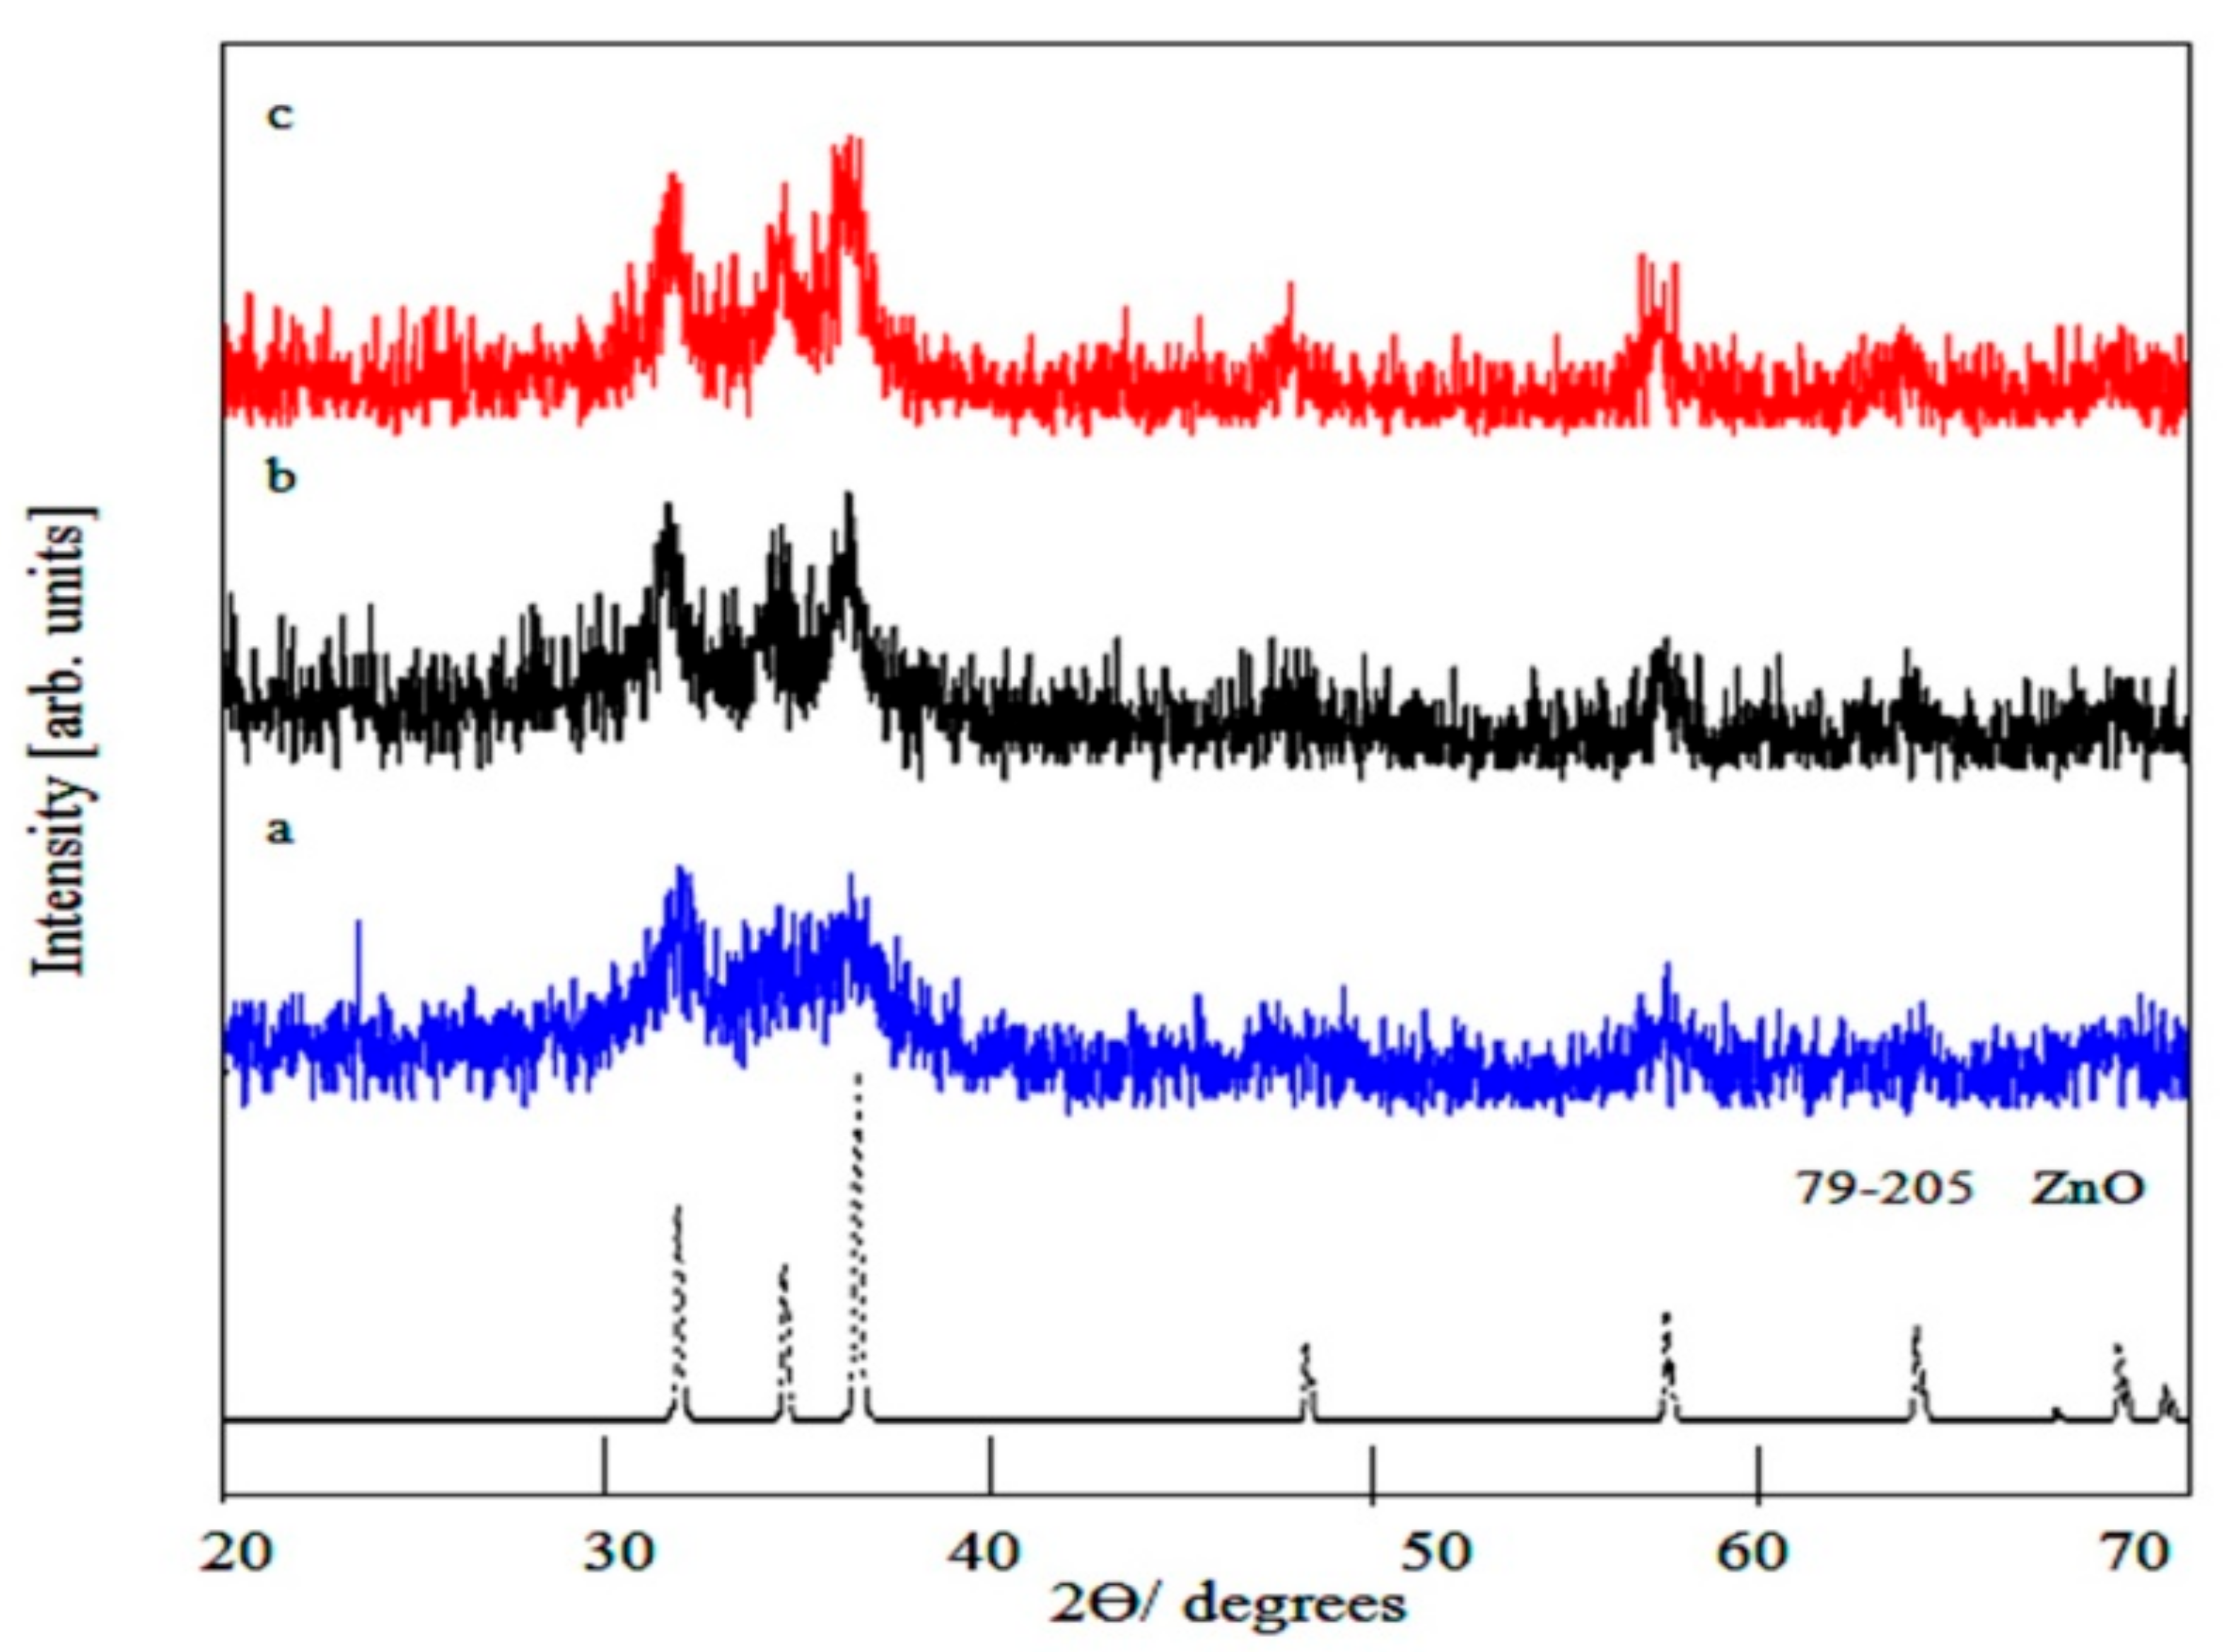
3.2. Multi-Doping Process of Zinc Oxide
3.3. Optical Properties
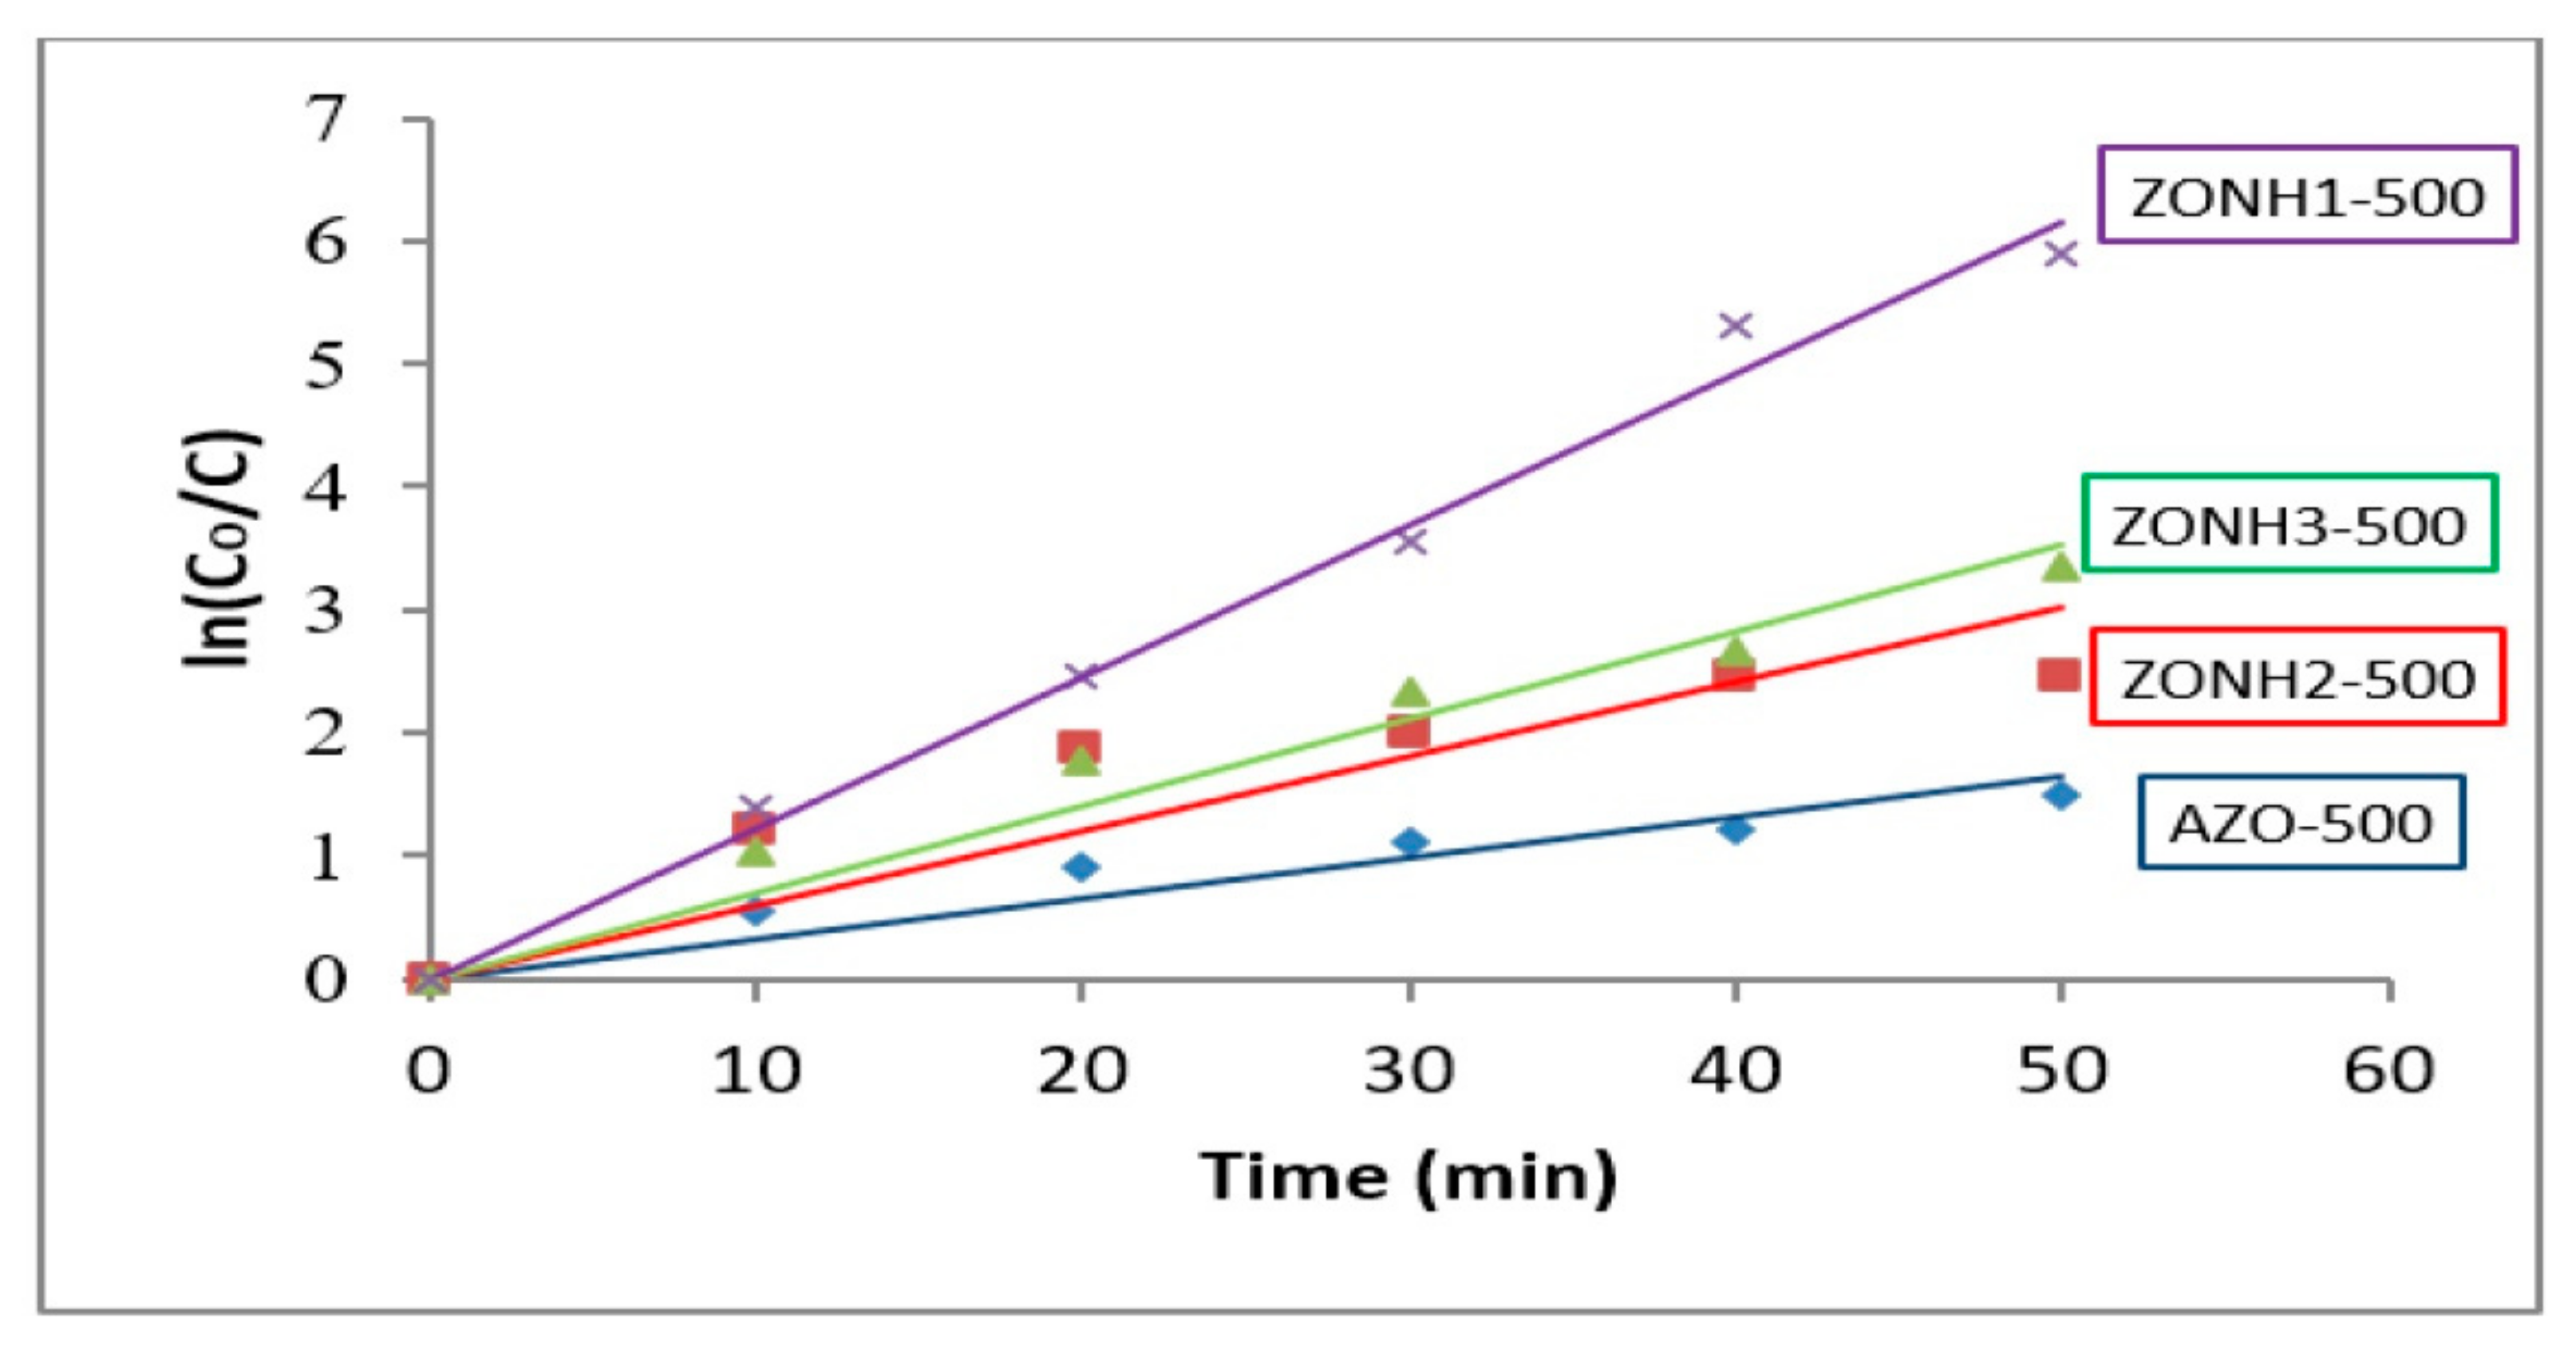
3.4. Effective Removal of Pollutants
4. Discussion
5. Conclusions
Author Contributions
Funding
Data Availability Statement
Acknowledgments
Conflicts of Interest
References
- Nasr, M.; Eid, C.; Habchi, R.; Miele, P.; Bechelany, M. Recent progress on titanium dioxide nanomaterials for photocatalytic applications. ChemSusChem 2018, 11, 3023–3047. [Google Scholar] [CrossRef] [PubMed]
- Alshoaibi, A.; Saber, O.; Ahmed, F. Enhancement of optical activity and properties of barium titanium oxides to be active in sunlight through using hollandite phase instead of perovskite phase. Crystals 2021, 11, 550. [Google Scholar] [CrossRef]
- Saber, O.; Alshoaibi, A.; Al-Yaari, M.; Osama, M. Conversion of non-optical material to photo-active, nanocomposites through non-conventional techniques for water purification by solar energy. Molecules 2020, 25, 4484. [Google Scholar] [CrossRef] [PubMed]
- Dindar, B.; Icli, S. Unusual photoreactivity of ZnO under concentrated sun light. J. Photochem. Photobiol. A Chem. 2001, 140, 263–268. [Google Scholar] [CrossRef]
- Yeber, M.C.; Roderiguez, J.; Freer, J.; Baeza, J.; Duran, N.; Mansilla, H.D. Advanced oxidation of a pulp mill bleaching wastewater. Chemosphere 1999, 39, 1679–1688. [Google Scholar] [CrossRef]
- Behnajady, M.A.; Modirshahla, N.; Hamzavi, R. Kinetic study on photocatalytic degradation of C.I. Acid Yellow 23 by ZnO photocatalyst. J. Hazard. Mater. B 2006, 133, 226–232. [Google Scholar] [CrossRef] [PubMed]
- Saber, O.; El-Brolossy, T.; AlJaafari, A. Improvement of photocatalytic degradation of naphthol green B under solar light using aluminum doping of zinc oxide nanoparticles. Water Air Soil Pollut. 2012, 223, 4615–4626. [Google Scholar] [CrossRef]
- Gupta, V.K.; Jain, R.; Nayak, A.; Agarwal, S.; Shrivastava, M. Removal of the hazardous dye—Tartrazine by photodegradation on titanium dioxide surface. Mater. Sci. Eng. C 2011, 31, 1062–1067. [Google Scholar] [CrossRef]
- Sakthivel, S.; Kish, H. Photocatalytic and photoelectrochemical properties of N-doped titanium dioxide. ChemPhysChem 2003, 4, 487–490. [Google Scholar] [CrossRef] [PubMed]
- Sun, J.H.; Dong, S.Y.; Wang, Y.K.; Sun, S.P. Preparation and photocatalytic property of a novel dumbbell-shaped ZnO microcrystal photocatalyst. J. Hazard. Mater. 2009, 172, 1520–1526. [Google Scholar] [CrossRef]
- Wang, Q.; Tang, C.; Jiang, C.; Du, D.; Wang, F.; Song, J. Role of Substrate Roughness in ZnO Nanowire Arrays Growth by Hydrothermal Approach. Acta Metall. Sin. Engl. Lett. 2016, 29, 237–242. [Google Scholar] [CrossRef] [Green Version]
- Zhou, W.; Li, X.; Qin, L.; Kang, S. Facile Preparation of Ag2ZnGeO4 Flower-like Hierarchical Nanostructure and Its Photocatalytic Activity. J. Mater. Sci. Technol. 2017, 33, 47–51. [Google Scholar] [CrossRef]
- Liu, C.; Xu, H.; Wang, L.; Qin, X. Facile One-Pot Green Synthesis and Antibacterial Activities of GO/Ag Nanocomposites. Acta Metall. Sin. Engl. Lett. 2017, 30, 36–44. [Google Scholar] [CrossRef] [Green Version]
- Bai, X.; Wang, L.; Zong, R.; Lv, Y.; Sun, Y.; Zhu, Y. Performance enhancement of ZnO photocatalyst via synergic effect of surface oxygen defect and graphene hybridization. Langmuir 2013, 29, 3097–3105. [Google Scholar] [CrossRef] [PubMed]
- Leung, Y.; Chen, X.; Ng, A.; Guo, M.; Liu, F.; Djurisic, A.; Chan, W.; Shi, X.; Van Hove, M. Green emission in ZnO nanostructures—Examination of the roles of oxygen and zinc vacancies. Appl. Surf. Sci. 2013, 271, 202–209. [Google Scholar] [CrossRef]
- Wojnarowicz, J.; Chudoba, T.; Koltsov, I.; Gierlotka, S.; Dworakowska, S.; Lojkowski, W. Size control mechanism of ZnO nanoparticles obtained in microwave solvothermal synthesis. Nanotechnology 2019, 29, 06561. [Google Scholar] [CrossRef]
- Pimentel, A.; Ferreira, S.H.; Nunes, D.; Calmeiro, T.; Martins, R.; Fortunato, E. Microwave Synthesized ZnO Nanorod Arrays for UV Sensors: A Seed Layer Annealing Temperature Study. Materials 2016, 9, 299. [Google Scholar] [CrossRef]
- Samadipakchin, P.; Mortaheb, H.R.; Zolfaghari, A. ZnO nanotubes: Preparation and photocatalytic performance evaluation. J. Photochem. Photobiol. A Chem. 2017, 337, 91. [Google Scholar] [CrossRef]
- Zhang, Y.; Ram, M.K.; Stefanakos, E.K.; Goswami, Y.D. Synthesis, Characterization, and Applications of ZnO Nanowires. J. Nanomater. 2012, 12, 624520. [Google Scholar] [CrossRef]
- Diguna, L.J.; Fitriani, A.D.; Liasari, B.R.; Timuda, G.E.; Widayatno, W.B.; Wismogroho, A.S.; Zeng, S.; Birowosuto, M.D.; Amal, M.I. Optical and Photodetection Properties of ZnO Nanoparticles Recovered from Zn Dross. Crystals 2021, 11, 6. [Google Scholar] [CrossRef]
- Chen, H.; Zhao, L.; He, X.; Wang, G.; Wang, X.; Fang, W.; Du, X. In situ Formed Fan-Shaped Nanowires in Biomorphic SiO2: A Multidimensional Composite of Hierarchical Porous Material and Organic Pollutant Adsorption Behavior. Acta Metall. Sin. Engl. Lett. 2017, 30, 104–112. [Google Scholar] [CrossRef] [Green Version]
- Zhong, J.B.; Li, J.Z.; He, X.Y.; Zeng, J.; Lu, Y.; Hu, W.; Lin, K. Improved Photocatalytic Performance of Pd-Doped ZnO. Curr. Appl. Phys. 2012, 12, 998–1001. [Google Scholar] [CrossRef]
- Sin, J.; Lam, S.; Lee, K.; Mohamed, A. Preparation and photocatalytic properties of visible light-driven samarium-doped ZnO nanorods. Ceram. Int. 2013, 39, 5833–5843. [Google Scholar] [CrossRef]
- Ahmad, M.; Ahmed, E.; Zhang, Y.; Khalid, N.R.; Xu, J.; Ullah, M.; Hong, Z. Preparation of Highly Efficient Al-Doped ZnO Photocatalyst by Combustion Synthesis. Curr. Appl. Phys. 2013, 13, 697–704. [Google Scholar] [CrossRef]
- Huang, L.; Ren, N.; Li, B.; Zhou, M. Effect of Annealing on the Morphology, Structure and Photoelectric Properties of AZO/Pt/FTO Trilayer Films. Acta Metall. Sin. Engl. Lett. 2015, 28, 281–288. [Google Scholar] [CrossRef]
- Haja sheriff, M.H.; Murugan, S.; Manivasaham, A.; Ashok Kumar, R. Electro spray technique to enhance the physical property of Sulphur doped zinc oxide thin film. Mater. Today Proc. 2021, 47, 1717–1723. [Google Scholar] [CrossRef]
- Riaz, A.; Ashraf, A.; Taimoor, H.; Javed, S.; Akram, M.A.; Islam, M.; Mujahid, M.; Ahmad, I.; Saeed, K. Photocatalytic and Photostability Behavior of Ag- and/or Al- Doped ZnO Films in Methylene Blue and Rhodamine B Under UV-C Irradiation. Coatings 2019, 9, 202. [Google Scholar] [CrossRef] [Green Version]
- Lavand, A.B.; Malghe, Y.S. Synthesis, characterization and visible light photocatalytic activity of nitrogen-doped zinc oxide nanospheres. J. Asian Ceram. Soc. 2018, 3, 305–310. [Google Scholar] [CrossRef] [Green Version]
- Hamrouni, S.; AlKhalifah, M.S.; El-Bana, M.S.; Zobaidi, S.K.; Belgacem, S. Deposition and characterization of spin-coated n-type ZnO thin film for potential window layer of solar cell. Appl. Phys. A 2018, 124, 555. [Google Scholar] [CrossRef]
- Farrag, A.A.-G.; Balboul, M.R. Nano ZnO thin films synthesis by sol–gel spin coating method as a transparent layer for solar cell applications. J. Sol-Gel Sci. Technol. 2016, 82, 269–279. [Google Scholar] [CrossRef]
- Yan, X.; Venkataraj, S.; Aberle, A.G. Wet-Chemical Surface Texturing of Sputter-Deposited ZnO: Al Films as Front Electrode for Thin-Film Silicon Solar Cells. Int. J. Photoenergy 2015, 2015, 1–10. [Google Scholar] [CrossRef]
- Islam, M.R.; Rahman, M.; Farhad, S.F.U.; Podder, J. Structural, optical and photocatalysis properties of sol–gel deposited Al-doped ZnO thin films. Surf. Interfaces 2019, 16, 120–126. [Google Scholar] [CrossRef]
- Mahdavi, R.; Talesh, S.S.A. Sol-gel synthesis, structural and enhanced photocatalytic performance of Al doped ZnO nanoparticles. Adv. Powder Technol. 2017, 28, 1418–1425. [Google Scholar] [CrossRef]
- Aydın, C.; AbdEl-sadek, M.S.; Zheng, K.; Yahia, I.S.; Yakuphanoglu, F. Synthesis, diffused reflectance and electrical properties of nanocrystalline Fe-doped ZnO via sol–gel calcination technique. Opt. Laser Technol. 2013, 48, 447–452. [Google Scholar] [CrossRef] [Green Version]
- Ravichandran, K.; Sindhuja, E.; Uma, R.; Arun, T. Photocatalytic efficacy of ZnO films light intensity and thickness effects. Surf. Eng. 2017, 33, 512–520. [Google Scholar] [CrossRef]
- Saber, O.; Asiri, S.M.; Ezzeldin, M.F.; El-Azab, W.I.M.; Abu-Abdeen, M. Designing Dual-Effect Nanohybrids for Removing Heavy Metals and Different Kinds of Anions from the Natural Water. Materials 2020, 13, 2524. [Google Scholar] [CrossRef]
- Saber, O.; Aljaafari, A.; Osama, A.; Alshoaibi, A. Optimization Conditions for Crystal Growth of Novel Nanolayers, Nanohybrids and Nanocomposites Based on Cobalt, Zirconium, Titanium and Silicon. Chem. Sel. 2019, 4, 580–588. [Google Scholar]
- Faramawy, S.; Zaki, T.; Sakr, A.A.-E.; Saber, O.; Aboul-Gheit, A.K.; Hassan, S.A. The activity of Mg-Al layered double hydroxides intercalated with nitrogen containing anions towards the removal of carbon dioxide from natural gas. J. Nat. Gas Sci. Eng. 2018, 54, 72–82. [Google Scholar] [CrossRef]
- Low, J.; Yu, J.; Jaroniec, M.; Wageh, S.; Al-Ghamdi, A.A. Heterojunction Photocatalysts. Adv. Mater. 2017, 29, 1601694. [Google Scholar] [CrossRef]
- Amaro-Ortiz, A.; Yan, B.; D’Orazio, J.A. Ultraviolet Radiation, Aging and the Skin: Prevention of Damage by Topical cAMP Manipulation. Molecules 2014, 19, 6202–6219. [Google Scholar] [CrossRef]
- Nakamoto, N. Infrared and Raman Spectra of Inorganic and Coordination Compounds, 4th ed.; Wiley: New York, NY, USA, 1986; pp. 121–139. [Google Scholar]
- Saber, O.; Aljaafari, A.; Alomair, H.A.; Alshoaibi, A. Novel strategy for producing nanoplatelets to be used as building blocks for shaping nanofibers through layered double hydroxides and poly vinyl alcohol. Chem. Sel. 2019, 4, 4293–4300. [Google Scholar] [CrossRef]
- Tang, Z.K.; Wong, G.K.L.; Yu, P.; Kawasaki, M.; Ohtomo, A.; Koinuma, H.; Segawa, Y. Room-temperature ultraviolet laser emission from self-assembled ZnO microcrystallite thin films. Appl. Phys. Lett. 1998, 72, 3270. [Google Scholar] [CrossRef]
- van Dijken, A.; Makkinje, J.; Meijerink, A. The influence of particle size on the luminescence quantum efficiency of nanocrystalline ZnO particles. J. Lumin. 2001, 92, 323–328. [Google Scholar] [CrossRef]
- Kind, H.; Yan, H.; Messer, B.; Law, M.; Yang, P. Nanowire Ultraviolet Photodetectors and Optical Switches. Adv. Mater. 2002, 14, 158–160. [Google Scholar] [CrossRef]
- Nakrela, A.; Benramdane, N.; Bouzidi, A.; Kebbab, Z.; Medles, M.; Mathieu, C. Site location of Al-dopant in ZnO lattice by exploiting the structural and optical characterisation of ZnO:Al thin films. Results Phys. 2016, 6, 133–138. [Google Scholar] [CrossRef] [Green Version]
- Barton, D.G.; Shtein, M.; Wilson, R.D.; Soled, S.L.; Iglesia, E. Structure and electronic properties of solid acids based on tungsten oxide nanostructures. J. Phys. Chem. B 1999, 103, 630–640. [Google Scholar] [CrossRef]
- Ahmed, N.; Shibata, Y.; Taniguchi, T.; Izumi, Y. Photocatalytic conversion of carbon dioxide into methanol using zinc–copper–M(III) (M = aluminum, gallium) layered double hydroxides. J. Catal. 2011, 279, 123–135. [Google Scholar] [CrossRef]
- Pankove, J.I. Optical Processes in Semiconductor; Prentice-Hall: Englewood Cliffs, NJ, USA, 1971; pp. 1–72. [Google Scholar]
- Saber, O.; Alomair, H.; Abu-Abdeen, M.; Aljaafari, A. Fast Degradation of Green Pollutants Through Nanonets and Nanofibers of the Al-Doped Zinc Oxide. Acta Metall. Sin. Engl. Lett. 2018, 31, 533–546. [Google Scholar] [CrossRef] [Green Version]
- Liang, C.; Zhang, X.; Wang, Z.; Wang, W.; Yang, M.; Dong, X. Organic/inorganic nanohybrids rejuvenate photodynamic cancer therapy. J. Mater. Chem. B 2020, 8, 4748–4763. [Google Scholar] [CrossRef]
- Xu, J.W.; Cui, Z.M.; Liu, Z.Q.; Xu, F.; Chen, Y.S.; Luo, Y.L. Organic–Inorganic Nanohybrid Electrochemical Sensors from Multi-Walled Carbon Nanotubes Decorated with Zinc Oxide Nanoparticles and In-Situ Wrapped with Poly(2-methacryloyloxyethyl ferrocenecarboxylate) for Detection of the Content of Food Additives. Nanomaterials 2019, 9, 1388. [Google Scholar] [CrossRef] [Green Version]
- Banerjee, T.; Podjaski, F.; Kröger, J.; Biswal, B.P.; Lotsch, B.V. Polymer photocatalysts for solar-to-chemical energy conversion. Nat. Rev. Mater. 2021, 6, 168–190. [Google Scholar] [CrossRef]
- Zhou, H.; Qu, Y.; Zeida, T.; Duan, X. Towards highly efficient photocatalysts using semiconductor nanoarchitectures. Energy Environ. Sci. 2012, 5, 6732–6743. [Google Scholar] [CrossRef]
- Kobayashi, A.; Muramatsu, E.; Yoshida, M.; Kato, M. Two Excited State Collaboration of Heteroleptic Ir(III)-Coumarin Complexes for H2 Evolution Dye-Sensitized Photocatalys. Energies 2021, 14, 2425. [Google Scholar] [CrossRef]


| Sample | (2θ) | Area | Cry. Size (nm) | Av. Size (nm) |
|---|---|---|---|---|
| ZONH1-500 | 31.7 ± 0.1 | 127 ± 0.1 | 7.8 ± 0.1 | 8 ± 0.1 |
| 34.4 ± 0.1 | 85 ± 0.1 | 8.3 ± 0.1 | ||
| 36.2 ± 0.1 | 189 ± 0.1 | 7.8 ± 0.1 | ||
| ZONH1-1200 | 31.7 ± 0.1 | 94 ± 0.1 | 132 ± 0.1 | 125 ± 0.1 |
| 34.4 ± 0.1 | 69 ± 0.1 | 123 ± 0.1 | ||
| 36.2 ± 0.1 | 171 ± 0.1 | 120 ± 0.1 |
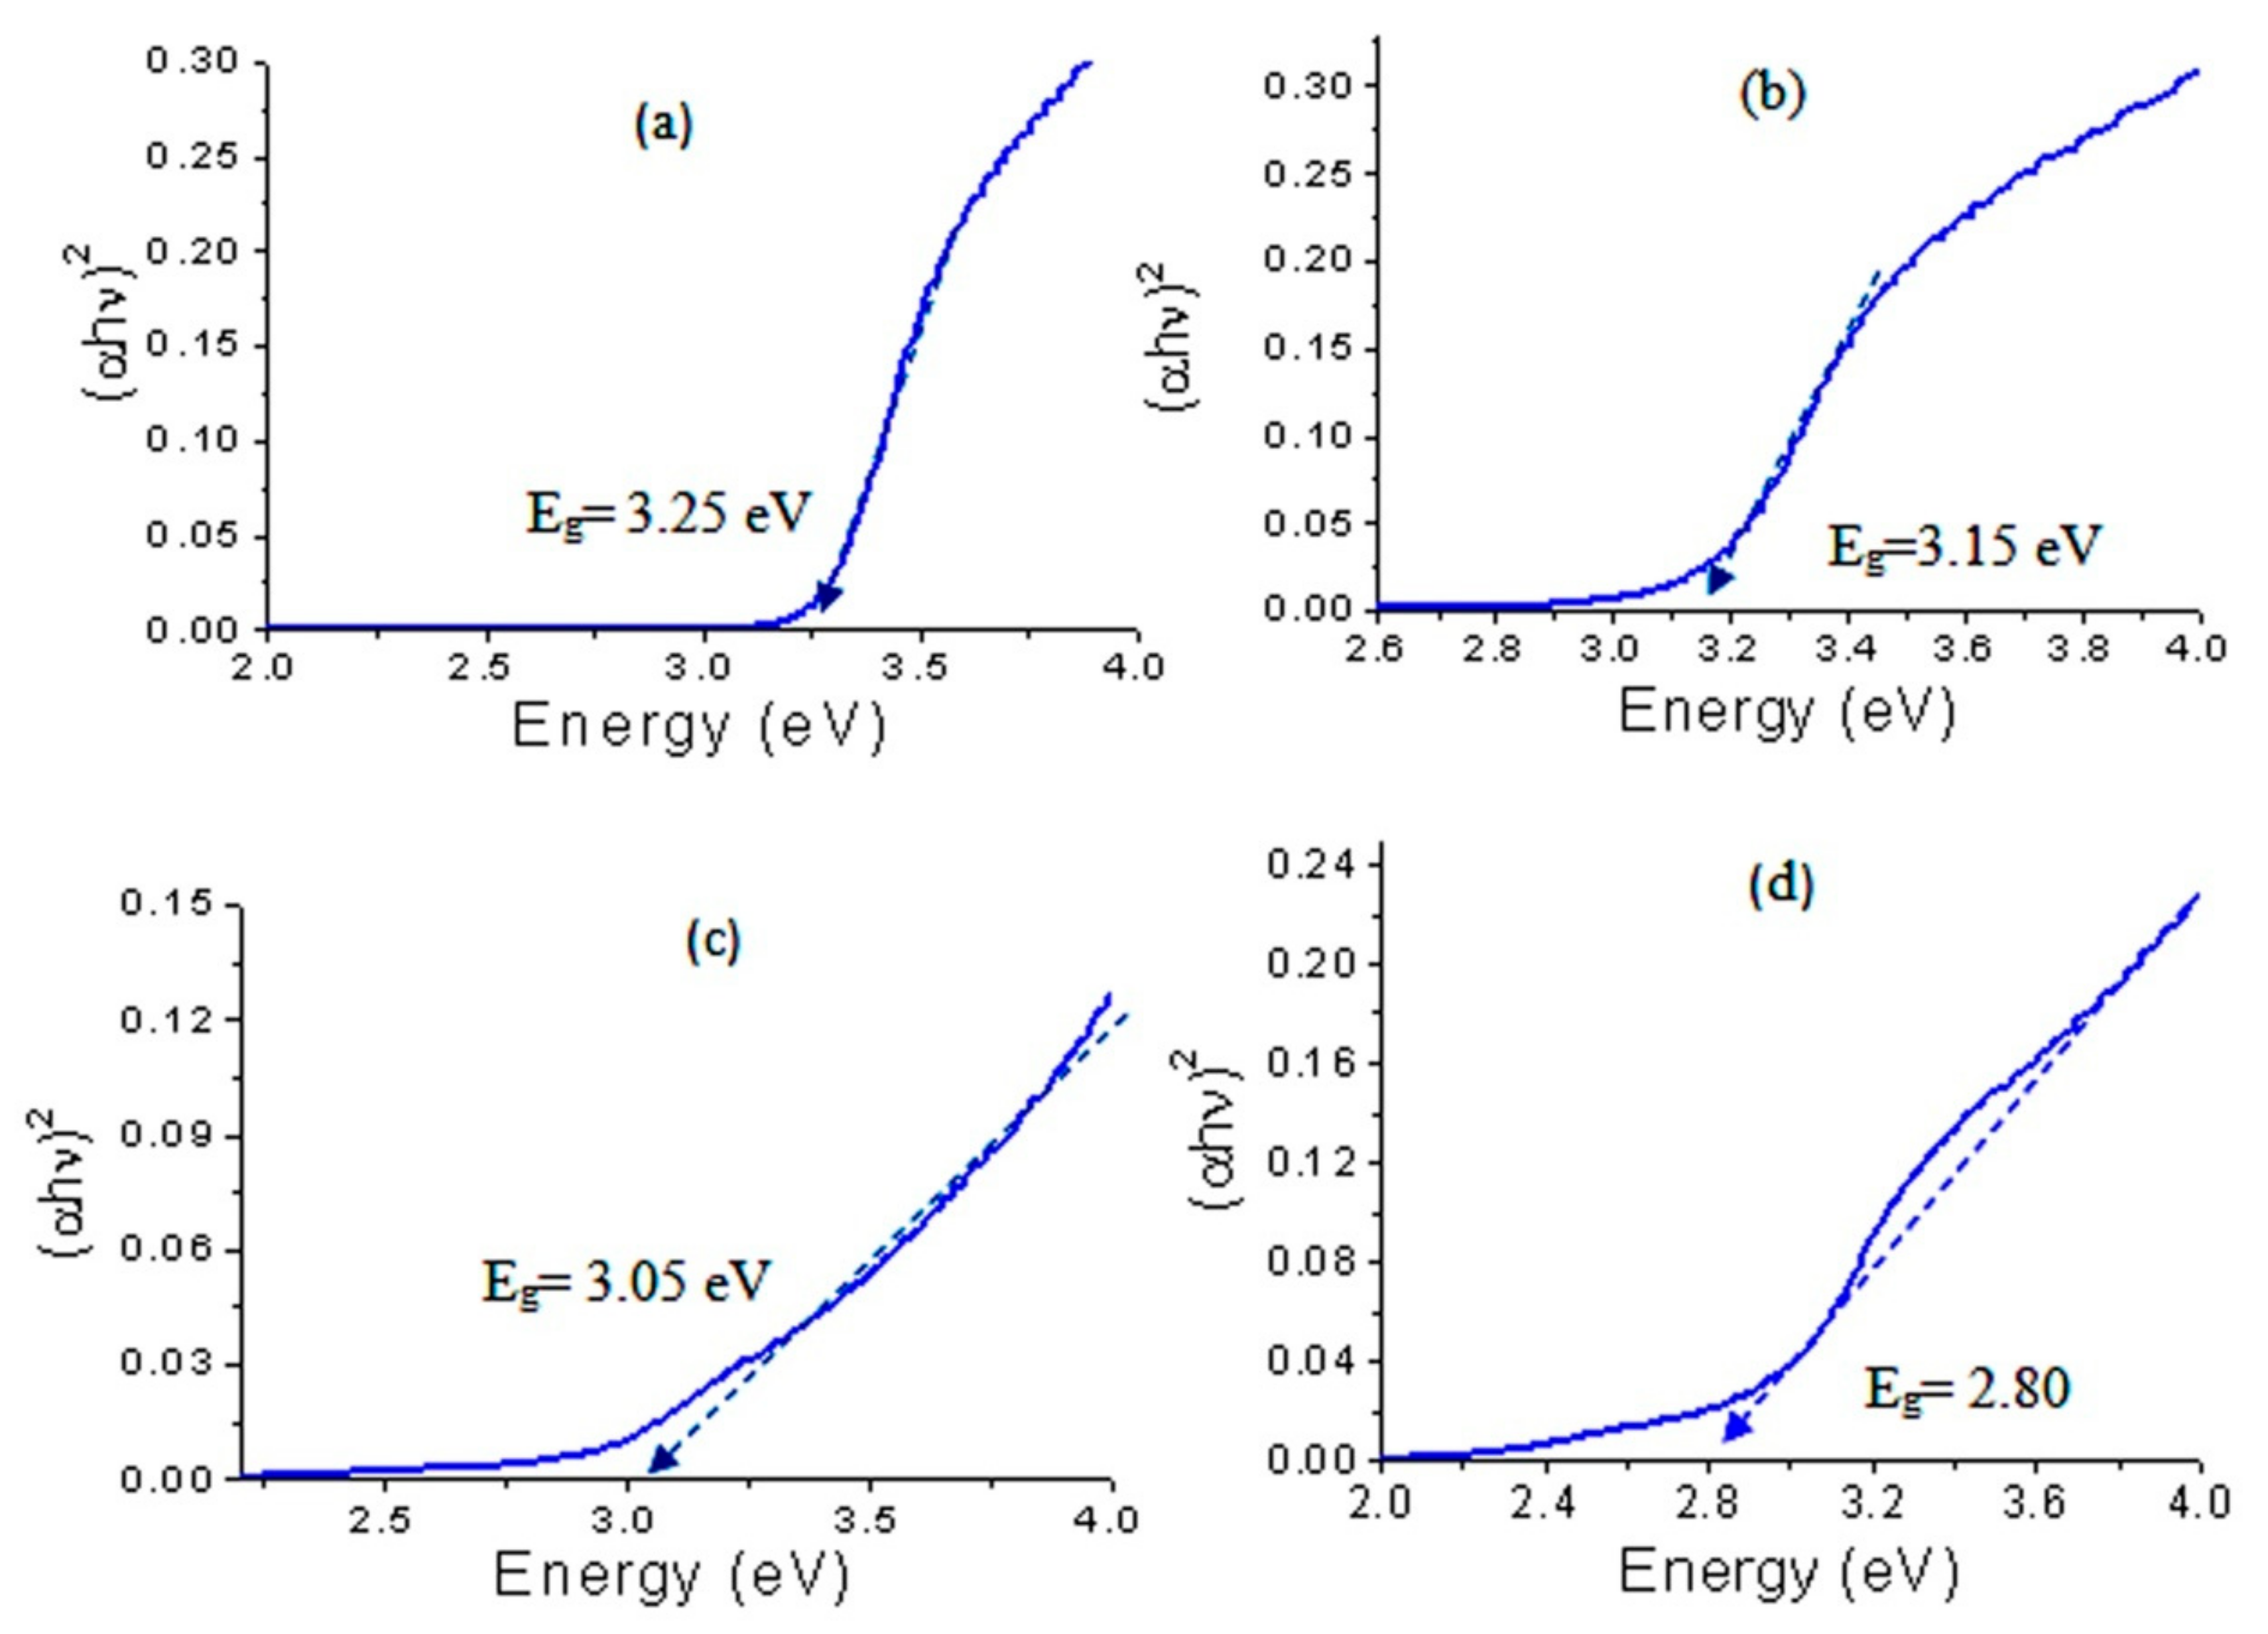
| Scheme | Band Gap Energy (eV) |
|---|---|
| AZO-500 | 3.25 ± 0.01 |
| ZONH2-500 | 3.15 ± 0.01 |
| ZONH3-500 | 3.05 ± 0.01 |
| ZONH1-500 | 2.80 ± 0.01 |
Publisher’s Note: MDPI stays neutral with regard to jurisdictional claims in published maps and institutional affiliations. |
© 2021 by the authors. Licensee MDPI, Basel, Switzerland. This article is an open access article distributed under the terms and conditions of the Creative Commons Attribution (CC BY) license (https://creativecommons.org/licenses/by/4.0/).
Share and Cite
Saber, O.; Shaalan, N.M.; Ahmed, F.; Kumar, S.; Alshoaibi, A. One-Step Multi-Doping Process for Producing Effective Zinc Oxide Nanofibers to Remove Industrial Pollutants Using Sunlight. Crystals 2021, 11, 1268. https://0-doi-org.brum.beds.ac.uk/10.3390/cryst11101268
Saber O, Shaalan NM, Ahmed F, Kumar S, Alshoaibi A. One-Step Multi-Doping Process for Producing Effective Zinc Oxide Nanofibers to Remove Industrial Pollutants Using Sunlight. Crystals. 2021; 11(10):1268. https://0-doi-org.brum.beds.ac.uk/10.3390/cryst11101268
Chicago/Turabian StyleSaber, Osama, Nagih M. Shaalan, Faheem Ahmed, Shalendra Kumar, and Adil Alshoaibi. 2021. "One-Step Multi-Doping Process for Producing Effective Zinc Oxide Nanofibers to Remove Industrial Pollutants Using Sunlight" Crystals 11, no. 10: 1268. https://0-doi-org.brum.beds.ac.uk/10.3390/cryst11101268