
Finite Element Modeling of Brittle and Ductile Modes in Cutting of 3C-SiC


1
ICAMS, Ruhr-Universität Bochum, Universit ätstr. 150, 44801 Bochum, Germany
2
Center for Precision Engineering, Harbin Institute of Technology, Harbin 150001, China
*
Author to whom correspondence should be addressed.
Crystals 2021, 11(11), 1286; https://0-doi-org.brum.beds.ac.uk/10.3390/cryst11111286
Submission received: 31 August 2021
/
Revised: 13 October 2021
/
Accepted: 19 October 2021
/
Published: 24 October 2021
(This article belongs to the Special Issue Micromechanical Modelling and Its Applications to Polycrystals)
Abstract
:Machining of brittle ceramics is a challenging task because the requirements on the cutting tools are extremely high and the quality of the machined surface strongly depends on the chosen process parameters. Typically, the efficiency of a machining process increases with the depth of cut or the feed rate of the tool. However, for brittle ceramics, this easily results in very rough surfaces or even in crack formation. The transition from a smooth surface obtained for small depths of cut to a rough surface for larger depths of cut is called a brittle-to-ductile transition in machining. In this work, we investigate the mechanisms of this brittle-to-ductile transition for diamond cutting of an intrinsically brittle 3C-SiC ceramic with finite element modeling. The Drucker–Prager model has been used to describe plastic deformation of the material and the material parameters have been determined by an inverse method to match the deformation behavior of the material under nanoindentation, which is a similar loading state as the one occurring during cutting. Furthermore, a damage model has been introduced to describe material separation during the machining process and also crack initiation in subsurface regions. With this model, grooving simulations of 3C-SiC with a diamond tool have been performed and the deformation and damage mechanisms have been analyzed. Our results reveal a distinct transition between ductile and brittle cutting modes as a function of the depth of cut. The critical depth of cut for this transition is found to be independent of rake angle; however, the surface roughness strongly depends on the rake angle of the tool.
1. Introduction
Owing to the unique electronic and optoelectronic properties, the zinc blende type cubic phase of SiC, i.e., 3C-SiC, is a highly desirable material in the semiconductor, optoelectronic industry [1]. Due to its high specific stiffness and thermal stability, SiC is further used in the lightweight space telescope [2,3]. The covalently bonded material exhibits high thermal, wear, and chemical resistance, which can withstand extreme environmental conditions [4,5]. The presence of strong covalent interaction between Si and C, however, results in an intrinsic brittleness of the material. Consequently, the machining of such brittle material frequently leaves behind a rather rough surface and microcracks within the subsurface material. Hence, the poor machinability of the material can be associated to its low fracture toughness [6]. The optimum machinability of SiC is further challenged by a high anisotropy [6,7], erosive wear [8], high pressure-induced phase transition [9], and an amorphous phase [10].
Recent studies showed that machining of such material is characterized by the presence of two modes of cutting, i.e., brittle and ductile [11,12,13]. A smooth surface having relatively low surface roughness can be achieved when a low depth of cut is used for the machining. Single-point diamond turning (SPDT) has become one of the most popular and efficient methods for the material removal, as it provides a surface roughness on the nanoscale [6,14]. The optimum surface roughness is obtained using SPDT and a controlled combination of machining parameters such as rake angle, depth of cut, and relief angle [11,13]. The machining is performed by varying the depth of cut gradually and monitoring the evolution of surface morphology afterwards with the help of an ex situ experiment. By monitoring the force behavior at the low depth of cut, the critical depth of cut that separates the ductile and brittle regime is obtained. The surface morphology is then examined through a scanning electron microscope (SEM).
Among others, Bifano et al. [15] showed a method of achieving a ductile regime during the machining of brittle materials. By varying the infeed rate, they achieved a ductile mode of grinding. These experimental results are further confirmed by an analytical model. In another experimental study, Patten et al. [9] performed the cutting of 6H-SiC. Their study suggests that the ductile mode of cutting is characterized by the presence of a high pressure phase within SiC. Alternatively, finite element (FE) simulations are used to identify the brittle-ductile transition (BDT) and surface morphology in brittle materials. Mariayyah et al. [11] studied the effect of machining parameters on the scratching and cutting behavior of SiC. Their study revealed the effect of the machining parameters on the ductile regime of machining. They have concluded that this ductile regime is achieved by imposing a hydrostatic pressure that is higher than the hardness of SiC. The ductile machining is achieved through the presence of a high-pressure phase transition. In another study, Dai et al. [12] proposed the tension shear coupled fracture method to study the BDT in SiC machining. In the proposed method, the brittle fracture occurs when the material reaches a certain tensile stress, whereas the materials fail in a ductile manner if the shear stress reaches a pre-defined value. They characterized the BDT by comparing the experimental undeformed chip thickness and surface morphology to that of numerically obtained values. In silicon, a material with similar sp bonds, Zhang et al. [13] showed that a ductile mode of material removal can be achieved through the consistent choice of machining parameters. Their use of a tool with a negative rake angle suppressed the crack propagation, leading to a ductile mode of cutting at low depth. Zhang et al. [16] further performed the cutting simulation of reaction-bonded SiC, using elliptical vibration-assisted diamond cutting along with the experiment. Their results suggest that, the deformation behavior of cutting depends on the existence of a different phase within SiC [16]. This is also confirmed in the atomistic study of Liu et al. [17,18], as well as in the experimental study of Tian et al. [19], where the formation of a thin amorphous phase is observed. Although the formation of an amorphous phase is observed during molecular dynamics simulations and experiment, the typical thickness of such an amorphous layer is rather small, and this phase is metastable with respect to the ground state of SiC [20]. Furthermore, density functional theory calculations revealed that the energy difference between different phases of SiC is only on the order of few meV [20]. Such energy difference arises due to the difference in the stacking sequence of Si and C layer [21].
From previous studies, the mechanisms of brittle and ductile cutting of 3C-SiC and their correlation with essential machining parameters like depth of cut and rake angle have not been well understood. However, this knowledge is crucial for optimizing machining parameters and ensuring the desired surface quality. Hence, in the present study, we aim at understanding the mechanisms of brittle and ductile cutting of 3C-SiC and their correlations with the machining parameters, by focusing on small-scale plastic deformation of the brittle material, occurring under compressive stresses in front of the tool tip, and the material separation process. To accomplish this, FE simulations are performed with various depths of cut and rake angles, and the resulting cutting forces and surface roughness are characterized to gain insight into the brittle or ductile nature of the cutting process. The used material model of the Drucker–Prager-type [22] has been parameterized by inverse analysis of nanoindentation simulations and experiments. In addition to the Drucker–Prager model for plasticity, a damage model has been implemented to describe the material separation process and the nucleation of subsurface cracks during cutting in a realistic manner. In the following sections, details about the material model are given, before the finite element model for the machining simulations is introduced. After this, the results are analyzed with respect to the mechanisms occurring during the machining of the brittle ceramic. Based on this analysis, criteria for the brittle or ductile cutting modes are derived.
2. Material Parameter Identification by Nanoindentation
In this section, the constitutive model used to describe the deformation of 3C-SiC in the FE simulations is introduced, along with the adopted damage model. The choice of this constitutive model will be confirmed afterwards by demonstrating that the corresponding material parameters can be successfully identified with an inverse method by minimizing the difference between simulated and experimental nanoindentation load-displacement curves. Finally, the constitutive model is validated by comparison of predicted load-displacement curves to experimental results that have not been used for fitting.
2.1. Constitutive Model for 3C-SiC
A Drucker–Prager-(DP)-type constitutive model has been used to describe plastic deformation of the brittle ceramic, based on findings in the literature. Among others, Patten et al. [23] successfully applied the DP constitutive relations to simulate the machining process of 6H-SiC. They demonstrated numerically and experimentally that a brittle ceramic may exhibit ductile behavior under the loading conditions of a machining process. Similar constitutive relations have widely been used for studying the BDT in silicon carbide, silicon nitride, silicon, and germanium [11,13,24]. Motivated by these studies, the linear DP constitutive relation is applied here to model the deformation behavior of 3C-SiC.
In this work, we follow the definition of the DP model as it is implemented in the finite element software ABAQUS 2017 [25], where the linear DP constitutive model is expressed in terms of the stress invariants, and the yield criterion is defined as
with the effective stress t that drives the deformation. This effective stress is proportional to the von Mises equivalent stress q and takes the form
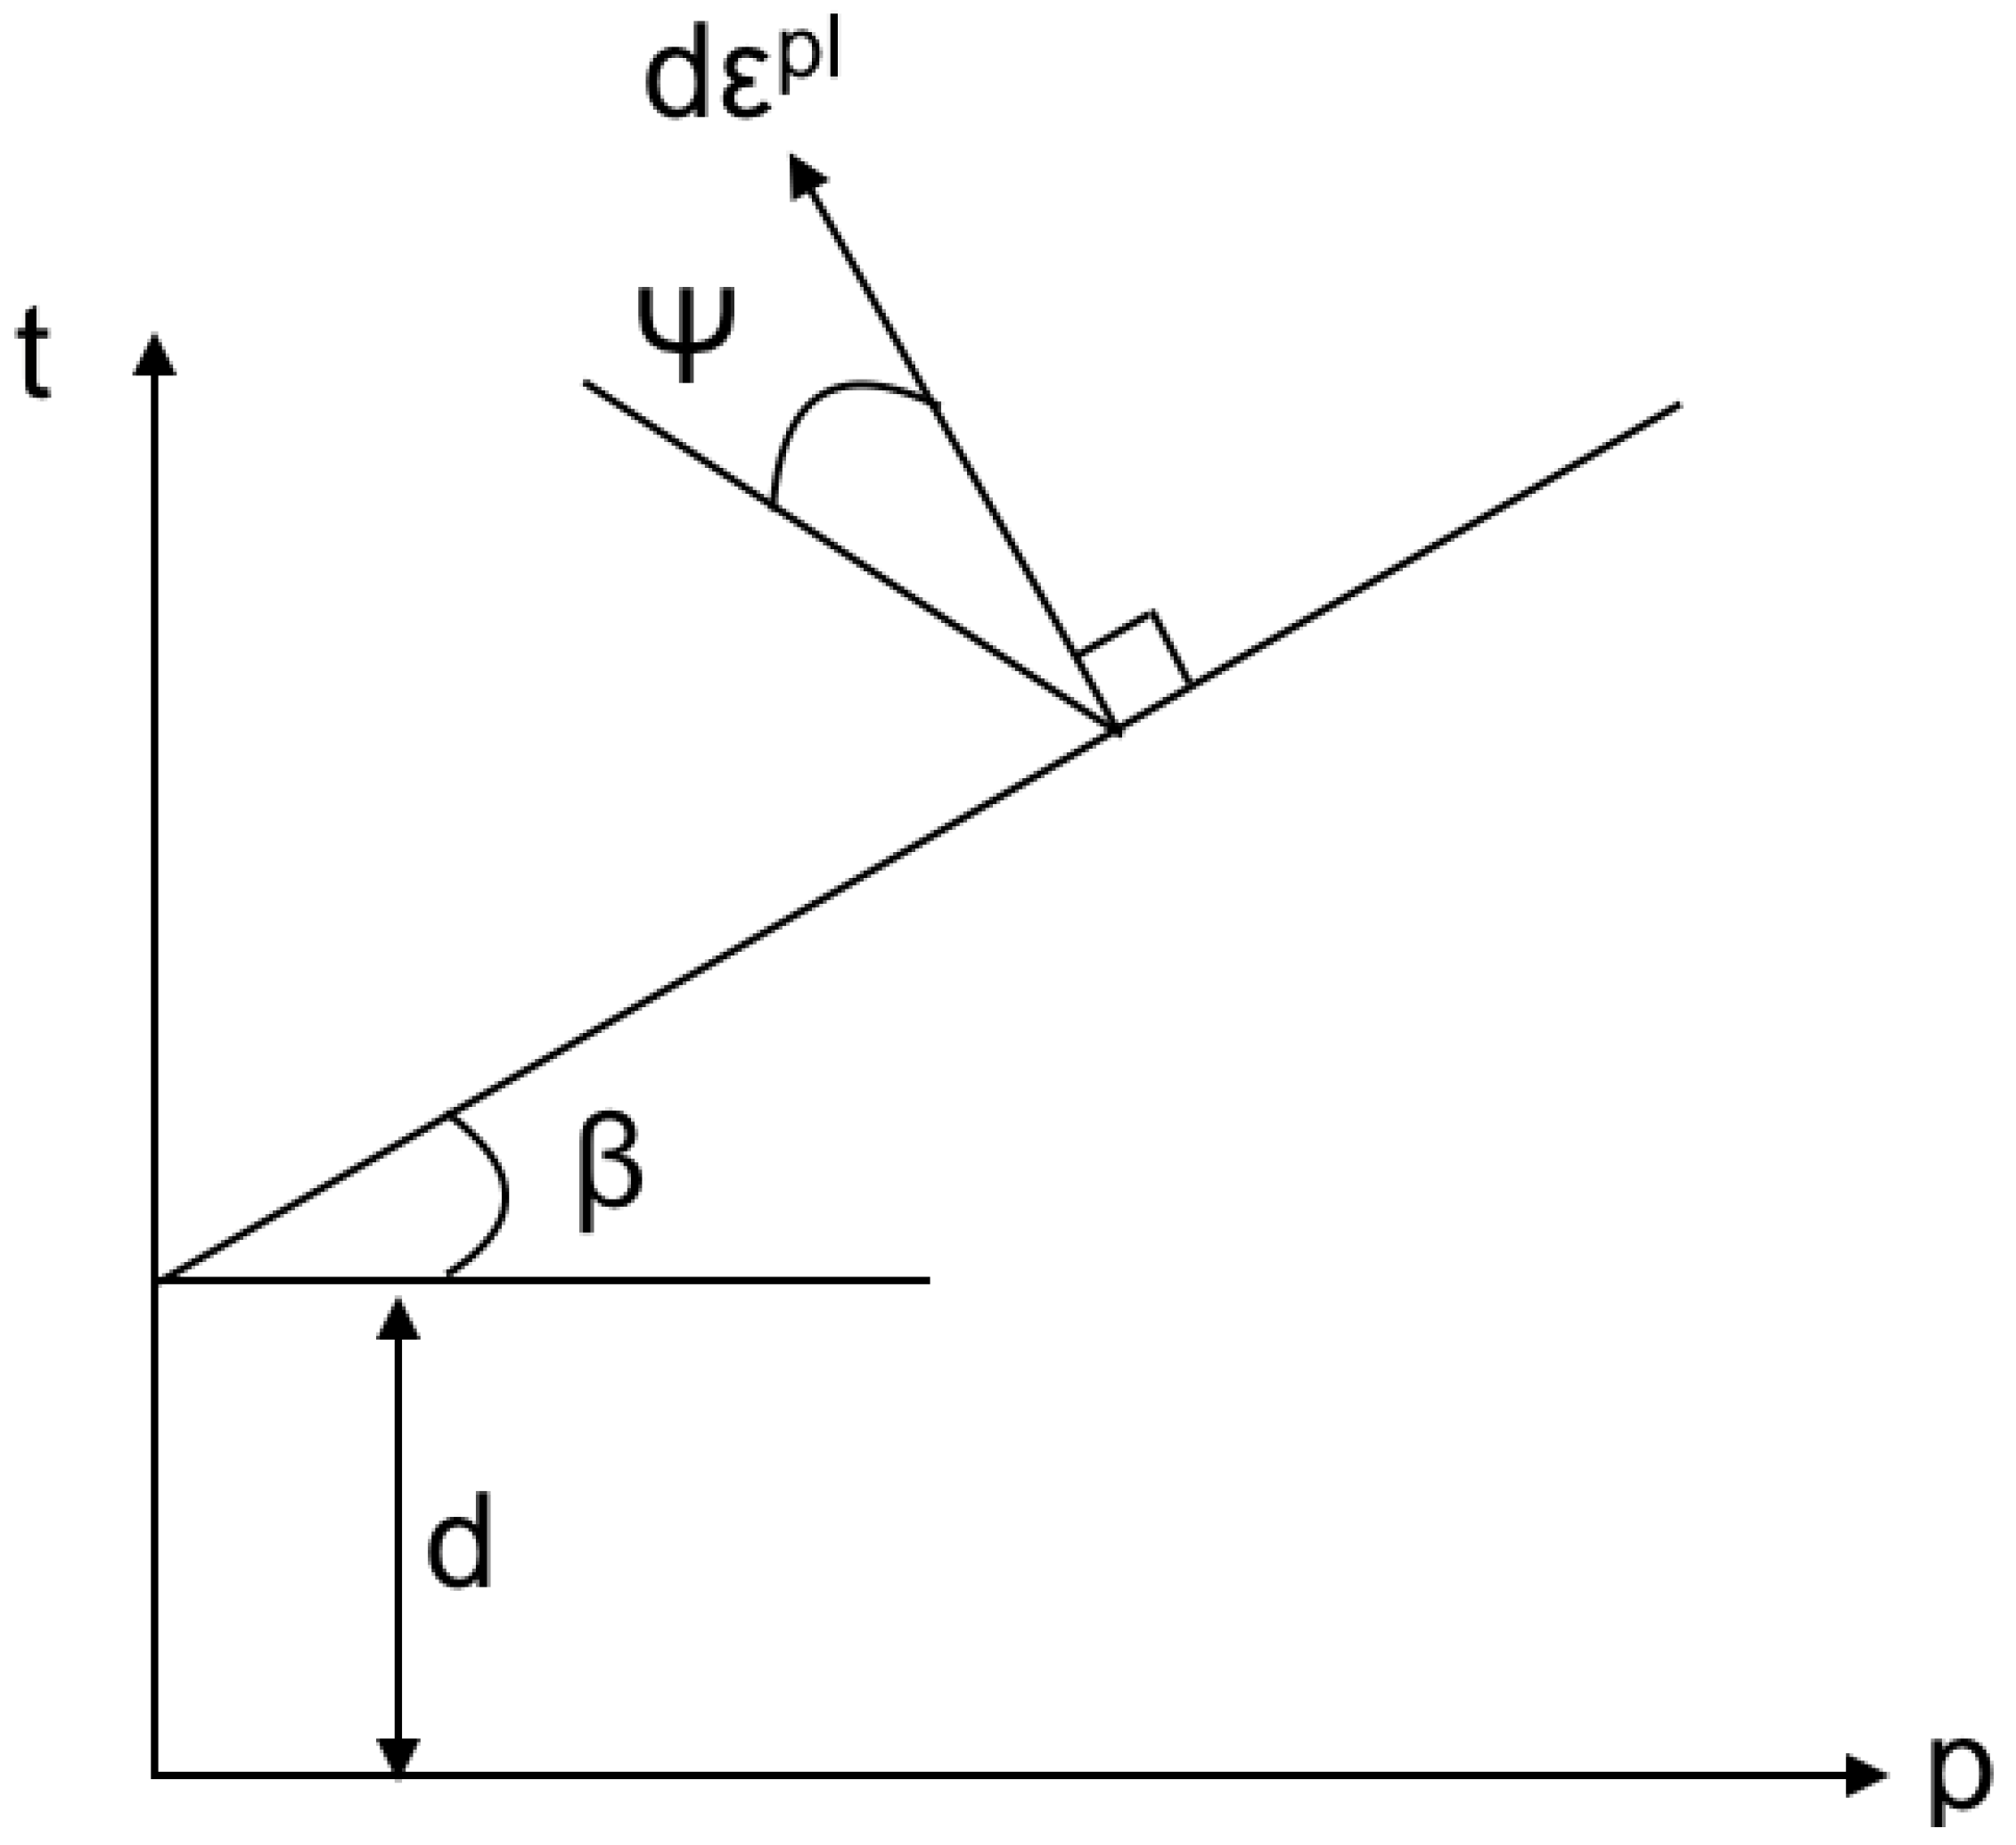
Further parameters of the yield criterion in Equation (1) are the angle that defines the slope of the yield stress with respect to the axis of the hydrostatic pressure p, and the intercept d of the t-p line at ; see Figure 1 for a graphical representation of the yield criterion in the stress space. In Equation (2), K is the ratio of the yield stresses under hydrostatic tension and compression, respectively, and r is the third invariant of the deviatoric stress.
The parameter d can be calculated from the yield stress under uniaxial compression as
Hence, this parameter also incorporates any work hardening that influences the yield onset, as seen later during the fitting of the parameters.
Besides this plasticity model, a damage model is applied in this work to describe the material separation process during machining. Following Zhang et al. [13], a phenomenological damage model is assumed, where the damage evolution follows a shear criterion based on the equivalent plastic strain [26]. The damage parameter D is defined as function of in the form
where is a material-specific critical value of the plastic strain that depends on the parameter as
with the material parameters a, b and c, where is defined as
Here, is the stress triaxiality and is the ratio of the maximum in plane shear stress to the von Mises equivalent stress q, thus . Once the damage parameter reaches a value of , the material is assumed to have failed completely, and the finite element in which this value occurs is deleted. During the simulation, the damage parameter is applied to all stiffness components of an element uniformly, such that the usual relation
is fulfilled, where is the reference stress in the undamaged material and is the effective stress in the damaged material. The parameters a, b, c, and associated with the damage model are given in Table 1, together with the parameters for the DP model for plastic deformation. It is noted here that the constitutive model used in this work does not cover phase transformations that might occur in the material. In particular, atomistic studies show that a phase transformation to the amorphous phase may occur under the high pressure caused by the machining process of SiC [10,16,17,19,20]. However, this amorphous layer is typically very thin and would be smaller than the element size in our simulations. Hence, it is out of the scope of this work to study the influence of microscopical phase transformation layers. Since our DP model is adapted to nanoindentation experiments, where similar mechanical stress states are achieved as during machining, we expect that the influence of a potential amorphous layer is effectively captured in the constitutive rule derived from these experiments. In forthcoming studies, the influence of phase transformations on the machining of SiC shall be investigated in more detail.
2.2. Parameter Identification by an Inverse Method
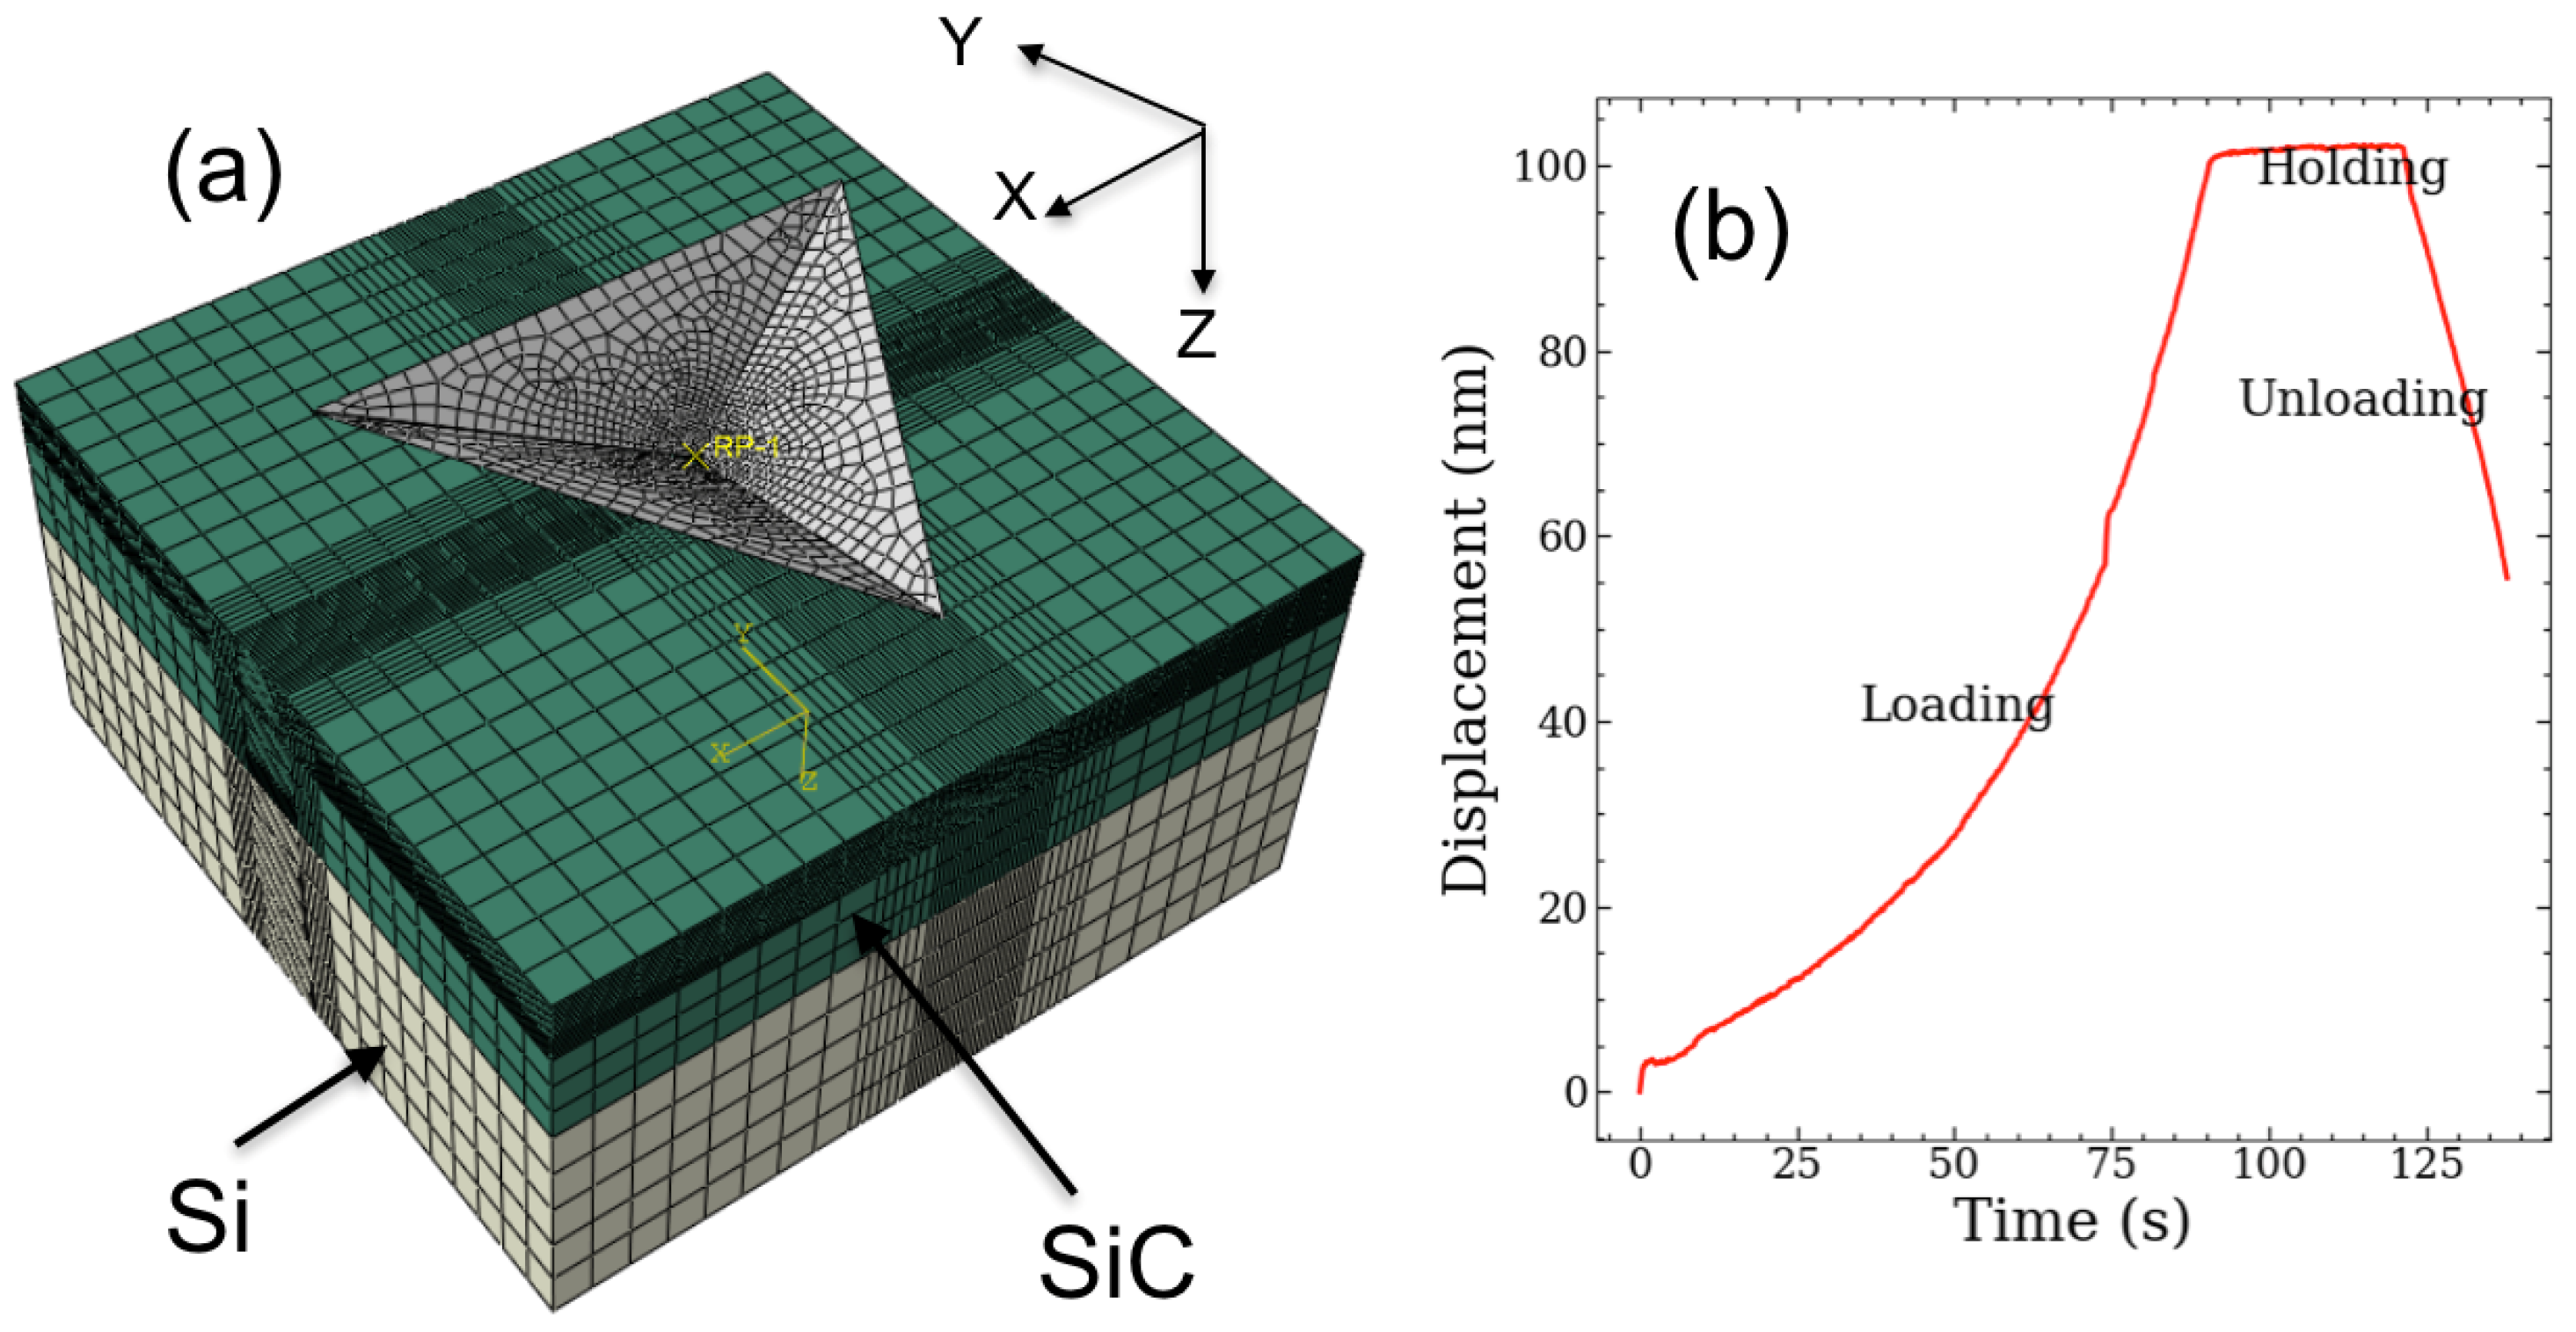
In the present work, nanoindentation into the (001) surface of a 3C-SiC single-crystal was simulated with a finite element (FE) model, see Figure 2. The indenter geometry and the maximum displacement were set to match those of previously published experimental work [29] such that a quantitative comparison of the force-displacement curves was possible. The FE models of nanoindentation tests were created following the strategy of Zhao et al. [29]. The model consists of a Si substrate with a top layer of 3C-SiC. The dimensions of the sample were set to m, resulting in 66,000 hexahedral elements of type C3D8. The size of the elements adjacent to the indenter is 40 nm, which has been found to be sufficient for FE simulations to converge numerically. The indenter was modeled as a discrete rigid body such that it does not contribute to the deformation of the system. In order to restrict any rigid body motion, the bottom surface of the model was fixed in all directions. The contact behavior is governed by the penalty method, with a friction coefficient of 0.1. The finite element simulations have been performed with the commercial tool Abaqus with explicit solution.
To achieve a quantitative comparison between experimental and numerical load-displacement curves, the normalized mean squared error (NMSE) was introduced as
Here, and are the average of the experimental and simulated load values, respectively. and ( are experimental and simulated load values taken at similar indenter displacements. The NMSE was then treated as the objective function to be minimized during an iterative process to identify the material parameters. To accomplish this, a genetic algorithm was used, in which the parameters of the DP model were updated at each subsequent iteration based on the fitness of the load-depth curve. The parameterization process was terminated once the NMSE is smaller than , following the criterion used by Sajjad et al. [30]. It is noted here that only the load-displacement curve for an indentation depth of 105 nm was used for this inverse parameters identification; later we validated the optimized parameter set by conducting the nanoindentation for other applied maximum indentation depths.
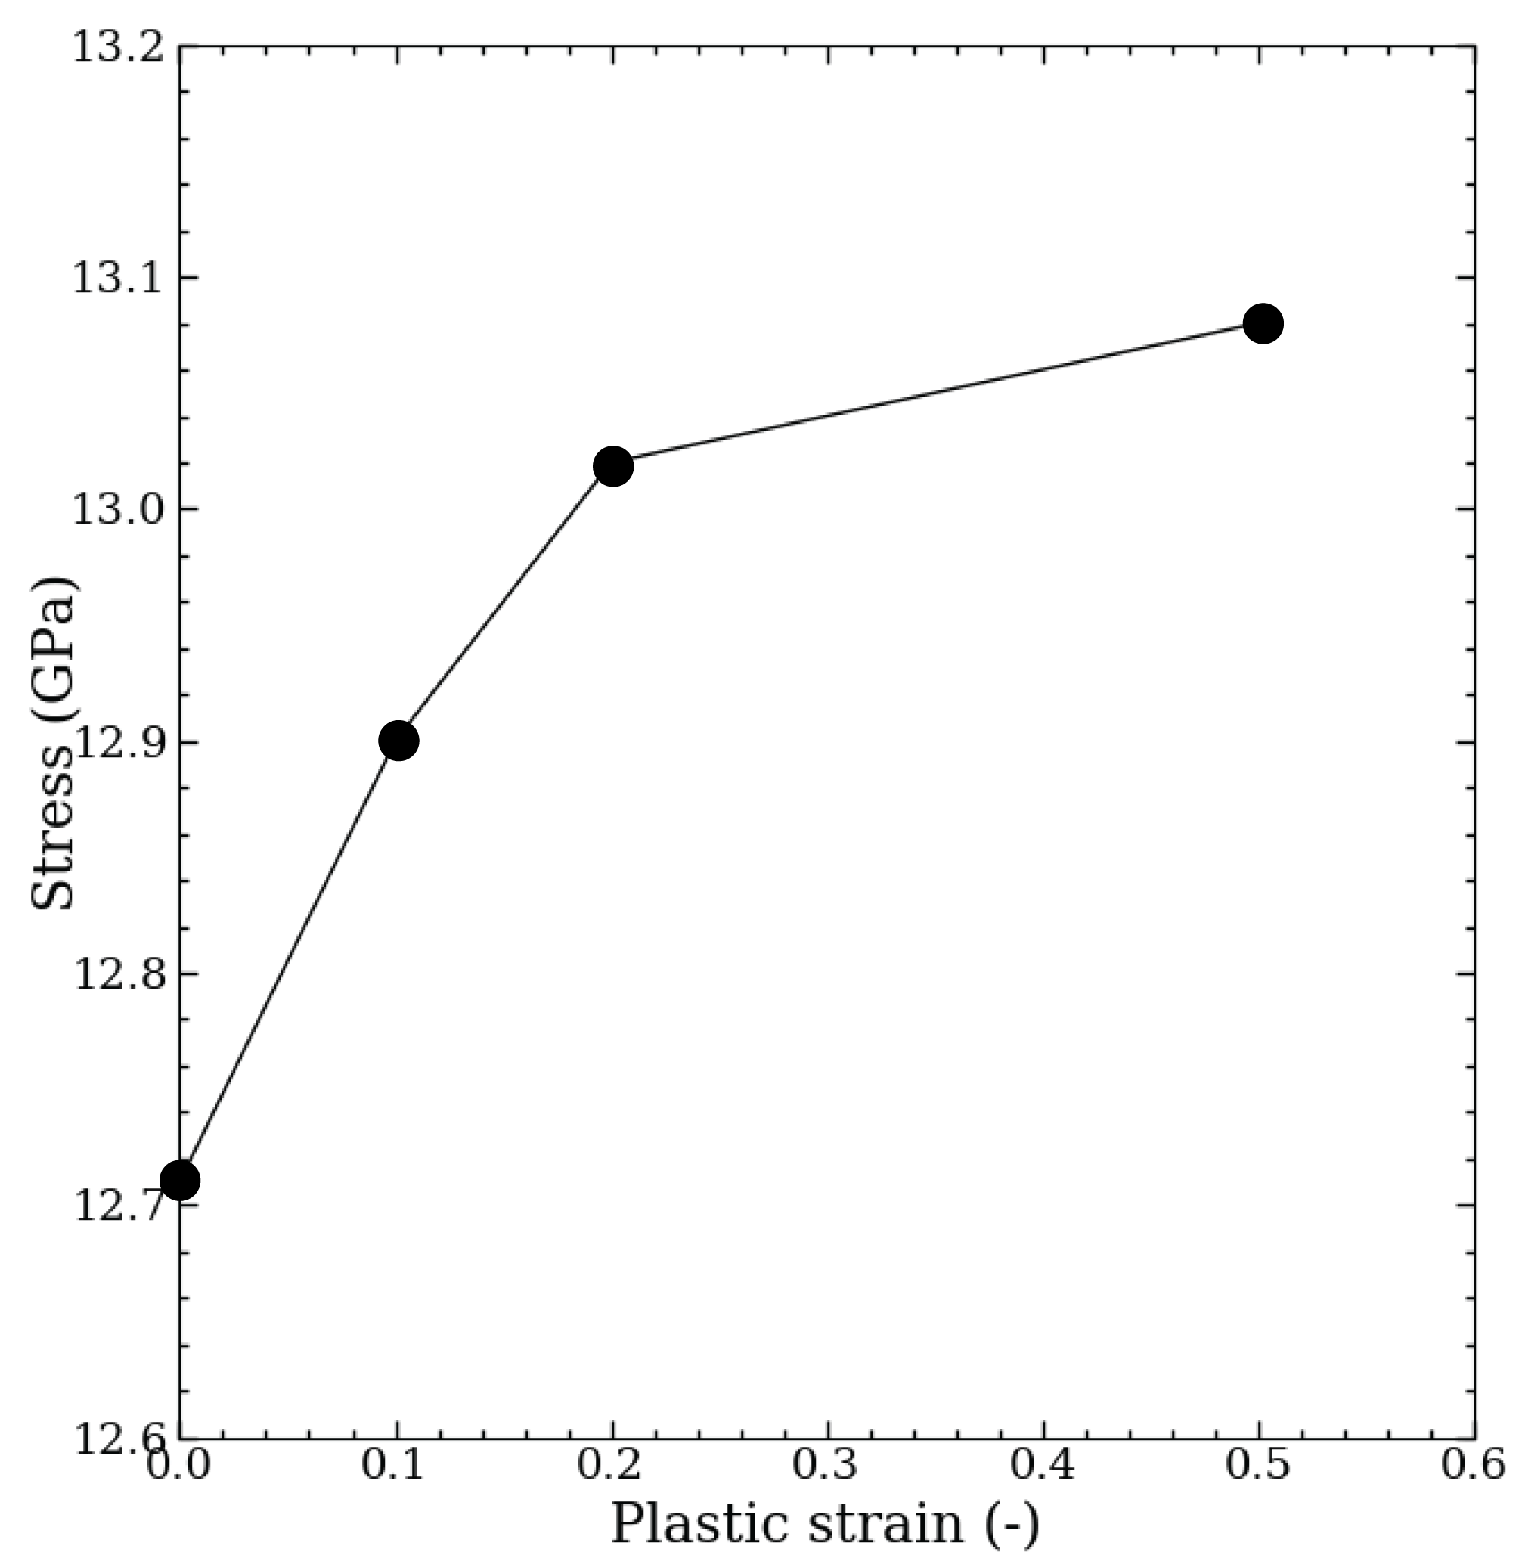
During the inverse analysis, we included work hardening by incorporating the yield stress as a function of plastic strain , as shown in Figure 3. The initial guess of the yield stress at zero plastic strain was adopted such that the values closely match the Peierls stress of 3C-SiC (12 GPa) as described by Zhao et al. [20]. During the optimization, the values for finite plastic strains were altered iteratively to fit the nanoindentation load-displacement curve for a maximum indentation depth of 105 nm.
In order to determine the parameters of the critical equivalent plastic strain for the damage evolution as given in Equation (6), we considered the shear stress ratio as an independent variable, as shown by Hooputra et al. [26]. We calculated the equivalent plastic strain for several combinations of a, b, and c. The corresponding shear stress ratio and the critical equivalent plastic strain was then used in the FE simulation to calculate the cutting force-vs.-depth curve. Finally, the combination of a, b, and c was chosen in such a way that the corresponding force–depth behavior closely followed the force depth-behavior of covalently bonded materials as shown by Zhang et al. [13].
The material parameters for 3C-SiC obtained from this inverse procedure are summarized in Table 1.
2.3. Model Validation
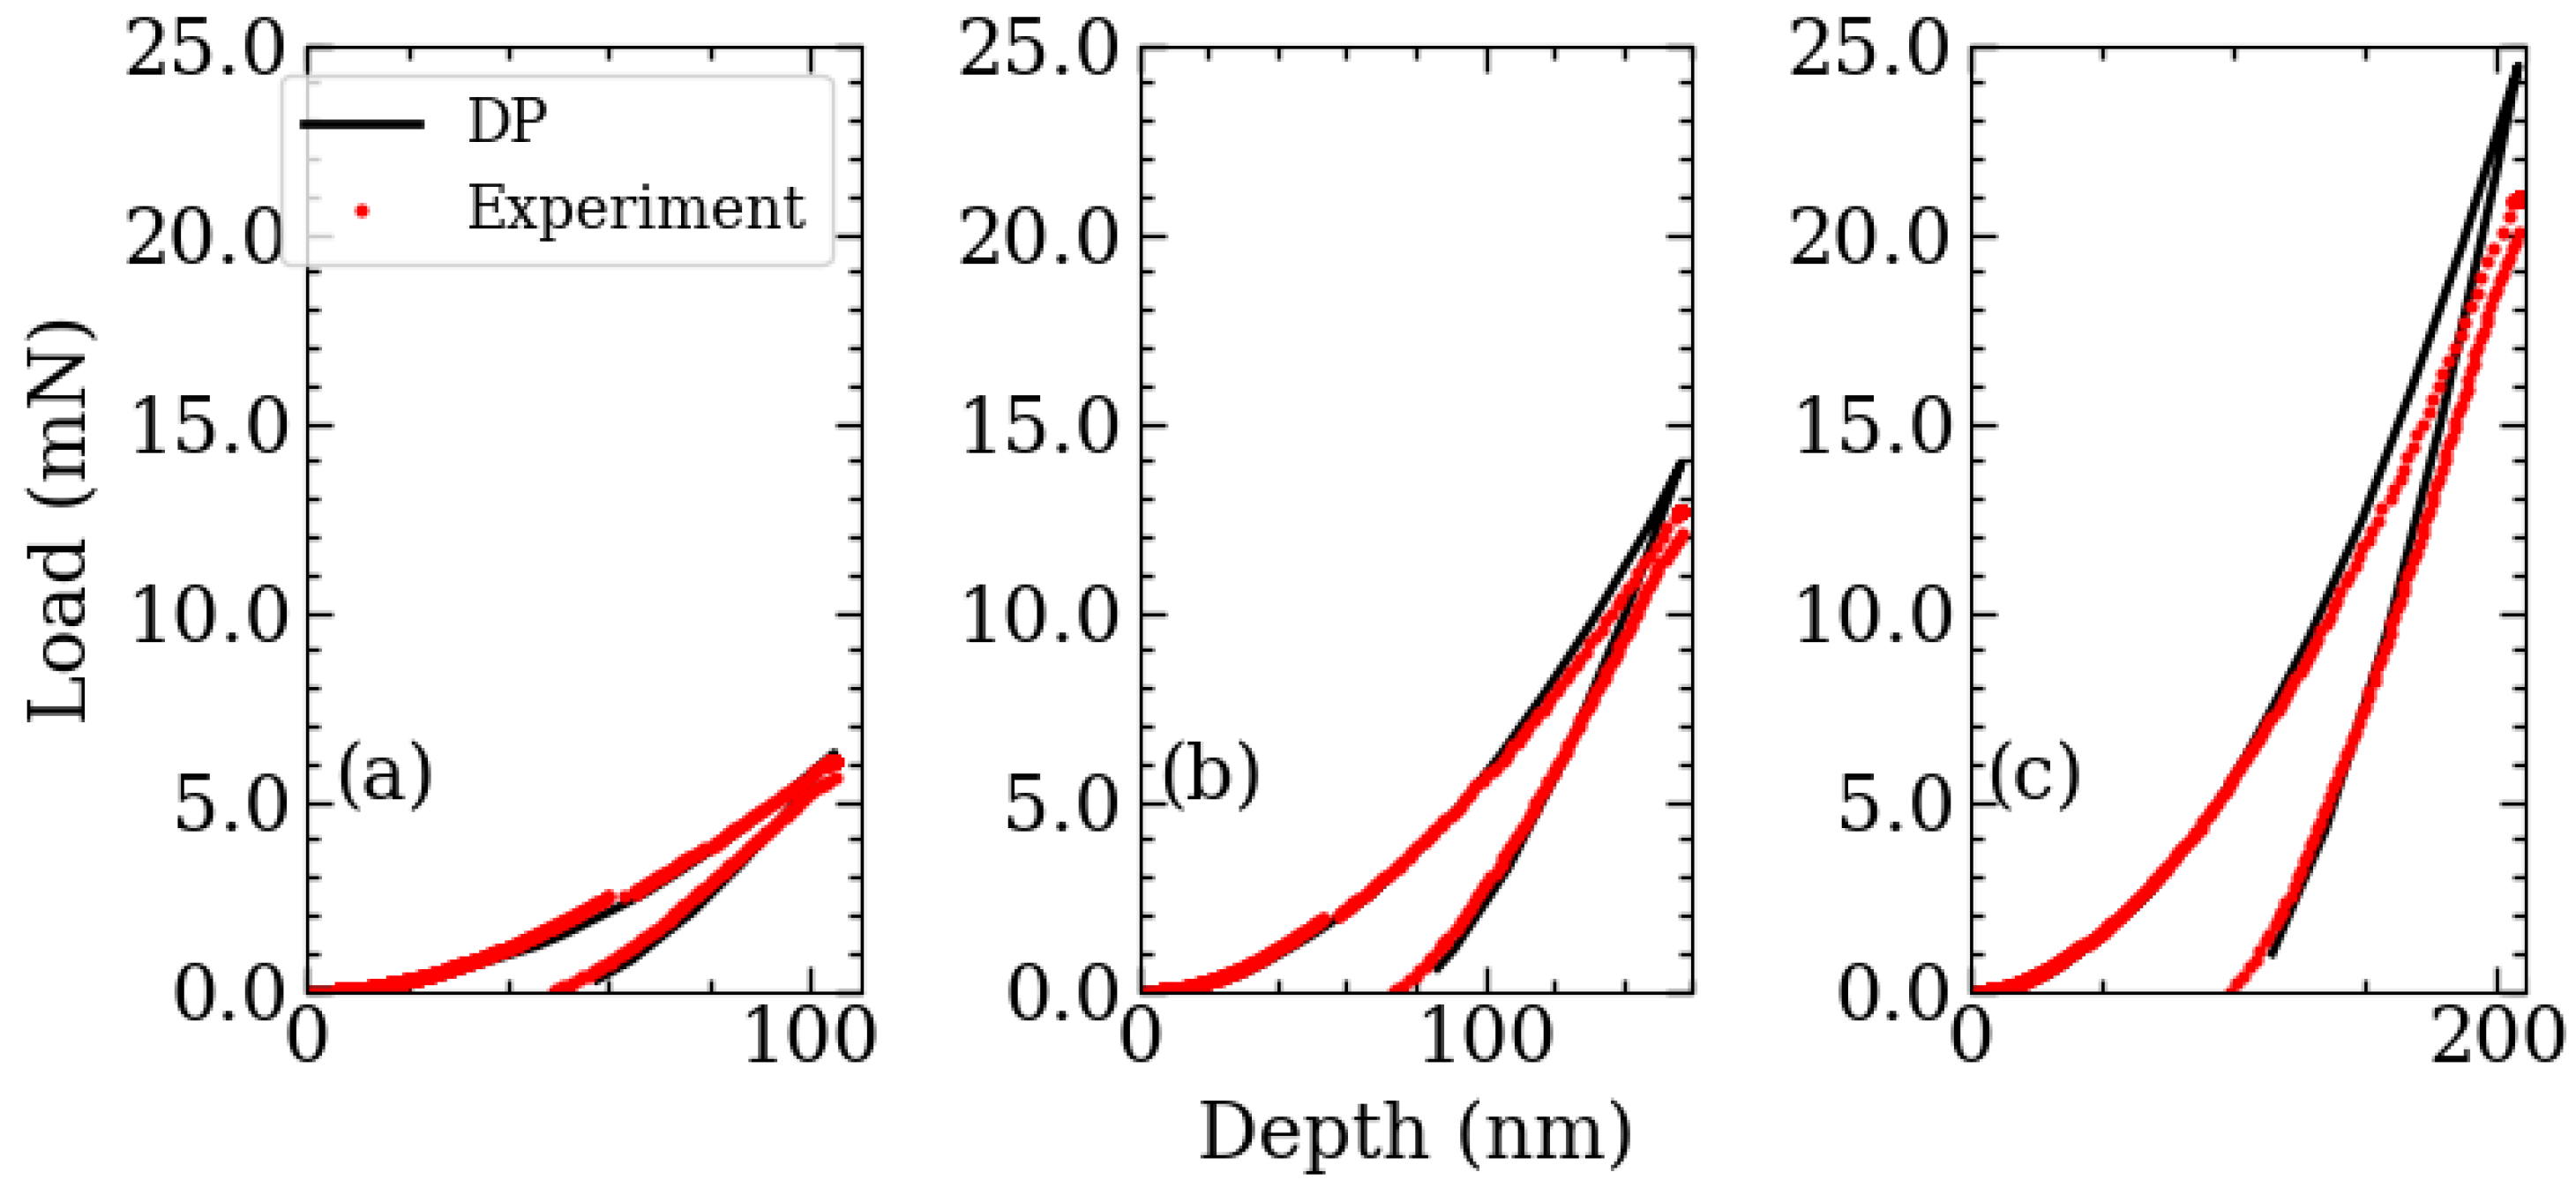
Figure 4 depicts different load-indentation depth curves resulting from the FE simulations with the material parameters obtained from the inverse analysis in comparison to experimental curves taken from the literature [29]. The experimental curve for a maximum indentation depth of 105 nm was used for the inverse analysis, as described above, yielding the material parameters given in Table 1. Hence, the FE curve in this diagram represents the optimal agreement between model and experiment, which has an NMSE value smaller than . The initial load-depth curve shows a behavior of , where P is the load, and h is the depth, indicating an elastic Hertzian contact at small depths. For validation purposes, the Young’s modulus and the hardness were calculated from the unloading stage of the load-depth curves using the Oliver–Pharr method [31,32], which has been widely used to identify these material parameters [29,33]. The experimentally derived Young’s modulus and hardness were 440 GPa and 39 GPa, respectively. The analysis of the simulation results with the Oliver–Pharr method yielded values of Young’s modulus and hardness of 446 GPa and 40 GPa, respectively, which is within ≈2% of the experimental values. Similar values of Young’s modulus and hardness have been reported by Nawaz et al. [33].
Using the fitted material parameters, we performed further nanoindentations with a maximum indentation depth of 157 nm and 208 nm. The corresponding experimental and simulated load-depth curves are plotted in Figure 4b,c, where it is seen in that the initial loading stage and the final unloading stage are captured very well. However, for indentation forces above 10 mN, the experiment behaves in a more compliant way, which can be associated with crack formation in the brittle ceramic, see [29], a mechanism that is not captured within this FE model. Using the load-depth curve, we then derived the Young’s modulus and micro hardness. The experimental values of hardness of 3C-SiC were 38.8 and 38.5 GPa for indentation depths of 157 and 208 nm, respectively. The corresponding hardness values derived from the simulation results are 40 and 39 GPa and, thus, in good agreement with the experiment. Furthermore, the derived experimental (simulation) values for the Young’s modulus at the given maximum indentation depths were 436 GPa (431 GPa) and 406 GPa (449 GPa), which reflects the more compliant behavior of the system during larger indentation depths.
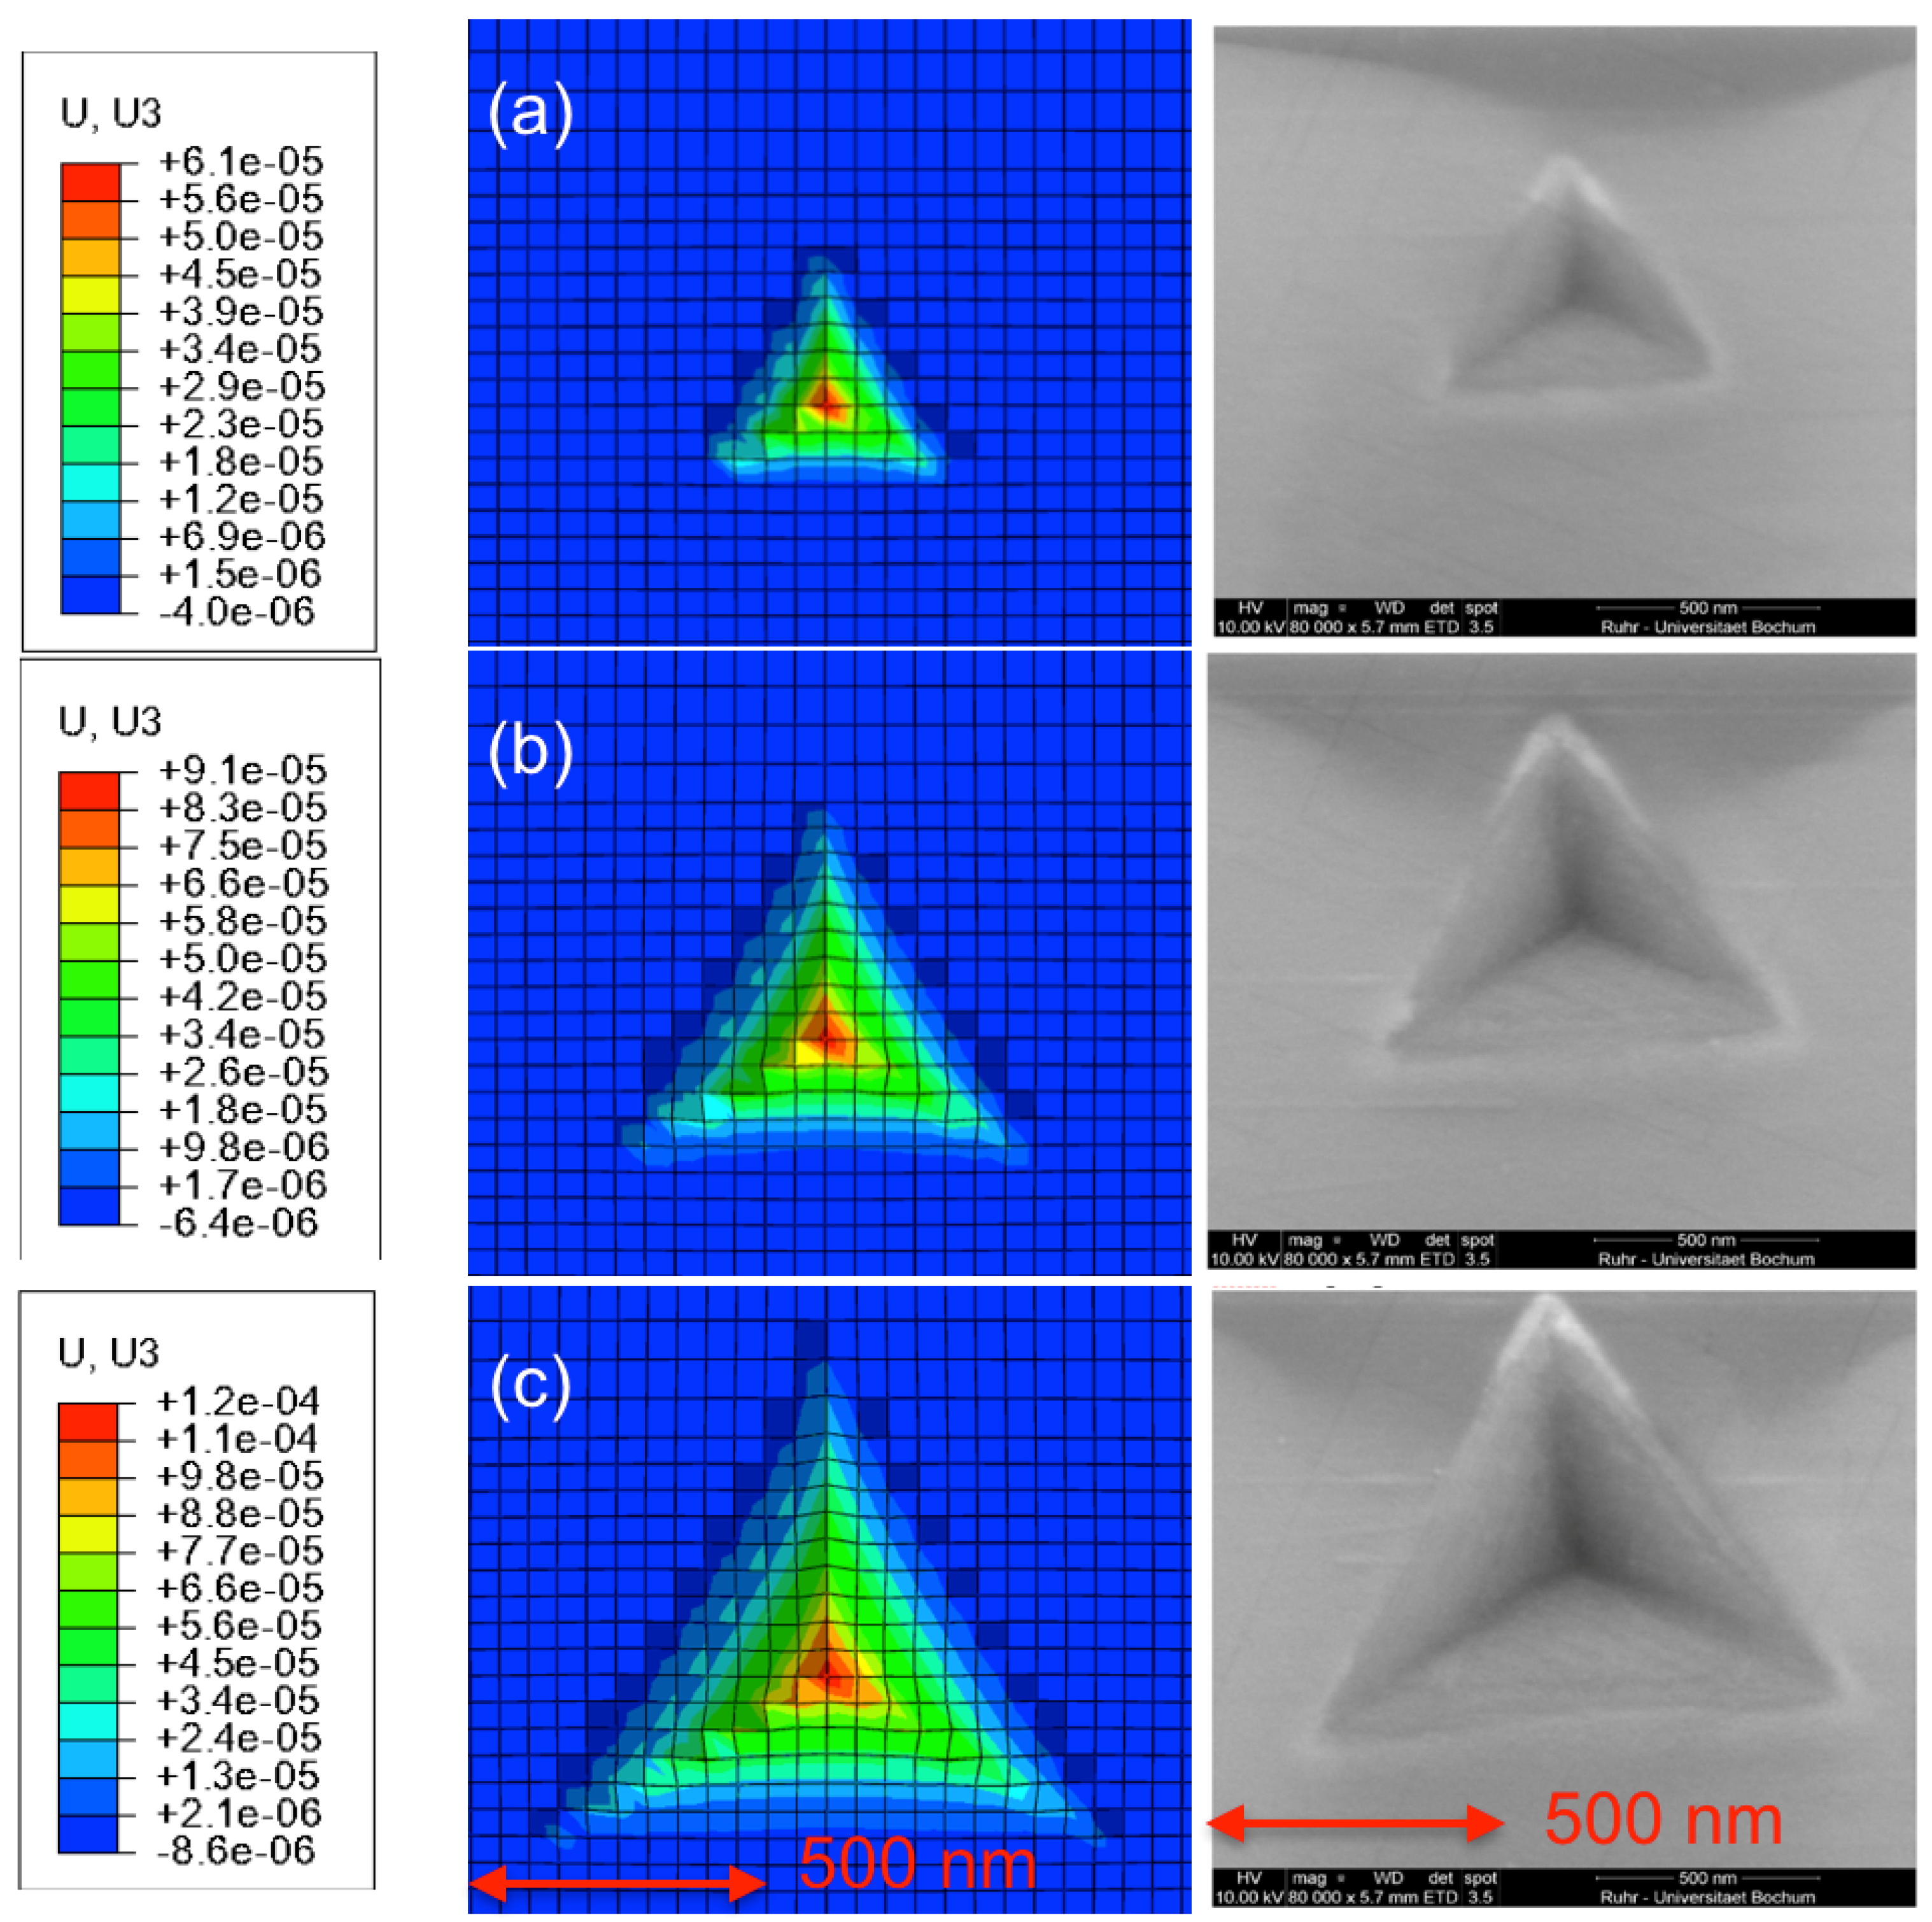
Figure 5 shows the residual imprints of the nanoindentations from the FE model (left column) and from the experiment (right column) at an indentation depth of 105 nm (a), which were used for fitting, and at depths of 157 nm (b) and 208 nm (c), which we used for validation. It is seen that a small but significant amount of plastic deformation occurs, manifesting itself in a pile-up, forming at the very corner of the contact area between substrate material and indenter.
3. Finite Element Simulations of 3C-SiC Grooving
In this section, the parameterized constitutive model for 3C-SiC is applied in the FE simulations of machining processes. In a first step, grooving simulations are performed in which the tool trajectory is characterized by a linearly increasing depth of cut. In these simulations, a transition from the ductile cutting mode at low depths of cut to brittle cutting at higher depth is observed. In the following section, these results will be validated by simulations with a constant depth of cut, demonstrating that in this case only one single cutting mode, either ductile or brittle, is observed.
3.1. Model Setup
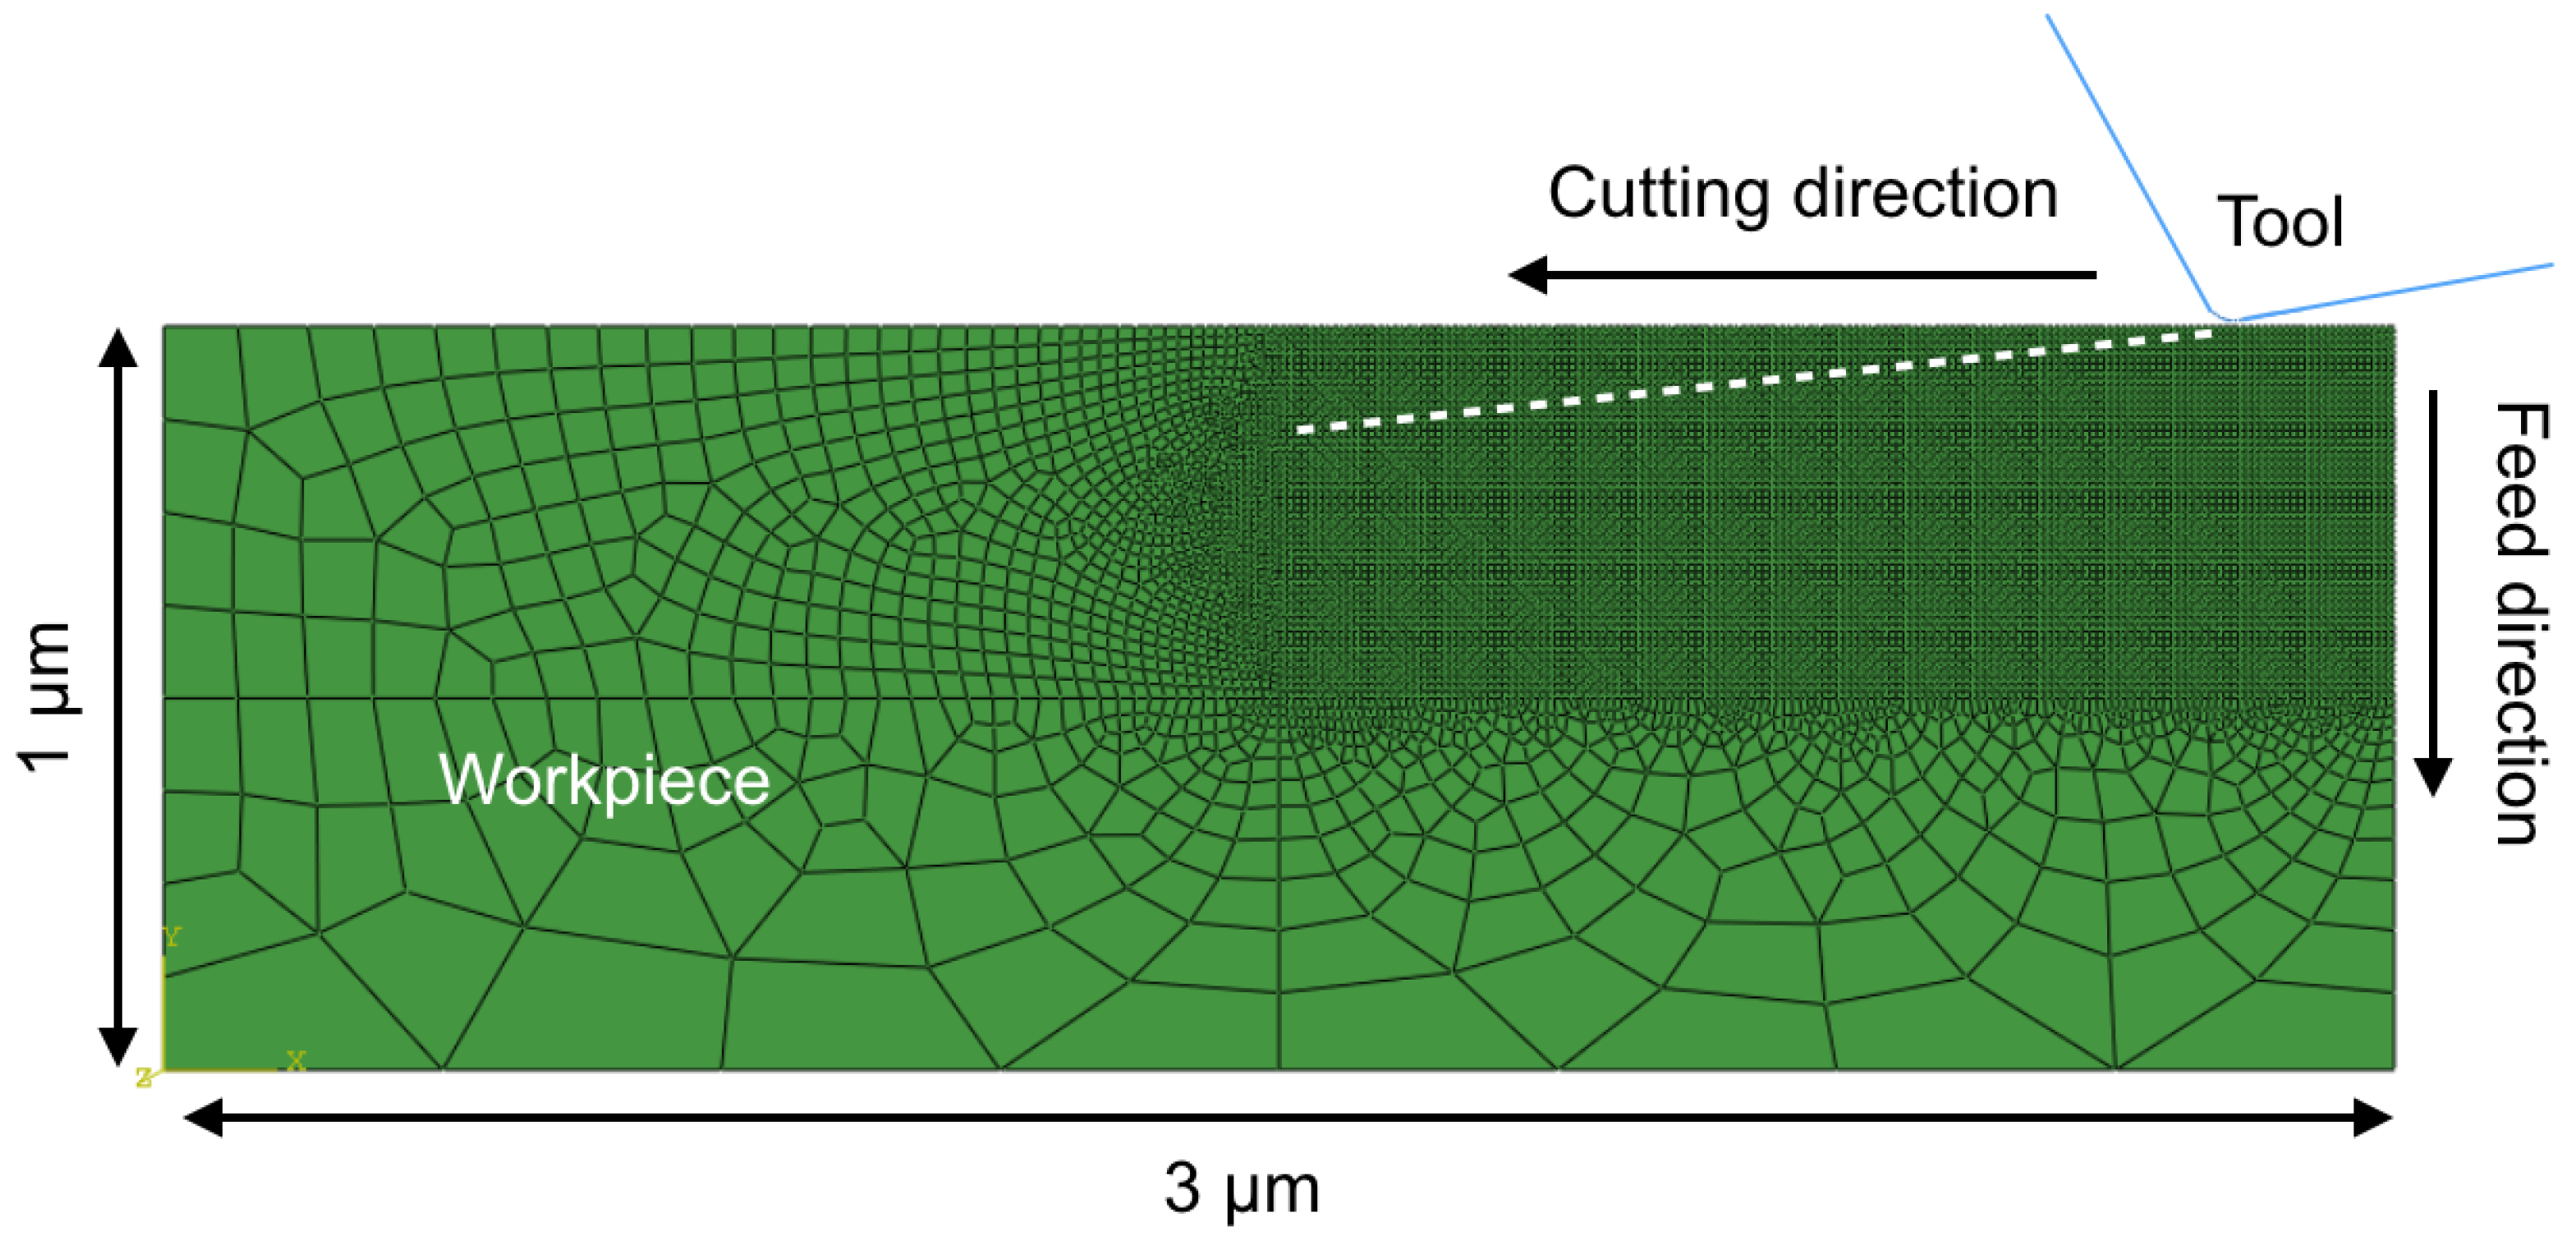
The 2D grooving simulations were performed with an FE model with dimensions of 3 × 1 m as shown in Figure 6, where the tool is moving in a horizontal (cutting) direction and vertical (feed) direction simultaneously, resulting in an angle of cut of 7. The initial contact of the tool occurs on the flat surface at some distance to the corner of the model to avoid any adverse effects of the lateral free boundary. The model was meshed with a 4-nodes linear plane–strain element with a reduced integration scheme (CPE4R). From a thorough convergence test, an element size of 10 nm was found to be sufficient for the convergence of the results. As seen in Figure 6, this fine mesh size is only used in the process region, whereas in the remote areas, a coarser mesh was considered for the sake of keeping simulation times as short as possible. In the coarse region, the mesh was generated by the single bias method with a minimum element size of 10 nm. This method ensures a smooth transition of the mesh from finer to coarser regions, thus minimizing the effect of the mesh on the cutting process. The degrees of freedom at the bottom of the workpiece were fully restricted, while the top and side parts were free. The cutting tool has a relief angle of 10 along with an arch-shaped cutting edge radius of 40 nm. The center of the arch was chosen to be the reference point. The cutting tool was modeled as a rigid body to exclude the influence of tool compliance on the deformation process of the system. The outer part of the tool acts as a master surface during the contact while the workpiece acts as a slave surface. A kinematic contact method was chosen for the surface to surface contact. The friction formulation of the contact was characterized by the penalty method in tangential direction and by the hard contact method along normal direction. Similar to the nanoindentation simulations performed in the previous section, a friction coefficient of 0.1 was used. During the grooving process, the cutting tool moves with a speed of 30 mm/s along the cutting direction and with a speed of 4 mm/s along the feed direction, in agreement with the values for grooving experiments and simulations for Si adopted by Zhang et al. [13]. The maximum cutting length was 1.0 m and the maximum depth of cut was 0.15 m. We have performed the grooving simulations for rake angles of −15, −22.5 and −30, to study the influence of the rake angle on the BDT depth. The choice of only negative rake angles is motivated by the intrinsic brittleness of the material. As brittle failure is characterized by the crack nucleation under tension, such negative rake angle suppresses the formation of brittle cracks in the subsurface region [34]. Consequently, negative rake angles have typically been used in both experiment and simulations [11,13].
3.2. Results
The results of the FE simulation are firstly analyzed with respect to the resulting cutting force as a function of the depth of cut. The simulations show that during the initial stage of the grooving, the material undergoes significant plastic deformation. The stress is concentrated at the vicinity of the contact region of the cutting tool and the workpiece, i.e., in the primary deformation zone. With the advancement of the cutting tool, the stress concentration and the corresponding grooving forces increase at first with very small oscillations, as shown in Figure 7, where the grooving forces resulting from the different rake angles are plotted. Once the depth of cut of 0.025 m is exceeded, a sharp drop in the force occurs, marking the removal process of a first larger segment of the workpiece. After that, the force-vs.-depth curve is characterized by very large fluctuations that are caused by the periodic building-up of high contact stresses and their sudden relief. Each force drop is assumed to be attributed to the initiation of brittle failure in the contact region between cutting edge and workpiece, which can result either in a large segment of the workpiece being removed from the surface or in the formation of a subsurface crack. The maxima of the cutting force increase throughout the cutting process, finally exceeding values of 2 N, whereas the minima after the force drops reach almost a value of zero. There are no significant qualitative differences in this behavior for the chosen rake angles, except that the frequency of the force drops seems to be lower for the most negative rake angle.
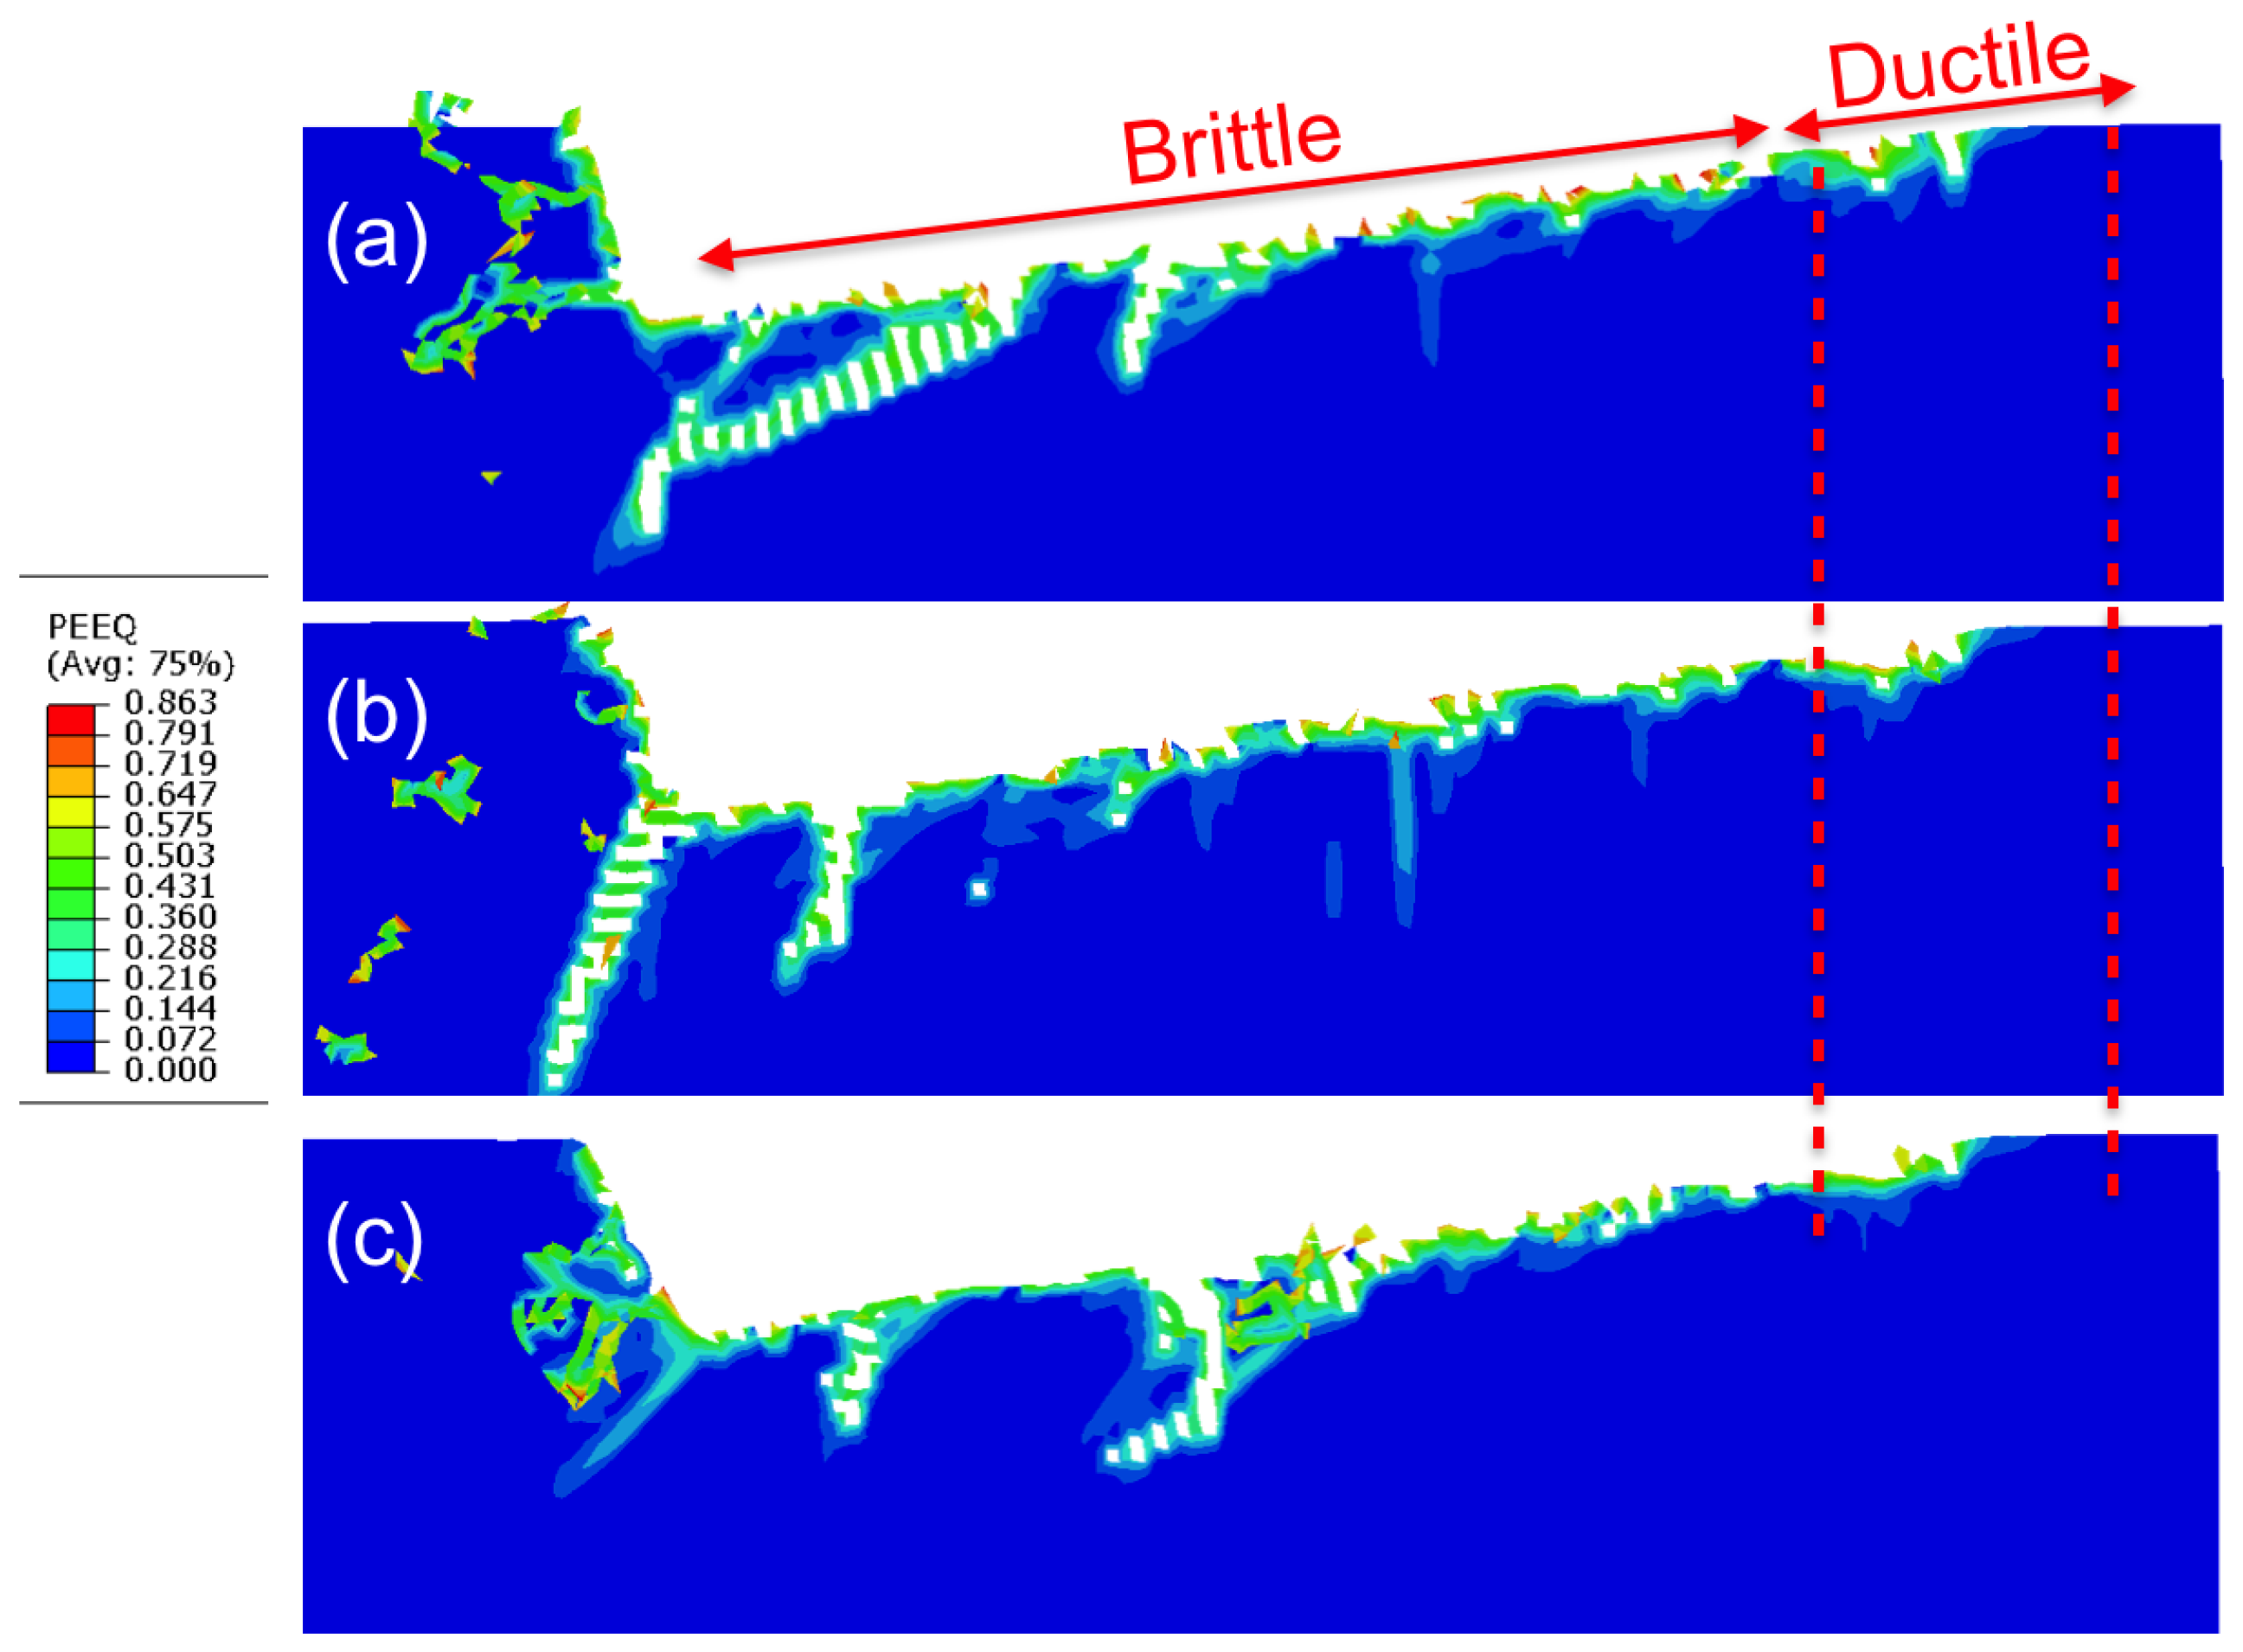
Figure 8 further shows the equivalent plastic strain distribution in the process zone after the grooving simulations. The magnitude of equivalent plastic strains and their distribution throughout the workpiece remains similar for all three rake angles. It is also seen that the plastic region is very thin, but the subsurface volume in the brittle region is characterized by deep vertical or slanted cracks. These subsurface cracks form due to the exceedingly high tensile stresses in the process zone that occur at depths of cut above 0.025 m.
3.3. Surface Roughness
We further characterized the machined surfaces by calculating the surface roughness, defined as
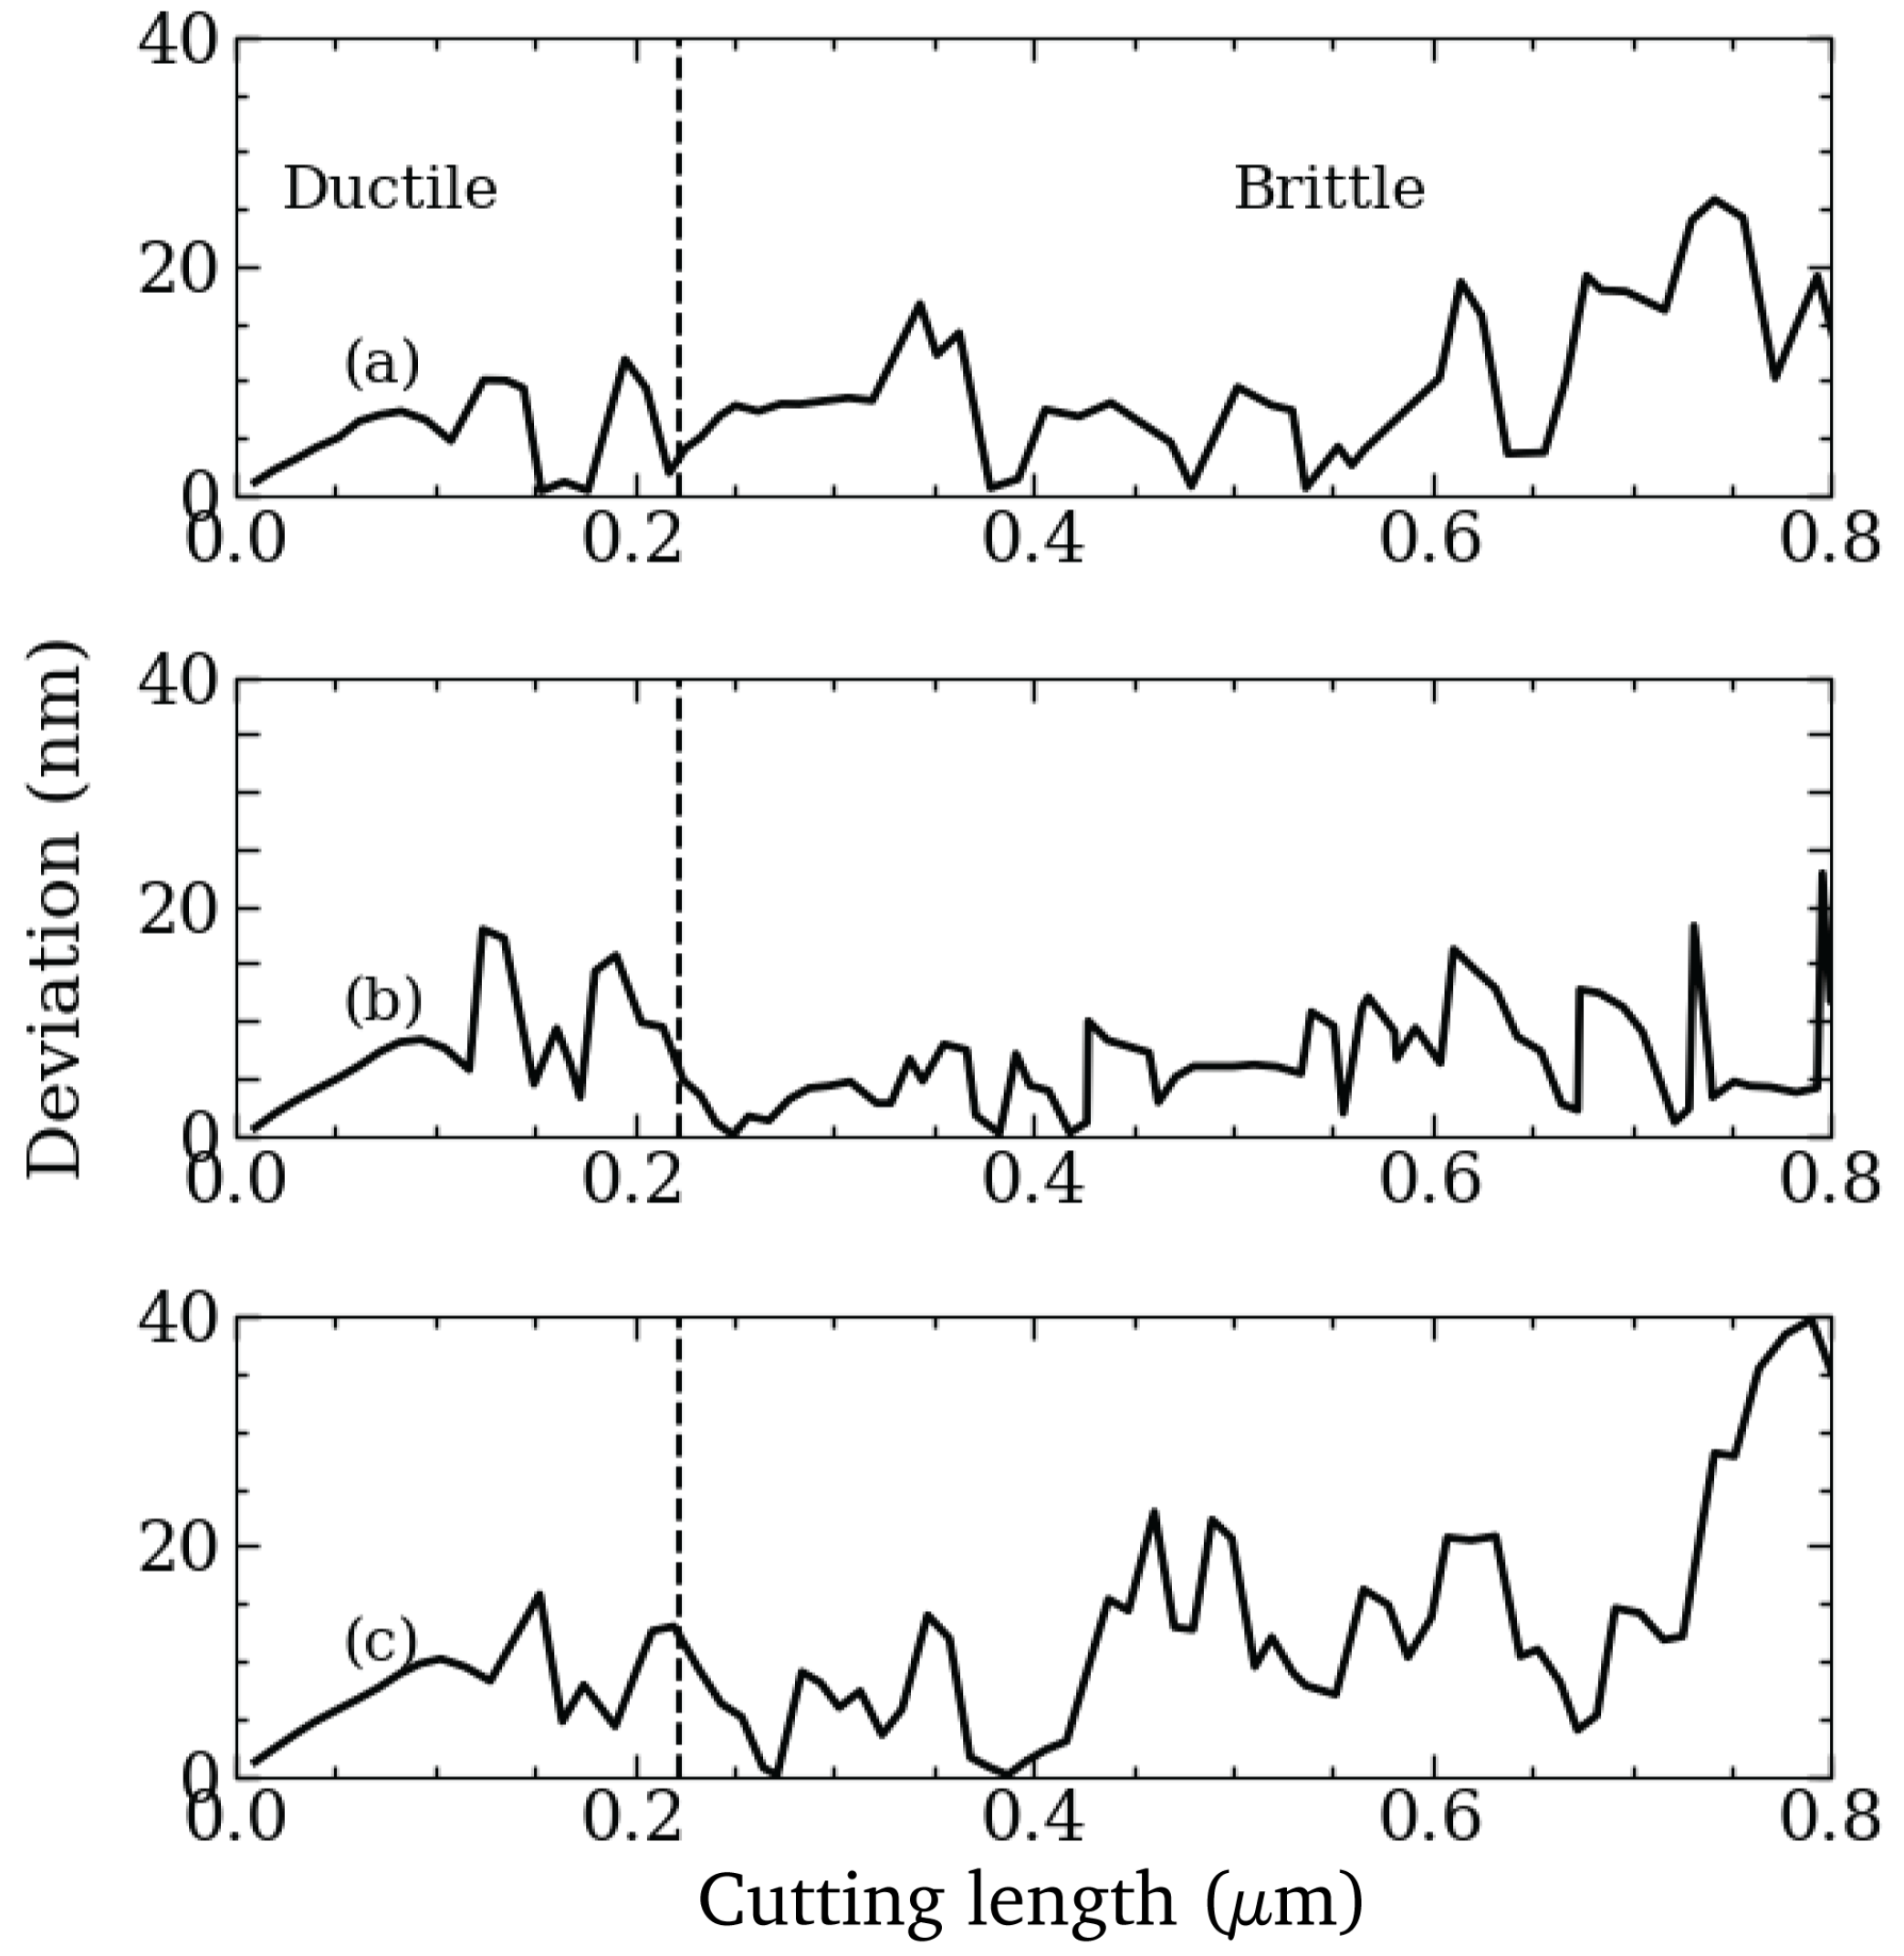
where x is the cutting length along grooving and is the deviation of the surface profile from the line of grooving, i.e., from the prescribed trajectory of the cutting edge. Figure 9 shows the absolute deviation of the surface coordinates as a function of the grooving length. The deviation of the surface coordinates is rather small before the cutting length of 220 nm is reached, corresponding to a depth of cut of 27 nm. Beyond this value, the surface deviations are higher, growing exceedingly for cutting lengths beyond 500 nm. As the surface topology is given by the distance between the newly created surface and the reference line, it is influenced by both, plastic deformation and the formation of cracks. The values for the surface roughness obtained by numerically evaluating Equation (10) are given in Table 2. This quantitative evaluation corresponds well to the qualitative impression obtained from Figure 8, where it is seen that the surface is smoother before the first force drop. The surface roughness values in this ductile region are 5.0 nm, 6.7 nm and 7.3 nm for the rake angles −15, −22.5 and −30, respectively. After the initial force drop the surface roughness varies from 9 nm to 15 nm with increasingly negative rake angles. All obtained roughness values for the different rake angles are specified in Table 2.
Therefore, the low and higher surface roughness clearly separates the brittle and the ductile regime. However, it is also noted here that the division into a brittle and ductile region for the cutting process is much clearer when considering the force signal, as compared to the roughness. Both evaluation methods consistently show that the rake angle does not influence the critical depth of cut at which the BDT occurs, although the roughness values in the brittle region increase with more negative rake angles.
4. Verification of Brittle and Ductile Cutting Models
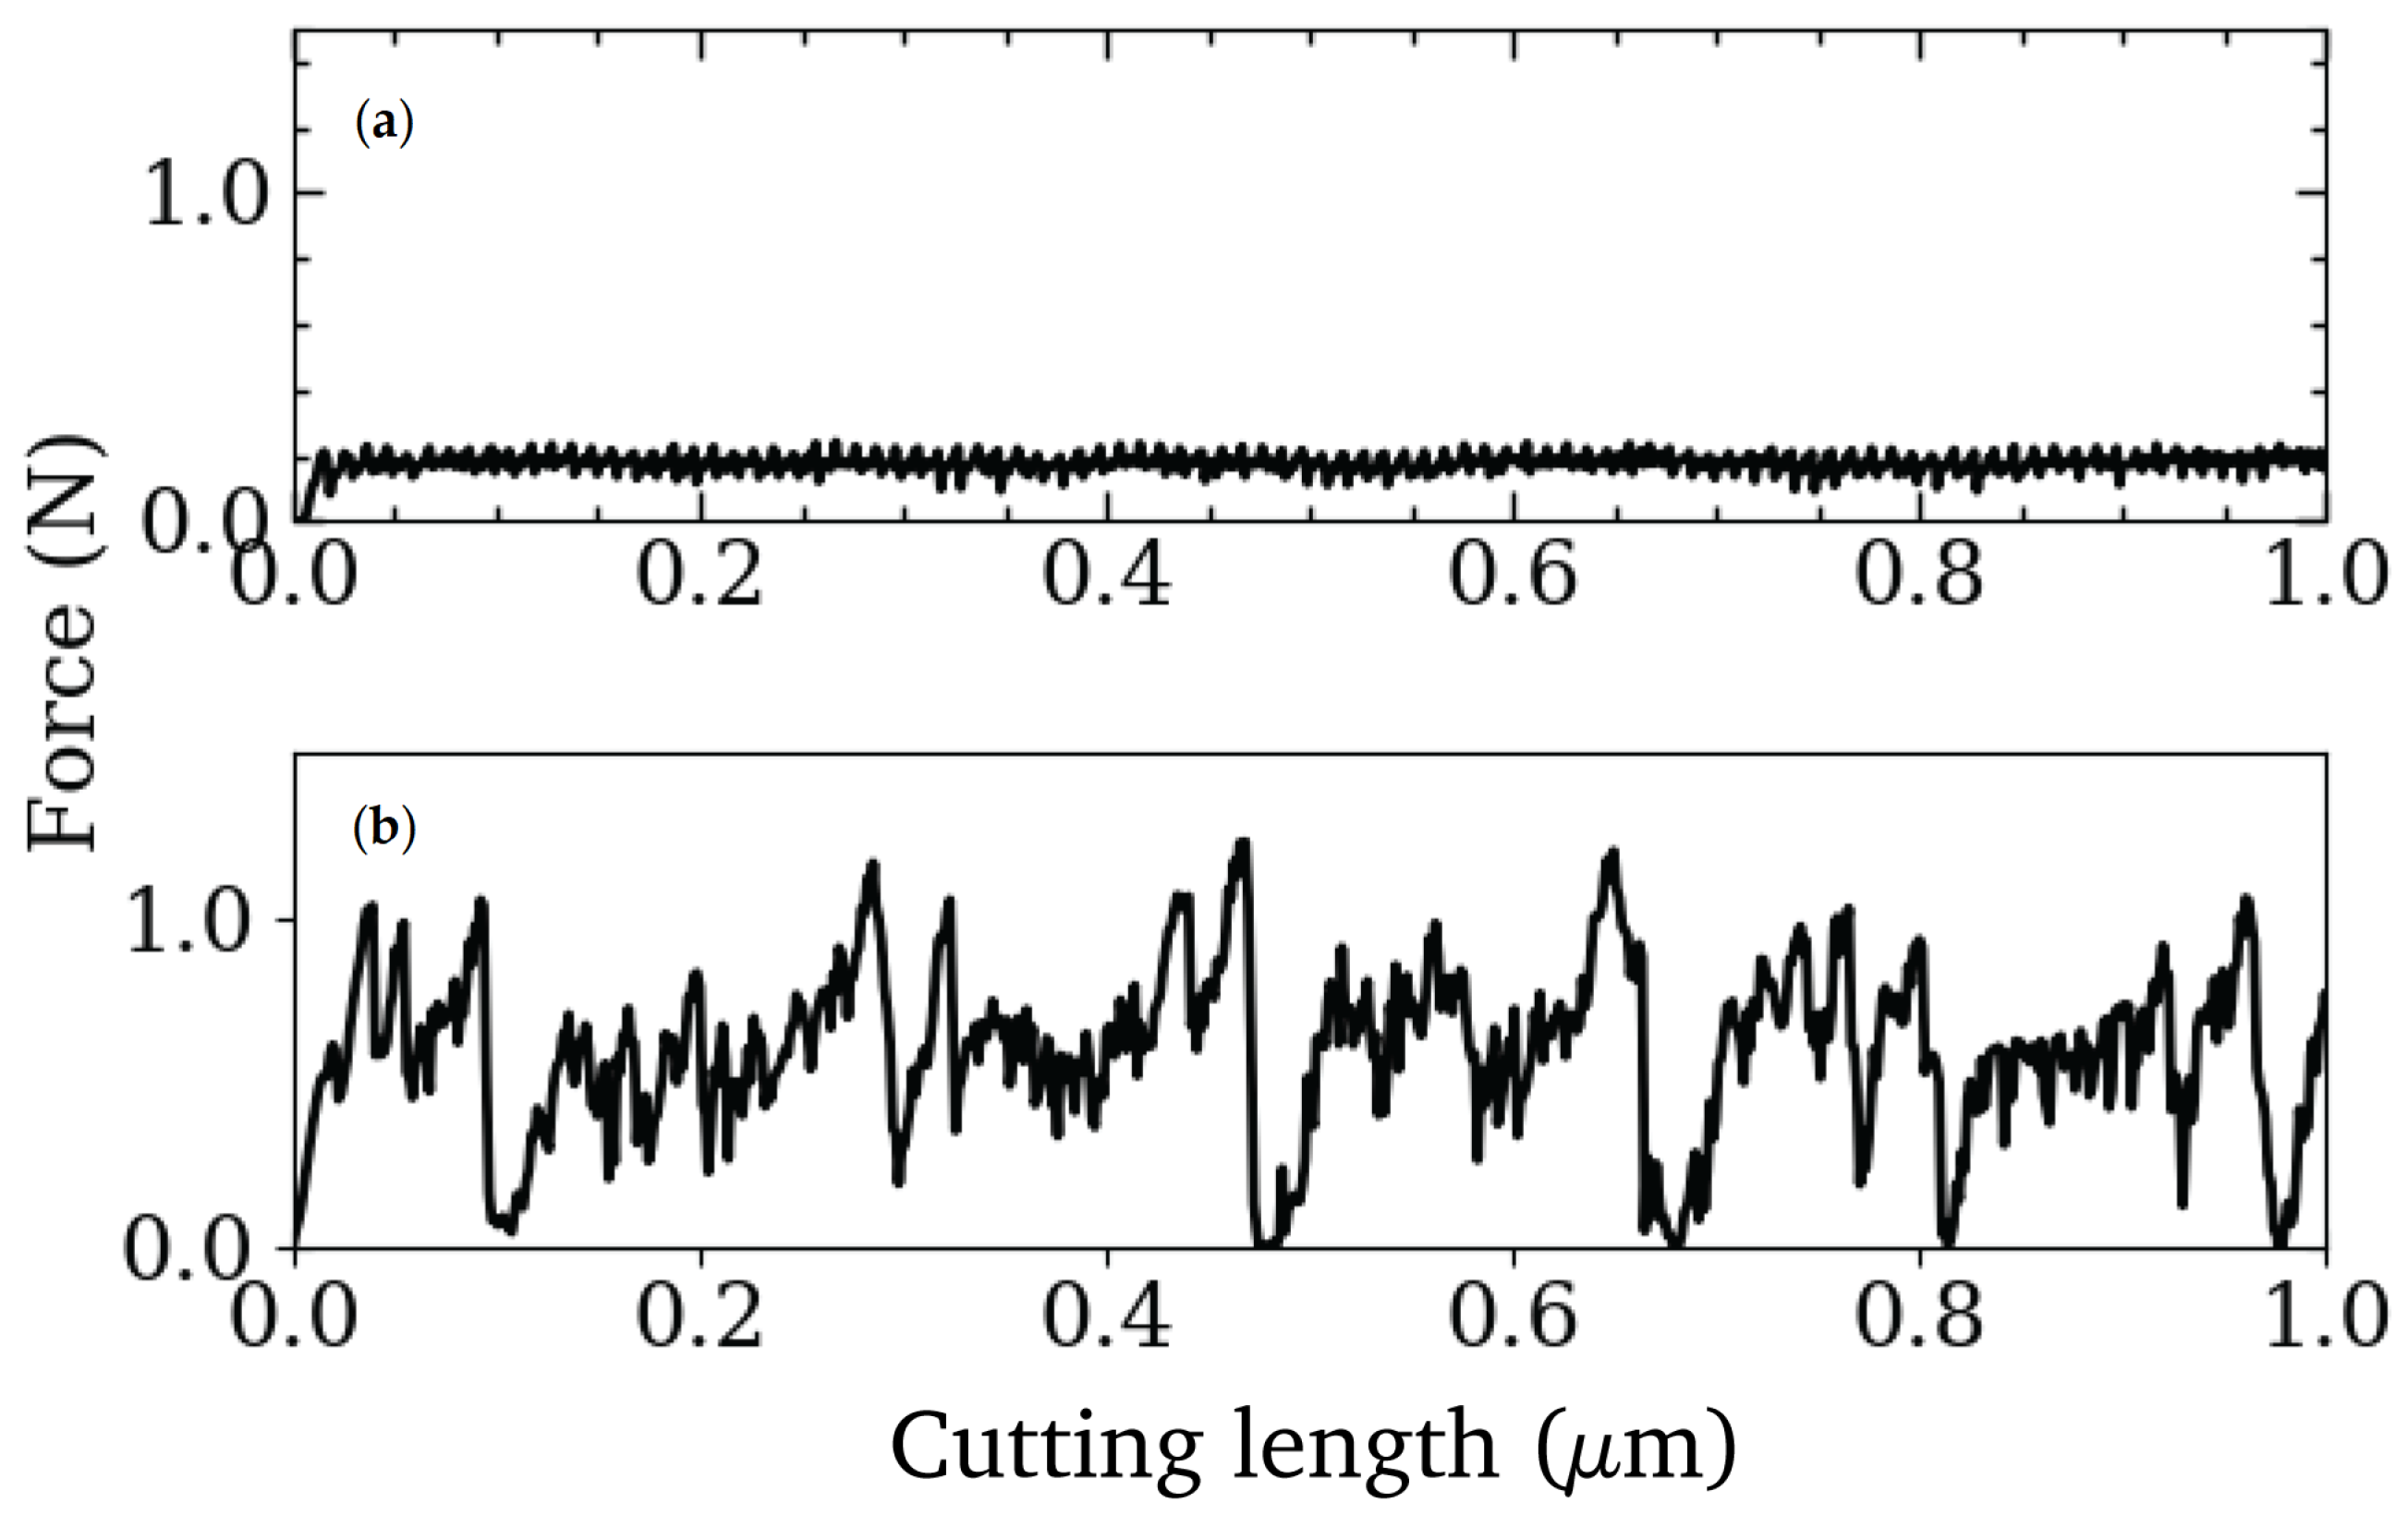
To verify that the grooving simulations give an accurate indication of the critical depth of cut at which the BDT occurs and to further investigate the brittle and ductile cutting mechanisms of 3C-SiC, we have performed two simulations at a fixed depth of cut of 20 nm and 30 nm, respectively, i.e., below and above the critical value of about 25 nm obtained from the grooving simulations. Figure 10 shows the corresponding cutting force vs. cutting length curves.
As seen in Figure 10a, the cutting force obtained for 20 nm depth of cut shows only very small oscillations, comparable to the ductile part of the grooving simulations seen in Figure 7. The average surface roughness of this depth of cut is nm, which is an even smaller value than obtained from the ductile region in grooving. The behavior of the cutting force is also consistent with results of Arif et al. [35] for Si, a similar covalently bonded material. The force during the advancement of the cutting tool in a constant depth of cut constitutes of bending and compressive components. However, for the brittle material and negative rake angles, the contribution of bending stress is negligible in the cutting force and the main component results from compression, which results in a smooth shearing mode of the material removal process.
Figure 10b shows the cutting force vs. cutting length for the larger depth of cut of 30 nm, which is above the BDT of the grooving simulations. The cutting force at this depth is characterized by large oscillations, ranging from 0 to more than 1 N. The surface roughness obtained for this depth of cut is nm, which is an order of magnitude larger than for the lower constant depth of cut, but still slightly smaller than the roughness resulting from the brittle cutting mode in grooving. In fact, the value is close to the roughness obtained for ductile grooving. The larger surface roughness values seen for the grooving simulations when compared to the cutting at constant depth, are associated to the higher difficulty for the material to shear off when the tool trajectory points into the material and, hence, the shear components of the stresses of the process regions are smaller compared to the compressive stresses. However, large compressive stresses in front of the tool tip will also cause larger tensile stresses in the rear end of the process zone, which leads to the formation of subsurface cracks there.
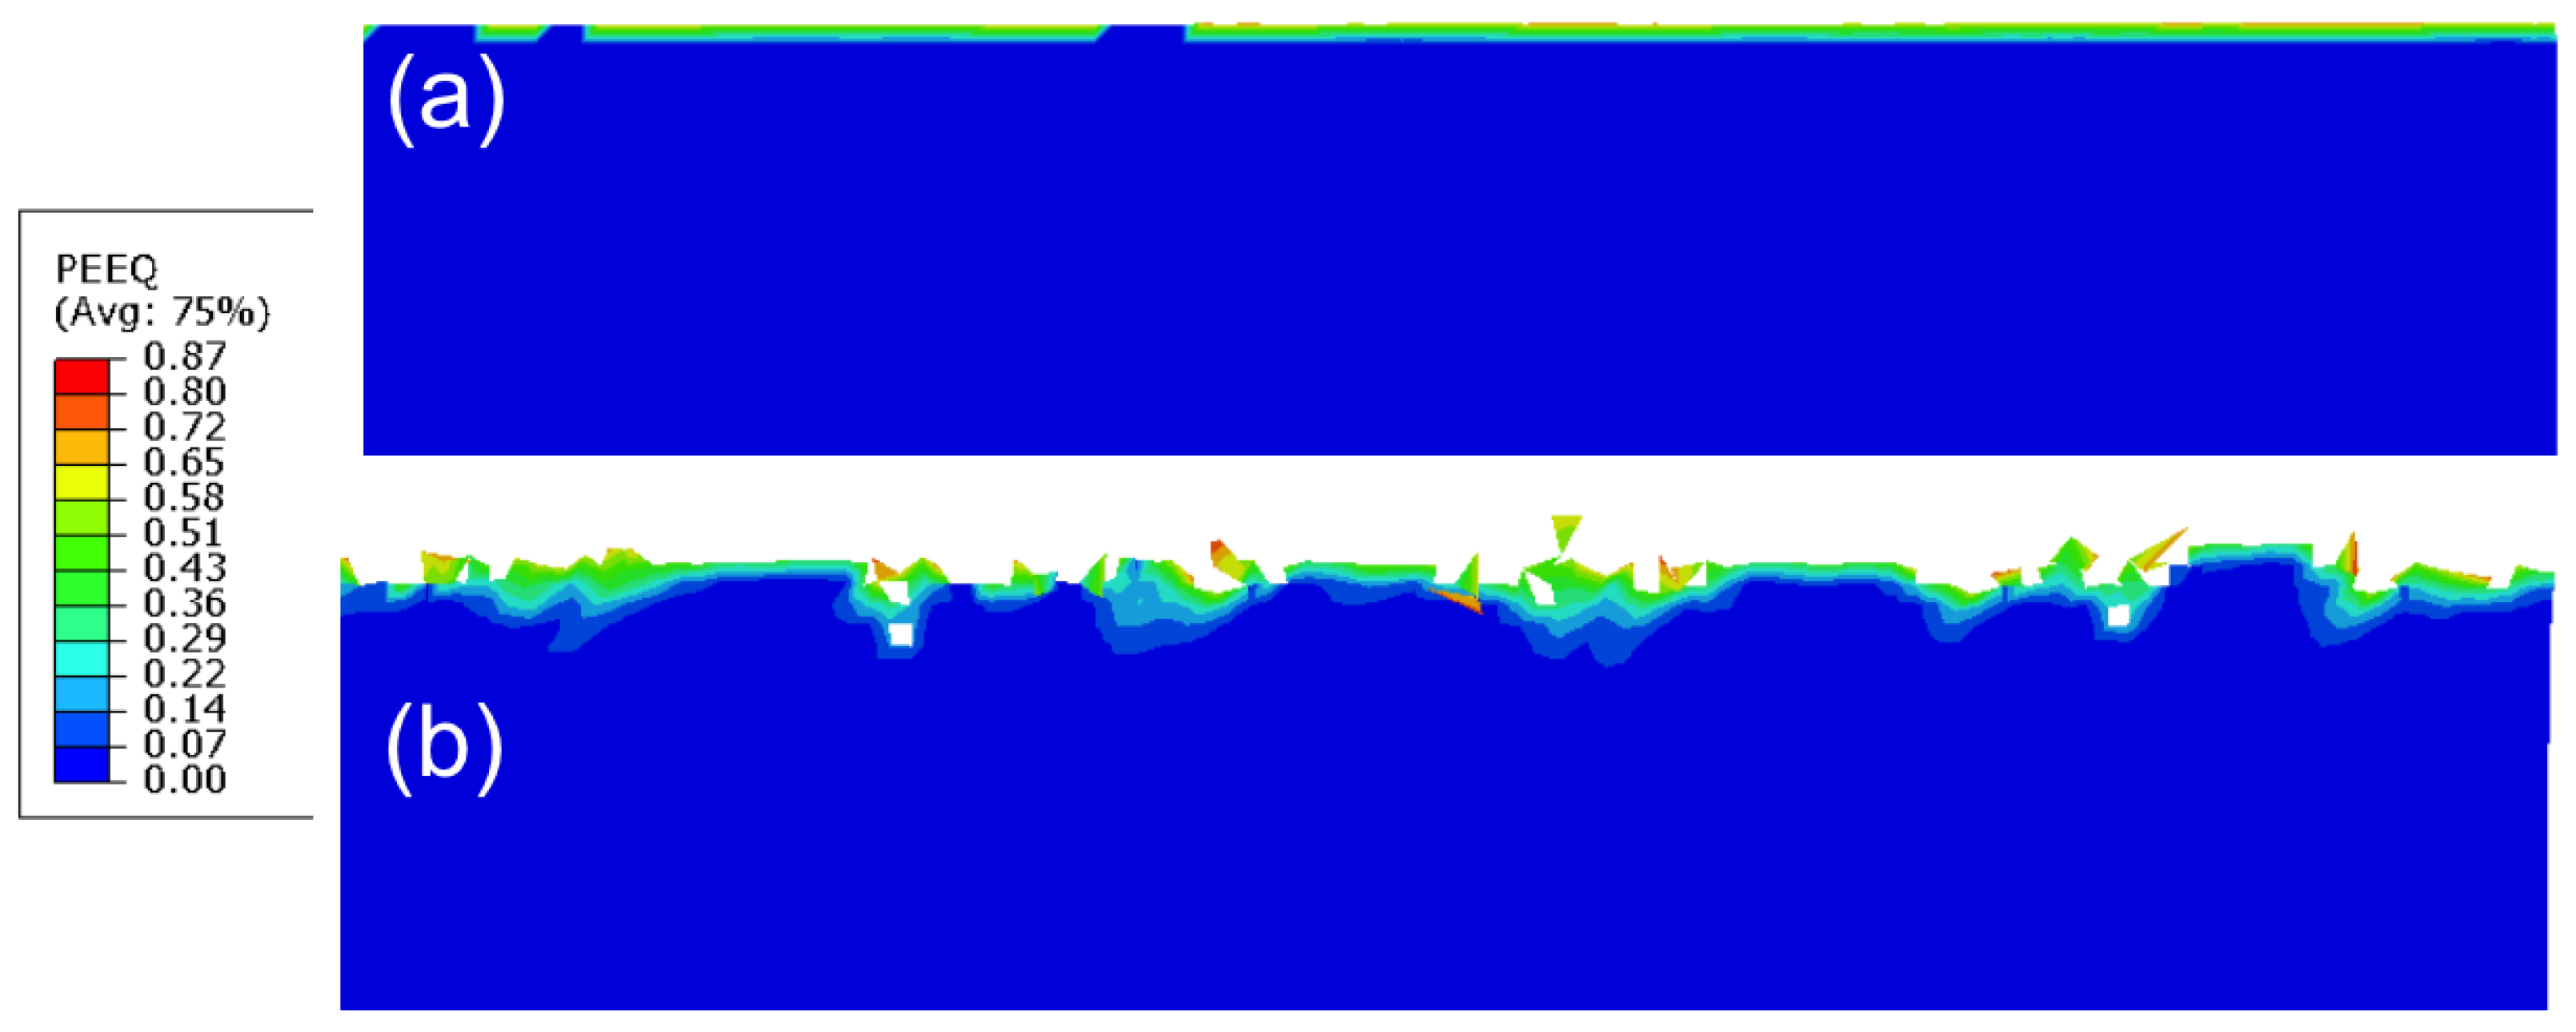
This behavior also becomes visible when analyzing the equivalent plastic strain at the newly created surface of the workpiece, as shown in Figure 11. For the smaller depth of cut of 20 nm, see Figure 11a, no subsurface cracks are observed and the plastic zone is very smooth and exhibits an almost constant depth. In contrast, for the higher depth of cut, shown in Figure 11b, the plastic strains are rather unevenly distributed along the surface, and the subsurface region is characterized by the presence of small cracks. These highly localized regions of plastic strain and subsurface cracks reflect the build-up of high stresses and the following violent bursts of material removal in the brittle cutting mode.
After analyzing brittle and ductile cutting modes for the brittle 3C-SiC ceramic and comparing the suitedness of the cutting force and the surface roughness as indicators for the type of cutting mode, our results are compared to findings in the literature to further clarify the mechanisms leading to ductile or brittle cutting. Tian et al. [19] have identified the BDT depth for 3C-SiC to lie within a range of 21–39 nm. Their SEM analysis of the surface morphology at 21 nm depth of cut showed mostly plastic material removal by shearing. With increasing the depth of cut to values of 39 nm and 48 nm, the brittle mode, dominated by fracture processes, increasingly dominates. Given the amount of uncertainty in measuring the BDT depth both from the experimental and numerical calculations, our simulated values of BDT depth of 25 nm agree very well with their experimental findings. Tian et al. further show that the low depth of cut, i.e., 21 nm, is further characterized by smaller fluctuations of cutting force, whereas for the larger depth of cut between 39 nm and at 48 nm, the cutting force exhibits larger oscillations, similar to those shown in our simulations. This furthermore confirms that the magnitude of the oscillations in the cutting force is a good indicator to separate brittle and ductile modes of cutting. A similar behavior of the cutting forces has also been described for covalently bonded Si by Arif et al. [35]. Furthermore, the grooving force during the transition varies from 0.5 to 0.8 N, depending on the rake angle; a similar range of cutting forces has been reported by Patten et al. [23] for their FE simulations of machining of 6H-SiC.
5. Conclusions
In the present study, we have applied FE simulations for a systematic investigation of brittle and ductile cutting modes during the machining of an intrinsically brittle 3C-SiC ceramic, using a Drucker–Prager (DP) constitutive relation in combination with a damage model. In a first step, the DP material parameters have been obtained by an inverse analysis of experimental and simulated nanoindentation curves. This has been accomplished by an iterative process, in which the material parameters have been varied to minimize the differences between simulated and experimentally measured load vs. indentation depth curves for a given maximum indentation depth. The thus obtained parameters have been further validated by comparing load-depth responses and remaining surface profiles between with FE simulations and experiment for different maximum indentation depths. Furthermore, it was found that the simulated values of micro hardness and the shapes of imprint profiles are in excellent agreement with experiment.
With this validated material model, grooving simulations with a linearly increasing depth of cut have been performed for three different negative rake angles. A close analysis of the cutting force revealed an initially smooth increase of the cutting force with the depth of cut, indicating a ductile cutting mode. After a critical value for the depth of cut is exceeded, a transition to a brittle cutting mode occurs, which is characterized by an initial force drop followed by large and steep fluctuations of the cutting force. In the ductile regime, a rather continuous removal of small pieces of material occurs, whereas in the brittle regime larger chunks of material break away after the building up of higher stresses in the process zone. This also leads to an increased roughness of the newly created surface during brittle cutting and, furthermore, gives rise to subsurface cracks. The predicted critical depth of cut for the transition from ductile to brittle cutting of 25 nm is in good agreement with experimental observations of a critical depth of 21–39 nm. Furthermore, we have found that the rake angle barely influences the transition depth, although the surface roughness increases for more negative rake angles.
To verify the observed transition in cutting mode, we performed further machining simulations with a constant depth of cut. The simulation with a depth of cut smaller than the critical value indeed resulted in a fully ductile cutting mode, leaving behind a very smooth surface with a thin, homogeneous plastically deformed layer on top. In contrast to this, the simulation where a depth of cut above the critical value was applied resulted in a rather rough surface morphology, characterized by highly localized plastic strains and subsurface cracks. Our simulations also indicate that the signal of the cutting force yields a much clearer criterion for the transition in the cutting mode during grooving than the resulting surface roughness, which is, furthermore, found to be generally higher in grooving simulations than in simulations with a constant depth of cut.
Author Contributions
Conceptualization, A.H. and J.Z.; methodology, all authors; validation, M.A., L.Z. and N.V.; writing—original draft preparation, M.A., N.V. and A.H.; writing—review and editing, A.H., L.Z. and J.Z.; visualization, M.A.; supervision, A.H. and N.V.; funding acquisition, A.H. and J.Z. All authors have read and agreed to the published version of the manuscript.
Funding
This work has been funded by the Deutsche Forschungsgemeinschaft (DFG) under project number 392230176 and by the National Natural Science Foundation of China (NSFC)-German Research Foundation (DFG) international joint research program und contract number 51761135106.
Acknowledgments
The authors acknowledge funding by the National Natural Science Foundation of China (NSFC)-German Research Foundation (DFG) international joint research program (51761135106). M.A. and A.H. acknowledge funding of the Deutsche Forschungsgemeinschaft (DFG) under project number 392230176.
Conflicts of Interest
The authors declare no conflict of interest.
References
- Käckell, P.; Wenzien, B.; Bechstedt, F. Electronic properties of cubic and hexagonal SiC polytypes from ab initio calculations. Phys. Rev. B 1994, 50, 10761. [Google Scholar] [CrossRef]
- Woodilla, D.; Buonomo, M.; Bar-On, I.; Katz, R.N.; Whalen, T. Elevated-Temperature Behavior of High-Strength Silicon Carbide. J. Am. Ceram. Soc. 1993, 76, 249–252. [Google Scholar] [CrossRef]
- Logut, D.; Breysse, J.; Toulemont, Y.; Bougoin, M. Light weight monolithic silicon carbide telescope for space application. In Optical Design and Engineering II; International Society for Optics and Photonics: Bellingham, WA, USA, 2005; Volume 5962, p. 59621. [Google Scholar]
- Talwar, D.; Sherbondy, J.C. Thermal expansion coefficient of 3C–SiC. Appl. Phys. Lett. 1995, 67, 3301–3303. [Google Scholar] [CrossRef]
- Karch, K.; Pavone, P.; Mayer, A.; Bechstedt, F.; Strauch, D. First-principles study of thermal properties of 3C SiC. Phys. B Condens. Matter 1996, 219, 448–450. [Google Scholar] [CrossRef]
- Goel, S. The current understanding on the diamond machining of silicon carbide. J. Phys. D Appl. Phys. 2014, 47, 243001. [Google Scholar] [CrossRef] [Green Version]
- Goel, S.; Stukowski, A.; Luo, X.; Agrawal, A.; Reuben, R.L. Anisotropy of single-crystal 3C—SiC during nanometric cutting. Model. Simul. Mater. Sci. Eng. 2013, 21, 065004. [Google Scholar] [CrossRef]
- Wang, Y.F.; Yang, Z.G. Finite element model of erosive wear on ductile and brittle materials. Wear 2008, 265, 871–878. [Google Scholar] [CrossRef]
- Patten, J.A.; Jacob, J. Comparison between numerical simulations and experiments for single-point diamond turning of single-crystal silicon carbide. J. Manuf. Process. 2008, 10, 28–33. [Google Scholar] [CrossRef]
- Pastewka, L.; Moser, S.; Gumbsch, P.; Moseler, M. Anisotropic mechanical amorphization drives wear in diamond. Nat. Mater. 2011, 10, 34–38. [Google Scholar] [CrossRef]
- Mariayyah, R. Experimental and Numerical Studies on Ductile Regime Machining of Silicon Carbide and Silicon Nitride; The University of North Carolina: Charlotte, NC, USA, 2007. [Google Scholar]
- Dai, J.; Su, H.; Zhou, W.; Yu, T.; Ding, W.; Zhang, Q.; Zheng, Y. Finite element implementation of the tension-shear coupled fracture criterion for numerical simulations of brittle-ductile transition in silicon carbide ceramic grinding. Int. J. Mech. Sci. 2018, 146, 211–220. [Google Scholar] [CrossRef]
- Zhang, J.; Han, L.; Zhang, J.; Li, G.; Xu, J.; Yan, Y.; Sun, T. Finite element analysis of the effect of tool rake angle on brittle-to-ductile transition in diamond cutting of silicon. Int. J. Adv. Manuf. Technol. 2019, 104, 881–891. [Google Scholar] [CrossRef]
- Ravindra, D.; Patten, J. Ductile regime single point diamond turning of CVD-SiC resulting in an improved and damage-free surface. In Proceedings of the 4th International Conference on Recent Advances in Materials, Minerals & Environment and 2nd Asian Symposium on Materials & Processing, Penang, Malaysia, 17 June 2009; ESR Group: HK, China, 2009. [Google Scholar]
- Bifano, T.G.; Dow, T.A.; Scattergood, R.O. Ductile-regime grinding: A new technology for machining brittle materials. J. Manuf. Sci. Eng. 1991, 113, 184–189. [Google Scholar] [CrossRef]
- Zhang, J.; Han, L.; Zhang, J.; Liu, H.; Yan, Y.; Sun, T. Brittle-to-ductile transition in elliptical vibration-assisted diamond cutting of reaction-bonded silicon carbide. JOurnal Manuf. Process. 2019, 45, 670–681. [Google Scholar] [CrossRef]
- Liu, L.; Xu, Z.; Tian, D.; Hartmaier, A.; Luo, X.; Zhang, J.; Nordlund, K.; Fang, F. MD simulation of stress-assisted nanometric cutting mechanism of 3C silicon carbide. In Industrial Lubrication and Tribology; Emerald Group Publishing Limited: Bingley, UK, 2019. [Google Scholar]
- Liu, Y.; Li, B.; Kong, L. A molecular dynamics investigation into nanoscale scratching mechanism of polycrystalline silicon carbide. Comput. Mater. Sci. 2018, 148, 76–86. [Google Scholar] [CrossRef]
- Tian, D.; Xu, Z.; Liu, L.; Zhou, Z.; Zhang, J.; Zhao, X.; Hartmaier, A.; Liu, B.; Song, L.; Luo, X. In situ investigation of nanometric cutting of 3C-SiC using scanning electron microscope. Int. J. Adv. Manuf. Technol. 2021, 115, 2299–2312. [Google Scholar] [CrossRef]
- Zhao, L.; Alam, M.; Zhang, J.; Janisch, R.; Hartmaier, A. Amorphization-governed elasto-plastic deformation under nanoindentation in cubic (3C) silicon carbide. Ceram. Int. 2020, 46, 12470–12479. [Google Scholar] [CrossRef]
- Erhart, P.; Albe, K. Analytical potential for atomistic simulations of silicon, carbon, and silicon carbide. Phys. Rev. B 2005, 71, 035211. [Google Scholar] [CrossRef] [Green Version]
- Drucker, D.C.; Prager, W. Soil mechanics and plastic analysis or limit design. Q. Appl. Math. 1952, 10, 157–165. [Google Scholar] [CrossRef] [Green Version]
- Patten, J.; Gao, W.; Yasuto, K. Ductile regime nanomachining of single-crystal silicon carbide. J. Manuf. Sci. Eng. 2005, 127, 522–532. [Google Scholar] [CrossRef]
- Long Bi, J.; Feng Shi, G.; Jiang, F.; Quan Shi, G.; Qiang Xia, M. Simulation Analysis of Influencing Factors of High Pressure Phase Transformation in Single Crystal Germanium Ductile Cutting. J. Phys. Conf. Ser. IOP Publ. 2021, 1798, 012028. [Google Scholar] [CrossRef]
- Smith, M. ABAQUS Standard User’s Manual, Version 6.9. Available online: http://130.149.89.49:2080/v6.8/books/usi/default.htm?startat=pt01.html (accessed on 21 October 2021).
- Hooputra, H.; Gese, H.; Dell, H.; Werner, H. A comprehensive failure model for crashworthiness simulation of aluminium extrusions. Int. J. Crashworthiness 2004, 9, 449–464. [Google Scholar] [CrossRef]
- Pabst, O.; Schiffer, M.; Obermeier, E.; Tekin, T.; Lang, K.D.; Ngo, H.D. Measurement of Young’s modulus and residual stress of thin SiC layers for MEMS high temperature applications. In Proceedings of the International Society for Optics and Photonics, Smart Sensors, Actuators, and MEMS V, Prague, Czech Republic, 18–20 April 2011; Volume 8066, p. 806608. [Google Scholar]
- Fu, X.a.; Dunning, J.L.; Zorman, C.A.; Mehregany, M. Measurement of residual stress and elastic modulus of polycrystalline 3C-SiC films deposited by low-pressure chemical vapor deposition. Thin Solid Film. 2005, 492, 195–202. [Google Scholar] [CrossRef]
- Zhao, L.; Zhang, J.; Pfetzing, J.; Alam, M.; Hartmaier, A. Depth-sensing ductile and brittle deformation in 3C-SiC under Berkovich nanoindentation. Mater. Des. 2021, 197, 109223. [Google Scholar] [CrossRef]
- Sajjad, H.M.; Kuntz, M.; Schäfer, B.J.; Sonnweber-Ribic, P.; Hartmaier, A. Inverse method to determine fatigue properties of materials by combining cyclic indentation and numerical simulation. Materials 2020, 13, 3126. [Google Scholar] [CrossRef]
- Oliver, W.C.; Pharr, G.M. An improved technique for determining hardness and elastic modulus using load and displacement sensing indentation experiments. J. Mater. Res. 1992, 7, 1564–1583. [Google Scholar] [CrossRef]
- Bolshakov, A.; Oliver, W.; Pharr, G. Finite element studies of the influence of pile-up on the analysis of nanoindentation data. MRS Online Proc. Libr. 1996, 436. [Google Scholar] [CrossRef] [Green Version]
- Nawaz, A.; Islam, B.; Mao, W.; Lu, C.; Shen, Y. Nanoscale elastic-plastic deformation and mechanical properties of 3C-SiC thin film using nanoindentation. Int. J. Appl. Ceram. Technol. 2019, 16, 706–717. [Google Scholar] [CrossRef]
- Neo, W.K.; Kumar, A.S.; Rahman, M. A review on the current research trends in ductile regime machining. Int. J. Adv. Manuf. Technol. 2012, 63, 465–480. [Google Scholar] [CrossRef]
- Arif, M.; Xinquan, Z.; Rahman, M.; Kumar, S. A predictive model of the critical undeformed chip thickness for ductile–brittle transition in nano-machining of brittle materials. Int. J. Mach. Tools Manuf. 2013, 64, 114–122. [Google Scholar] [CrossRef]
Figure 1.
Schematic diagram of the effective stress t vs. the hydrostatic pressure p for the linear DP constitutive model. The parameter represents the slope of the t-p line, d is the intercept at and is the dilation angle.
Figure 1.
Schematic diagram of the effective stress t vs. the hydrostatic pressure p for the linear DP constitutive model. The parameter represents the slope of the t-p line, d is the intercept at and is the dilation angle.

Figure 2.
(a) Indentation model used in the present work. The model consists of a Si substrate, having a thickness of 3 m, and a 3C-SiC layer, having a thickness of 2 m. The Berkovich indenter has been modeled as discrete rigid body. (b) Experimental displacement vs. time profile used for applying the displacement-controlled boundary conditions in the indentation simulation.

Figure 3.
Compressive yield stress vs. plastic strain , as used in Equation (3).
Figure 3.
Compressive yield stress vs. plastic strain , as used in Equation (3).

Figure 4.
Load vs. indentation depth curves for the nanoindentations with a maximum depth of (a) 105 nm, (b) 157 nm, and (c) 208 nm. The load-depth curve of 105 nm was used for the inverse analysis of the material parameters, and the load-depth curves of 157 nm and 208 nm are the ones predicted with the obtained parameters.

Figure 5.
Residual imprint of the nanoindentation of (a) 105 nm, (b) 157 nm, and (c) 208 nm depth as obtained from the FE simulations (left), where the displacement in normal direction to the surface is shown (in mm). SEM image of indented surface for the same indentation depths (right).
Figure 5.
Residual imprint of the nanoindentation of (a) 105 nm, (b) 157 nm, and (c) 208 nm depth as obtained from the FE simulations (left), where the displacement in normal direction to the surface is shown (in mm). SEM image of indented surface for the same indentation depths (right).

Figure 6.
Schematic diagram of the workpiece and the cutting tool for the grooving simulations. The white dashed line shows the trajectory of the tool tip during grooving. The initial contact occurs on the flat surface at some distance to the corner of the model. The workpiece has a dimension of m, and the cutting tools was chosen to be rigid with a negative rake angle. A denser mesh was used around the grooving region, while in remote regions a coarser mesh was applied.

Figure 7.
Grooving force vs. depth of cut for rake angles of −15 (a), −22.5 (b) and −30 (c). The vertical dashed lines denote the transition depth that separates the ductile and the brittle regimes, respectively. In the ductile regime, the cutting force increases smoothly with the depth of cut, whereas the brittle regime is characterized by large oscillations of the force.

Figure 8.
Surface morphology after grooving simulations for rake angles of (a) −15, (b) −22.5 and (c) −30. The dashed red lines in the three figures separates the brittle and the ductile regions. The ductile region is characterized by the absence of subsurface cracks and a smoother surface, while the brittle region is characterized by the presence of crack and a rather rough surface. The color code represents the equivalent plastic strain as given in the colorbar. Note that only the region with a fine mesh is represented here, as the complete model is shown in Figure 6.

Figure 9.
Absolute deviation () of the surface coordinates during the grooving at (a) −15, (b) −22.5 and (c) −30 rake angles. The deviation is evaluated by subtracting the deformed coordinates from the undeformed coordinate along the grooving direction. The dashed line separates the ductile and the brittle regime.

Figure 10.
Cutting force vs. cutting length for the (a) 20 nm, and (b) 30 nm depth at a rake angle of −15. The force at depth lower than the BDT is characterized by an oscillatory small-sawtooth-like behavior around 0.2 N while cutting force at a depth larger than transition depth is characterized by large oscillatory behavior.

Figure 11.
Surface morphology obtained from FE simulations with a fixed depth of cut of 20 nm (a) and 30 nm (b), for a rake angle of −15. The color code represents the equivalent plastic strain as given in the colorbar.
Figure 11.
Surface morphology obtained from FE simulations with a fixed depth of cut of 20 nm (a) and 30 nm (b), for a rake angle of −15. The color code represents the equivalent plastic strain as given in the colorbar.


Table 1.
The parameters for the DP model and the damage model used for nanoindentation and cutting simulations of 3C-SiC. The quantities , E, represent density, Young’s modulus and Poisson ratio, respectively, which were included in this table for completeness as they were used in the FE simulations. The friction angle is , and the dilation angle is . The damage parameters a, b and c, defined in Equation (6), as well as the parameters , K and are dimensionless. The Young’s modulus and Poisson ratio was adopted from Pabst et al. [27] and Fu et al. [28], respectively, with small modifications.
| E | K | a | b | c | ||||||
|---|---|---|---|---|---|---|---|---|---|---|
| (kg/m) | (GPa) | (-) | () | (-) | () | (-) | (-) | (-) | (-) | |
| 3200 | 350 | 0.16 | 55 | 0.92 | −5 | 0.01 | 1.67 | 0.048 | 0.3 |
Table 2.
Transition depth and roughness values () in ductile and brittle regions as obtained from the grooving simulations for different negative rake angles. The roughness values in the two regimes are separated by a slash.
Table 2.
Transition depth and roughness values () in ductile and brittle regions as obtained from the grooving simulations for different negative rake angles. The roughness values in the two regimes are separated by a slash.
| Rake Angle () | Transition Depth (nm) | Roughness (nm) |
|---|---|---|
| −15 | 28 | 5.03 / 9.02 |
| −22.5 | 27 | 6.65 / 11.2 |
| −30 | 27 | 7.28 / 14.5 |
Publisher’s Note: MDPI stays neutral with regard to jurisdictional claims in published maps and institutional affiliations. |
© 2021 by the authors. Licensee MDPI, Basel, Switzerland. This article is an open access article distributed under the terms and conditions of the Creative Commons Attribution (CC BY) license (https://creativecommons.org/licenses/by/4.0/).
Share and Cite
MDPI and ACS Style
Alam, M.; Zhao, L.; Vajragupta, N.; Zhang, J.; Hartmaier, A. Finite Element Modeling of Brittle and Ductile Modes in Cutting of 3C-SiC. Crystals 2021, 11, 1286. https://0-doi-org.brum.beds.ac.uk/10.3390/cryst11111286
AMA Style
Alam M, Zhao L, Vajragupta N, Zhang J, Hartmaier A. Finite Element Modeling of Brittle and Ductile Modes in Cutting of 3C-SiC. Crystals. 2021; 11(11):1286. https://0-doi-org.brum.beds.ac.uk/10.3390/cryst11111286
Chicago/Turabian StyleAlam, Masud, Liang Zhao, Napat Vajragupta, Junjie Zhang, and Alexander Hartmaier. 2021. "Finite Element Modeling of Brittle and Ductile Modes in Cutting of 3C-SiC" Crystals 11, no. 11: 1286. https://0-doi-org.brum.beds.ac.uk/10.3390/cryst11111286
Note that from the first issue of 2016, this journal uses article numbers instead of page numbers. See further details here.