
Electronic and Optical Properties of Polythiophene Molecules and Derivatives

1
Department of Power Mechanical Engineering, National Tsing Hua University, Hsinchu 30013, Taiwan
2
Department of Energy Engineering, National United University, Miaoli 36001, Taiwan
3
Department of Electro-Optical Engineering, National Taipei University of Technology, Taipei 10608, Taiwan
*
Author to whom correspondence should be addressed.
Crystals 2021, 11(11), 1292; https://0-doi-org.brum.beds.ac.uk/10.3390/cryst11111292
Submission received: 12 August 2021
/
Revised: 17 October 2021
/
Accepted: 20 October 2021
/
Published: 25 October 2021
(This article belongs to the Special Issue Nano/Micro and Bio-Inspired Materials on Wide-Bandgap-Semiconductor-Based Optoelectronic/Power Devices)
Abstract
:The electronic and optical properties of polythiophene (PT) for polymer light-emitting diodes (PLEDs) were calculated using density functional theory (DFT) and time-dependent DFT. We calculated the electronic and optical properties of thiophene and PT polymers with degrees of polymerization (DP) from 2 to 30 monomers (T1–T30) and their derivatives. The associated highest occupied molecular orbital (HOMO) energy, lowest unoccupied molecular orbital (LUMO) energy, band gaps, electron orbitals, and molecular structures were determined. As the DP increased, the LUMO energy gradually decreased, and the HOMO energy gradually increased. The band gap of PT approached 2 eV as the DP of the PT polymer increased from 1 to 30. The calculations and exchange–correlation functional were verified against values in the literature and experimental data from cyclic voltammetry (redox potential) and ultraviolet-visible, photoluminescence, and ultraviolet photoelectron spectra. The color of PT PLEDs can be adjusted by controlling the DP of the polymer and the substituents.
1. Introduction
Polymer light-emitting diodes (PLEDs) were developed in the Cavendish Lab Burroughs of the University of Cambridge in 1990 using the spin coating method [1]. When poly(p-phenylene vinylene) was placed between indium tin oxide and aluminum, yellow–green light was observed. This was the first high-light-efficiency PLED. The quantum efficiency of PLEDs can reach up to 8%, and their driving voltage is lower as compared to other LEDs. Developing PLEDs is simple because a vacuum is not required. Furthermore, PLED materials are made of common polymers, such as polyfluorene, polyphenylene, and polythiophene (PT). During the development of such materials, the molecular structure can be changed using different methods of synthesis to obtain PLEDs of different materials with various functionalization. For example, by changing the molecular bond length [2], adding a launching group to control the color of the wavelength, or adding various groups for electron transport to improve carrier injection, the efficiency of illumination [3] or functionalization can be improved.
To characterize PT for use in PLEDs, Colditz et al. [4] used the semiempirical CNDO/S method to calculate the ultraviolet–visible (UV/Vis) spectra of thiophene containing two to six monomers (T2–T6) in 1995. In 1997, Ferro et al. [5] used the molecular mechanics method (CHAMP, mm2, and mm2p) to calculate the structure of thiophene. Their calculations were compared against X-ray diffraction spectrometry data. The bond length and bond angle of the thiophene crystal structure were obtained. In 2002, Ma, Li, and Jing [6] used time-dependent density functional theory (TD-DFT) and the Becke, 3-parameter, Lee–Young–Parr (B3LYP) functional to calculate the excitement energy for PT to be 1.52 eV [6]. However, the calculated values significantly differed from the experimental data. In 2011, Colle et al. [7] used a method based on DFT with functional B3LYP basis set PSP-31G1** and the van der Waals force to obtain the structural parameters of poly(3-hexylthiophene), which coincided with their experimental value. A rr-HT-P3HT crystalline structure consists of chains of adjacent thiophene rings slightly rotated with respect to each other around the polythiophene backbone axis. Bella et al. [8] used TD-DFT with functional B3LYP, basis set 6-31G(d) to evaluate the optoelectronic properties of diphenylamine in conjugation with biphenyl-based π acceptors, such as bifuran, bithiophene, and bipyrrole. Their results indicated that relative to other heteroaromatic π-acceptors, bithiophene-substituted molecules had the highest lowest unoccupied molecular orbital (LUMO) contribution and thus exhibited a higher absorption, higher emission λmax, and lower highest occupied molecular orbital (HOMO)–LUMO gap. Taouali et al. [9] using functional B3PW91, basis set 6-31G(d) study small molecules with an A–D–A–D–A structure, denoted BT(-2T-DCV-Hex)2, which are synthesized with benzothiadiazole as the core, bithienyl as the donor unit, and dicyanovinyl as the terminal acceptor groups to investigate the relationships between structural and material properties. A promising molecular structure [10] with an acceptable open circuit voltage and high power conversion efficiency for applications in solar cells was discovered. Model used DFT functional B3LYP, basis set 6-311g(d.p). DFT and TD-DFT have also been used to investigate the tuning of the optoelectronic properties of triphenylamine derivatives for solar cell applications [11]. Song et al. [12] used DFT/B3LYP and TDDFT/B3LYP to calculate the geometric structure, absorption and emission spectra and to investigate blue and green iridium complexes with a mesityl-phenyl-imidazole ligand. Nayak and Periasamy [13] used DFT functional B3LYP basis set 6-31g(d) to investigate the electron affinity, ionization potential, transport gap, optical band gap (exciton energy), and exciton binding energy of organic molecules in the solid state. Kuusik et al. [14] used hybrid DFT functional M06 and ωB97X-D to investigate the electronic structure of ionic liquids based on the trifluoromethyl sulfonyl imide anion.
Quites et al. [15] fabricated a single-layer LED comprising blue and green emitters. When they adjusted the green emitter composition from 0.0075 to 2.4 wt%, they observed large differences between the electroluminescence and photoluminescence (PL) spectra of these blends. To calculate the material features organic photovoltaic, Chen et al. [16] calculated the HOMO-LUMO and bandgap mono- and di-bridged, the heterocyclic quinoid compound of 4,7-dithien-2-yl-2,1,3- benzothiadiazole using the Gaussian 09 package with functional B3LYP, basis set 6-31G(d). They conducted electronic absorption in a vacuum; using TD-DFT, they discovered the C and Si atoms to be the most efficient bridging atoms. Dibridging and thiophene endcapping were used to create effective building blocks for organic photovoltaic molecules. Kuusik et al. [17] measured the UV photoelectron spectrum (UPS) of the ionic liquid (1-ethyl-3-methylimidazolium tetrafluoroborate). They found that DFT has some shortcomings in describing the electronic structure of bulk ionic liquids; most importantly, DFT yields inaccurate calculations of the top of the valence band. However, their DFT used PBE-D3 with vdW-DF functionals C09, optPBE, optB88 and CX results were in excellent agreement with their experimental UPSs and ab initio reconstructed spectra. Kuusik et al. [18] measured the UPSs of various gas-phase ion pairs of ionic liquids. Hybrid DFT functional M06, ωB97X-D, basis set 6-311++G**(d,p) yielded calculations that accorded well with their experimental data.
The aforementioned studies have used theoretical calculations to first derive the properties of materials and devices, and such calculations play a key role in the development of new materials and devices. The accuracy of calculations depends on the DFT module, calculation procedure, and basis sets used, which in turn affect the development of the derivative materials.
The use of macromolecules as single-layer PLED devices is becoming attractive because of their promising physical characteristics and simple coating process. Macromolecules have low manufacturing costs, and various light-emitting polymer materials are available. However, red-light-emitting materials are difficult to obtain. PT is a material that emits red light and has rarely been studied. Chemists have attempted to alter the molecular chain length, add other chromophores, and formulate synthetic derivatives with hole transport groups to improve the efficiency of these materials. However, these materials have yet to live up to their promise. Experimental tests and verification are time consuming and costly, and the use of computational approaches reduces development time and cost.
Thus, using Gaussian09 software, this study investigated light-emitting PT-conjugated polymers and their quantum mechanics by using first-principles DFT calculations. Specifically, the PT-conjugated polymers investigated were the monomer, dimer variants, thiophene (T1) and 2,2′-bithiophene (T2), respectively. The basis sets values, as derived from calculations and experiments, were used to simulate the band gap of polymers containing 3 to 30 as well as infinitely many monomers. We studied the electronic and optical properties and the behavior of the materials as the degree of polymerization (DP) increased. Furthermore, we simulated the electron-withdrawing and electron-donating substituents. This helped us understand the nature of these derivatives, their influence on light emission, and the electronic differences from molecules without such push-and-pull interaction.
2. Theoretical Calculations, Principles, and Methods
The ground-state geometries of thiophene and PT polymers were fully optimized using the density functional theory (DFT, functional/basis set) B3LYP/6-31G(d), B3LYP/6-311G(d), and B3LYP/CEP31G(d) [19], as implemented in Gaussian 09 [20,21]. TD-DFT (B3LYP) calculations of the excitation energies were then performed at the optimized geometries of the ground states. The excited-state geometries of thiophene were fully optimized using the Configuration Interaction Singles (CIS). Throughout the pre-screening, basis set 6-31G(d) is found to be the most accurate among basis set tested. All the methods used here are based on the hybrid B3LYP functional [22]. The geometries of all the molecules were optimized with 6-31G (d) basis functions.
The frontier orbitals of the highest occupied molecular orbitals (HOMOs) and the lowest unoccupied molecular orbitals (LUMOs) were calculated by B3LYP/6-31G(d) on the basis of optimized structures at the ground states (S0) of the thiophene and PT polymers. The bandgap (Eg) was obtained from the energy difference between HOMO and LUMO of the compound. The HOMO, LUMO, and Eg of the polymers were achieved by plotting the HOMO, LUMO, and Eg of the corresponding monomers, dimers, trimers, tetramers, and pentamers against their reciprocal chain length and extrapolating to infinite chain length.
3. Simulation Methods
3.1. PT Polymers
In this study, PT was used as the radiated layer for a PLED. The simulation method was used to derive the properties of the PT, which is a linear polymer composed of multiple thiophene monomers. The PT variants with different DPs were named T1–T30, where the number indicates the DP (degree of polymerization, number of monomers contained in each polymer).
3.2. PT Derivatives
In organic molecules, substituents can affect material properties, such as reactivity, melting point, boiling point, pH, band gap, and spectral properties. However, in addition to the substituents, their position in the molecules affects material properties. In general, substitution comes in many forms. In this study, we explored how different electron-donating and electron-withdrawing substituents affect the properties of PT. Five substituents were chosen for this study: the strong electron-donating group (OCH3), electron-donating group (OCOCH3), weak electron-donating group (CH3), weak electron-withdrawing group (Br), and electron-withdrawing group (COOH). In the present study, the substituents replaced the H atom The properties of these TP derivatives were also calculated.
3.3. Simulation
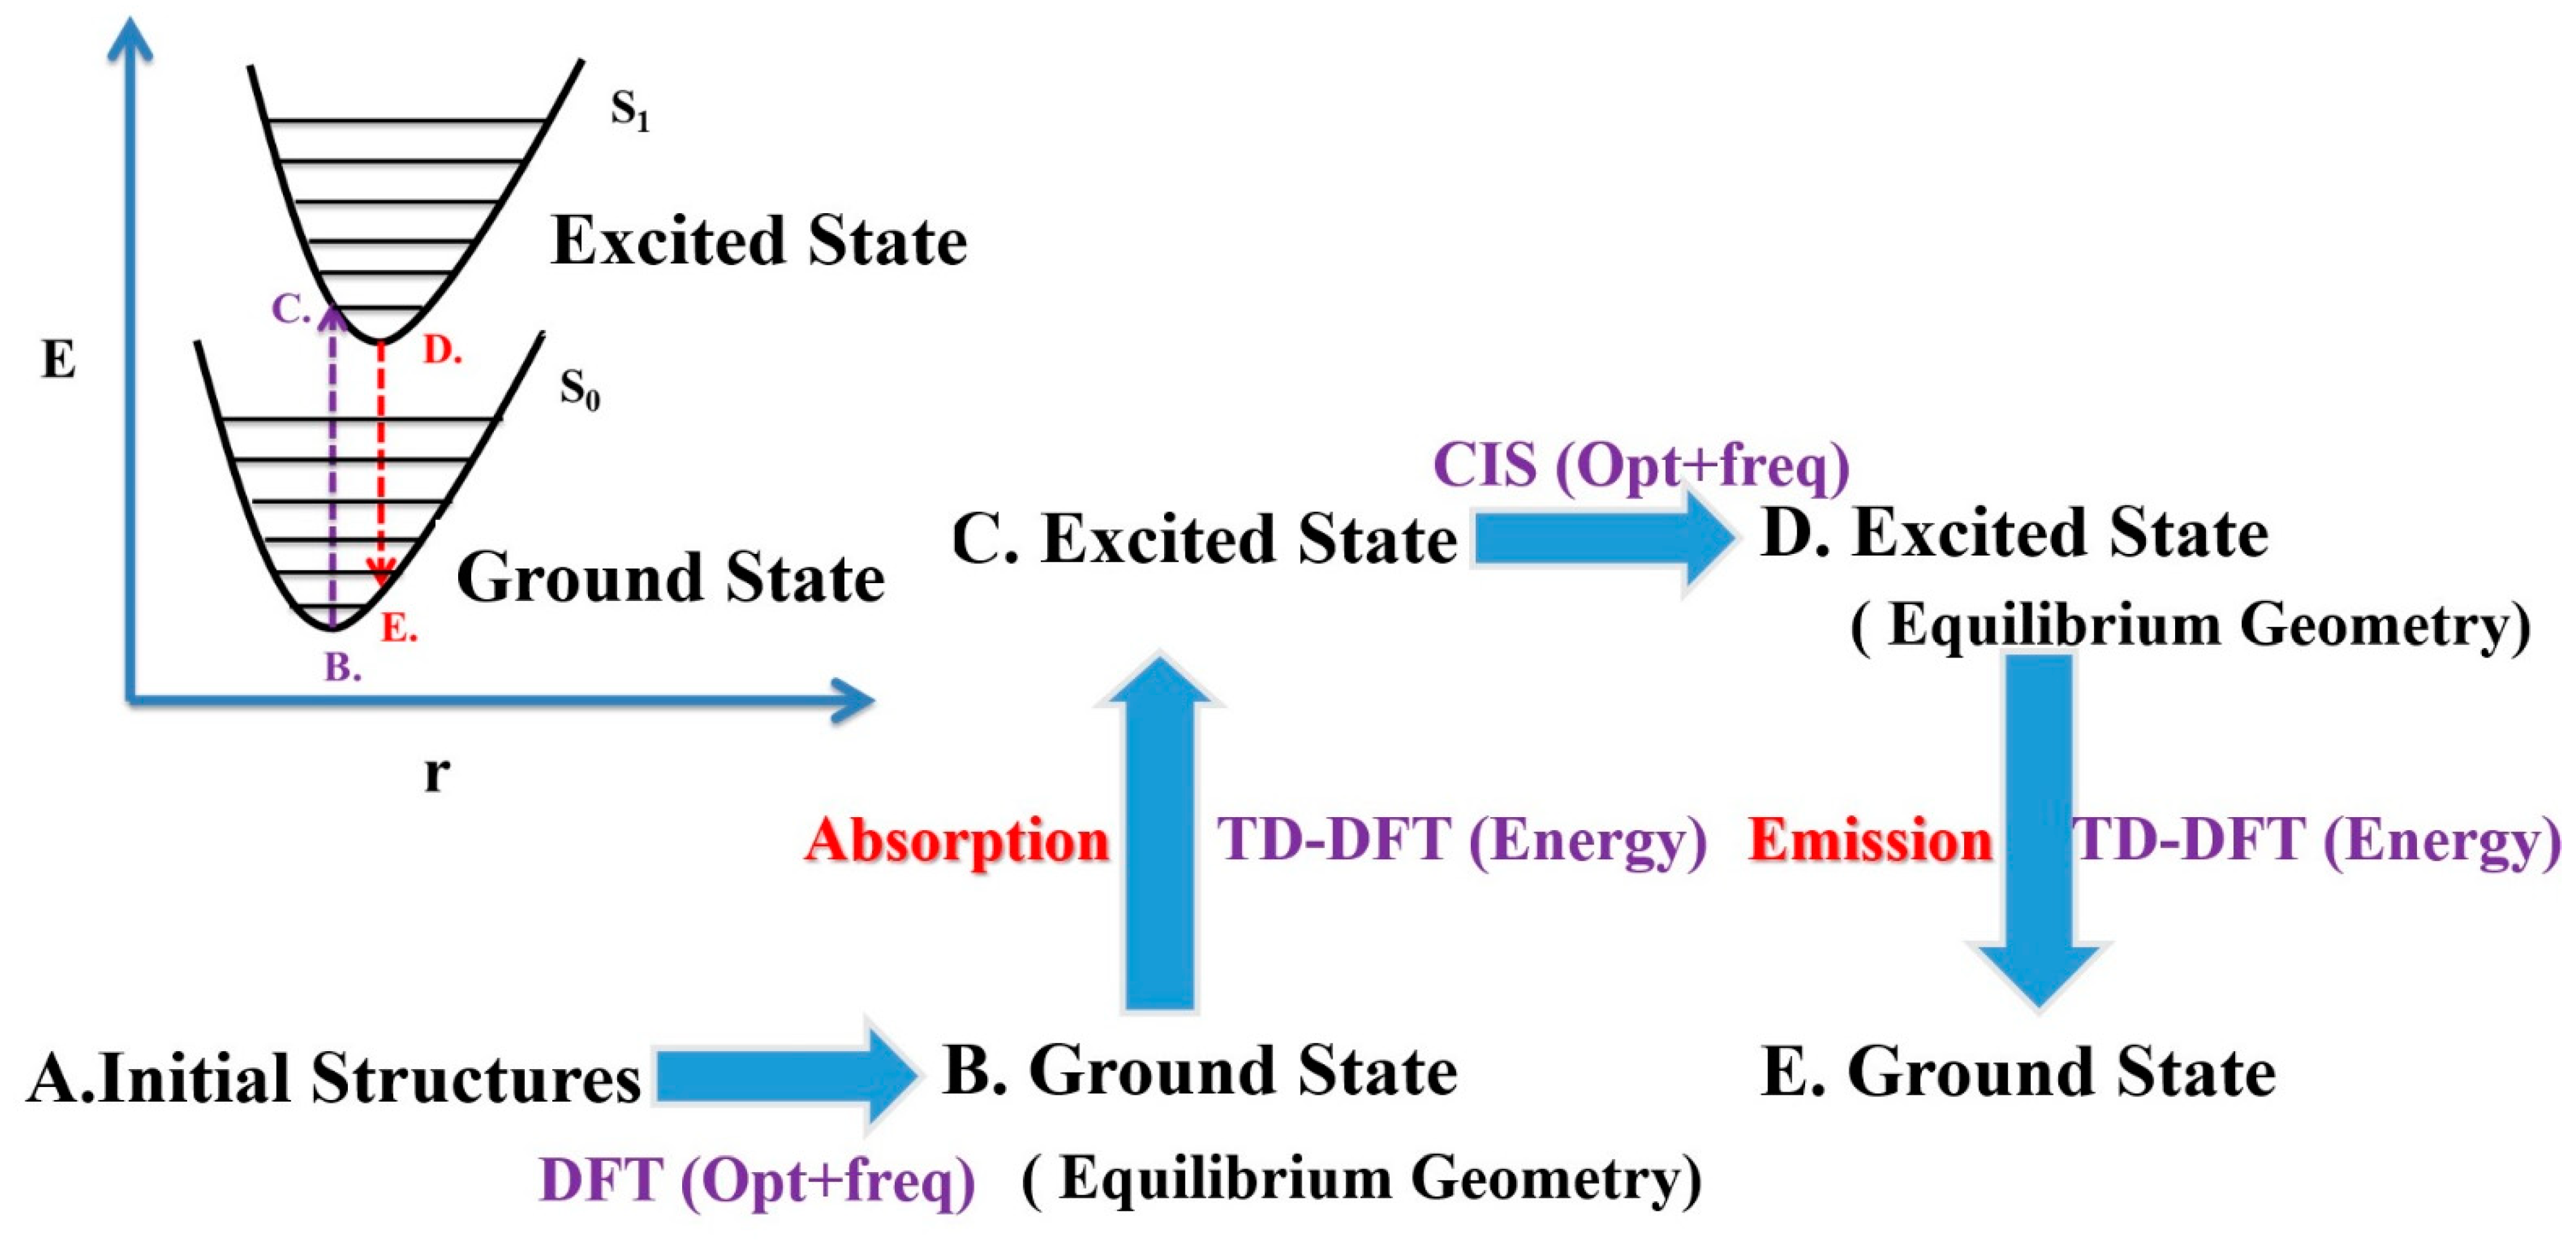
The simulation steps are detailed in the flow chart in Figure 1. First, in step A, the initial structure is established. In step B, the structure is optimized using the DFT, functional B3LYP, basis 6-31G(d) for the calculations. In step C, the energy required to transition the ground state to the excited state is calculated using the TD-DFT B3LYP/6-31-G(d), and the corresponding UV/Vis spectrum is obtained. In step D, the excited-state structure was optimized. The Configuration Interaction Singles (CIS) B3LYP/6-31G(d)is used for structural optimization of the first excited state (S1). Finally, in step E, the energy emitted during transition from the excited state to the ground state is calculated using the TD-DFT B3LYP/6-31G(d).
3.4. Exchange–Correlation Functional and Basis Sets Used in Calculation
The exchange–correlation functional and basis sets used in calculation are presented in Table 1; Table 2, respectively. First, the T1 and T2 data were calculated with the optimization and frequency (Opt + Freq) using the DFT B3LYP/6-31G(d). Calculation results were compared to the result of other DFT with different basis set (6-311G(d) and CEP-31G(d)). The result was also compared with the experimental result on Table 3. The error is calculated by ((C − E)/E) × 100%, where C is the calculated result and E is the experimental data. The most accurate method was used to calculate T1–T10, T15, T20, T25, and T30 as given on Table 2. The band gap from the simulated result was analyzed using linear extrapolation. Furthermore, the properties of these PTs were obtained. The functional/basis sets B3LYP/6-31G(d) yield the most accurate result and it was used throughout the calculation. Second, the TD-DFT B3LYP/6-31G(d)was used for energy calculations. Third, the excited state was optimized by using the CIS B3LYP/6-31G(d). Finally, we calculated the energy using the TD-DFT B3LYP/6-31G(d).
3.5. Experimental Setup for Cyclic Voltammetry, UV/Vis Spectrum, PL Spectrum and UPS Spectrum
Cyclic voltammetry was used to verify the calculation results. The redox potential of the PT polymers was measured. The PT polymer was spin coated on an indium tin oxide substrate used as the working electrode. The reference electrode was made of Ag/AgC, and the counter electrode was made of platinum. These electrodes were immersed in a solution of 0.1 M tetrabutylammonium phosphorus hexafluoride. The electrode scanning rate was 0.1 V·S−1. The UV/Vis spectrum were measured by CT-2200 UV/VIS Spectrophotometer with 200~1000 nm wavelength range. The PL spectra were measured by ZEISS LSM 800 and Axio Observer Z1 TIRF spectroscopy with a 405 nm laser. The ultraviolet photoemission spectroscopy (UPS) spectra were measured in an ethanol environment by PerkinElmer PHI 5400. The EUV source of UPS was He(I), which supplied 21.2 eV incident power.
4. Discussion
In this section, the DFT calculation results were compared to experimental data for accuracy and reliability. Only T2 and T6 were tested due to availability from material supplier. The work function and valence band maximum were calculated from the UPS of T6 in Section 4.3. The redox potential, UV/Vis spectrum, and PL spectrum of T2 data were reported in Section 4.4.
4.1. Exchange Functional and Basis Sets Used for Optimization and LUMO and HOMO Energy Levels of PT Polymers
In this study, we tested three exchange–correlation functionals and basis set. As listed in Table 1 and Table 2, three exchange–correlation functionals and their basis sets (functional/basis set)—B3LYP/6-31G(d), B3LYP/6-311G(d), and B3LYP/CEP-31G(d)—were selected because they were the most suitable for theoretically deriving the material properties of PT polymers. The band gap of T∞ was calculated from those functional/basis sets and it was listed on Table 3. The experimental data from literature [23] were also listed in Table 3 for comparison. The B3LYP/6-31G(d) yielded the smallest error among others.
The calculated band gaps of the PT polymers with different DPs (n values, indicating the number of monomers in the PT polymer) are plotted in Figure 2a against 1/n. A linear relationship was observed of the form y = ax + b. The slope (a) was 4.2987. The band gap (1.9807) of the PT polymer with a nearly infinite DP (n → ∞ or 1/n → 0) approached the intercept (b) of the linear equation.
The band gap calculation results and experimental data of T∞ are listed in Table 3 for comparison. The band gaps, calculated using three selected exchange–correlation functionals, and basis sets of T∞ are listed in Table 3. The experimental data were drawn from the literature [23], in which the band gap was 2.0 eV for a T∞ polymer. As indicated in the table, when the B3LYP functional was used for matching the 6-31G calculation basis sets with the (d) basis function set, a minimum band gap error of 0.965% was achieved. In the subsequent calculations of the excited state energy, these basis sets values and minimum error were used.
The HOMO and LUMO energy levels of T1–T10 and T15, T20, T25, and T30 were calculated using B3LYP/6-31G(d). The energy levels are plotted in Figure 2b as a function of DP (Tn). In Figure 2b, as DP increases, the LUMO energy level decreases, and the HOMO energy level increases; the band gap gradually decreases to 2 eV as n approaches 30. This phenomenon is similar to the quantum confinement effect. Therefore, organic conjugated polymers are also known as organic semiconductors.
4.2. Optimized Molecular Structures and Orbital Diagrams of T2, T4, T10, and T20
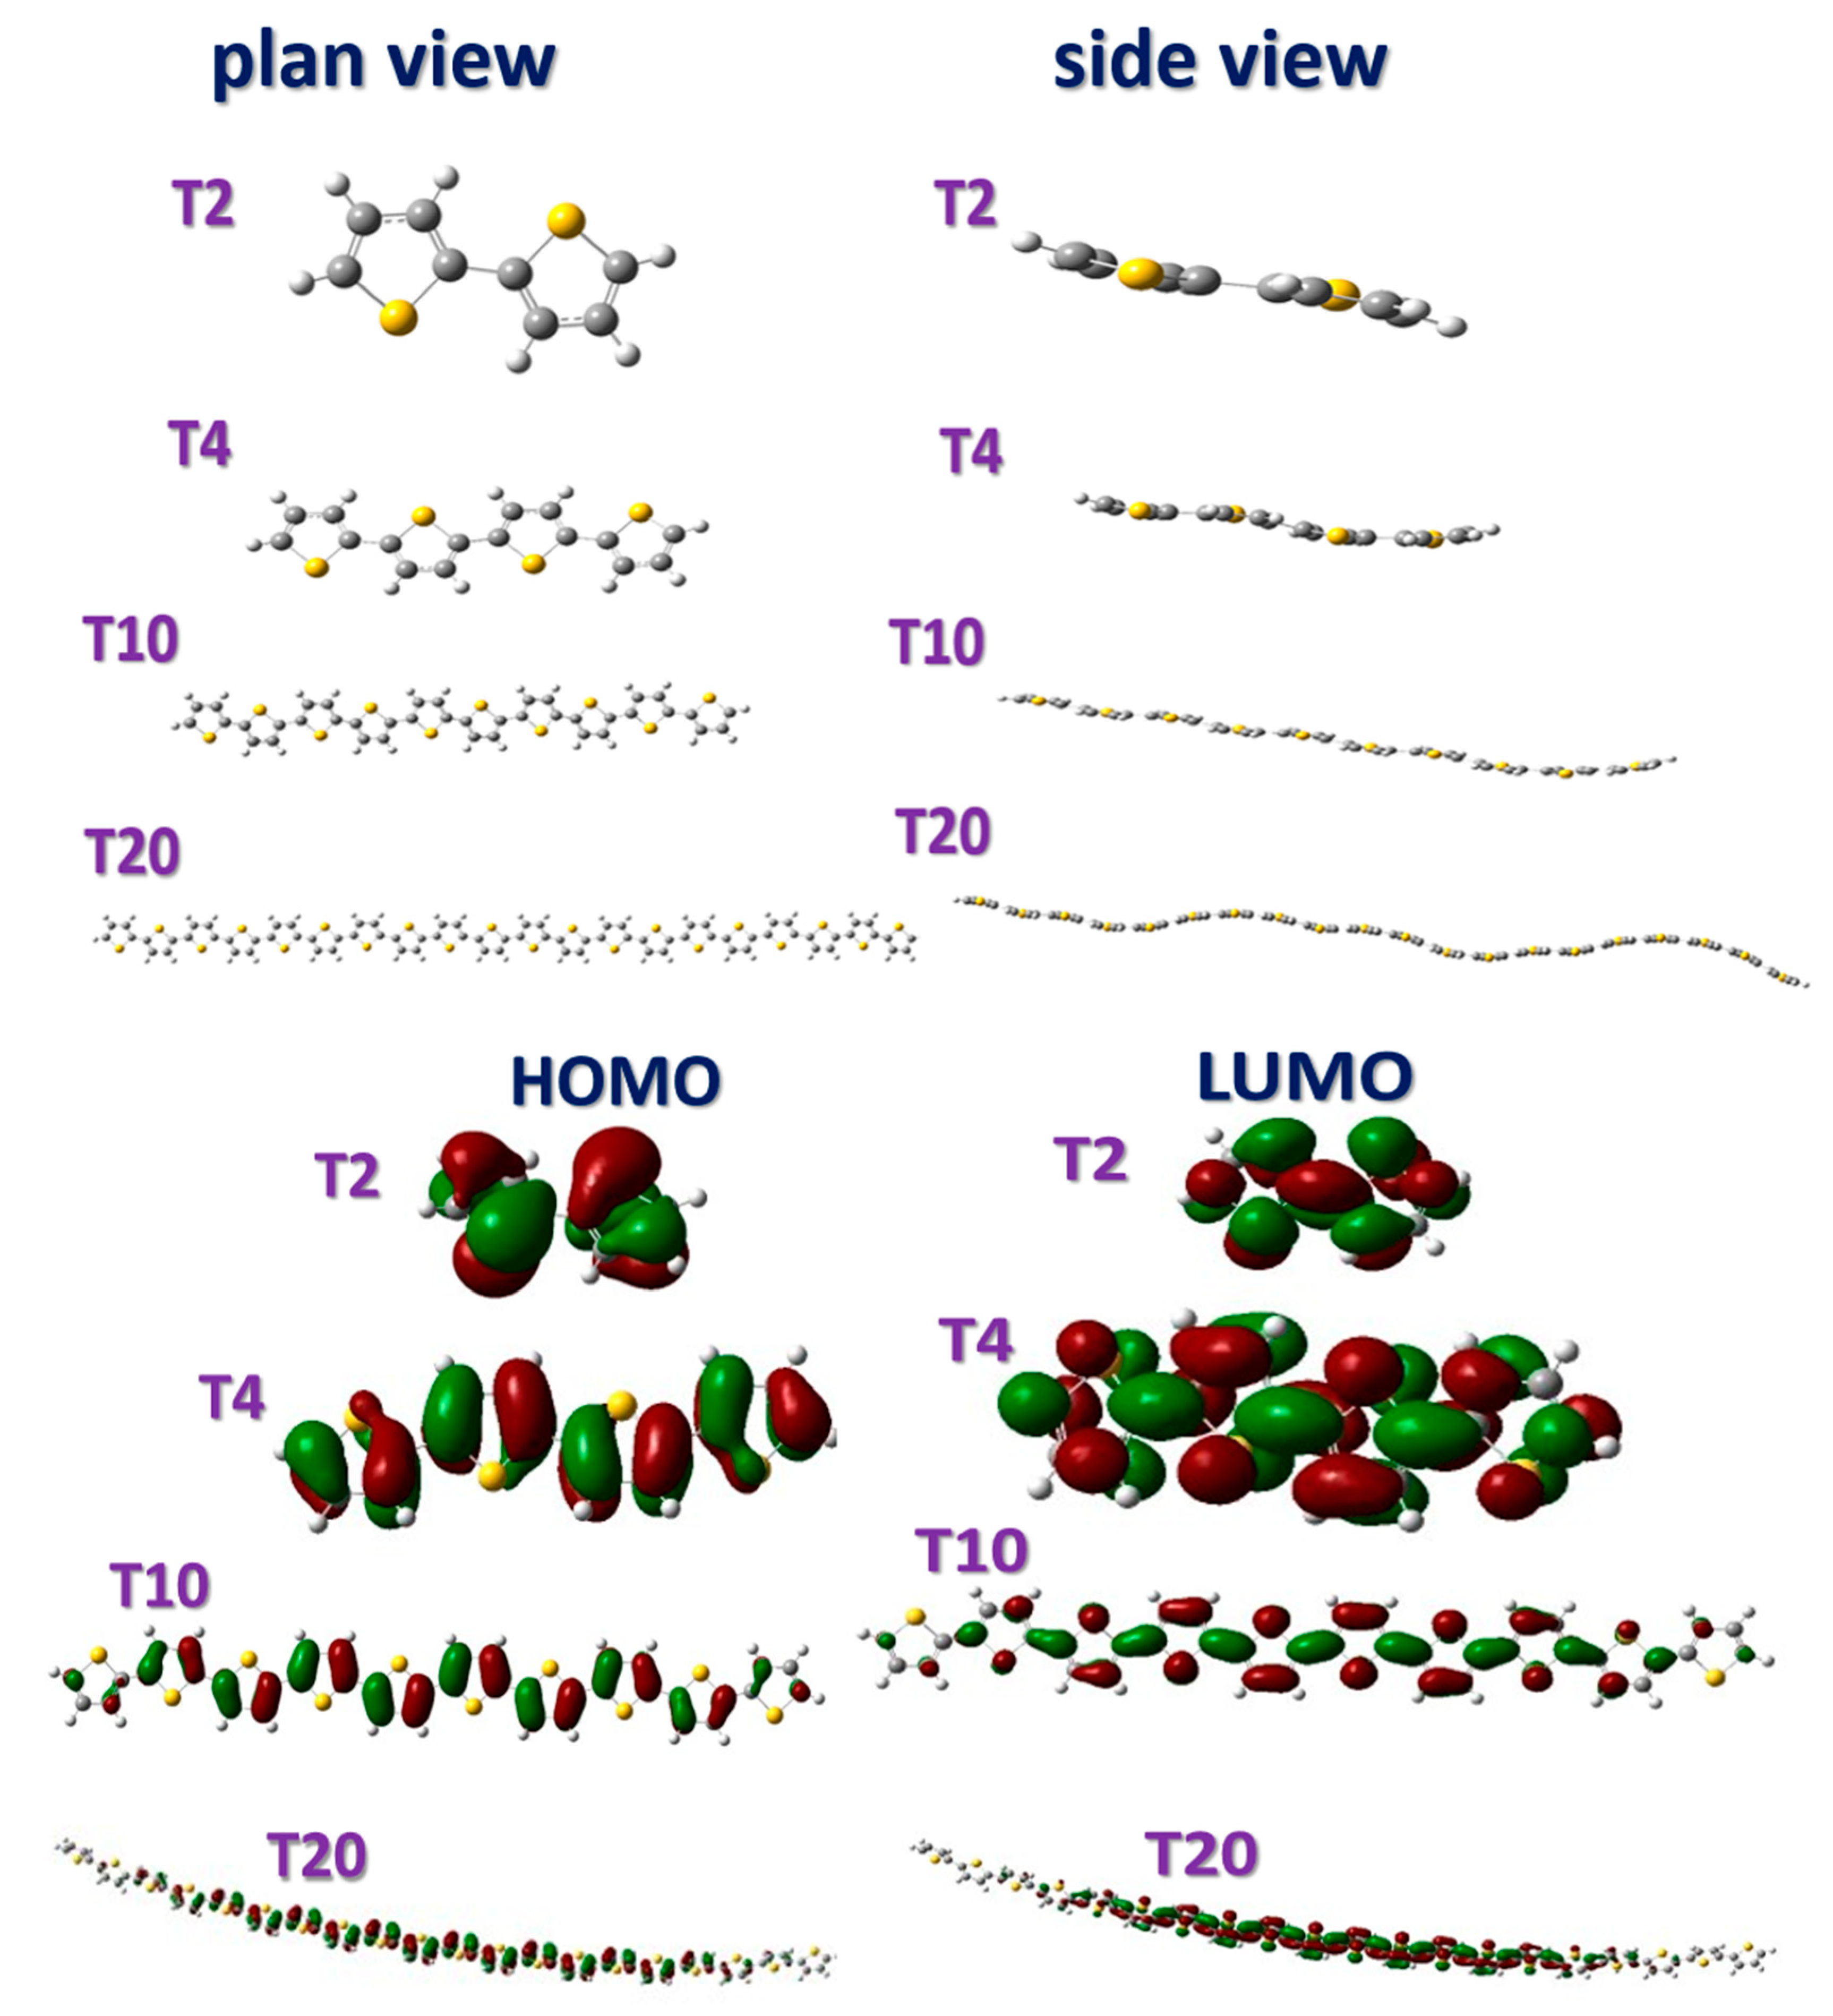
The optimized structures of the PT polymers are illustrated in Figure 3. The top part of Figure 3 presents the planar view and side view of T2, T4, T10, and T20. As indicated in the figure, the large S atom’s steric hindrance between the two C atoms gives the ring structure a nonplanar staggered form. The curvature of the molecular structure increased with DP.
The bottom part of Figure 3 presents the HOMO and LUMO diagrams of T2, T4, T10, and T20. The electron density of the HOMO and LUMO of each polymer are similar. The difference is that the LUMO has more nodes than the HOMO, indicating more antibonding orbitals and a higher energy level.
4.3. Work Function, Valance Band Maximum, Conduction Band Minimum, and Band Gap of T6 (α-Sexithiophene)
Figure 4 presents the UPS measurement of α-sexithiophene (T6). Calculated from the UPS data, the work function and valence band maximum (VBM) of T6 are −4.0 ± 0.1 and −4.9 ± 0.2 eV versus vacuum, respectively. The work function was calculated by subtracting the He(I) radiation energy of 21.2 eV from the high-binding-energy cutoff at 17.2 eV; that is, 17.2 (±0.1) eV − 21.2 eV = −4.0 ± 0.1 eV versus vacuum. Referring to the method that Schulz et al. [24] employed for a bare MAPbI3 surface, we used the low-energy tail of the UPS to determine the position of the VBM. Correspondingly, the VBM was calculated to be 4.9 ± 0.2 eV versus vacuum (−4.0 [±0.1] eV − 0.85 [±0.1] eV). As indicated by the UPS, the T6 optical band gap was approximately 2.8 eV, and the conduction band minimum was calculated to be −2.1 eV versus vacuum. We verified that the experimental HOMO position was close to the theoretically calculated HOMO position (Figure 2). This suggests that the Fermi level of PT lies close to the conduction band and that PT is therefore an n-type semiconductor.
4.4. Redox Potential, UV/Vis Spectrum, and PL Spectrum of T2 (2,2-Bithiophene)
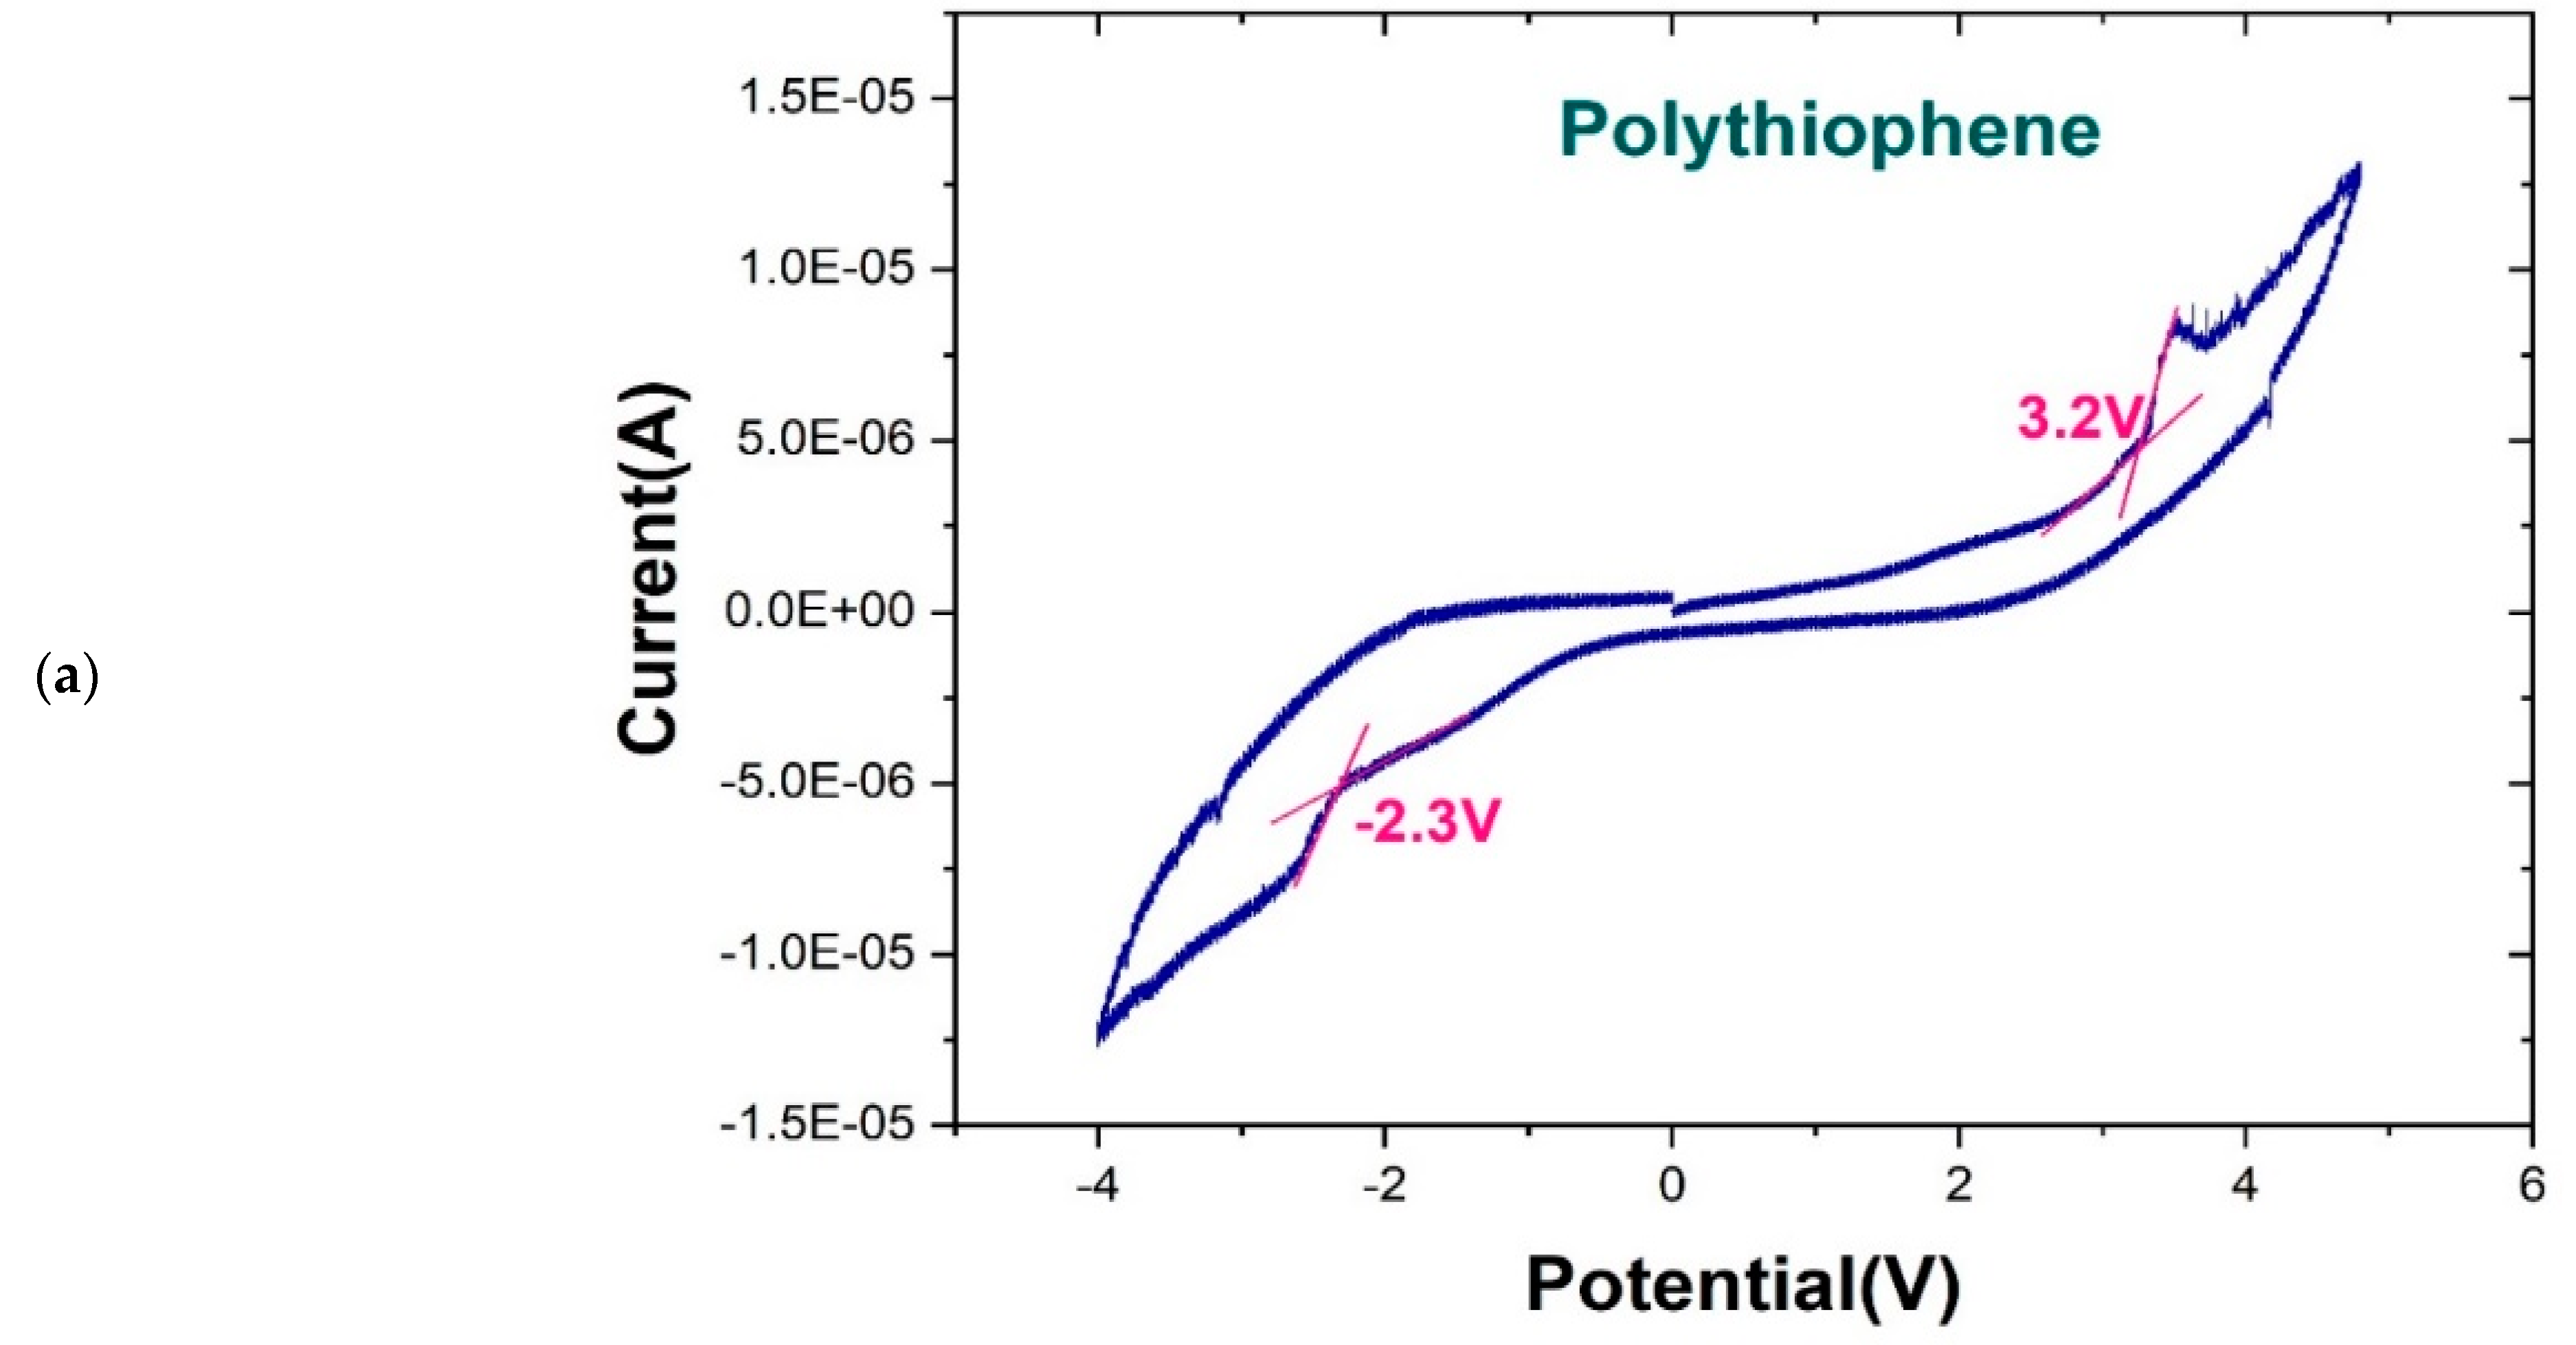
The redox potential, UV/Vis spectrum, and PL of T2 were experimentally measured. The redox potential of T2 was evaluated through cyclic voltammetry [25,26,27]. The electrode potential was scanned at −4.0 to 4.0 V. The band gap of T2 could be calculated from the redox potentials [28,29,30,31]. The redox potential was identified as the peak shoulder potential from the current–potential curve [32,33]. The following empirical formula from Bredas et al. [34] was used:
where IP is the ionization potential and EA is the electron affinity. As presented in Figure 5a, the oxidation peak potential was 3.5 V, and the oxidation potential at the peak shoulder, Eox, was 3.2 V. The reduction peak potential was approximately −2.7 V, and the reduction potential at the peak shoulder, Ered, was −2.3 V. The experimental readings could be converted into HUMO and LUMO energy values, which were 6.7 eV (2.3 + 4.4 eV) and −1.2 eV (3.2 − 4.4 eV), respectively. Accordingly, the band gap was 5.5 eV (6.7–1.2 eV). This value can be treated as reference only because the sample was immersed in a solution during measurement. This measuring environment is far different from DFT calculation environment.
|HOMO| (eV) = IP = 4.4 + Eox
|LUMO| (eV) = EA = 4.4 + Ered
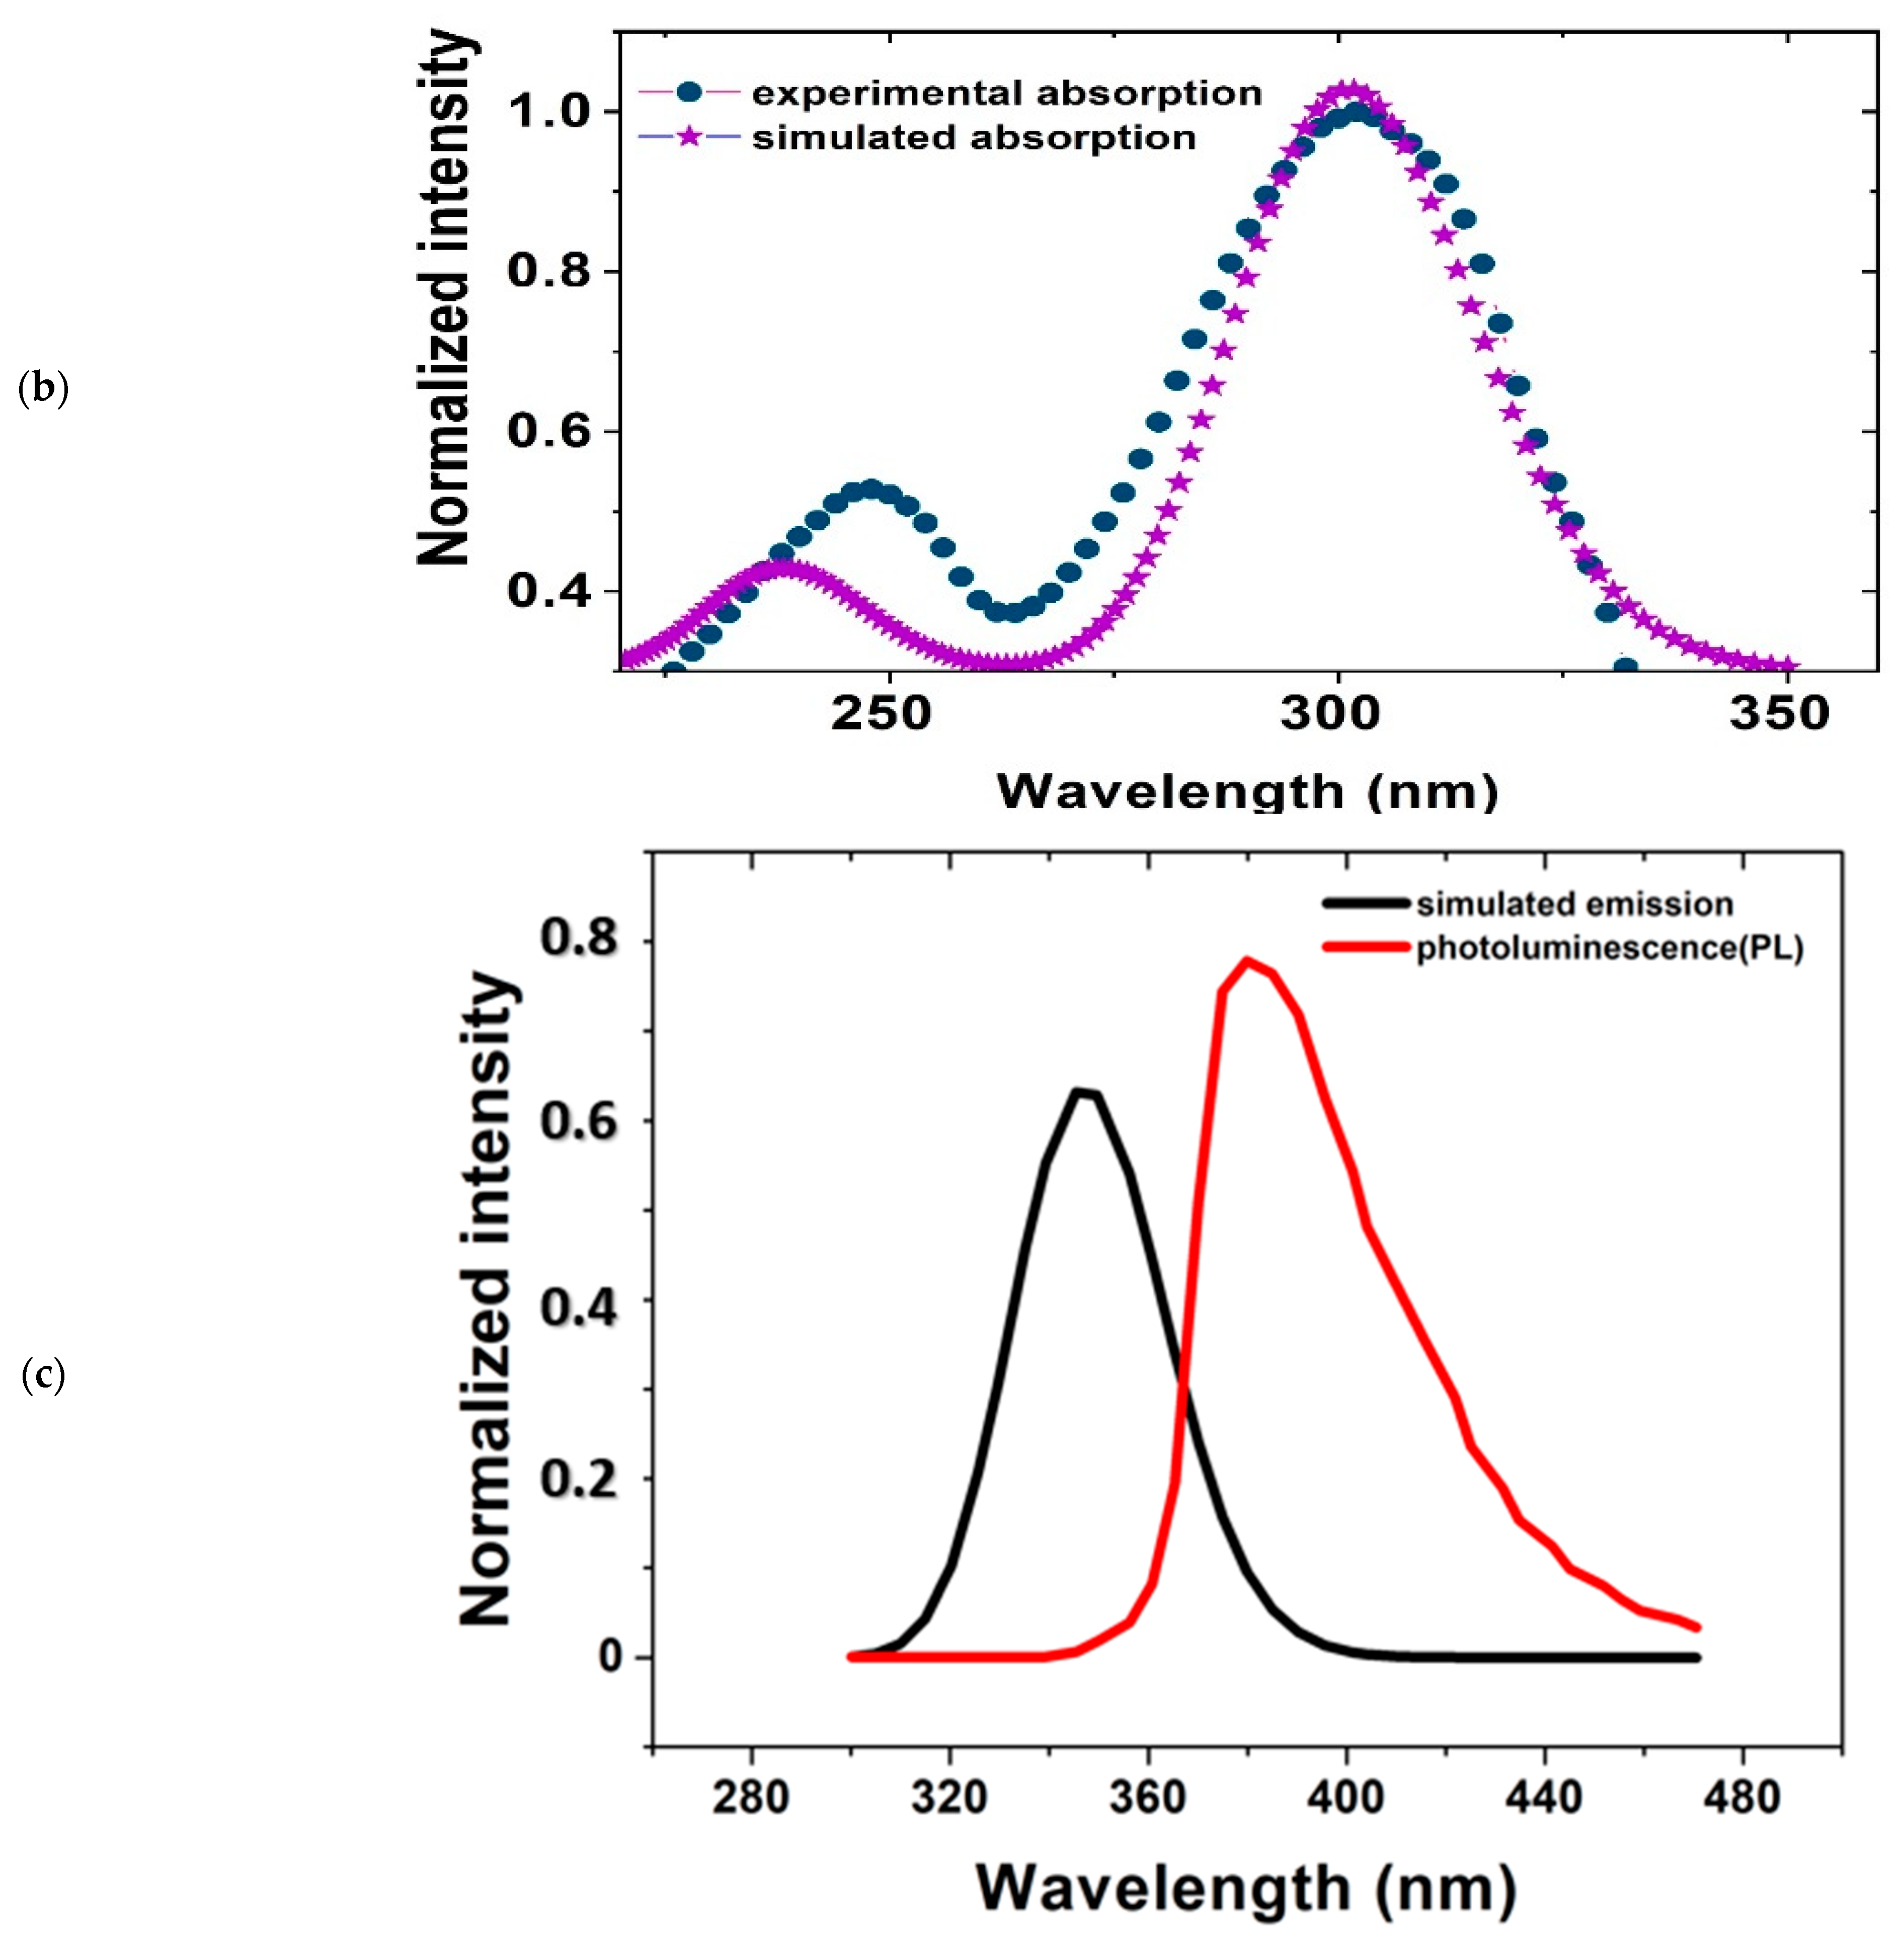
Figure 5b shows the UV/Vis measurements and calculated absorption spectra for T2. The black line indicates the calculated result, and the red line indicates the measured result at a concentration of 1.56 × 10⁻⁴ M T2/ethanol. The calculated and measured absorption peaks (λ = 302 nm) nearly overlap. The discrepancy between calculation and measured data probably due to the environmental factor that DFT calculation do not take into account.
The molecular absorption spectra of various PT polymers were superimposed. The spectral wavelength increased with monomer number. As the number of monomers increased, the energy required to transition from the ground state to the excited state gradually decreased. The absorption peak was due to the transition from the HOMO to the LUMO. The absorption intensity increased with the number of monomers. Therefore, the intensity of the absorption spectra could be used to determine the DP of the polymers. The polymer absorbs the energy and it transforms from the HOMO state to the LUMO state. It then releases the energy from the LUMO state and returns to the HOMO state with the emission of photons. The absorption and emission peaks were both located at the far right of each spectrum. The radiation peak position red-shifted with the increase in DP.
The experimental PL results for T2 are illustrated in Figure 5c; the calculated results are also plotted for comparison. The measured and calculated emission peaks were 345 and 380 nm, respectively. The band gap was then calculated from the emission data.
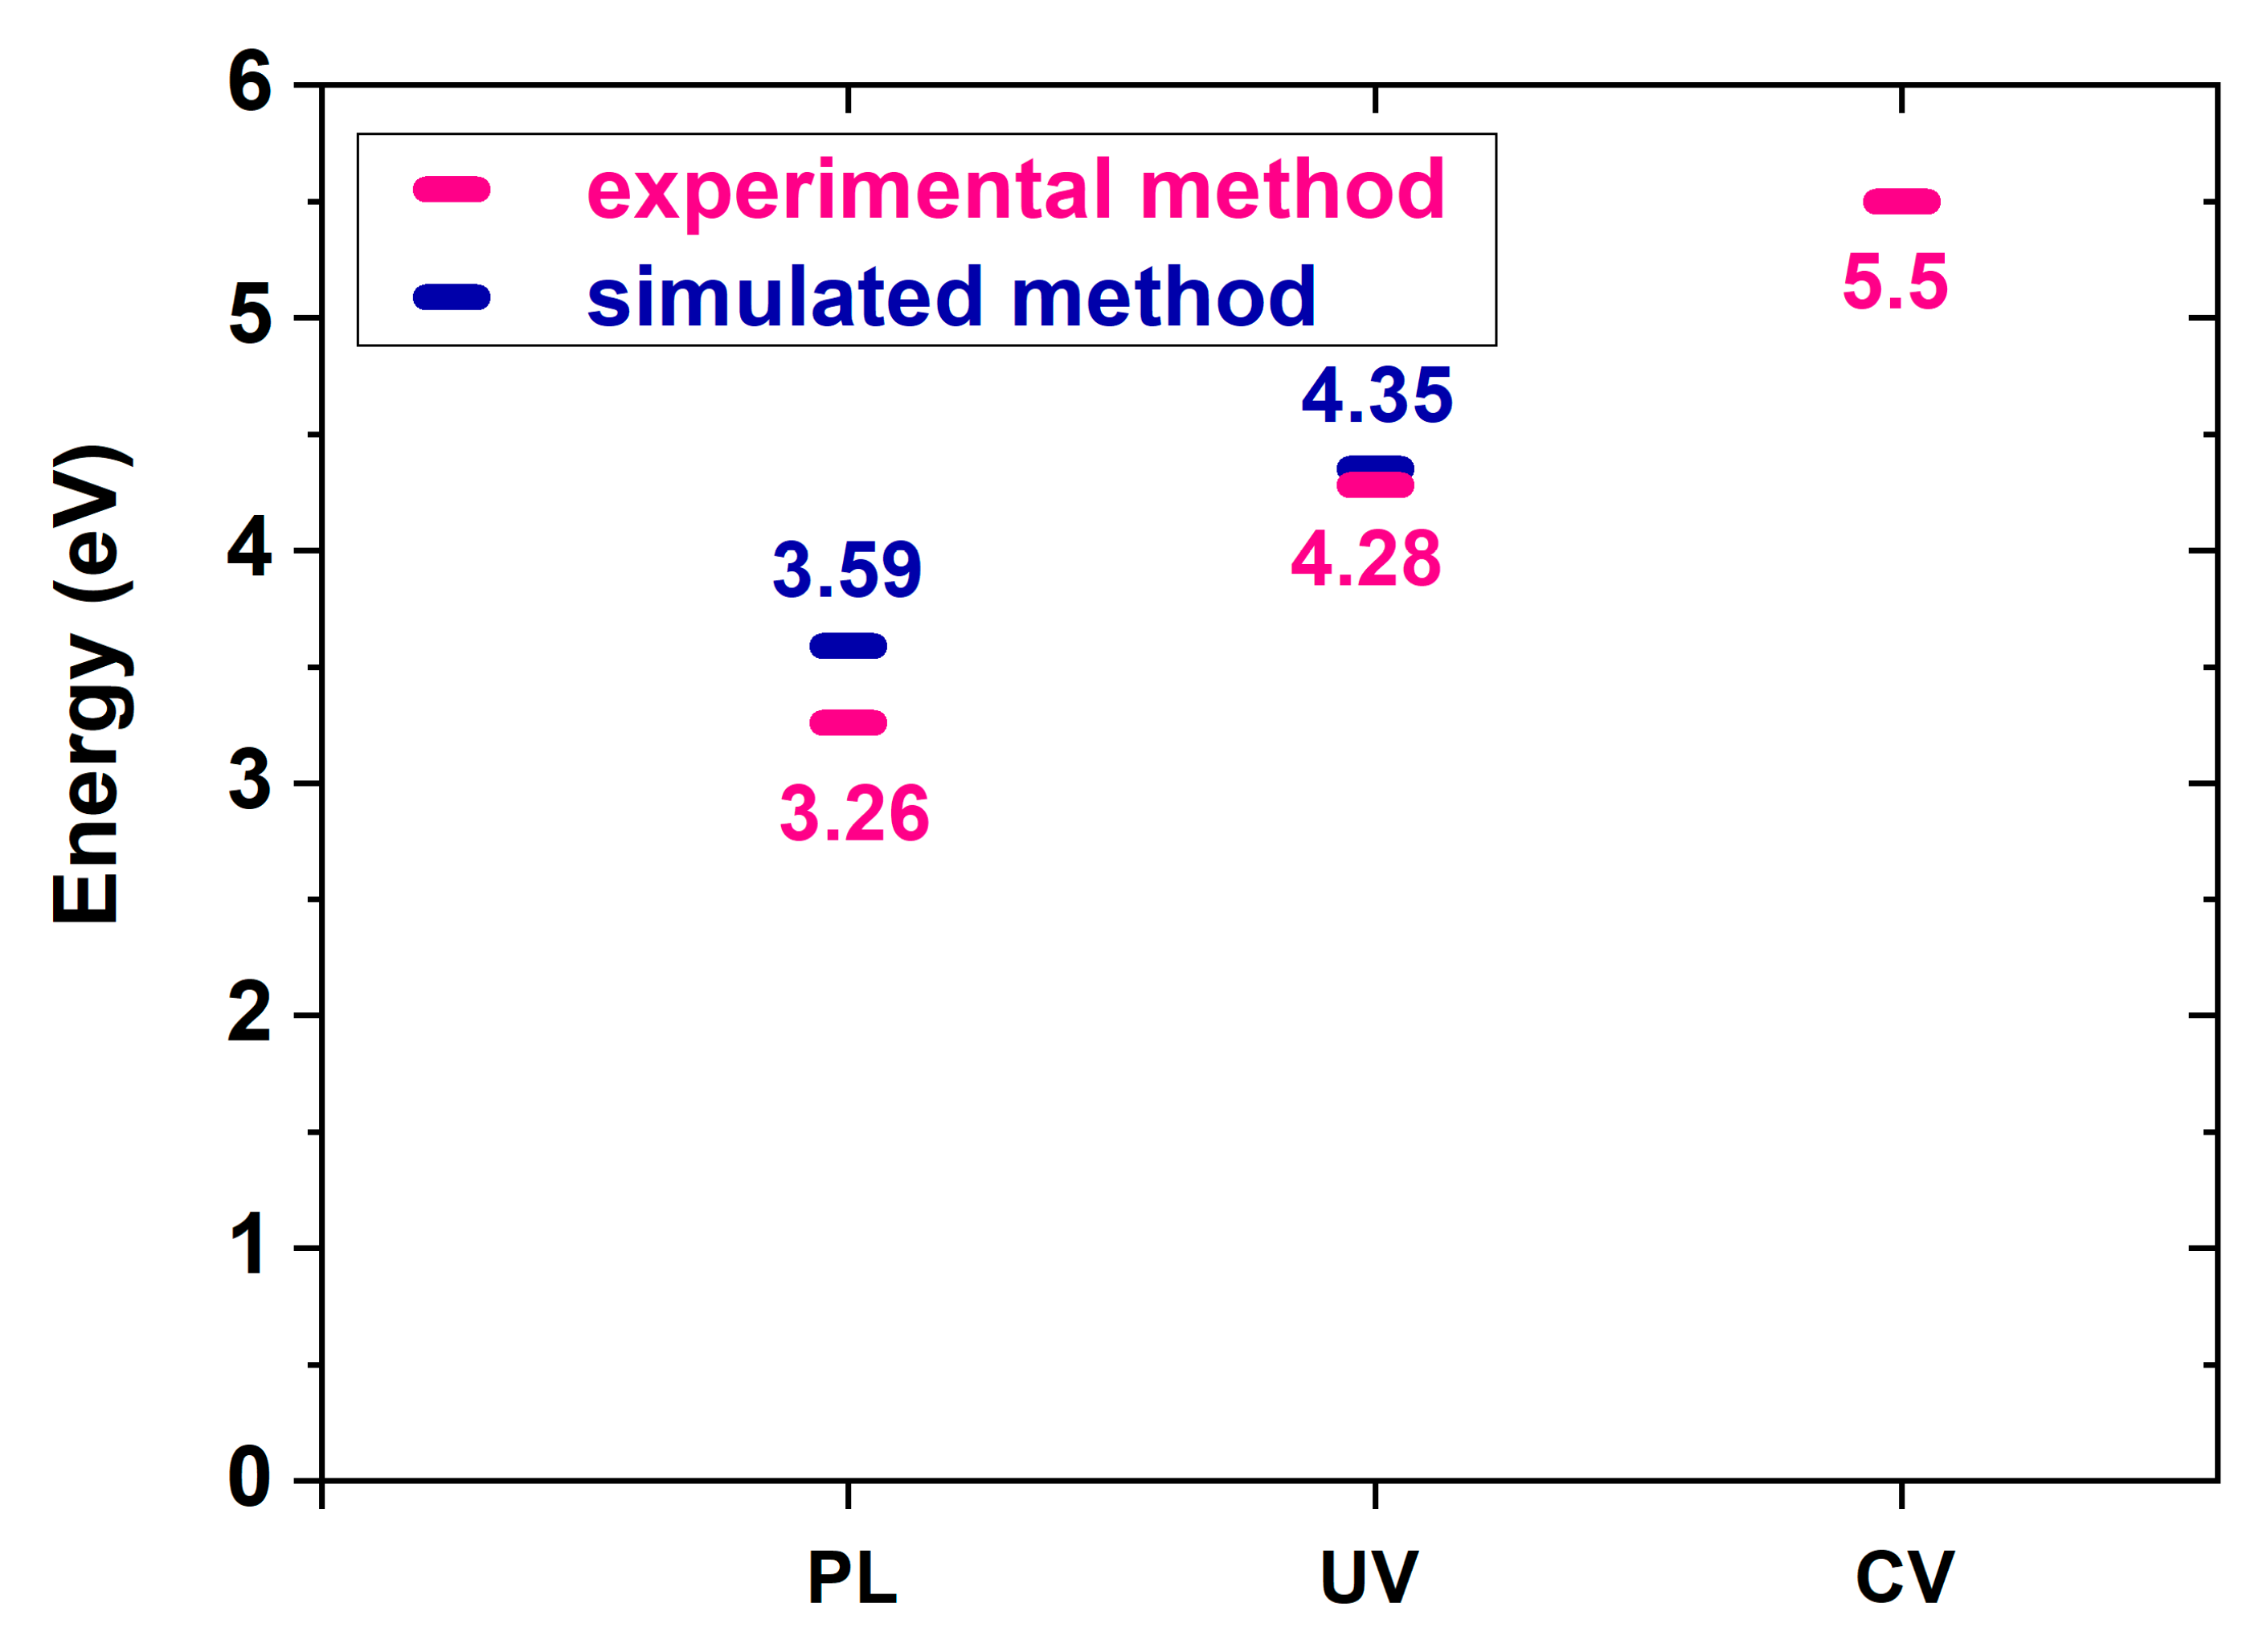
Figure 6 presents a plot of the experimental T2 band gaps obtained from cyclic voltammetry readings and UV/Vis and PL spectra. The experimental data and simulated results differ. The energy levels, from high to low, were those from the cyclic voltammetry readings, UV/Vis spectrum, and PL spectrum. Present DFT calculation does not count the solution effect of CV measurement and solvent effect on UV measurement. A 3.59 eV was obtained from DFT calculation and 3.26 eV from the PL spectrum measurement. The discrepancy between calculation and measurement of PL are the smallest among CV, UV, and PL.
4.5. Free Energy, Electron Affinity, and Electron/Hole Reorganization Energy
According to the Marcus theory formula [35], molecules with smaller hole reorganization energy (λe) or electron reorganization energy (λh) have faster carrier transport. PLED materials contain delocalized π electrons in the organic semiconductor structure. The π electrons are free but still confined within the monomer. However, if the difference in energy level at the interface of the monomer is large, carrier transport is difficult, and the luminous efficiency is low. To improve the luminous efficiency of PLEDs, we must assess the carrier transport capacity of organic materials. The electron/hole transfer rate constant (kh,e) can be calculated from the following equation.
where kB is Boltzman’s constant (1.3806 × 10⁻³ J‧K−1), h is Planck’s constant (1.054 × 10⁻³⁴ J‧s), T is the absolute temperature (in K), HAB is the electron–hole coupling (in eV), λh,e is the electron/hole reorganization energy (in eV), and ΔG0 is the change in the Gibbs free energy of the electron transfer (in eV). Per the preceding equation, the electron/hole transfer rate constant (kh,e) is proportional to λh,e−0.5 exp(−λh,e); this entails that a small value of λh,e results in a high kh,e and that a low electron reorganization energy λe and low hole reorganization energy λe result in a high kh,e.
Table 4 details the IP, EA, λh, and λe for the T∞ polymers. IP decreased with the DP, indicating that free electrons were transferred more easily along the molecule. The higher-DP variants more easily accept electrons and more attract electrons, thereby facilitating electron injection. Furthermore, as DP increased, λh and λe decreased, and the conduction rate increased. The aforementioned electronic properties indicate that the carrier transport rate of PT makes it highly suitable as a light-emitting material.
4.6. Structural Optimization for PT Derivatives
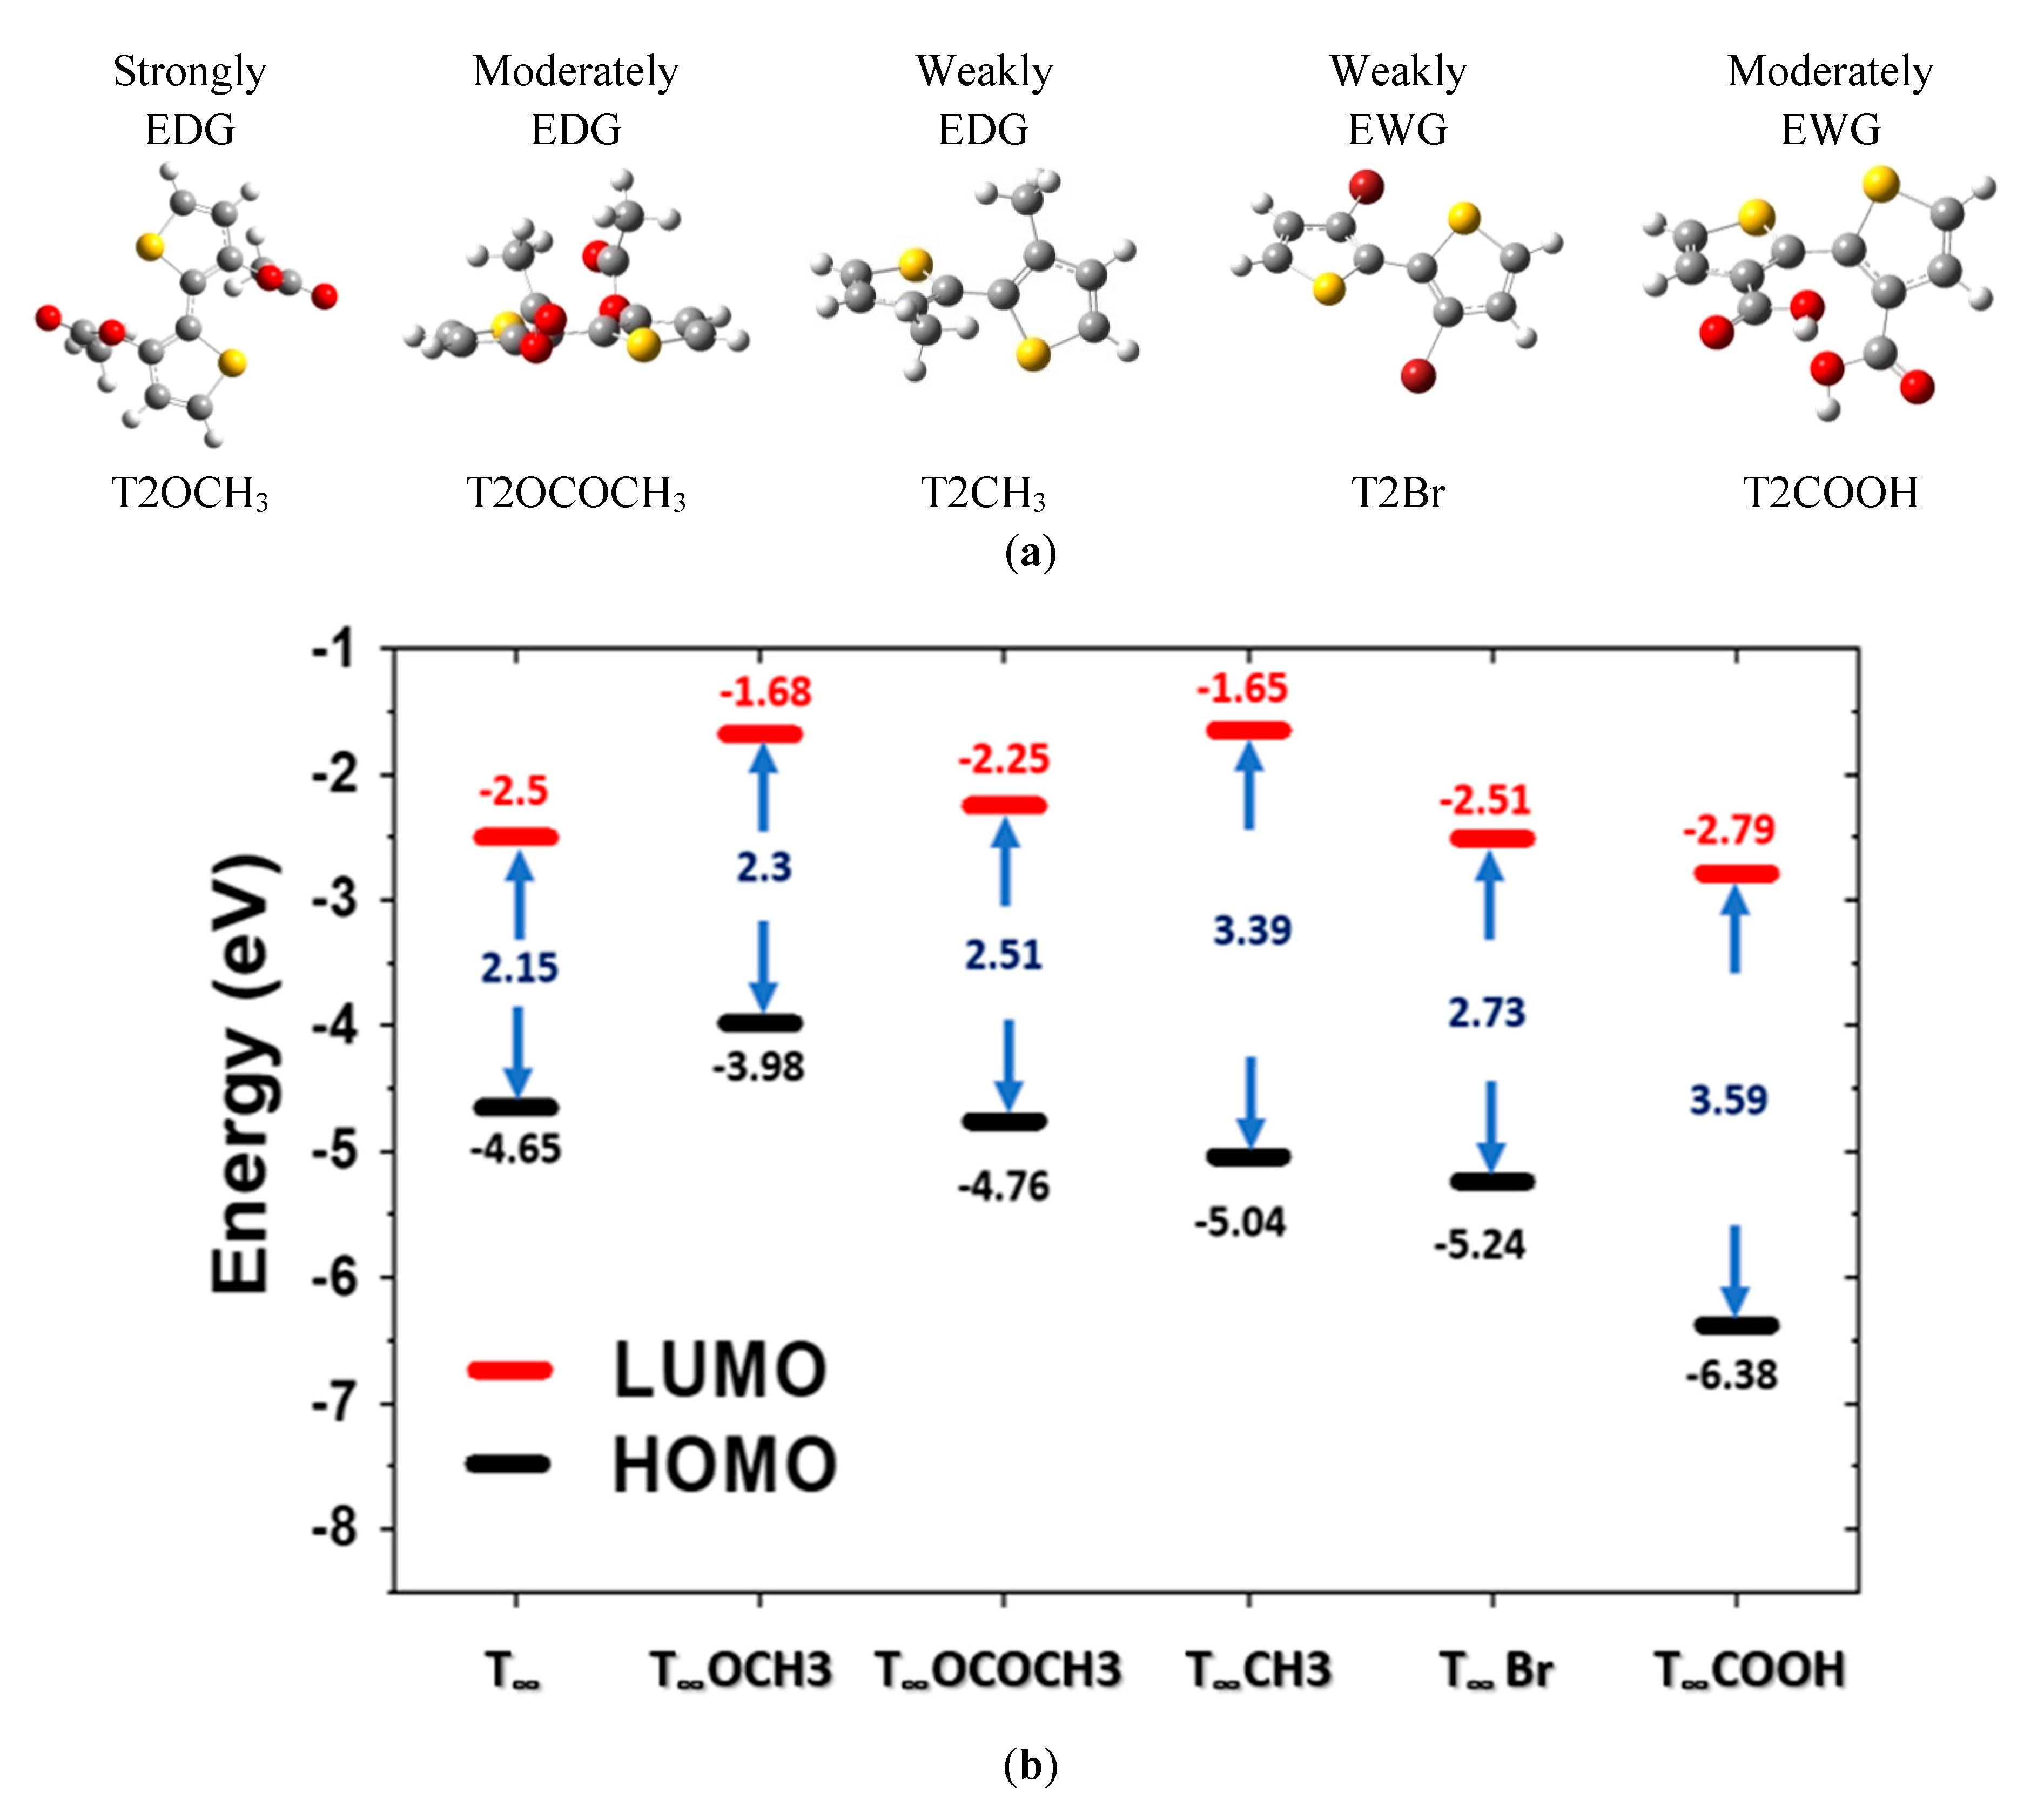
The structural optimization for the Br and COOH derivatives became more difficult as the DP increased. Thus, we calculated the absorption and emission spectra for T1–T6 (Table 5 and Table 6). The structures of the PT polymer derivatives T2OCH3, T2OCOCH3, T2CH3, T2Br, and T2COOH are plotted in Figure 7a. The T2Br structure formed as a result of a Br atom replacing a H atom at position 3, which caused steric hindrance within the ring structure. The polymer chain is not on a planar surface or in a straight chain.
4.7. Energy Levels and Band Gaps of PT Derivatives
Figure 7b illustrates the HOMO and LUMO energy levels of the PT derivatives. Conjugation with the strong electron-withdrawing group reduced the HOMO and LUMO energy levels, and the effect on the HOMO was greater than that on the LUMO. The introduction of the –COOH component to the PT polymer increased the band gap. T2 extrapolating to T∞ has the minimum band gap. In summary, the electron push-and-pull behavior of the substituents can alter the energy levels, band gap, and absorption and emission spectra. Furthermore, the cathode or anode can be made of a material that matches the energy level of the light-emitting material.
4.8. Wavelengths of Absorption and Emission Peaks, Band Gaps, and Oscillation Strengths of PT Derivatives
The wavelengths of the peaks of the absorption and emission spectra of the PT derivatives are listed in Table 5 and Table 6, respectively. The band gaps and oscillator strength of the derivatives are also listed in Table 5 and Table 6. The wavelength increased (red-shifted) as the DP increased (from T2 to T6), which entailed a considerable decrease in excitation energy.
The absorption peaks of the PT polymer derivatives were similar to those of the PT polymer. The highest absorption peaks were located at the far right of the spectrum. As indicated by a comparison of the highest absorption peaks of the PT polymers and their derivatives, the substituents affected the peak absorption position. Some derivatives were red-shifted, whereas others were blue-shifted. The type of substituent affected only the position of the absorption peak and not the configuration of the electron orbitals. In theory, –OCH3 and –COOH induce red and blue shifts in the absorption peak, respectively. The factors causing these red and blue shifts are similar to those causing the band gap variations discussed in Section 4.7. Therefore, different substituents can be added to change the material’s emission spectrum.
The emission wavelengths of the PT polymers were also affected by the addition of substituents. In general, the strong electron push due to –OCH3 induced a red shift in the emission peak, and the weak electron withdrawal due to –OCOCH3 induced a blue shift. These phenomena resulted from simultaneous electron donation withdrawals and steric hindrance effects. A highly distorted main chain results in a short conjugate chain, which causes a blue shift. Thus, the color of the light-emitting element can be adjusted by using different PT polymer derivatives. The light intensity was greatest for the –OCH3 derivative, followed by T1, and –CH3, –Br, –OCOCH3, and –COOH slightly weakened fluorescence. As the –CH3 derivatives exhibit steric hindrance and because C=O functional groups cause electron confinement, the electrons cannot transport effectively. Moreover, because of the lone pair of electrons with an n → π* transition, the transition energy is small to the point where it reduces fluorescence. However, the strong electron push due to –OCH3 can enhance the material’s fluorescence properties.
4.9. Free Energy (IP), Electron Affinity (EA), and Electron and Hole Reorganization Energy (λh, λe) of PT Derivatives
Table 6 lists the ionization potential (IP), electron affinity (EA), and electron and hole reorganization energy (λh, λe) of the PT polymer derivatives as DP approaches infinity. The values for T∞ were extrapolated from the linear relationship of energy and 1/n, as mentioned in Section 4.1. The effect of the addition of substituents was substantial. The addition of –OCH3 reduced the IP of T∞ from 5.1 to 4.36 eV. However, –OCH3 can transport electrons more easily than PT can. T∞COOH had increased IP of 8.23 eV, which resulted in low conductivity. The remaining three substituents also caused the IP of the derivatives to increase.
Through the introduction of derivatives, λe and λh were altered (Table 6), and the conduction rate changed. These results indicate that the nature of electrons and holes can be modulated by changing the substituent.
5. Conclusions
DFT and TD-DFT were used to calculate the electronic and optical properties of PT polymers with different DPs (T1–T6, T10, T15, T20, T25, and T30) and their derivatives formed with five substituents (T2OCH3, T2OCOCH3, T2CH3, T2Br, and T2COOH). Exchange–correlation functionals and basis set values—B3LYP/6-31G(d), B3LYP/6-311G(d), and B3LYP/CEP-31G(d)—were selected and optimized for all calculations of the PT polymer properties. Thus, we elucidated the influence of DP and substituents on the electronic and optical properties of PT polymers and their derivatives.
The optimal structures of T3–T10, T15, T20, T25, and T30 were obtained. Due to the steric hindrance associated with the S atom, the PT ring structure must be nonplanar to achieve stability. The band gaps of these PT polymers with different DPs were calculated. The band gap gradually decreased to 2eV as the DP (n) increased from 1 to 30. A linear relationship between band gap and 1/n was obtained. This linear equation was used to extrapolate the PT polymer behavior to T∞ (1/n → 0).
To verify the calculations, we compared them with experimental data from the literature and obtained an error of 0.965%. The redox potentials, UV/Vis spectra, PL spectrum of T2, and UPS of T6 were also experimentally obtained and used to evaluate the calculated results.
The UV/Vis absorption and emission spectra were calculated. With increases in the DP of the PT polymer, the increasingly conjugated nature of the polymer caused an increasing red shift in the absorption and emission spectra. Therefore, the color of the light-emitting material can be controlled by selecting the DP of the PT polymer. The emission intensity increased as the DP of the PT polymer increased. Therefore, spectral intensity can be used to quantitatively analyze the DP of PT polymers.
Both the absorption and emission spectra of the PT polymer derivatives, –OCH3, –OCOCH3, –CH3, –Br, and –COOH, were also calculated. The shapes of the absorption and emission spectra and peaks of these derivatives did not change significantly from their corresponding PT polymers. However, the derivatives differed in their HOMO and LUMO energy levels, band gaps, peak positions of their respective absorption spectra, and light emission intensity. These properties were dependent on the substituent. In general, the color of a DP PLED can be tuned by adjusting the DP of the polymer or by using suitable derivatives.
Author Contributions
This project was carried out under the supervision of Prof. C.-W.H. He conceptualized this work. Calculations were carried out by H.-W.T. Prof. M.-H.C. provides PL data. Prof. K.-L.H. edited this manuscript. All authors have read and agreed to the published version of the manuscript.
Funding
This research was funded by the Ministry of Science and Technology, Taiwan, grant number MOST 107-2221-E-007-047-MY3.
Acknowledgments
The author H.-W.T. appreciate the computational services provided by the National Center for High-Performance Computing.
Conflicts of Interest
The authors declare no conflict of interest.
References
- Burroughes, J.H.; Bradley, D.D.C.; Brown, A.R.; Marks, R.N.; Mackay, K.; Friend, R.H.; Burns, P.L.; Holmes, A.B. Light-emitting diodes based on conjugated polymers. Nature 1990, 347, 539–541. [Google Scholar] [CrossRef]
- Andersson, M.R.; Berggren, M.; Gustafsson, G.; Gustafsson-Carlberg, J.C.; Selse, D.; Hjertberg, T.; Wennerstroem, O. Electroluminescence from substituted poly(thiophenes): From blue to near-infrared. Macromolecules 1995, 27, 7525–7529. [Google Scholar] [CrossRef]
- van Mullekoma, H.A.M.; Vekemans, J.A.J.M.; Havinga, E.E.; Meijer, E.W. Developments in the chemistry and band gap engineering of donor–acceptor substituted conjugated polymers. Mater. Sci. Eng. 2001, 32, 1–40. [Google Scholar] [CrossRef]
- Colditz, R.; Grebner, D.; Helbig, M.; Rentsch, S. Theoretical studies and spectroscopic investigations of ground and excited electronic states of thiophene oligomers. Chem. Phys. 1995, 201, 309–320. [Google Scholar] [CrossRef]
- Ferro, D.R.; Porzio, W.; Destri, S.; Ragaui, M.; Brückner, S. Application of molecular mechanics to refine and understand the crystal structure of polythiophene and its oligomers. Macromol. Theory Simul. 1997, 6, 713–727. [Google Scholar] [CrossRef]
- Ma, J.; Li, S.; Jiang, Y. A time-dependent DFT study on band gaps and effective conjugation lengths of polyacetylene, polyphenylene, polypentafulvene, polycyclopentadiene, polypyrrole, polyfuran, polysilole, polyphosphole and polythiophene. Macromolecules 2002, 35, 1109–1115. [Google Scholar] [CrossRef]
- Colle, R.; Grosso, G.; Ronzani, A.; Zicovich-Wilson, C.M. Structure and X-ray spectrum of crystalline poly(3-hexylthiophene) from DFT-van der Waals calculations. Phys. Status Solidi B 2011, 248, 1360–1368. [Google Scholar] [CrossRef]
- Bella, A.; Panneerselvam, M.; Vedha, S.A.; Jaccob, M.; Solomon, R.V.; Merlin, J.P. DFT-TDDFT framework of diphenylamine based mixed valence compounds for optoelectronic applications—Structural modification of π acceptors. Comput. Mater. Sci. 2019, 162, 359–369. [Google Scholar] [CrossRef]
- Taouali, W.; Casida, M.E.; Darghouth, A.A.M.H.M.; Alimia, K. Theoretical design of new small molecules with a low band-gap for organic solar cell applications: DFT and TD-DFT study. Comput. Mater. Sci. 2018, 150, 54–61. [Google Scholar] [CrossRef]
- Solomon, R.V.; Jagadeesan, R.; Vedha, S.A.; Venuvanalingam, P. A DFT/TDDFT modelling of bithiopheneazochromophores for optoelectronic applications. Dye. Pigment. 2014, 100, 261–268. [Google Scholar] [CrossRef]
- Panneerselvam, M.; Kathiravan, A.; Solomon, R.V.; Jaccob, M. The role of π-linkers in tuning the optoelectronic properties of triphenylamine derivatives for solar cell applications—A DFT/TDDFT study. Phys. Chem. Chem. Phys. 2017, 19, 6153–6163. [Google Scholar] [CrossRef] [PubMed]
- Song, M.X.; He, K.C.; Lü, P.; Wang, L.J.; Cao, Y.Q.; Song, S.Y.; Meng, X.W.; Lü, S.Q.; Qin, Z.K.; Bai, F.Q.; et al. DFT and TD-DFT study a series of blue and green iridium complexes with mesityl-phenyl-imidazole ligand. Org. Electron. 2019, 64, 181–187. [Google Scholar] [CrossRef]
- Nayak, P.K.; Periasamy, N. Calculation of electron affinity, ionization potential, transport gap, optical band gap and exciton binding energy of organic solids using ‘solvation’ model and DFT. Org. Electron. 2009, 10, 1396–1400. [Google Scholar] [CrossRef]
- Kuusik, I.; Kook, M.; Pärna, R.; Kivimäki, A.; Käämbre, T.; Reisberg, L.; Kikas, A.; Kisand, V. The electronic structure of ionic liquids based on the TFSI anion: A gas phase UPS and DFT study. J. Mol. Liq. 2019, 294, 111580. [Google Scholar] [CrossRef]
- Quites, F.J.; Faria, G.C.; Germino, J.C.; Atvars, T.D.Z. Tuning emission colors from blue to green in polymeric light-emitting diodes fabricated using polyfluorene blends. J. Phys. Chem. A 2014, 118, 10380–10390. [Google Scholar] [CrossRef]
- Chen, R.; Wang, Y.; Chen, T.; Li, H.; Zheng, C.; Yuan, K.; Wang, Z.; Tao, Y.; Zheng, C.; Huang, W. Heteroatom-bridged benzothiazolyls for organic solar cells: A theoretical study. J. Phys. Chem. B 2015, 119, 583–591. [Google Scholar] [CrossRef] [PubMed]
- Kuusik, I.; Berholts, M.; Kruusma, J.; Kisand, V.; Tõnisoo, A.; Lust, E.; Nõmmiste, E. Valence electronic structure of [EMIM][BF4] ionic liquid: Photoemission and DFT+D study. RSC Adv. 2018, 8, 30298–30304. [Google Scholar] [CrossRef] [Green Version]
- Kuusik, I.; Kook, M.; Pärna, R.; Kisand, V. Ionic liquid vapors in vacuum: Possibility to derive anodic stabilities from DFT and UPS. ACS Omega 2021, 6, 5255–5265. [Google Scholar] [CrossRef]
- Alguno, A.C.; Chung, W.C.; Bantaculo, R.V.; Vequizo, R.M.; Miyata, H.; Ignacio, E.W.; Bacal, A.M. Ab initio and density functional studies of polythiophene energy band gap. NECTEC Tech. J. 2001, 2, 215–218. Available online: http://citeseerx.ist.psu.edu/viewdoc/download?doi=10.1.1.510.5901&rep=rep1&type=pdf (accessed on 12 August 2021).
- Mori, K.; Matsumoto, N.; Nomoto, S.; Tsuruta, K. Computational and experimental analyses of detachment force at the interface between carbon fibers and epoxy resin. Open J. Compos. Mater. 2017, 7, 179–184. [Google Scholar] [CrossRef] [Green Version]
- Becke, A.D. Density-functional thermochemistry. III. The role of exact exchange. J. Chem. Phys. 1993, 98, 5648. [Google Scholar] [CrossRef] [Green Version]
- Stephens, P.J.; Devlin, J.F.; Chabalowski, C.F.; Frisch, M.J. Ab initio calculation of vibrational absorption and circular dichroism spectra using density functional force fields. J. Chem. Phys. 1993, 98, 11623–11627. [Google Scholar] [CrossRef]
- Kobayashi, M.; Chen, J.; Chung, T.C.; Moraes, F.; Heeger, A.J.; Wudl, F. Synthesis and properties of chemically coupled poly(thiophene). Synth. Met. 1984, 9, 77–86. [Google Scholar] [CrossRef]
- Schulz, P.; Edri, E.; Kirmayer, S.; Hodes, G.; Cahen, D.; Kahn, A. Interface energetics in organo-metal halide perovskite-based photovoltaic cells. Energy Environ. 2014, 7, 1377–1381. [Google Scholar] [CrossRef]
- Lete, C.; Gadgil, B.; Kvarnström, C. The electrochemistry of copolymer films based on azulene and 3 thiophene acetic acid. J. Electroanal. Chem. 2015, 742, 30–36. [Google Scholar] [CrossRef]
- Bagger, A.; Arán-Ais, R.M.; Stenlid, J.H.; Santos, E.C.D.; Arnarson, L.; Jensen, K.D.; Escudero-Escribano, M.; Cuenya, B.R.; Rossmeisl, J. Ab initio cyclic voltammetry on Cu(111), Cu(100) and Cu(110) in acidic, neutral and alkaline solutions. ChemPhysChem 2019, 20, 3096–3105. [Google Scholar] [CrossRef]
- Rossmeisl, J.; Jensen, K.D.; Petersen, A.S.; Arnarson, L.; Bagger, A.; Escudero-Escribano, M. Realistic cyclic voltammograms from ab initio simulations in alkaline and acidic electrolytes. J. Phys. Chem. C 2020, 124, 20055–20065. [Google Scholar] [CrossRef]
- Tiwari, A.; Heenen, H.H.; Bjørnlund, A.S.; Maagaard, T.; Cho, E.; Chorkendorff, I.; Kristoffersen, H.H.; Chan, K.; Horch, S. Fingerprint voltammograms of copper single crystals under alkaline conditions: A fundamental mechanistic analysis. J. Phys. Chem. Lett. 2020, 11, 1450–1455. [Google Scholar] [CrossRef]
- Bruix, A.; Margraf, J.T.; Andersen, M.; Reuter, K. First-principles-based multiscale modelling of heterogeneous catalysis. Nat. Catal. 2019, 2, 659–670. [Google Scholar] [CrossRef]
- Pedersen, J.K.; Batchelor, T.A.A.; Bagger, A.; Rossmeisl, A. High-entropy alloys as catalysts for the CO2 and CO Reduction Reactions. ACS Catal. 2020, 10, 2169–2176. [Google Scholar] [CrossRef]
- Elgrishi, N.; Rountree, K.J.; McCarthy, B.D.; Rountree, E.S.; Eisenhart, T.T.; Dempsey, J.L. A practical beginner’s guide to cyclic voltammetry. J. Chem. Educ. 2018, 95, 197–206. [Google Scholar] [CrossRef]
- Changsuk, Y.; Seongpil, H. Analysis of the charging current in cyclic voltammetry and supercapacitor’s galvanostatic charging profile based on a constant-phase element. ACS Omega 2021, 6, 367–373. [Google Scholar] [CrossRef]
- Kim, Y.N.; Yun, D.Y.; Arul, N.S.; Kim, T.W. Carrier transport mechanisms of multilevel non-volatile memory devices with a floating gate consisting of hybrid organic/inorganic nano composites. Org. Electron. 2015, 17, 270–274. [Google Scholar] [CrossRef]
- Bredas, J.L.; Silbey, R.; Boudreaux, D.S.; Chance, R.R. Chain-length dependence of electronic and electrochemical properties of conjugated systems: Polyacetylene, polyphenylene, polythiophene, and polypyrrole. J. Am. Chem. Soc. 1983, 105, 6555–6559. [Google Scholar] [CrossRef]
- Marcus, R.A. On the theory of oxidation-reduction reactions involving electron transfer. J. Chem. Phys. 1956, 24, 966. [Google Scholar] [CrossRef] [Green Version]
Figure 1.
Steps in the calculation method.

Figure 2.
(a) Plot of band gap against 1/n. A linear relationship was observed, and the data were fitted to y = ax + b; (b) HOMO and LUMO energy levels of T1, T10, T15, T20, T25, and T30 calculated using B3LYP/6-31G(d).
Figure 2.
(a) Plot of band gap against 1/n. A linear relationship was observed, and the data were fitted to y = ax + b; (b) HOMO and LUMO energy levels of T1, T10, T15, T20, T25, and T30 calculated using B3LYP/6-31G(d).


Figure 3.
Planar view and side view of optimized molecular structure and orbital diagram of HOMO and LUMO of T2, T4, T10, and T20.
Figure 3.
Planar view and side view of optimized molecular structure and orbital diagram of HOMO and LUMO of T2, T4, T10, and T20.

Figure 4.
UV/Vis photoemission spectra (He(I)) of α-sexithiophene/indium tin oxide for direct determination of work function and VBM.
Figure 4.
UV/Vis photoemission spectra (He(I)) of α-sexithiophene/indium tin oxide for direct determination of work function and VBM.

Figure 5.
(a) Cyclic voltammetry results for T2. Oxidation potential (Eox) and reduction potential (Ered) can be obtained from the cyclic voltammetry curve; (b) Comparison of UV/Vis spectra of T2 from molecular simulations and experimental measurements; (c) Comparison of PL measurements and quantum simulation calculations for T2 emission spectrum.


Figure 6.
T2 band gaps obtained from experimental data and calculated from cyclic voltammetry readings, UV/Vis spectra, and PL spectra.
Figure 6.
T2 band gaps obtained from experimental data and calculated from cyclic voltammetry readings, UV/Vis spectra, and PL spectra.

Figure 7.
(a) Molecular structure of PT derivatives studied in this work. EDG and EWG denote electron-donating groups and electron-withdrawing groups, respectively; (b) Calculated energy levels of HOMO and LUMO of PT derivatives.
Figure 7.
(a) Molecular structure of PT derivatives studied in this work. EDG and EWG denote electron-donating groups and electron-withdrawing groups, respectively; (b) Calculated energy levels of HOMO and LUMO of PT derivatives.


Table 1.
Calculation method, exchange–correlation functional, and basis set used in Gaussian 09 for the calculation of the band gap, electronic properties, and UV/Vis spectra of the PT polymers T1–T10, T15, T20, T25, and T30.
Table 1.
Calculation method, exchange–correlation functional, and basis set used in Gaussian 09 for the calculation of the band gap, electronic properties, and UV/Vis spectra of the PT polymers T1–T10, T15, T20, T25, and T30.
| Polymers | Objectives | Job | Method and Exchange-Correlation Functional | Basis Set | |
|---|---|---|---|---|---|
| T1–T10, T15,T20 T25,T30 | 1. Optimization 2. Band Gap 3.Linear Extrapolation => PT Band Gap | Opt + freq | DFT | B3LYP | 6-31G(d) |
| 6-311G(d) | |||||
| CEP-31G(d) | |||||
| T1–T10, T15,T20 T25,T30 | 1.Electronic Properties 2.UV/Vis Spectrum | Energy | TD-DFT | B3LYP | 6-31G(d) |
Table 2.
Calculation method, exchange–correlation functional, and basis set used in Gaussian 09 for calculation of excited state of 1. T10, T15, T20, T25, and T30.
Table 2.
Calculation method, exchange–correlation functional, and basis set used in Gaussian 09 for calculation of excited state of 1. T10, T15, T20, T25, and T30.
| Polymers | Objectives | Job | Method and Exchange-Correlation Functional | BASIS SET | |
|---|---|---|---|---|---|
| T1–T10, T15,T20, T25,T30 | Excited State Optimization | Opt + freq | CIS | 6-31G(d) | |
| Emission Spectrum | Energy | TD-DFT | B3LYP | ||
Table 3.
Calculated and experimental band gaps of T∞. Experimental results are drawn from the literature [23]. Error was calculated by ((C − E)/E) × 100%. Where C is the calculation result and E is the experimental data.
Table 3.
Calculated and experimental band gaps of T∞. Experimental results are drawn from the literature [23]. Error was calculated by ((C − E)/E) × 100%. Where C is the calculation result and E is the experimental data.
| Exchange-Correlation Functional Used in the Calculation | |||
|---|---|---|---|
| B3LYP/6-31G(d) | B3LYP/6-311G(d) | B3LYP/CEP-31G(d) | |
| Calculated band gap (eV) | 1.9807 | 2.2058 | 1.8654 |
| Literature experimental data | 2.00 eV | ||
| Error (%) | −0.965 | 10.29 | −6.73 |
Table 4.
Calculated IP, EA, λh, and λe of PT polymer derivatives.
| Derivatives of PT Polymer | IP | EA | λh | λe |
|---|---|---|---|---|
| T∞ | 5.1 | −2.1 | 0.18 | 0.15 |
| T∞OCH3 | 4.36 | −1.6 | 0.22 | 0.02 |
| T∞OCOCH3 | 5.77 | −2.47 | 0.25 | 0.35 |
| T∞CH3 | 5.42 | −1.46 | 0.71 | 0.36 |
| T∞Br | 5.5 | −2.4 | 0.07 | 0.08 |
| T∞COOH | 8.23 | −3.11 | 0.2 | 0.23 |
Table 5.
Wavelengths of highest peak of absorption spectra of derivatives of T2, T4, and T6.
| Derivatives of PT Polymer | Peak Wavelength (nm) | E (eV) | Osc. Strength (f) | Major Contribution |
|---|---|---|---|---|
| T2OCH3 | 327.60 | 3.79 | 0.43 | LUMO (99%) |
| T4OCH3 | 471.92 | 2.63 | 1.18 | LUMO (100%) |
| T6OCH3 | 582.85 | 2.13 | 2.05 | LUMO (100%) |
| T2OCOCH3 | 307.76 | 4.03 | 0.39 | LUMO (99%) |
| T4OCOCH3 | 430.27 | 2.88 | 1.09 | LUMO (100%) |
| T6OCOCH3 | 505.97 | 2.45 | 1.82 | LUMO (99%) |
| T2CH3 | 266.34 | 4.66 | 0.19 | LUMO (92%) |
| T4CH3 | 359.89 | 3.45 | 0.89 | LUMO (98%) |
| T6CH3 | 412.62 | 3.01 | 1.43 | LUMO (99%) |
| T2Br | 299.38 | 4.15 | 0.25 | LUMO (97%) |
| T4Br | 430.14 | 2.89 | 1.08 | LUMO (100%) |
| T6Br | 506.14 | 2.45 | 1.82 | LUMO (100%) |
| T2COOH | 318.32 | 3.90 | 0.20 | LUMO (97%) |
| T4COOH | 332.57 | 3.73 | 0.73 | LUMO (98%) |
| T6COOH | 356.47 | 3.48 | 0.53 | LUMO (92%) |
| 340.81 | 3.64 | 1.04 | H-1 L+1 (92%) |
Table 6.
Wavelengths of highest peaks of emission spectra of derivatives of T2, T4, and T6.
| Emission | Wavelength (nm) | E (eV) | Osc. Strength (f) |
|---|---|---|---|
| T2OCH3 | 360.14 | 3.45 | 0.45 |
| T4OCH3 | 515.14 | 2.41 | 1.24 |
| T6OCH3 | 610.54 | 2.03 | 2.12 |
| T2OCOCH3 | 345.62 | 3.59 | 0.40 |
| T4OCOCH3 | 479.98 | 2.59 | 1.19 |
| T6OCOCH3 | 534.13 | 2.32 | 1.62 |
| T2CH3 | 354.57 | 3.50 | 0.37 |
| T4CH3 | 458.45 | 2.71 | 1.15 |
| T6CH3 | 494.82 | 2.51 | 1.74 |
| T2Br | 380.28 | 3.26 | 0.29 |
| T4Br | 469.51 | 2.64 | 1.09 |
| T6Br | 506.59 | 2.45 | 1.63 |
| T2COOH | 415.87 | 2.98 | 0.27 |
| T4COOH | 490.56 | 2.53 | 0.63 |
| T6COOH | 506.80 | 2.45 | 1.25 |
Publisher’s Note: MDPI stays neutral with regard to jurisdictional claims in published maps and institutional affiliations. |
© 2021 by the authors. Licensee MDPI, Basel, Switzerland. This article is an open access article distributed under the terms and conditions of the Creative Commons Attribution (CC BY) license (https://creativecommons.org/licenses/by/4.0/).
Share and Cite
MDPI and ACS Style
Tsai, H.-W.; Hsueh, K.-L.; Chen, M.-H.; Hong, C.-W. Electronic and Optical Properties of Polythiophene Molecules and Derivatives. Crystals 2021, 11, 1292. https://0-doi-org.brum.beds.ac.uk/10.3390/cryst11111292
AMA Style
Tsai H-W, Hsueh K-L, Chen M-H, Hong C-W. Electronic and Optical Properties of Polythiophene Molecules and Derivatives. Crystals. 2021; 11(11):1292. https://0-doi-org.brum.beds.ac.uk/10.3390/cryst11111292
Chicago/Turabian StyleTsai, Huai-Wen, Kan-Lin Hsueh, Mei-Hsin Chen, and Che-Wun Hong. 2021. "Electronic and Optical Properties of Polythiophene Molecules and Derivatives" Crystals 11, no. 11: 1292. https://0-doi-org.brum.beds.ac.uk/10.3390/cryst11111292
Note that from the first issue of 2016, this journal uses article numbers instead of page numbers. See further details here.