Article

Effect of Different NaOH Solution Concentrations on Mechanical Properties and Microstructure of Alkali-Activated Blast Furnace Ferronickel Slag

1
China Construction First Group Construction and Development Co., Ltd., Beijing 100102, China
2
Department of Civil Engineering, Tsinghua University, Beijing 100084, China
*
Author to whom correspondence should be addressed.
Submission received: 15 September 2021 / Revised: 12 October 2021 / Accepted: 23 October 2021 / Published: 26 October 2021
(This article belongs to the Special Issue Advances in Sustainable Concrete System)

Abstract

:
Blast furnace ferronickel slag (BFFS) is a kind of industrial solid waste that has not been effectively utilized in construction industry. The effects of different NaOH concentrations on the mechanical properties and microstructure of alkali-activated blast furnace ferronickel slag were investigated in this study. The results show that an optimal concentration for compressive strength is found, both higher and lower concentrations cause strength degradation. The pore structure, phase composition and hydration heat revealed that less C-A-S-H gel is produced at low concentration and result in the low compressive strength The phase composition and hydration heat revealed that more hydrotalcite is produced than C-A-S-H at high concentration due to more violent reaction at the early age hinders the growth of C-A-S-H in the later stage. FT-IR also shows that high concentration decreased the Al/Si ratio and polymerization of C-A-S-H which also leads to the low strength at high concentration.

1. Introduction

Ferronickel slag is a byproduct of ferronickel alloy production. Approximately 0.64 million tons of nickel–iron alloys are produced globally each year [1]. China accounts for 48% of all ferronickel alloy production. According to different ferronickel alloy production methods, ferronickel slag can be classified as electric furnace ferronickel slag (EEFS) or blast furnace ferronickel slag (BFFS). The electric furnace method is the main method for producing ferronickel alloys and is used worldwide [2]. With the lack of nickel-rich minerals and the demand for ferronickel alloys in China, the blast furnace method is still the main production method [3]. The chemical and mineral composition of BFFS and EFFS are different with different production methods. EFFS is mainly composed of SiO2, Fe2O3 and MgO; BFFS is mainly composed of CaO, Al2O3 and SiO2. The main minerals in EFFS are crystalline substances such as forsterite and diopside; BFFS is mainly composed of an amorphous phase [4]. The resource utilization of EFFS has been extensively studied by many researchers. EFFS can be used as a supplementary cementitious material [5,6,7,8], as an aggregate [9,10,11] in concrete, and as a precursor in geopolymer synthesis [12,13]. Compared with EFFS, there are relatively few studies on BFFS.
Alkali-activated materials have recently become popular as green building materials in cement. Alkali-activated materials use solid waste as a precursor in the preparation of cementitious paste, effectively transforming solid waste into a construction resource. Researchers have studied different industrial solid wastes including blast furnace slag [14,15,16], red mud [17,18,19], ground coal bottom ash [20], silico-manganese (Si–Mn) slag [21], electrolytic manganese residue [22], Cu–Ni slag [23] and lead slag [24]. Alkali-activated materials have greater strength and durability than Portland cement [25]. However, alkali-activated materials also have workability problems such as large shrinkage and a fast setting time [26].
Using BFFS as a precursor to produce alkali-activated materials is a potential way to utilize BBFS. The amorphous aluminosilicate phase in solid waste is the active source of the precursor to produce alkali-activated material [27]. The calcium content in the amorphous phase has a great impact on the solid waste activity; the presence of calcium lowers the polymerization degree of the aluminosilicate framework in the amorphous phase and increase the activity for alkali-activated reaction. The most commonly used precursors are blast furnace slag (BFS), which has a high calcium content. BFFS is mainly composed of CaO, SiO2, Al2O3 and MgO, which has a chemical composition similar to BFS. However, BFFS has a higher CaO content and a lower Al2O3 content than BFS. Thus, BFFS can be classified as a medium-calcium slag for alkali-activated materials and has potential activity for alkali-activation. Few investigations were conducted on BFFS due to most BFFS is adopted only in some parts of China [28]. Wang [28] compared the reaction mechanism and mechanical properties of the alkali-activated BFFS and alkali-activated BFS. The early compressive strength of alkali-activated BFFS is lower than that of alkali-activated BFS, while the strength development of alkali-activated BFFS is better.
This study investigates the effect of NaOH concentration on the mechanical properties and microstructure of alkali-activated BFFS. The mechanical property is measured by the compressive strength. The pore structure is tested to understand the trend of strength on the microstructure scale. The phase composition and hydration heat are used to analyze the effect of reaction product on the pore structure. The polymerization degree and chemical bonding of C-A-S-H is tested by FT-IR.

2. Raw Materials and Test Methods

2.1. Raw Materials

BFFS was used as the precursor of the alkali-activated material. The specific surface area of the FFS was 439 m2/kg. The chemical composition of the FFS was determined by X-ray fluorescence (XRF), as shown in Table 1. FFS consists mainly of CaO, SiO2, Al2O3 and MgO.
The X-ray diffraction (XRD) patterns of the FFS are shown in Figure 1. The slag consists mainly of amorphous phases, indicated by the broad peaks from 17° to 37° in the XRD patterns. The main crystalline phases in BFFS are calcite (CaCO3), spinel (MgO·Al2O3) and gypsum (CaSO4·2H2O). It is widely accepted that the reactive CaO, SiO2 and Al2O3 contents in amorphous phases determine the precursor reactivity. The CaO content in BFFS is lower, and the Al2O3 content is higher than that of BFS. The MgO content in BFFS is mainly in the form of spinel, which is stable and does not easily react.
The alkali hydroxide solutions of five NaOH concentrations (2 M, 5 M, 8 M, 10 M, 12 M) were prepared by dissolving sodium hydroxide pellets (99.9% purity) in water. The water-to-slag ratio was 0.5 for the mortar used in this study. Hydroxide was added to the water to obtain the required concentration. The slag-to-sand ratio for the mortar was 1:3. The paste and mortar specimens were cured in standard curing conditions of 20 ± 2 °C and 95% RH.

2.2. Test Method

2.2.1. Compressive Strength

Mortar samples were prepared to test the compressive strength by mixing the raw materials with a planet mixer. The pastes were mixed for 30 s at low speed after the solution was added. The sands were added for another 4 min. The fresh mortar was cast in 40 mm × 40 mm × 160 mm molds and cured in standard curing conditions of 20 ± 2 °C and 95% RH until testing. The specimens were tested at 1 d, 3 d, 7 d and 28 d.

2.2.2. Isothermal Calorimetry

The hydration heat of alkali-activated BBFS with a water/binder ratio of 0.5 was measured by isothermal conduction calorimetry (TA instrument, TAM Air) at 25 °C. Two slags were weighed and placed in plastic bowls. The bowls were set in the calorimeter until thermal balance was reached. After 10 h of thermal equilibration, the activator was mixed with the precursors for 3 min. The heat evolution was recorded. Compared with the reaction heat, the heat disturbance caused by mixing can be neglected.

2.2.3. X-ray Diffraction (XRD)

The alkali-activated pastes were mixed with a planet mixer for 2 min. The water-to-slag ratio for all paste in this study is 0.5 after mixing, the suspensions were cast into 50-mL sealed centrifuge tubes and cured at 25 °C. After a specified duration, hydration of the sample was terminated using the isopropanol replacement method. The detailed method is described in previous studies [29,30]. The sample powder was ground to <100 μm for XRD. XRD analysis was performed with a Bruker D8 advance using CuKα radiation (scanning range from 5° to 65° for 40 min).

2.2.4. Mercury Intrusion Porosimeter

A mercury intrusion porosimeter (MIP) was used to characterize the pore structure of the paste specimens. The paste was obtained from the same sample analyzed by XRD. The surface tension and contact angle were 135° and 0.485 N/m, respectively. The paste samples for the MIP were cut into small cubes with a maximum size of 0.5 mm.

2.2.5. ATR–FTIR Spectroscopy

Attenuated total internal reflectance Fourier transform infrared spectroscopy (ATR–FTIR) was used to determine the chemical microstructure of the paste. The measurements were performed in the mid-infrared spectral region of 550–4000 cm−1 with a spectral resolution of 2 cm−1 using a BRUKER Tensor 27 spectrometer equipped with a diamond crystal as the ATR element (PIKE Miracle™). The paste was obtained from the sample analyzed by XRD. Same powder sample analyzed by XRD was used for ATR-FTIR.

3. Results and Discussion

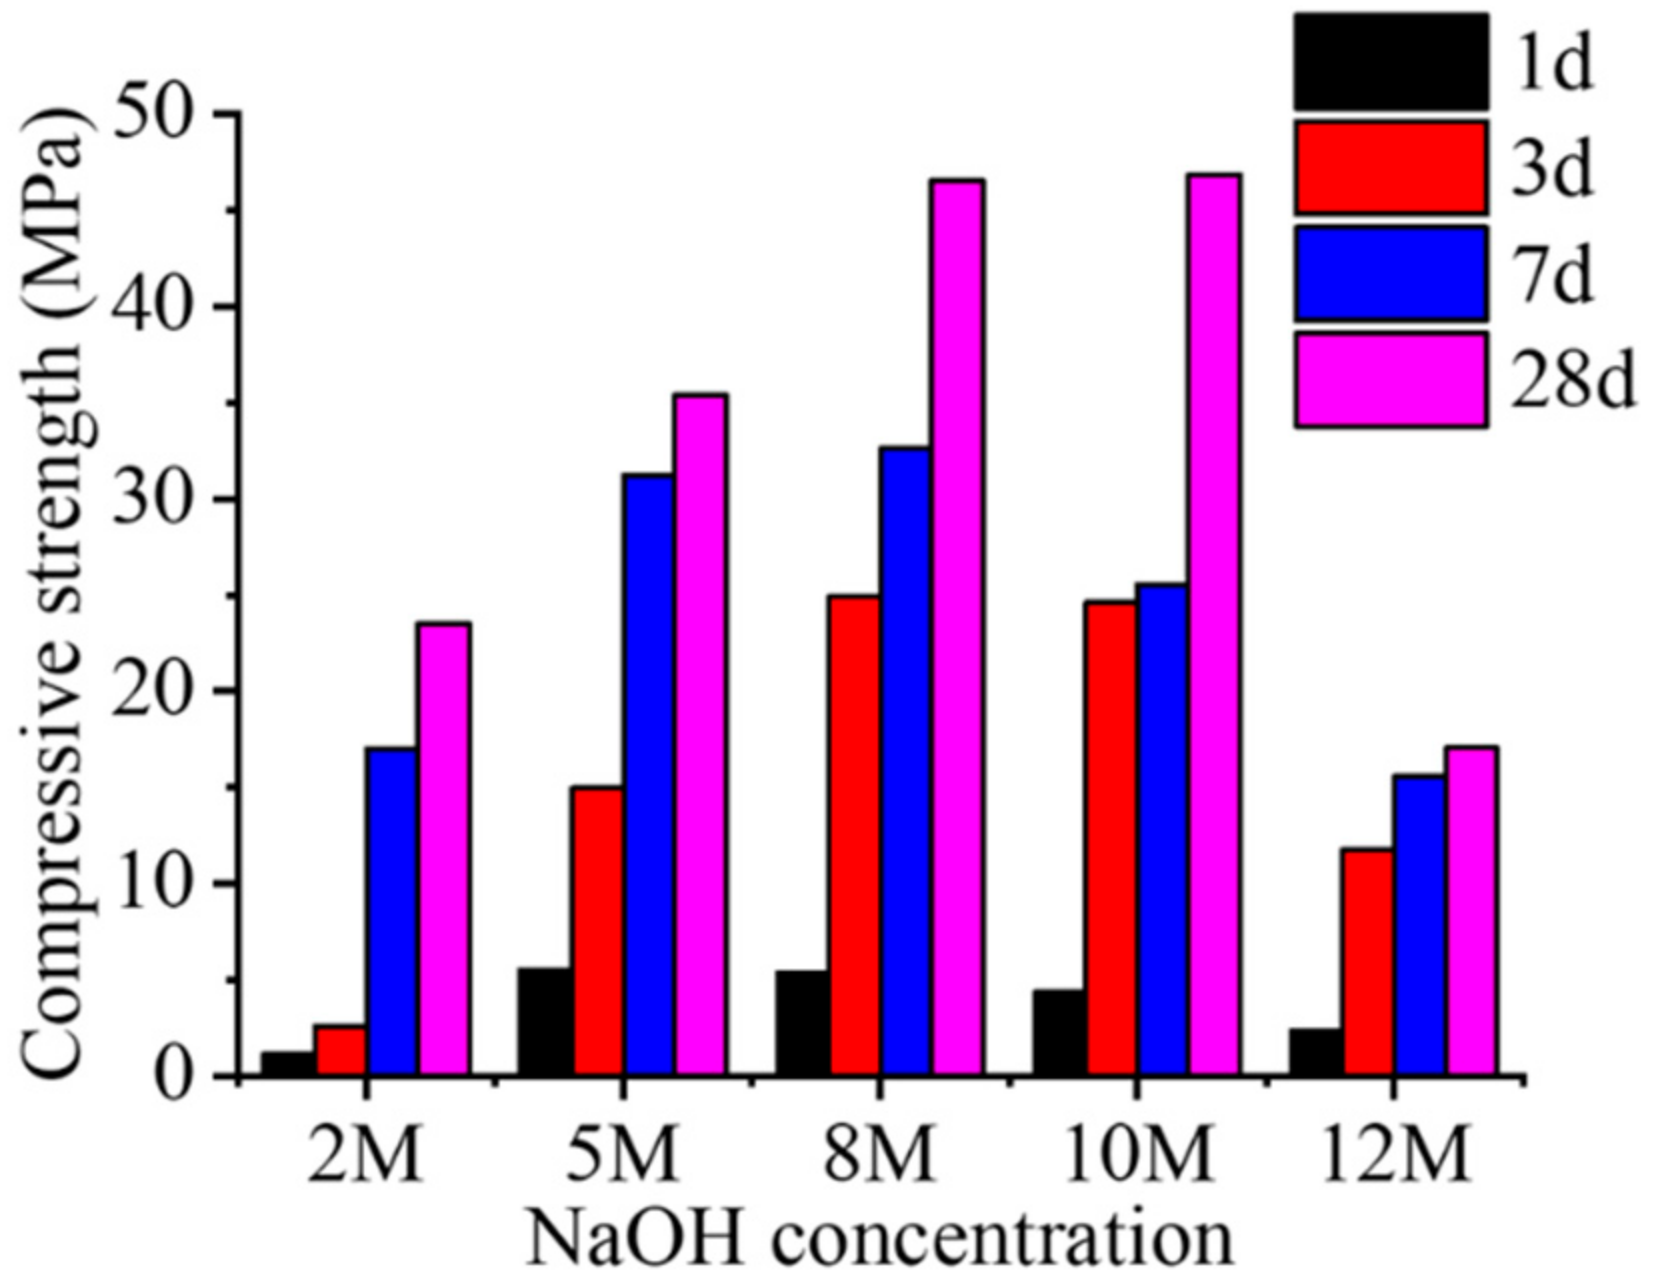
3.1. Compressive Strength Development

The compressive strength results are presented in Figure 2. NaOH-activated BFFS demonstrated a good activating effect. The lowest 28-d compressive strength was observed for 12 M activated BFFS. The highest compressive strength was observed for 8 M activated BFFS. As the concentration increased, the strength of the mortar first increased and then decreased, indicating that when the concentration of the activator is too high, the mechanical properties of the alkali-activated BFFS are decreased. This is consistent with the results of previous research [31,32]. A high concentration of NaOH increases the alkalinity of the activator and the pore solution, which is critical for BFFS dissolution. However, a higher pH in the pore solution also promotes the formation of crystal products in the paste such as portlandite and hydrotalcite, which decrease the strength. According to Bondar [33] higher concentration of NaOH results in a higher viscosity of the solution. The pastes require more time for excess water to evaporate; this is the key step in the development of a network of aluminosilicates in which strength is developed.

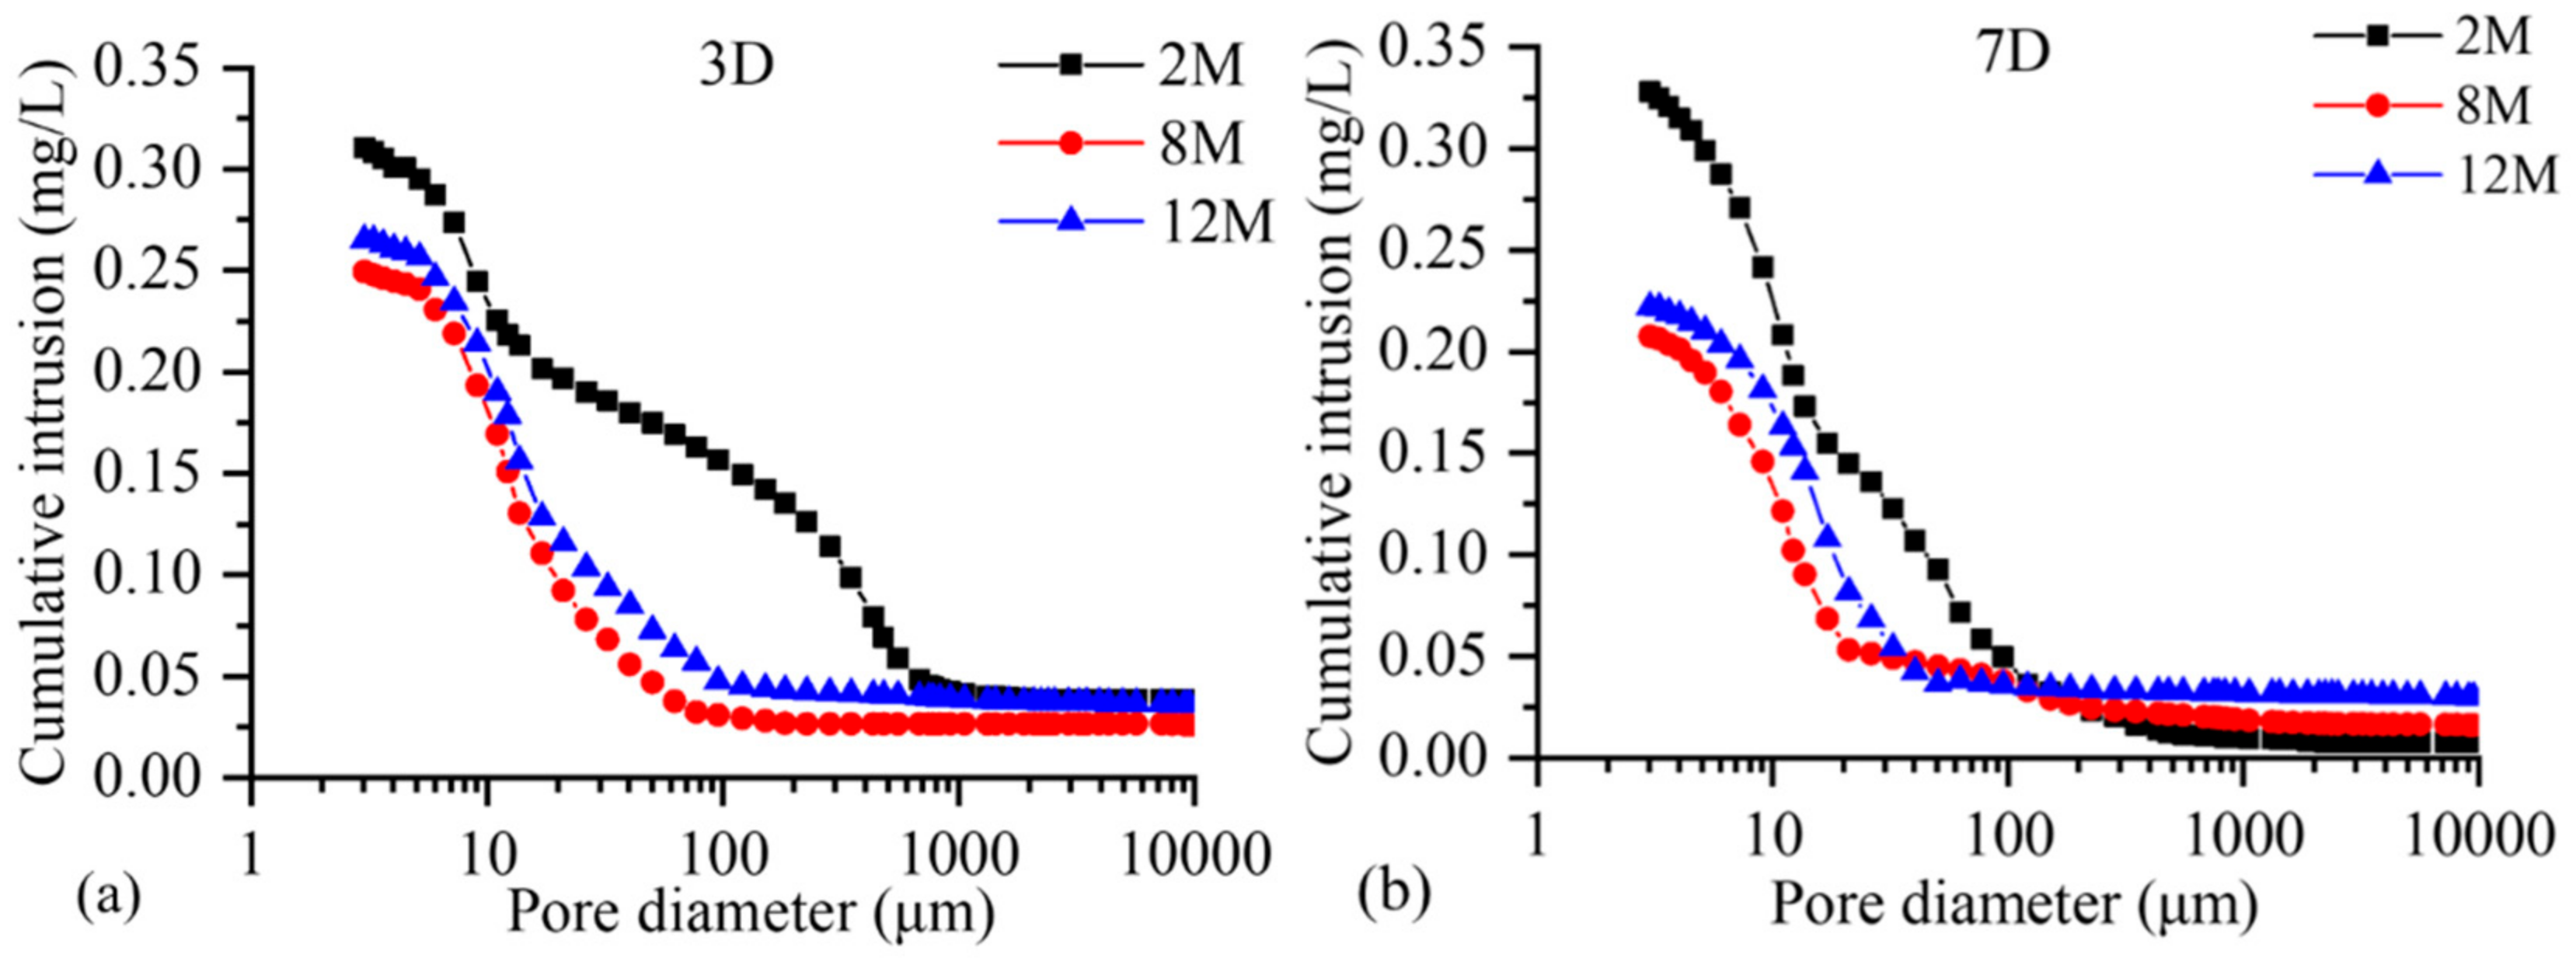
3.2. Pore Structure of Hardened Pastes

Pore structure is analyzed by MIP in order to understand the trend of compressive strength on the microstructure scale. Figure 3 shows the cumulative pore volumes of the alkali-activated BFFS at 3 d and 7 d. The pore structure results are consistent with the compressive strength. The 2 M activated paste had the weakest pore structure of all concentration groups. Figure 3a shows that the 2 M activated sample has many pores from 100 to 1000 nm in size, which are considered to be harmful in porous materials [34], and are mainly due to the relatively low concentration of 2 M NaOH, which slows down the early dissolution of the BFFS and reduces the production of C-A-S-H gel. The pore structure is fragile, and the compressive strength is low. The 12 M activated paste has a pore structure similar to that of the 8 M activated paste but does not match the compressive strength. Figure 3a shows that the pore structure curves are similar for 8 M and 12 M; the total pore volume for 8 M (0.249 mg/L) is slightly smaller than that for 12 M (0.265 mg/L). However, the compressive strength of the 8 M paste (24.9 MPa) is more than twice that of the 12 M paste (11.9 MPa) at 3 d. According to the section below, more crystal phases are formed at high pore concentrations. The possible reason for the optimal concentration is that although the 12 M NaOH has a pH that can dissolve the BFFS and form sufficient C-A-S-H, formation of a large amount of crystal phase diminishes the strength of AA-BFFS.
Figure 3b shows the pore structure of AA-BFFS at 7 d, which is the same as at 3 d. Compared to the result at 3 d, the 2 M paste contains fewer pores from 100 to 1000 nm in size. The compressive strength of the 2 M paste at 7 d (17 MPa) is much greater than at 3 d (2.6 MPa), indicating that the pores between 100 and 1000 nm have a great influence on the strength of alkali-activated BFFS. The pore structures of 8 M and 12 M activated BFFS at 7 d are also improved. There are pores from 10 to 100 nm in size in the 7-d pore structure. The compressive strength of the 8 M (32.6 MPa) and 12 M (15.55 MPa) pastes at 7 d is greater than at 3 d (24.9 MPa and 11.8 MPa, respectively). The strength development of the 2 M paste is much greater than that of the 8 M and 12 M pastes, which indicates that the pores from 100 to 1000 nm have a greater impact on the compressive strength than the pores from 10 to 100 nm in AA-BFFS.

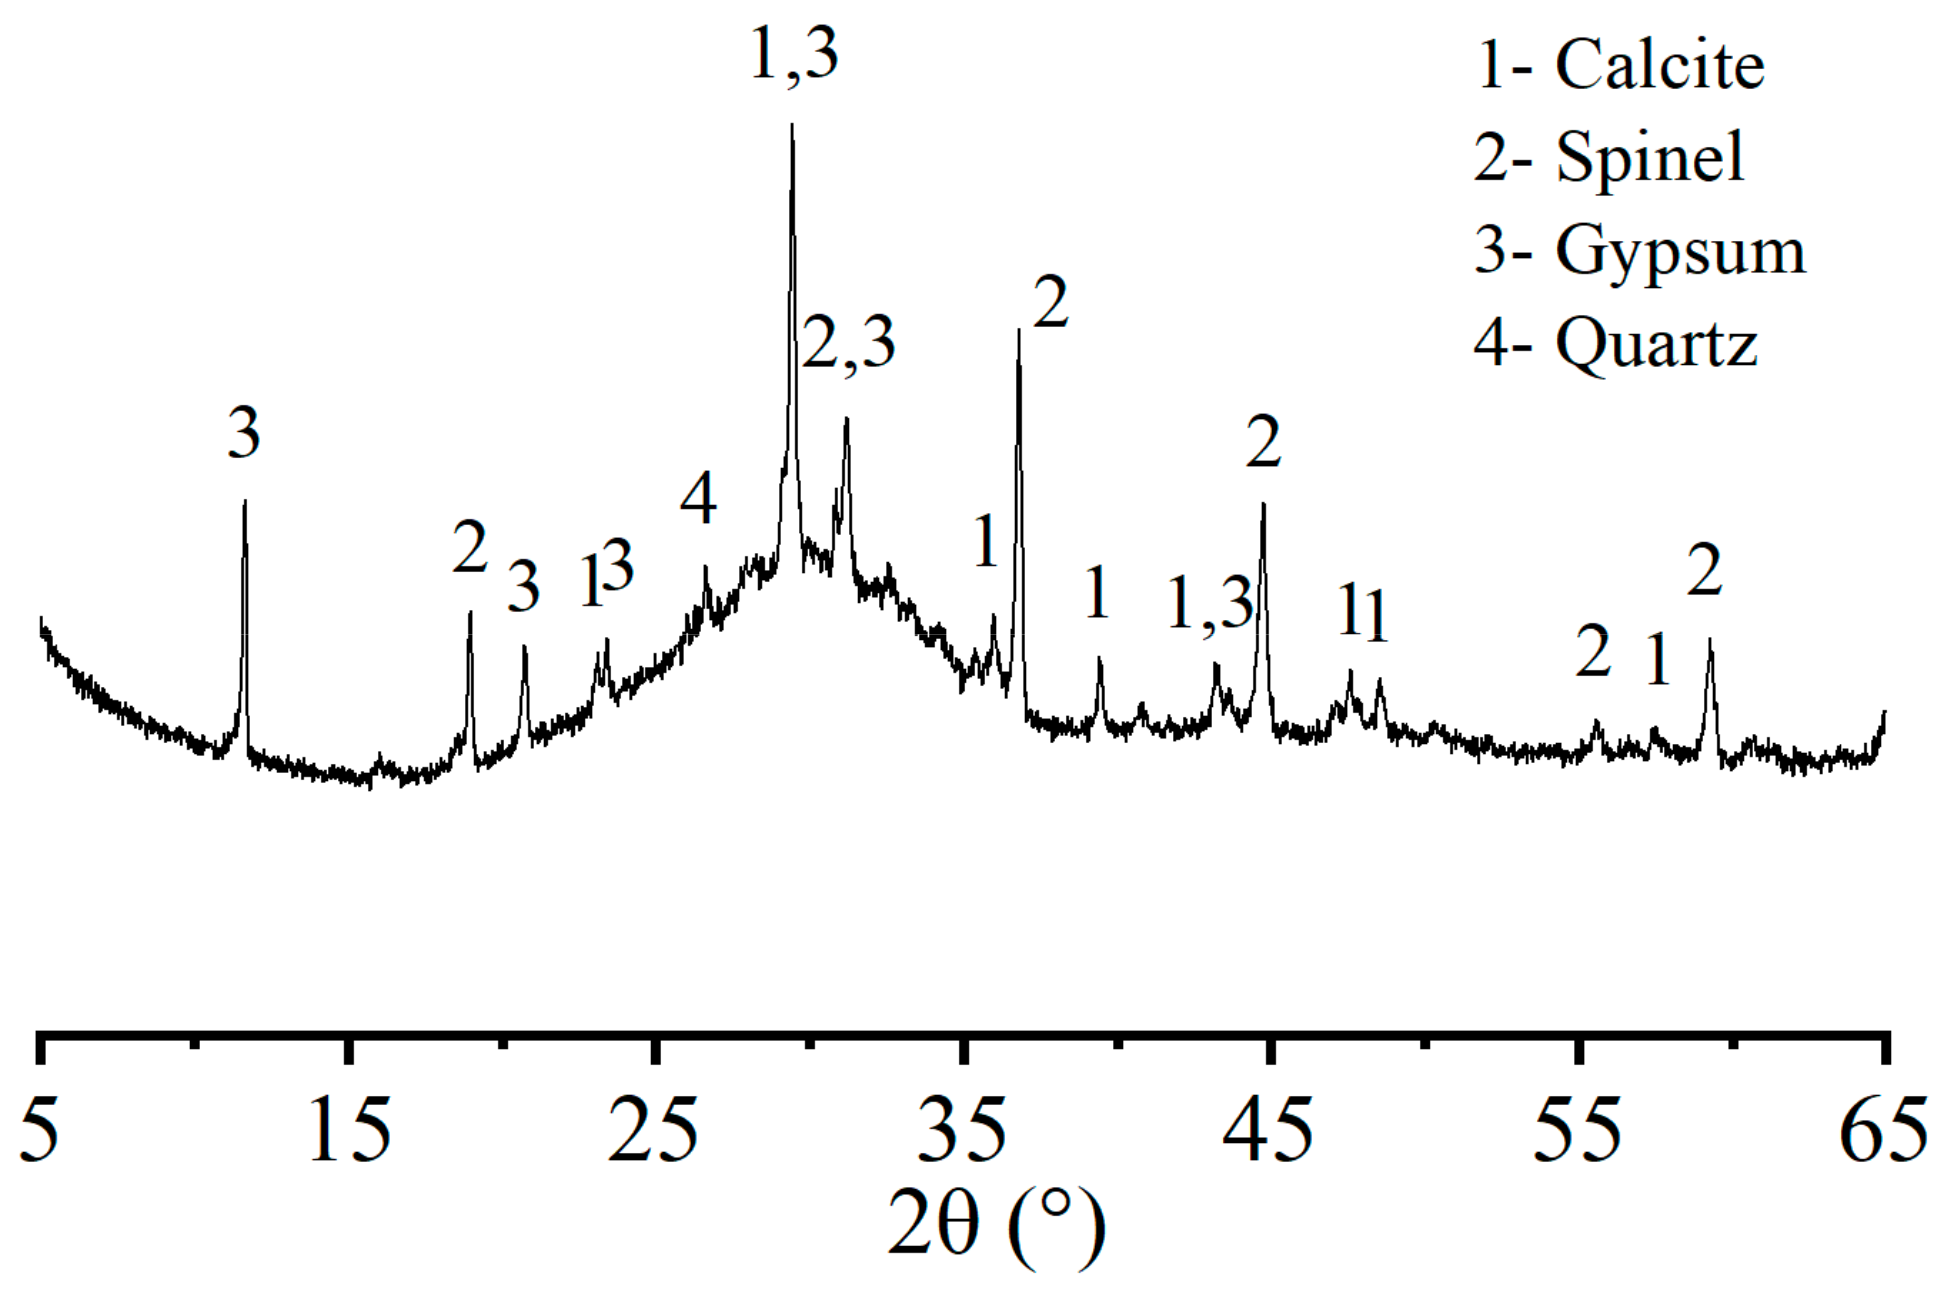
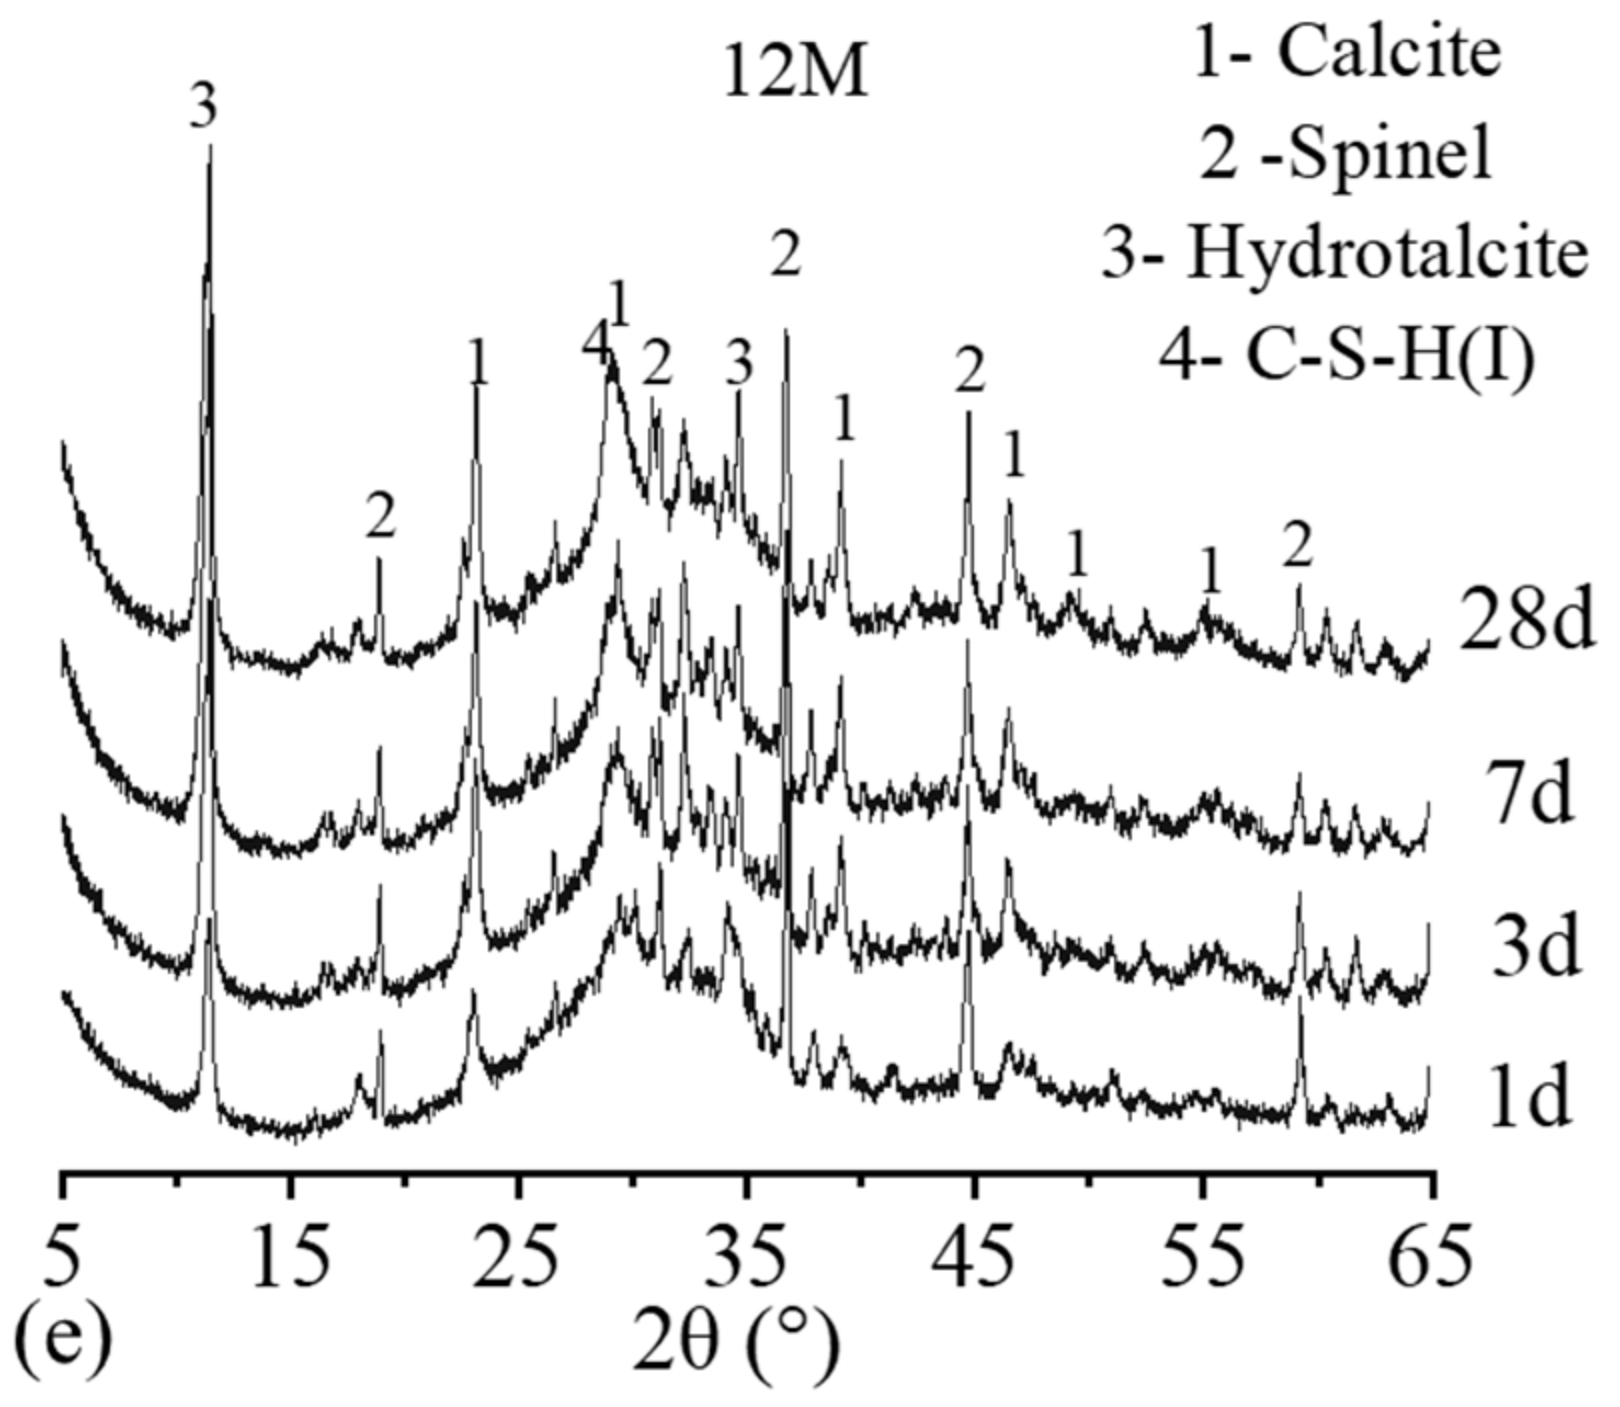
3.3. Phase Compositions of Hardened Pastes

XRD was used to analyzed the phase composition in order to understand the effect of reaction production on the pore structure. Figure 4 shows the XRD spectra of the hardened pastes hydrated for 1 d, 3 d, 7 d and 28 d. The main crystal product of AA-BFFS is hydrotalcite (PDF#89-0460), which is the same as that of alkali-activated BFS [35,36]. The XRD patterns show that as the reaction progresses, calcite (CaCO3) and gypsum (CaSO4·2H2O) are gradually dissolved and consumed; spinel (MgO·Al2O3) did not participate in the reaction because it has a stable crystal structure, as reported in a previous study [36]. The main amorphous phase is C-A-S-H gel, which corresponds to the C-S-H(I) peaks in Figure 4 [36].
Comparing the XRD patterns of slag activated by different concentrations of sodium hydroxide, it was found that as the concentration increases, more crystals are formed in the product [37]. As spinel is stable in the pore solution of alkali-activated material, it can be used as an internal standard material for semiquantitative analysis. For 2 M activated BFFS, the rate of product generation was slow. Hydrotalcite was not observed in the XRD spectrum until 3 d (Figure 3a). The calcite in the 2 M XRD patterns was not consumed at 28 d, indicating that the low concentration of 2 M NaOH does not have sufficient alkalinity to dissolve BFFS and provide sufficient ions for crystal growth. Compared with paste activated by higher concentrations of NaOH, few C-S-H(I) peaks were observed in the XRD patterns. This can also be explained by the low concentration of NaOH. With an increase in age, the peak of hydrotalcite in the 2 M pattern did not change significantly, indicating that further reaction in the 2 M paste is minimal. The phase composition development of the 2 M paste explains the poor pore structure, and the low strength development of the 2 M mortar.
When a higher concentration of NaOH (>2 M) was used to activate the BFFS, the hydrotalcite peak was clearly observed at 1 d. At the same age, the peaks of crystalline products and C-S-H(I) were higher with an increase in concentration, indicating that high alkalinity can promote product formation. High alkalinity accelerates the dissolution of BFFS, increasing the ion concentration in the solution [38,39] and promoting crystallization and growth of the products. Unlike the 2 M paste, the reaction continued to 28 d, as the peaks of hydrotalcite and C-S-H(I) are sharper than the peak of spinel (Figure 4b–e). This explains the strength and pore structure development. Comparing Figure 4c and Figure 4e, it is observed that the peaks of C-S-H(I) are similar in intensity according to the spinel peaks. The hydrotalcite peak of the 12 M paste (Figure 4c) is more intense than that of the 8 M paste (Figure 4e), indicating that with an increase in the NaOH concentration, more hydrotalcite was formed than C-A-S-H gel. C-A-S-H is the main product providing strength to alkali-activated material. The formation of hydrotalcite consumes more calcium and aluminum in the solution, reducing the Ca and Al content in the C-A-S-H gel, resulting in a low-degree C-A-S-H gel. Hydrotalcite and portlandite are preferred to enrich the particles and fine aggregates, forming an interfacial transition zone (ITZ) and reducing the compressive strength. As a high concentration of NaOH promotes generation of hydrotalcite and other crystals, the compressive strength of high-concentration NaOH is lower.

3.4. Isothermal Calorimetry

Isothermal calorimetry was measured to analyze the reaction mechanism and production of the reaction products. Figure 5 shows the isothermal calorimetry results for the alkali-activated pastes within 96 h. Isothermal calorimetry was performed to evaluate the effect of concentration on the kinetics of alkali-activated BFFS. The heat evolution curves of the alkali-activated BFFS are shown in Figure 5a. The evolution peak occurred in the early stage of the reaction (within 4 h). With an increase in the concentration, the evolution peak became more intense. The first exothermic peak of alkali-activated materials can be interpreted as the heat of wetting and the heat of dissolution according to [40]. The results show that a higher pH of the solution increases the dissolution of BFFS. This is consistent with the XRD results. A fast and intense evolution indicates fast dissolution of the BFFS, which provides sufficient ions in the concentration for crystallization. The 2 M paste shows a low heat evolution in poor formation of product and pore structure. The 5 M curves in Figure 5a show a broad shoulder peak from 3–4 h. This curve is widely accepted as an acceleration peak. The shape of this curve is similar to that for Portland cement, although the temporal occurrences are different [41].
Figure 5b shows the cumulative heat of the AA-BFFS. The total heat of the 2 M paste is significantly less than that of the others, indicating that the low pH of the 2 M NaOH reduces the reaction rate and the product formation of the paste (mainly C-A-S-H gel). This is direct evidence to explain the low strength and poor pore structure of the 2 M paste. However, for high-concentration pastes, the total heat within 72 h is similar, which is consistent with the XRD results. The cumulative heat and heat evolution indicate that the violent reaction at the early age hinders the later C-A-S-H production.

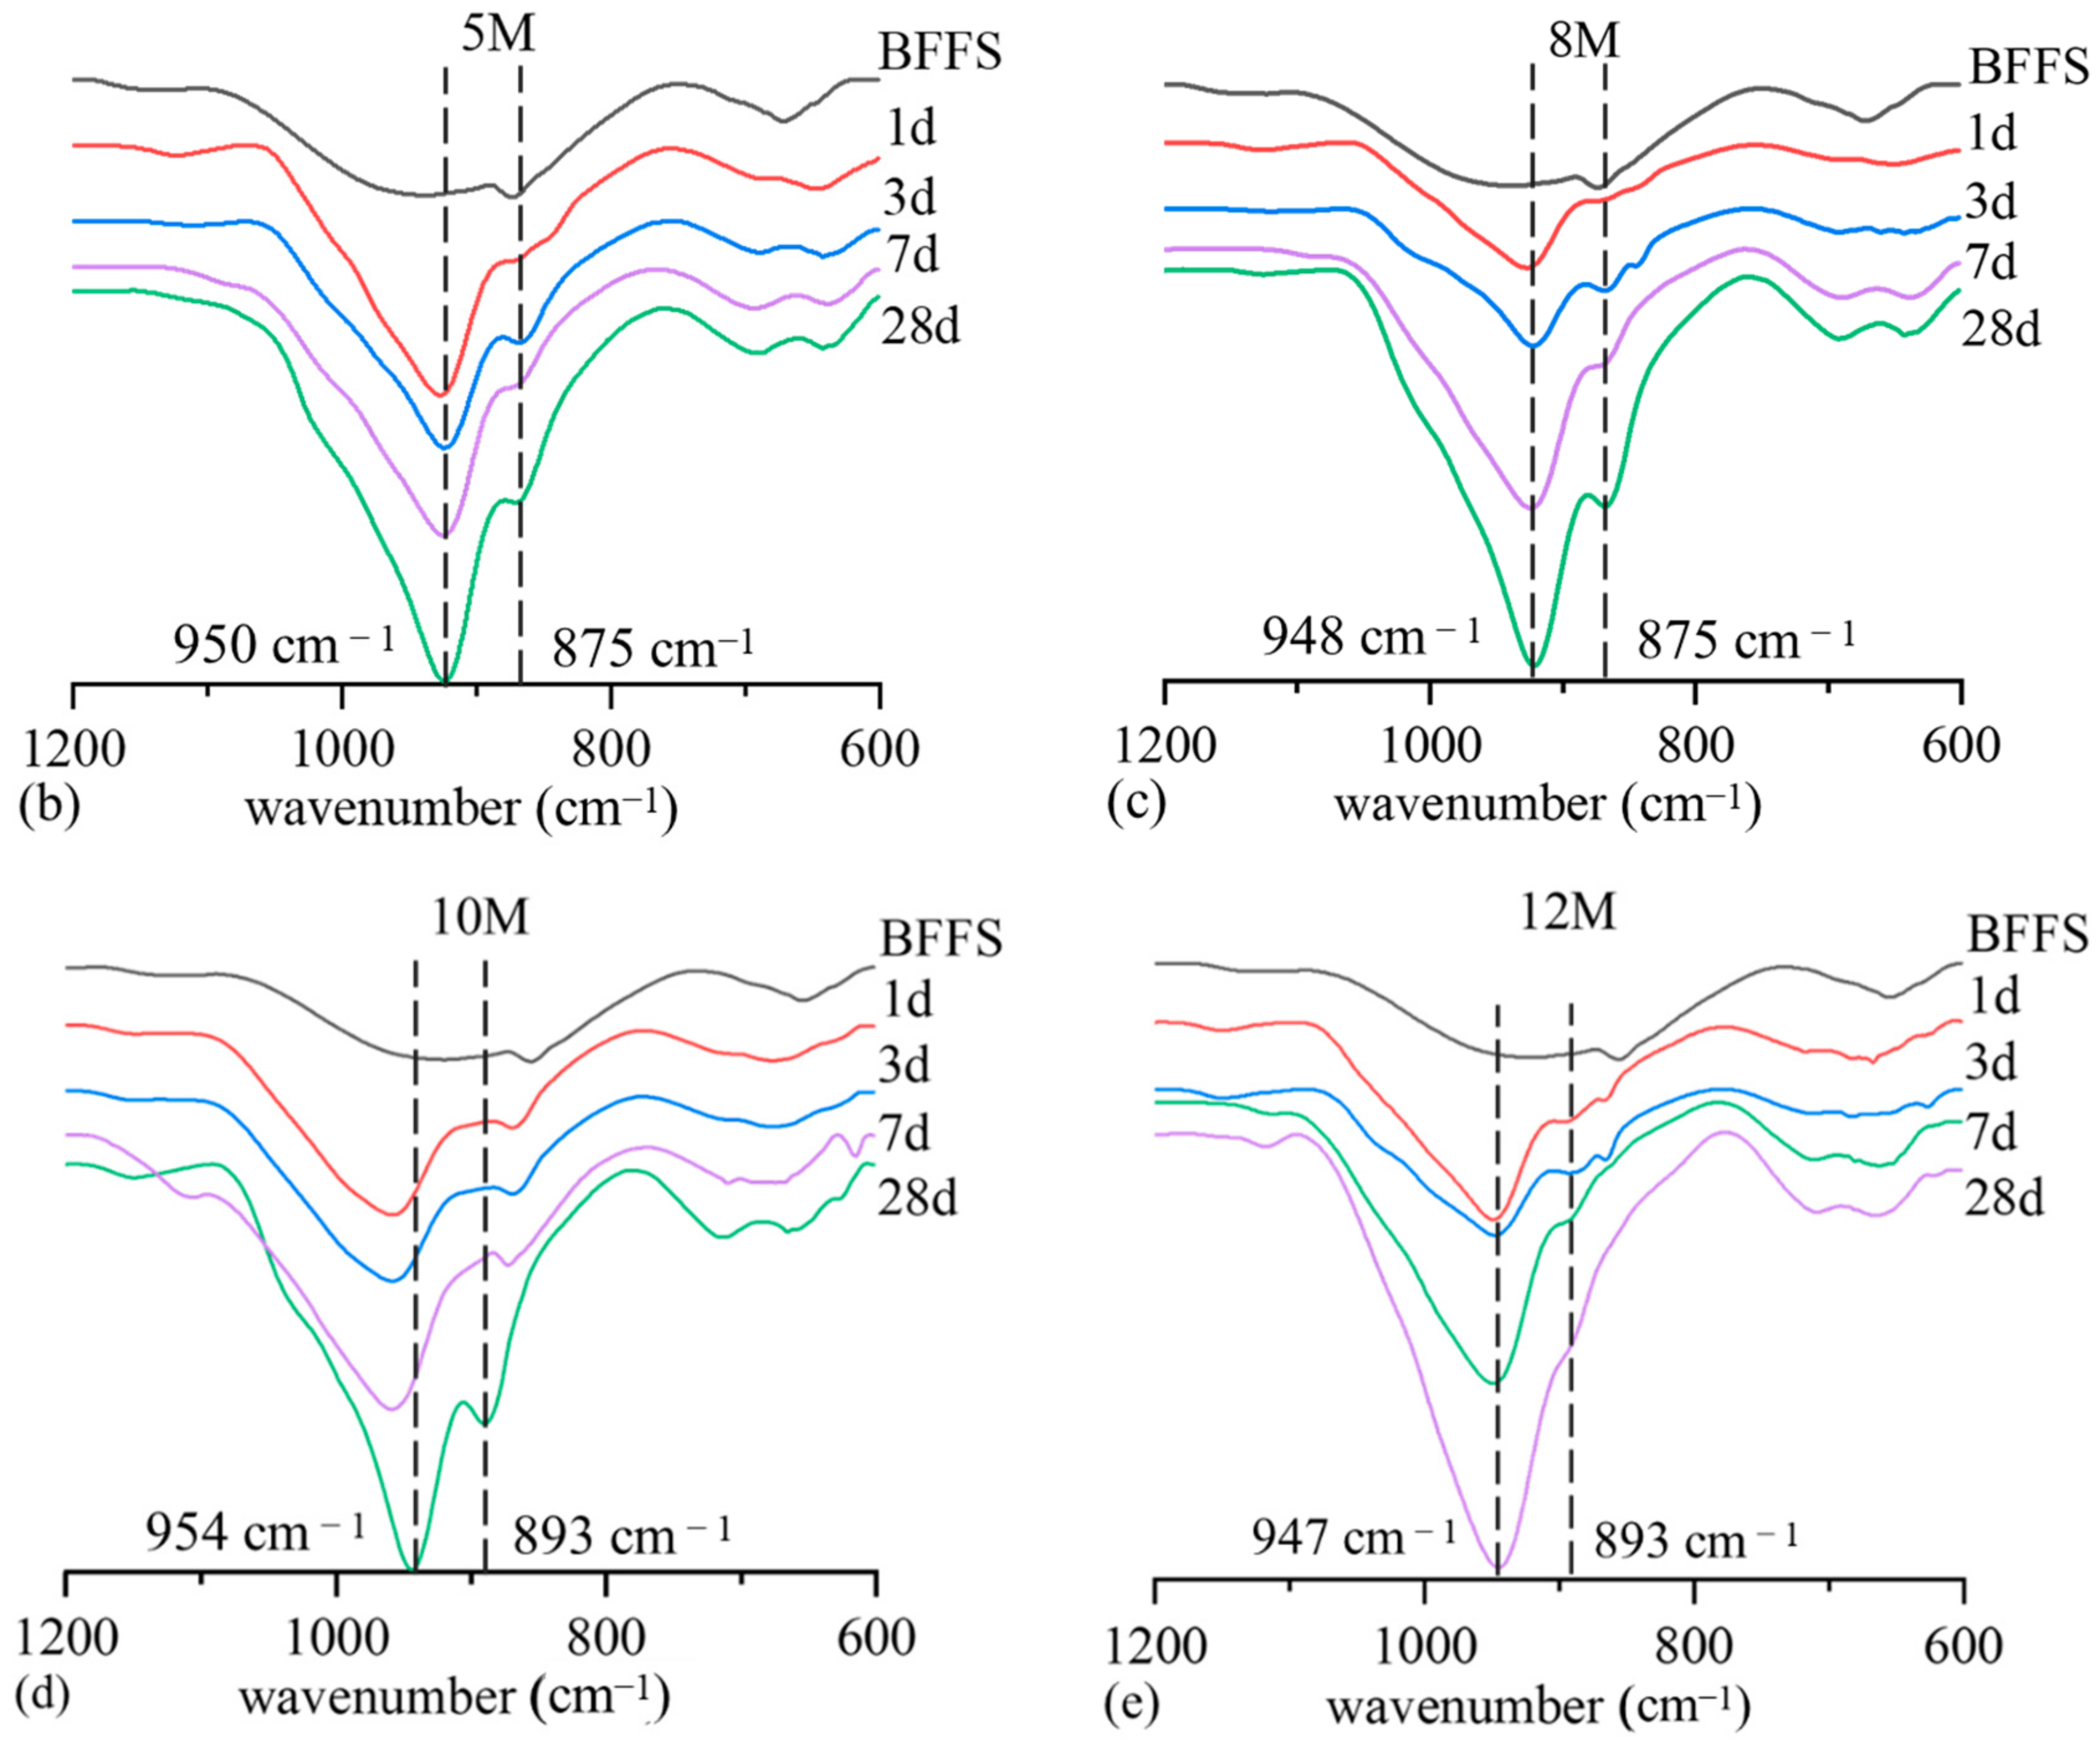
3.5. FT-IR Spectra of Hardened Pastes

The chemical bonding and the polymerization degree of C-A-S-H was analyzed by FT-IR. Figure 6 shows the FT-IR spectra of hardened pastes hydrated for 1 d, 3 d, 7 d and 28 d. Three obvious peaks are observed. The most important peak is at approximately 950–1000 cm−1, corresponding to the Si–O asymmetric stretching vibrations (ν3) of Q2 units [41,42,43]. The peak at 870–875 cm−1 is related to the asymmetric stretching (ν3) and out-of-plane bending (ν2) modes of C O 3 2 ions [41,44]. The weak peak at 650–700 cm−1 corresponds to the Al–O–Si bonds [43].
The band at 875 cm−1 corresponds to calcite in the precursor. The shifting of this band can be interpreted as the dissolution of calcite and the formation of other unknown carbonates. Figure 5a shows that the C O 3 2 bond of the 2 M paste remains at 28 d, indicating that calcite did not react in the 2 M paste. This is consistent with the results in Figure 4a. For the 5 M and 8 M concentrations, the C O 3 2 bond broadens and becomes weaker, indicating that calcite dissolved. For the last two concentrations, the C O 3 2 bond is weaker, disappears or shifts to other wavenumbers, indicating that calcite dissolved and transformed into other carbonates. The results indicate that higher concentrations promote crystal dissolution and new crystal formation, which is consistent with the XRD results.
The bands at 950–1000 cm−1 are different for different concentrations. At 28 d, with an increase in the concentration, the band at 950–1000 cm−1 first shifted toward a lower wavenumber and then back to a higher wavenumber. The lowest wavenumber was observed in 8 M activated BFFS (948 cm−1, Figure 6c), and is consistent with the compressive strength. The shifting of the band from 950–1000 cm−1 is caused by different Si/Al ratios in the Si-O-T (Si, Al) [45]. A higher wavenumber corresponds to an “Si-rich” bond with a lower degree. A lower wavenumber corresponds to an “Al-rich” bond with a higher polymerization degree [35]. Thus, the wavenumber trend from low concentration to high concentration can be interpreted as the Al/Si ratio and polymerization degree of C-A-S-H gel first increasing and then decreasing when the concentration is greater than 8 M. This means the optimal concentration result in the higher polymerization degree of C-A-S-H gel. This explains the compressive strength and pore structure, which are consistent with the XRD patterns.

4. Conclusions

In this study, the properties of alkali-activated BBFS were investigated at different concentrations of NaOH (2 M, 5 M, 8 M, 10 M, 12 M). Based on the results, the following conclusions can be drawn.
  • Optimal concentration on the compressive strength of mortars is found; 8 M NaOH shows the best performance. Both lower concentrations and higher concentrations cause strength degradation.
  • The pore structure characterized by MIP indicates that at the low concentration (2M) more pore between 10 and 1000 nm is existed. This demonstrates the low compressive strength of 2M. The pore structure of 8M and 12M is similar which means the pore structure cannot explain the strength degradation at high concentration.
  • The phase composition characterized by XRD reveals that less C-A-S-H gel is generated at low concentration and result in the poor pore structure. The low alkalinity of the 2M NaOH leads to lower reaction rate at the early age according to isothermal calorimetry result. Eventually, the amount of less C-A-S-H gel is generated.
  • An increase in the concentration promotes the generation of C-A-S-H and hydrotalcite. According to XRD result, when the concentration is greater than 8 M, more hydrotalcite is formed compared to C-A-S-H. Isothermal calorimetry indicates that, the violent reaction at the early age hinders the later formation of the C-A-S-H. This causes the compressive strength degradation at high concentration.
FT-IR result indicates that the polymerization degree of C-A-S-H gel is consistent with the compressive strength, the optimal concentration of 8M shows the highest polymerization degree. The result indicates both low and high concentration reduce the polymerization degree of C-A-S-H which also do harm to the compressive strength.

Author Contributions

Z.H.: Conceptualization, Data curation, Formal analysis, Investigation, Methodology, Writing—original draft. Y.Z.: Investigation, Methodology. Y.C.: Conceptualization, Formal analysis, Funding acquisition, Supervision, Validation, Writing—review & editing. All authors have read and agreed to the published version of the manuscript.

Funding

This research was funded by [National Natural Science Foundation of China] grant number [No. 51822807].

Institutional Review Board Statement

Not applicable.

Informed Consent Statement

Informed consent was obtained from all subjects involved in the study.

Data Availability Statement

The data presented in this study are available within the manuscript.

Acknowledgments

The authors would like to acknowledge the National Natural Science Foundation of China (No. 51822807).

Conflicts of Interest

The authors declare no conflict of interest.

References

  1. Index Mundi, Nickel: World Plant Production, by Country and Product. 2012. Available online: https://www.indexmundi.com/en/commodities/minerals/nickel/nickel_t12.html (accessed on 12 October 2021).
  2. Vartiainen, A. Proceedings of the Twelfth International Ferroalloys Congress. In The Twelfth International Ferroalloys Congress: Sustainable Future; Outotec Oyj: Helsinki, Finland, 2010. [Google Scholar]
  3. Cheng, M.M. Current development status, market analysis and prospect of ferronickel in China. Expr. Inf. Min. Ind. 2008, 8. (In Chinese) [Google Scholar]
  4. Saha, A.K.; Khan, M.N.N.; Sarker, P.K. Value added utilization of by-product electric furnace ferronickel slag as construction materials: A review. Resour. Conserv. Recy. 2018, 134, 10–24. [Google Scholar] [CrossRef] [Green Version]
  5. Wang, Q.; Huang, Z.; Wang, D. Influence of high-volume electric furnace nickel slag and phosphorous slag on the properties of massive concrete. J. Therm. Anal. Calorim. 2017, 131, 873–885. [Google Scholar] [CrossRef]
  6. Huang, Y.; Wang, Q.; Shi, M. Characteristics and reactivity of ferronickel slag powder. Constr. Build. Mater. 2017, 156, 773–789. [Google Scholar] [CrossRef]
  7. Rahman, M.A.; Sarker, P.K.; Shaikh, F.U.A.; Saha, A.K. Soundness and compressive strength of Portland cement blend-ed with ground granulated ferronickel slag. Constr. Build. Mater. 2017, 140, 194–202. [Google Scholar] [CrossRef] [Green Version]
  8. Zhai, M.; Zhu, H.; Liang, G.; Wu, Q.; Zhang, C.; Hua, S.; Zhang, Z. Enhancing the recyclability of air-cooled high-magnesium ferronickel slag in cement-based materials: A study of assessing soundness through modifying method. Constr. Build. Mater. 2020, 261, 120523. [Google Scholar] [CrossRef]
  9. Maragkos, I.; Giannopoulou, I.P.; Panias, D. Synthesis of ferronickel slag-based geopolymers. Miner. Eng. 2009, 22, 196–203. [Google Scholar] [CrossRef]
  10. Saha, A.K.; Sarker, P. Sustainable use of ferronickel slag fine aggregate and fly ash in structural concrete: Mechanical properties and leaching study. J. Clean. Prod. 2017, 162, 438–448. [Google Scholar] [CrossRef]
  11. Saha, A.K.; Sarker, P.K. Expansion due to alkali-silica reaction of ferronickel slagfine aggregate in OPC and blended cement mortars. Constr. Build. Mater. 2016, 123, 135–142. [Google Scholar] [CrossRef] [Green Version]
  12. Zhang, Z.; Zhu, Y.; Yang, T.; Li, L.; Zhu, H.; Wang, H. Conversion of local industrial wastes into greener cement through geopolymer technology: A case study of high-magnesium nickel slag. J. Clean. Prod. 2017, 141, 463–471. [Google Scholar] [CrossRef]
  13. Yang, T.; Wu, Q.; Zhu, H.; Zhang, Z. Geopolymer with improved thermal stability by incorporating high-magnesium nickel slag. Constr. Build. Mater. 2017, 155, 475–484. [Google Scholar] [CrossRef]
  14. Provis, J.L.; van Deventer, J.S.J. (Eds.) Alkali-activated Materials: State-of-the-Art Report, RILEM TC 224-AAM; Springer/RILEM: Dordrecht, Germany, 2014. [Google Scholar]
  15. Wang, D.; Wang, Q.; Huang, Z. New insights into the early reaction of NaOH-activated slag in the presence of CaSO4. Compos. Pt. B-Eng. 2020, 198, 108207. [Google Scholar] [CrossRef]
  16. Luo, T.; Wang, Q.; Zhuang, S. Effects of ultra-fine ground granulated blast-furnace slag on initial setting time, fluidity and rheological properties of cement pastes. Powder Technol. 2019, 345, 54–63. [Google Scholar]
  17. Dimas, D.D.; Giannopoulou, I.P.; Panias, D. Utilization of Alumina Red Mud for Synthesis of Inorganic Polymeric Materials. Miner. Process. Extr. Met. Rev. 2009, 30, 211–239. [Google Scholar] [CrossRef]
  18. Gong, C.; Yang, N. Effect of phosphate on the hydration of alkali-activated red mud–slag cementitious material. Cem. Concr. Res. 2000, 30, 1013–1016. [Google Scholar] [CrossRef]
  19. Kumar, A.; Kumar, S. Development of paving blocks from synergistic use of red mud and fly ash using geopolymerization. Constr. Build. Mater. 2013, 38, 865–871. [Google Scholar] [CrossRef]
  20. Donatello, S.; Maltseva, O.; Fernandez-Jimenez, A.; Palomo, A. The Early Age Hydration Reactions of a Hybrid Cement Containing a Very High Content of Coal Bottom Ash. J. Am. Ceram. Soc. 2013, 97, 929–937. [Google Scholar] [CrossRef] [Green Version]
  21. Kumar, S.; García-Triñanes, P.; Teixeira-Pinto, A.; Bao, M. Development of alkali activated cement from mechanically activated silico-manganese (SiMn) slag. Cem. Concr. Compos. 2013, 40, 7–13. [Google Scholar] [CrossRef]
  22. Wang, D.; Wang, Q.; Xue, J. Reuse of hazardous electrolytic manganese residue: Detailed leaching characterization and novel application as a cementitious material. Resour. Conserv. Recycl. 2019, 154, 104645. [Google Scholar] [CrossRef]
  23. Kalinkin, A.M.; Kumar, S.; Gurevich, B.I.; Alex, T.C.; Kalinkina, E.V.; Tyukavkina, V.V.; Kalinnikov, V.T.; Kumar, R. Geo-polymerization behavior of Cu–Ni slag mechanically activated in air and in CO2 atmosphere. Int. J. Miner. Process. 2012, 112–113, 101–106. [Google Scholar] [CrossRef]
  24. Onisei, S.; Pontikes, Y.; Van Gerven, T.; Angelopoulos, G.; Velea, T.; Predica, V.; Moldovan, P. Synthesis of inorganic polymers using fly ash and primary lead slag. J. Hazard. Mater. 2012, 205–206, 101–110. [Google Scholar] [CrossRef] [PubMed]
  25. Provis, J.; Palomo, A.; Shi, C. Advances in understanding alkali-activated materials. Cem. Concr. Res. 2015, 78, 110–125. [Google Scholar] [CrossRef]
  26. Shi, C.; Roy, D.; Krivenko, P. Alkali-Activated Cements and Concretes; CRC Press: Boca Raton, FL, USA, 2005. [Google Scholar]
  27. Li, C.; Sun, H.; Li, L. A review: The comparison between alkali-activated slag (Si + Ca) and metakaolin (Si + Al) cements. Cem. Concr. Res. 2010, 40, 1341–1349. [Google Scholar] [CrossRef]
  28. Wang, D.; Wang, Q.; Zhuang, S.; Yang, J. Evaluation of alkali-activated blast furnace ferronickel slag as a cementitious ma-terial: Reaction mechanism, engineering properties and leaching behaviors. Constr. Build. Mater. 2018, 188, 860–873. [Google Scholar] [CrossRef]
  29. Tian, H.; Kong, X.; Su, T.; Wang, D. Comparative study of two PCE superplasticizers with varied charge density in Port-land cement and sulfoaluminate cement systems. Cem. Concr. Res. 2019, 115, 43–58. [Google Scholar] [CrossRef]
  30. Scrivener, K.L.; Snellings, R.; Lothenbach, B. A Practical Guide to Microstructural Analysis of Cementitious Materials; CRC Press: Boca Raton, FL, USA, 2016. [Google Scholar]
  31. De Filippis, U.; Prud’Homme, E.; Meille, S. Relation between activator ratio, hydration products and mechanical properties of alkali-activated slag. Constr. Build. Mater. 2020, 266, 120940. [Google Scholar] [CrossRef]
  32. Bondar, D.; Lynsdale, C.; Milestone, N.B.; Hassani, N.; Ramezanianpour, A. Effect of type, form, and dosage of activators on strength of alkali-activated natural pozzolans. Cem. Concr. Compos. 2010, 33, 251–260. [Google Scholar] [CrossRef]
  33. Xu, H.; van Deventer, J.S.J. The geo-polymerisation of alumino-silicate minerals. Int. J. Miner. Process. 2000, 59, 247–266. [Google Scholar] [CrossRef] [Green Version]
  34. Wu, Z.; Shi, C.; Khayat, K.; Wan, S. Effects of different nanomaterials on hardening and performance of ultra-high strength concrete (UHSC). Cem. Concr. Compos. 2016, 70, 24–34. [Google Scholar] [CrossRef] [Green Version]
  35. Puertas, F.; Torres-Carrasco, M. Use of glass waste as an activator in the preparation of alkali-activated slag. Mechanical strength and paste characterization. Cem. Concr. Res. 2014, 57, 95–104. [Google Scholar] [CrossRef]
  36. Garcia-Lodeiro, I.; Palomo, A.; Fernández-Jiménez, A.; Macphee, D.E. Compatibility studies between N-A-S-H and C-A-S-H gels. Study in the ternary diagram Na2O–CaO–Al2O3–SiO2–H2O. Cem. Concr. Res. 2011, 41, 923–931. [Google Scholar] [CrossRef]
  37. Chithiraputhiran, S.; Neithalath, N. Isothermal reaction kinetics and temperature dependence of alkali activation of slag, fly ash and their blends. Constr. Build. Mater. 2013, 45, 233–242. [Google Scholar] [CrossRef]
  38. Song, S.; Jennings, H.M. Pore solution chemistry of alkali-activated ground granulated blast-furnace slag. Cem. Concr. Res. 1999, 29, 159–170. [Google Scholar] [CrossRef]
  39. Zuo, Y.; Nedeljković, M.; Ye, G. Pore solution composition of alkali-activated slag/fly ash pastes. Cem. Concr. Res. 2018, 115, 230–250. [Google Scholar] [CrossRef]
  40. Yao, X.; Zhang, Z.; Zhu, H.; Chen, Y. Geopolymerization process of alkali–metakaolinite characterized by isothermal calorimetry. Thermochim. Acta 2009, 493, 49–54. [Google Scholar] [CrossRef]
  41. Zhang, Z.; Wang, H.; Provis, J.L. Quantitative study of the reactivity of fly ash in geopolymerization by FTIR. J. Sustain. Cem. Mater. 2012, 1, 154–166. [Google Scholar] [CrossRef] [Green Version]
  42. Yu, P.; Kirkpatrick, R.J.; Poe, B.; McMillan, P.F.; Cong, X. Structure of Calcium Silicate Hydrate (C-S-H): Near-, Mid-, and Far-Infrared Spectroscopy. J. Am. Ceram. Soc. 2004, 82, 742–748. [Google Scholar] [CrossRef]
  43. Fang, Y.H.; Lu, Z.L.; Wang, Z.L. FT-IR Study on Early-Age Hydration of Alkali-Activated Slag Cement. Key Eng. Mater. 2011, 492, 429–432. [Google Scholar] [CrossRef]
  44. Mollah, M.Y.A.; Lu, F.; Cocke, D.L. X-raydiffraction (XRD) fourier transform infrared spectroscopy (FT-IR) characterization Portland cement type-V. Sci. Total Environ. 1998, 224, 57. [Google Scholar] [CrossRef]
  45. Hajimohammadi, A.; Provis, J.L.; van Deventer, J.S.J. The effect of silica availability on the mechanism of geopolymerisation. Cem. Concr. Res. 2011, 41, 210–216. [Google Scholar] [CrossRef]
Figure 1. XRD pattern for BFFS.
Crystals 11 01301 g001
Figure 2. Compressive strength of AA–BFFS mortar at different concentrations.
Crystals 11 01301 g002
Figure 3. Cumulative pore volumes of alkali-activated BFFS paste at different ages: (a) 3 d; (b) 7 d.
Crystals 11 01301 g003
Figure 4. XRD spectra of hardened pastes at different ages: (a) 2 M, (b) 5 M. (c) 8 M. (d) 10 M and (e) 12 M.
Crystals 11 01301 g004aCrystals 11 01301 g004b
Figure 5. Isothermal calorimetry curves for paste: (a) heat flow and (b) cumulative heat.
Crystals 11 01301 g005
Figure 6. FT-IR spectra of hardened pastes at different ages: (a) 2 M, (b) 5 M, (c) 8 M, (d) 10 M and (e) 12 M.
Crystals 11 01301 g006aCrystals 11 01301 g006b
Table 1. Chemical composition of raw materials (wt.%).
CompoundCaOSiO2Al2O3MgOMnOCr2O3Fe2O3SO3LOI
BFFS32.7227.3121.828.641.991.951.571.582.41
Publisher’s Note: MDPI stays neutral with regard to jurisdictional claims in published maps and institutional affiliations.

