
Impact of Impurities on Crystallization and Product Quality: A Case Study with Paracetamol


1
EPSRC Centre for Innovative Manufacturing in Continuous Manufacturing and Crystallization, University of Strathclyde, Glasgow G1 1RD, UK
2
Laboratoire Sciences et Méthodes Séparatives, Université de Rouen Normandie, Place Emile Blondel, CEDEX, 76821 Mont Saint Aignan, France
*
Author to whom correspondence should be addressed.
Crystals 2021, 11(11), 1344; https://0-doi-org.brum.beds.ac.uk/10.3390/cryst11111344
Submission received: 20 September 2021
/
Revised: 9 October 2021
/
Accepted: 19 October 2021
/
Published: 3 November 2021
(This article belongs to the Special Issue Pharmaceutical Crystallization)
Abstract
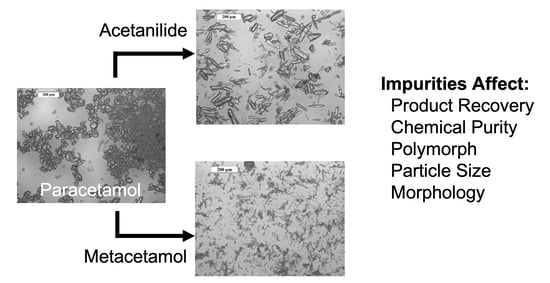
:A thorough, systematic study into the effect that structurally related impurities have on both the process and product quality during the crystallization of an active pharmaceutical ingredient is presented. The presence of acetanilide and metacetamol influences the crystallization and product quality of paracetamol. Where high concentrations of either impurity were present in the crystallization feed, product recovery decreased by up to 15%. Acetanilide is included in the final product through adsorption onto the particle surface in concentrations up to 0.79 mol%, which can be reduced to acceptable levels through product reslurrying. The presence of metacetamol results in much higher concentrations—up to 6.78 mol% in the final product, of which approximately 1 mol% is incorporated into the crystal lattice, resulting in the perturbation of the unit-cell dimensions. The incidental crystallization and subsequent isolation of metastable Form II paracetamol increased product purity in the presence of a low metacetamol concentration. This metastable product converts to stable paracetamol Form I through reslurrying, offering an efficient metacetamol impurity rejection route. The morphology of the product is modified consistently by both impurities. An elongation of the normal prismatic shape is observed, which in the extreme case of high metacetamol contamination results in the isolation of fine, fragile needles. This problematic morphology is also improved by a reslurrying of the crystallization product to give a more equilateral shape. This systematic study of the influence of acetanilide and metacetamol on the crystallization of paracetamol builds a well-rounded picture of the concomitant impact of impurities on the principal quality attributes of a crystallization product.
1. Introduction
The quality of a crystallization product is defined by four principal attributes: chemical purity, polymorphic form, particle size and crystal morphology [1]. An optimized procedure will isolate the most stable polymorph to as close to 100% purity as possible, and the crystals will be uniform in size and equant in shape. These properties are critical in the design of a manufacturing process, where the product material is further processed downstream. For example, the crystallization product of an active pharmaceutical ingredient (API) needs to be formulated into a commercial dosage form. The presence of impurities in the crystallization feed can influence these attributes, leading to inferior product quality and manufacturability.
When impurities are not rejected during the crystallization and isolation processes, they contaminate the product, decreasing chemical purity. Ensuring a high purity of APIs is essential, as impurities can affect the efficacy of the medicine or, in the worst-case scenario, have their own adverse therapeutic effects. In general, impurities cannot be present in a crystallized API in a concentration greater than 0.1 mol% [2]. Impurities can incorporate into crystal products via different mechanisms, resulting in compromised purity [3,4,5]. Through a consideration of the mechanism for impurity incorporation, targeted process changes can be implemented to enhance the rejection of impurities during crystallization [3]. The concentration of impurity in the crystallization product is typically dependent on the concentration of the impurity in the crystallization feed, and the magnitude of this relationship changes from impurity to impurity [6,7].
The presence of an impurity can impact other product quality aspects such as polymorph, size and shape, while changing the polymorph, size and shape during crystallization in turn can affect impurity rejection. Many APIs exhibit polymorphism, where multiple unique crystal structures of the same chemical compound are possible [8]. Structurally related impurities have been shown to direct the polymorphic outcome of crystallization; for example, the addition of high metacetamol concentrations to crystallization feeds of paracetamol results in the isolation of phase-pure metastable Form II [9]. Additionally, impurity molecules can interact differently with growing crystals of two polymorphs, and thus the choice of polymorph to be crystallized can affect the chemical purity of the resulting product [10,11,12]. Further, the interaction of impurity molecules with the growing crystal surface affects the size and morphology (shape) of the particles isolated. Through non-covalent interactions, impurities can influence the growing crystal interface, either accelerating or hindering the growth of either the entire crystal or specific faces [13]. Where overall fast growth is observed, the product tends to be less pure, as the particles are likely to capture more impurity molecules kinetically [14]. Specific growth modification leads to prominent shape changes. The presence of 4-chloroacetanilide during the crystallization of paracetamol from alcoholic solvents results in needle-like crystals, whilst without the impurity prismatic crystals are isolated [15].
It is important to control particle size and morphology during crystallization, as these attributes affect how the product processes downstream. The presence of small, fine particles in a bulk powder results in poor flowability and will be difficult to handle in downstream processes. Needle-shaped crystals with a low aspect ratio are particularly undesirable, as they hinder any filtration steps and are subject to breakage due to fragility [16].
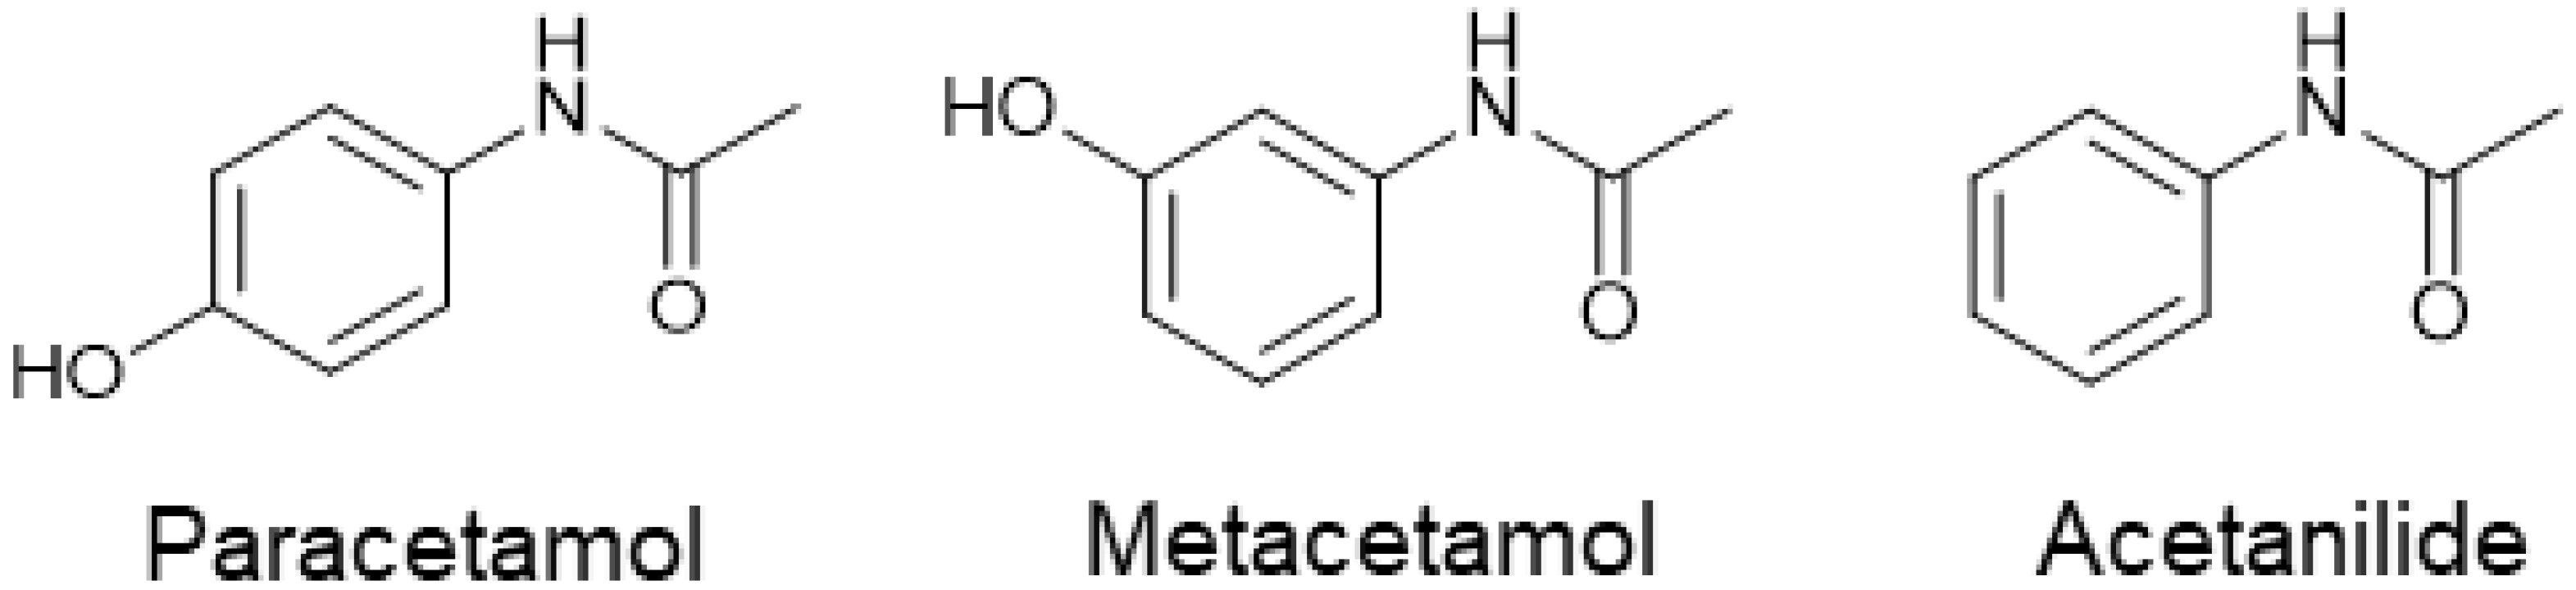
We present here a comprehensive study on the impact of structurally similar impurities metacetamol and acetanilide (Figure 1) on paracetamol crystallization and product quality aspects. The effect of the impurities on the nucleation and product recovery are investigated, as well the influence on the principal product quality aspects: purity, polymorph, size distribution and shape. Paracetamol is a generic antipyretic and analgesic medication. It is a polymorphic API, with well-established routes to each of its three specific polymorphs ranging from thermal techniques to the addition of structurally related compounds [9,17,18,19,20]. The most stable polymorph, Form I, typically exhibits a prismatic morphology, though various process-related impurities have been shown to influence the particle shape [7,15]. The metastable Form II shows an elongation along the c-axis of the crystal to form a more needle-shaped morphology [21].
2. Materials and Methods
Paracetamol (≥99.0%, Sigma Aldrich, Dorset, UK) acetanilide (99%, Sigma Aldrich, Dorset, UK) and metacetamol (97%, Sigma Aldrich, Dorset, UK) were purchased and used without further purification. Solvents 2-propanol (99.7%, VWR International, Lutterworth, UK), heptane (99%, Sigma Aldrich, Dorset, UK), methanol (HPLC grade, 99.9%, Sigma Aldrich, Dorset, UK) and acetone (99.8%, VWR International, Lutterworth, UK) were purchased and used without further purification.
2.1. Crystallization and Isolation
Turbidity-based solubility measurements were carried out using the Technobis Crystalline instrument. Stirred suspensions of known concentrations were subjected to heating and cooling cycles whilst the solution transmissivity was measured. The suspension was slowly heated (0.3 °C min−1), and the point at which the transmissivity reached 100% was taken as the saturation temperature. After dissolution, the solution was cooled slowly (0.5 °C min−1) and the point at which the transmissivity began to decrease sharply was taken as the metastable zone-width temperature. The saturation temperatures for a range of concentrations were then fitted to the linear van ’t Hoff Equation (1), where XA is the mole fraction of the solute, ΔH° is an enthalpy term, R is the universal gas constant, T is the saturation temperature and ΔS° is a temperature-independent entropy term.
From the linear van’t Hoff parameters, a temperature dependence curve can be plotted as saturation temperature versus concentration and checked against the experimentally predicted data points.
The supersaturation ratio S is defined in Equation (2) where C is the concentration of the solution and Cs is the saturation concentration at the given temperature.
Using the Technobis Crystal16 instrument, temperature cycles were applied to multiple samples of identical compositions. The initial suspension was heated beyond the saturation temperature to ensure complete dissolution; then, the solution was cooled rapidly to obtain the desired supersaturation ratio, S. The time between reaching the supersaturation ratio, S, and the first appearance of crystals, indicated by a drop in transmissivity, was taken as the induction time, tind. These cycles continued until 80 data points were collected at the same supersaturation ratio [22], and the experimental induction time probability distribution was plotted according to Equation (3), where M+(t) is the number of induction time measurements in which crystals were detected at time t, and M is the total number of induction time measurements at an equal supersaturation ratio [23,24].
The induction time distribution was then fitted to the probability distribution function in Equation (4) [23], where J is the nucleation rate, V is the experimental volume, t is the true induction time and tg is the time difference between nucleation occurring and the crystals being observed. J and tg are fitted parameters, obtained from the experimental data using Origin 3.0.
Small-scale batch crystallization experiments were carried out using the Technobis Crystalline platform. Approximately 1 g paracetamol was weighed into a vial containing a magnetic stirrer bar, followed by an amount of impurity and 4 mL of 2-propanol. The relative impurity spike (I) of this crystallization feed was calculated using Equation (5) based on the molar ratio of impurity (mi) and API (mAPI) in the feed suspension (f).
The stirred solutions were then heated above the saturation temperature of the suspension, held briefly isothermally to ensure complete dissolution, then cooled rapidly (5 °C min−1) to the temperature to reach the desired relative supersaturation S. The solution was held isothermally at this temperature for 30 min, during which time nucleation occurred, indicated by a sharp decrease in transmissivity, and the formation of a suspension was confirmed by an analysis of the in-situ images captured. The suspension was further cooled slowly (0.5 °C min−1) to 20 °C and, finally, held at this final temperature for approximately 3 h.
After crystallization, a portion of filtered mother liquor was transferred to a pre-weighed vial, the mass recorded, and the solvent evaporated using an IKA multiwell heat block at 30 °C to give a gravimetric concentration. The evaporated mother liquor sample was diluted directly with HPLC mobile phase for HPLC analysis within the limits of the calibration to determine the concentrations of the API and impurity in the solution phase. The remaining suspension from the crystallization was then vacuum filtered, and the solid washed with heptane (2 × 3 mL). A measured amount of the crystals isolated was diluted with HPLC mobile phase volumetrically to a concentration within the calibrated limits. The percentage product recovery (Yr) of the crystallization is calculated using Equation (6) based on the molar amount of product obtained (), in which the maximum mass of API in the amount of solvent present at the final isolation temperature was calculated using the saturation concentration determined earlier (Cs) and the volume of solvent added to the crystallization (V).
For reslurry experiments, a sample of the crystallization product (typically ca. 100 mg) was suspended in a saturated solution of paracetamol in 2-propanol, which was immediately filtered before use. This suspension temperature was maintained at 21 °C by a temperature-controlled metal jacket, while the suspension was stirred at 100 rpm for 18 h. To isolate the slurry product, the suspension was vacuum filtered and the solid washed with heptane (2 × 3 mL). We made sure that a thorough and reproducible filtration, washing and drying procedure was put in place to ensure that the results and interpretations drawn from them are due to the crystallization process rather the filtration, washing and drying.
2.2. Product Analysis
HPLC was used to measure component concentrations in the solid and isolated liquid phases after crystallization and reslurrying. Calibration curves with a detector wavelength 243 nm were constructed to allow accurate concentration determination. HPLC analyses were carried out using an Agilent 1100 instrument fitted with an Agilent Poroshell 120, EC-C18, 4.6 × 74 mm 2.7 um column. A mobile phase of 20 v% MeOH 80 v% water was used with an isocratic elution of 1 mL min−1 at a column temperature of 40 °C. Samples were prepared by dissolution in 5 v% MeOH 95 v% water solvent mixture, and then syringe filtered to remove particulates. Analysis was stopped after 12 min, and the resulting chromatograms were interpreted using the Agilent ChemStation software. The purity of a solid Xp was calculated from the number of moles of API present and the number of moles of impurity present (Equation (7)), as indicated by the HPLC data. The concentrations of impurity in the solid phase after crystallization () and after reslurrying () were calculated in a similar fashion (see Equation (8) for Xi,p).
The polymorphic form of the API crystallized was analyzed using a Bruker AXS D8 Advance II diffractometer using a Debye–Scherrer transmission of Cu Kα1 radiation with a wavelength of 1.540596 Å. Samples were prepared on an automated x–y 28-well plate with 7.5 μm Kapton film. Patterns were collected on a range of 4–35 2θ, and the paracetamol phase was confirmed using Pawley refinement against reference patterns located in the Cambridge Crystallographic Data Centre (CCDC) to identify the polymorph present.
Thermal analysis was carried out using a Netzsch DSC 214 Polyma. A single heating–cooling cycle was used to avoid polymorphic transformations [25]. Samples were sealed in aluminum pans with a pierced lid at 20 °C and then heated at rate of 10 °C min−1 to 190 °C. After a 10 min isothermal hold at the maximum temperate, the sample was then returned to room temperature at a rate of 10 °C min−1. Melting temperatures and signal area were determined using Proteus Analysis software.
Using the literature-reported values for the solubility of paracetamol, metacetamol and acetanilide in acetone [26], volumetric stock solutions of each solute with the same molar concentration were prepared. These solutions were then combined in different binary ratios to give solutions of different impurity mole fractions. These solutions were evaporated at room temperature to give crystalline material suitable for Differential Scanning Calorimetry (DSC) analysis. The melting temperature of the component and eutectic signals were plotted as a function of the impurity mole fractions to give the experimental binary phase diagram. Where the DSC graphs contained a eutectic peak, the area of this signal was plotted as a function of the impurity mole fraction in the solid phase. A linear fit of these data points gave two linear relationships which intersect at a maximum energy value, with an impurity mole fraction value corresponding to the eutectic composition [27]. The miscibility limit of the solid–solid composition was determined by the linear extrapolation to the intersection of the impurity mole fraction axis.
Small amounts of crystals were transferred to microscope slides and viewed with an appropriate magnification to identify any agglomeration. Images were captured using a Leica DM6000 FS microscope.
Particle size and shape distributions of isolated crystals were analyzed using the Malvern Morphologi G3. The dry powder was dispersed using compressed air under low energy conditions to avoid particle breakage. Some filters were applied to the raw data to remove artefacts such as dust and fibers. Particles under 55 pixels, with a convexity value less than 0.80 or with a solidity value less than 0.65 were removed from the distribution. Circle Equivalent (CE) Diameter measurements were used to compare particle sizes across data sets, and aspect ratio measurements were used to compare particle shapes. Aspect ratio (A) is defined here as the ratio of width (shortest edge, w) to length (longest edge, l); Equation (9) gives a dimensionless value between 0 to 1, where 1 equates to an equant shape.
2.3. List of Terms
| A | Aspect ratio |
| C | Solution concentration (mg g−1) |
| Cs | Saturation concentration at given temperature (mg g−1) |
| ΔH° | Enthalpy (J g−1) |
| I | Relative impurity spike of impurity in respect to paracetamol (%) |
| J | Nucleation rate (m−3 s−1) |
| l | Particle length (μm) |
| M | Total number nucleation experiments |
| M+ | Number of successful nucleation experiments at a particular time |
| Moles of impurity in feed (mol) | |
| Moles of API in feed (mol) | |
| Moles of impurity in crystallized solid (mol) | |
| Moles API in crystallized solid (mol) | |
| Moles of impurity in mother liquor (mol) | |
| Moles of API in crystallized solid (mol) | |
| Moles of impurity in solid after reslurry (mol) | |
| Moles of API in solid after reslurry (mol) | |
| P | Probability of nucleation |
| Yr | Product recovery (%) |
| R | Universal gas constant (J K−1 mol−1) |
| S | Supersaturation ratio |
| ΔS° | Temperature independent entropy (J K−1) |
| T | Temperature of solution saturation (°C) |
| Tm | Melting temperature (°C) |
| t | True induction time (s) |
| tind | Observed induction time (s) |
| tg | Time between nucleation occurring and observed (s) |
| V | Volume (cm3) |
| w | Particle width (μm) |
| Xa | Mole fraction of solute (-) |
| Xi,F | Impurity molar concentration in the feed (%) |
| Xi,p | Concentration of impurity in the crystallized solid (mol%) |
| Xi,s | Concentration of impurity in solid after reslurry (mol%) |
| Xp | Product purity (mol%) |
| Xp,s | Crystal purity after the reslurrying process (%) |
3. Results
3.1. Crystallization Conditions
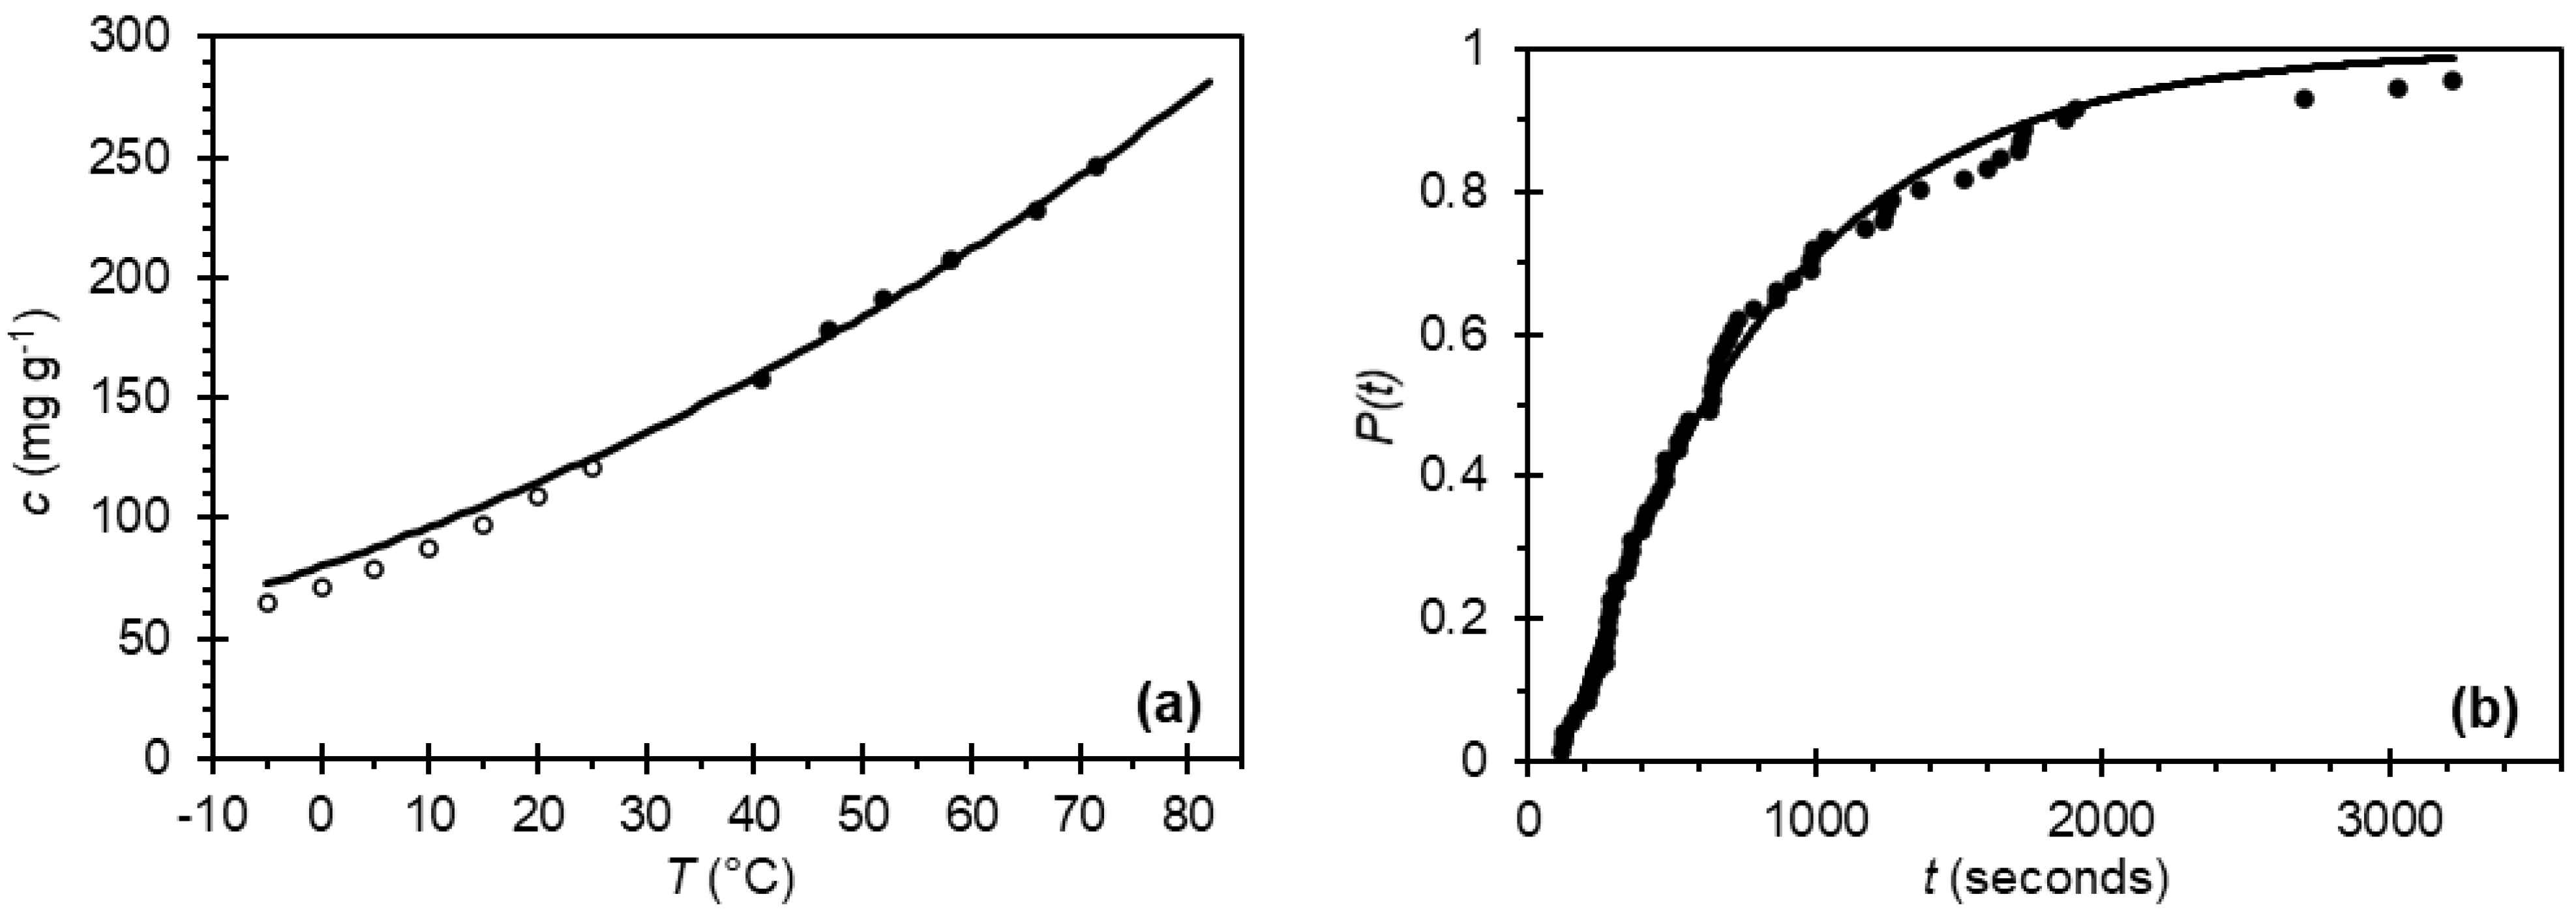
Paracetamol is a well-studied model system; as such, a range of solvents have been used to facilitate crystallization. At the outset of this work, 2-propanol was chosen, as it is reported to produce un-agglomerated crystals of stable polymorphic Form I [28]. To enable the design of small-scale crystallization experiments in this work, the temperature-dependent solubility of paracetamol in 2-propanol at high temperatures was investigated using turbidity measurements. As seen in Figure 2a, a shallow relationship was found where the solubility doubles roughly every 50 °C. The data is in good agreement with literature values at lower temperatures using gravimetric techniques, although the van’t Hoff extrapolation results in slightly higher solubilities below room temperature in our case [26].
The nucleation kinetics of paracetamol in 2-propanol at a supersaturation ratio S = 2.10 were also investigated. Figure 2b shows the probability of nucleation under such conditions, fitted using Equation (4). The nucleation rate J = 1376 ± 17 m−3 s−1 is significantly higher than values reported for the same system at a slightly lower supersaturation, S = 2.0 [29]. Using the determined nucleation rate J, the probability of nucleation, accounting for the increased volume, was calculated as greater than 90% after a 30-min isothermal hold at S = 2.10. Given this high probability, under these conditions, nucleation should occur in most small-scale experiments even in the presence of impurities. Thus, these conditions were used in the nucleation stage of the temperature profile in the 14 small-scale (4 mL) crystallization experiments of paracetamol in the presence of various amounts of either acetanilide or metacetamol in 2-propanol (1 pure component, 6 with added acetanilide and 7 with added metacetamol).
Effect of Impurities
All 14 crystallization experiments, with and without impurities, show nucleation in the intended isothermal time window of 30 min (Figure S1). A single experiment in the absence of impurities resulted in an induction time of 7 min 50 s. The addition of acetanilide to the crystallization feed does not significantly impact the induction time up to a concentration of 5 mol% impurity. A high initial concentration of metacetamol increases the time to nucleation at S = 2.10, with high induction times close to the 30-min boundary observed with initial impurity spike IMET values in respect to paracetamol concentrations of 7.38 mol% and 9.65 mol%. This observation is in line with similar larger scale experiments, where a larger initial concentration of metacetamol increases the time to nucleation in a supersaturated solution [30,31].
Using the crystallization and isolation procedures described, in the absence of impurities a high product recovery Yr = 94.3% is achieved when compared to the theoretically maximum amount that can be recovered due to solubility (Equation (6)). Due to the small scale of these experiments, the deviation from the maximum possible yield determined by solubility data is explained by small amounts of product loss through transfer steps and can be considered consistent across all 14 experiments within experimental error. Comparison of the product recovery across the experimental series shows a lower crystallization yield as the initial impurity concentration is increased (Figure S3). The addition of 5.01 mol% acetanilide and 9.65 mol% metacetamol to the crystallization feed decreased Yr to 79.5% and 75.8%, respectively. As it has been shown that the presence of metacetamol increases the solubility of paracetamol Form I in 2-propanol by approximately 5% [32], this decrease in product recovery is thought to be due to increased solution saturation. The effect of acetanilide on paracetamol solubility is not reported, but it has been noted that other structurally related impurities, such as 4-nitrophenol and 4′-chloroacetanilide, were shown to not affect paracetamol solubility in 2-propanol when present in as much as 5 mol% concentration [29].
In summary, paracetamol nucleation at a relative supersaturation ratio of 2.10 in 2-propanol is achieved in less than 30 min, even in the presence of high concentrations of acetanilide or metacetamol—up to 5.01 mol% and 9.65 mol%, respectively. As the concentration of impurity increases in the crystallization feed solution, the product recovery decreases—by up to 15%, in the case of metacetamol.
3.2. Analysis of Product Attributes
3.2.1. Crystal Purity
All experiments in the presence of impurities result in compromised product purity Xp (Figure 3). Choosing a product purity specification of Xp ≥ 99.5 mol% as a target, 7 of the 13 experiments in the presence of impurities have not met the product purity specification and require enhanced impurity rejection (Table S1). In accordance with literature precedence [3,6,7], metacetamol contaminates the product in much higher concentrations than acetanilide with comparable initial impurity concentrations. In the most extreme case, the addition of 9.65 mol% metacetamol to the crystallization feed results in crystals with only 93.2 mol% paracetamol purity. The purity of the crystals isolated is found to have a linear relationship with the initial impurity spike; the more impurity present in the crystallization feed, the less pure are the crystals obtained. From this linear relationship, it can be ascertained that the maximum amount of metacetamol or acetanilide in the feed suspension relative to paracetamol that would lead to on-specification product would be I = 1.21 mol% or 2.84 mol%, respectively.
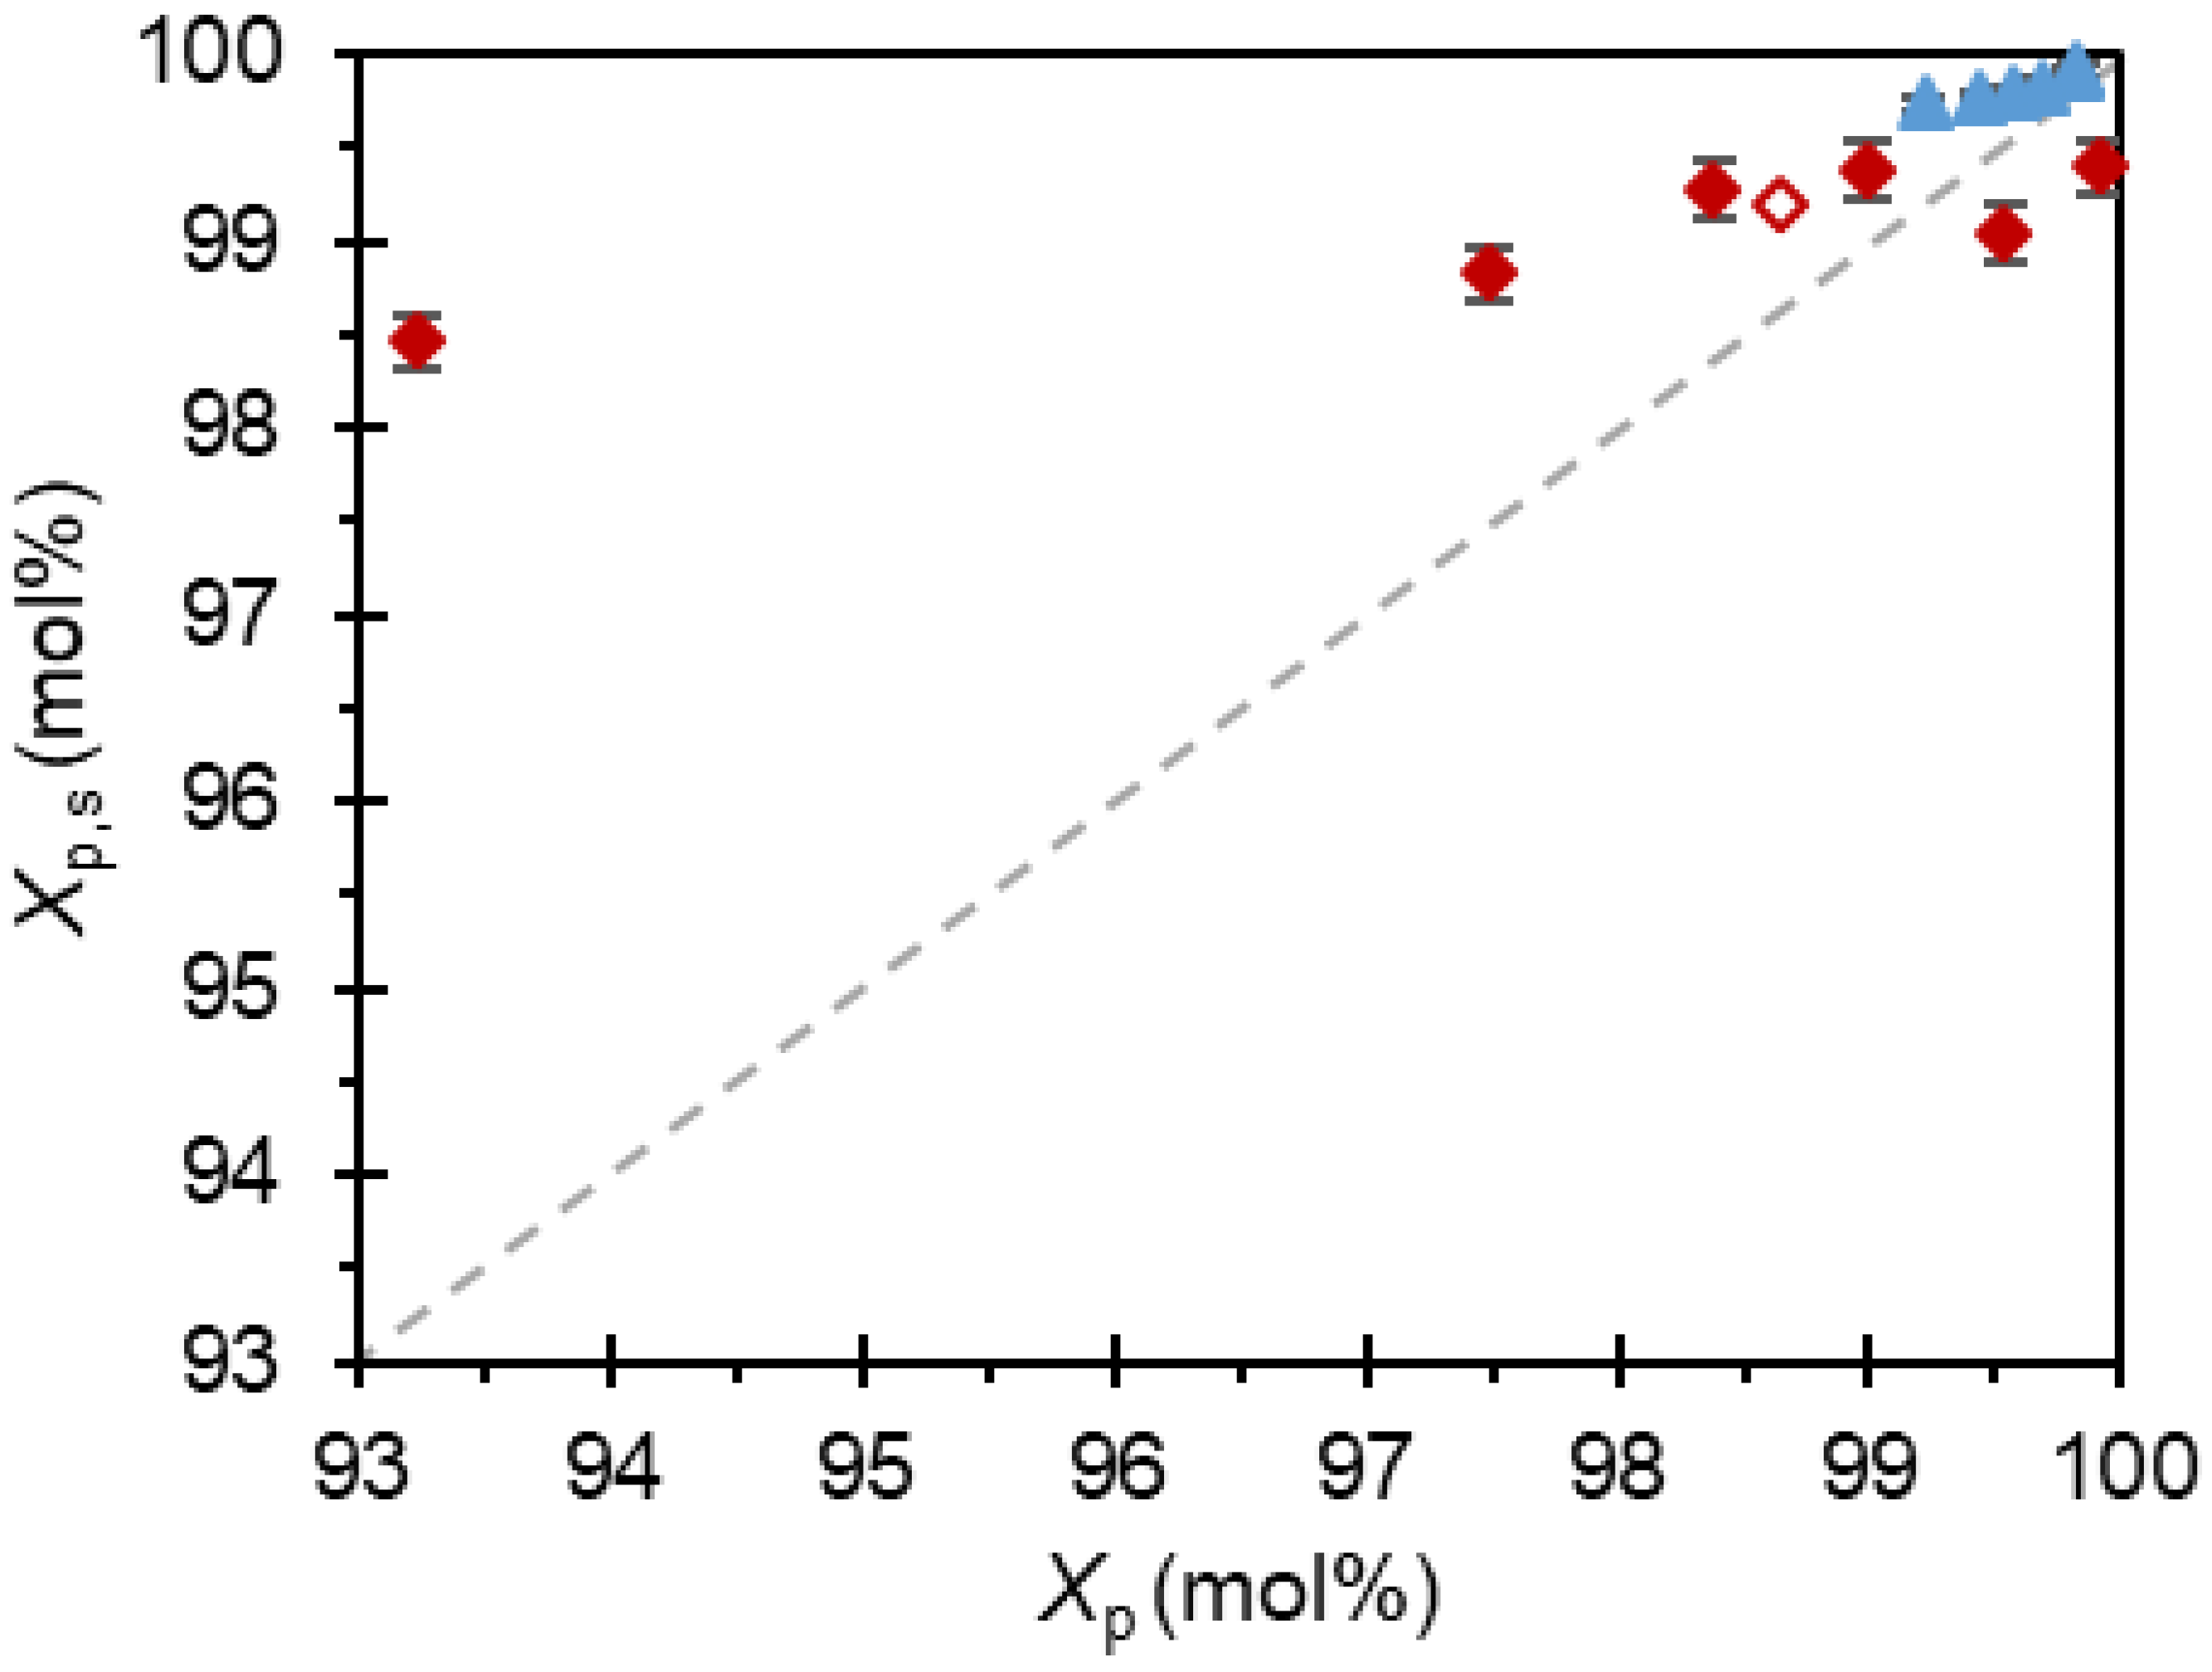
In our recent report where paracetamol crystallizations were used to validate the effectiveness of the workflow methodology [3], it was concluded that acetanilide contamination was mostly due to adsorption on the crystal surface, while metacetamol incorporated into the paracetamol crystal lattice likely through partial miscibility. It therefore follows that a reslurry of the acetanilide-contaminated products in a solution of 2-propanol saturated with paracetamol would increase chemical purity to meet the target specification, and, indeed, this was observed (Figure 4). The acetanilide concentration is significantly decreased in all applicable samples, achieving purities Xp,s = 99.7–99.9 mol% across the series. This complements our previous observation that acetanilide becomes absorbed onto the surface of the paracetamol crystals, and that a modified isolation procedure would remove acetanilide from the product and allow direct access to paracetamol-enhanced purity.
Similar reslurry experiments were undertaken with the metacetamol-contaminated products for comparison, and more sporadic results were obtained. The most contaminated sample, which contained Xi,P = 6.78 mol% metacetamol, saw the most dramatic enhancement of purity, increasing from Xp = 93.2 mol% to Xp,s = 98.5 mol%. Whilst this purity still does not meet specification, the slurry experiment suggested that much of the high metacetamol contamination was at the surface of these crystals. Two samples contaminated with metacetamol decreased in purity after reslurrying. Initially unsettled by this result, consideration of the entire data set aids an explanation. First, whilst the range of metacetamol concentrations in the product after crystallization was large, Xi,F being between 0.09 mol% and 6.78 mol%, after reslurrying the range was significantly narrower, at Xi,s being between 0.61 mol% and 1.54 mol%. In addition, the average value for purity after reslurrying was Xp,s = 99.1 mol% with a standard deviation of 0.4 mol%. Further, metacetamol increases the solubility of paracetamol in 2-propanol [32], so although the impurity-free solution phase of the slurry was initially saturated, some product can dissolve into the solvent, increasing the concentration of the impurity in the solution and, with it, the solubility. We further previously reported a partial miscibility of metacetamol and the paracetamol solid [3]. We therefore propose that during the 18 h reslurry, thermodynamic equilibration occurs towards a solid solution alongside an increase in paracetamol solubility, i.e., the formation of a partial solid solution where the concentration of initially desorbed impurity in the solution phase decreases whilst the concentration of paracetamol slightly increases. This manifests as the solid phase becoming less pure with reslurrying at low feed concentrations of metacetamol. It follows that due to this thermodynamic incorporation of the impurity, 99.1 mol% is the maximum value for thermodynamic product purity that can be obtained for paracetamol crystallized in the presence of high levels of metacetamol. During the initial crystallization, product with a higher purity was obtained (99.9 mol% when IMET = 0.50 mol%) as the growth of purer paracetamol was under a kinetic regime and was competitive with the thermodynamic solid solution formation.
The binary phase diagram and Tammann triangle for the metacetamol–paracetamol system indicate a partial solid solution of metacetamol in paracetamol (Figure 5). A value of partial miscibility of metacetamol in the paracetamol crystal lattice was found to be 6.3 ± 2.5 mol% [3]. For comparison, Figure 5 shows the resulting experimental binary phase diagram and accompanying Tammann triangle for acetanilide and paracetamol. There is good agreement between the predicted liquidus curves and the experimental melting points of the two-component mixtures in Figure 5b, as well as the melting points of the eutectic (97.2 ± 0.3 °C). The intersection of the two linear regressions in Figure 5d gives comparable experimental and predicted eutectic compositions of XACE = 0.713 and XACE = 0.715, respectively. Inspection of the impurity concentration axis intercepts of these linear regressions does not indicate a significant miscibility between acetanilide and paracetamol, further supporting the conclusion that this impurity incorporates into paracetamol using purely kinetic mechanisms.
3.2.2. Polymorphic Form
Paracetamol is a polymorphic API with three known polymorphs at atmospheric pressure. Form I is the most stable, Form II is metastable, but isolable, and Form III is highly unstable. Indeed, the structure of Form III has only been solved using powder diffraction techniques [33]. Metacetamol is known to be a template for paracetamol Form II when present in high concentrations during cooling crystallizations [9,32].
As anticipated, all the crystallizations with added acetanilide resulted in the isolation of paracetamol Form I (Figure S5). This was also the case for the majority of the metacetamol crystallizations. However, the XRPD analysis reveals that an experiment where 7.38 mol% of metacetamol was added to the crystallization feed stream led to the crystallization of paracetamol Form II (Figure 6c). This was unexpected under the conditions used here, as multiple studies have concluded that a suspension concentration of 25 w% metacetamol is required to form phase-pure Form II paracetamol, and lower impurity concentrations do not effectively template [9,32]. From the linear relationship established in Figure 3 between IMET and purity where form I was isolated, it is predicted that the addition of 7.38 mol% metacetamol to the crystallization feed would result in Form I crystals of 94.9 mol% paracetamol purity. However, these Form II crystals had a much higher purity of 98.7 mol% (denoted ( ![Crystals 11 01344 i003]() ) on Figure 3). Suspension of these Form II crystals in 2-propanol saturated with paracetamol further increased the purity to 99.2 mol% (denoted (
) on Figure 3). Suspension of these Form II crystals in 2-propanol saturated with paracetamol further increased the purity to 99.2 mol% (denoted ( ![Crystals 11 01344 i003]() ) in Figure 4), while XRPD indicates this slurry process also induced a polymorphic transformation to stable paracetamol Form I (Figure 6d).
) in Figure 4), while XRPD indicates this slurry process also induced a polymorphic transformation to stable paracetamol Form I (Figure 6d).
 ) on Figure 3). Suspension of these Form II crystals in 2-propanol saturated with paracetamol further increased the purity to 99.2 mol% (denoted ( ) in Figure 4), while XRPD indicates this slurry process also induced a polymorphic transformation to stable paracetamol Form I (Figure 6d).
It further can be noted that when the XRPD patterns are compared, the 2θ value of specific reflections vary with increased metacetamol content within the crystals (Table S2), and these reflections are indexed to the {011}, {020}, {021} and {022} planes. Following this observation, the experimental unit-cell parameters extracted from the refined powder pattern, show indeed that the dimensions change with increased metacetamol incorporation, as depicted in Figure 7a. Most affected are the a- and c-parameters, which both shorten as the concentration of metacetamol increases. At Xi,s = 6.78 mol%, these dimensions have decreased by almost 0.05 Å, representing a 0.7% and 0.4% respective decrease from the impurity-free measurements. This is contrasted by an analysis of crystals contaminated with acetanilide, where the unit-cell parameters do not change significantly across the series (Figure 7b).
Metacetamol is known to interact with crystallizing paracetamol in 2-propanol, as evidenced from the Form II template effect when present in concentrations of at least 25 w% [9,32] and partial solid solution formation [3]. We propose that it is the latter that is responsible for the crystal lattice disruption by the incorporation of metacetamol molecules into the lattice during growth.
3.2.3. Particle Size
Representative images from optical microscopy of the dry, isolated crystals after crystallization are shown in Figure 8. In general, the crystals are small (<100 μm) and show some signs of particle breakage. This was expected given that the crystallization platform employed uses small vessels (8 mL vials) and magnetic stirring. Samples (a) through (e) were free-flowing suspensions, and across the series have a reasonably consistent particle size. The crystals with a high Xi,p, at 6.78 mol%, in Figure 8f, have a significantly decreased particle size, and the batch contains mostly fine particles. Further, it is noted here that this sample was difficult to handle, with obvious clumping of the powder. For comparison, Figure 9 shows the metastable Form II crystals that were isolated. The particles here are considerably smaller than those in Figure 8a–e.
Measurement of the bulk sample particle size distribution shows little overall effect of acetanilide concentration on the overall particle size. Compared with crystals grown under the same process conditions without any impurity present, the volume-weighted CE diameter D50 value varies over the experimental series (Figure 9). From microscopy images in Figure 8e,f, a decrease in particle size with increased metacetamol concentration is observed, and to some extent this is seen in the particle size distribution (PSD) measurements. The CE diameter D50 value in the least contaminated product (Xi,p = 0.09 mol%) is comparable with crystals grown without impurity present, at 62.4 μm and 64.1 μm, respectively. Where Xi,p has increased to 6.78 mol%, the CE diameter D50 decreases to 49.9 μm. This is comparable to the similar measurement of the small plate-like metastable Form II crystals isolated, where D50 = 52.4 μm ( ![Crystals 11 01344 i003]() , Figure 10a). The span of the distributions varies across the series (Table S4). Across the metacetamol-contaminated samples, the average span of the crystallization product samples is 1.18 (standard deviation = 0.50). At the extreme of this range was the case of Xi,p = 6.78 mol%, where the span of the distribution is 2.19. We hypothesise that, as these particles are very fine needles (Figure 8f), breakage occurs during the sample dispersion for measurement, which results in a bi-modal particle size distribution (Figure S8f) and hence a large value for the span.
, Figure 10a). The span of the distributions varies across the series (Table S4). Across the metacetamol-contaminated samples, the average span of the crystallization product samples is 1.18 (standard deviation = 0.50). At the extreme of this range was the case of Xi,p = 6.78 mol%, where the span of the distribution is 2.19. We hypothesise that, as these particles are very fine needles (Figure 8f), breakage occurs during the sample dispersion for measurement, which results in a bi-modal particle size distribution (Figure S8f) and hence a large value for the span.
, Figure 10a). The span of the distributions varies across the series (Table S4). Across the metacetamol-contaminated samples, the average span of the crystallization product samples is 1.18 (standard deviation = 0.50). At the extreme of this range was the case of Xi,p = 6.78 mol%, where the span of the distribution is 2.19. We hypothesise that, as these particles are very fine needles (Figure 8f), breakage occurs during the sample dispersion for measurement, which results in a bi-modal particle size distribution (Figure S8f) and hence a large value for the span.The agitated slurry slightly decreased the size of the crystals for all samples across the series. (Figure 10b). The CE diameter D50 of the impurity-free sample decreased from 64.1 μm to 51.5 μm. Whilst the metacetamol concentration of the most contaminated sample has decreased from 6.78 mol% to 1.54 mol%, the CE diameter D50 has also decreased slightly, from 49.9 μm to 46.8 μm.
3.2.4. Crystal Morphology
Paracetamol crystallized in the absence of impurity has a relatively prismatic morphology, as seen in Figure 1a. It is known that the addition of metacetamol to crystallizing solutions of paracetamol changes the particle morphology from a prismatic to a columnar-type shape [7,31]. This is also observed in our work, evidenced by the microscopy images (Figure 8). This elongation of the crystal shape was also observed in this work when acetanilide was added.
This impurity-induced morphology change is quantified in Figure 11a, where the number weighted aspect ratio D50 of the aspect ratio distribution is shown as a function of the impurity concentration, Xi,F. An aspect ratio D50 value of 0.695 for paracetamol crystals grown in the absence of impurity indicates non-equant, however certainly not elongated, morphology. The addition of increasing amounts of impurity to the crystallization feed lowers the median aspect ratio of the resulting isolated crystals, complementing the microscopy images previously captured. The effect of metacetamol and acetanilide appears to be approximately equal. In a sample with acetanilide where Xi,F = 0.79 mol%, the mean aspect ratio had decreased to 0.452, and in a sample with metacetamol where Xi,F = 1.01 mol%, this value was 0.490. This effect is also seemingly irrespective of the polymorph crystallized; the crystallized Form II paracetamol also has a decreased median aspect ratio compared with pure component Form I ( ![Crystals 11 01344 i003]() , Figure 11a). It is noted here that crystals with the highest Xi,F (6.78 mol%) of metacetamol were very fragile needles (Figure 8f) and were damaged during the compressed air dispersion required for particle-shape distribution analysis, even when low energy dispersion techniques were used, and so the aspect ratio value obtained for this sample may be substantially higher than the actual one.
, Figure 11a). It is noted here that crystals with the highest Xi,F (6.78 mol%) of metacetamol were very fragile needles (Figure 8f) and were damaged during the compressed air dispersion required for particle-shape distribution analysis, even when low energy dispersion techniques were used, and so the aspect ratio value obtained for this sample may be substantially higher than the actual one.
, Figure 11a). It is noted here that crystals with the highest Xi,F (6.78 mol%) of metacetamol were very fragile needles (Figure 8f) and were damaged during the compressed air dispersion required for particle-shape distribution analysis, even when low energy dispersion techniques were used, and so the aspect ratio value obtained for this sample may be substantially higher than the actual one.An elongated morphology is not ideal for downstream processing and the manufacturability of a crystallization product. Extreme aspect ratio crystals do not flow well, hinder filtration and, as observed with the extremely elongated case in this work, are very fragile. Whilst the reslurry process performed to enhance crystal purity did not have a significant effect on particle size, microscopy images of the isolated material seemed to indicate a morphology change (Figures S10–S13). Indeed, analysis of the shape information obtained from the analysis performed showed that along with the purity enhancement, the median aspect ratio of the crystals increased (Figure 11b).
4. Discussion
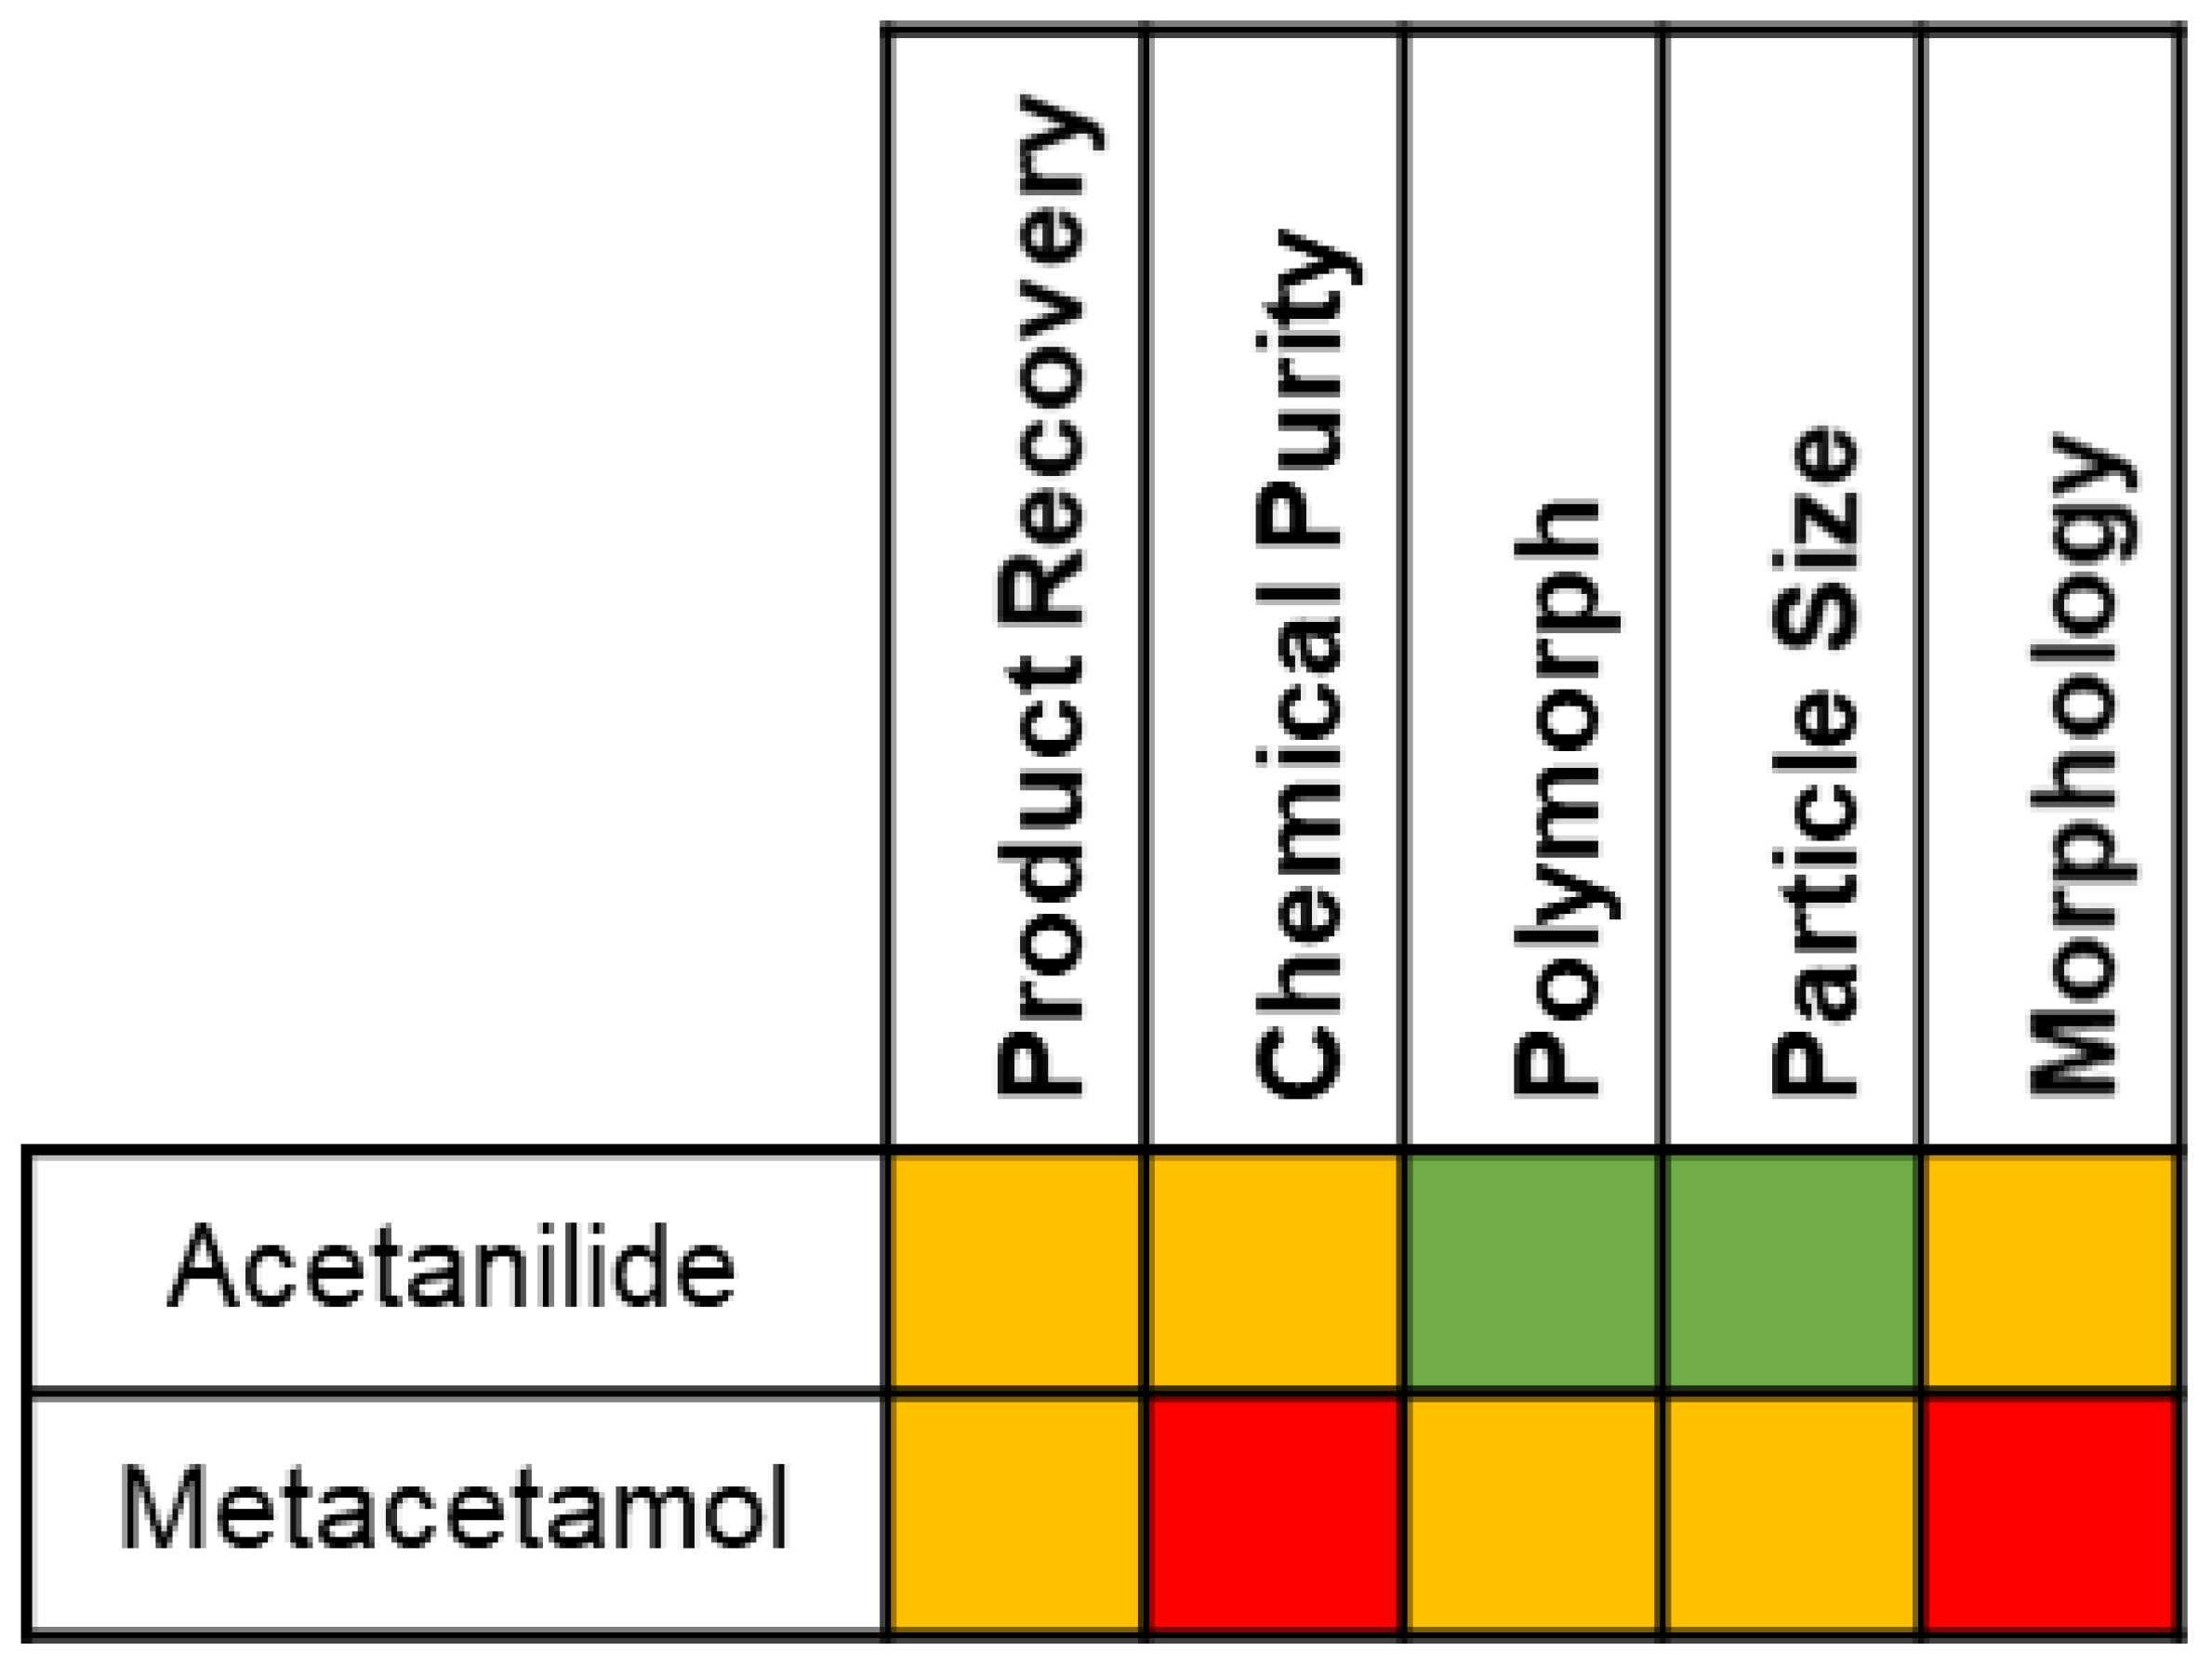
The measured influence of acetanilide and metacetamol on the crystallization of paracetamol and subsequent product attributes is summarized in Figure 12. In general, the presence of metacetamol has a more significant negative effect on the aspects measured than acetanilide.
No effect was observed of acetanilide on the time to nucleation at S = 2.10, but high concentrations lowered product recovery to 79.5% of the maximum theoretical yield, ca. 15% lower than where no impurity was present. Should this crystallization process be scaled up, this discrepancy would represent a substantial loss of material. The implementation of mother liquor recycles could be used in this case to improve product recovery [35]; however, this has also been shown to lead to impurity build-up over multiple cycles and may ultimately have an adverse effect on product purity [36].
Although the majority of the impurity preferred the solution over the solid in the crystallization process, the purity of the crystallization product was decreased by the presence of acetanilide in the crystallization feed. These contaminated crystals also had an elongated shape. Reslurrying the product improved both the chemical purity and the measured aspect ratio. This increase in purity in particular is consistent with our previous report that acetanilide is incorporated into paracetamol through adhesion to the outside of the crystal present only at the surface of contaminated particles [3]. In further support of this conclusion, the binary phase diagram and Tammann triangle plot did not reveal any significant solid-state interactions which would indicate thermodynamic impurity incorporation.
When high concentrations of metacetamol were added, nucleation events were detected during the calculated 95% probability window. Due to the limited number of experiments carried out here, no conclusions on the effect of these impurities on paracetamol nucleation can be drawn. As with acetanilide, the product recovery decreased with increasing metacetamol concentration, which could result in substantial product loss at scale.
Metacetamol contaminates the crystallization product to a much greater extent than acetanilide. The poor rejection of metacetamol from the growing paracetamol Form I crystals is due to thermodynamic substitution into the lattice. This is apparently specific to the monoclinic Form I paracetamol polymorph and manifests as a distortion of the unit-cell parameters. Interestingly, although acting as a Form II template, metacetamol does not incorporate into the Form II crystal product, leading to an enhanced impurity rejection where this metastable form is initially isolated. Therefore, a possible route to purify metacetamol-contaminated paracetamol is to use process conditions which would isolate paracetamol Form II in the first instance and then reslurry the bulk Form II in impurity-free 2-propanol saturated with paracetamol, which would result in high-purity Form I.
Where metacetamol contamination was at its highest, at Xi,P = 6.78 mol%, the crystals isolated were significantly smaller and had a needle-like morphology. Davey and Cruz-Cabeza recently reported that growth along the {011} plane determines the width of a paracetamol crystal grown from 2-propanol and is inhibited by the presence of metacetamol in the crystallising solution [32]. This ties in well with the observed disruption along the {011} plane of the paracetamol crystal lattice in the presence of metacetamol. This particular sample experienced the highest increase in purity with reslurrying, to 98.5 mol%, indicating that the majority of the impurity was present in the surface of the crystals. In this specific case, the size and shape modifications provided a greater surface area in contact with the impurity-rich solution phase; this contributed to increased product contamination. This also indicates that in this case, metacetamol is incorporated through both surface adhesion and thermodynamic substitution mechanisms concurrently.
Changes to crystal morphology were observed across both experimental series, seemingly irrespective of the impurity identity. Acetanilide and metacetamol have very similar molecular structures, with the only difference being the absence of the hydroxyl group on acetanilide (Figure 1). Therefore, it is proposed that this shape modification is not due to H-bonding interactions through this group but is rather due to interactions of the amide group with the growing crystal surface. However, further work is required to support this. The unexpected decrease in particle size with reslurrying can be explained by the accompanying increase aspect ratio. One dimension has decreased, but another has increased, so the volume (and therefore mass) of the crystal remains constant.
Overall, the observed effects of metacetamol and acetanilide on the crystallization and product attributes support a conclusion of molecular interactions causing disruption during the crystal growth phase. A general suppression and slowing of the overall rate of growth would account for the lower yield over the same time frame. Specifically, the inhibition of growth along the {011} face causes the shape change from prismatic to needle-like. It is important to note that this decrease in growth rate will decrease the rate of de-supersaturation and could also induce significant secondary nucleation. However due to a unimodal particle size distribution (Figures S8 and S9) and the absence of agglomeration (Figure 9), we believe that this type of nucleation does not contribution significantly to the overall process. Specific examination of the exact interactions responsible for this growth disruption will be the subject of future studies.
This paper shows that impurities can have different impacts on the crystallization process and the crystal product quality aspects. This is due to the different underlying mechanisms of impurity rejection. Therefore, it is important to consider impurity rejection as part of the overall crystallization process design through, for instance, the recently proposed impurity rejection workflow [3].
5. Conclusions
Acetanilide and metacetamol have a measurable influence on the crystallization and subsequent product attributes of paracetamol. Some acetanilide becomes incorporated into the crystallization product through kinetic mechanisms; however, the purity can be increased to being within specified limits by reslurry. Metacetamol is more poorly rejected, and significant amounts are incorporated into the crystallization product through a mixture of surface effects and lattice substitution. Approximately 1 mol% was substituted into the crystal lattice, which distorted the unit-cell dimensions. Where metacetamol acted as a Form II template, purity of the product after crystallization increased. This metastable product can easily be converted to the desired stable form by a solvent-mediated transformation, offering a route to highly pure paracetamol where high concentrations of this miscible impurity are present in the crystallization feed. Due to the presence of the impurity, the Form I particle morphology was modified, seemingly irrespective of whether acetanilide or metacetamol was present. In the most extreme case, fine needles of paracetamol were obtained. This problematic morphology can be improved by a reslurrying of the crystallization product. The mechanism of the morphology change is currently under investigation. The systematic methodology presented here can be taken and applied to a range of other crystallizations to better understand the global influence of impurities on the process and product quality.
Supplementary Materials
The following are available online at https://0-www-mdpi-com.brum.beds.ac.uk/article/10.3390/cryst11111344/s1: Figures S1, Induction time as a function of initial impurity concentration. Figure S2, Van’t Hoff solubility plot of paracetamol in 2-propanol. Figure S3, Product recovery as a function of initial impurity concentration, from crystallizations nucleated at σ = 2.10. Figure S4, XRPD of crystallized paracetamol from 2-propanol in the presence of metacetamol. Figure S5, XRPD of crystallized paracetamol from 2-propanol in the presence of acetanilide. Figure S6, CE Diameter measurements of paracetamol crystals grown under the same conditions without added impurity and the same crystals after slurrying. Figure S7, CE Diameter measurements of paracetamol Form II crystals contaminated with 1.35 mol% metacetamol and the stable Form I product formed after slurrying, contaminated with 0.81 mol% metacetamol. Figure S8, CE Diameter (Volume) measurements of PCM contaminated with MET after crystallizations, then after reslurrying. Figure S9, CE Diameter (Volume) measurements of PCM contaminated with ACE after crystallizations, then after reslurrying. Figure S10, Microscopy images of PCM contaminated with MET after crystallizations, then after reslurrying. Figure S11, Microscopy images of PCM contaminated with MET after crystallizations, then after reslurrying. Figure S12, Microscopy images of PCM contaminated with ACE after crystallizations, then after reslurrying. Figure S13, Microscopy images of PCM contaminated with ACE after crystallizations, then after reslurrying. Figure S14, Elongation measurements (Malvern Morphologi G3) of PCM contaminated with MET after crystallizations, then after reslurrying. Figure S15, Elongation measurements (Malvern Morphologi G3) of PCM contaminated with ACE after crystallizations, then after reslurrying. Table S1, Summary of paracetamol cooling crystallizations from 2-propanol in the presence of metacetamol or acetanilide. Table S2, Comparative 2Theta peak position at the maximum of the 7 most intense peaks in the XRPD patterns of paracetamol crystallized from 2-propanol in the presence of either metacetamol or acetanilide. Table S3, Unit-cell dimensions determined from Pawley refinements of XRPD patterns of paracetamol crystallized from 2-propanol in the presence of either metacetamol or acetanilide. Table S4, Comparative span measurements from PSD distributions of crystallization and slurry product.
Author Contributions
S.J.U. devised and performed the solubility and crystallization experiments, analyzed product attributes and co-wrote the manuscript. S.Y. performed the solubility experiments and determined the PCM-ACE phase diagram and Tamann triangle. I.H. managed the project and collaborative interactions and gave valuable scientific advice. J.H.t.H. designed and supervised the study and co-wrote the manuscript. All authors have read and agreed to the published version of the manuscript.
Funding
This research was funded by EPSRC, Centre for Innovative Manufacturing for Continuous Manufacturing and Crystallization (CMAC) (Grant ref. EP/I033459/1) and the CMAC Tier 1 companies GlaxoSmithKline, AstraZeneca, Novartis, Bayer AG, Eli Lilly and Company, Takeda, Roche and Pfizer. The work was carried out in the CMAC National Facility, housed within the University of Strathclyde’s Technology and Innovation Centre and funded with a UKRPIF (UK Research Partnership Institute Fund) capital award, SFC ref. H13054, from the Higher Education Funding Council for England (HEFCE).
Institutional Review Board Statement
Not applicable.
Informed Consent Statement
Not applicable.
Data Availability Statement
Not applicable.
Acknowledgments
The authors thank Alan Martin of the CMAC National Facility for his assistance in processing the XRPD data.
Conflicts of Interest
The authors declare no competing financial interest.
References
- Ter Horst, J.H.; Schmidt, C.; Ulrich, J. Handbook of Crystal Growth, 2nd ed.; Elsevier, B.V.: Amsterdam, The Netherlands, 2015; pp. 1317–1349. [Google Scholar]
- European Medicines Agency. Impurities in New Drug Products (Q3B(R2)). In Proceeding of International Conference on Harmonisation of Technical Requirements for Registration of Pharmaceuticals from Human Use. Available online: https://www.ema.europa.eu/en/ich-q3b-r2-impurities-new-drug-products (accessed on 20 September 2021).
- Urwin, S.J.; Levilain, G.; Marziano, I.; Merritt, J.M.; Houson, I.; Ter Horst, J.H. A Structured Approach to Cope with Impurities during Industrial Crystallization Development. Org. Process. Res. Dev. 2020, 24, 1443–1456. [Google Scholar] [CrossRef] [PubMed]
- Moynihan, H.A.; Horgan, D.E. Impurity Occurrence and Removal in Crystalline Products from Process Reactions. Org. Process. Res. Dev. 2017, 21, 689–704. [Google Scholar] [CrossRef]
- Darmali, C.; Mansouri, S.; Yazdanpanah, N.; Woo, M.W. Mechanisms and Control of Impurities in Continuous Crystallization: A Review. Ind. Eng. Chem. Res. 2018, 58, 1463–1479. [Google Scholar] [CrossRef]
- Nguyen, T.T.H.; Khan, A.; Bruce, L.M.; Forbes, C.; O’Leary, R.L.; Price, C.J. The Effect of Ultrasound on the Crystallization of Paracetamol in the Presence of Structurally Similar Impurities. Crystals 2017, 7, 294. [Google Scholar] [CrossRef] [Green Version]
- Hendriksen, B.A.; Grant, D.J.W.; Meenan, P.; Green, D.A. Crystallization of paracetamol (acetaminophen) in the presence of structurally related substances. J. Cryst. Growth 1998, 183, 629–640. [Google Scholar] [CrossRef]
- Lee, A.Y.; Erdemir, D.; Myerson, A.S. Crystal Polymorphism in Chemical Process Development. Annu. Rev. Chem. Biomol. Eng. 2011, 2, 259–280. [Google Scholar] [CrossRef] [PubMed]
- Agnew, L.R.; Cruickshank, D.L.; McGlone, T.; Wilson, C.C. Controlled production of the elusive metastable form II of acetaminophen (paracetamol): A fully scalable templating approach in a cooling environment. Chem. Commun. 2016, 52, 7368–7371. [Google Scholar] [CrossRef] [PubMed] [Green Version]
- Qian, G.; Wu, Y.; Yang, X.; Duan, X.; Zhou, X. Effect of polymorphism on the purity of l-glutamic acid. J. Cryst. Growth 2013, 373, 78–81. [Google Scholar] [CrossRef]
- Tanoury, G.J.; Hett, R.; Kessler, D.W.; Wald, S.A.; Senanayake, C.H. Taking Advantage of Polymorphism To Effect an Impurity Removal: Development of a Thermodynamic Crystal Form of (R,R)-Formoterol Tartrate. Org. Process. Res. Dev. 2002, 6, 855–862. [Google Scholar] [CrossRef]
- Black, S.; Cuthbert, M.W.; Roberts, R.J.; Stensland, B. Increased Chemical Purity Using a Hydrate. Cryst. Growth Des. 2004, 4, 539–544. [Google Scholar] [CrossRef]
- Ter Horst, J.H.; van Rosmalen, R.M.; Geertman, R.M. Additives: Molecular Design. In Encyclopedia of Separation Science; Academic Press: Cambridge, MA, USA, 2000; pp. 931–940. [Google Scholar]
- Gu, C.; Grant, D.J.W. Relationship Between Particle Size and Impurity Incorporation During Crystallization of (+)-Pseudoephedrine Hydrochloride, Acetaminophen, and Adipic Acid from Aqueous Solution. Pharm. Res. 2002, 19, 1068–1070. [Google Scholar] [CrossRef] [PubMed]
- Steendam, R.R.E.; Keshavarz, L.; de Souza, B.P.; Frawley, P.J. Thermodynamic properties of paracetamol impurities 4-nitrophenol and 4″-chloroacetanilide and the impact of such impurities on the crystallization of paracetamol from solution. J. Chem. Thermodyn. 2019, 133, 85–92. [Google Scholar] [CrossRef]
- MacLeod, C.S.; Muller, F. On the Fracture of Pharmaceutical Needle-Shaped Crystals during Pressure Filtration: Case Studies and Mechanistic Understanding. Org. Process. Res. Dev. 2012, 16, 425–434. [Google Scholar] [CrossRef]
- Thomas, L.H.; Wales, C.; Zhao, L.; Wilson, C.C. Paracetamol Form II: An Elusive Polymorph through Facile Multicomponent Crystallization Routes. Cryst. Growth Des. 2011, 11, 1450–1452. [Google Scholar] [CrossRef]
- Agnew, L.R.; McGlone, T.; Wheatcroft, H.P.; Robertson, A.; Parsons, A.R.; Wilson, C.C. Continuous Crystallization of Paracetamol (Acetaminophen) Form II: Selective Access to a Metastable Solid Form. Cryst. Growth Des. 2017, 17, 2418–2427. [Google Scholar] [CrossRef]
- Gaisford, S.; Buanz, A.B.; Jethwa, N. Characterisation of paracetamol form III with rapid-heating DSC. J. Pharm. Biomed. Anal. 2010, 53, 366–370. [Google Scholar] [CrossRef] [PubMed]
- Telford, R.; Seaton, C.C.; Clout, A.; Buanz, A.; Gaisford, S.; Williams, G.R.; Prior, T.J.; Okoye, C.H.; Munshi, T.; Scowen, I.J. Stabilisation of metastable polymorphs: The case of paracetamol form III. Chem. Commun. 2016, 52, 12028–12031. [Google Scholar] [CrossRef] [PubMed] [Green Version]
- Nichols, G.; Frampton, C.S. Physicochemical Characterization of the Orthorhombic Polymorph of Paracetamol Crystallized from Solution. J. Pharm. Sci. 1998, 87, 684–693. [Google Scholar] [CrossRef] [PubMed]
- Xiao, Y.; Tang, S.K.; Hao, H.; Davey, R.J.; Vetter, T. Quantifying the Inherent Uncertainty Associated with Nucleation Rates Estimated from Induction Time Data Measured in Small Volumes. Cryst. Growth Des. 2017, 17, 2852–2863. [Google Scholar] [CrossRef] [Green Version]
- Jiang, S.; ter Horst, J.H. Crystal Nucleation Rates from Probability Distributions of Induction Times. Cryst. Growth Des. 2010, 11, 256–261. [Google Scholar] [CrossRef]
- Kulkarni, S.A.; Kadam, S.S.; Meekes, H.; Stankiewicz, A.I.; ter Horst, J.H. Crystal Nucleation Kinetics from Induction Times and Metastable Zone Widths. Cryst. Growth Des. 2013, 13, 2435–2440. [Google Scholar] [CrossRef]
- De Wet, F.N.; Gerber, J.J.; Lötter, A.P.; Van der Watt, J.G.; Dekker, T.G. A study of the changes during heating of paracetamol. Drug Dev. Ind. Pharm. 1998, 24, 447–453. [Google Scholar] [CrossRef] [PubMed]
- Granberg, R.A.; Rasmuson, C. Solubility of Paracetamol in Pure Solvents. J. Chem. Eng. Data 1999, 44, 1391–1395. [Google Scholar] [CrossRef]
- Rycerz, L. Practical remarks concerning phase diagrams determination on the basis of differential scanning calorimetry measurements. J. Therm. Anal. Calorim. 2013, 113, 231–238. [Google Scholar] [CrossRef] [Green Version]
- Brown, C.J. McGlone, T. Yerdelen, S. Srirambhatla, V. Mabbott, F. Gurung, R. Briuglia, M.L. Ahmed, B. Polyzois, H. McGinty, J.; et al. Enabling precision manufacturing of active pharmaceutical ingredients: Workflow for seeded cooling continuous crystallizations. Mol. Syst. Des. Eng. 2018, 3, 518–549. [Google Scholar] [CrossRef] [Green Version]
- Keshavarz, L.; Steendam, R.R.E.; Blijlevens, M.A.R.; Pishnamazi, M.; Frawley, P.J. Influence of Impurities on the Solubility, Nucleation, Crystallization, and Compressibility of Paracetamol. Cryst. Growth Des. 2019, 19, 4193–4201. [Google Scholar] [CrossRef]
- Hendriksen, B.A.; Grant, D.J. The effect of structurally related substances on the nucleation kinetics of paracetamol (acetaminophen). J. Cryst. Growth 1995, 156, 252–260. [Google Scholar] [CrossRef]
- Saleemi, A.; Onyemelukwe, I.I.; Nagy, Z. Effects of a structurally related substance on the crystallization of paracetamol. Front. Chem. Sci. Eng. 2013, 7, 79–87. [Google Scholar] [CrossRef]
- Liu, Y.; Gabriele, B.; Davey, R.J.; Cruz-Cabeza, A.J. Concerning Elusive Crystal Forms: The Case of Paracetamol. J. Am. Chem. Soc. 2020, 142, 6682–6689. [Google Scholar] [CrossRef]
- Perrin, M.-A.; Neumann, M.A.; Elmaleh, H.; Zaske, L. Crystal structure determination of the elusive paracetamol Form III. Chem. Commun. 2009, 22, 3181–3183. [Google Scholar] [CrossRef]
- Haisa, M.; Kashino, S.; Maeda, H. The orthorhombic form of p-hydroxyacetanilide. Acta Crystallogr. Sect. B Struct. Crystallogr. Cryst. Chem. 1974, 30, 2510–2512. [Google Scholar] [CrossRef]
- Cesar, M.A.B.; Ng, K.M. Improving Product Recovery in Fractional Crystallization Processes: Retrofit of an Adipic Acid Plant. Ind. Eng. Chem. Res. 1999, 38, 823–832. [Google Scholar] [CrossRef]
- Alvarez, A.J.; Singh, A.; Myerson, A.S. Crystallization of Cyclosporine in a Multistage Continuous MSMPR Crystallizer. Cryst. Growth Des. 2011, 11, 4392–4400. [Google Scholar] [CrossRef]
Figure 1.
Chemical structures of compounds used here.

Figure 2.
(a) Temperature-dependent solubility of paracetamol in 2-propanol from clear point temperature measurements ( ![Crystals 11 01344 i001]() ) and compared with published gravimetric values (
) and compared with published gravimetric values ( ![Crystals 11 01344 i012]() ). (b) Probability distribution of induction times for paracetamol in 2-propanol at a supersaturation ratio S = 2.10 resulting in a growth time tg = 24 ± 4 s, a nucleation rate J = 1376 ± 17 m−3 s−1 and median induction time tind = 480 s.
). (b) Probability distribution of induction times for paracetamol in 2-propanol at a supersaturation ratio S = 2.10 resulting in a growth time tg = 24 ± 4 s, a nucleation rate J = 1376 ± 17 m−3 s−1 and median induction time tind = 480 s.
 ) and compared with published gravimetric values (
  ). (b) Probability distribution of induction times for paracetamol in 2-propanol at a supersaturation ratio S = 2.10 resulting in a growth time tg = 24 ± 4 s, a nucleation rate J = 1376 ± 17 m−3 s−1 and median induction time tind = 480 s.
Figure 2.
(a) Temperature-dependent solubility of paracetamol in 2-propanol from clear point temperature measurements ( ![Crystals 11 01344 i001]() ) and compared with published gravimetric values (
) and compared with published gravimetric values ( ![Crystals 11 01344 i012]() ). (b) Probability distribution of induction times for paracetamol in 2-propanol at a supersaturation ratio S = 2.10 resulting in a growth time tg = 24 ± 4 s, a nucleation rate J = 1376 ± 17 m−3 s−1 and median induction time tind = 480 s.
). (b) Probability distribution of induction times for paracetamol in 2-propanol at a supersaturation ratio S = 2.10 resulting in a growth time tg = 24 ± 4 s, a nucleation rate J = 1376 ± 17 m−3 s−1 and median induction time tind = 480 s.
) and compared with published gravimetric values ( ). (b) Probability distribution of induction times for paracetamol in 2-propanol at a supersaturation ratio S = 2.10 resulting in a growth time tg = 24 ± 4 s, a nucleation rate J = 1376 ± 17 m−3 s−1 and median induction time tind = 480 s.
Figure 3.
Product purity Xp of paracetamol crystallized from 2-propanol as a function of the impurity concentration Xi,F in the feed solution. ( ![Crystals 11 01344 i002]() ) Paracetamol in presence of metacetamol, linear regression Xp = −0.735 Xi,F + 100.39, R2 = 0.998. (
) Paracetamol in presence of metacetamol, linear regression Xp = −0.735 Xi,F + 100.39, R2 = 0.998. ( ![Crystals 11 01344 i006]() ) Paracetamol in the presence of acetanilide, linear regression Xp = −0.141 Xi,F + 99.9, R2 = 0.999. (
) Paracetamol in the presence of acetanilide, linear regression Xp = −0.141 Xi,F + 99.9, R2 = 0.999. ( ![Crystals 11 01344 i003]() ) Paracetamol in presence of metacetamol where Form II was crystallized. (
) Paracetamol in presence of metacetamol where Form II was crystallized. ( ![Crystals 11 01344 i013]() ) denotes the specification of 99.5 mol% product purity. All experimental solutions nucleated at a supersaturation S = 2.10. Error bars denote the standard error.
) denotes the specification of 99.5 mol% product purity. All experimental solutions nucleated at a supersaturation S = 2.10. Error bars denote the standard error.
 ) Paracetamol in presence of metacetamol, linear regression Xp = −0.735 Xi,F + 100.39, R2 = 0.998. (
  ) Paracetamol in the presence of acetanilide, linear regression Xp = −0.141 Xi,F + 99.9, R2 = 0.999. ( ) Paracetamol in presence of metacetamol where Form II was crystallized. (
  ) denotes the specification of 99.5 mol% product purity. All experimental solutions nucleated at a supersaturation S = 2.10. Error bars denote the standard error.
Figure 3.
Product purity Xp of paracetamol crystallized from 2-propanol as a function of the impurity concentration Xi,F in the feed solution. ( ![Crystals 11 01344 i002]() ) Paracetamol in presence of metacetamol, linear regression Xp = −0.735 Xi,F + 100.39, R2 = 0.998. (
) Paracetamol in presence of metacetamol, linear regression Xp = −0.735 Xi,F + 100.39, R2 = 0.998. ( ![Crystals 11 01344 i006]() ) Paracetamol in the presence of acetanilide, linear regression Xp = −0.141 Xi,F + 99.9, R2 = 0.999. (
) Paracetamol in the presence of acetanilide, linear regression Xp = −0.141 Xi,F + 99.9, R2 = 0.999. ( ![Crystals 11 01344 i003]() ) Paracetamol in presence of metacetamol where Form II was crystallized. (
) Paracetamol in presence of metacetamol where Form II was crystallized. ( ![Crystals 11 01344 i013]() ) denotes the specification of 99.5 mol% product purity. All experimental solutions nucleated at a supersaturation S = 2.10. Error bars denote the standard error.
) denotes the specification of 99.5 mol% product purity. All experimental solutions nucleated at a supersaturation S = 2.10. Error bars denote the standard error.
) Paracetamol in presence of metacetamol, linear regression Xp = −0.735 Xi,F + 100.39, R2 = 0.998. ( ) Paracetamol in the presence of acetanilide, linear regression Xp = −0.141 Xi,F + 99.9, R2 = 0.999. ( ) Paracetamol in presence of metacetamol where Form II was crystallized. ( ) denotes the specification of 99.5 mol% product purity. All experimental solutions nucleated at a supersaturation S = 2.10. Error bars denote the standard error.
Figure 4.
Paracetamol crystal purity before (Xp) and after (Xp,s) the reslurry process, as measured by HPLC. ( ![Crystals 11 01344 i002]() ) Paracetamol in presence of metacetamol. (
) Paracetamol in presence of metacetamol. ( ![Crystals 11 01344 i006]() ) Paracetamol in the presence of acetanilide. (
) Paracetamol in the presence of acetanilide. ( ![Crystals 11 01344 i003]() ) Paracetamol in presence of metacetamol where Form II was crystallized. The diagonal line (
) Paracetamol in presence of metacetamol where Form II was crystallized. The diagonal line ( ![Crystals 11 01344 i004]() ) is added for comparison of purifications. Error bars denote standard error.
) is added for comparison of purifications. Error bars denote standard error.
) Paracetamol in presence of metacetamol. ( ) Paracetamol in the presence of acetanilide. ( ) Paracetamol in presence of metacetamol where Form II was crystallized. The diagonal line (  ) is added for comparison of purifications. Error bars denote standard error.
Figure 4.
Paracetamol crystal purity before (Xp) and after (Xp,s) the reslurry process, as measured by HPLC. ( ![Crystals 11 01344 i002]() ) Paracetamol in presence of metacetamol. (
) Paracetamol in presence of metacetamol. ( ![Crystals 11 01344 i006]() ) Paracetamol in the presence of acetanilide. (
) Paracetamol in the presence of acetanilide. ( ![Crystals 11 01344 i003]() ) Paracetamol in presence of metacetamol where Form II was crystallized. The diagonal line (
) Paracetamol in presence of metacetamol where Form II was crystallized. The diagonal line ( ![Crystals 11 01344 i004]() ) is added for comparison of purifications. Error bars denote standard error.
) is added for comparison of purifications. Error bars denote standard error.
) Paracetamol in presence of metacetamol. ( ) Paracetamol in the presence of acetanilide. ( ) Paracetamol in presence of metacetamol where Form II was crystallized. The diagonal line ( ) is added for comparison of purifications. Error bars denote standard error.
Figure 5.
(a) Binary phase diagram for paracetamol–metacetamol with an average experimental eutectic temperature at 120.7 ± 1.4 °C [3]. (b) Binary phase diagram for paracetamol–acetanilide, with an average experimental eutectic temperature at 98.6 ± 0.3 °C. (c) Tammann triangle for paracetamol–metacetamol. Left-hand-side linear regression H = 249.6XMET − 15.0, R2 = 0.985, XMET -axis intercept = 0.063 ± 0.023. Intersection XMET = 0.620, Enthalpy = 139.8 J g−1 [3]. (d) Tammann triangle for paracetamol–acetanilide. Left-hand-side linear regression H = 170.1XACE + 8.8, R2 = 0.956, XACE-axis intercept = 0.052 ± 0.020. Intersection XACE = 0.713, Enthalpy = 132.2 J g−1.

Figure 6.
XRPD patterns of (a) paracetamol Form I calculated [34], (b) paracetamol Form II calculated [21], (c) paracetamol crystallized in the presence of 7.38 mol% metacetamol and (d) product from reslurry of sample (c).

Figure 7.
Changes in unit-cell dimensions as a function of impurity concentration Xi,p in the Form I solid. Only experiments where paracetamol Form I was isolated are included. (a) Metacetamol, ( ![Crystals 11 01344 i002]() ) a-axis, (
) a-axis, ( ![Crystals 11 01344 i005]() ) b-axis and (
) b-axis and ( ![Crystals 11 01344 i003]() ) c-axis. (b) Acetanilide (
) c-axis. (b) Acetanilide ( ![Crystals 11 01344 i006]() ) a-axis, (
) a-axis, ( ![Crystals 11 01344 i007]() ) b-axis and (
) b-axis and ( ![Crystals 11 01344 i008]() ) c-axis. Reference structure for paracetamol was used from the CCDC to determine length deviation. Error bars denote standard error.
) c-axis. Reference structure for paracetamol was used from the CCDC to determine length deviation. Error bars denote standard error.
) a-axis, (  ) b-axis and ( ) c-axis. (b) Acetanilide ( ) a-axis, (
  ) b-axis and (
  ) c-axis. Reference structure for paracetamol was used from the CCDC to determine length deviation. Error bars denote standard error.
Figure 7.
Changes in unit-cell dimensions as a function of impurity concentration Xi,p in the Form I solid. Only experiments where paracetamol Form I was isolated are included. (a) Metacetamol, ( ![Crystals 11 01344 i002]() ) a-axis, (
) a-axis, ( ![Crystals 11 01344 i005]() ) b-axis and (
) b-axis and ( ![Crystals 11 01344 i003]() ) c-axis. (b) Acetanilide (
) c-axis. (b) Acetanilide ( ![Crystals 11 01344 i006]() ) a-axis, (
) a-axis, ( ![Crystals 11 01344 i007]() ) b-axis and (
) b-axis and ( ![Crystals 11 01344 i008]() ) c-axis. Reference structure for paracetamol was used from the CCDC to determine length deviation. Error bars denote standard error.
) c-axis. Reference structure for paracetamol was used from the CCDC to determine length deviation. Error bars denote standard error.
) a-axis, ( ) b-axis and ( ) c-axis. (b) Acetanilide ( ) a-axis, ( ) b-axis and ( ) c-axis. Reference structure for paracetamol was used from the CCDC to determine length deviation. Error bars denote standard error.
Figure 8.
Selected microscopic images of paracetamol crystals grown in 2-propanol in the presence of acetanilide or metacetamol. See supporting information for full data set. (a) Paracetamol crystallized without impurities, (b) acetanilide, Xi,p = 0.17 mol%, (c) acetanilide, Xi,p = 0.79 mol%, (d) metacetamol, Xi,p = 0.46 mol%, (e) metacetamol, Xi,p = 1.01 mol% and (f) metacetamol, Xi,p = 6.78 mol%.

Figure 9.
Microscopy image of the isolated paracetamol Form II crystals grown in the presence of metacetamol, with Xi,p = 1.35 mol%.
Figure 9.
Microscopy image of the isolated paracetamol Form II crystals grown in the presence of metacetamol, with Xi,p = 1.35 mol%.

Figure 10.
CE diameter D50 measurements of ( ![Crystals 11 01344 i001]() ) paracetamol in absence of impurities, (
) paracetamol in absence of impurities, ( ![Crystals 11 01344 i002]() ) paracetamol contaminated with metacetamol (
) paracetamol contaminated with metacetamol ( ![Crystals 11 01344 i003]() ) paracetamol Form II contaminated with metacetamol and (
) paracetamol Form II contaminated with metacetamol and ( ![Crystals 11 01344 i006]() ) paracetamol contaminated with acetanilide. (a) Crystallization product. (b) Reslurry product.
) paracetamol contaminated with acetanilide. (a) Crystallization product. (b) Reslurry product.
) paracetamol in absence of impurities, ( ) paracetamol contaminated with metacetamol ( ) paracetamol Form II contaminated with metacetamol and ( ) paracetamol contaminated with acetanilide. (a) Crystallization product. (b) Reslurry product.
Figure 11.
Aspect ratio D50 measurements as a function of impurity concentration (a) after crystallization and (b) after product reslurry. ( ![Crystals 11 01344 i001]() ) Paracetamol in absence of impurities, (
) Paracetamol in absence of impurities, ( ![Crystals 11 01344 i002]() ) paracetamol contaminated with metacetamol (
) paracetamol contaminated with metacetamol ( ![Crystals 11 01344 i003]() ) paracetamol Form II (Form I after slurrying) contaminated with metacetamol and (
) paracetamol Form II (Form I after slurrying) contaminated with metacetamol and ( ![Crystals 11 01344 i006]() ) paracetamol contaminated with acetanilide.
) paracetamol contaminated with acetanilide.
) Paracetamol in absence of impurities, ( ) paracetamol contaminated with metacetamol ( ) paracetamol Form II (Form I after slurrying) contaminated with metacetamol and ( ) paracetamol contaminated with acetanilide.
Figure 12.
Summary of influence of acetanilide and metacetamol on the crystallization of paracetamol from 2-propanol. Influence ranges from no effect ( ![Crystals 11 01344 i009]() ), through moderate effect (
), through moderate effect ( ![Crystals 11 01344 i010]() ) to significant negative effect (
) to significant negative effect ( ![Crystals 11 01344 i011]() ).
).
 ), through moderate effect (
  ) to significant negative effect (
  ).
).
Figure 12.
Summary of influence of acetanilide and metacetamol on the crystallization of paracetamol from 2-propanol. Influence ranges from no effect ( ![Crystals 11 01344 i009]() ), through moderate effect (
), through moderate effect ( ![Crystals 11 01344 i010]() ) to significant negative effect (
) to significant negative effect ( ![Crystals 11 01344 i011]() ).
).
), through moderate effect ( ) to significant negative effect ( ).
Publisher’s Note: MDPI stays neutral with regard to jurisdictional claims in published maps and institutional affiliations. |
© 2021 by the authors. Licensee MDPI, Basel, Switzerland. This article is an open access article distributed under the terms and conditions of the Creative Commons Attribution (CC BY) license (https://creativecommons.org/licenses/by/4.0/).
Share and Cite
MDPI and ACS Style
Urwin, S.J.; Yerdelen, S.; Houson, I.; ter Horst, J.H. Impact of Impurities on Crystallization and Product Quality: A Case Study with Paracetamol. Crystals 2021, 11, 1344. https://0-doi-org.brum.beds.ac.uk/10.3390/cryst11111344
AMA Style
Urwin SJ, Yerdelen S, Houson I, ter Horst JH. Impact of Impurities on Crystallization and Product Quality: A Case Study with Paracetamol. Crystals. 2021; 11(11):1344. https://0-doi-org.brum.beds.ac.uk/10.3390/cryst11111344
Chicago/Turabian StyleUrwin, Stephanie J., Stephanie Yerdelen, Ian Houson, and Joop H. ter Horst. 2021. "Impact of Impurities on Crystallization and Product Quality: A Case Study with Paracetamol" Crystals 11, no. 11: 1344. https://0-doi-org.brum.beds.ac.uk/10.3390/cryst11111344
Note that from the first issue of 2016, this journal uses article numbers instead of page numbers. See further details here.