
FE Modelling and Analysis of Beam Column Joint Using Reactive Powder Concrete
by
 , , , and
Afnan Nafees
1, 
Muhammad Faisal Javed
1,*,
Muhammad Ali Musarat
2,
Mujahid Ali
2 ,
,
Fahid Aslam
3 and
Nikolai Ivanovich Vatin
4
1
Department of Civil Engineering, COMSATS University Islamabad, Abbottabad Campus, Abbottabad 22060, Pakistan
2
Department of Civil and Environmental Engineering, Universiti Teknologi PETRONAS, Bandar Seri Iskandar 32610, Perak, Malaysia
3
Department of Civil Engineering, College of Engineering in Al-Kharj, Prince Sattam Bin Abdulaziz University, Al-Kharj 16273, Saudi Arabia
4
Institute of Civil Engineering, Peter the Great St. Petersburg Polytechnic University, 195251 St. Petersburg, Russia
*
Author to whom correspondence should be addressed.
Crystals 2021, 11(11), 1372; https://0-doi-org.brum.beds.ac.uk/10.3390/cryst11111372
Submission received: 20 September 2021
/
Revised: 28 October 2021
/
Accepted: 8 November 2021
/
Published: 11 November 2021
(This article belongs to the Special Issue Advances in Sustainable Concrete System)
Abstract
:Reactive powder concrete (RPC) is used in the beam-column joint region in two out of four frames. Finite element modeling of all specimens is developed by using ABAQUS software. Displacement controlled analysis is used rather than load control analysis to obtain the actual response of the structure. The prepared models were verified by using experimental results. The results showed that using RPC in the joint region increased the overall strength of the structure by more than 10%. Moreover, it also helped in controlling the crack width. Furthermore, using RPC in the joint region increased the ductility of the structures. Comparisons were made by varying the size of the mesh and viscosity parameter values. It was found that by increasing the mesh size and viscosity parameter value, analysis time and the number of steps during analysis were reduced. This study provides a new modeling approach using RPC beam-column joint to predict the behavior and response of structures and to improve the shear strength deformation against different structural loading.
1. Introduction
The beam-column joint is a sensitive and crucial part of a structure, where a failure in it can cause the sudden collapse of a building [1]. It is the most seismically vulnerable component in a structure that is typically designed for gravity loads [2]. Recently, extensive research has been on the behavior of reinforced concrete (RC) beam-column joints brought under monotonic loading [3,4,5]. It was found that many beam-column joints designed with the concept of strong column weak beam concept undergo severe shear force during a seismic event causing joint failure [6].
Shear failures are brittle and more vulnerable causing the catastrophic collapse of structures. To achieve ductile design, ductile material or appropriate reinforcement should be used to improve shear capacity. The latter technique is mostly done by providing stirrups and ties in beams and columns, respectively, with appropriate spacing for good bonding between concrete and reinforcement [7]. Shear capacity can also be enhanced by following various techniques. De Corte and Boel [8] examined the use of rectangular spiral reinforcement (RSR) by testing RC beams under continuous four-point test and results showed increased shear capacity. Yang, Kim [9] explored the effectiveness of Spiral type wire rope as a shear reinforcement by testing three two-span reinforced concrete T-beams in the four-point test under static loading conditions, and results demonstrated increased ductility and controlled crack width. Similarly, Al-Nasra and Asha [10] utilized swimmer bars as transverse reinforcement with three types of connection (weld, bolt, and U-link bolt), and results depicted that it is a convenient method for improving shear strength, ductility, and controlling crack width. Another research by Ghobarah and Said [11] suggested different retrofitting and reinforcing techniques for improving shear resistance of beam-column joints by using concrete jacketing, bolted steel plates, and corrugated steel sheets, etc. [12]. Moreover, Gencoglu and Mobasher [13] concentrated on the use of external steel plates on each side of the column face by bolting it through epoxy bonding and steel angles welded to the plates and the joint region inflamed with concrete fillet in a two-way beam column slab system to provide additional strength to structure against different loadings. As the columns were prefabricated, these approaches were extremely beneficial in terms of construction time. All these methods were very effective in enhancing the shear strength of a beam-column joint, but such techniques are neither cost-effective nor time-efficient.
Reactive powder concrete (RPC) exhibiting strain hardening processes can be utilized to improve beam-column joint strength. During the 1990s, ultra high strength performance mortar known as reactive powder concrete was developed having the compressive strength of 200 MPa [14]. The RPC concept was first developed in 1990 by P. Richard and M. Cheyrezy [15]. It was first utilized in 1997 for the construction of the Sherbrooke bridge in Canada [16]. RPC provides many advanced and high strength and ductility properties in comparison to conventional concrete [17]. RPC constituents include cement, sand, silica fumes, quartz powder, superplasticizers, and steel fibers (optional) [18]. The compressive strength of the RPC used in high prestressed bridge girders is more than 200 MPa while its flexural strength is 50 MPa with high workability. Moreover, it possesses strong ductility and energy absorption characteristics [19]. These properties of RPC make it a significant material. Therefore, RPC is widely used in the construction industry for the construction of different structures like prestressed girders, sewer pipes, blast resistance structures, and high-pressure pipes [20]. Experimental investigation on RPC showed significant improvement in the strength, ductility, strain capacity, and energy dissipation of structures. Furthermore, during the uniaxial compression test, RPC sustained a significant amount of load after initial cracking [21]. The presence of silica fumes and fine particles in the material provides pozzolanic characteristics, agitating the hydration reaction and increasing strength [14]. RPC sometimes shows brittle behavior due to its ultra-high strength. This can be mitigated by adding steel fibers. RPC is gaining momentum and recently has been used in a number of construction fields including bridge erection, mining engineering and high-rise buildings [22,23].
RPC can be used for retrofitting structures. Al-Jubory [24] evaluated the bond strength and durability of RPC using as a repairing material. The addition of silica fume and quartz powder to RPC improved temperature resistance and rendered the structure impermeable. Furthermore, employing RPC as a retrofitting material increased the structure’s compressive and flexural strength by more than 12%. It was observed that the abrasion coefficient of RPC was 7.58% more than ordinary concrete. Results indicated no drastic declination for RPC which proved it to be more durable than reinforced concrete.
The experimental study was employed on reinforced RPC (having 1% and 2%) with and without steel fibers. On both of these samples, several strength tests were performed, including compressive strength, tensile strength, and flexural strength. It was discovered that the inclusion of steel fibers increases compressive strength, flexural strength, and split tensile strength by more than 10%. Compressive strength for samples without and with reinforcement was 50–67 MPa and 74.5 MPa, respectively. Low values indicated the presence of higher calcium aluminate content. Experimental results showed that RPC has 250 times greater durability and 200% more compressive strength and 150% more flexural strength than conventional and high strength mortar (HSM). Furthermore, RPC has an abrasion coefficient that is eight times that of normal and four times that of HSM. Freeze and thaw cycles have less effect on RPC which makes it more durable. All these factors lead RPC to be one of the best retrofitting materials [25].
RPC has improved material usage in the concrete industry by providing economic benefits and builds considerably strong, efficient, and durable structures. Experimental research on RPC is conducted by many researchers, however, there is little study on modeling of RPC beam-column joints. This research focused on the numerical modeling of RPC beam-column joint besides experimental work. Numerical modeling provided complete diagnoses about the cause and extent of damage to the structures. Moreover, it is an efficient technique, and it is gaining momentum as it is not only cost-effective but also time efficient. The numerical modeling of the beam-column joint was done using ABAQUS software which is capable of simulating the nonlinear behavior and gives more realistic results in comparison to other software. The experimental results obtained were validated against the numerical results.
2. Experimental Investigation
Four triangular frames as shown in Figure 1 were cast and tested under simple monotonic loading for the determination of tensile strength of beam-column joints. Two out of four frames consisted of conventional concrete. RPC was used in the beam-column joint in the remaining two frames.
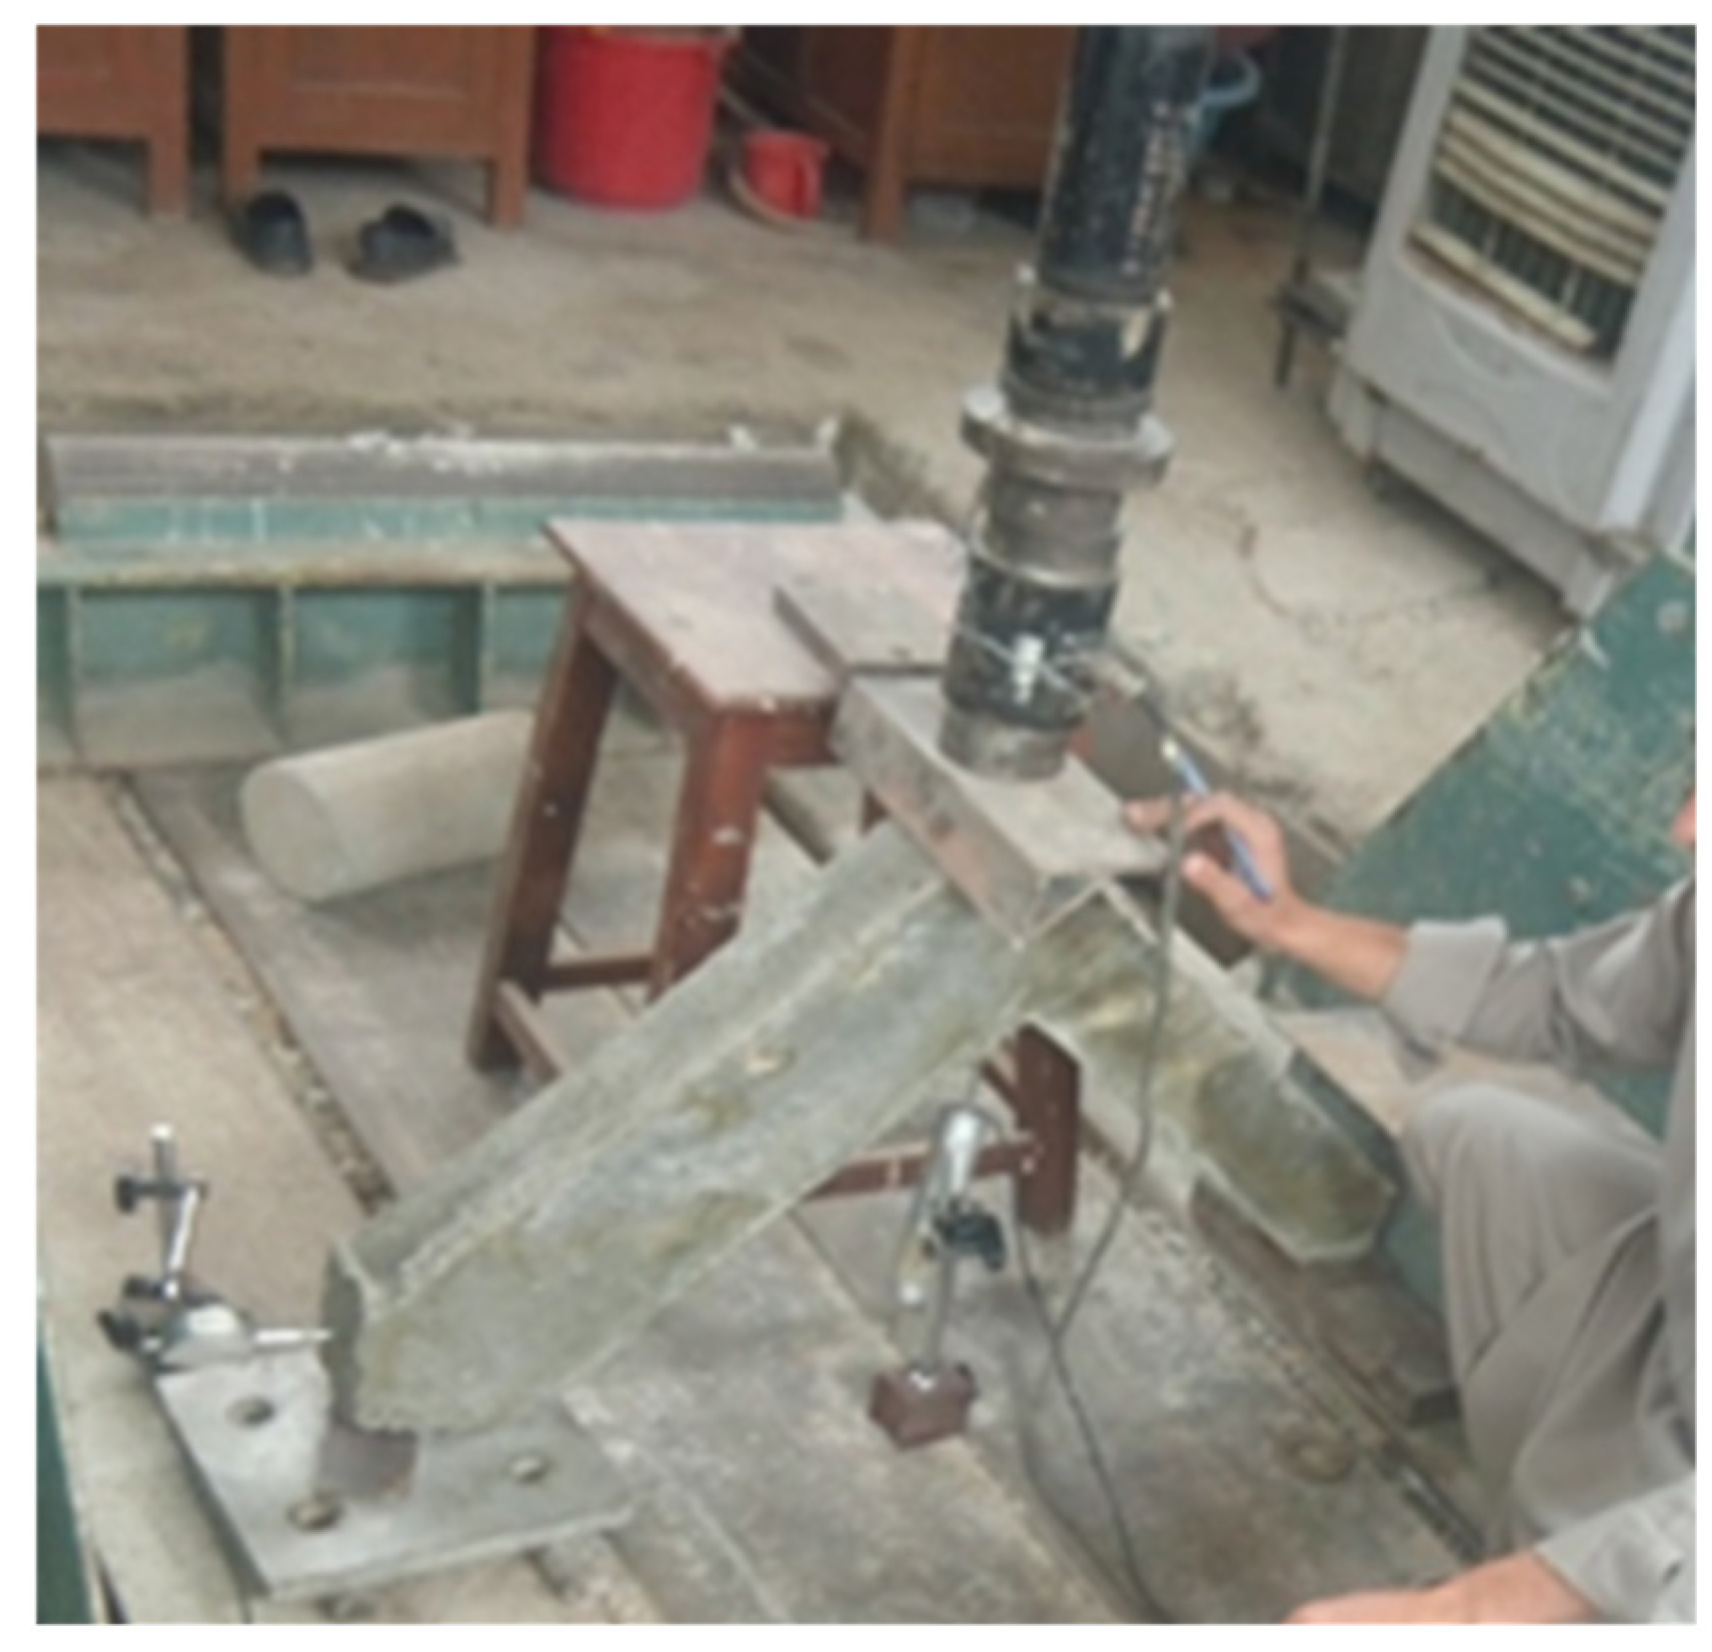
The cross-section and long section details of specimens are shown in Figure 1 and Figure 2. Column and beam dimensions are 4′′ × 4′′ × 24′′ and 4′′ × 6′′ × 24′′, respectively, with a cover of 0.5′′ from all sides. All the frames were brought under a monotonic loading machine for testing. During the application of load, roller support was provided to the beam and the column was kept fixed. Sensors were installed both at the joints and the beam ends.
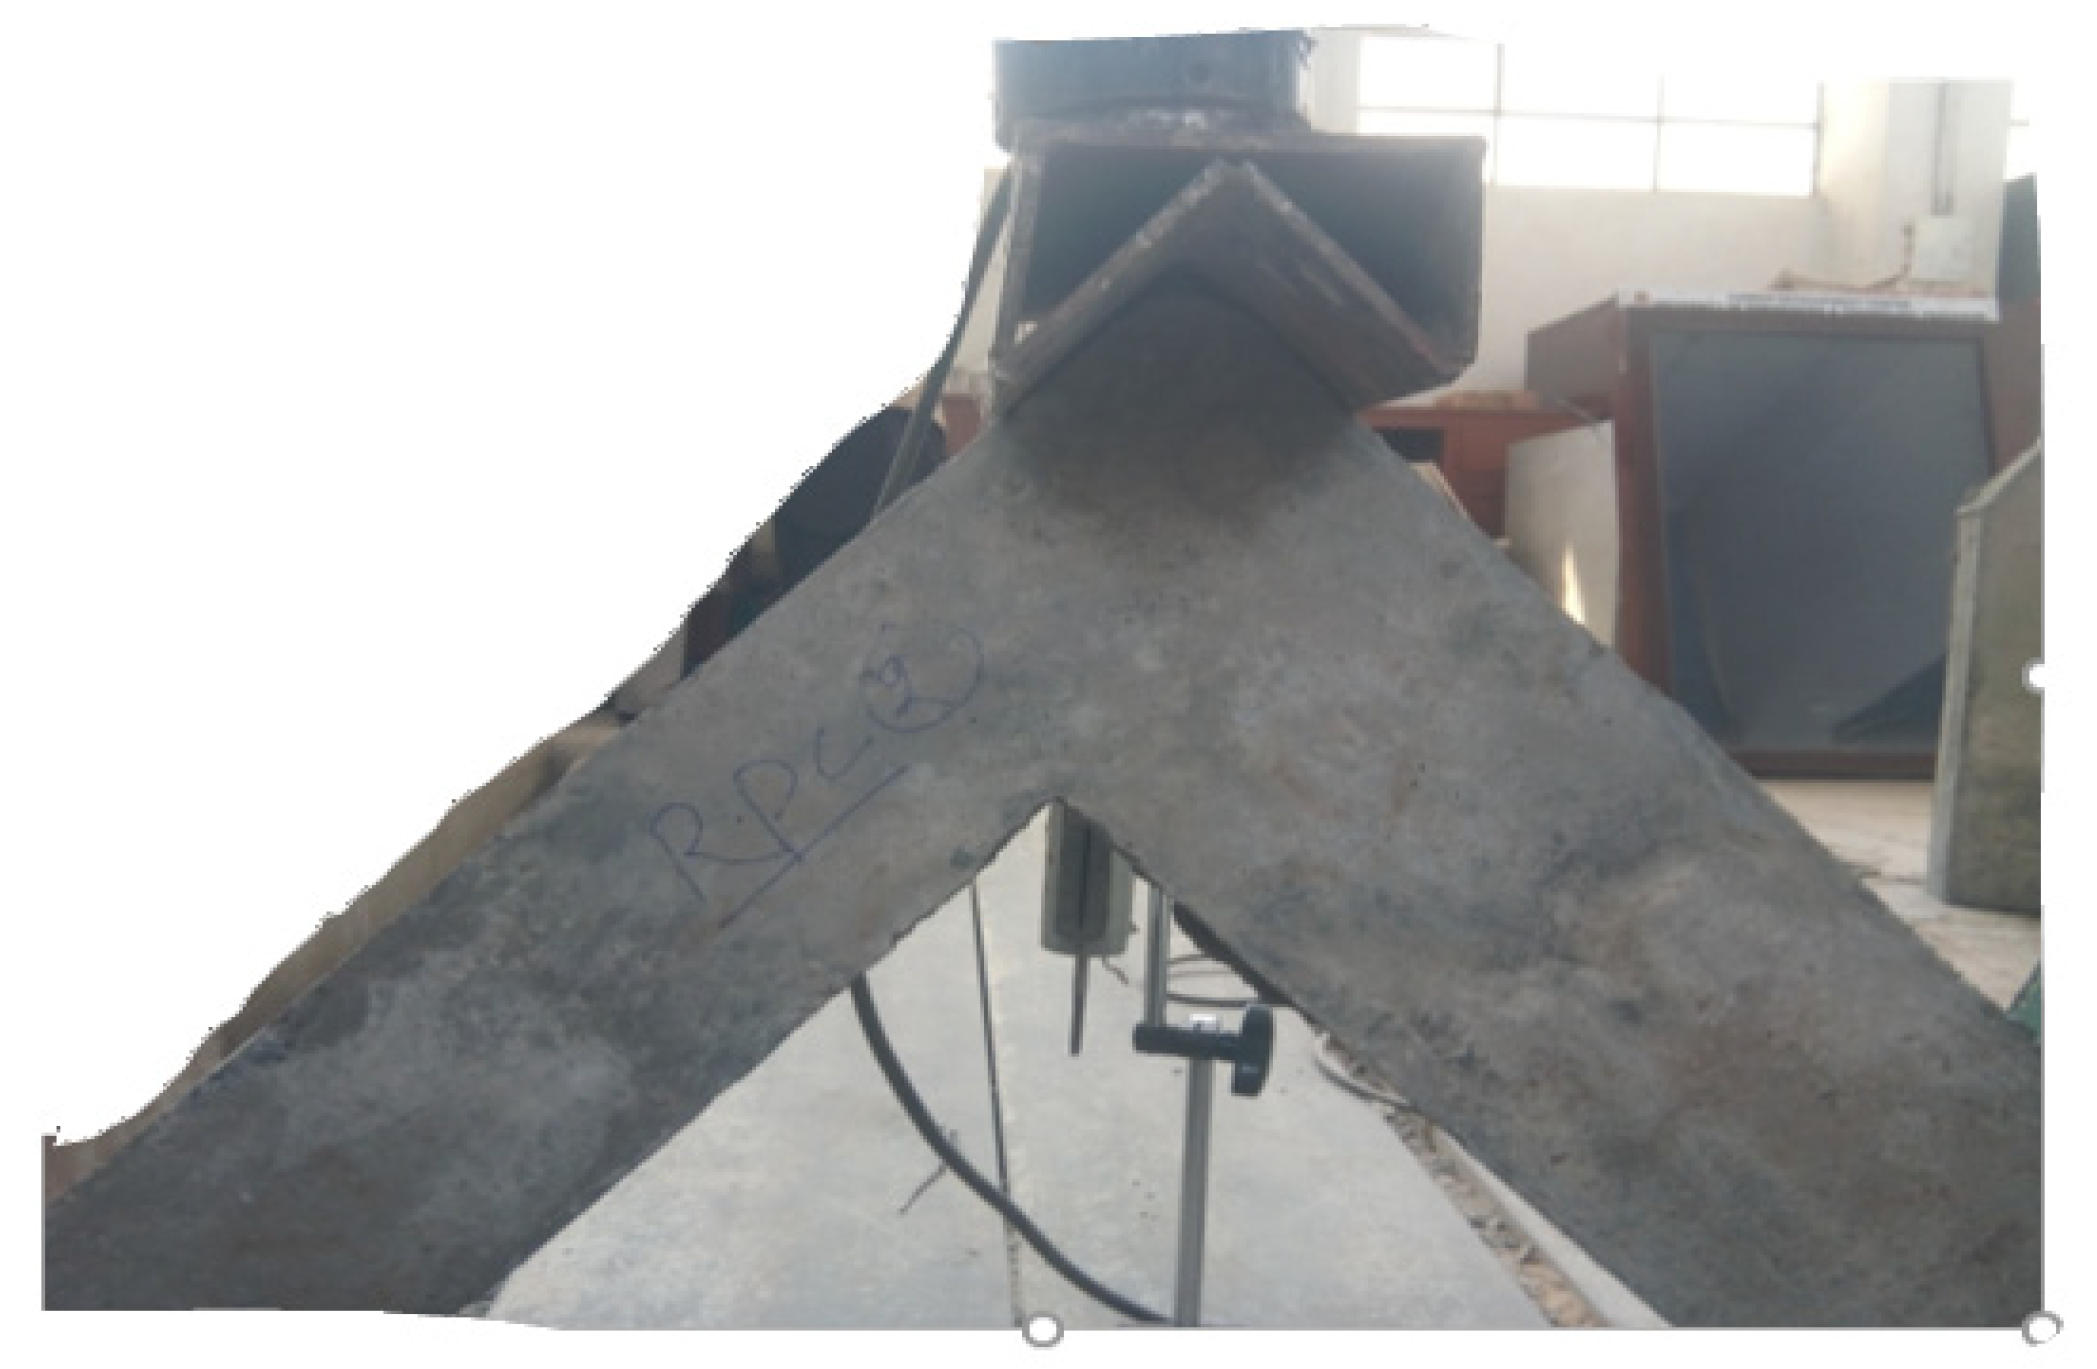
Constituents of RPC are shown in Table 1. RPC mix requires a higher cement quantity as compared to conventional concrete. The quality of cement is also of immense significance in this case [26]. Previous studies have employed high-performance cement with a low sodium oxide and low calcium aluminate content [27,28,29,30]. Reinforcement of grade 60 (60 ksi) was used in the specimens. RPC specimens in this study were made with low C3A Portland cement Type V complying with ASTM C150-2. Silica fume was utilized as an auxiliary binder. This was done as RPC requires a pozzolanic substance containing microparticles to reduce small voids in the paste. It also contributed to enhancing the strength and durability properties of the mix as a result of improved dense packing. According to ASTM C 494, a superplasticizer was used to recompense for the decreased water/cement ratio [31]. In the end, quartz mineral was employed to produce high-performance RPC. As the attributes of RPCs not only depend mainly on the order in which the components are inserted into the combination, but also on the speed and length of the process of mixing [32,33,34]. Approximately 7 min of gradual mixing of dry materials made out of silica fume, Portland cement, and quartz. The superplasticizer was added to water and the whole combination from the superplasticizer with water was added to the components immediately. The blend was then mixed up at around 10 min of progressively escalating speed. Beam column joint for two out of the four frames were left (4 inches for beam and 6 inches for column) for RPC concrete as shown in Figure 3. Joints were cast using RPC concrete monolithically with the conventional concrete as shown in Figure 4. The burlap curing method was adopted. In this method, the triangular specimens were kept under a burlap that was kept wet. Both controlled conventional concrete and RPC specimens were brought under a monotonic loading machine having a capacity of 200 tons as depicted in Figure 5 and Figure 6. In monotonic load testing, the load is steadily escalated at a constant rate, with no reversals from test start to ultimate fracture. Casting and testing of RPC frames are shown in Figure 3, Figure 4, Figure 5 and Figure 6.
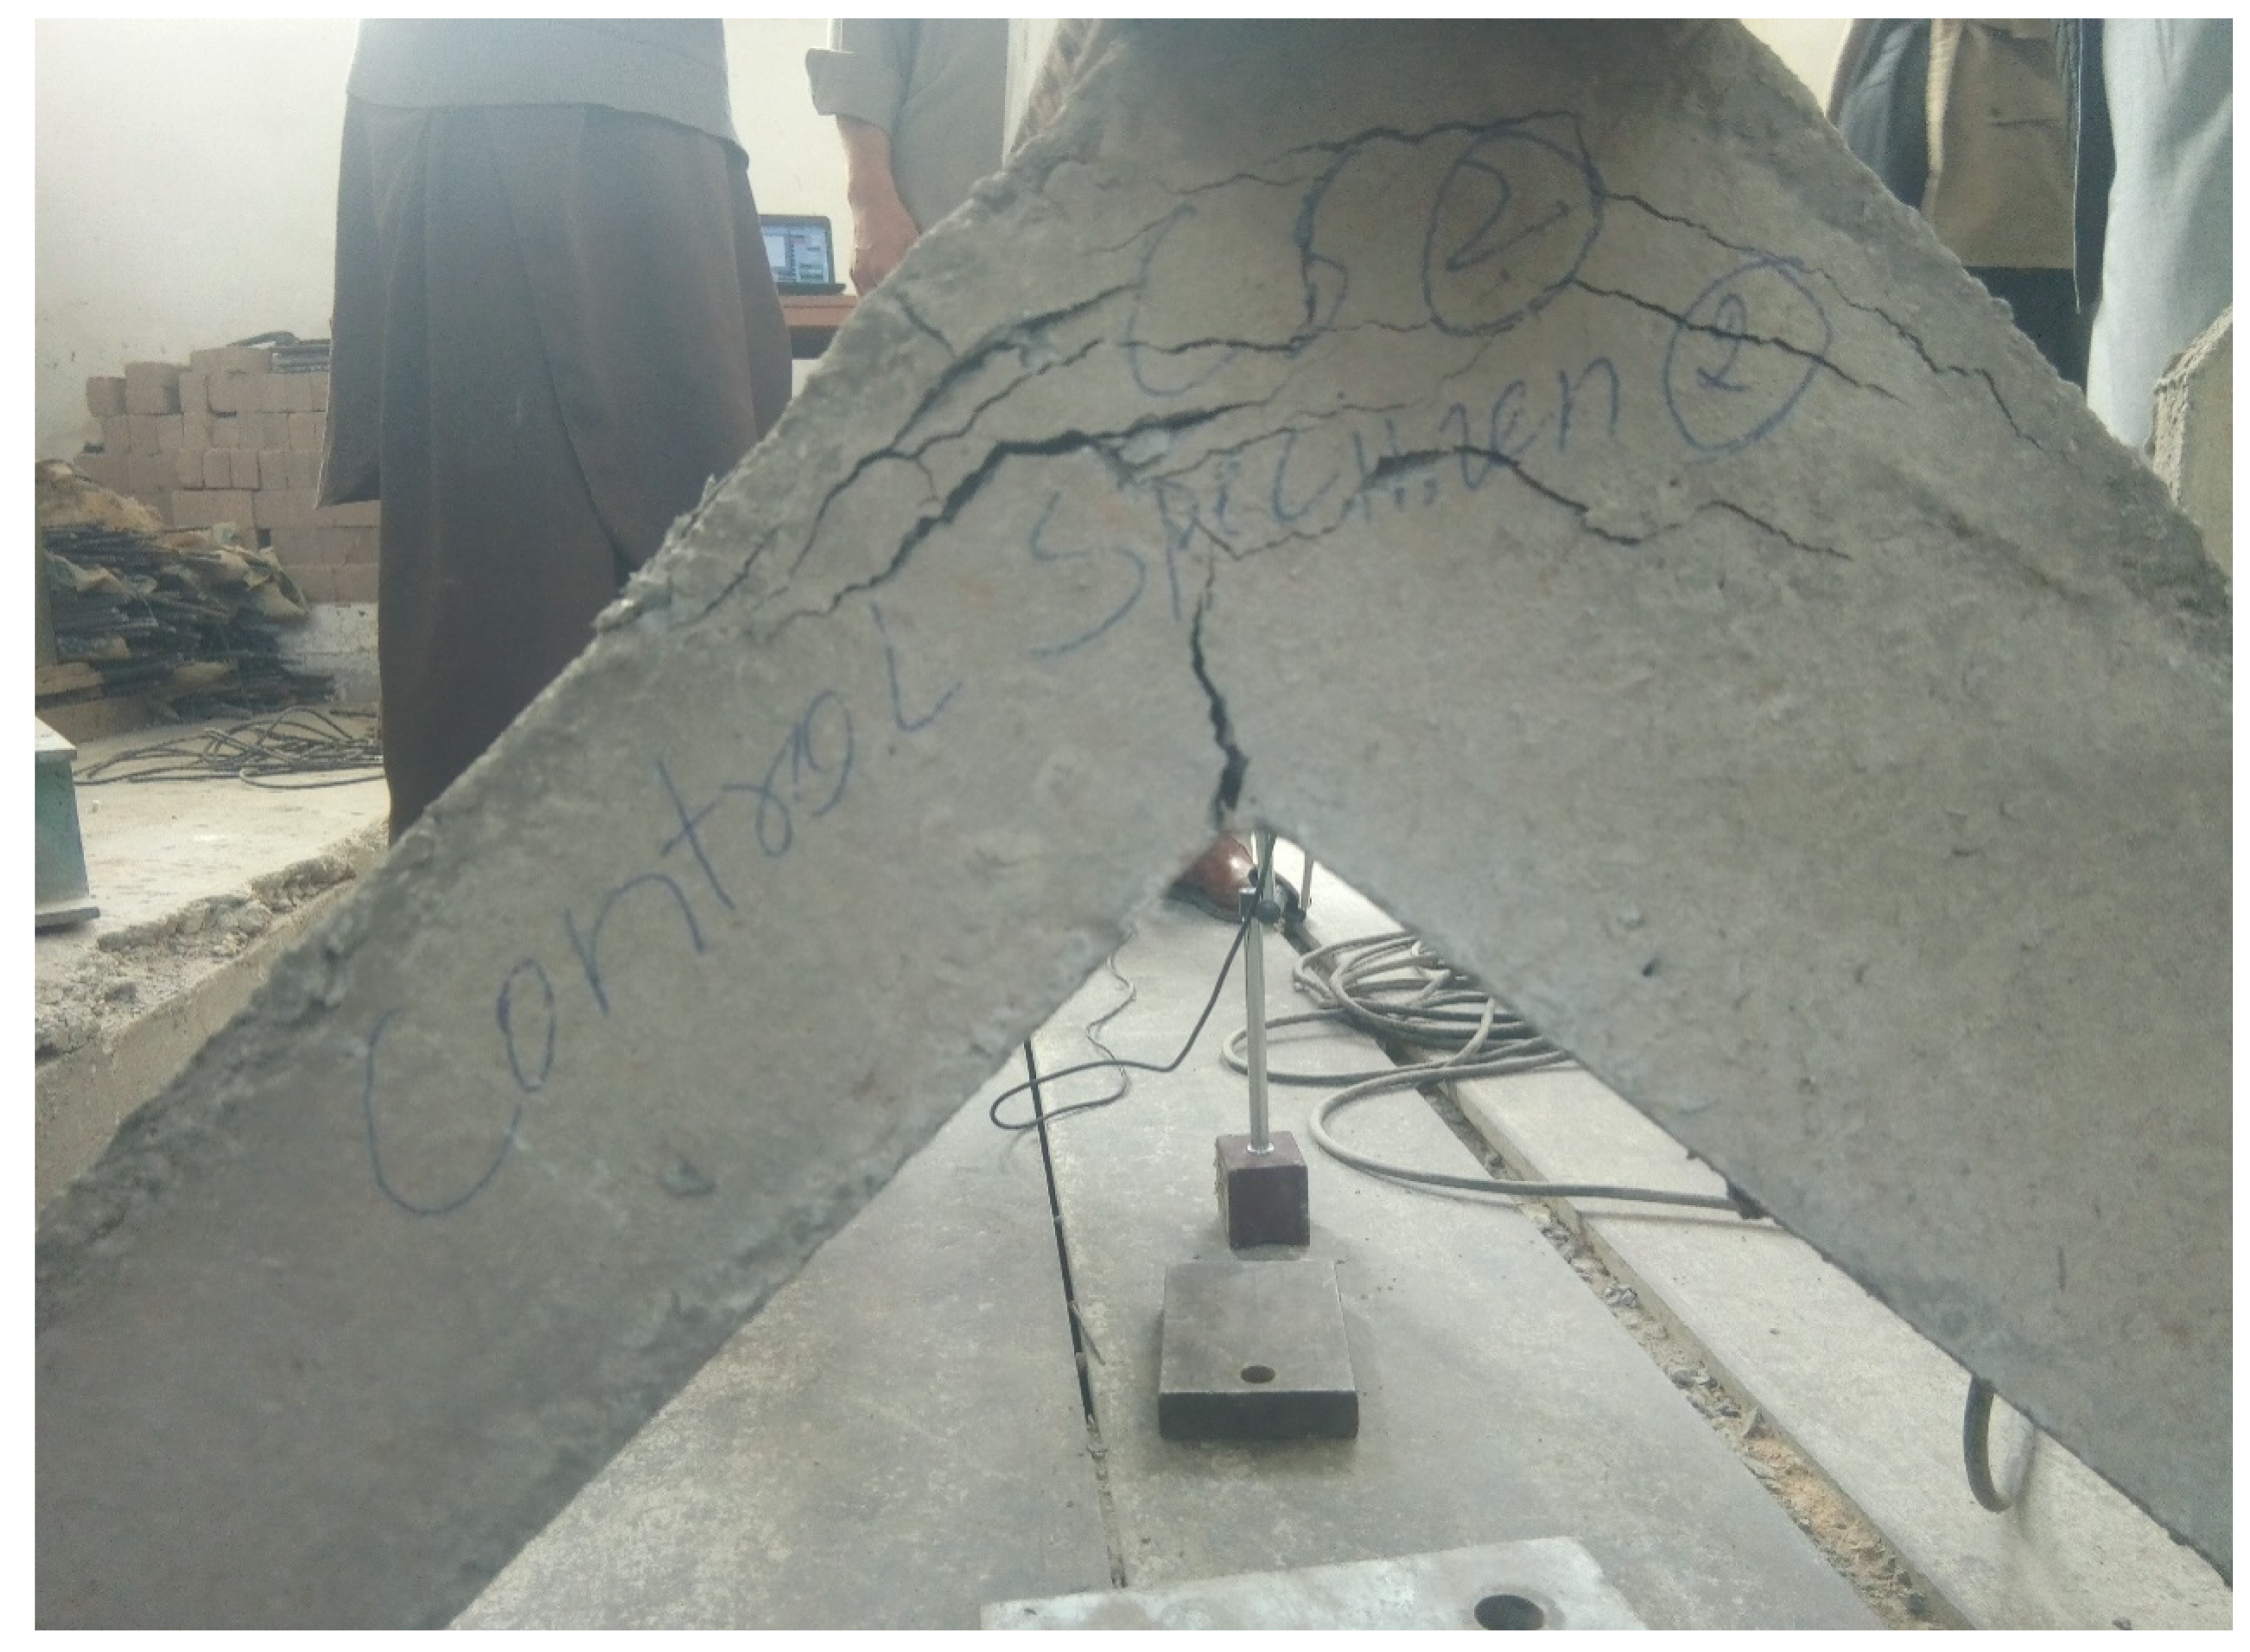
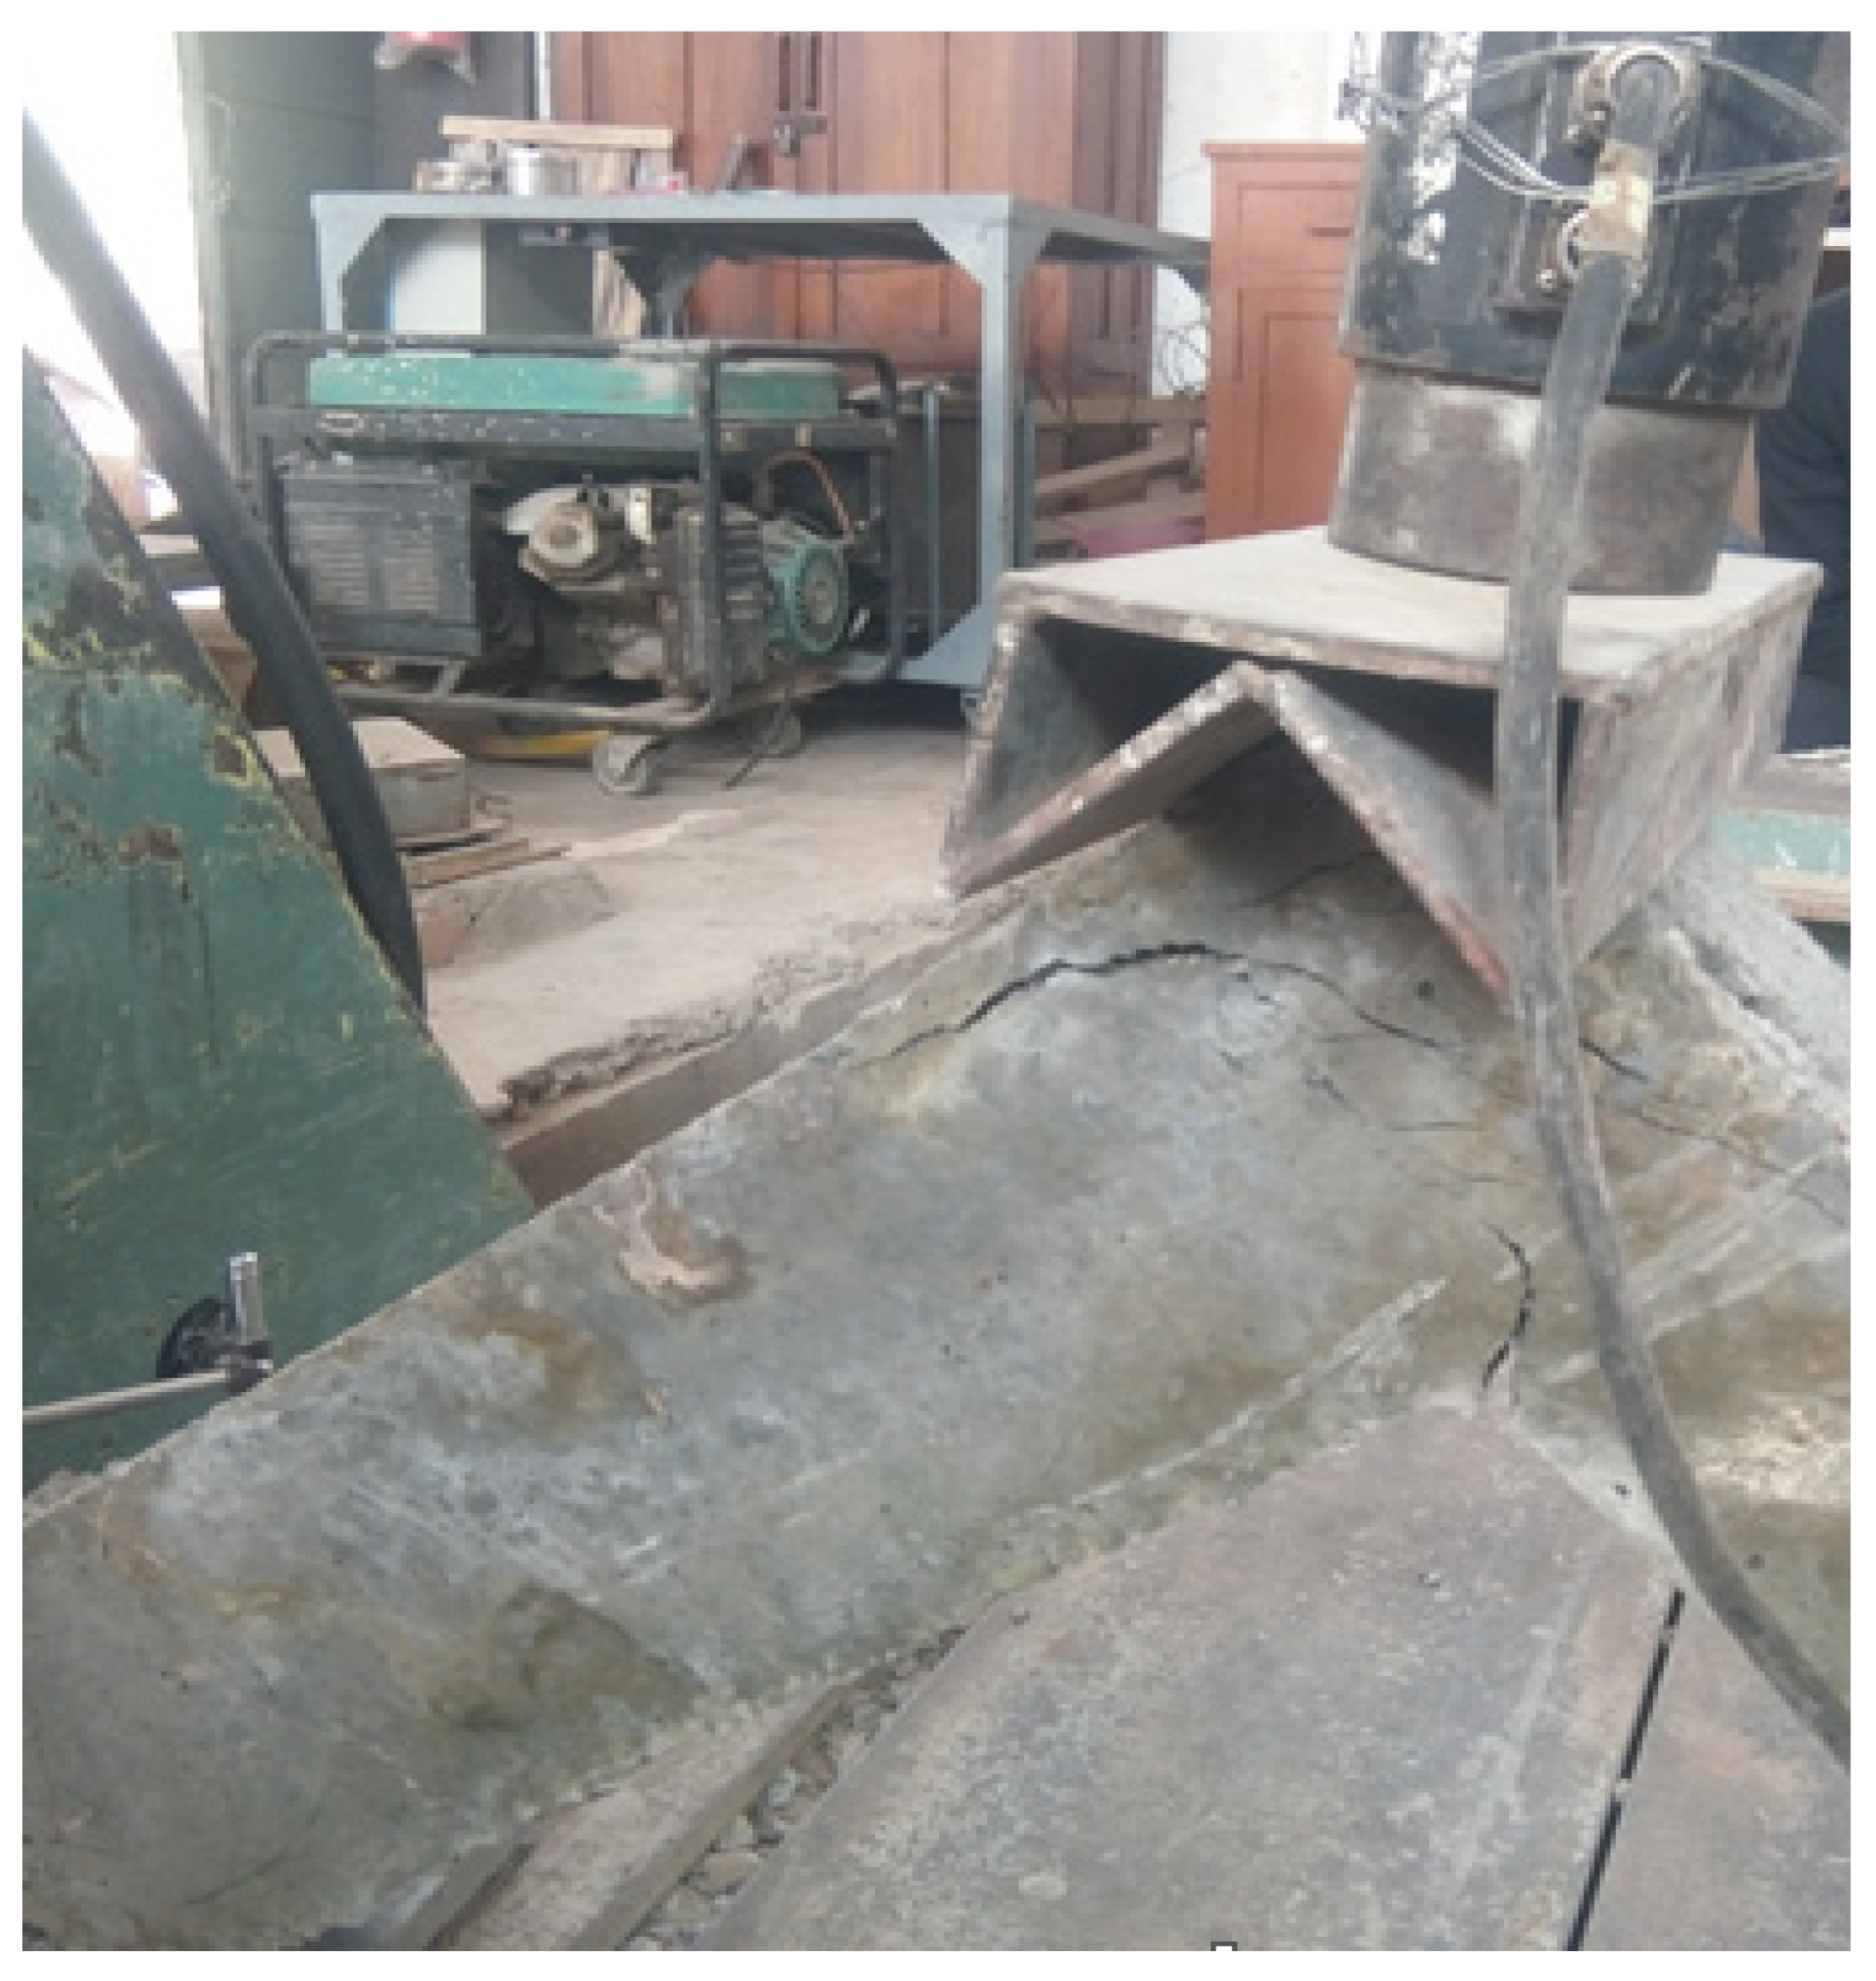
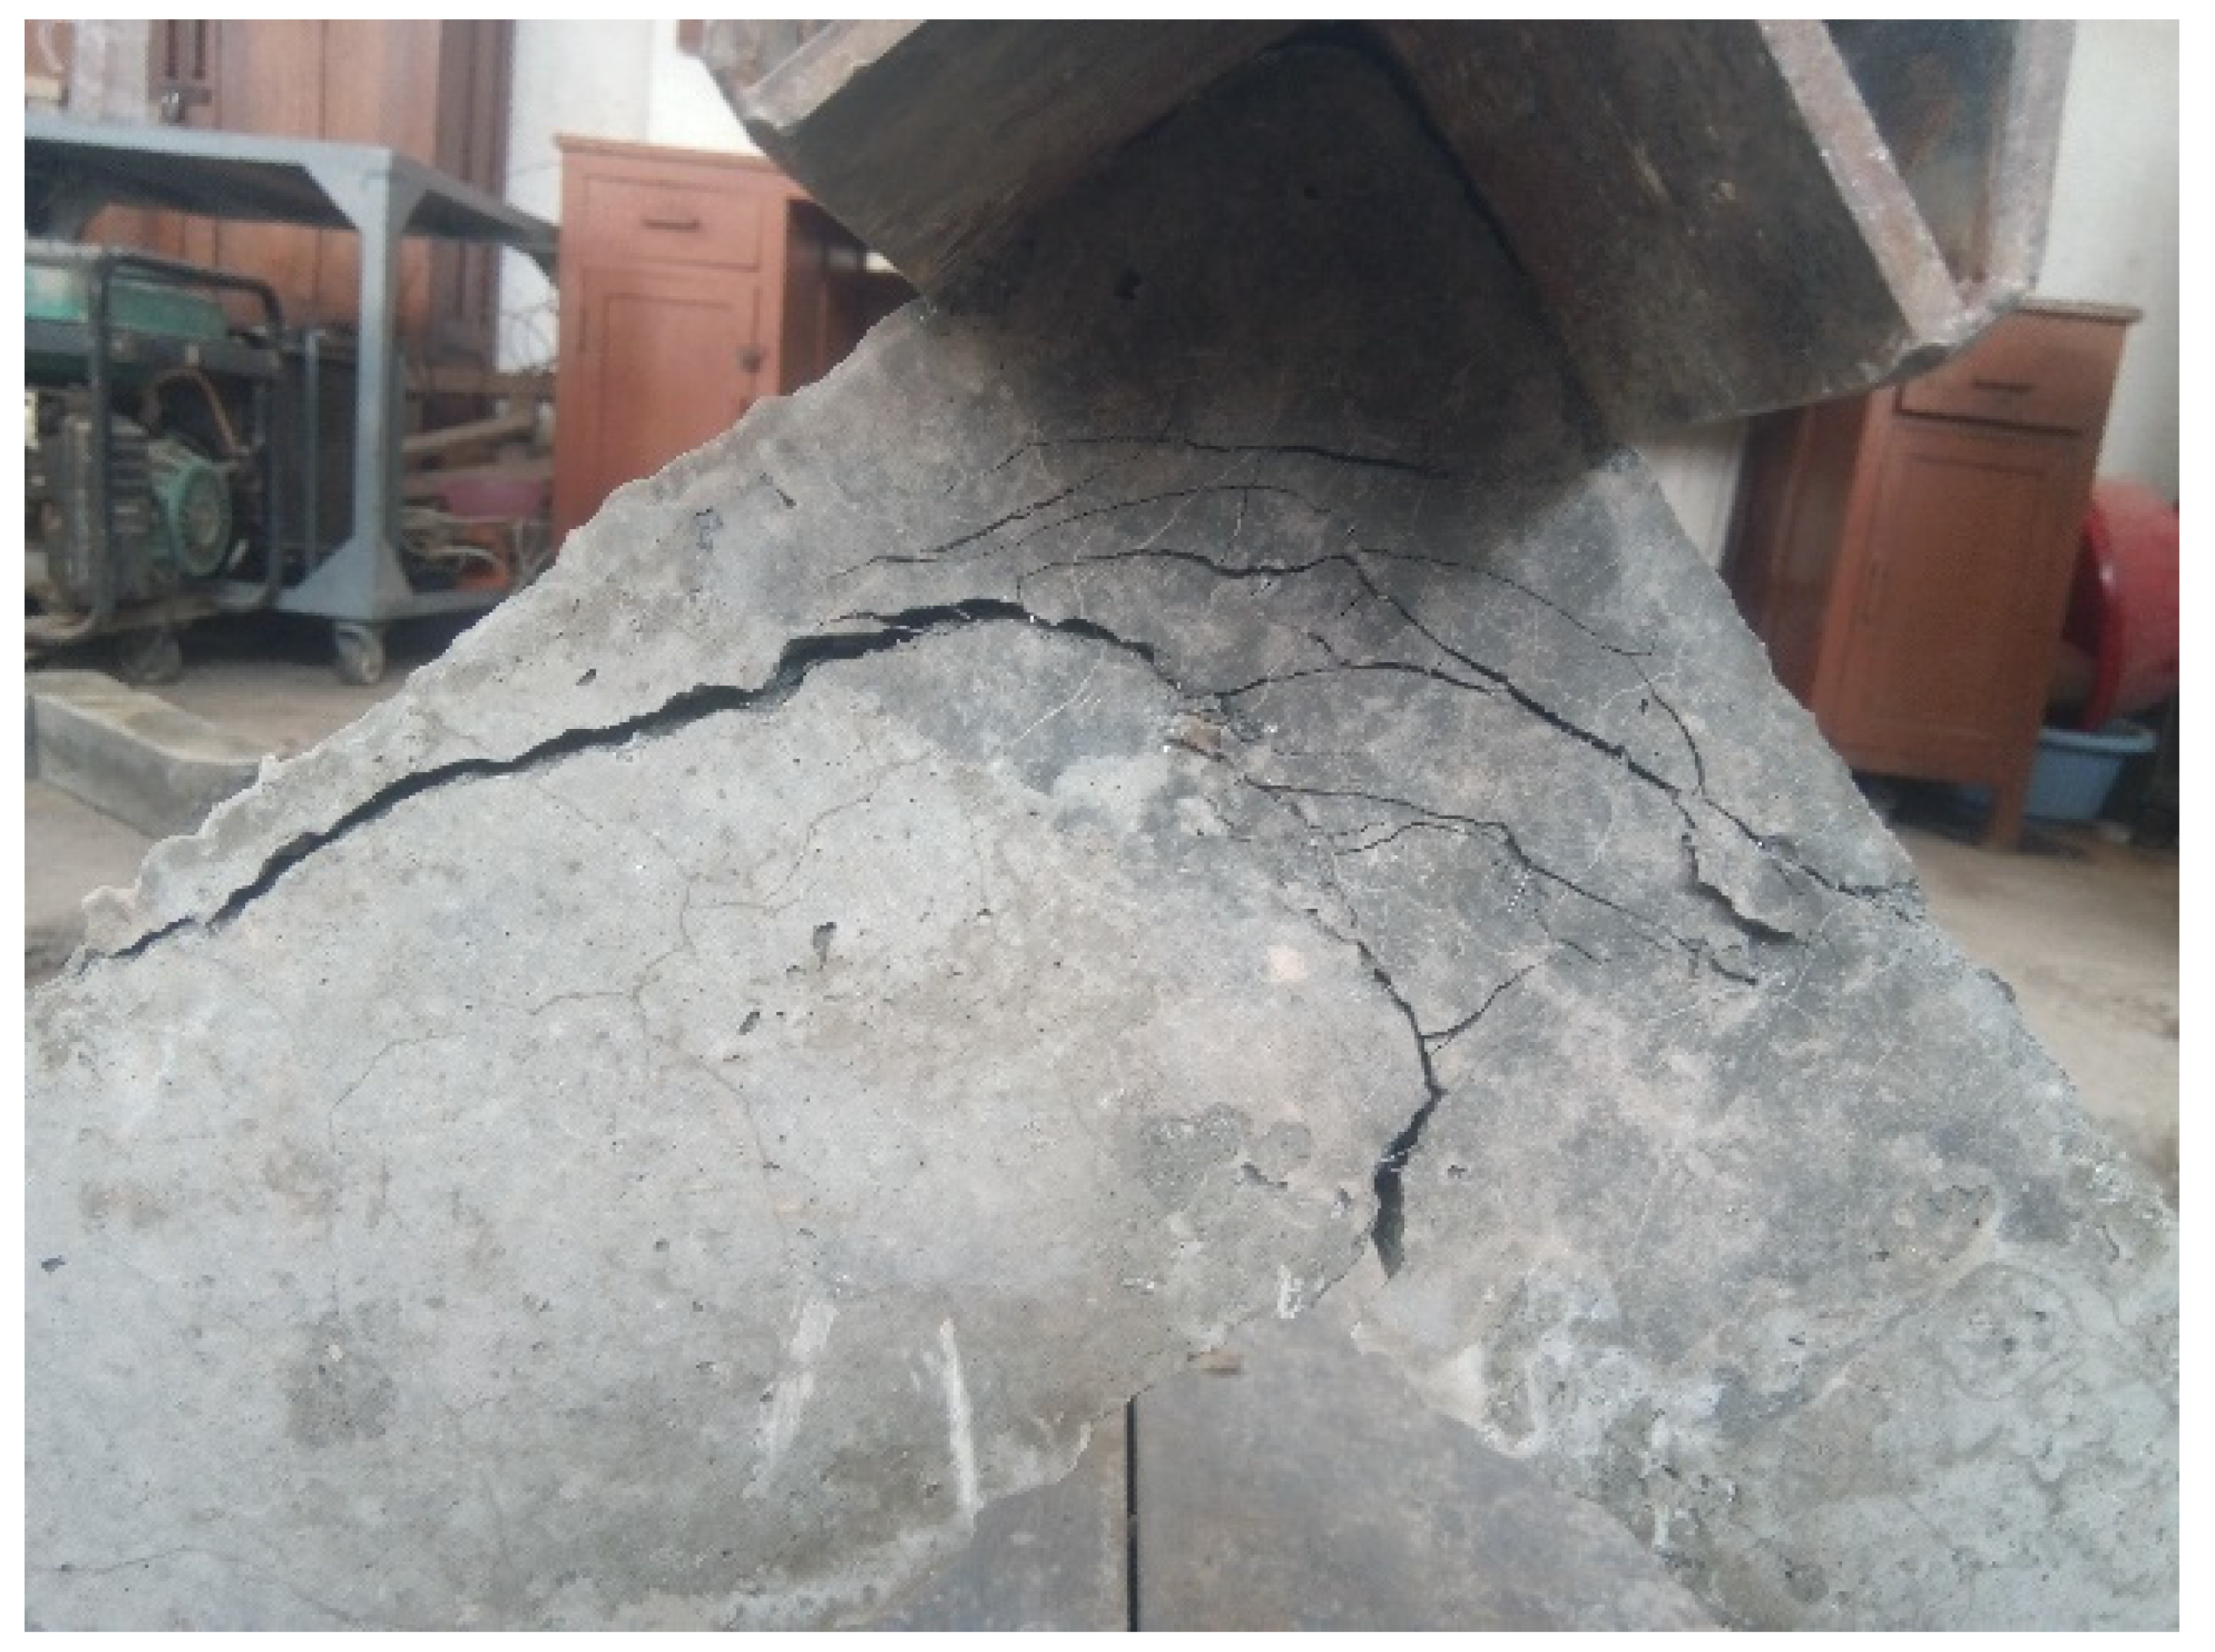
As seen in Figure 7, Figure 8, Figure 9 and Figure 10, shear cracking was the primary cause of failure in all the specimens. The distribution of cracks in the RPC sample was distributed uniformly due to the presence of steel fibers. As no coarse aggregates were involved in the case of RPC specimens, beam-column joint resulted in decreased stiffness as discussed in the results section of the article. RPC resulted in an increase of 10–15 percent of the tensile strength (the ability of a material to stretch when pulled apart) as compared to controlled conventional concrete samples.
Table 2 shows the values of experimental results. Strength (fc’), Elastic modulus (Ec), maximum load, and displacement for all the specimens were studied. RPC specimens reached ultimate strength at a later stage and have shown higher Ec. Moreover, the load taken by RPC specimens was greater in comparison to controlled concrete specimens.
3. Modelling
Recently, numerical modeling has been increasingly adopted to simulate the damaging effect of structures. These numerical models can predict the failure events by analysis of nonlinear behavior such as buckling, large displacements, cracking, and inter-surface contacts. Finite element analysis (FEA) model-based software ABAQUS was used to model and to simulate and determine the response of RPC in improving the shear strength deformation of vulnerable beam-column joint. Different parameters for linear and nonlinear analysis were taken from experimental work of shear strength-deformation improvement of vulnerable beam-column connection using RPC.
3.1. Finite Element Modeling of Nonlinear Behavior of Beam-Column Joint
3.1.1. Finite Element Method
The finite element method (FEM) is the most widely used in numerical simulation of structures [35]. Finite element models have the potential to solve a wide range of complex problems from elastic linear models for linear elements to highly plastic models for nonlinear and solid elements. FEM is one of the leading methods to simulate all types of structures (timber, steel, concrete, masonry) [36].
3.1.2. Abaqus Software
To perform numerical simulation of beam-column joint using RPC a FEM-based software ABAQUS/CAE was selected, which is general-purpose analysis software having the capability of solving the elastic and inelastic problems of the static and dynamic response of components [37].
ABAQUS/CAE 6.14-1 VERSION was used for modeling and analysis of beam-column joint using RPC.
3.1.3. Concrete Damage Plasticity Model
The concrete damage plasticity (CDP) model was selected as it has the capability and potential for modeling reinforced concrete and other quasi-brittle material for different types of structure. CDP model can define the nonlinear behavior of the RPC beam-column joint. Additionally, it takes into account the isotropic damage elasticity concepts with isotropic tensile and compressive plasticity. It also considers the degradation of elastic stiffness produced by plastic straining both in compression and tension [38]. The CDP model can show damage characteristics of a material. The main failure mechanism that this model assumes is the tensile cracking and the compressive crushing [39].
Different parameters required in the CDP model were studied and selected based on available literature both for conventional as well RPC specimens. The dilation angle for the model was taken as 36°. It is the angle obtained due to a change in volumetric strain produced due to plastic shearing. It depends on the angle of internal friction. Dilation angle controls the amount of plastic volumetric strain produced due to plastic shearing. Normally dilation angle is taken between 30° and 40° for concrete to avoid large variation between experimental work and numerical modeling. For the seismic design of reinforced concrete, the value of dilation angle is normally between 35° to 38° [40]. Moreover, eccentricity is the deviation from the center. The default value for eccentricity was taken, i.e., 0.1. If the value is increased by 0.1 the curvature of flow potential is increased. If the value is decreased from the default value, the convergence problem may occur if confinement pressure is not high enough. Furthermore, the ratio of biaxial loading (fb) to uniaxial loading (fc0) is normally taken as 1 or greater than 1. In this case default value was taken i.e., fb/fco = 1.16. K is the shape factor and default value for K = 0.667 [41]. The viscosity parameter shows the amount of flow potential in a material. A lower viscosity parameter value is better as higher values result in a high force of reaction. Therefore, the viscosity parameter, in this case, was taken as 0.001 [42].
3.2. Compressive and Tensile Behavior Determination by Using Eurocode
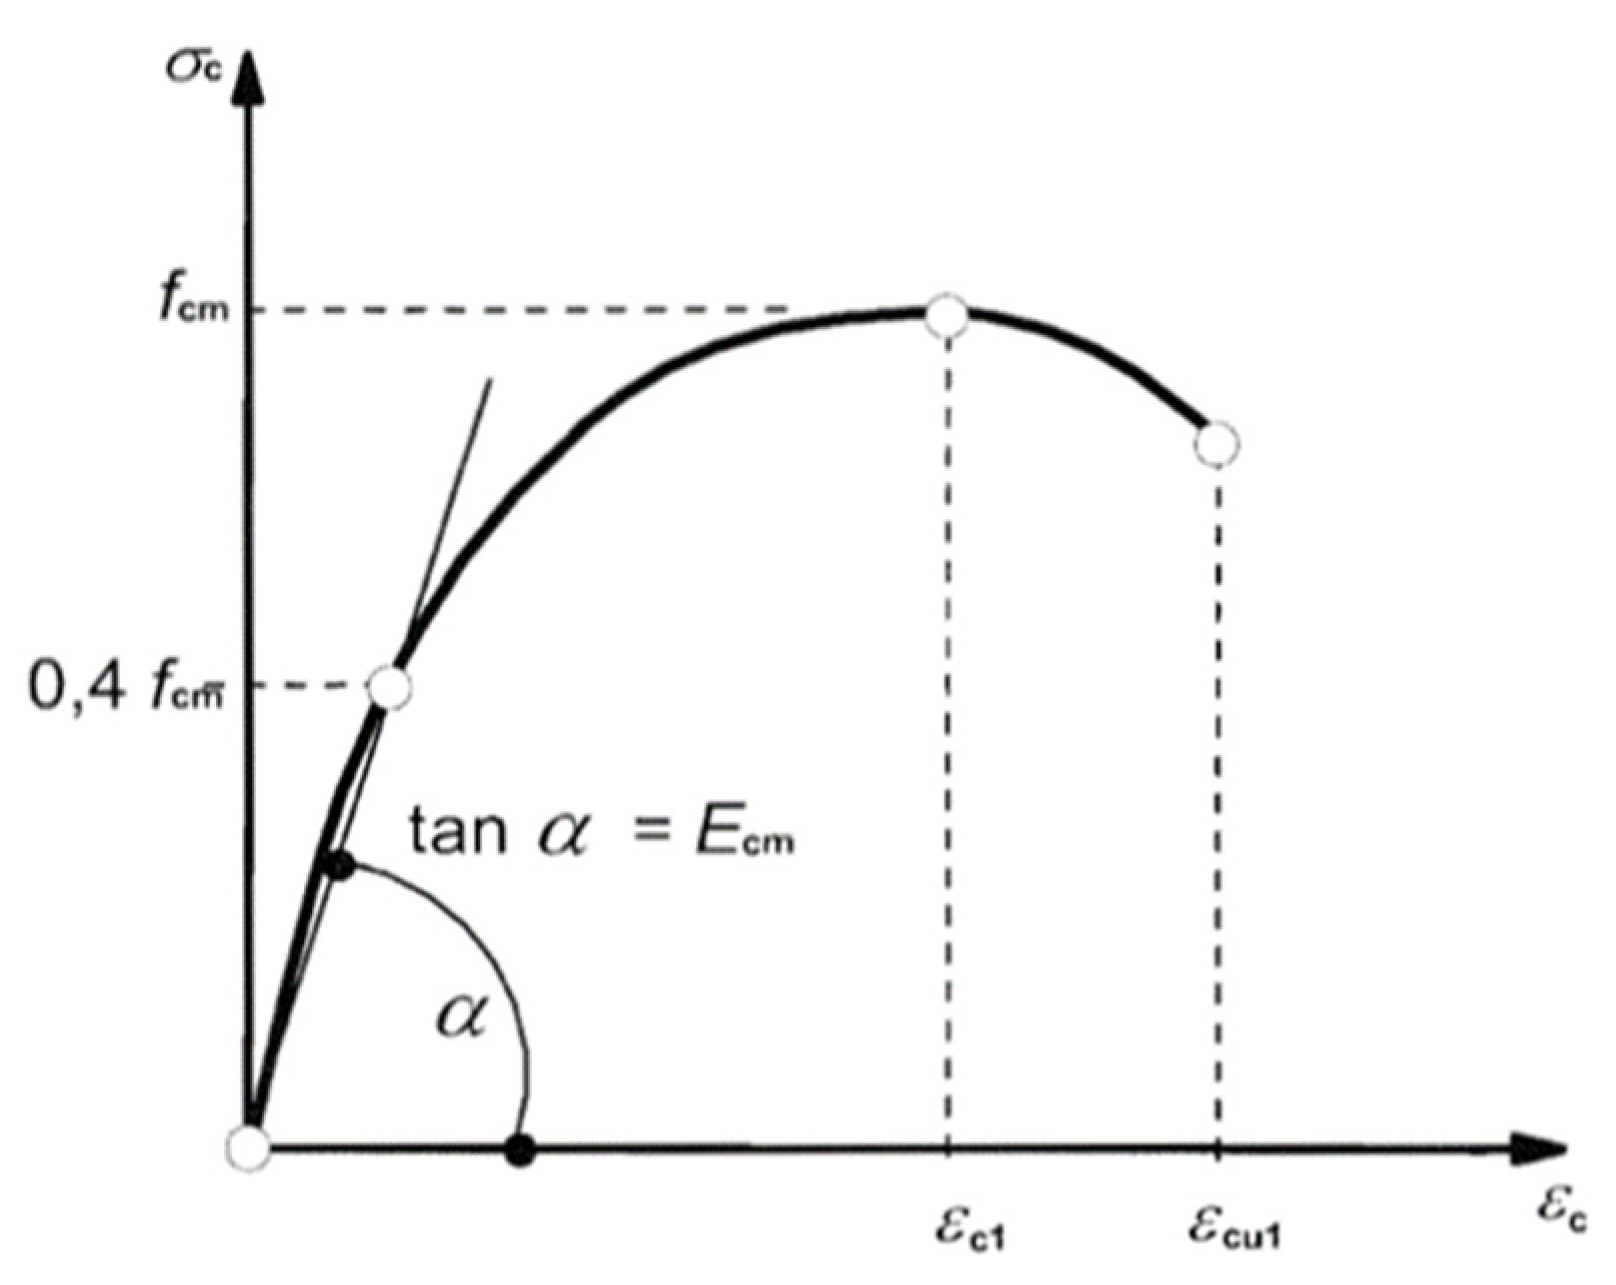
Compressive behavior and tensile behavior of both normal concrete and RPC were determined by using EN 1992 Eurocode 2: Design of concrete structures part 1–1 [43]. It describes different principles and requirements for the safety, serviceability, and durability of concrete structures with specific provisions of buildings. Eurocode 2 applies to the design of civil engineering works such as buildings, roads, bridges, etc. It is applied to plain, reinforced, and prestressed concretes. It complies with the specifications and requirements given in EN 1992-1-1 about safety, serviceability of the structures, the basis of their design, and verification of structures given in EN 1990; basis of structural design [38]. Compressive and tensile stress-strain curves are shown in Figure 11 and Figure 12, respectively. The limitation of the Eurocode 2 for concrete structures is that it is concerned only with the requirements for resistance, safety, serviceability, durability, and fire resistance of the structures. Moreover, it does not consider the other requirements like thermal or sound insulation, etc. [38].
3.2.1. Compressive Behavior
The compressive behavior of concrete was calculated by using the relations of Eurocode [43] given in Equation (1).
where:
fcm (MPa) is the compressive strength
Ecm (GPa) is the modulus of elasticity
Other values showing the position of characteristics points are strain εc1 at average compressive strength and ultimate strain εcu at 0.
where:
εc1 is the strain at peak stress
εcu is the ultimate strain at which concrete fails
Equations (2) and (3) are only pertinent to concrete having a cylindrical compressive strength of 50 MPa and cube compressive strength of 60 MPa at the most. On the basis of a list of the experimental results, Kmiecik and Kamiński [44] proposed the quite accurate approximating Equations (4) and (5):
Knowing the values of the output in Equations (4) and (5) one can determine the points at which the graphs intersect. Compressive stress values can be determined at any point using these relations [43].
According to Eurocode EN 1992-1-1
where:
and:
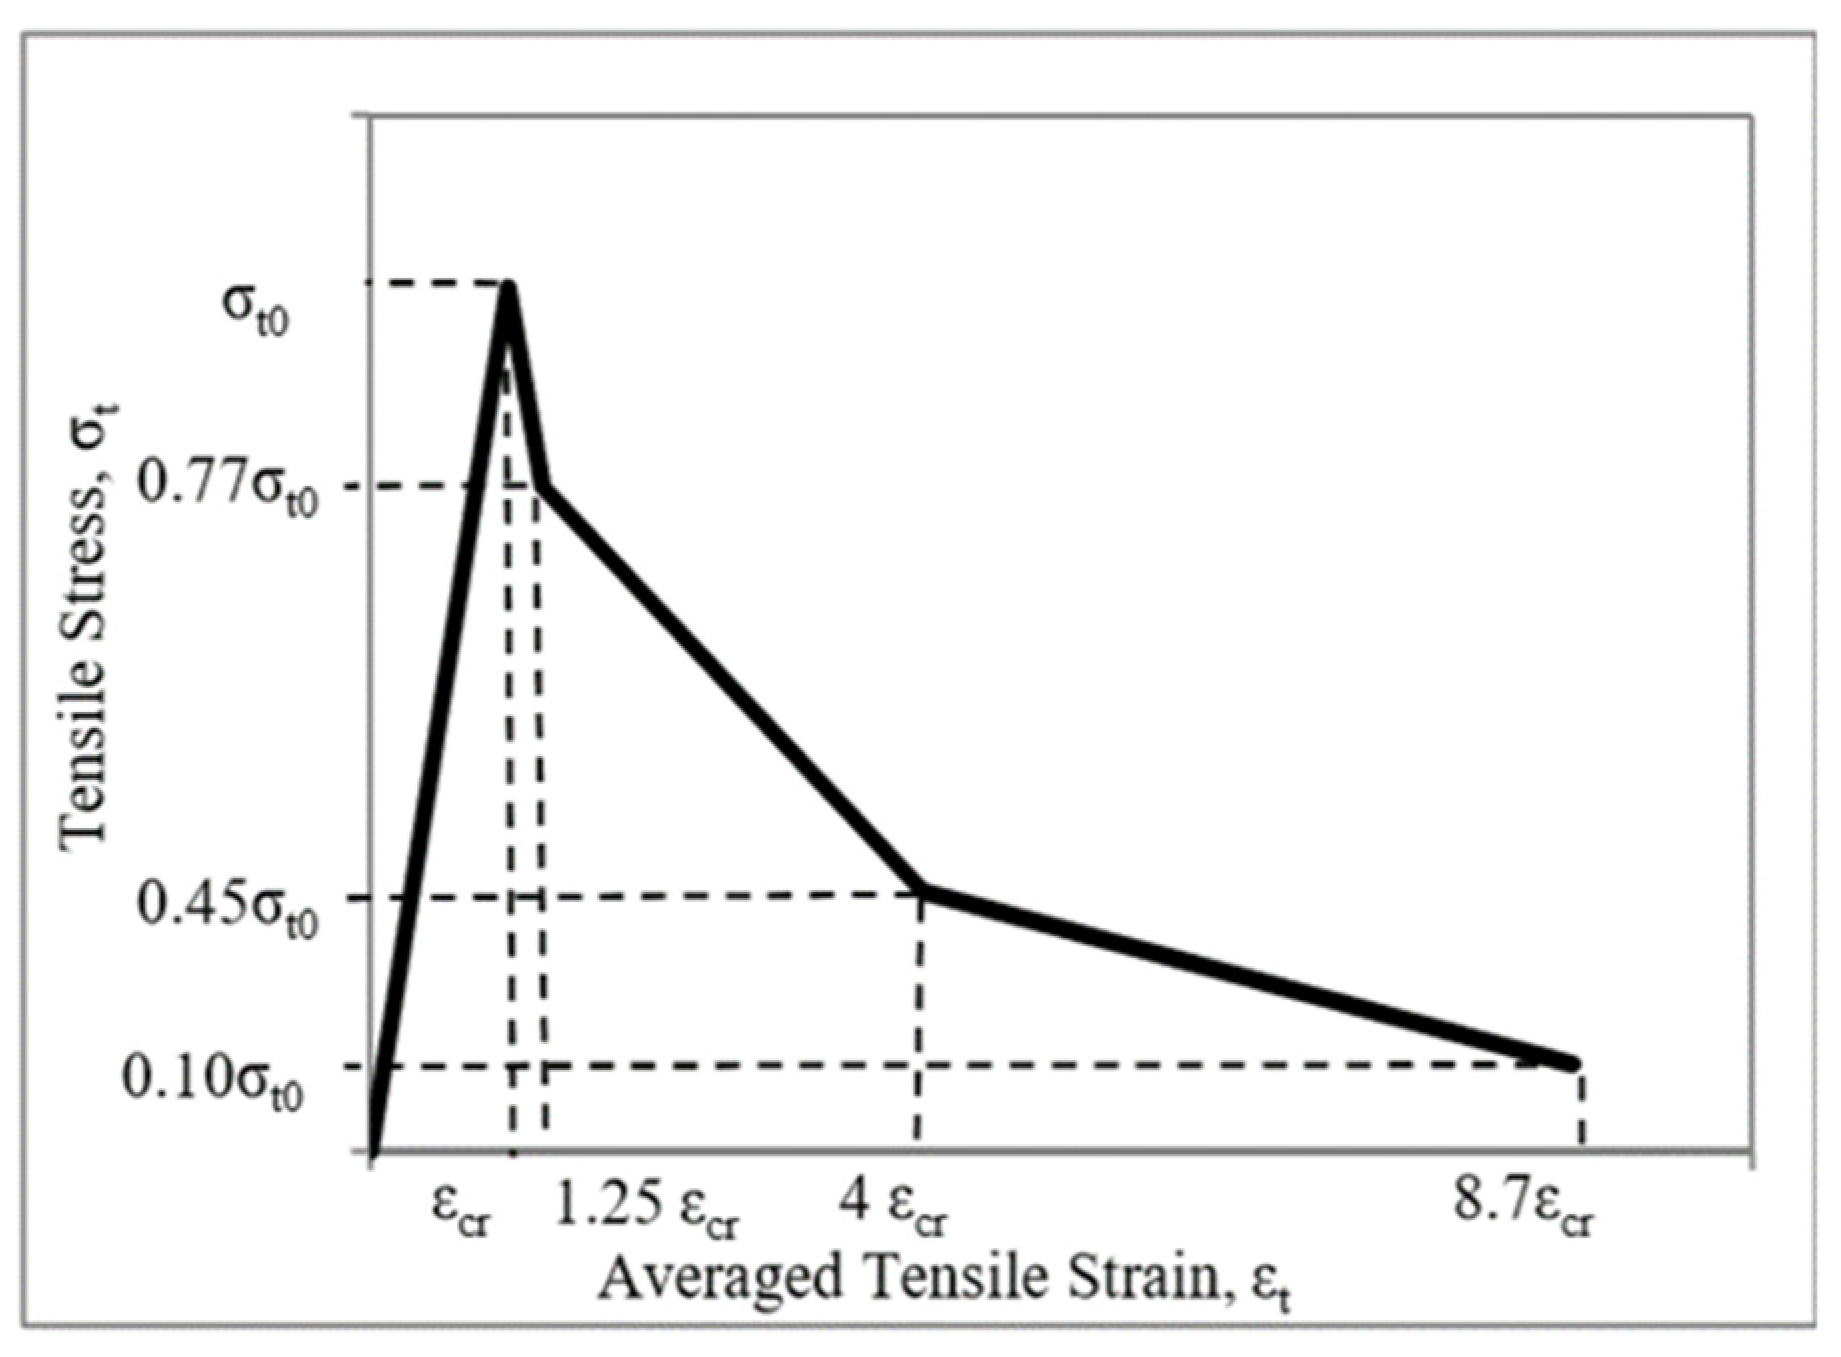
3.2.2. Tensile Behaviors
The tensile behavior of concrete was calculated by using the Equations (9)–(12).
If εt ≤ εcr
and if εt > εcr
For the determination of the complete stress-strain curve for compressive behavior and the tensile behavior of normal concrete and RPC, Eurocode has been used which is capable of determining the actual response of structures closer to the experimental setup. As RPC is a composite material and there is no official code for RPC developed yet, therefore small modifications based on literature have been made in normal concrete formulas for the determination of stress-strain curves of RPC.
Simple modifications were incorporated into the Equations (1), (3), and (12). These equations were utilized in assigning material properties during numerical modeling in ABAQUS to obtain more realistic results of RPC concrete. Modified equations are shown in Equations (13)–(15).
3.3. Steps and Boundary Conditions
After the completion of assembly, a step was formed. In steps, a time period was provided for which the load is applied to the assembly. The load was then applied to the designated location according to the magnitude of the sample and boundary conditions were applied according to experimental work in which two specimens (CC_S1 and RPC_S1) have hinge boundary condition, i.e., (U1 = U2 = UR3 = 0) while the other two specimens have fixed boundary condition (U1 = U2 = U3 = UR1 = UR2 = UR3 = 0) at column end while roller support (U1 = UR2 = UR3 = 0) at the beam end in all specimens. “U” refers to translatory motion while “UR” refers to rotation of the support. Both the boundary conditions for the column were studied and their effect on the strength and load values were observed.
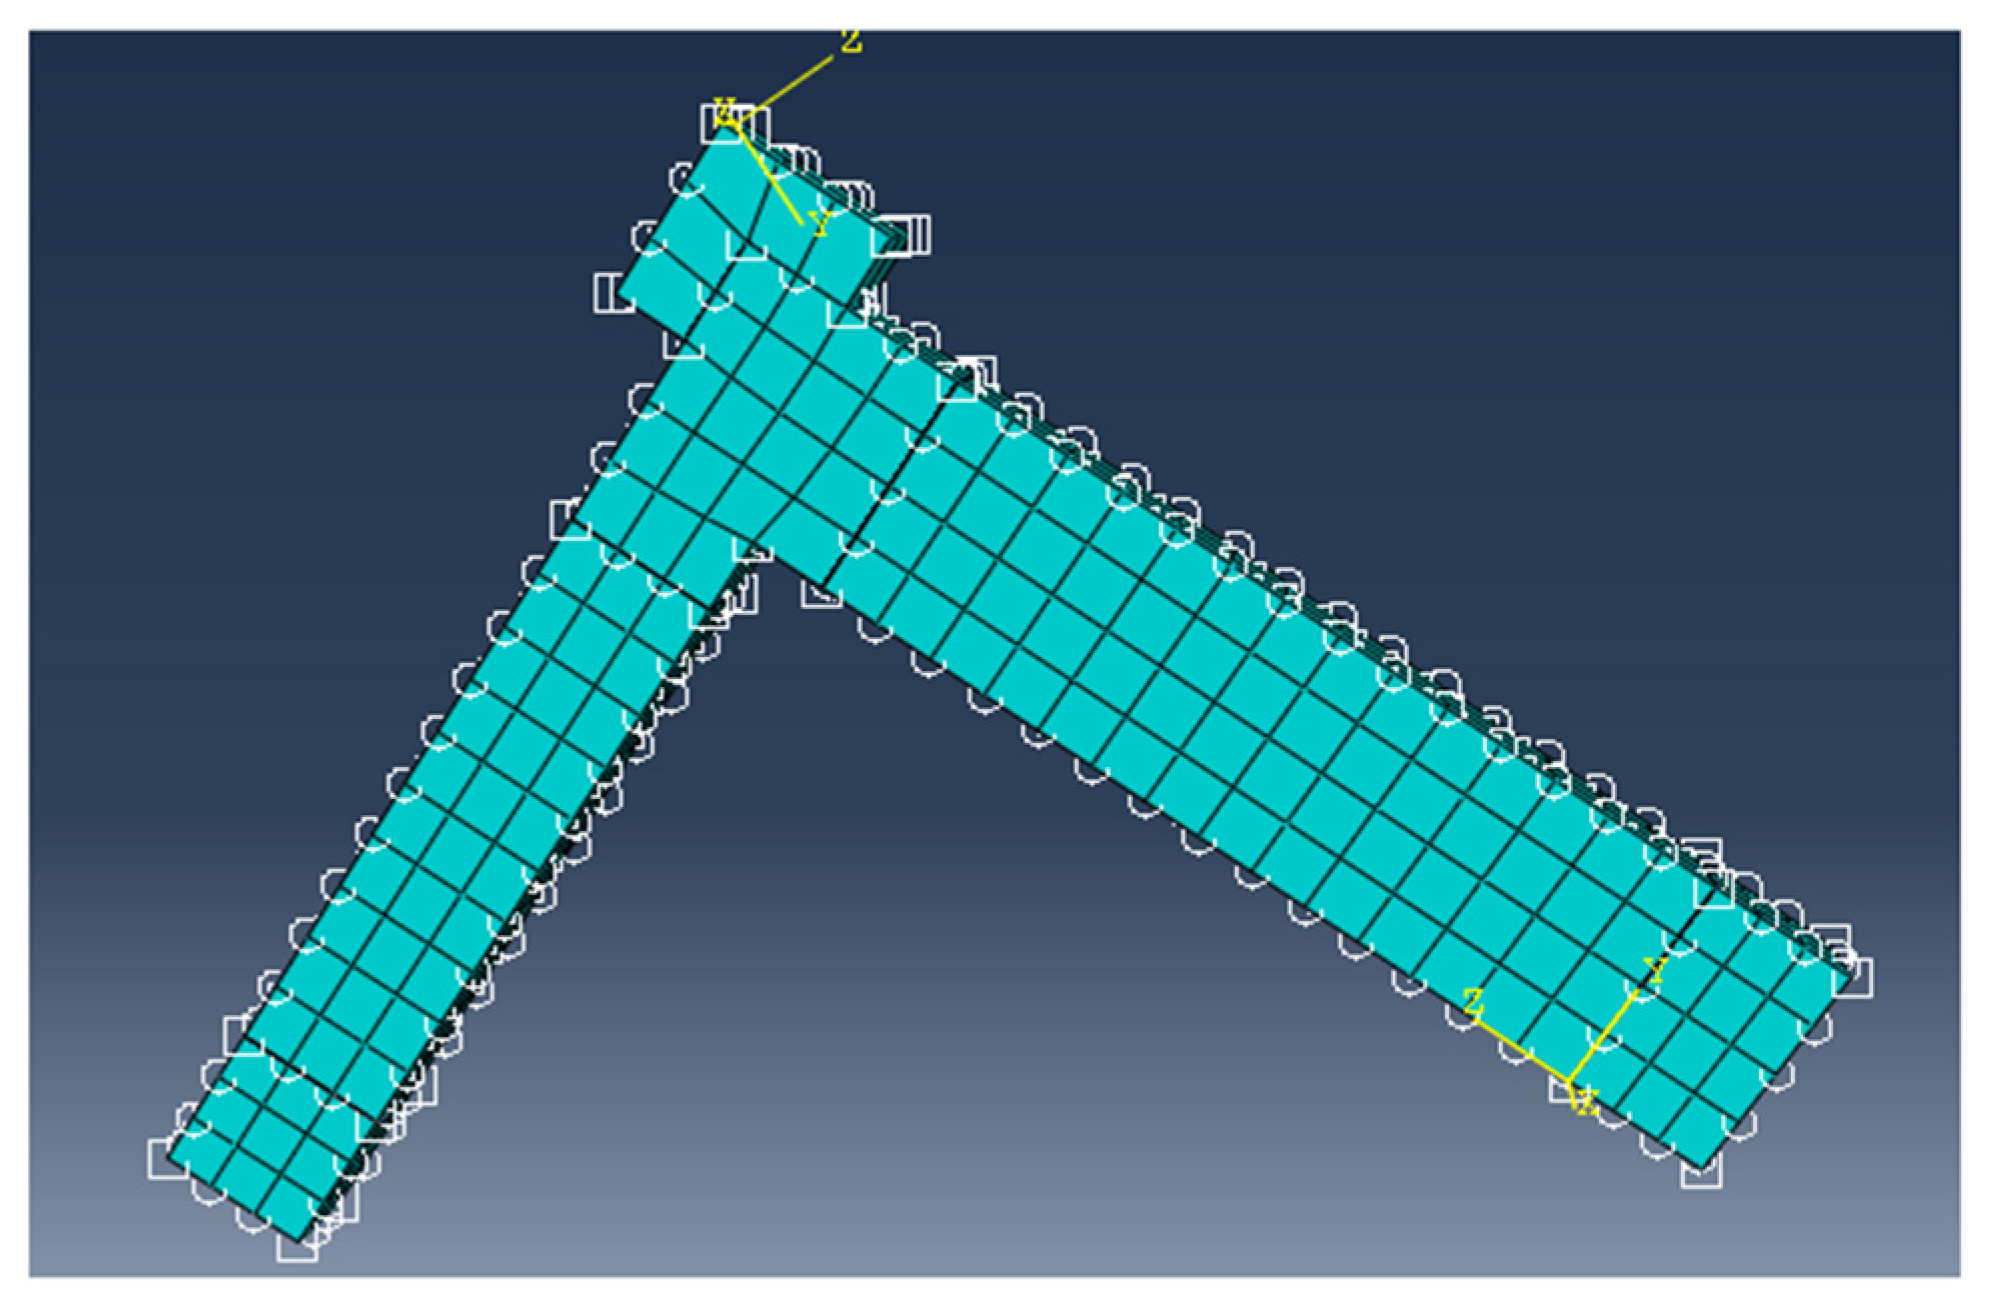
3.4. Meshing
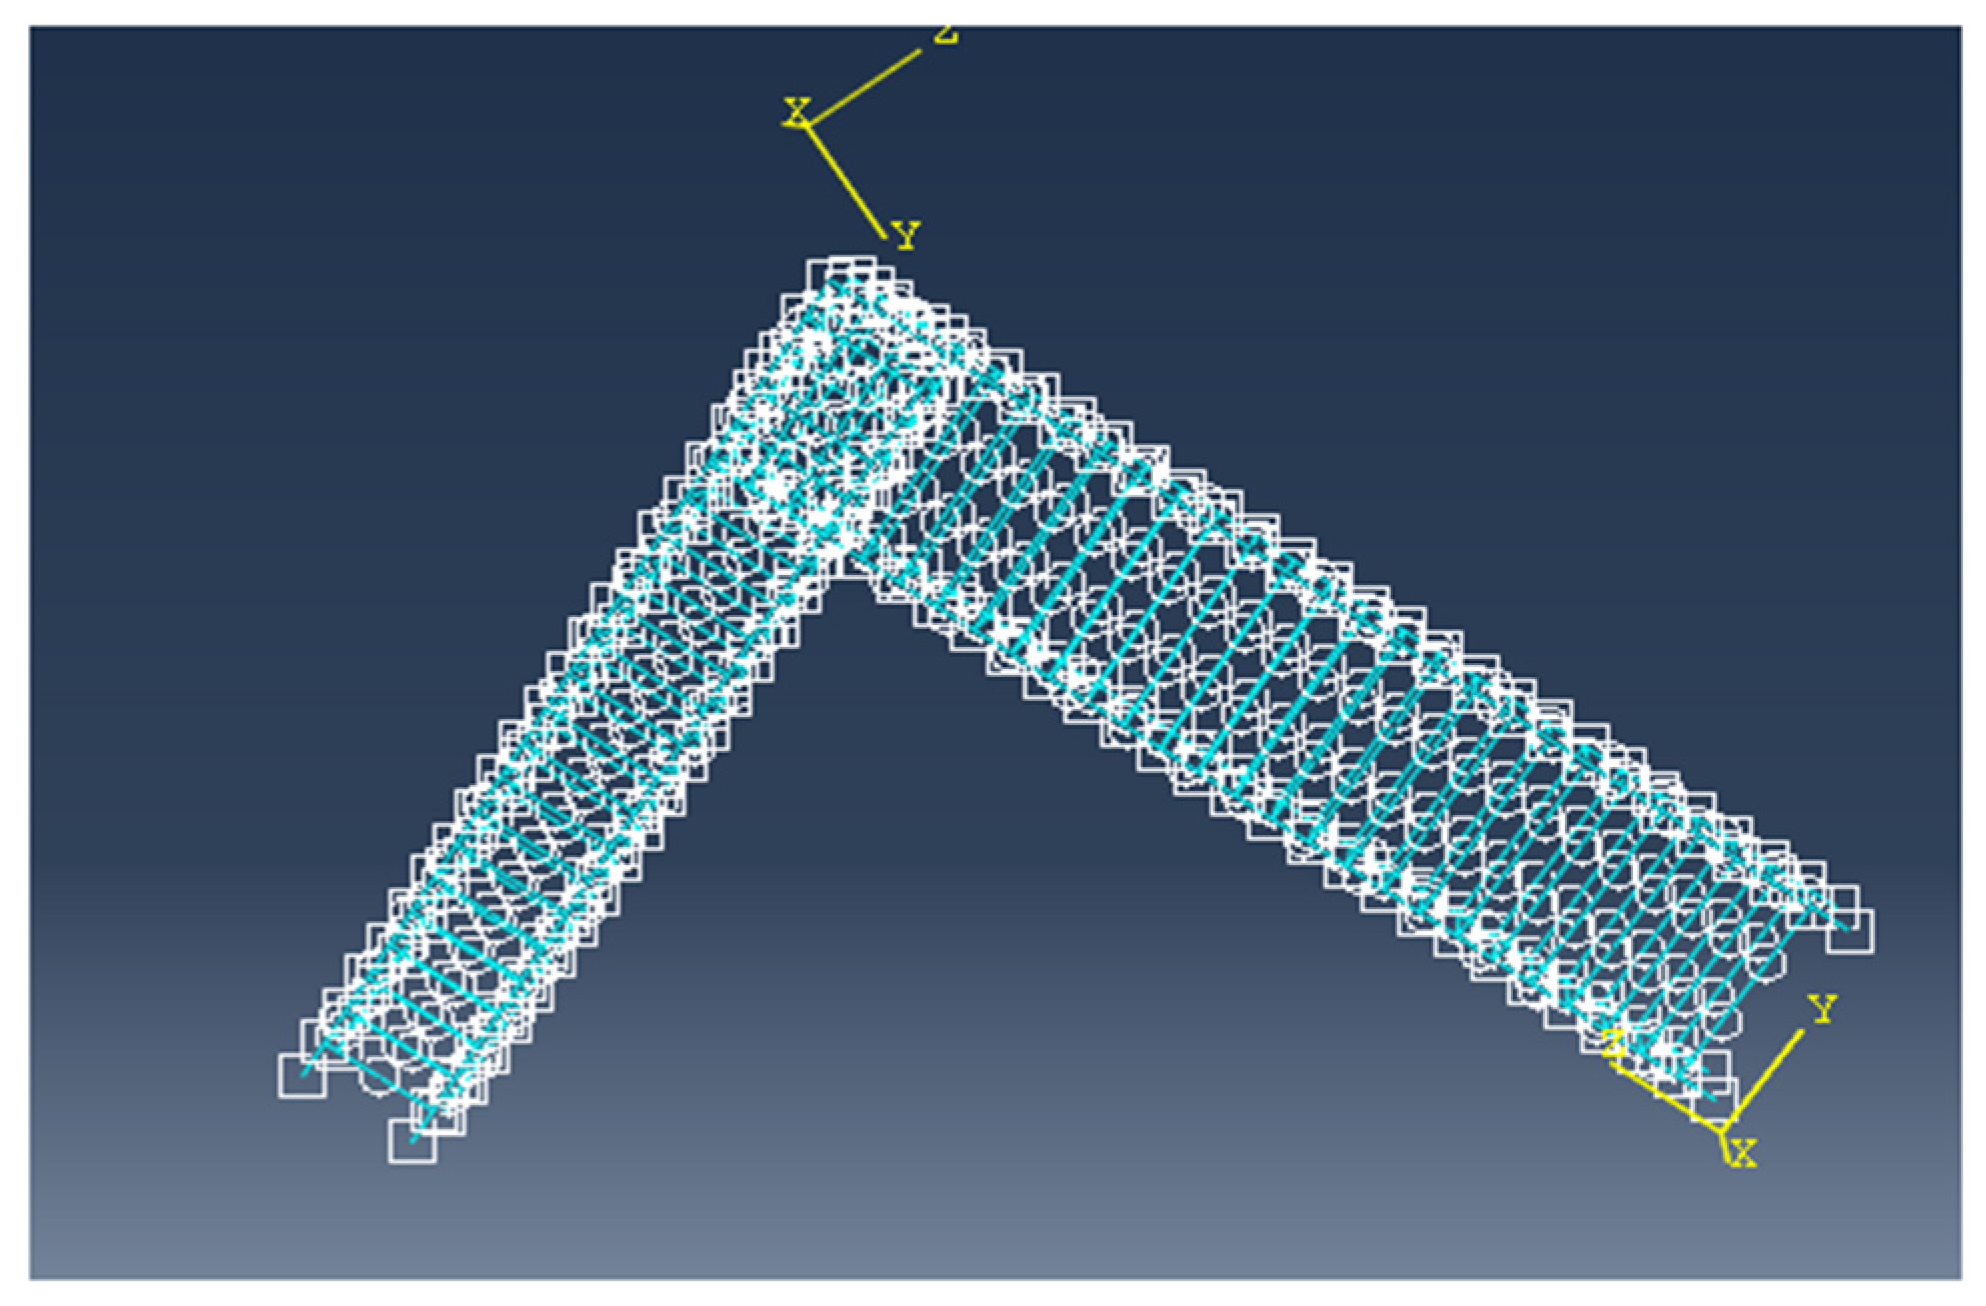
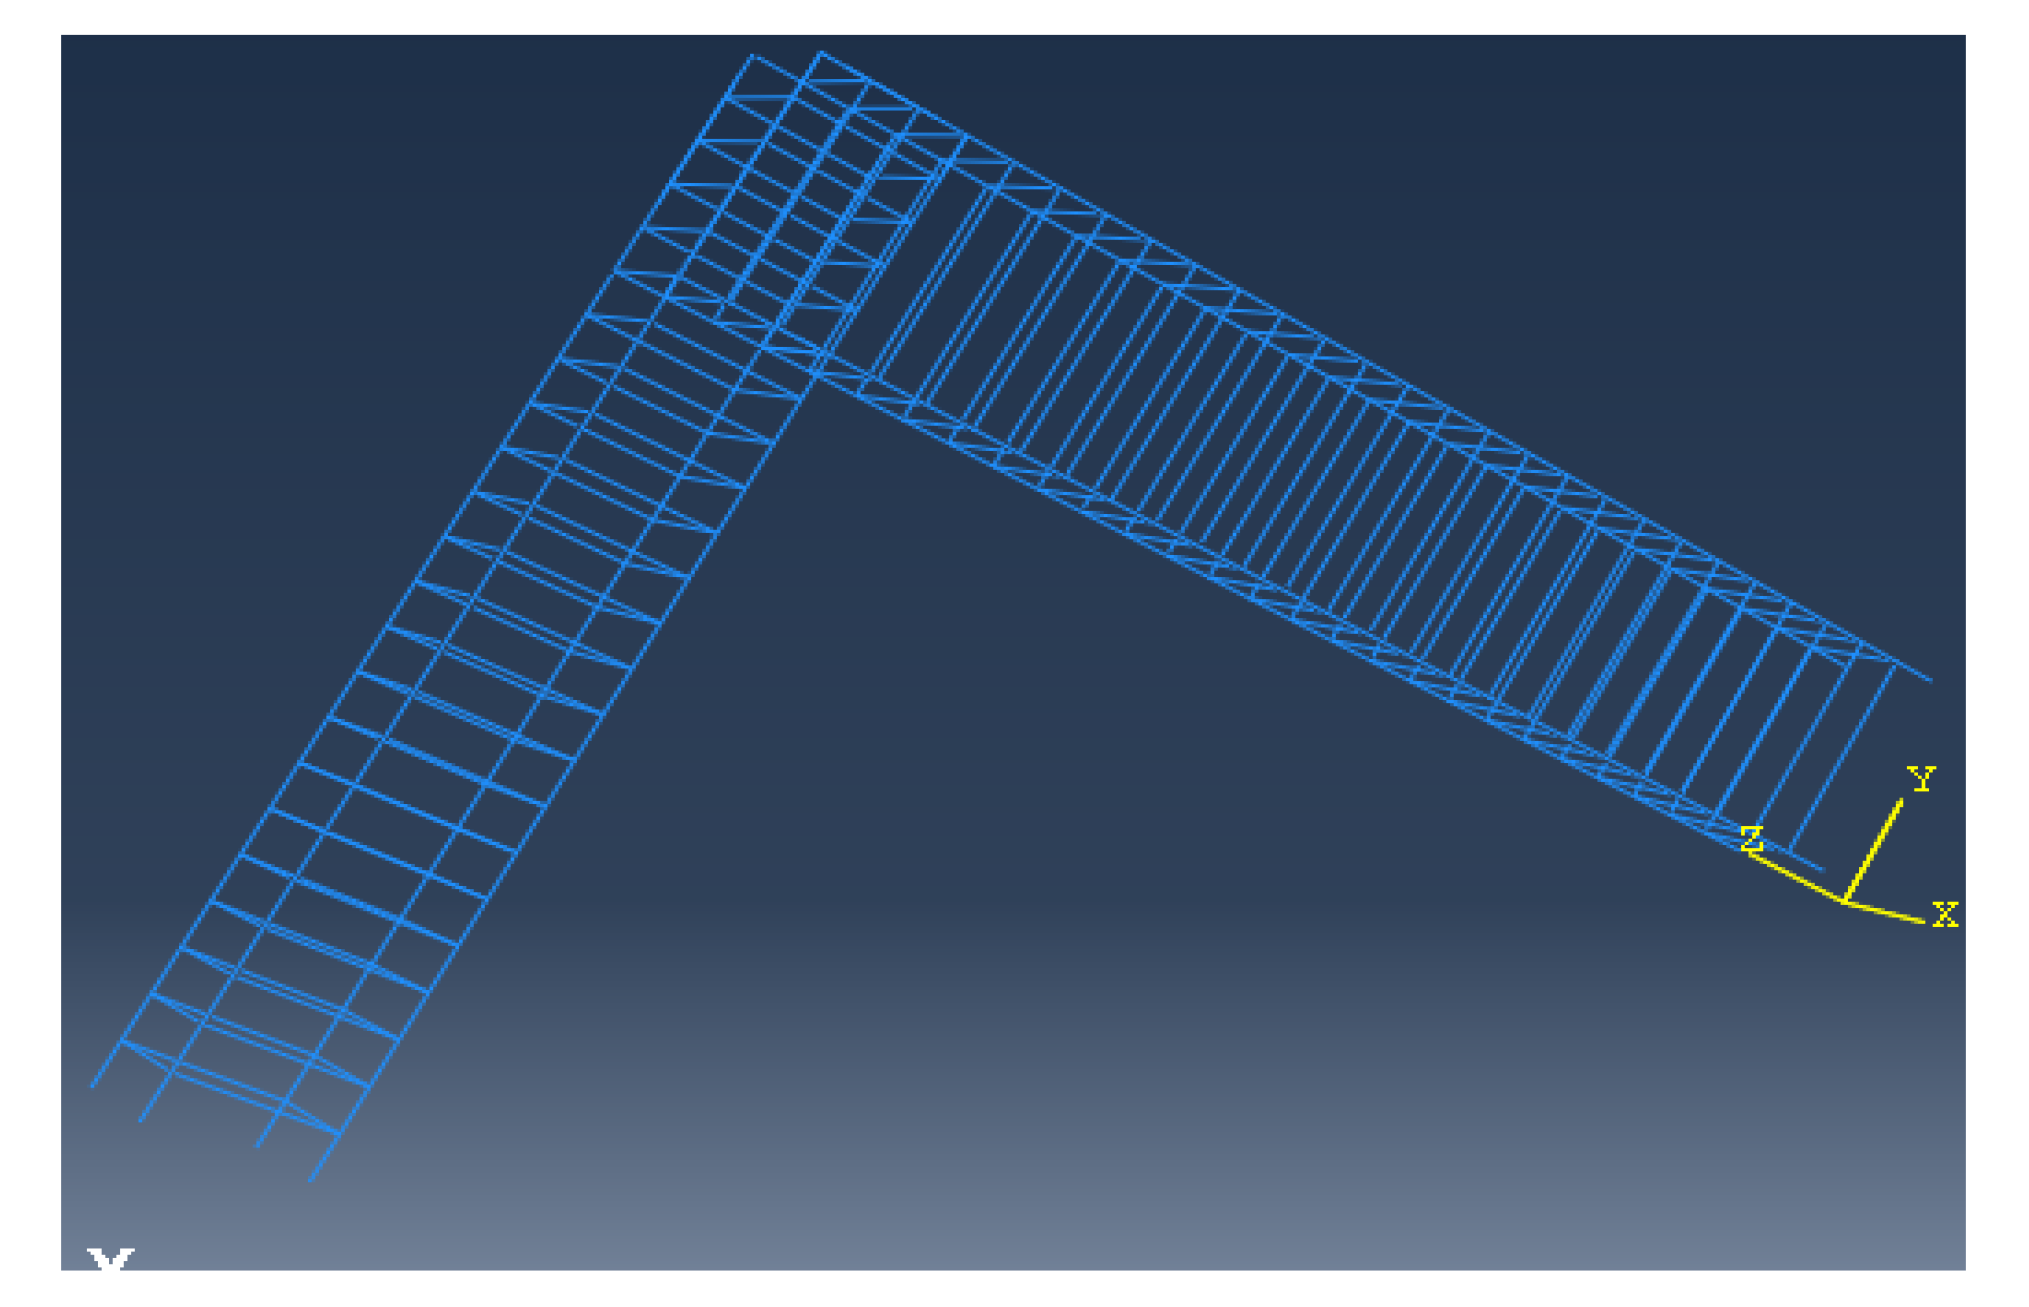
Meshing is the process of dividing the whole finite element model into a smaller number of chunks by the formation of different nodes at different points. Meshing is an important process as it allows us to apply load and find displacement or any other desired result at any point in the model. The greater the size of the mesh, the smaller will be the number of iterations taken to analyze the whole model and vice versa. In a greater size mesh, a lesser number of nodes are formed, hence the number of iterations and time of analysis is reduced. In our case, the size of the mesh taken was 25 mm, 40 mm, and 50 mm. Independent types of meshing for concrete and steel are selected in Figure 13, Figure 14 and Figure 15 [42].
3.5. Load
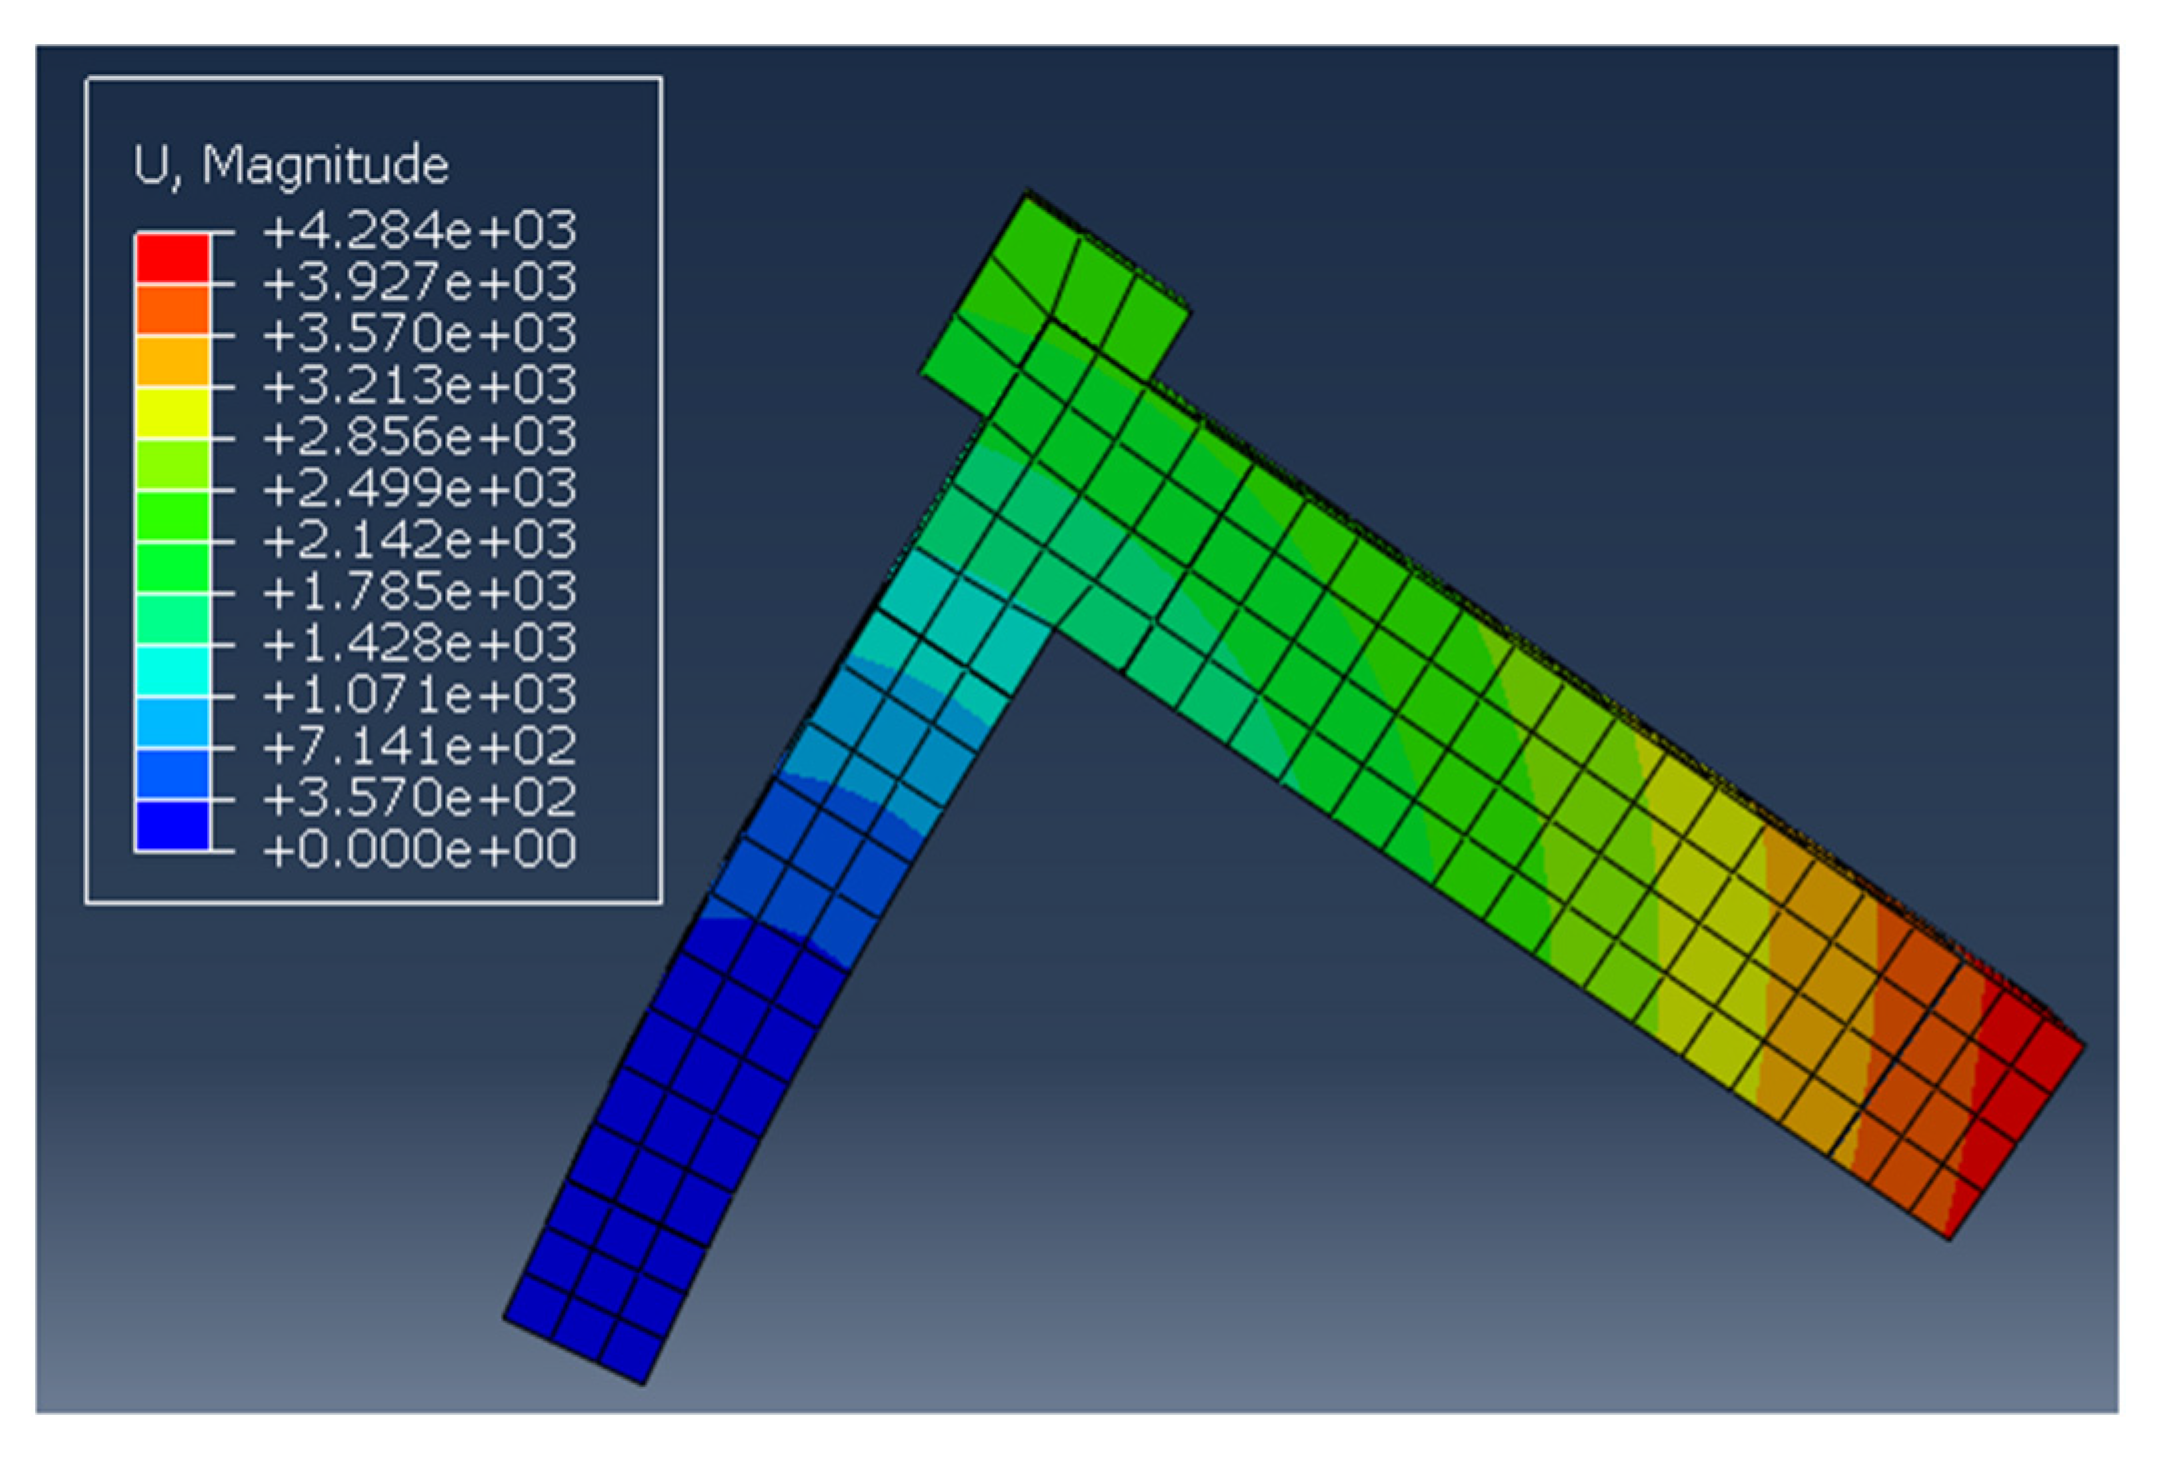
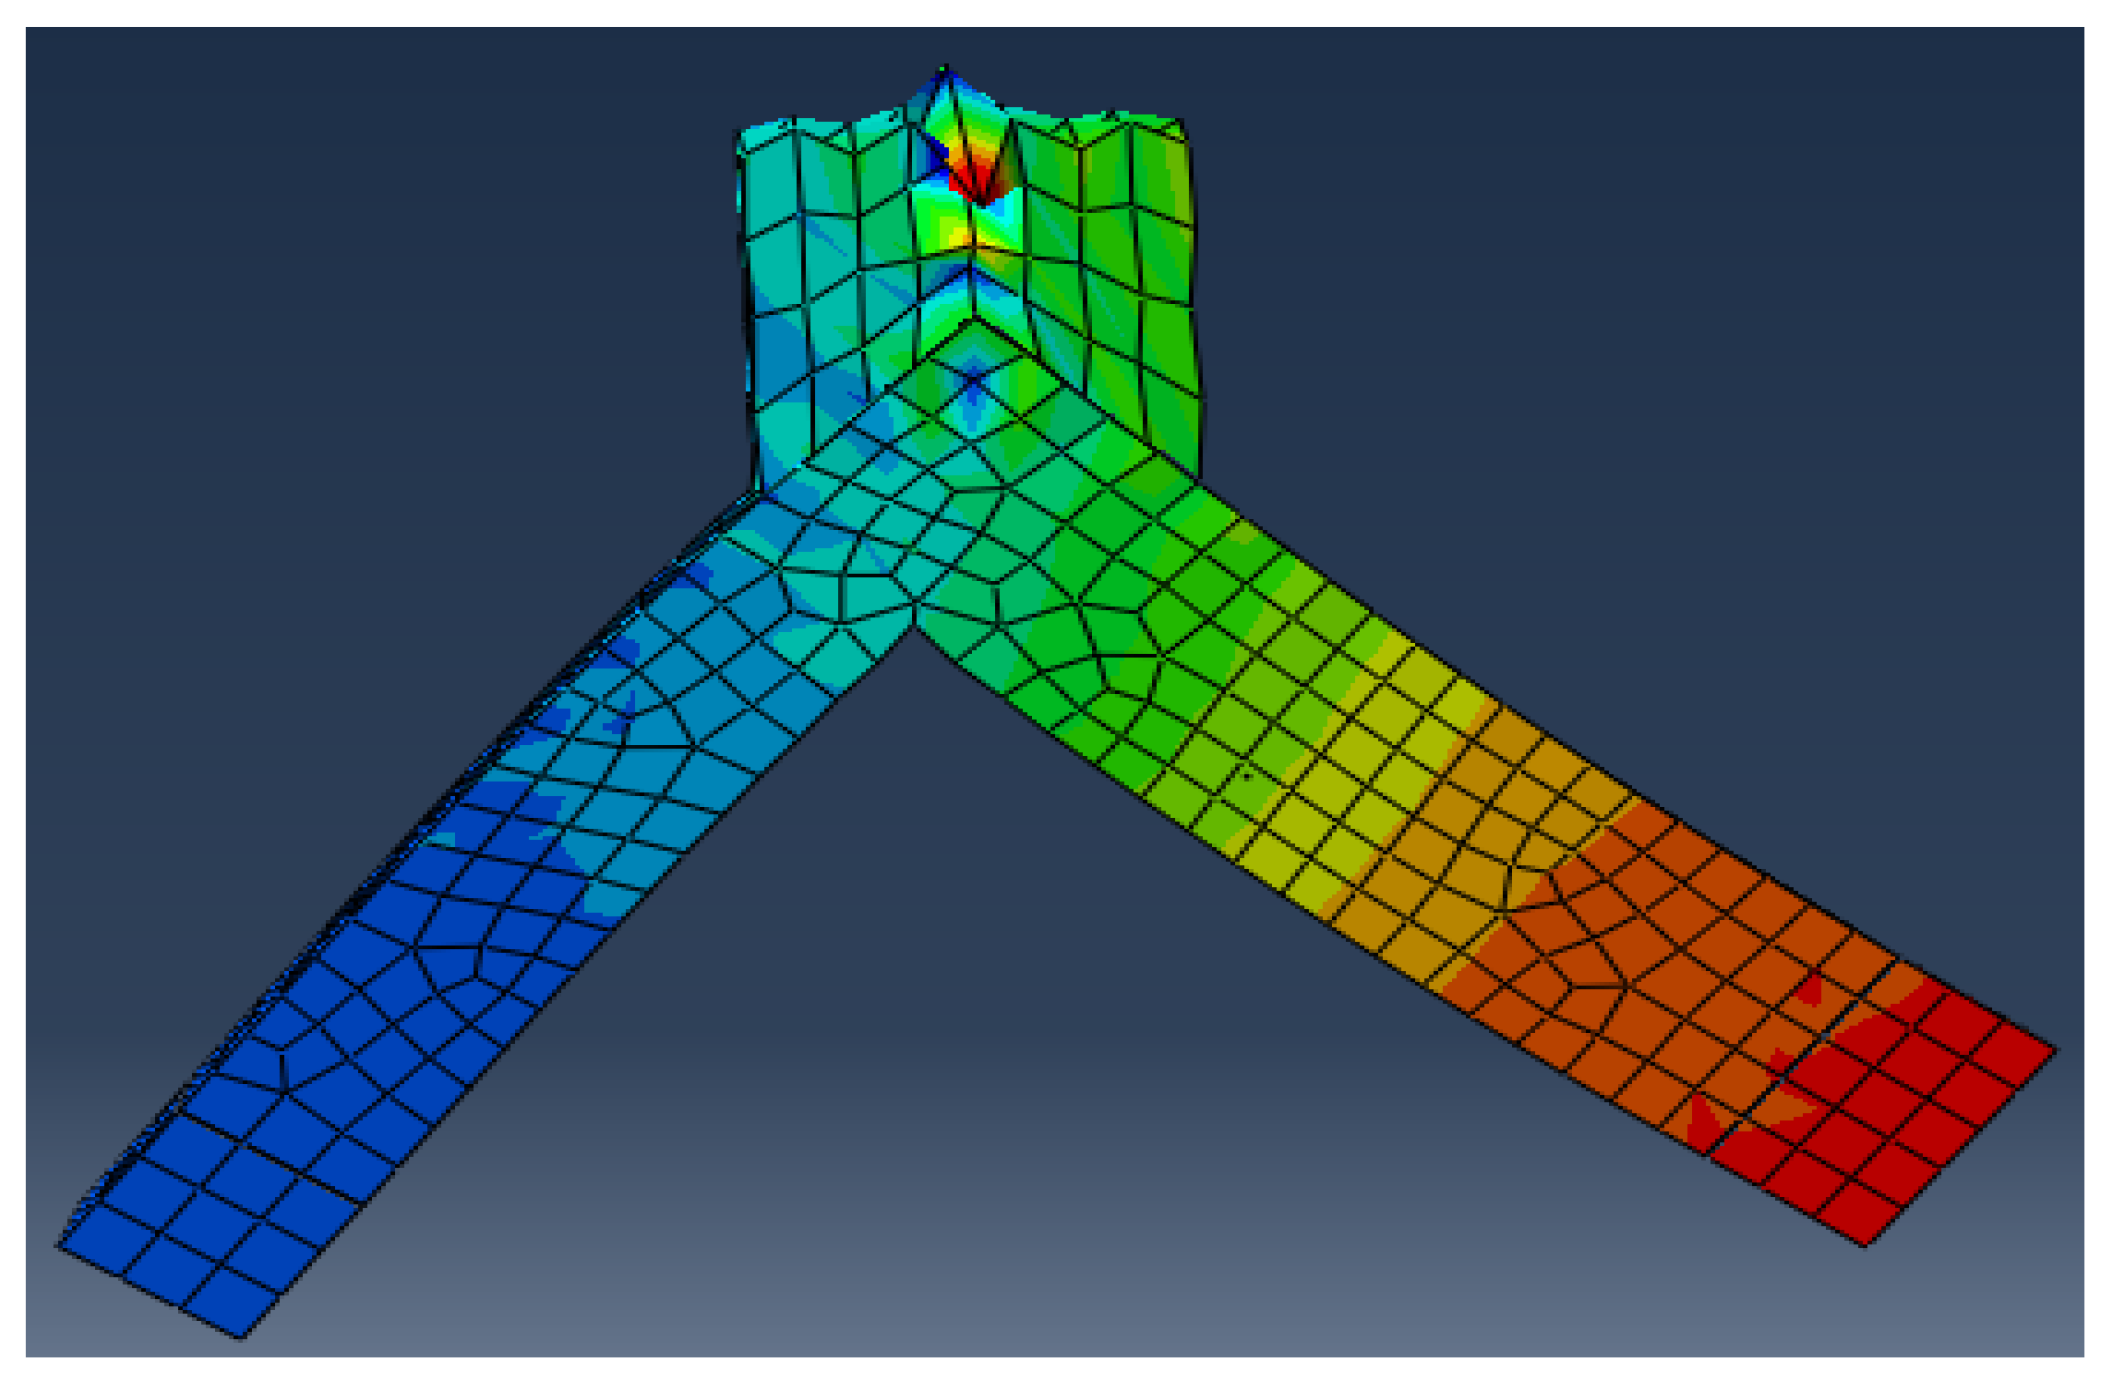
A series of analysis was performed on conventional concrete controlled specimens and RPC specimens to simulate and predict the actual response of linear and nonlinear behavior on beam-column joint and to show the behavior of RPC in improving the shear strength deformation against different structural loading. A monotonic load of 0 to 20 kN was applied at the top of the exterior joint for all specimens till the specimens reached the ultimate value. After the application of load, step was created for static analysis. Time period and increment values were given to all specimens. Figure 16 and Figure 17 show the analysis of RPC samples with fixed and hinge boundary conditions, respectively. As seen in Figure 16, a small amount of buckling was observed when the column boundary condition was kept fixed, whereas no buckling was observed in the case of hinge column conditions as seen in Figure 17.
4. Results and Discussion
Experimental results of shear strength-deformation improvement for vulnerable beam-column connection using RPC were used to validate the developed FEM approach. Different parameters from experimental work were used in numerical modeling. This approach provided a more realistic response simulation of the actual beam-column joint. The numerical results were compared with experimental results for the verification of the model as shown in Table 3. There was a negligible deviation of numerical results from experimental results for controlled concrete samples in case of maximum loads. It was 1.13% and 0.63% for CC_S1 and CC_S2, respectively. For RPC samples, the divergence was comparatively higher. It was 6.05% for RPC_S1 and 6.73% for RPC_S2. Maximum displacement variation was 7.06%, 4.18%, 3.12%, and 6.54% for CC_S1, CC_S2, RPC_S1, and RPC_S2, respectively. The maximum variation observed was 7.06% for CC_S1 for displacement. This shows that numerical results were in strong agreement with the experimental results.
4.1. Load Displacement Curve
4.1.1. Conventional Concrete Controlled Specimens
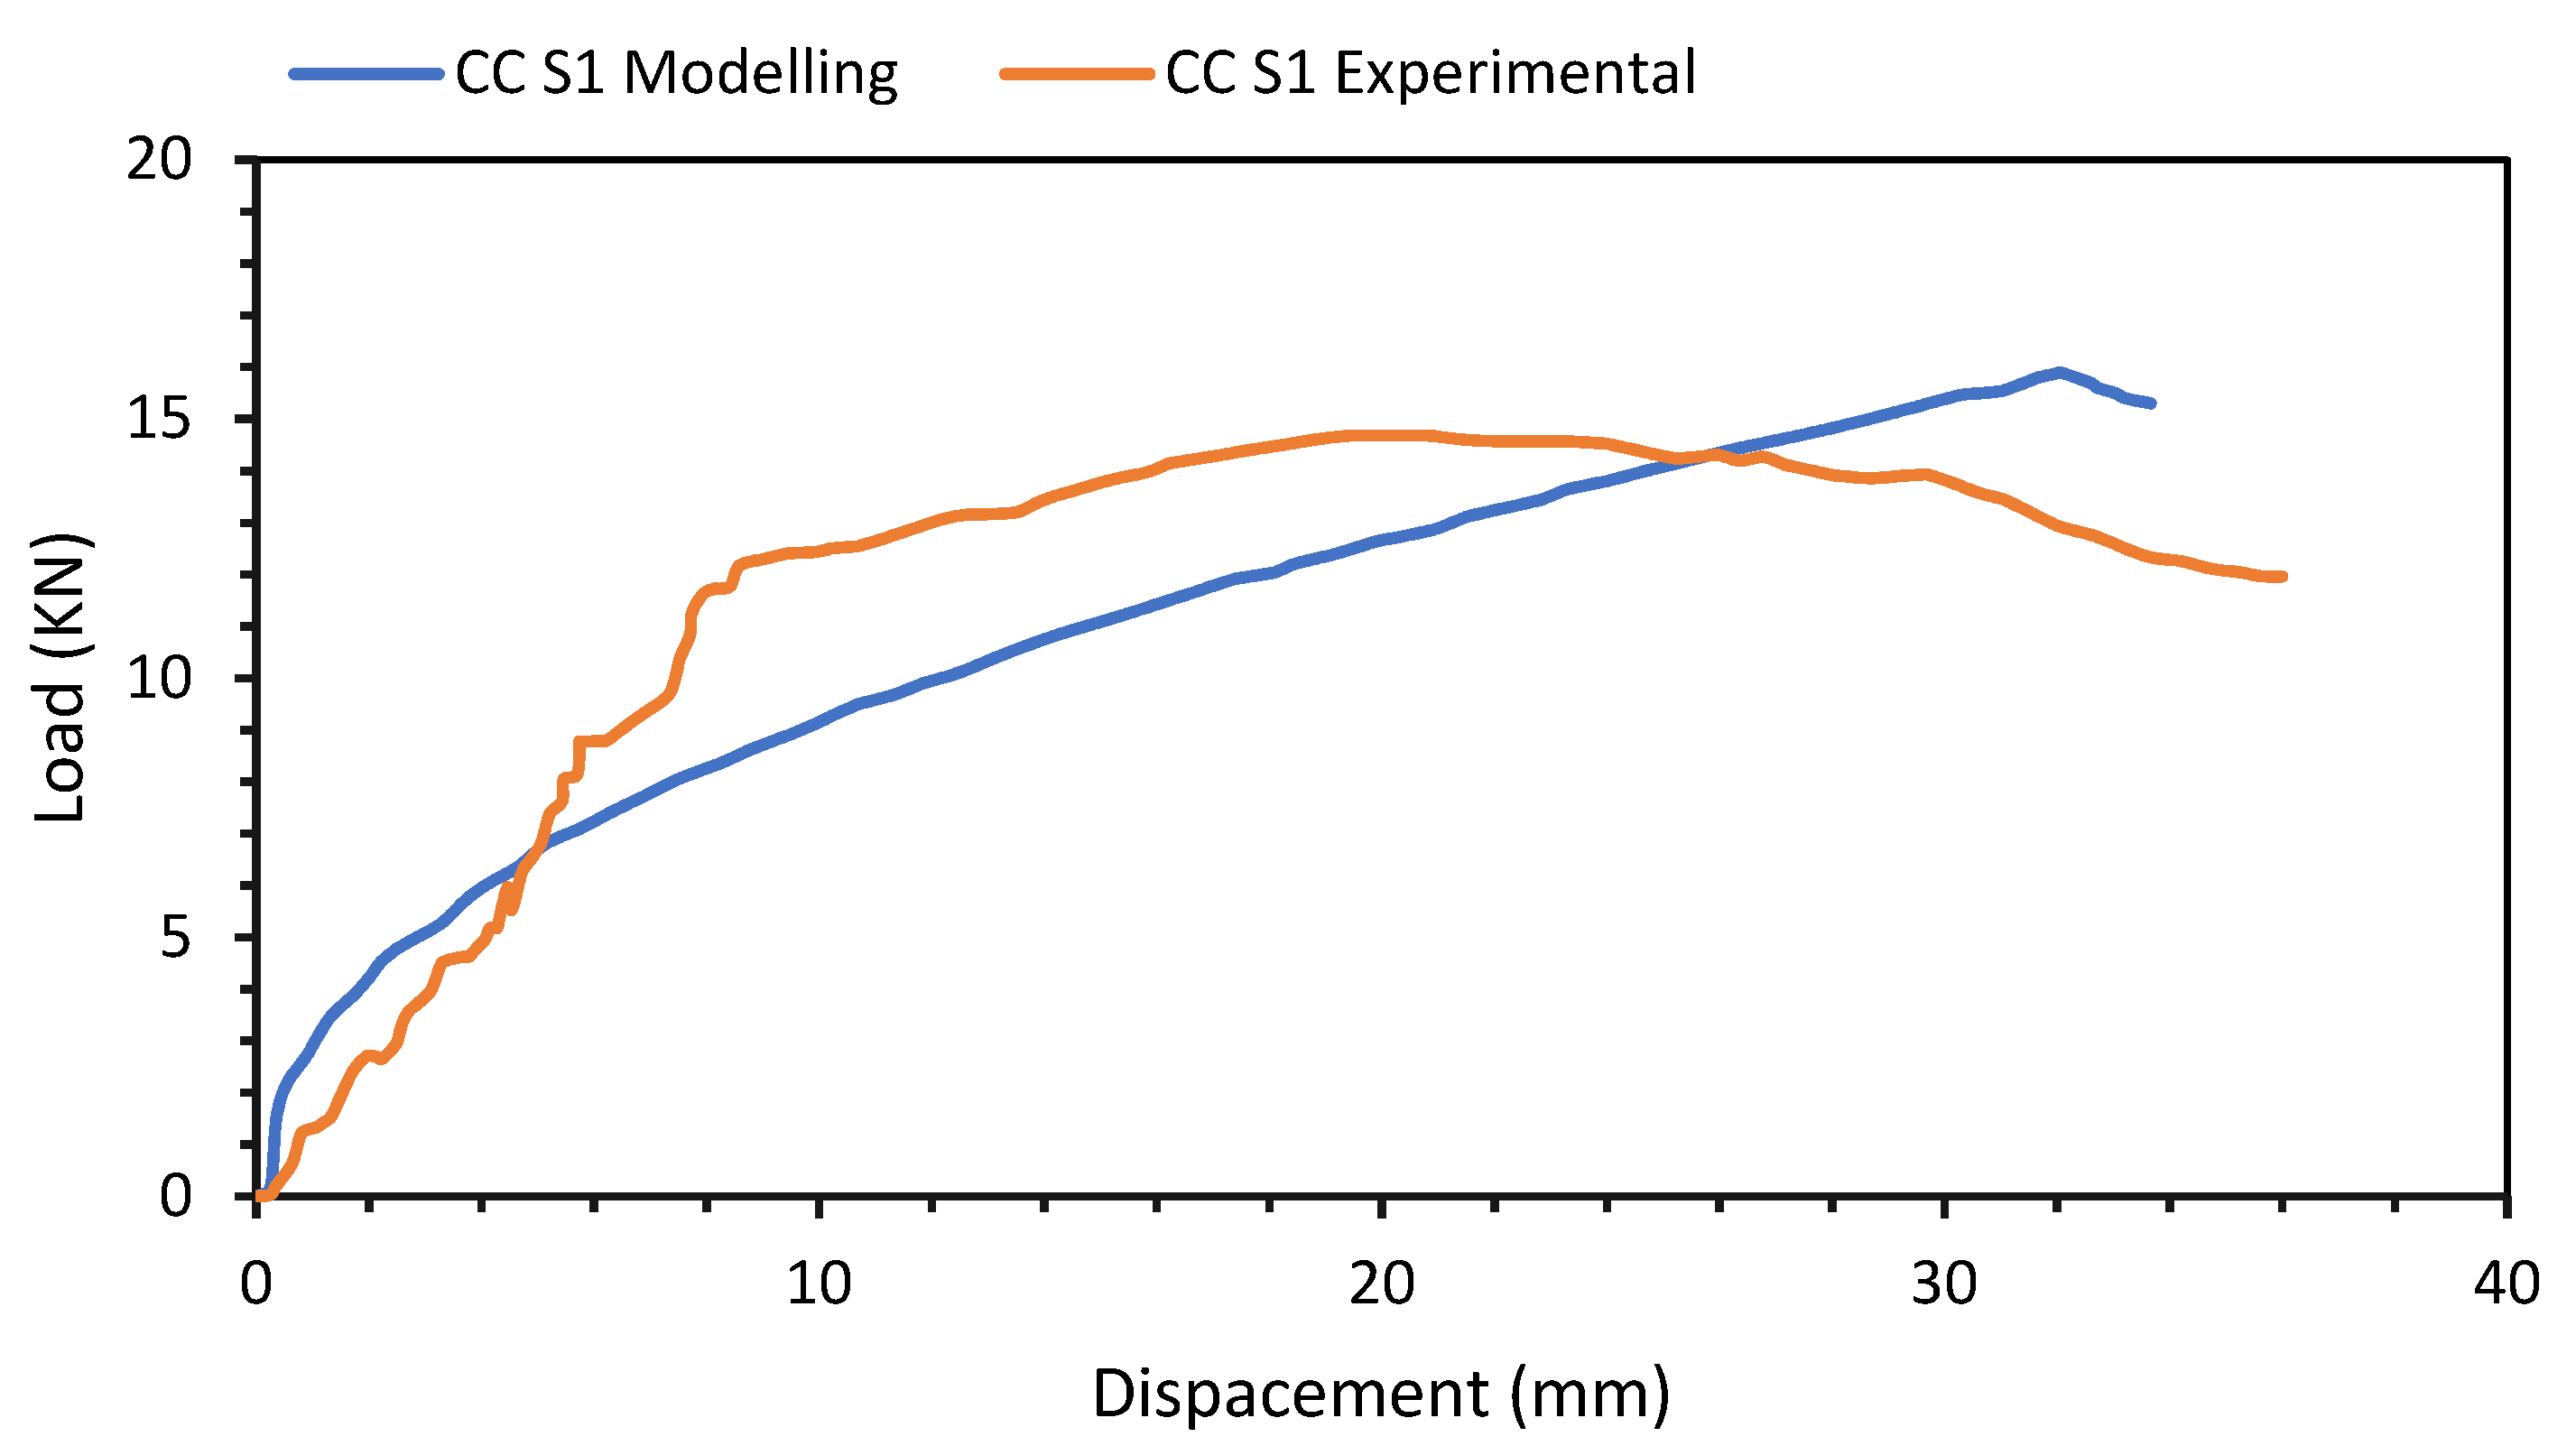
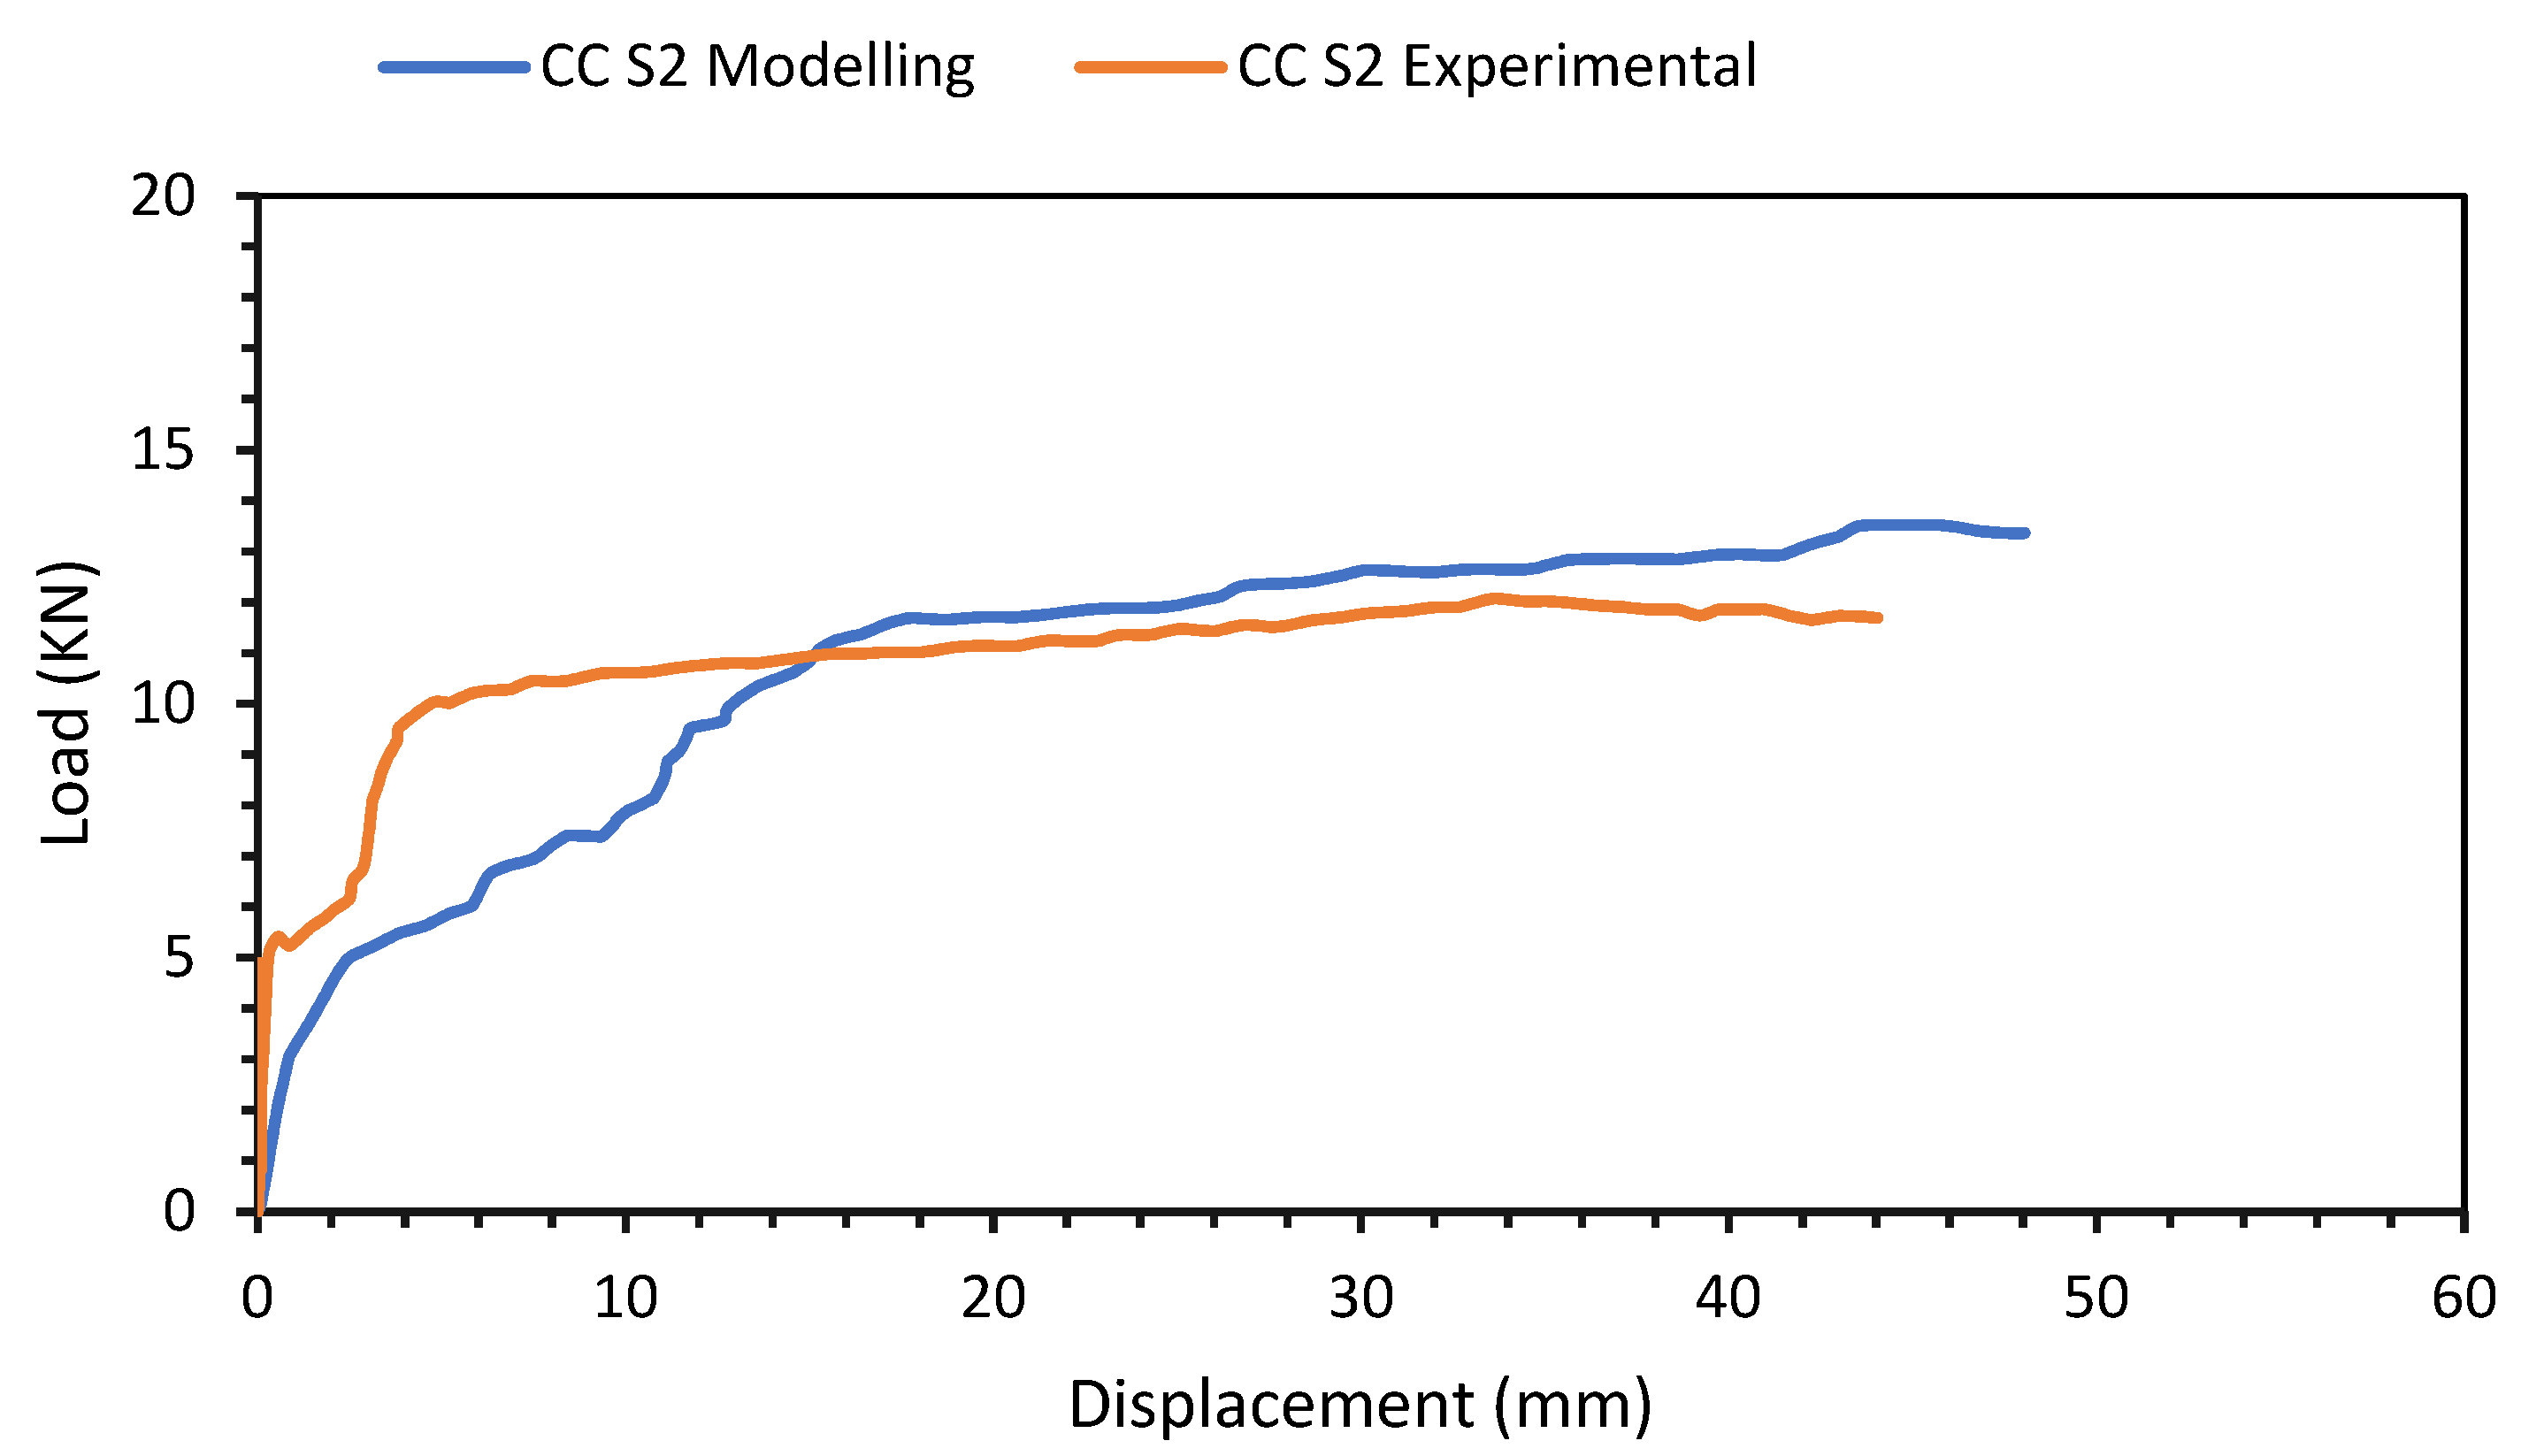
The comparison of the load-displacement curve obtained from experimental and ABAQUS simulations are shown in Figure 18, Figure 19, Figure 20 and Figure 21. The shape of the ABAQUS simulations curves is quite close to the experimental curves. The maximum average discrepancy between modeling and experimental results of conventional concrete was 3–7%. Almost linear behavior was obtained using ABAQUS modeling for CC_S1 whereas in experimental work the pattern of the graph showed nonlinearity which might be due to non-uniform increment of load in the experimental setup.
4.1.2. RPC Specimens
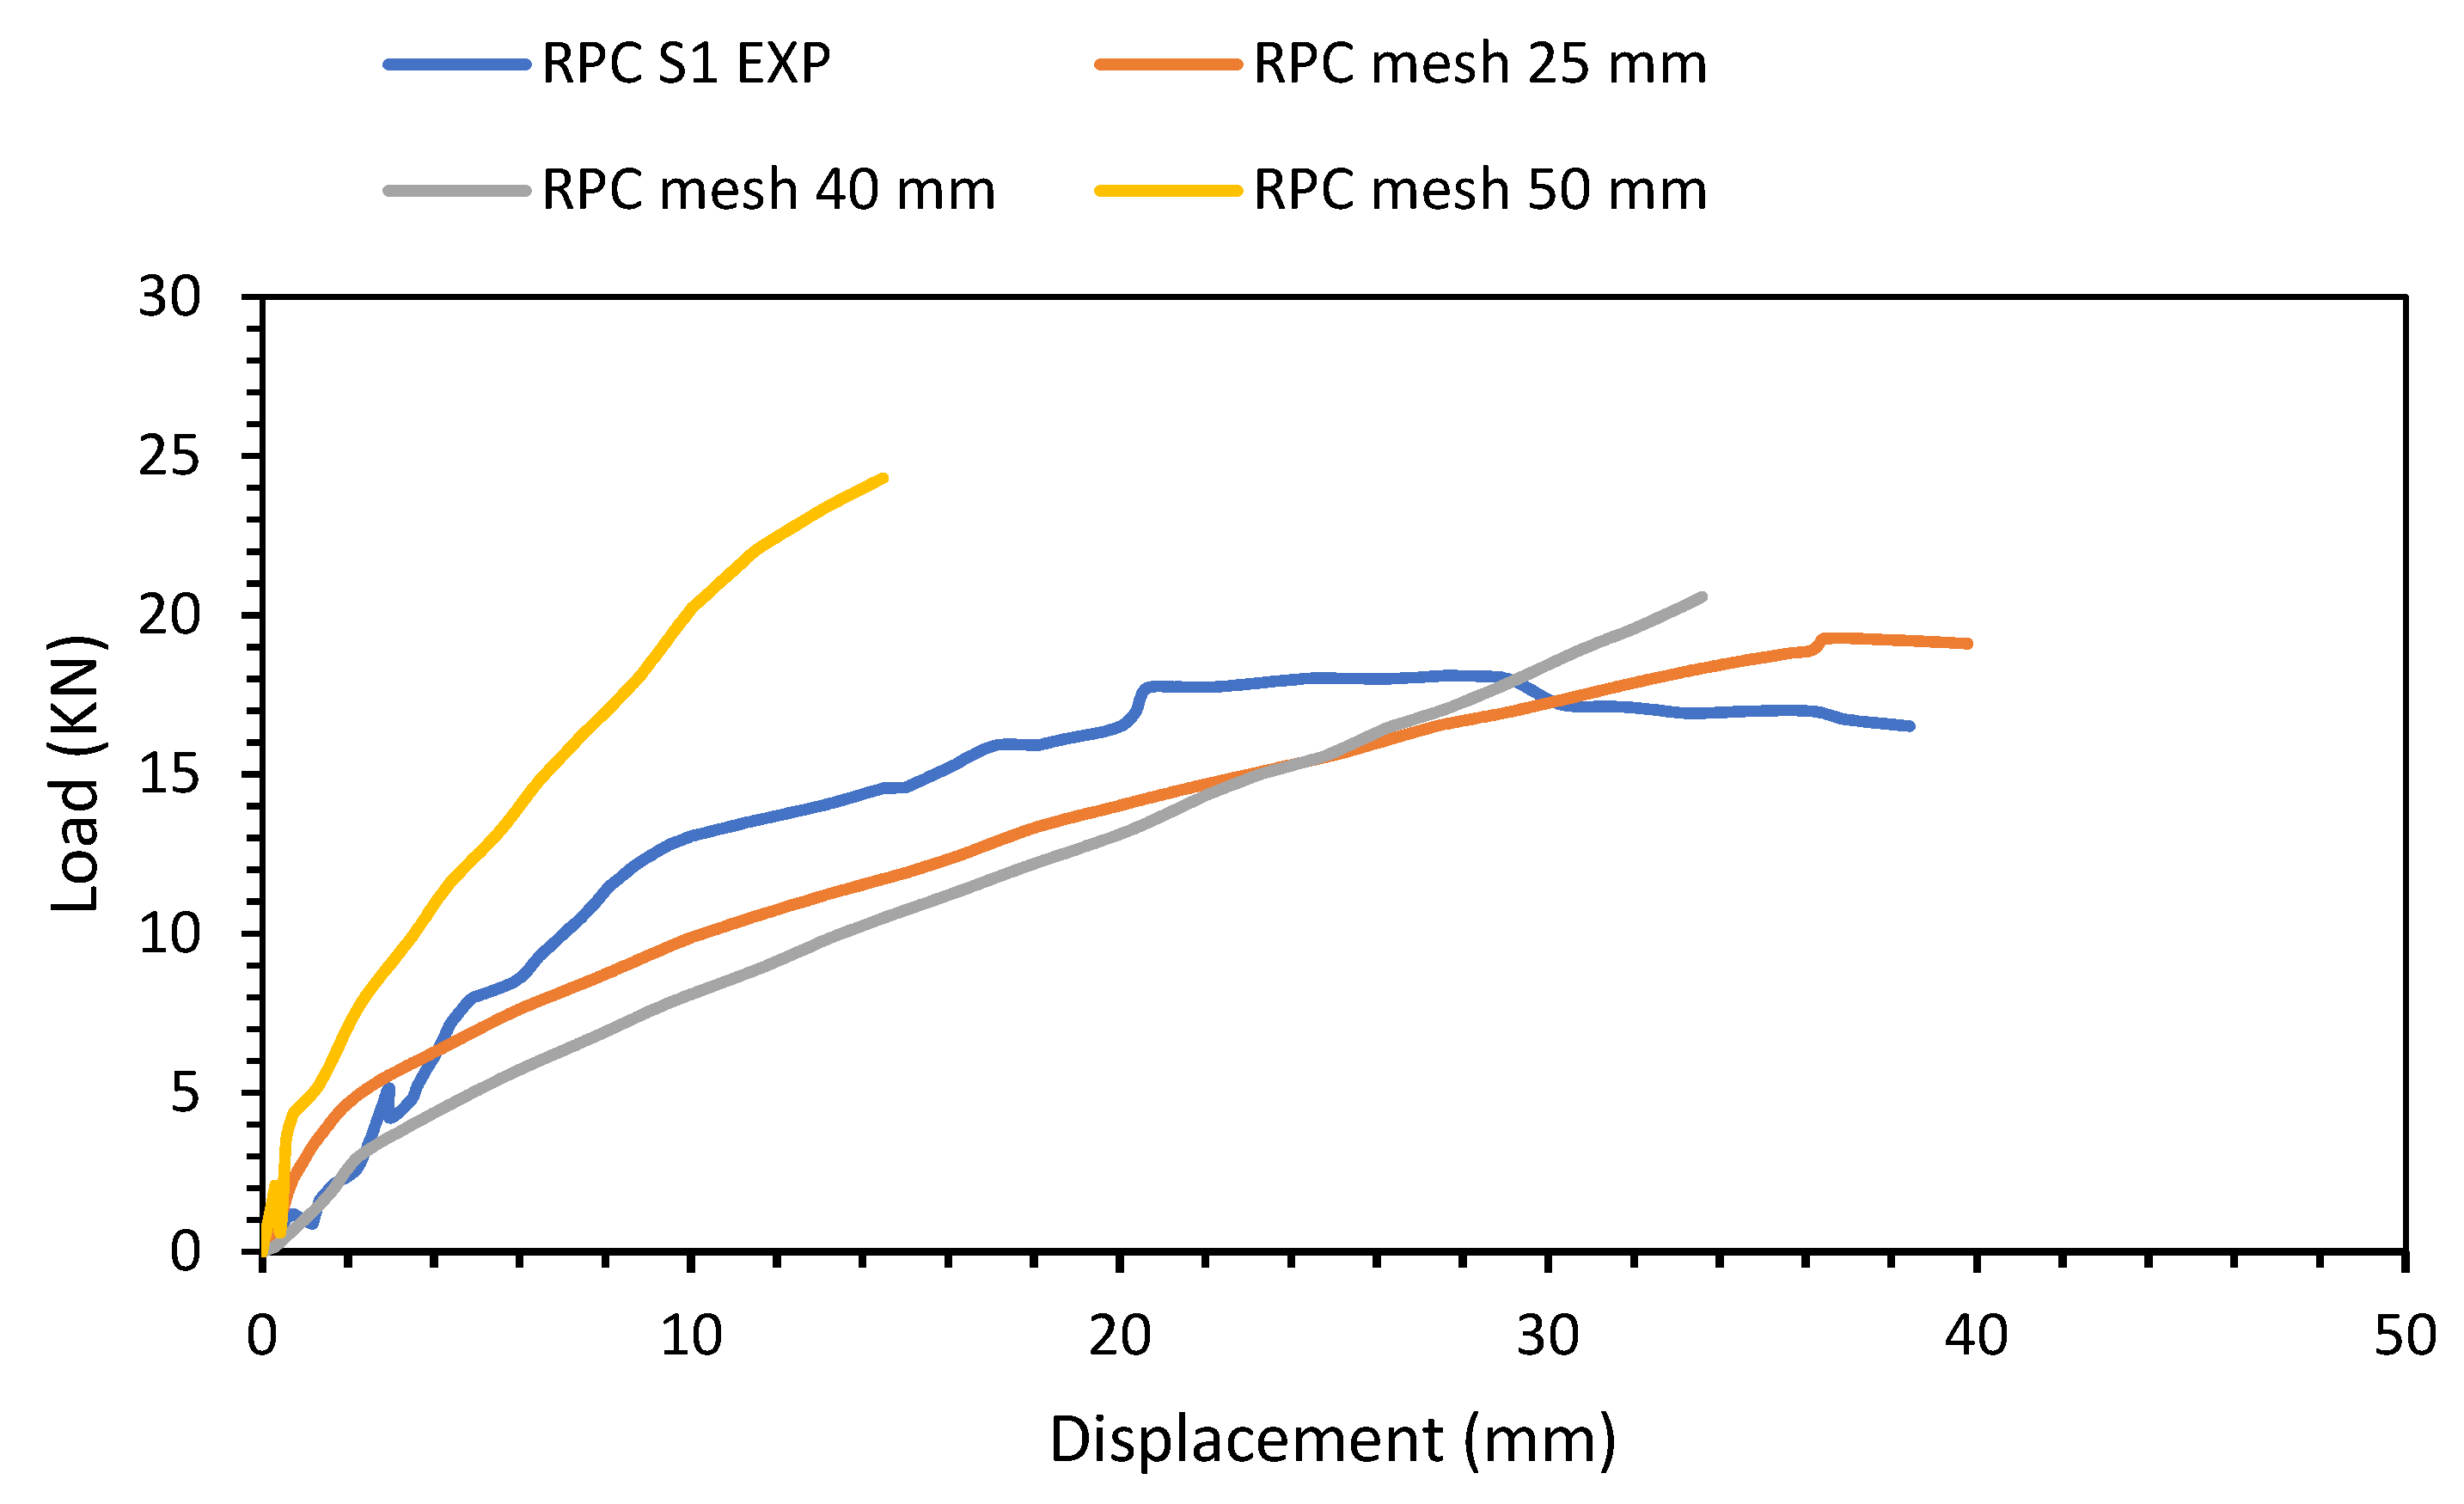
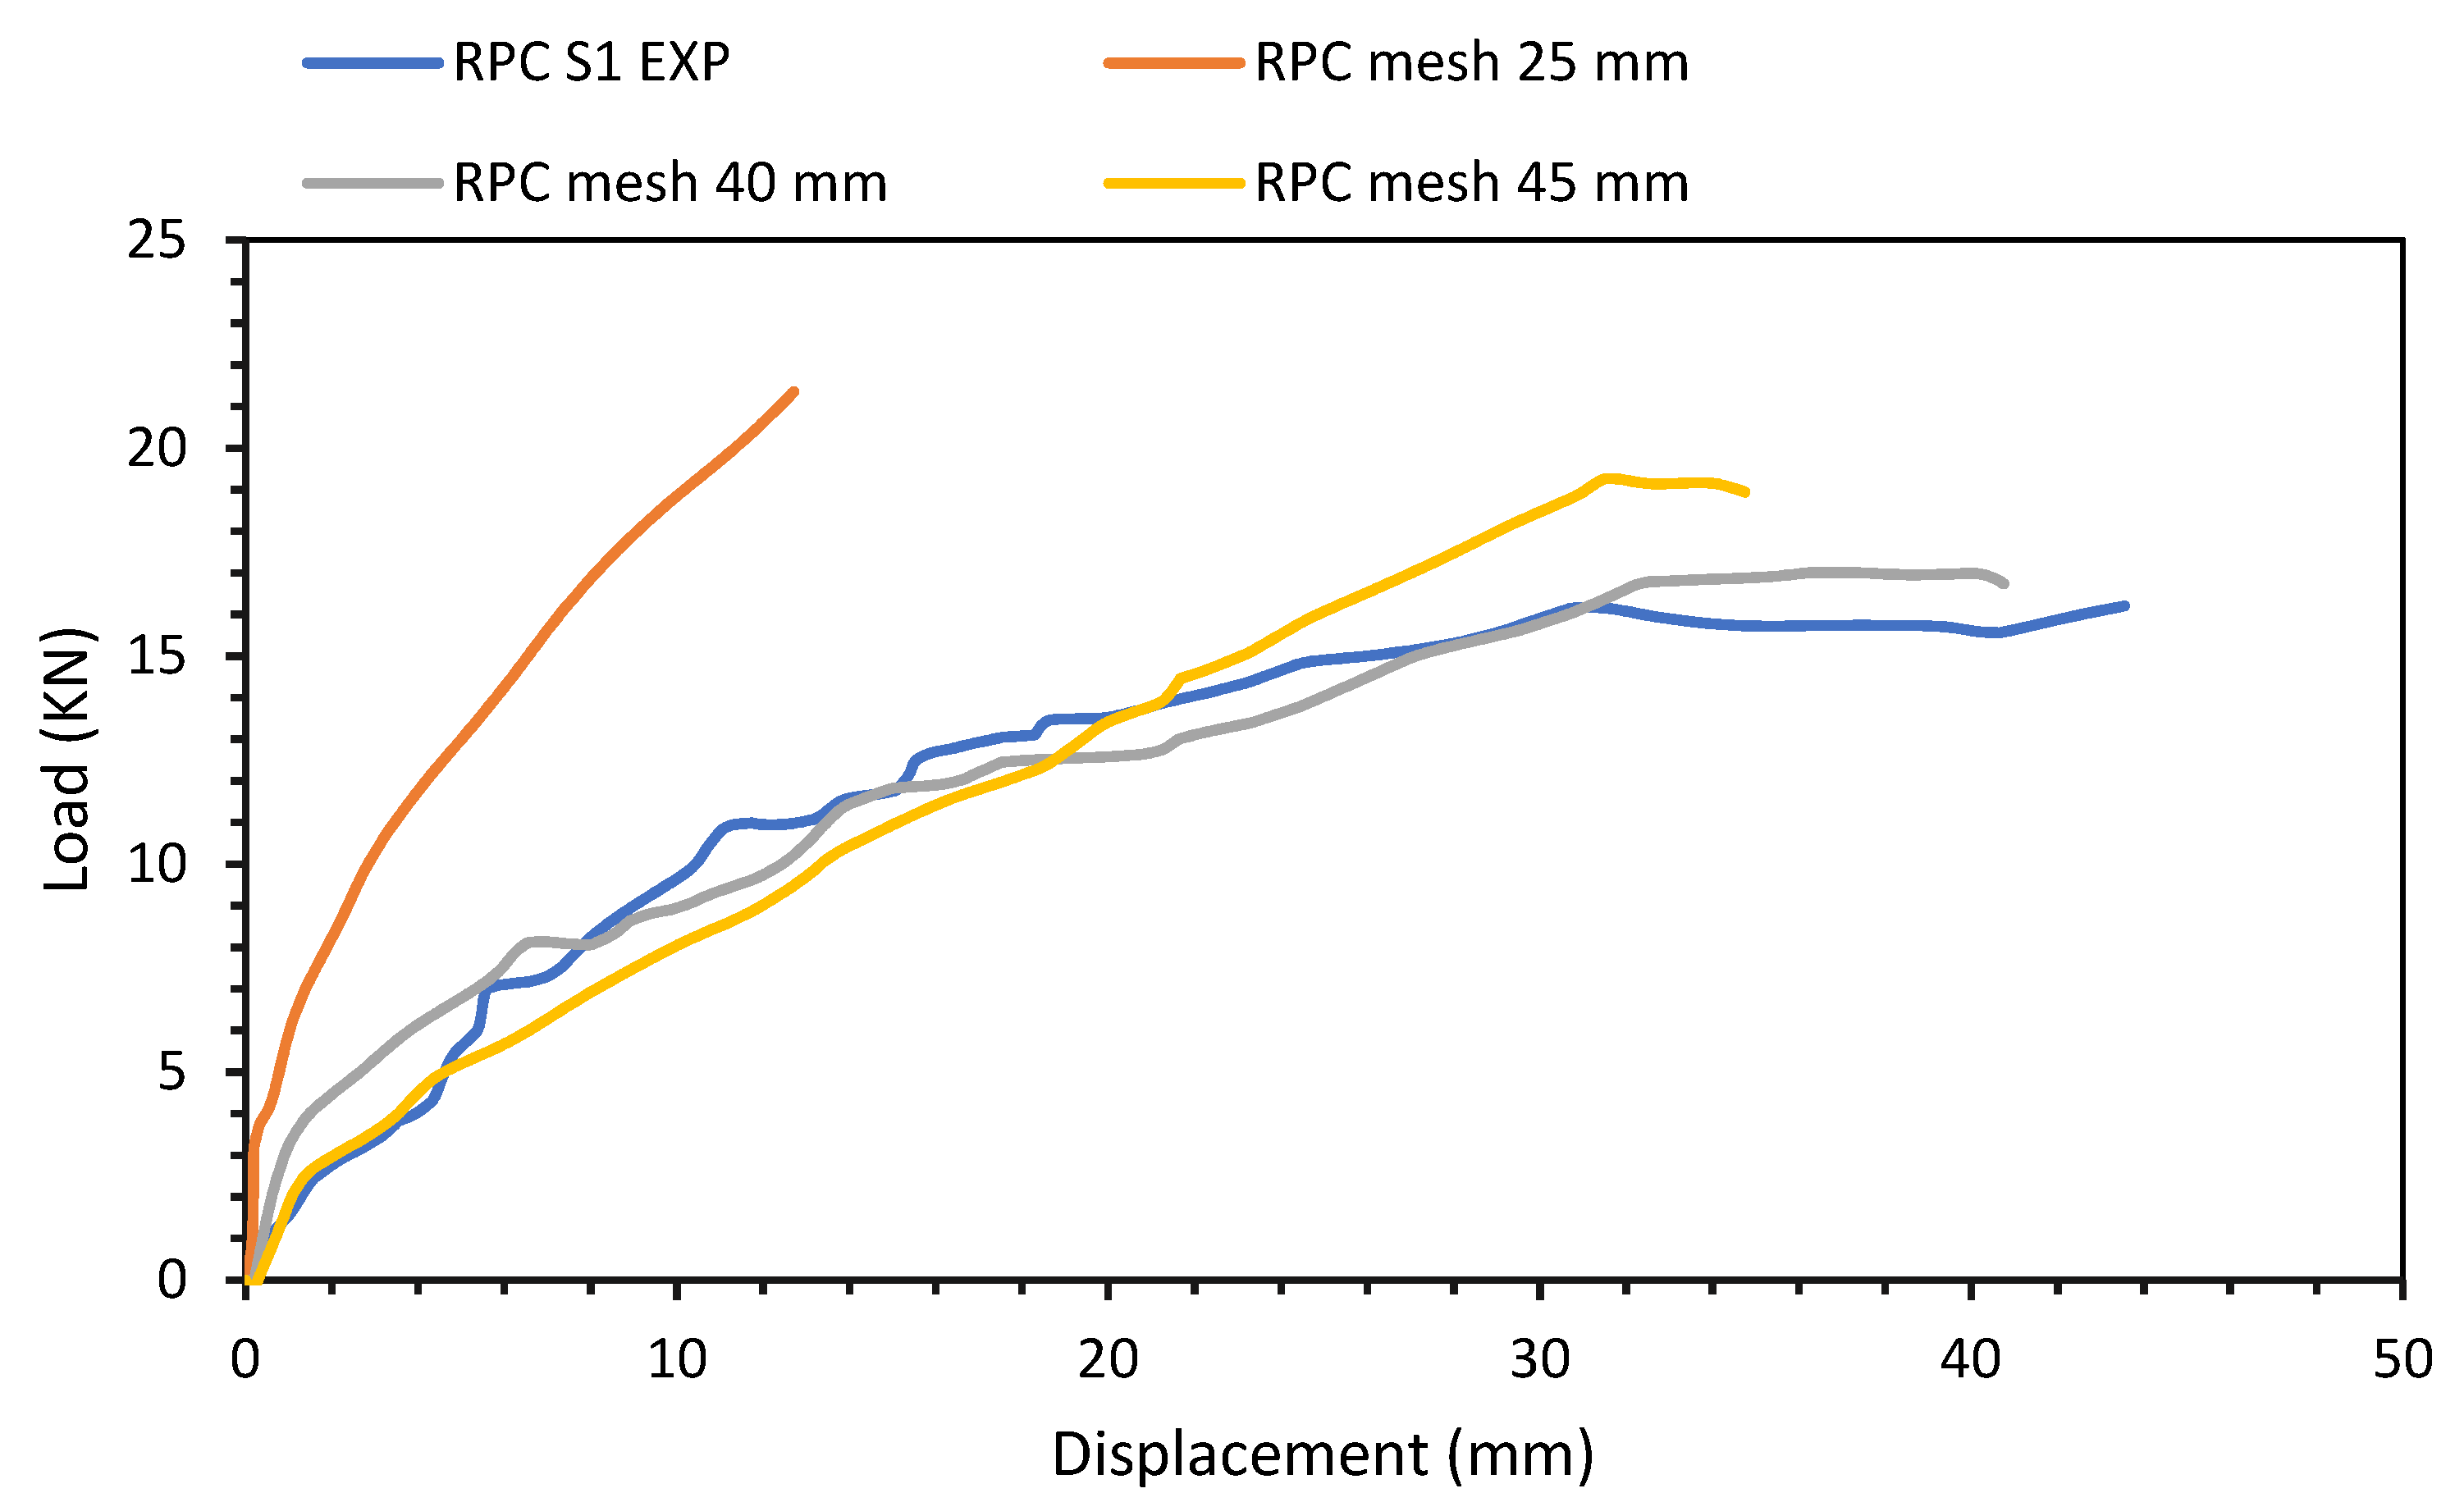
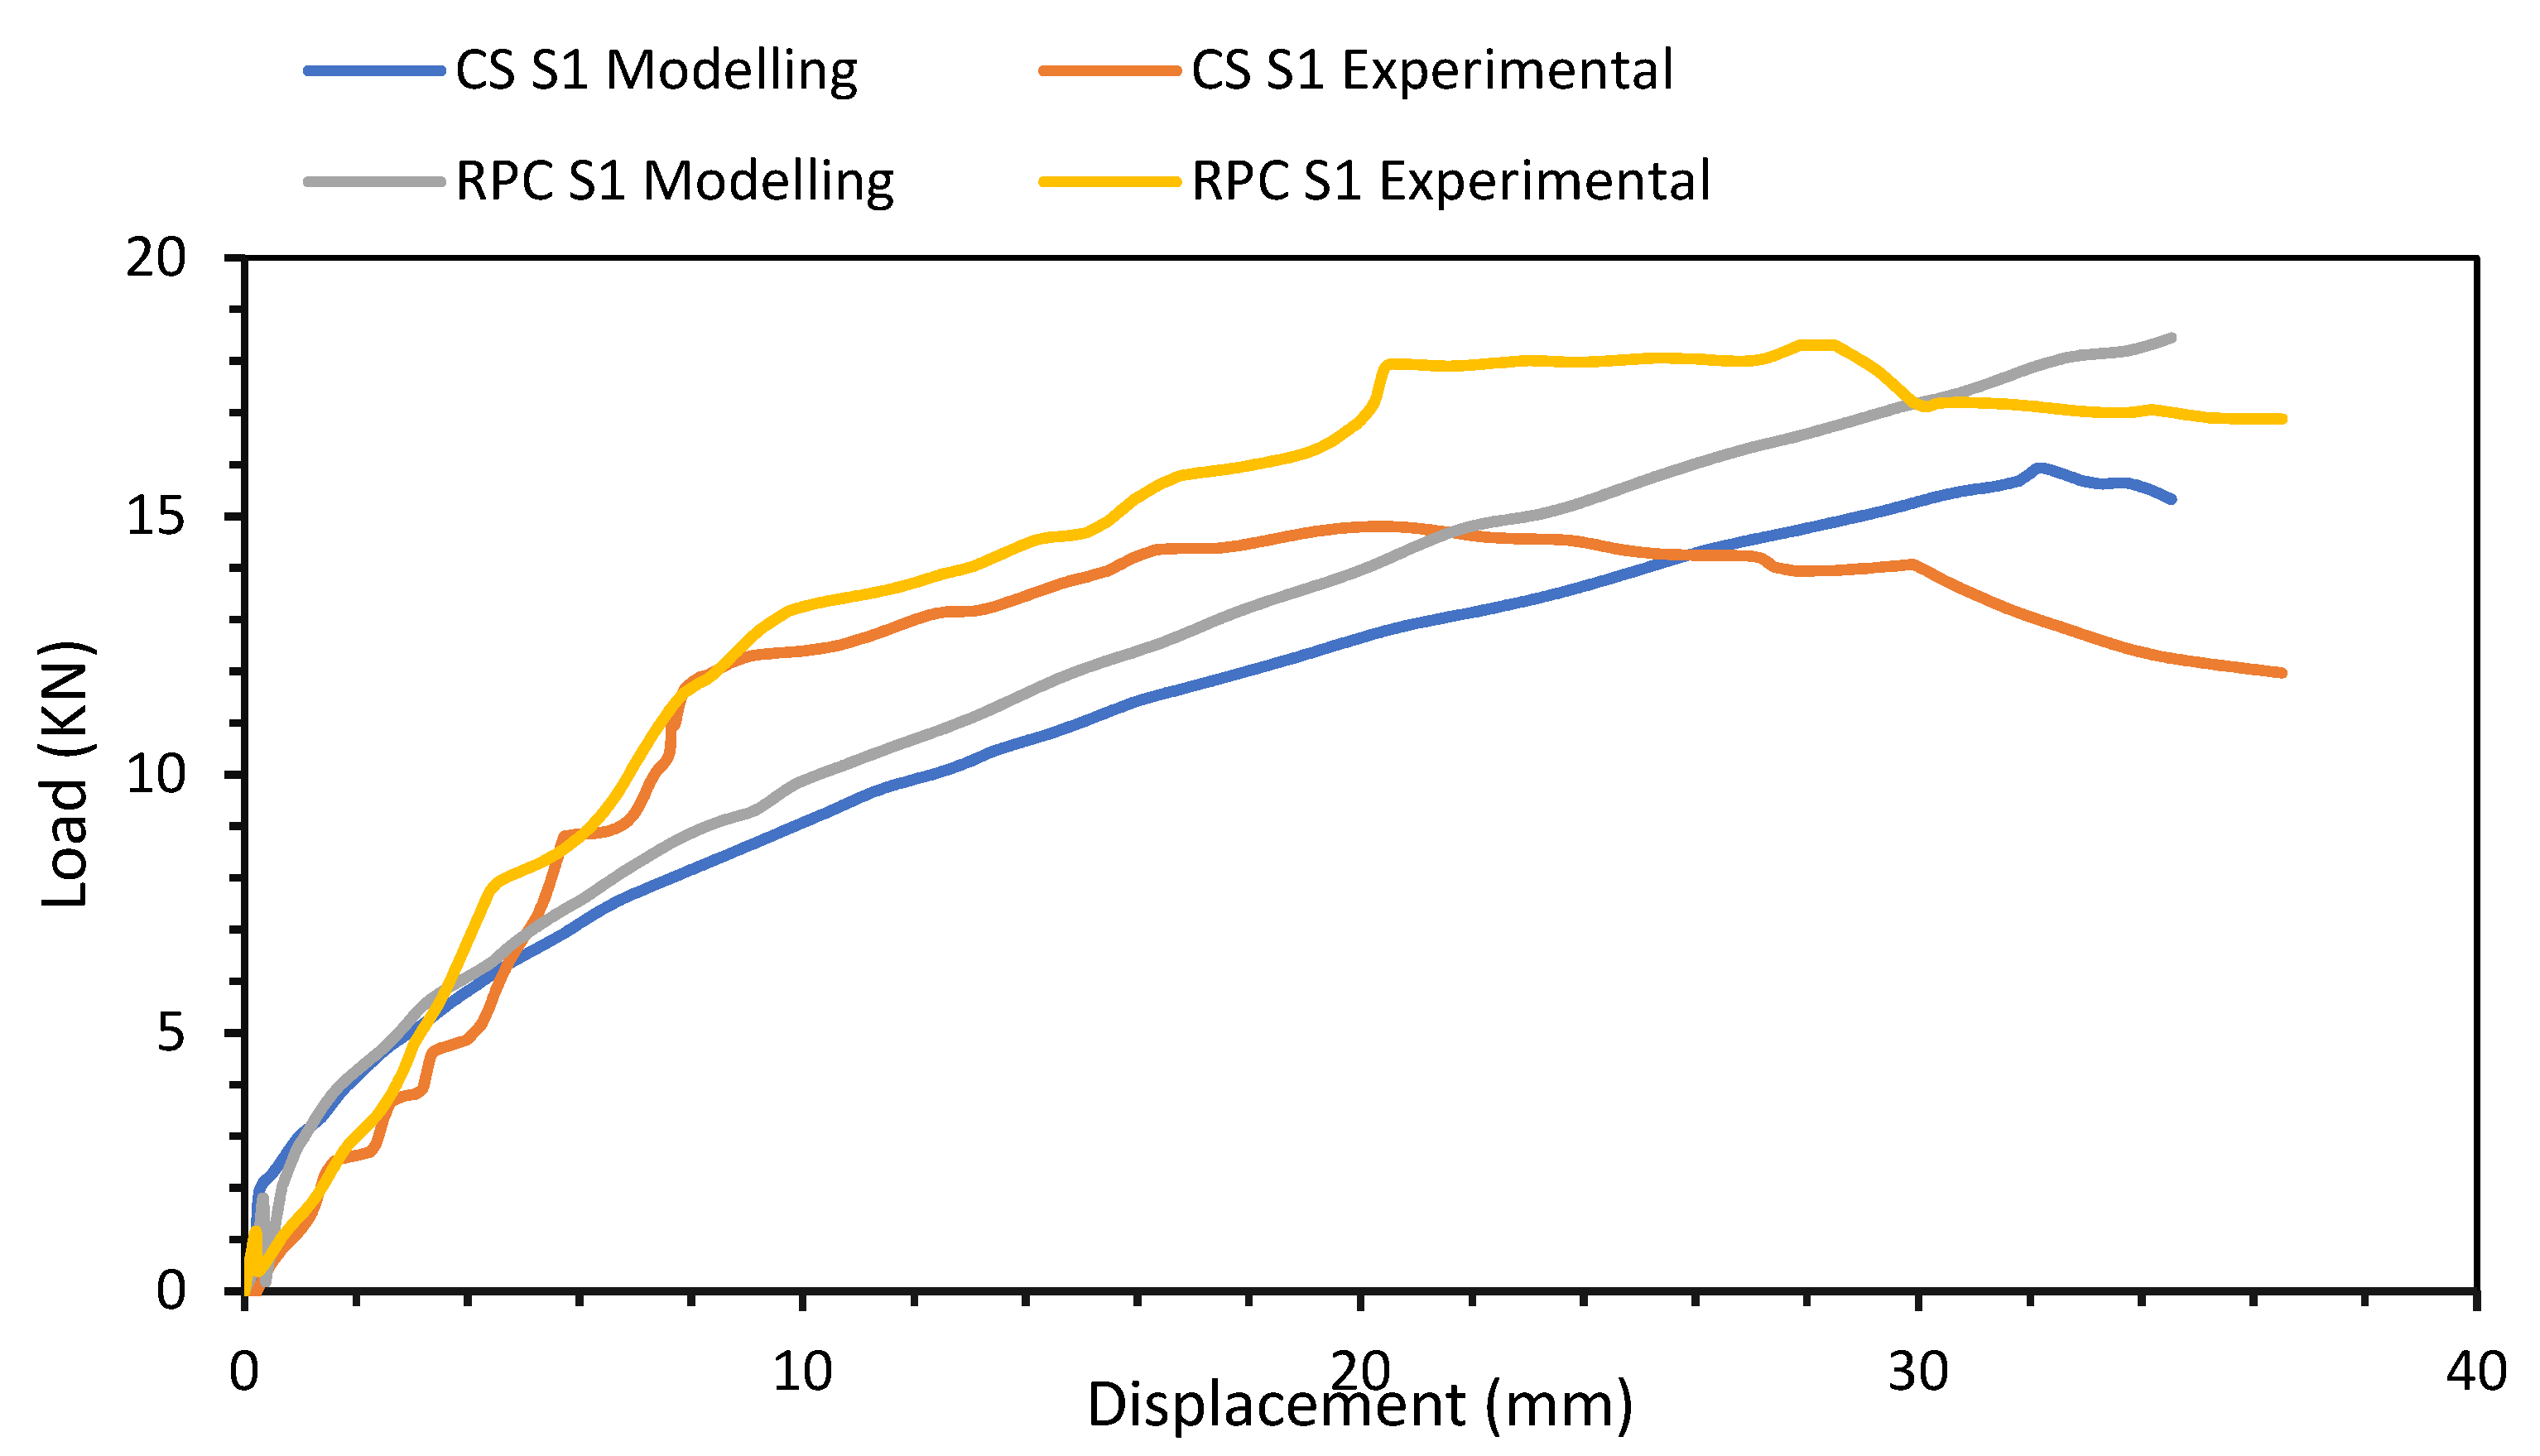
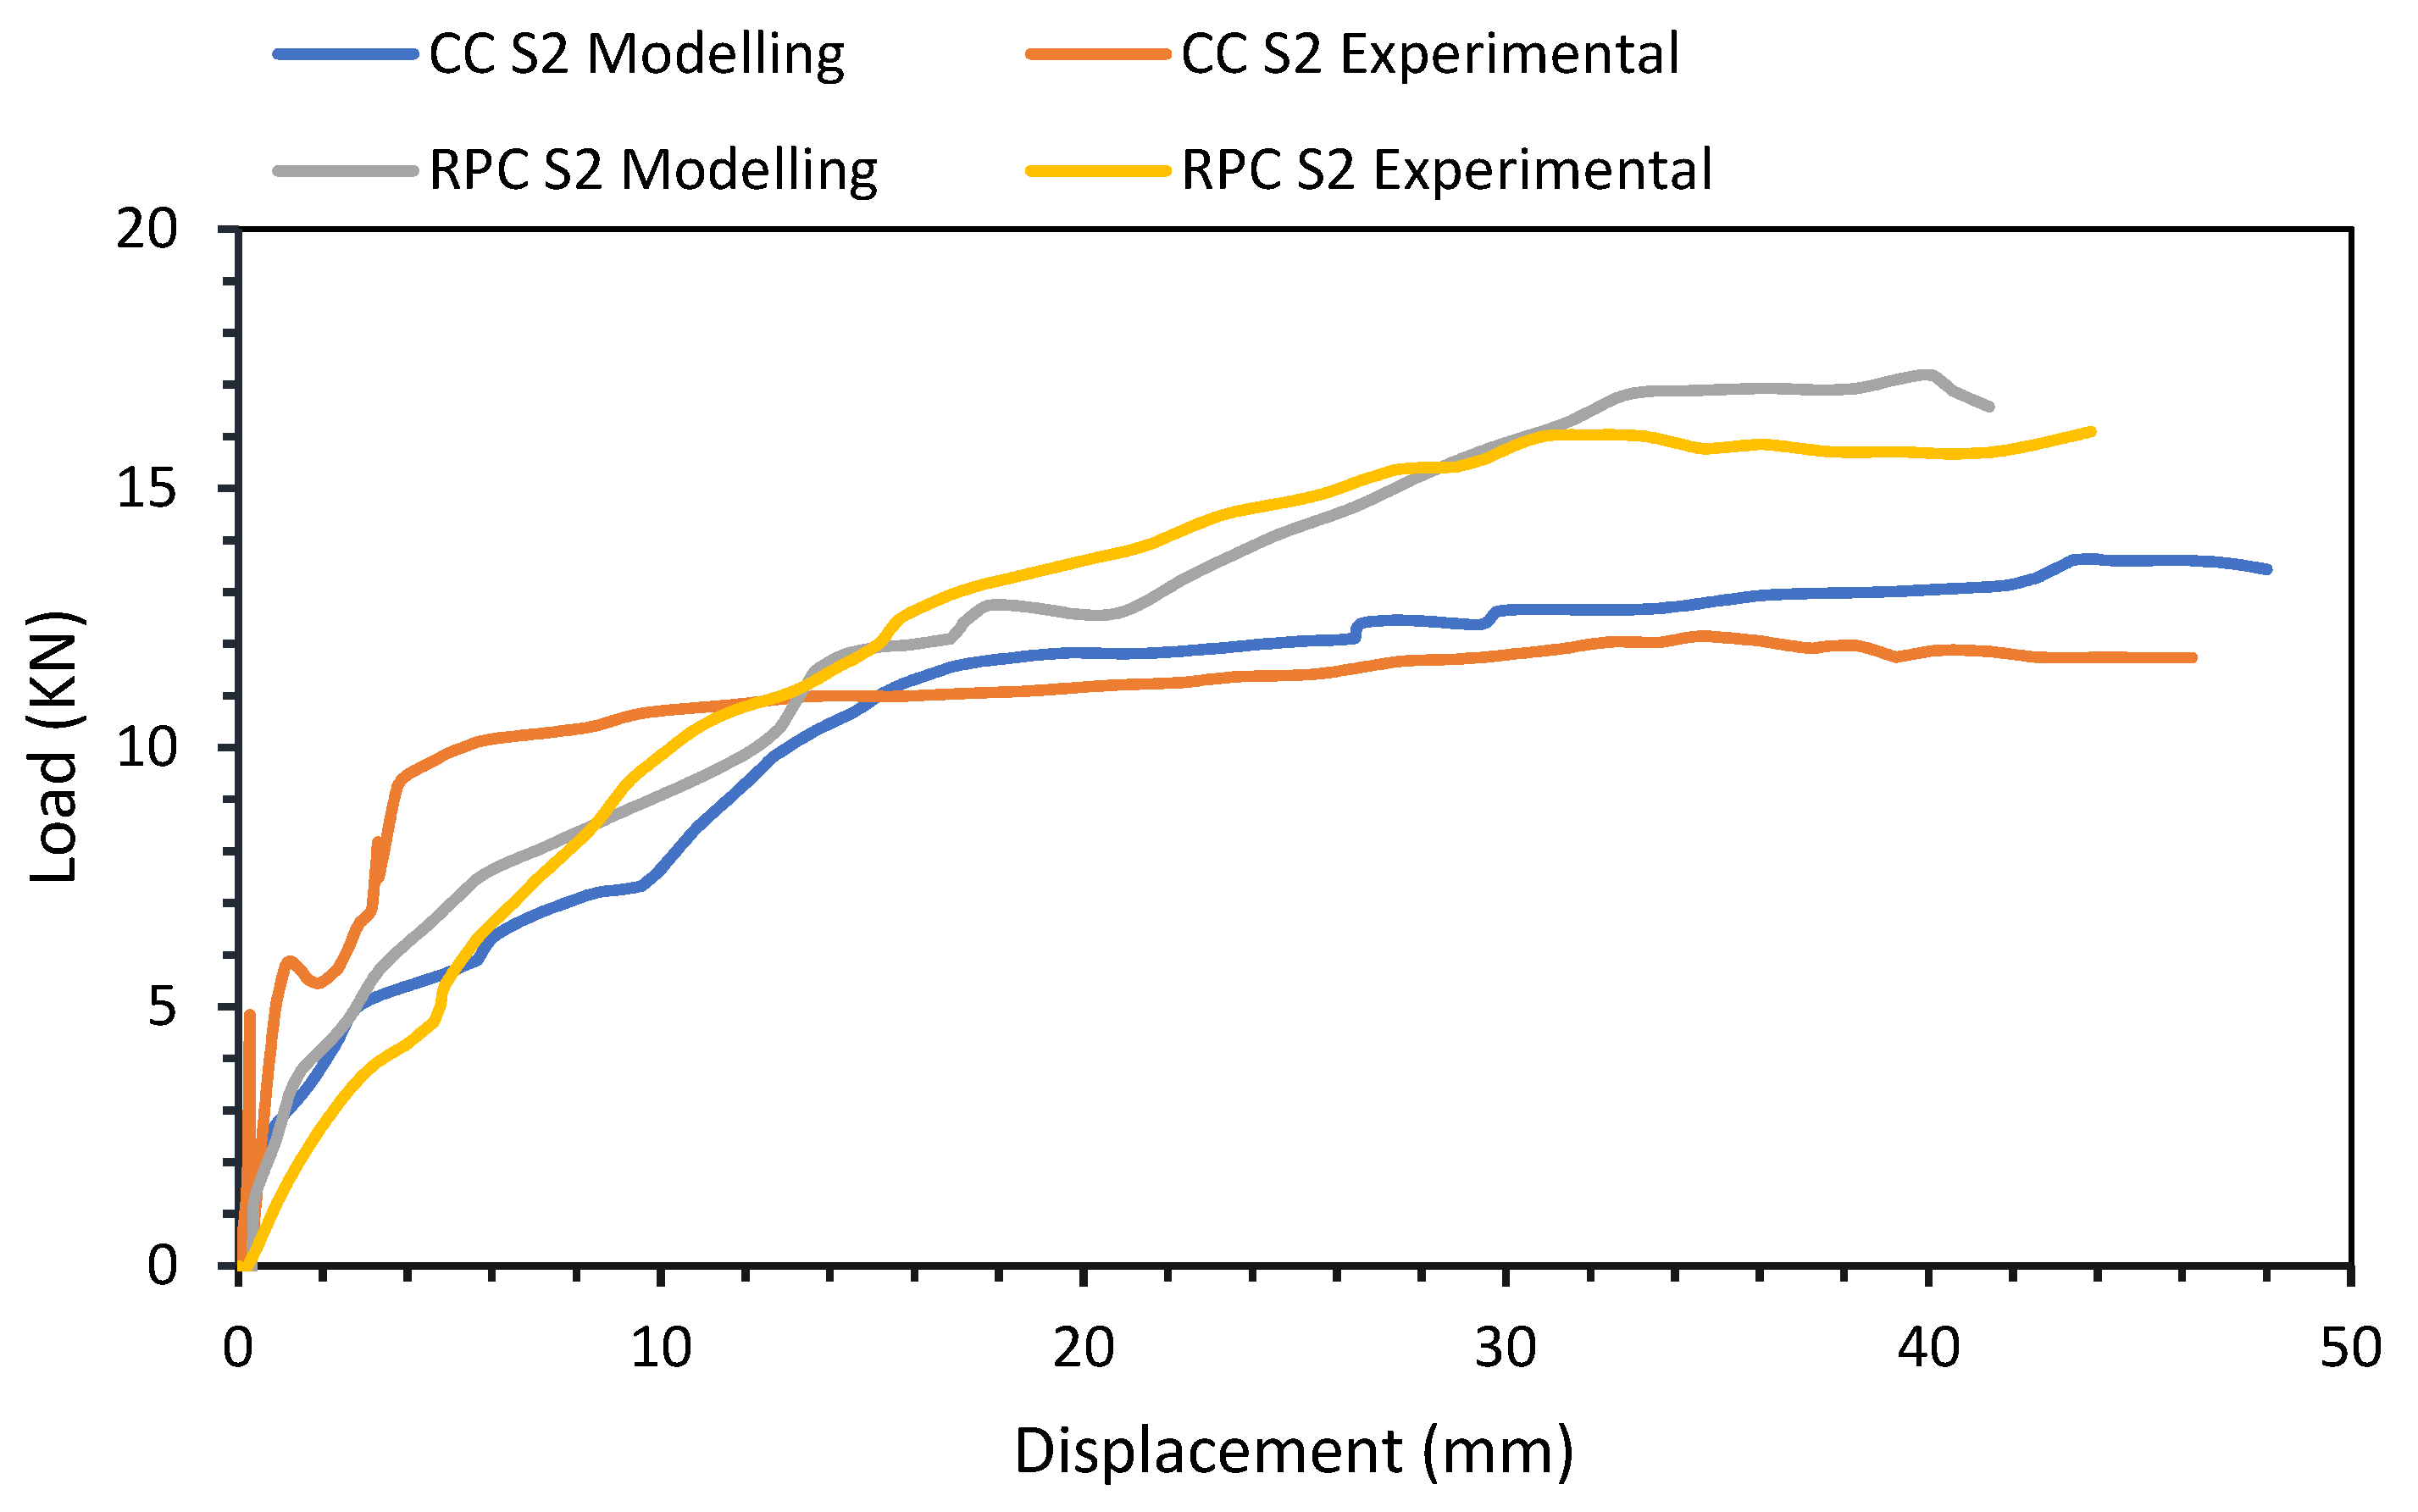
The maximum discrepancy between modeling and experimental results of RPC in the case of RPC_S1 was 6.05% while that of RPC_S2 was 6.7%. The deviation of experimental results from modeling in RPC_S1 was due to non-uniform increment of load and time period in the experimental setup while RPC_S2 showed quite accurate results. Mesh size effect was studied for RPC specimens and compared with the experimental results Figure 22 and Figure 23. Mesh size 25 was considered for RPC_S1 and mesh size 40 for RPC_S2 for comparison with the experimental values.
4.2. Comparison between Conventional Concrete and RPC Specimens
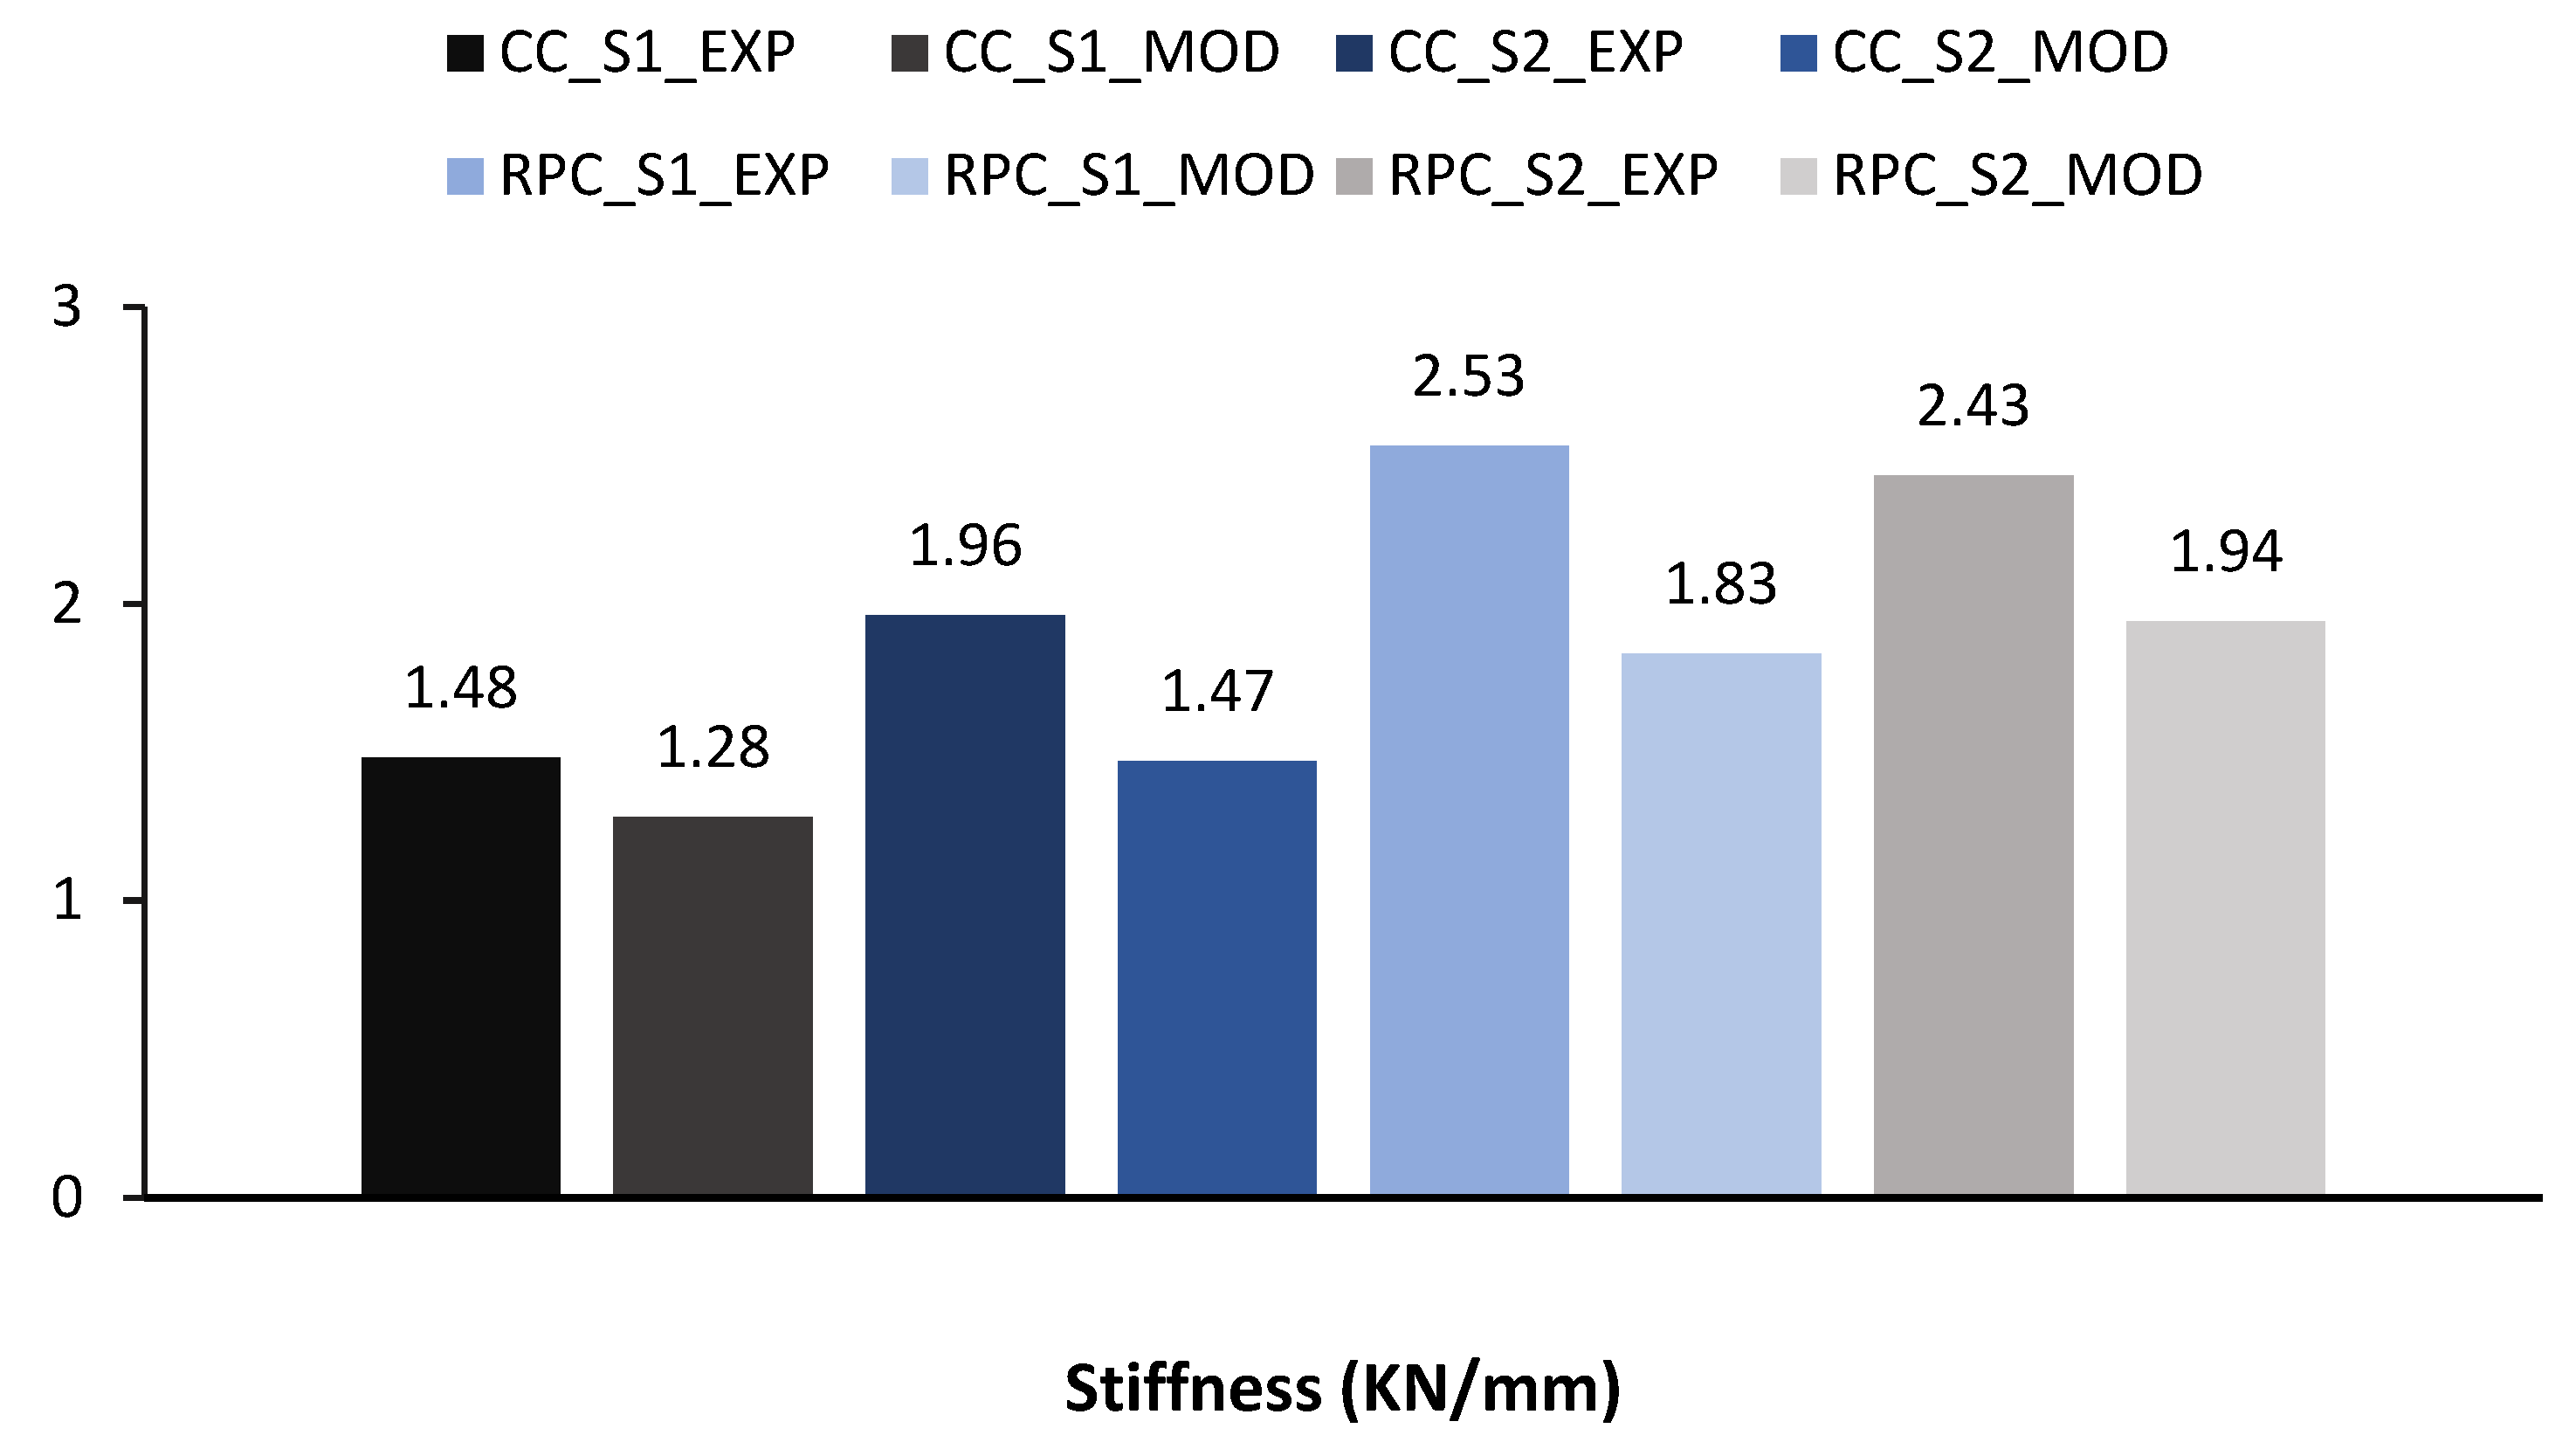
4.3. Stiffness of Concrete and RPC Specimens
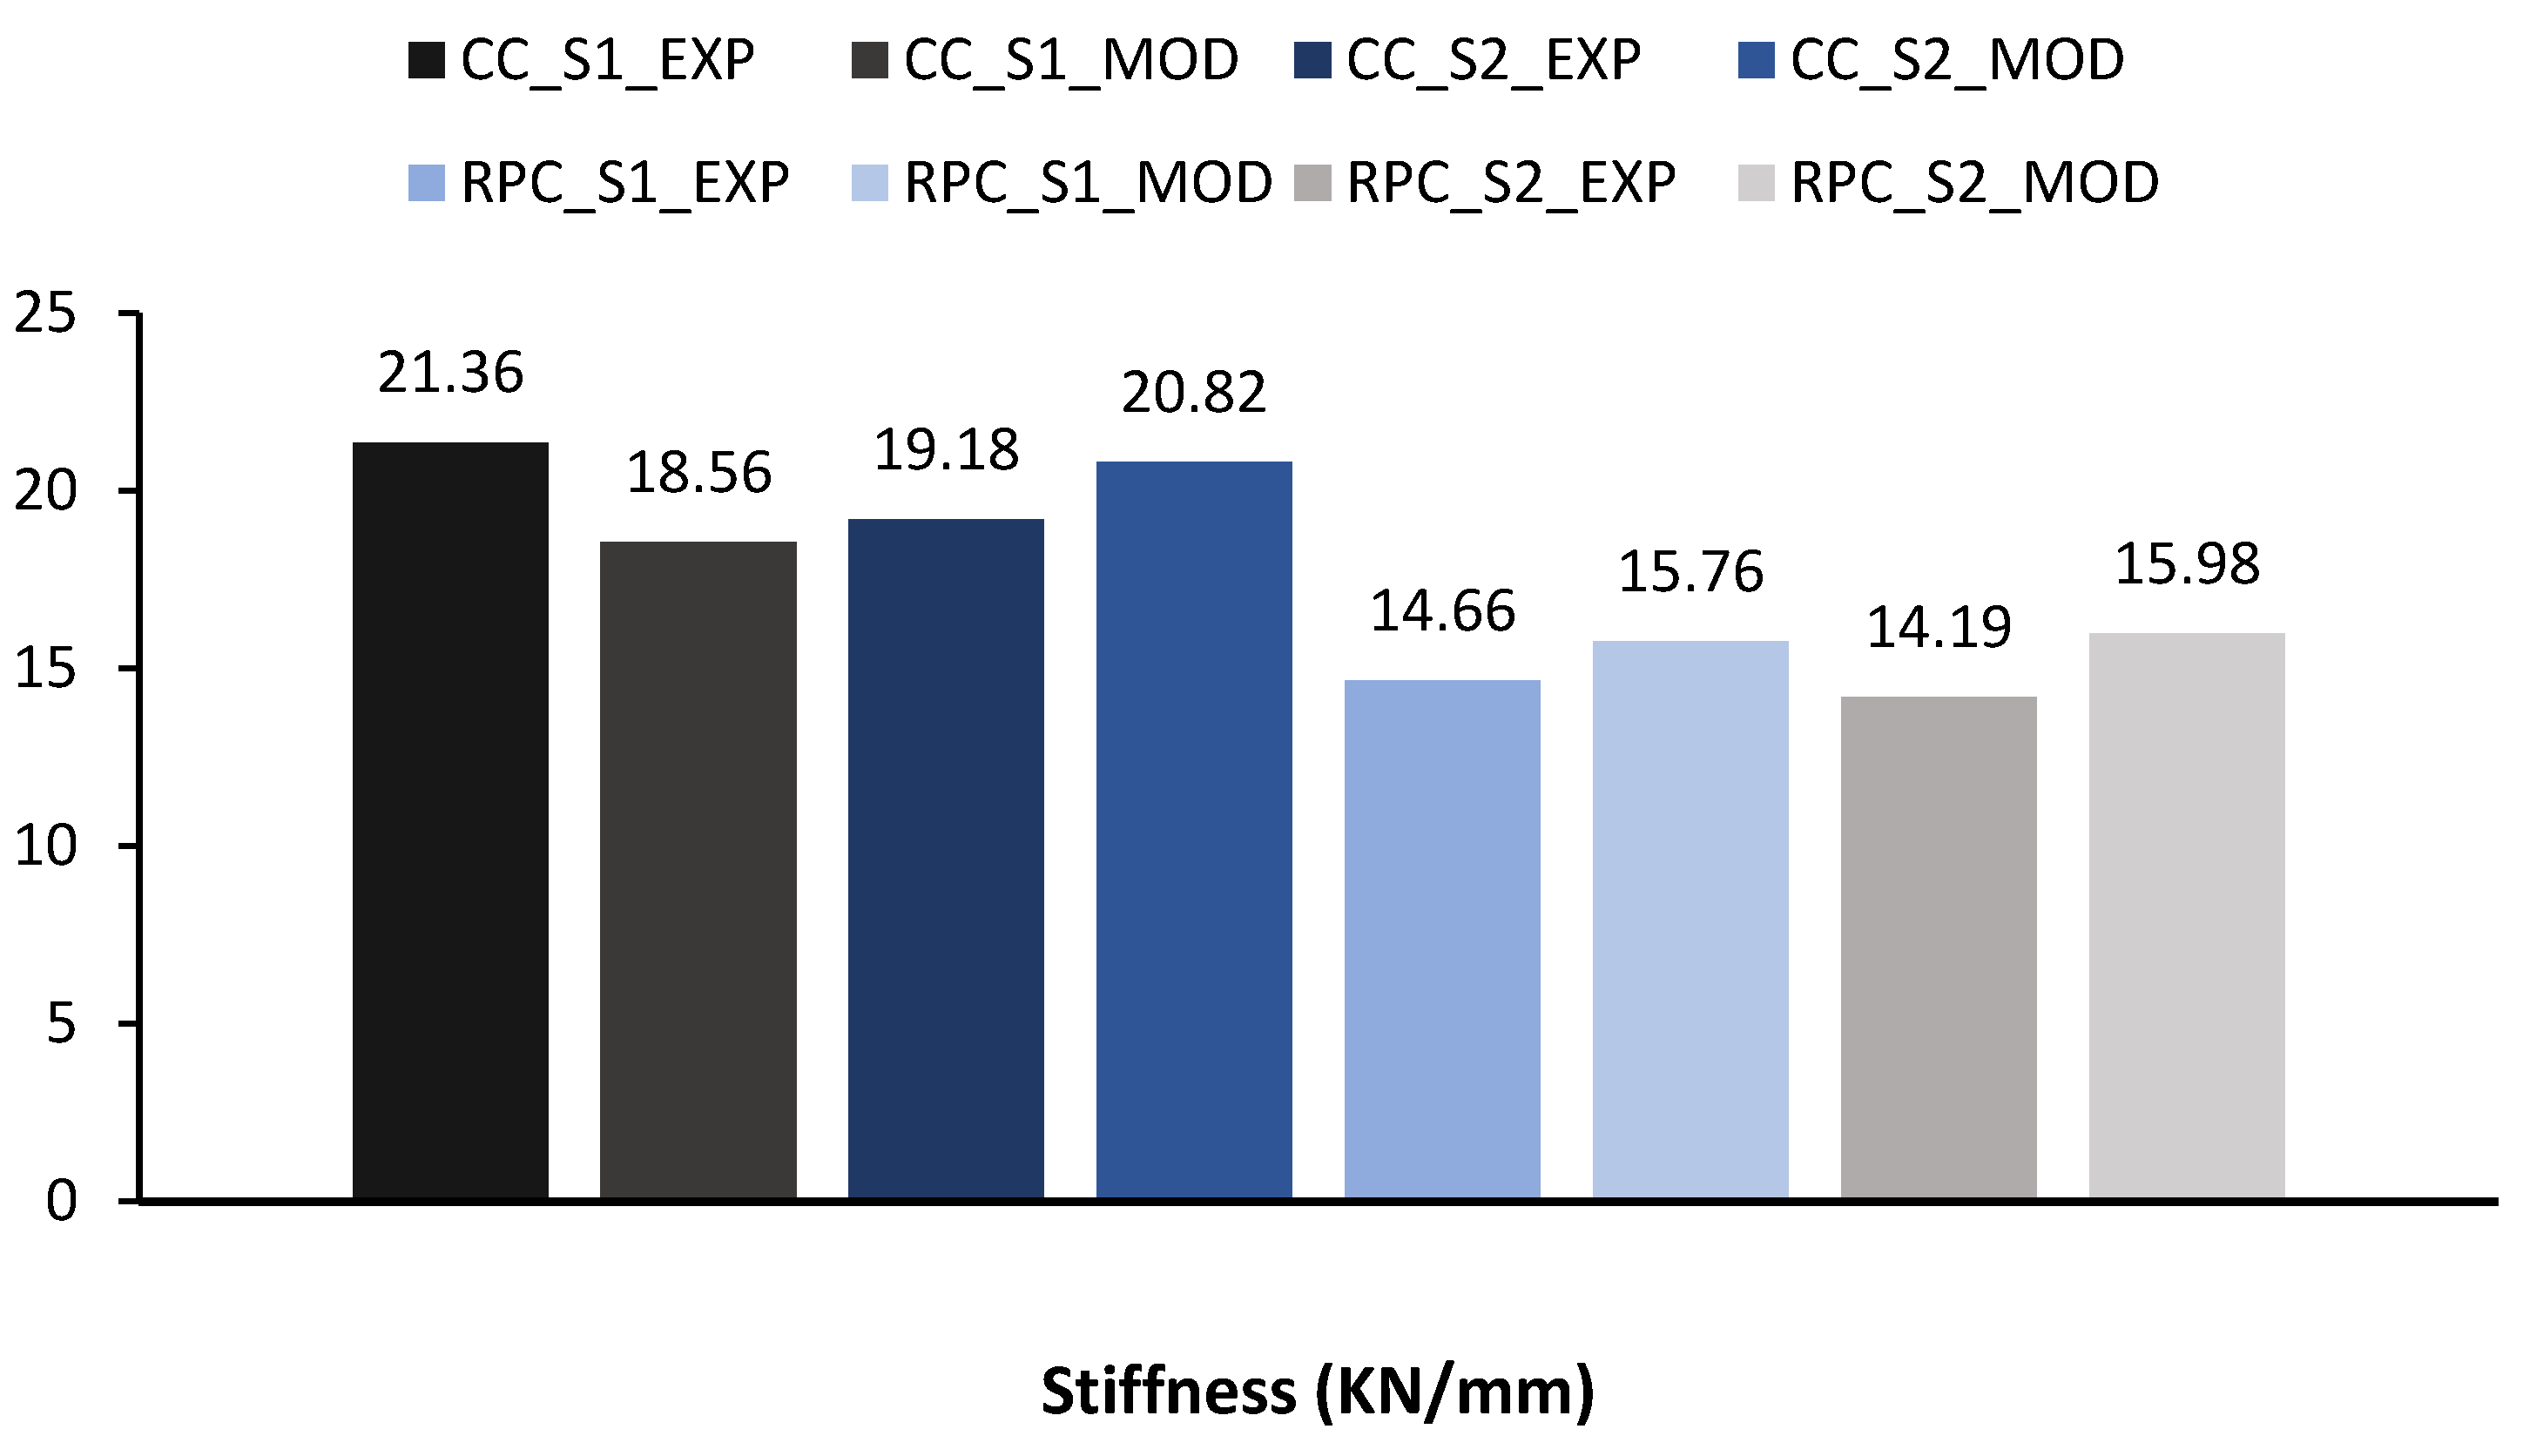
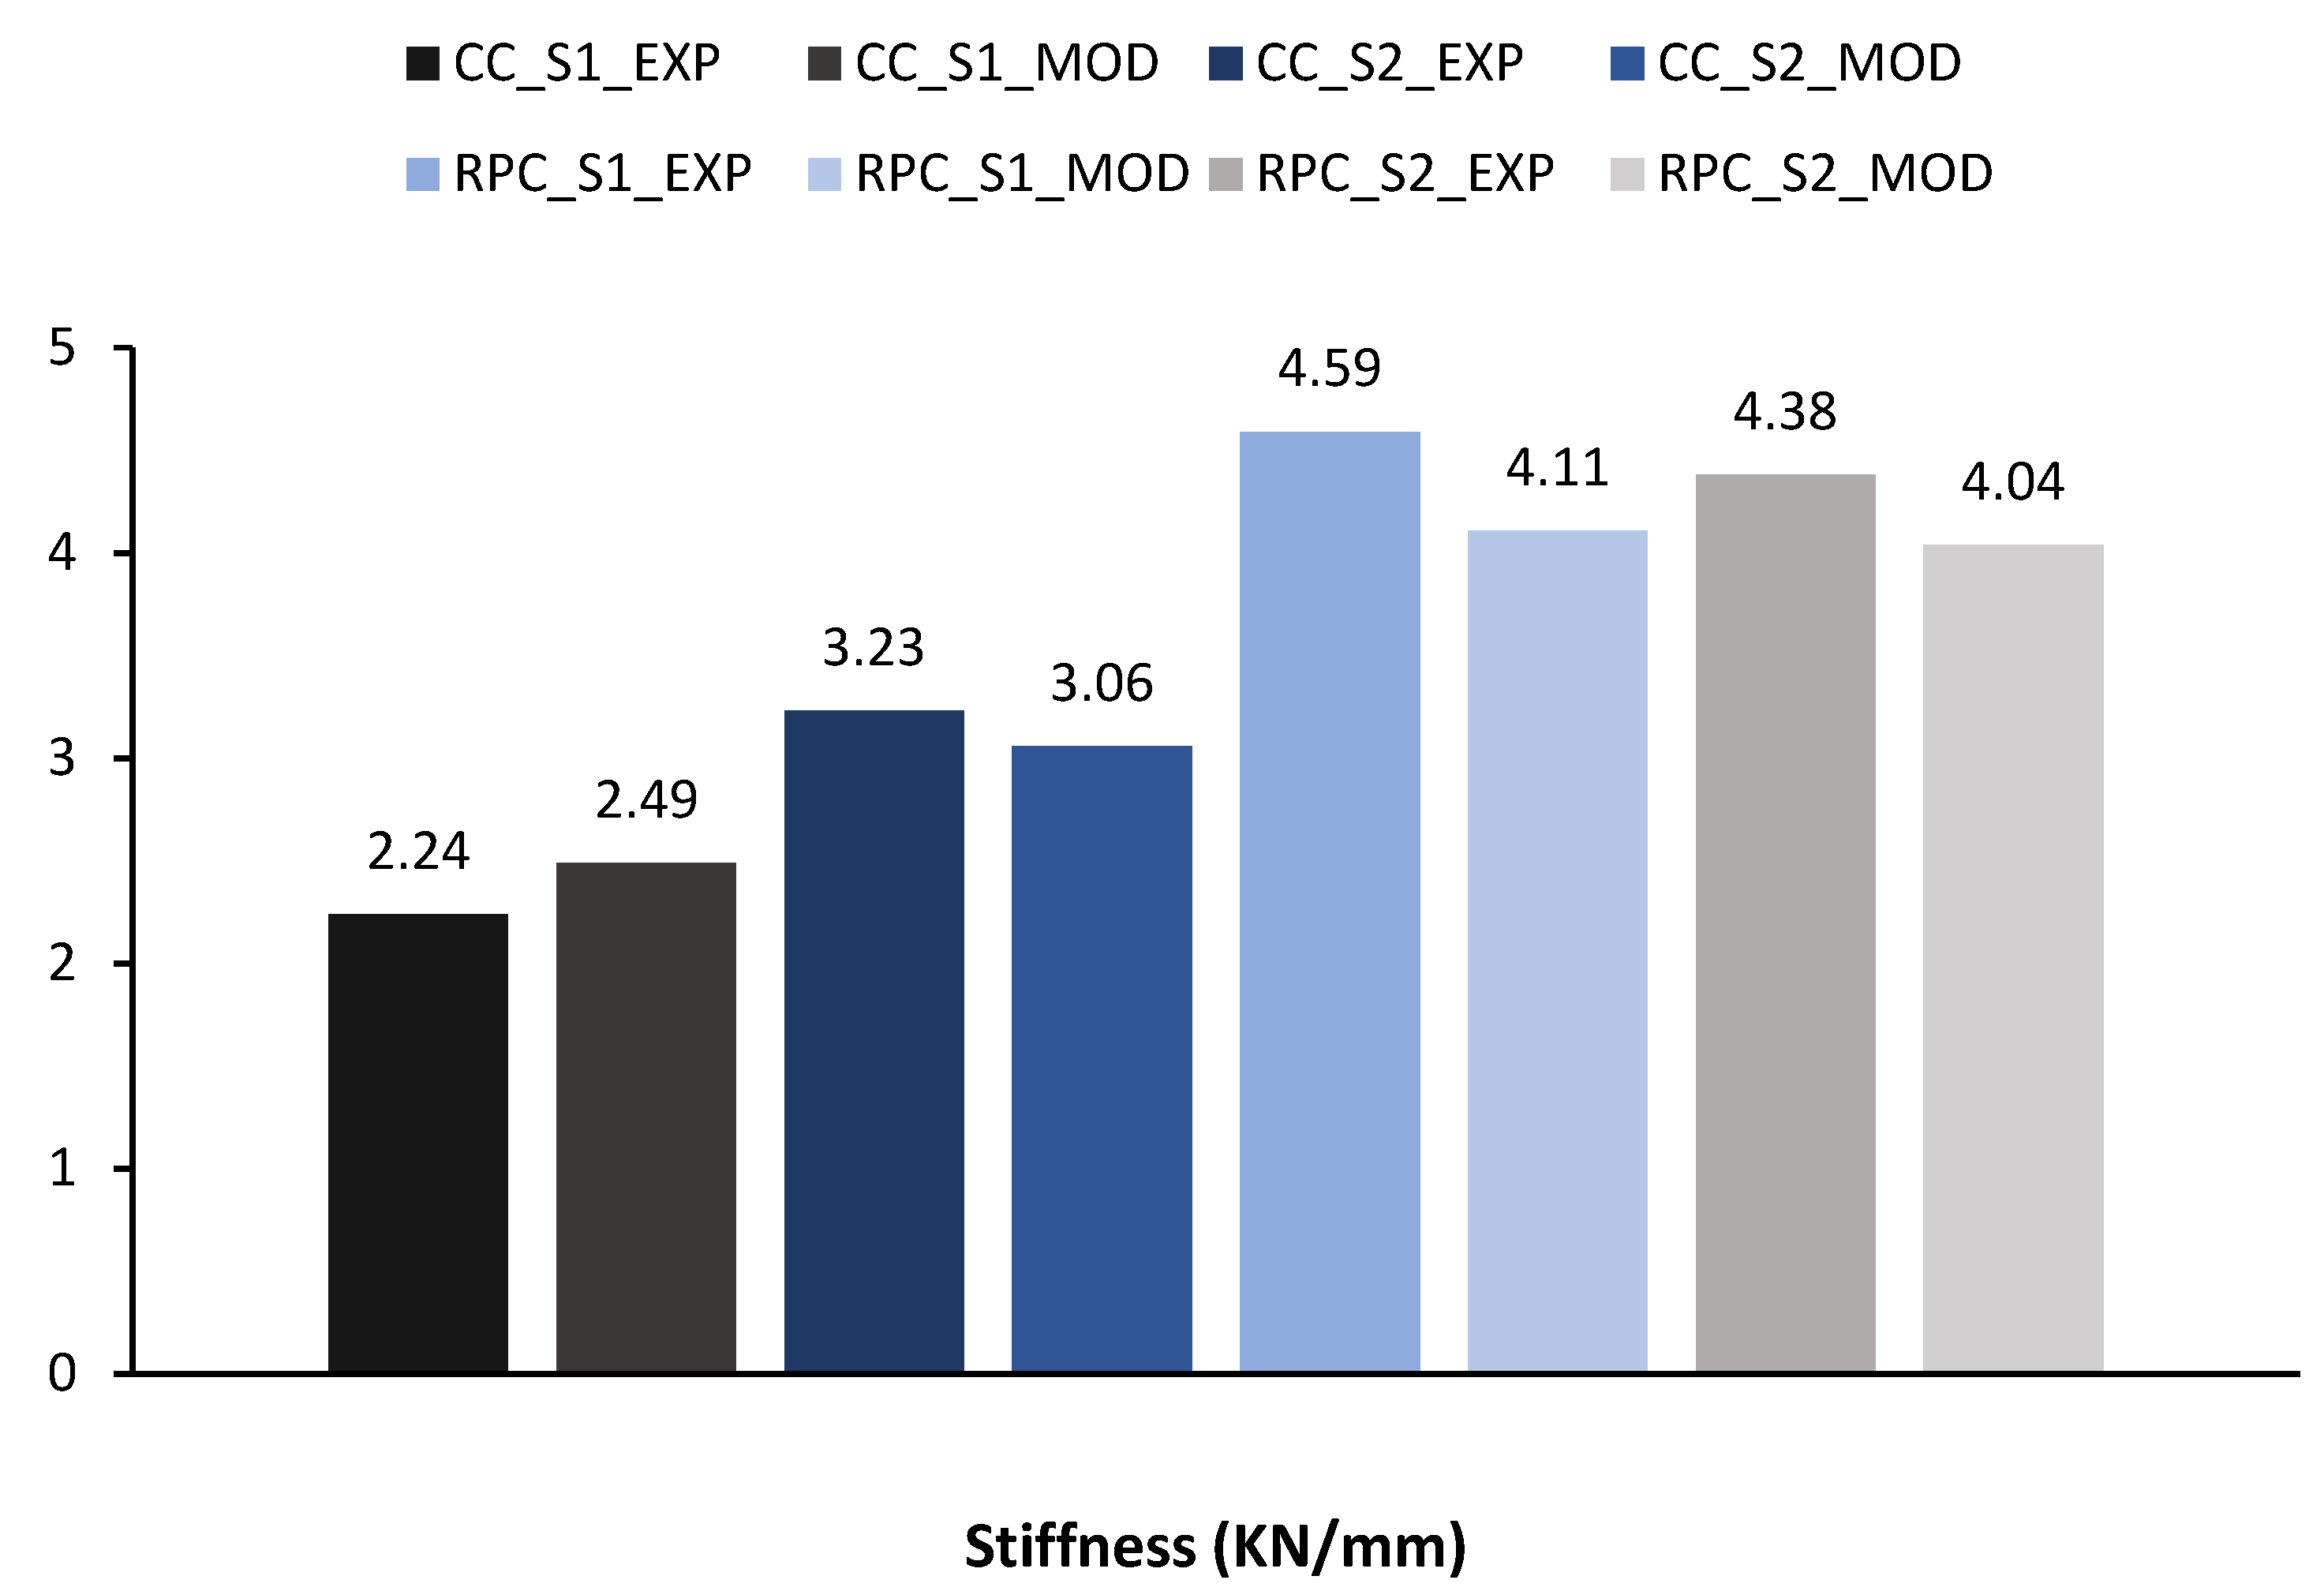
For the validation of the model, the stiffness of all specimens was calculated. It can be seen from Table 4 and Table 5 that the initial stiffness in the RPC specimens is low in comparison to conventional concrete. Moreover, it can be observed that as the load increased the structure lost its rigidity and stiffness (the ability of a structure to resist deformation when subjected to the applied force). However, after 20% of loading RPC was still taking more load in comparison to conventional concrete as shown in Table 4 and Table 5. It can also be observed from Figure 24, Figure 25 and Figure 26 that the initial stiffness of RPC specimens is low compared to controlled concrete specimens. Figure 25 and Figure 26 depict that as the load was increased to 25% and 50% of the ultimate load, RPC showed to have high stiffness comparatively.
4.4. Ductility of Concrete and RPC Specimens
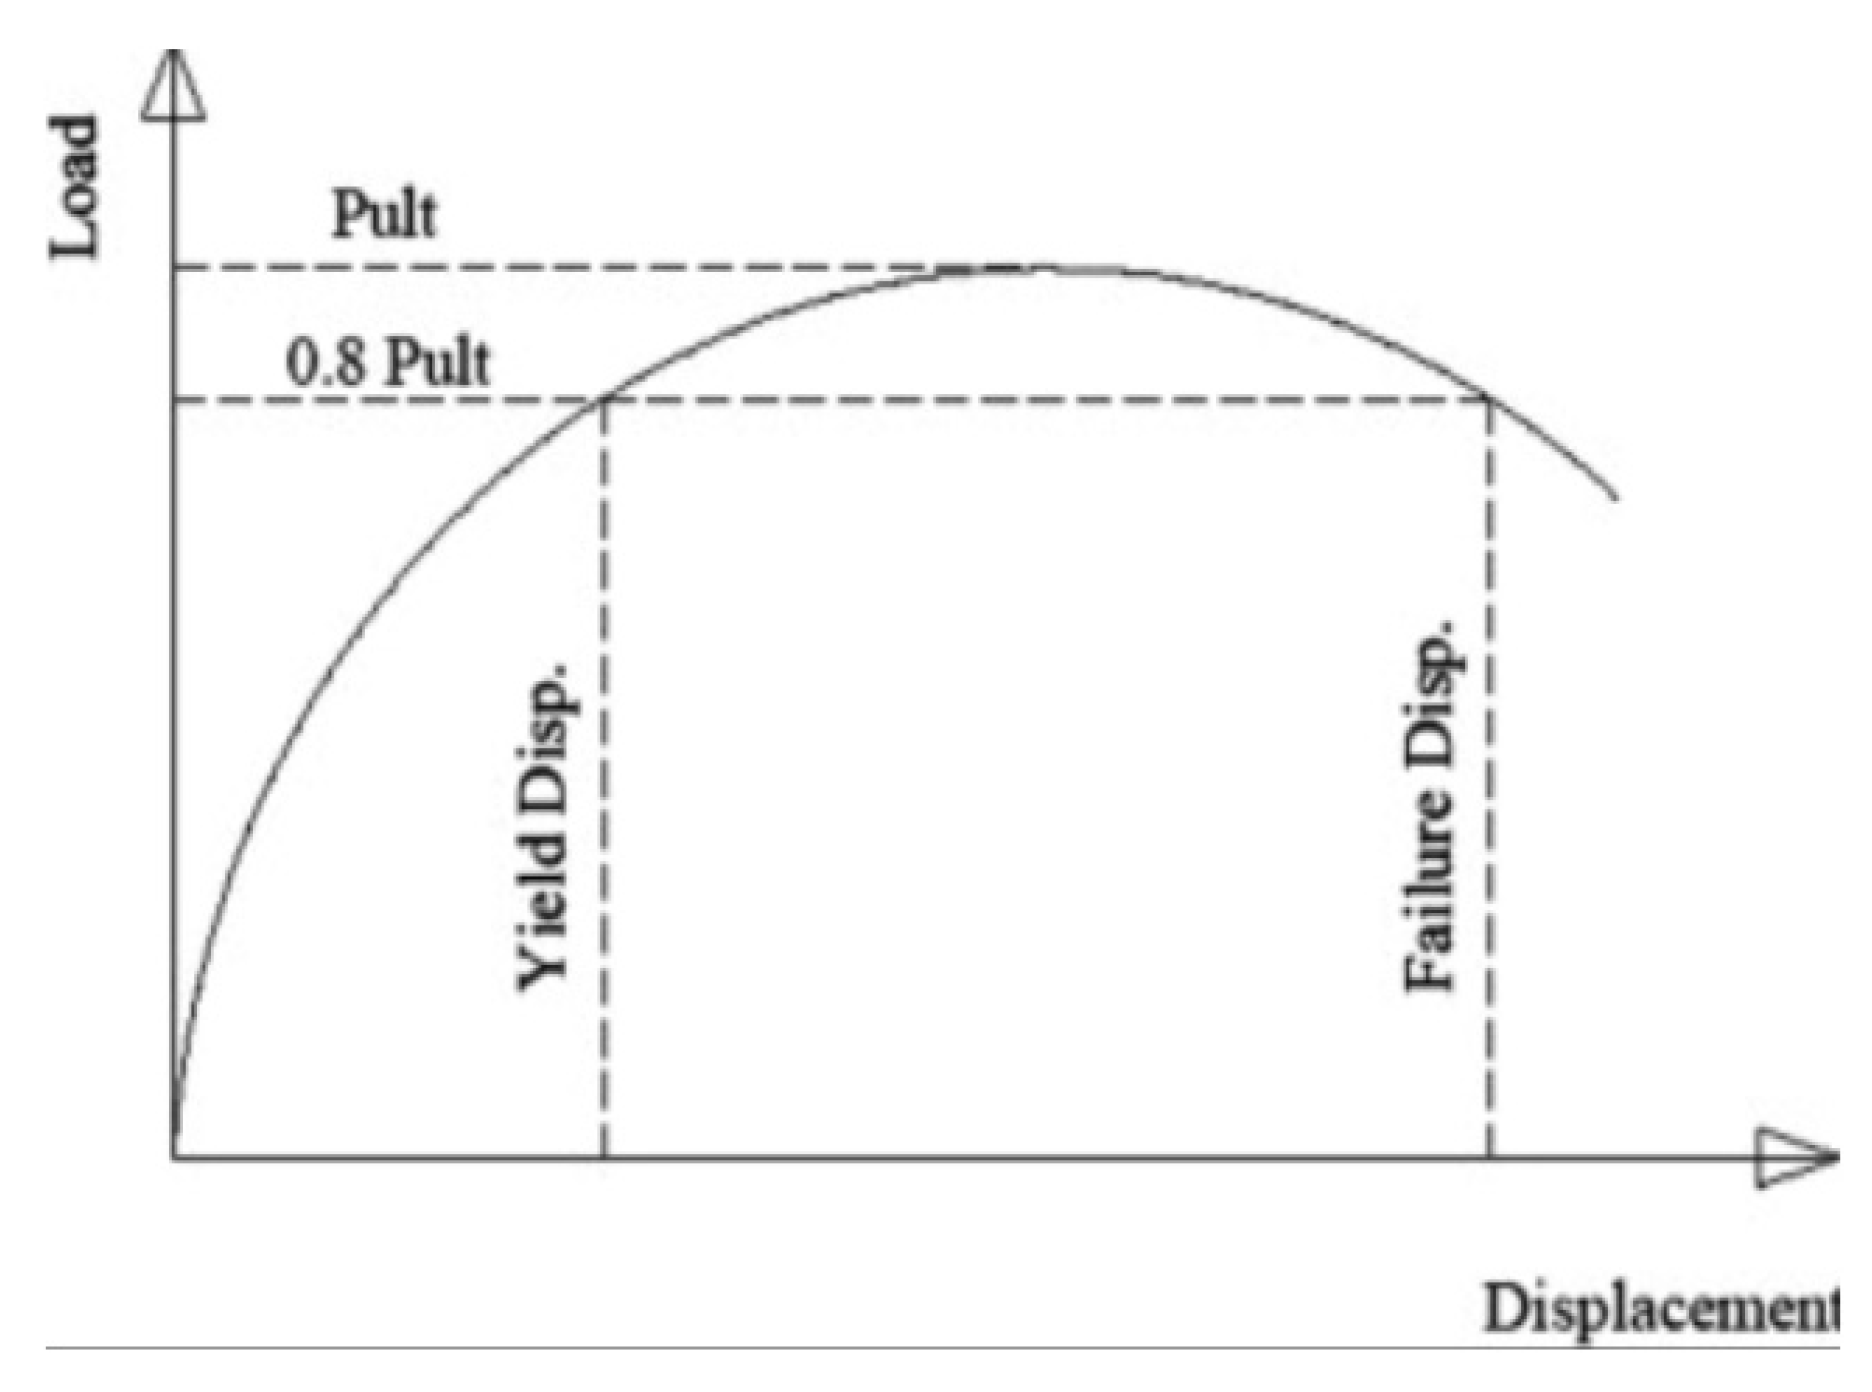
The ductility displacement factor (R), as depicted in Figure 27, according to the Committee Euro International Du Beton, 1996, is defined as the ratio between failure displacement and yield displacement. The yield displacement is the lateral displacement at 80% of the ultimate load at ascending part of the curve while the failure displacement is the lateral displacement at 80% of the ultimate load at descending part of the curve [26]. Ductility factor R and ductility displacement (DD) can be obtained from Equations (16) and (17), respectively.
where ∆f = failure displacement ∆y = yield displacement
where ∆i = maximum displacement in any cycle I ∆y = yield displacement
Table 6 displays ductility factor R and displacement ductility (DD) for all the specimens both for experimental and numerical modeling. Experimental results showed an increase of 27% and 11% in R for S1 and S2, respectively. Similarly, DD for RPC was enhanced by 29% and 12% for S1 and S2, respectively. The same trend was shown by numerical modeling results.
5. Conclusions
A series of analysis were performed on conventional concrete and RPC beam-column joint specimens. Following conclusions were made based on experimental and numerical testing.
- The use of RPC only in the joint region increased the overall strength of the structure by 10–15% and also delayed the crack propagations.
- The maximum average discrepancy between modeling and experimental results of conventional concrete and RPC was 3–7%. This discrepancy was due to the non-uniform increment of load and time period in the experimental setup.
- It was observed that with an increment in the mesh size, a reduction in the number of analysis increments occurred. This caused variation of modeling results from experimental results. Therefore, finer mesh size is recommended.
- Increasing the value of viscosity reduced the analysis time but produced more errors in results. The lower value of the viscosity parameter is better as higher values cause a high peak of reaction force. Therefore, smaller values are preferable i.e., 0.001, 0.002, 0.003, or 0.005 etc.
- Fixed column end conditions caused an increase in column stresses which resulted in buckling of column. No buckling was observed for hinged column conditions. Maximum deformation was observed at the beam end irrespective of the column end conditions.
- To obtain actual results, displacement control analysis should be used rather than load control analysis. With displacement control analysis it is easier to obtain the converged solutions in ABAQUS in case of highly nonlinear problems.
6. Recommendations
Based on this research following recommendations can be used for future research work.
In the case of RPC, a decrease in the initial stiffness of the specimen was observed in the joint region as coarse aggregates were not used. Therefore, the use of suitable size of coarse aggregate will not only increase the initial stiffness but also increase the strength of the structure.
Steel fibers of a longer length should be used so that they can help in controlling the crack from widening. In the case of RPC, shear cracking was observed in the joint region. Combining the RPC technique with some other technique will convert the failure mechanism from the joint to the beam through their combined effect.
Besides the CDP model smeared crack modeling and brittle concrete modeling of the RPC can be used to determine the complex behavior of RPC in structure.
As there is no official Eurocode for RPC. Therefore, the development of Eurocode for RPC with and without steel fibers will enable us to clearly understand the complicated behavior of the material.
Author Contributions
Supervision, review, and editing, A.N.; data curation and methodology, M.A.; investigation and review, M.F.J.; conceptualization, data analysis, writing original draft preparation, M.F.J.; formal analysis and modeling, F.A.; validation, proofreading, review, M.A.M. and N.I.V. All authors have read and agreed to the published version of the manuscript.
Funding
The research is partially funded by the Ministry of Science and Higher Education of the Russian Federation under the strategic academic leadership program ‘Priority 2030’ (Agreement 075-15-2021-1333 dated 30 September 2021).
Data Availability Statement
The data used in this research was collected from published literature.
Conflicts of Interest
The authors declare no conflict of interest.
References
- Al-Salloum, Y.A.; Alrubaidi, M.A.; Elsanadedy, H.M.; Almusallam, T.H.; Iqbal, R.A. Strengthening of precast RC beam-column connections for progressive collapse mitigation using bolted steel plates. Eng. Struct. 2018, 161, 146–160. [Google Scholar] [CrossRef]
- Shannag, M.J.; Abu-Dyya, N.; Abu-Farsakh, G. Lateral load response of high performance fiber reinforced concrete beam–column joints. Constr. Build. Mater. 2005, 19, 500–508. [Google Scholar] [CrossRef]
- Chiu, C.-K.; Lays, D.P.; Ricky; Krasna, W.A. Anchorage strength development of headed bars in HSRC external beam-column joints considering side-face blowout failure under monotonic loading. Eng. Struct. 2021, 239, 112218. [Google Scholar] [CrossRef]
- Yuan, H.; Hu, S.; Du, X.; Yang, L.; Cheng, X.; Theofanous, M. Experimental behaviour of stainless steel bolted T-stub connections under monotonic loading. J. Constr. Steel Res. 2019, 152, 213–224. [Google Scholar] [CrossRef] [Green Version]
- Allam, S.M.; Elbakry, H.M.; Arab, I.S. Exterior reinforced concrete beam column joint subjected to monotonic loading. Alex. Eng. J. 2018, 57, 4133–4144. [Google Scholar] [CrossRef]
- Ganesan, N.; Indira, P.; Abraham, R. Steel fibre reinforced high performance concrete beam-column joints subjected to cyclic loading. ISET J. Earthq. Technol. 2007, 44, 445–456. [Google Scholar]
- Uma, S.; Jain, S.K. Seismic design of beam-column joints in RC moment resisting frames—Review of codes. Struct. Eng. Mech. 2006, 23, 579–597. [Google Scholar] [CrossRef] [Green Version]
- De Corte, W.; Boel, V. Effectiveness of spirally shaped stirrups in reinforced concrete beams. Eng. Struct. 2013, 52, 667–675. [Google Scholar] [CrossRef]
- Yang, K.-H.; Kim, G.-H.; Yang, H.-S. Shear behavior of continuous reinforced concrete T-beams using wire rope as internal shear reinforcement. Constr. Build. Mater. 2011, 25, 911–918. [Google Scholar] [CrossRef]
- Al-Nasra, M.; Asha, N. Shear reinforcements in the reinforced concrete beams. Am. J. Eng. Res. (AJER) 2013, 2, 191–199. [Google Scholar]
- Ghobarah, A.; Said, A. Shear strengthening of beam-column joints. Eng. Struct. 2002, 24, 881–888. [Google Scholar] [CrossRef]
- Engindeniz, M.; Kahn, L.F.; Abdul-Hamid, Z. Repair and strengthening of reinforced concrete beam-column joints: State of the art. ACI Struct. J. 2005, 102, 1. [Google Scholar]
- Gencoglu, M.; Mobasher, B. The strengthening of the deficient RC exterior beam-column joints using CFRP for seismic excitation. In Proceedings of the 3rd International Conference on Structural Engineering, Mechanics and Computation, Cape Town, South Africa, 10–12 September 2007. [Google Scholar]
- Richard, P.; Cheyrezy, M. Reactive powder concrete. Cem. Concr. Res. 1995, 25, 1501–1511. [Google Scholar] [CrossRef]
- Sadrekarimi, A. Development of a Light Weight Reactive Powder Concrete. J. Adv. Concr. Technol. 2004, 2, 409–417. [Google Scholar] [CrossRef] [Green Version]
- Aïtcin, P.-C.; Lachemi, M.; Adeline, R.; Richard, P. The Sherbrooke Reactive Powder Concrete Footbridge. Struct. Eng. Int. 1998, 8, 140–144. [Google Scholar] [CrossRef]
- Yi, N.-H.; Kim, J.-H.J.; Han, T.-S.; Cho, Y.-G.; Lee, J.H. Blast-resistant characteristics of ultra-high strength concrete and reactive powder concrete. Constr. Build. Mater. 2012, 28, 694–707. [Google Scholar] [CrossRef]
- Shi, C.; Long, M.; Cao, C.; Long, G.; Lei, M. Mechanical property test and analytical method for Reactive Powder Concrete columns under eccentric compression. KSCE J. Civ. Eng. 2017, 21, 1307–1318. [Google Scholar] [CrossRef]
- Schmidt, M.; Fehling, E. Ultra-high-performance concrete: Research, development and application in Europe. ACI Spec. Publ. 2005, 228, 51–78. [Google Scholar]
- Blais, P.Y.; Couture, M. PRECAST, PRESTRESSED PEDESTRIAN BRIDGE-WORLD’S FIRST REACTIVE POWDER CONCRETE BRIDGE. PCI J. 1999, 44. [Google Scholar] [CrossRef] [Green Version]
- Jungwirth, J.; Muttoni, A. Underspanned bridge structures in reactive powder concrete (RPC). In Proceedings of the 4th International PhD Symposium in Civil Engineering, Munich, Germany, 19–21 September 2002. [Google Scholar]
- Shao, X.; Pan, R.; Zhan, H.; Fan, W.; Yang, Z.; Lei, W. Experimental Verification of the Feasibility of a Novel Prestressed Reactive Powder Concrete Box-Girder Bridge Structure. J. Bridg. Eng. 2017, 22, 04017015. [Google Scholar] [CrossRef]
- Abdulraheem, M.S.; Kadhum, M.M. Experimental investigation of fire effects on ductility and stiffness of reinforced reactive powder concrete columns under axial compression. J. Build. Eng. 2018, 20, 750–761. [Google Scholar] [CrossRef]
- Al-Jubory, N.H. Mechanical Properties of Reactive Powder Concrete (RPC) with Mineral Admixture-ENG. AL Rafdain Eng. J. (AREJ) 2013, 21, 92–101. [Google Scholar] [CrossRef]
- Lee, M.-G.; Wang, Y.-C.; Chiu, C.-T. A preliminary study of reactive powder concrete as a new repair material. Constr. Build. Mater. 2007, 21, 182–189. [Google Scholar] [CrossRef]
- Cwirzen, A.; Penttala, V.; Vornanen, C. Reactive powder based concretes: Mechanical properties, durability and hybrid use with OPC. Cem. Concr. Res. 2008, 38, 1217–1226. [Google Scholar] [CrossRef]
- Tai, Y.-S.; Pan, H.-H.; Kung, Y.-N. Mechanical properties of steel fiber reinforced reactive powder concrete following exposure to high temperature reaching 800 °C. Nucl. Eng. Des. 2011, 241, 2416–2424. [Google Scholar] [CrossRef]
- Tai, Y. Flat ended projectile penetrating ultra-high strength concrete plate target. Theor. Appl. Fract. Mech. 2009, 51, 117–128. [Google Scholar] [CrossRef]
- Zdeb, T. Influence of the Physicochemical Properties of Portland Cement on the Strength of Reactive Powder Concrete. Procedia Eng. 2015, 108, 419–427. [Google Scholar] [CrossRef] [Green Version]
- Singh, S.; Munjal, P.; Thammishetti, N. Role of water/cement ratio on strength development of cement mortar. J. Build. Eng. 2015, 4, 94–100. [Google Scholar] [CrossRef]
- Mailvaganam, N.P.; Rixom, M.R.; Manson, D.P.; Gonzales, C. Chemical Admixtures for Concrete; CRC Press: Abingdon, UK, 1999. [Google Scholar]
- Ipek, M.; Yilmaz, K.; Sümer, M.; Saribiyik, M. Effect of pre-setting pressure applied to mechanical behaviours of reactive powder concrete during setting phase. Constr. Build. Mater. 2011, 25, 61–68. [Google Scholar] [CrossRef]
- Tam, C.M.; Tam, V.W.; Ng, K. Assessing drying shrinkage and water permeability of reactive powder concrete produced in Hong Kong. Constr. Build. Mater. 2012, 26, 79–89. [Google Scholar] [CrossRef]
- Yunsheng, Z.; Wei, S.; Sifeng, L.; Chujie, J.; Jianzhong, L. Preparation of C200 green reactive powder concrete and its static–dynamic behaviors. Cem. Concr. Compos. 2008, 30, 831–838. [Google Scholar] [CrossRef]
- Adam, J.M. Special Issue on Analysis of Structural Failures Using Numerical Modeling; American Society of Civil Engineers: Reston, VA, USA, 2013. [Google Scholar]
- LLourenço, P.; Krakowiak, K.; Fernandes, F.; Ramos, L. Failure analysis of Monastery of Jerónimos, Lisbon: How to learn from sophisticated numerical models. Eng. Fail. Anal. 2007, 14, 280–300. [Google Scholar] [CrossRef] [Green Version]
- Gardner, J.D.; Vijayaraghavan, A.; Dornfeld, D.A. Comparative Study of Finite Element Simulation Software; Laboratory for Manufacturing and Sustainability: Lafayette, CA, USA, 2005. [Google Scholar]
- Narayanan, R.; Beeby, A. Designers’ Guide to EN 1992-1-1 and EN 1992-1-2. Eurocode 2: Design of Concrete Structures: General Rules and Rules for Buildings and Structural Fire Design; Thomas Telford: Telford, UK, 2005; Volume 17. [Google Scholar]
- Lubliner, J.; Oliver, J.; Oller, S.; Onate, E. A plastic-damage model for concrete. Int. J. Solids Struct. 1989, 25, 299–326. [Google Scholar] [CrossRef]
- Abaqus, F. Analysis User’s Manual 6.14; Dassault Systemes Simulia Corp.: Providence, RI, USA, 2011. [Google Scholar]
- Elchalakani, M.; Karrech, A.; Dong, M.; Ali, M.M.; Yang, B. Experiments and Finite Element Analysis of GFRP Reinforced Geopolymer Concrete Rectangular Columns Subjected to Concentric and Eccentric Axial Loading. Structures 2018, 14, 273–289. [Google Scholar] [CrossRef]
- Chaudhari, S.; Mukane, K.; Chakrabarti, M. Comparative study on exterior RCC beam column joint subjected to monotonic loading. Int. J. Comput. Appl. 2014, 102, 35–40. [Google Scholar]
- Institution, B.S. Eurocode 2: Design of Concrete Structures; BSI: London, UK, 1992. [Google Scholar]
- Kmiecik, P.; Kamiński, M. Modelling of reinforced concrete structures and composite structures with concrete strength degradation taken into consideration. Arch. Civil Mech. Eng. 2011, 11, 623–636. [Google Scholar] [CrossRef]
Figure 1.
Triangular frames of 2′ × 2′.

Figure 2.
Cross-section and reinforcement detailing of beam and column.

Figure 3.
Joint left for RPC.

Figure 4.
Joint filled with RPC concrete.

Figure 5.
Load setup for specimens.

Figure 6.
RPC specimens before application of load.

Figure 7.
Failure of the conventional concrete specimen (CC_S1) after application of load.

Figure 8.
Failure of the conventional concrete specimen (CC_S2) after application of load.

Figure 9.
Failure of RPC specimen (RPC_S1) after application of load.

Figure 10.
Failure of RPC specimen (RPC_S2) after application of load.

Figure 11.
Stress-strain diagram for analysis of concrete using Eurocode 2 [43].
Figure 11.
Stress-strain diagram for analysis of concrete using Eurocode 2 [43].

Figure 12.
Tensile stress-strain curve of concrete from Eurocode [43].
Figure 12.
Tensile stress-strain curve of concrete from Eurocode [43].

Figure 13.
Meshing of 25 mm size for concrete.

Figure 14.
Meshing of steel embedded in concrete.

Figure 15.
Typical view of Abaqus model of reinforcement.

Figure 16.
Analysis of RPC with fixed column boundary condition.

Figure 17.
Analysis of concrete with hinge column boundary condition.

Figure 18.
Displacement at beam end (roller support) with a hinge boundary condition at column end for CC_S1 (mesh size 25 mm).
Figure 18.
Displacement at beam end (roller support) with a hinge boundary condition at column end for CC_S1 (mesh size 25 mm).

Figure 19.
Displacement at beam end (roller support) with a fixed boundary condition at column end for CC_S2 (mesh size 25 mm).
Figure 19.
Displacement at beam end (roller support) with a fixed boundary condition at column end for CC_S2 (mesh size 25 mm).

Figure 20.
Displacement at beam end (roller support) with hinge boundary condition at column end for RPC_S1.
Figure 20.
Displacement at beam end (roller support) with hinge boundary condition at column end for RPC_S1.

Figure 21.
Displacement at beam end (roller support) with fixed boundary condition at column end for RPC_S2.
Figure 21.
Displacement at beam end (roller support) with fixed boundary condition at column end for RPC_S2.

Figure 22.
Comparison between concrete and RPC specimens for S1 (column hinge condition).

Figure 23.
Comparison between concrete and RPC specimens for S2 (column fixed condition).

Figure 24.
Initial stiffness of all specimens at 5% of ultimate loading.

Figure 25.
Stiffness of all specimens at 25% of ultimate loading.

Figure 26.
Stiffness of all specimens at 50% of ultimate loading.

Figure 27.
Ductility displacement.


Table 1.
Mix design of RPC.
| Ordinary Portland Cement | Silica Fume | Quartz | Fine Aggregate | W/C Ratio | Steel Fibers | Superplasticizers |
|---|---|---|---|---|---|---|
| 1 | 0.25 | 0.4 | 1.1 | 0.17 | 0.03 | 0.015 |
Table 2.
Experimental results.
| Specimens | fc’ (MPa) | Ec (MPa) | Max Load in Experimental (N) | Max Displacement Experimental (mm) |
|---|---|---|---|---|
| CC_S1 | 21.03 | 27,497.88 | 15,500 | 35.98 |
| CC_S2 | 21.03 | 27,497.88 | 13,330 | 46.28 |
| RPC_S1 | 45.24 | 37,433.67 | 18,000 | 40.15 |
| RPC_S2 | 45.24 | 37,433.67 | 16,020 | 43.33 |
Table 3.
Comparison of load and displacement between experimental and modeling.
| Specimens | fc’ (MPa) | Ec (MPa) | Max Load in Experimental (N) | Max Load in Modeling (N) | Max Displacement Experimental (mm) | Max Displacement Modeling (mm) | Difference b/w Modeling and Experimental Displacement Max Values (mm) |
|---|---|---|---|---|---|---|---|
| CC_S1 | 21.03 | 27,497.88 | 15,500 | 15,675.21 | 35.98 | 33.44 | 2.54 |
| CC_S2 | 21.03 | 27,497.88 | 13,330 | 13,413.50 | 46.28 | 48.21 | 1.93 |
| RPC_S1 | 45.24 | 37,433.67 | 18,000 | 19,090.02 | 40.15 | 38.89 | 1.25 |
| RPC_S2 | 45.24 | 37,433.67 | 16,020 | 17,097.80 | 43.33 | 40.50 | 2.83 |
Table 4.
Stiffness of all specimens from experimental work.
| Specimens | ||||
|---|---|---|---|---|
| (% of Ultimate Load) | CC_S1 | CC_S2 | RPC_S1 | RPC_S2 |
| Stiffness (kN/mm) | Stiffness (kN/mm) | Stiffness (kN/mm) | Stiffness (kN/mm) | |
| 5% | 21.36 | 19.18 | 14.66 | 14.19 |
| 25% | 2.24 | 3.23 | 4.59 | 4.38 |
| 50% | 1.48 | 1.96 | 2.53 | 2.43 |
Table 5.
Stiffness of all specimens at different loading rates (numerically).
| (% of Ultimate Load) | Specimens | |||
|---|---|---|---|---|
| CC_S1 | CC_S2 | RPC_S1 | RPC_S2 | |
| Stiffness (kN/mm) | Stiffness (kN/mm) | Stiffness (kN/mm) | Stiffness (kN/mm) | |
| 5% | 18.561 | 20.82 | 15.76 | 15.98 |
| 10% | 12.67 | 17.49 | 12.23 | 12.76 |
| 15% | 5.42 | 7.18 | 8.88 | 8.48 |
| 20% | 3.45 | 4.31 | 5.44 | 5.73 |
| 25% | 2.50 | 3.06 | 4.11 | 4.03 |
| 30% | 1.99 | 2.38 | 3.10 | 2.88 |
| 40% | 1.42 | 1.34 | 1.98 | 1.56 |
| 50% | 1.09 | 0.97 | 1.03 | 1.29 |
| 60% | 0.88 | 0.76 | 0.85 | 0.81 |
Table 6.
Ductility factor and ductility displacement.
| Sample | Experimental | Modeling | ||
|---|---|---|---|---|
| Ductility Factor (R) | Displacement Ductility (DD) | Ductility Factor (R) | Displacement Ductility (DD) | |
| CC_S1 | 4.91 | 4.78 | 4.671 | 4.699 |
| CC_S2 | 5.56 | 5.71 | 5.18 | 5.33 |
| RPC_S1 | 6.257 | 6.19 | 6.03 | 6.153 |
| RPC_S2 | 6.2 | 6.39 | 5.98 | 6.13 |
Publisher’s Note: MDPI stays neutral with regard to jurisdictional claims in published maps and institutional affiliations. |
© 2021 by the authors. Licensee MDPI, Basel, Switzerland. This article is an open access article distributed under the terms and conditions of the Creative Commons Attribution (CC BY) license (https://creativecommons.org/licenses/by/4.0/).
Share and Cite
MDPI and ACS Style
Nafees, A.; Javed, M.F.; Musarat, M.A.; Ali, M.; Aslam, F.; Vatin, N.I. FE Modelling and Analysis of Beam Column Joint Using Reactive Powder Concrete. Crystals 2021, 11, 1372. https://0-doi-org.brum.beds.ac.uk/10.3390/cryst11111372
AMA Style
Nafees A, Javed MF, Musarat MA, Ali M, Aslam F, Vatin NI. FE Modelling and Analysis of Beam Column Joint Using Reactive Powder Concrete. Crystals. 2021; 11(11):1372. https://0-doi-org.brum.beds.ac.uk/10.3390/cryst11111372
Chicago/Turabian StyleNafees, Afnan, Muhammad Faisal Javed, Muhammad Ali Musarat, Mujahid Ali, Fahid Aslam, and Nikolai Ivanovich Vatin. 2021. "FE Modelling and Analysis of Beam Column Joint Using Reactive Powder Concrete" Crystals 11, no. 11: 1372. https://0-doi-org.brum.beds.ac.uk/10.3390/cryst11111372
Note that from the first issue of 2016, this journal uses article numbers instead of page numbers. See further details here.