Article

Investigation on Optimal Ta/Cr Ratio of a Single Crystal Ni-Base Superalloy in View of the Isothermal Oxidation Behavior

1
College of Materials Science and Engineering, Xi’an Shiyou University, Xi’an 710065, China
2
Superalloys Division, Institute of Metal Research, Chinese Academy of Sciences, 72 Wenhua Road, Shenyang 110016, China
*
Author to whom correspondence should be addressed.
Submission received: 23 September 2021 / Revised: 8 November 2021 / Accepted: 16 November 2021 / Published: 20 November 2021
(This article belongs to the Section Inorganic Crystalline Materials)

Abstract

:
The relative content of strengthening element tantalum (Ta) and oxidation-resistant element chromium (Cr) is an essential value for superalloys to obtain an excellent combination of oxidation resistance and mechanical properties. In the present paper, the isothermal oxidation behavior of several single crystal Ni-base superalloys with different Ta/Cr (wt. %, similarly hereinafter) ratios at 1000 °C in static air has been systematically investigated to explore the optimal Ta/Cr for excellent oxidation resistance. A detailed microstructure study using X-ray diffraction (XRD), scanning electron microscopy (SEM) with energy dispersive spectroscopy (EDS) and an electro-probe microanalyzer (EPMA) was performed to reveal the oxidation products and mechanisms. For all alloys, a three-layer structured scale consisting of an outer (Cr, Al, Ti, Ni, Ta)-O layer, an inner Al2O3 layer and an inner nitride layer was formed. As Ta/Cr increased, the amounts of Ta-containing products, cracks, holes and inner nitride increased. Meanwhile, the completeness of the Al2O3 layer got worse. It was shown that if Ta/Cr ≤ 0.5, Ta increased the growth rate of Cr2O3 via the doping effect induced by Ta cations. If Ta/Cr > 0.5, Ta reduced the completeness of Cr2O3 through competitive growth of Ta2O5 and Cr2O3. A good oxidation performance can be expected with the value Ta/Cr ≤ 0.5.

1. Introduction

Nickel-base single crystal superalloys are widely used in large industrial gas turbines (IGTs) because of their outstanding combination of mechanical properties and environmental performance [1]. As IGTs developed, the operating temperature of the turbine blades became higher and higher. It was a new challenge to the hot end component materials because of severe oxidation and hot corrosion damage. During oxidation and hot corrosion, elements that assume the role of strengthening are consumed [2]. In addition, the inner corrosion destroys the microstructure of the blades [3]. Therefore, environmental damage severely deteriorates the service life of the blades. In recent years, approaches such as more effective thermal barrier coatings and cooling systems for blades have been used to improve this situation [4]. At the same time, efforts in developing superalloys with better temperature capability have been carried out. Researchers have been trying to increase the concentration of refractory elements (Re and Ta), which exhibited excellent performance in improving mechanical properties [5,6,7]. Consequently, the mechanisms by which Re and Ta affect hot corrosion resistance and oxidation behavior are very important for further optimization of their contents in superalloys for IGTs.
The authors have systematically investigated the effect of Re on hot corrosion and oxidation. It was shown that the Re addition improved both oxidation and hot corrosion resistance remarkably. The mechanisms, however, are different [8,9]. The effect of Ta on hot corrosion was systematically investigated. A quantization parameter Ta/Cr (wt. %, similarly hereinafter) was proposed to describe the effect of Ta [3,10]. Considering the different mechanisms of Re on hot corrosion and oxidation, it is of interest to reveal the effect of Ta on oxidation.
The effect of Ta addition on oxidation behavior is presently controversial. According to Yang et al. [11], a small amount of Ta improved the oxidation resistance of the alloy, while too much Ta content reduced the stability of the Al2O3 scale and deteriorated the oxidation resistance of the alloy. However, Barrett et al. [12] showed that high Ta concentrations can promote oxidation resistance, although the mechanism is not clear. Wu et al. [13] have studied the effect of Ir-Ta-Al coating on the cyclic oxidation behavior of alloys and declared that the Ta addition effectively inhibited the precipitation of the TCP phase in the coating, stabilized the coating structure and retarded the diffusion of elements. However, the results acquired by Kuppusami [14] are just the opposite. The results showed that increasing Ta content in Ir-Ta coating worsened the protection capability because the substitution of Al3+ by Ta5+ increased the concentration of Al vacancy, which led to increased consumption of Al. Thus, it is necessary to investigate the effect of Ta addition on oxidation behavior.
Cr is one of the most important elements for superalloys to resist oxidation attacks. Sufficient Cr promotes the formation of a continuous and adherent Cr2O3 scale on the surface of the alloy [15,16]. The diffusion rate of ions through the Cr2O3 scale is extremely slow. A complete Cr2O3 scale can protect the substrate from being damaged by oxygen or other corrosive media. Thus, describing the effect of Ta by introducing a parameter including Cr was necessary and practical. In the present paper, the isothermal oxidation behavior of several Ni-base single crystal superalloys with different Cr and Ta contents was investigated at 1000 °C. The oxidation process and mechanism of interaction of Ta and Cr on oxidation behavior were discussed. An optimal Ta/Cr ratio for good oxidation resistance was proposed.

2. Materials and Methods

The chemical compositions of the experimental alloys are listed in Table 1. The four alloys were designed with different Ta/Cr (wt. %) varying from 0.34 to 0.69, with the compositions of other alloying elements nearly unchanged.
The single crystal rods measuring Φ16 × 220 mm of the alloys were fabricated using the high rate solidification (HRS) method. A subsequent heat treatment was conducted for each alloy. Samples used in this experiment were slices measuring 20 × 10 × 1.5 mm. They were cut from the heat-treated single crystal rods using electro-spark wire-electrode cutting, with the 20 mm side parallel to the (001)-direction of the rods and the other sides left random. The surfaces of the specimens were ground to #800 and ultrasonically cleaned with acetone and alcohol before the test.
The isothermal oxidation test was conducted according to the China Aviation industry standard HB5258-2000. Samples were put into separated corundum crucibles and then placed in a furnace, the temperature of which was set at 1000 °C. The crucibles were taken out of the furnace at 1, 4, 7, 10, 13, 25, 50, 75, 100, 200 and 500 h for morphology inspection and weight monitoring. As soon as the crucibles were taken out, they were covered with special corundum lids, avoiding any weight loss caused by splashing oxide scales. Weight measurement was carried out after 1 h of cooling. Each data point of mass change was the average of three samples. XRD (Shimadzu, Kyoto, Japan), SEM (FEI, Hillsboro, USA) equipped with EDS and EPMA (Shimadzu, Kyoto, Japan) were employed for the sample analysis.

3. Results

Heat-treated microstructures of the experimental alloys are illustrated in Figure 1. After standard heat treatment, all of the alloys exhibited similar microstructure. The eutectics were almost completely eliminated.

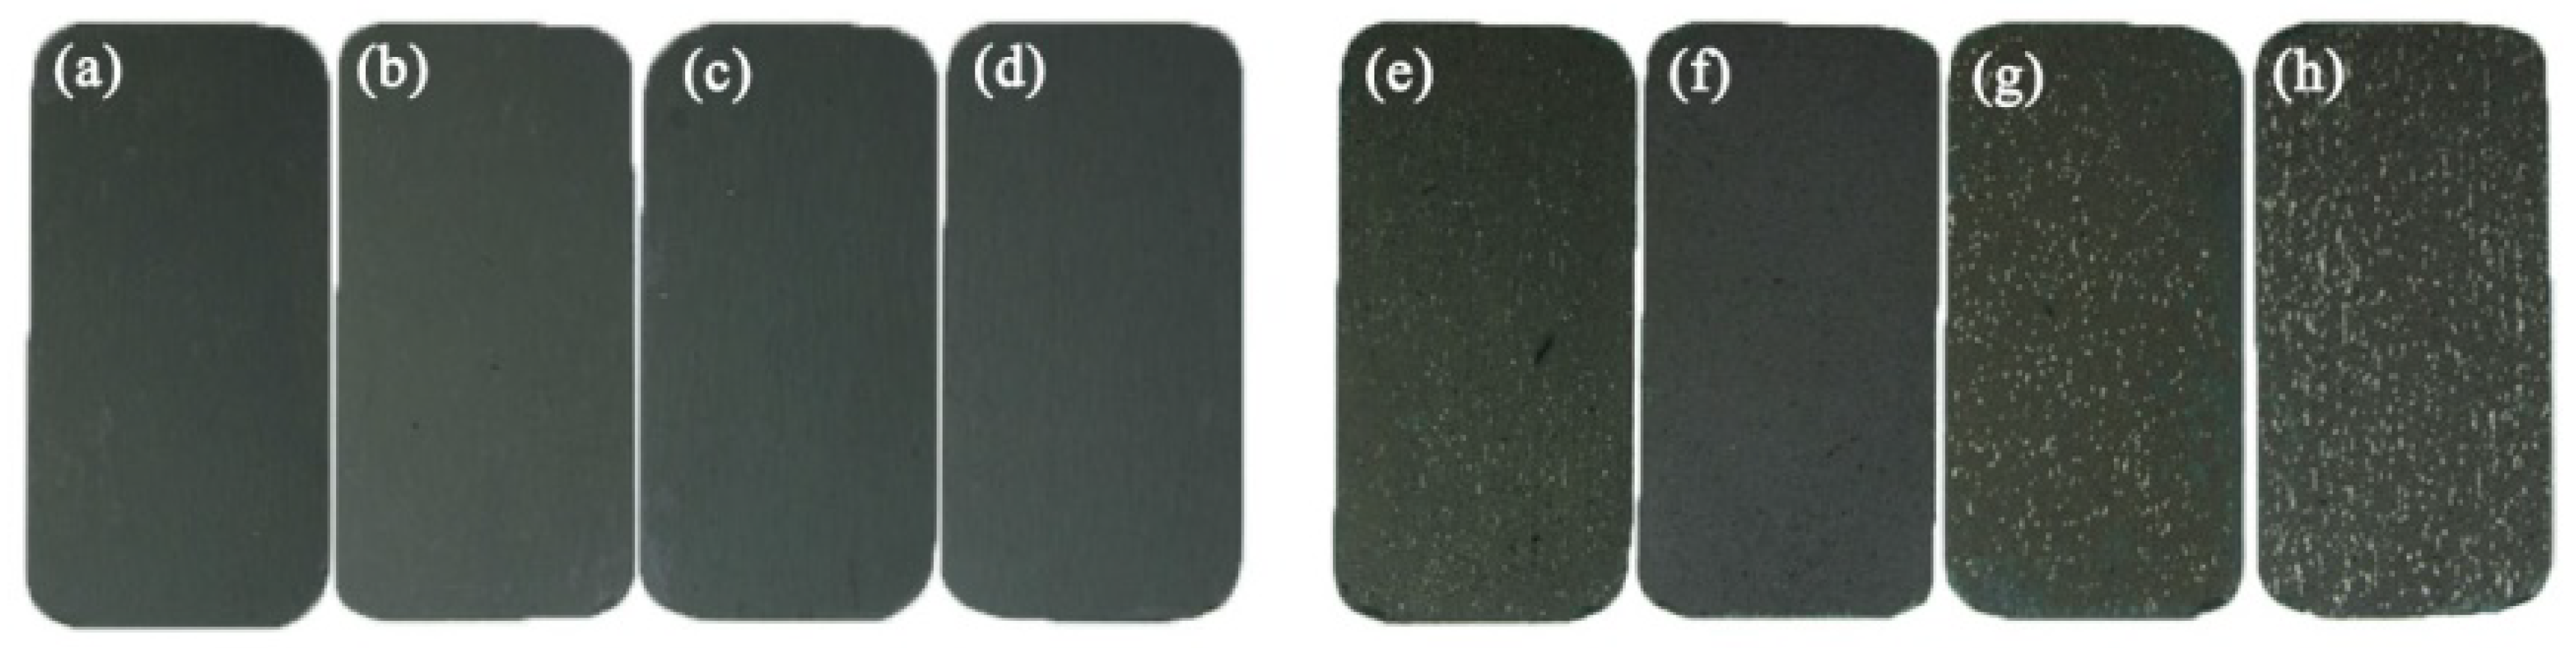
3.1. Macroscopic Morphologies

The macroscopic morphologies of the E7, E71, E73 and E75 alloys after isothermal oxidation at 1000 °C are shown in Figure 2. After only 4 h of oxidation, all samples were covered by gray, complete and dense scale. As the oxidation proceeded to 500 h, however, dispersed dot spallation was observed on the E7, E73 and E75 specimens, while the E71 samples remained complete and dense.

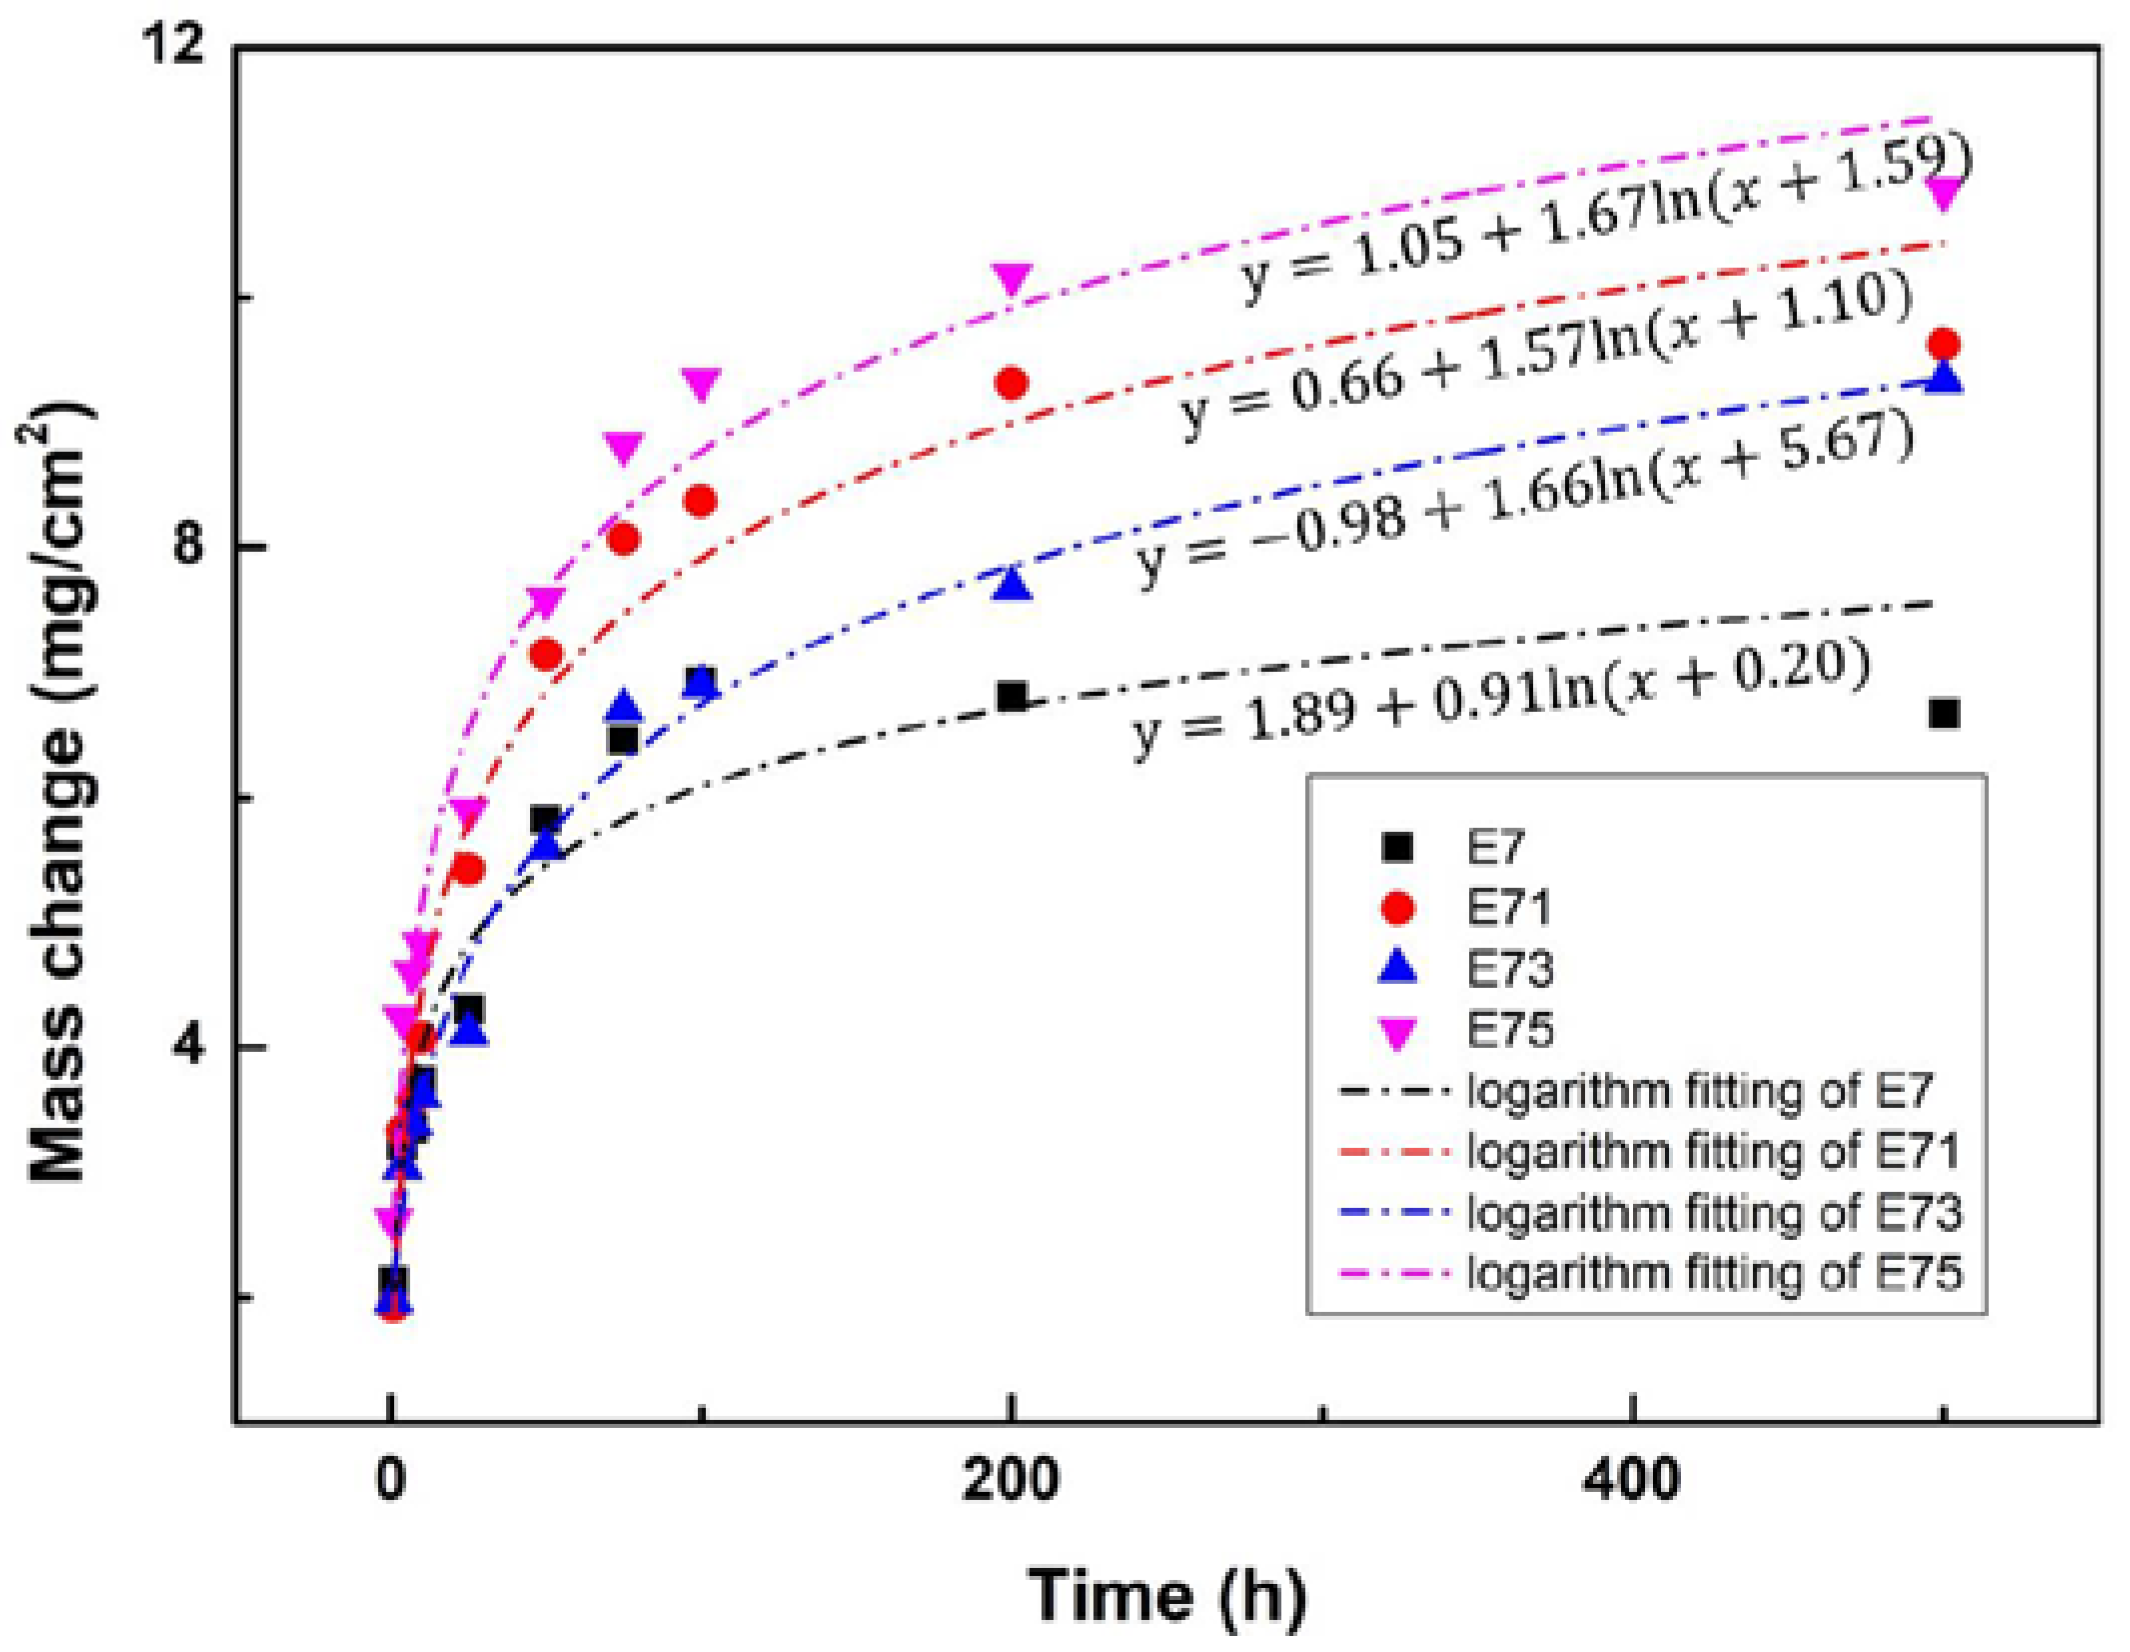
3.2. Oxidation Kinetics
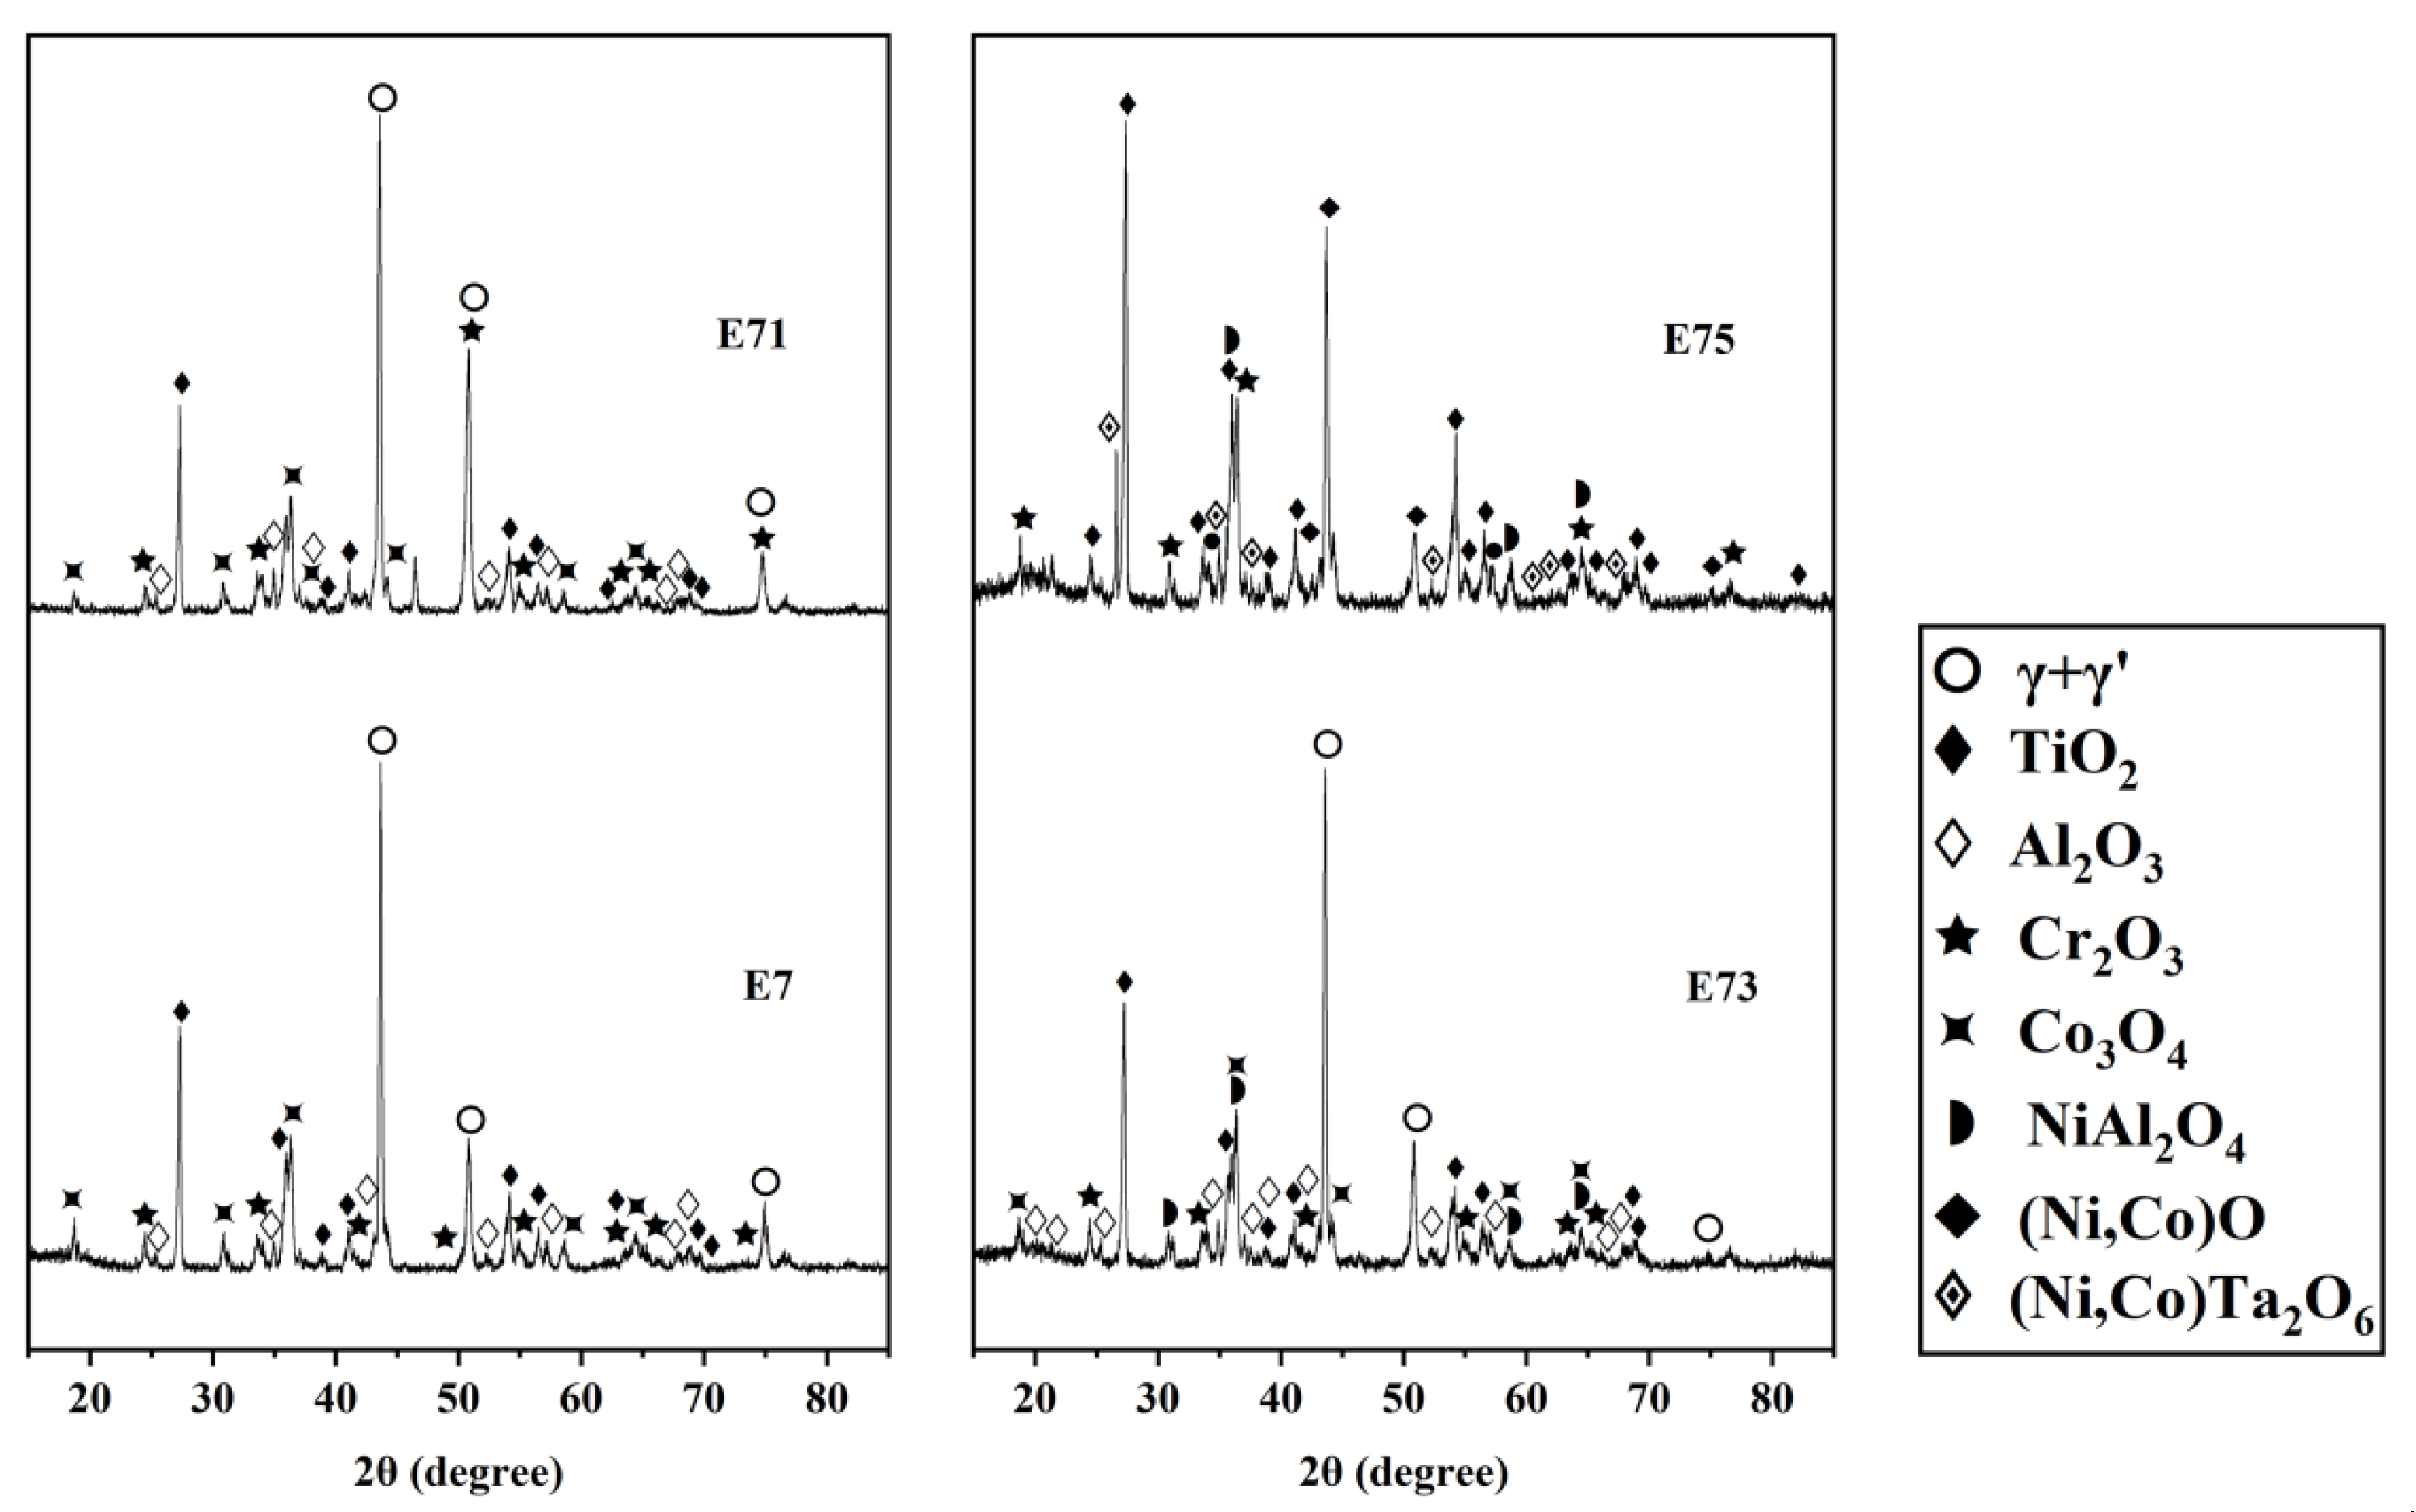
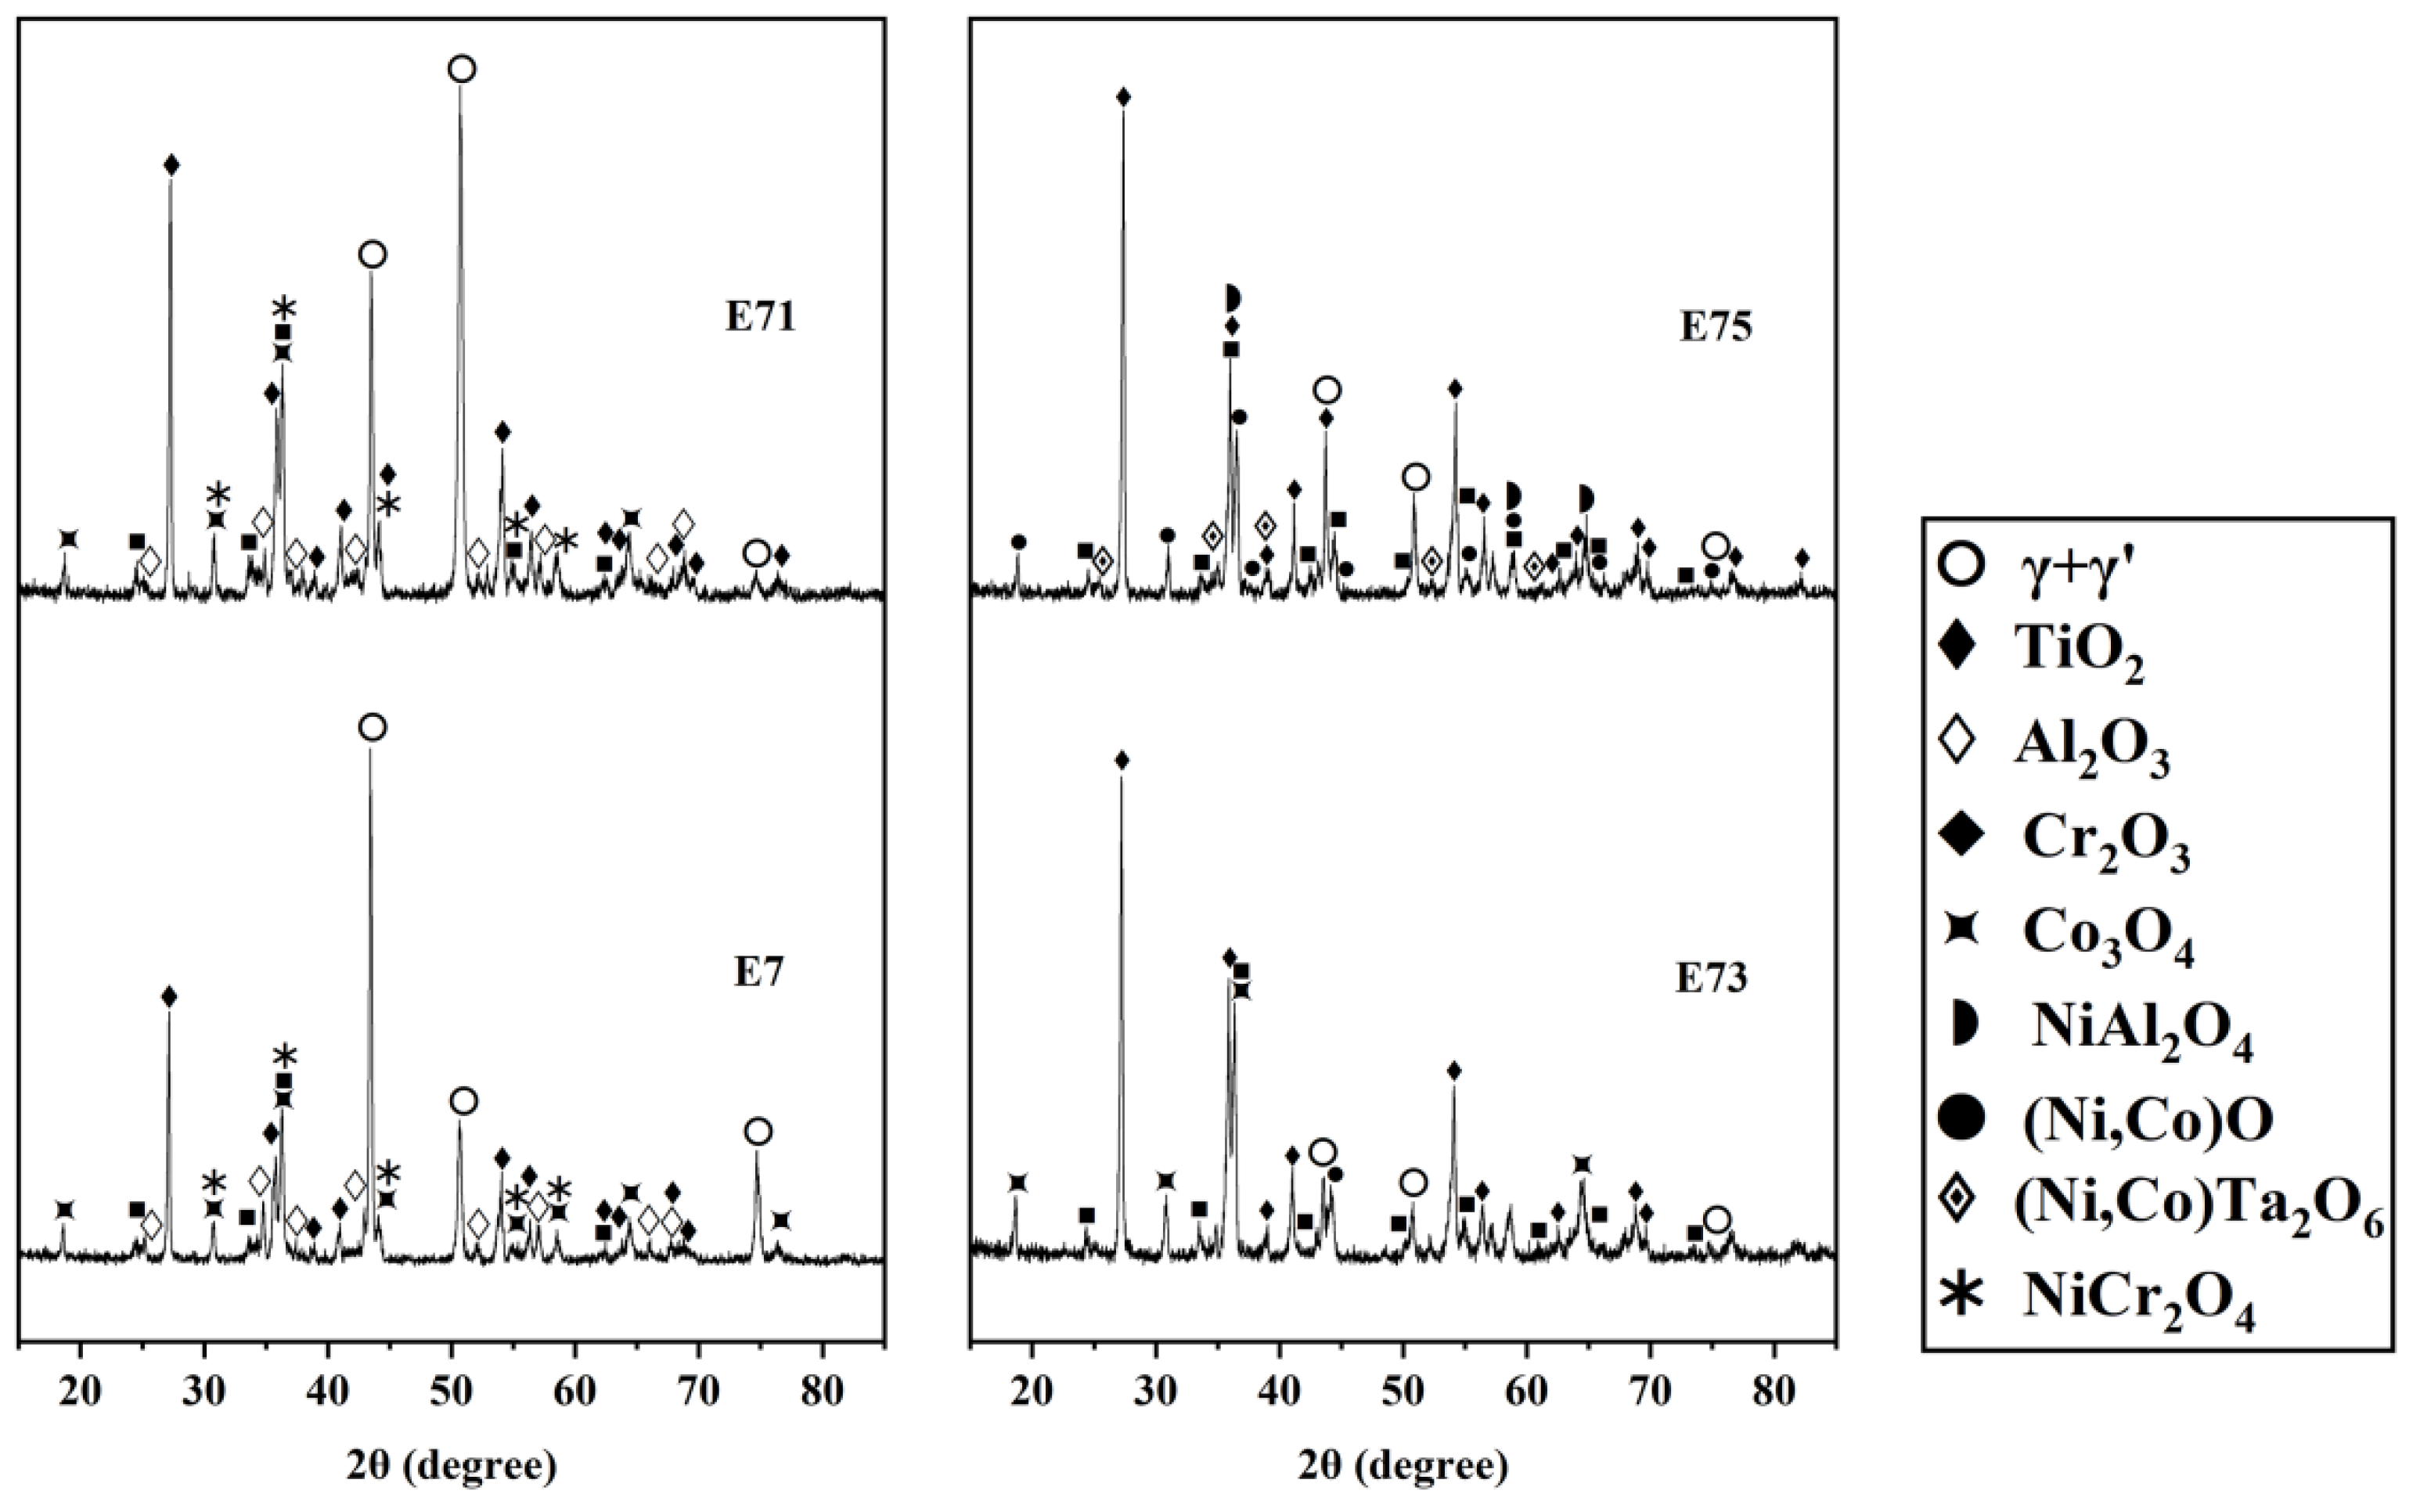
Weight gain versus time curves for the E7, E71, E73 and E75 alloys after isothermal oxidation at 1000 °C are shown in Figure 3. All alloys followed the logarithm law. In the initial 100 h, the mass changes of alloys increased rapidly. After 100 h, the increase in sample weights of the E7, E71 and E75 slowed down while E73 still presented obvious weight addition. The final mass gain of the four alloys decreased in this order: E75 > (E71, E73) > E7.

3.3. XRD Results

XRD patterns of the oxidation products are provided in Figure 4 and Figure 5 and Table 2. After 100 h of oxidation, common products TiO2, Cr2O3 and (Ni, Co)-oxides were detected on all samples. In addition, Al2O3 was detected on E7, E71 and E73; NiAl2O4 was detected on E73 and E75; (Ni, Co)Ta2O6 was formed on E75. After 500 h of oxidation, NiCr2O4 was formed on E7 and E71. Al2O3 and NiAl2O4 could not be detected on E73. The composition of the scale on E75 was unchanged.

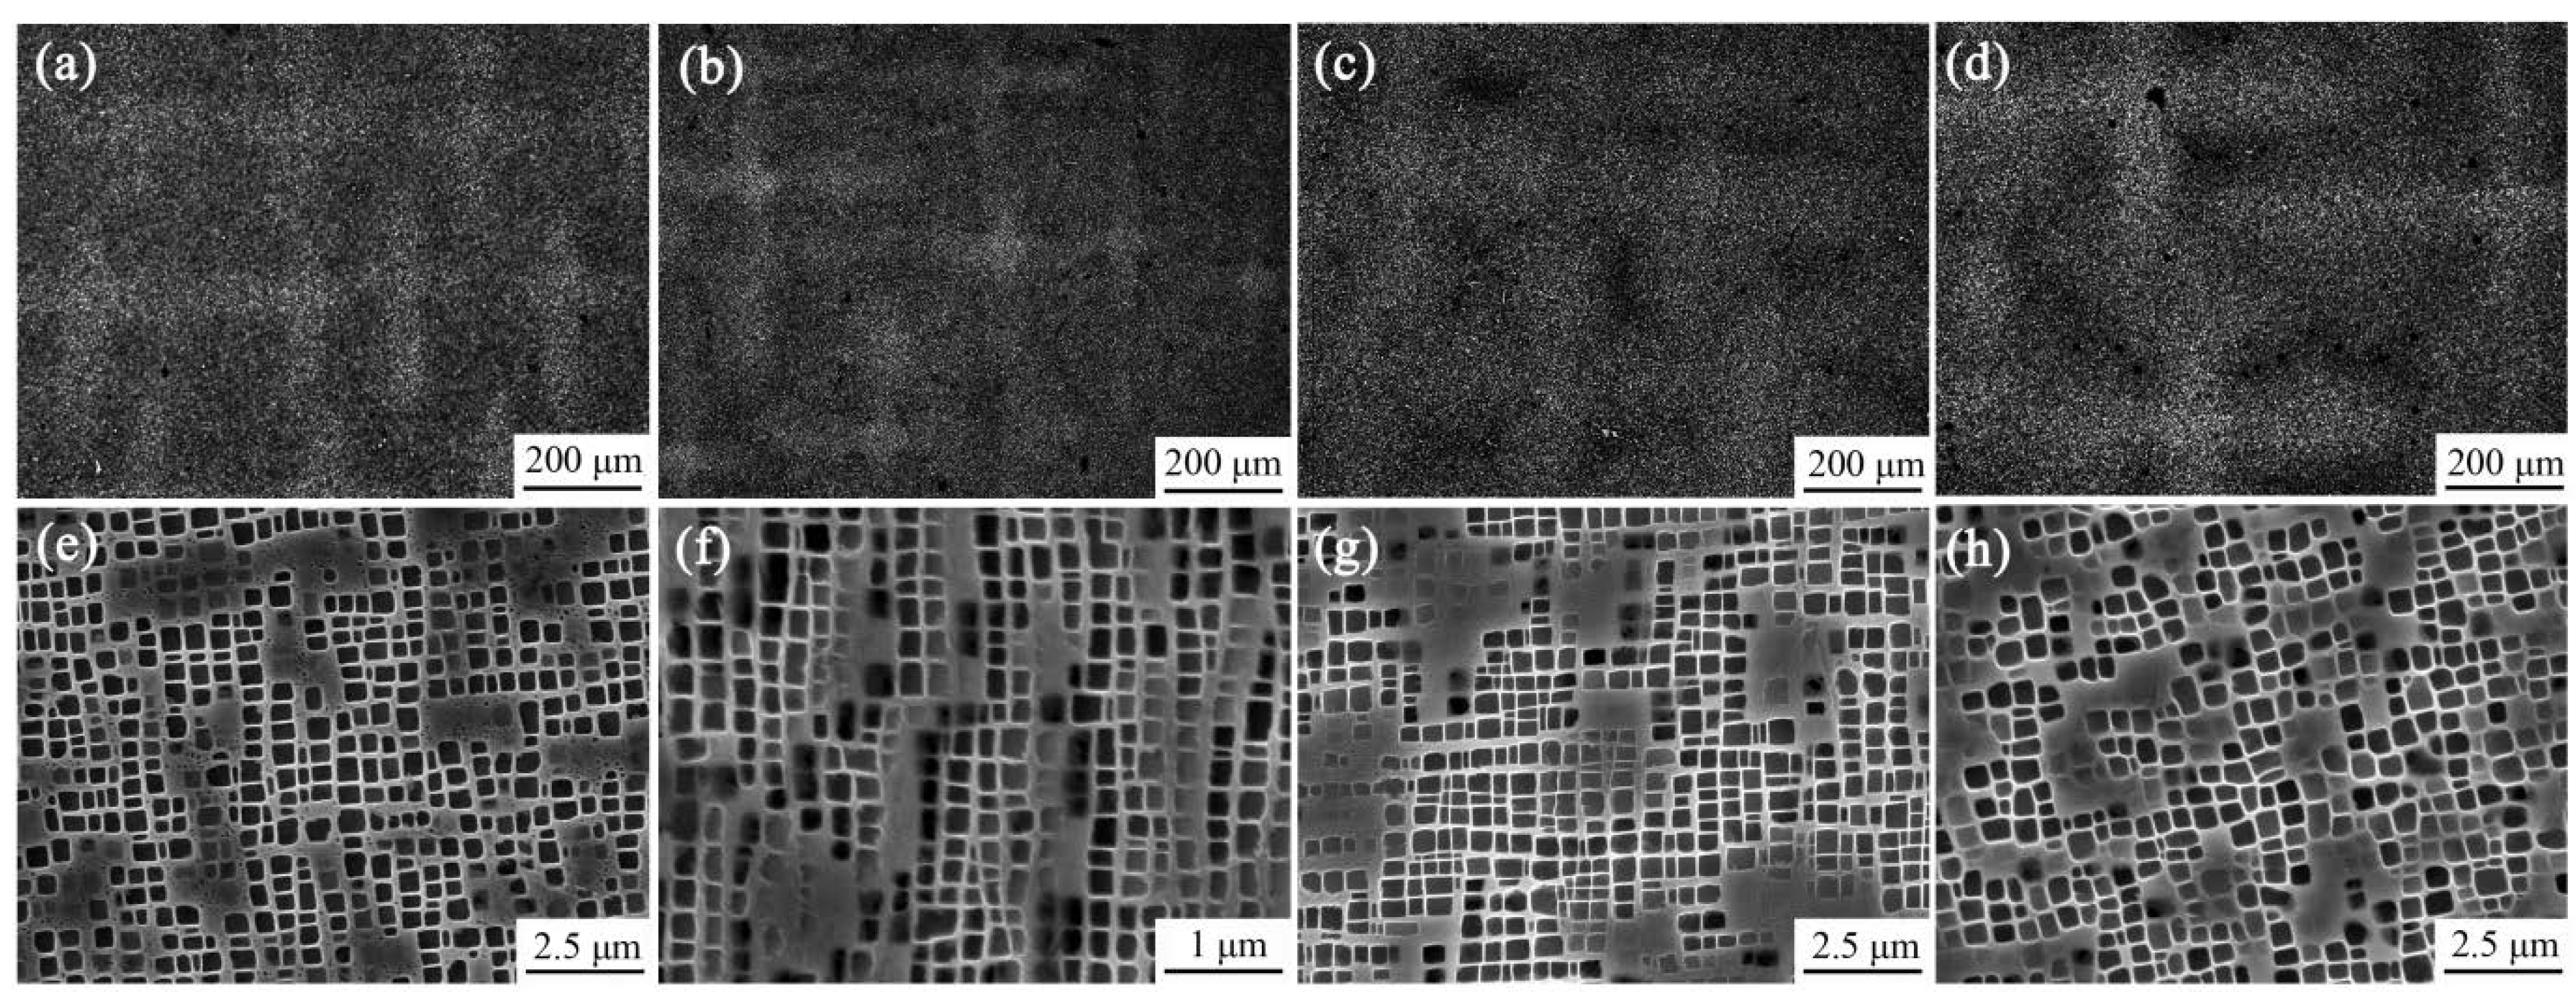
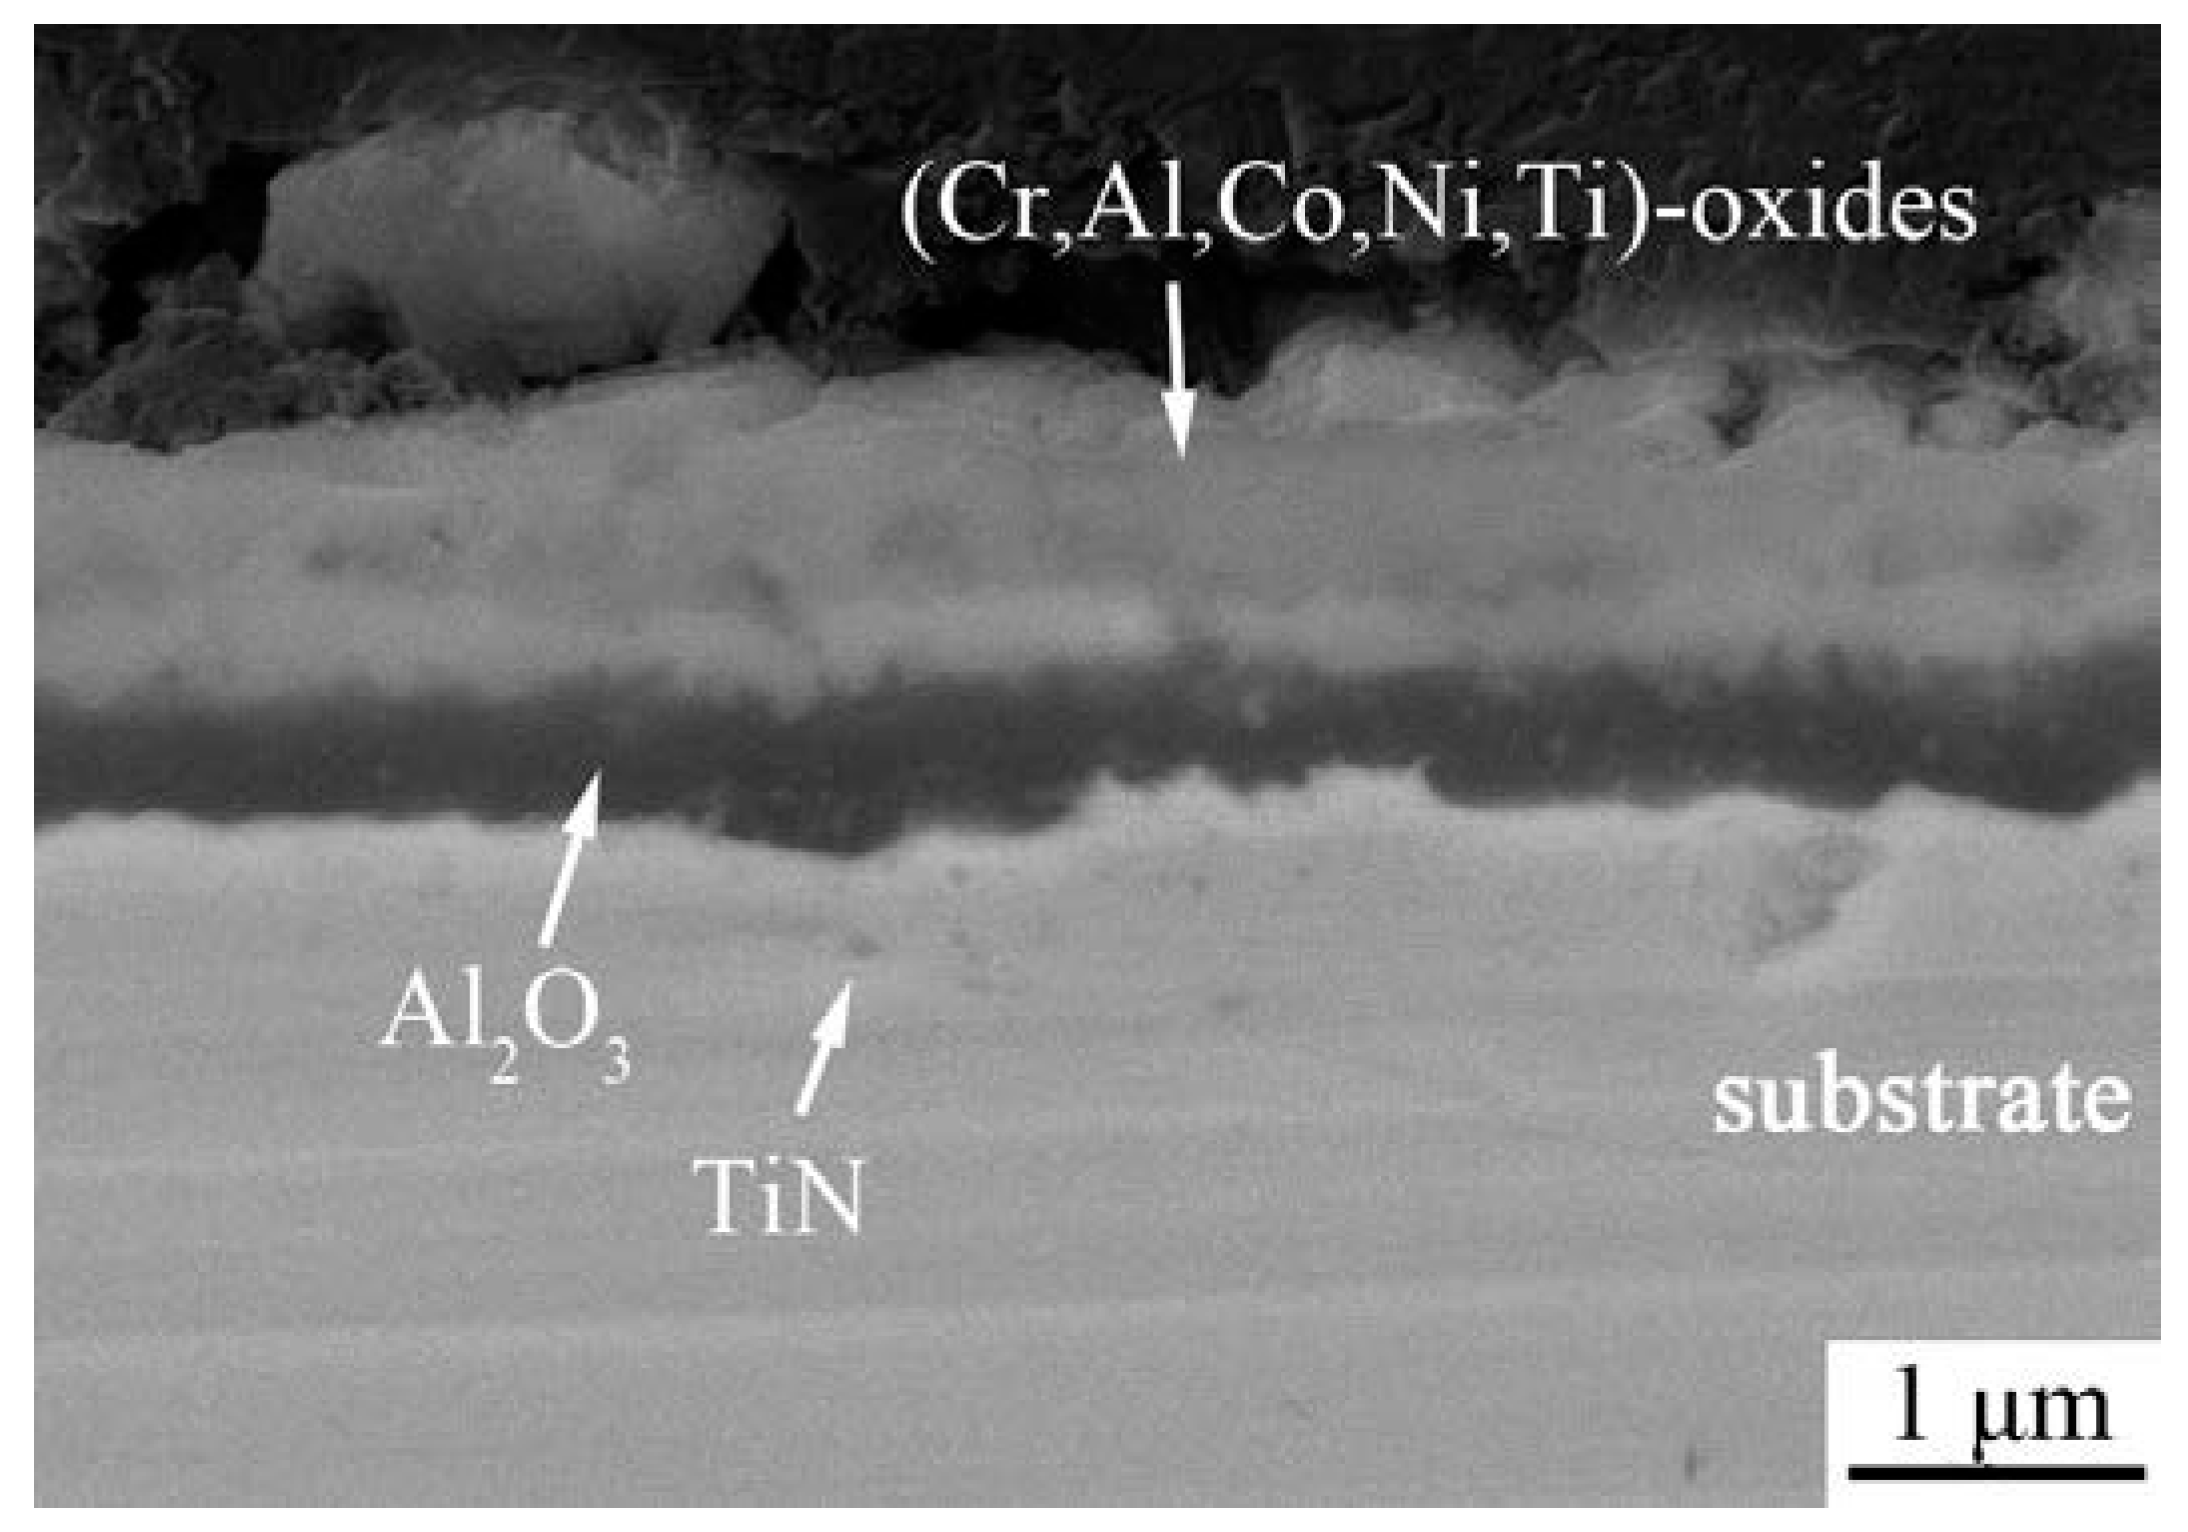
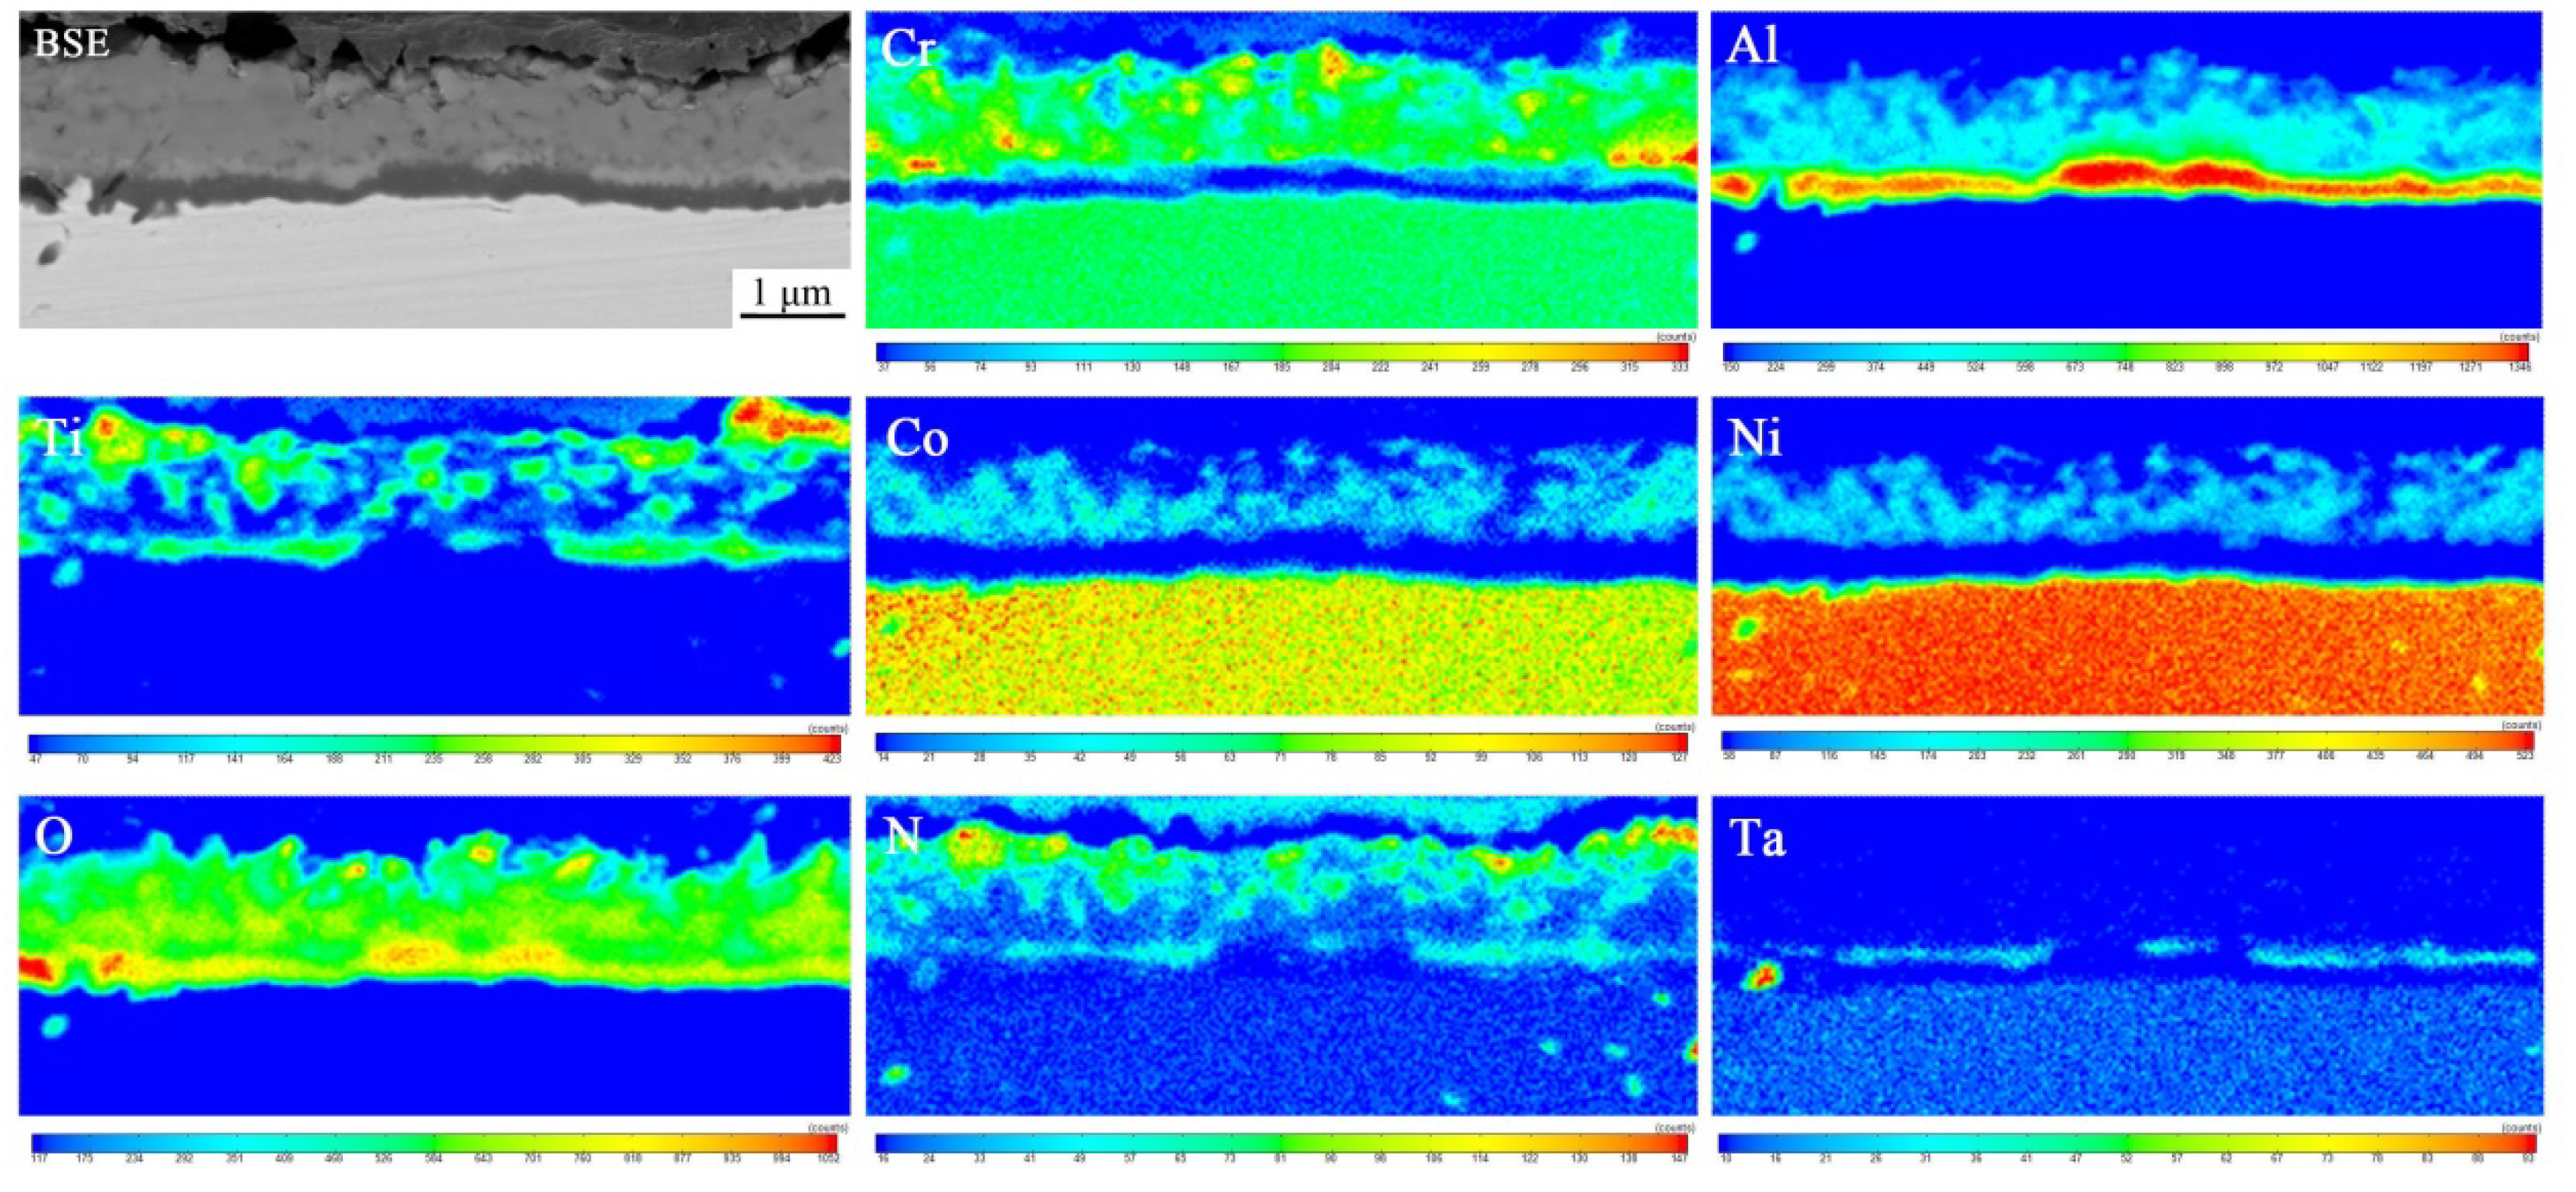
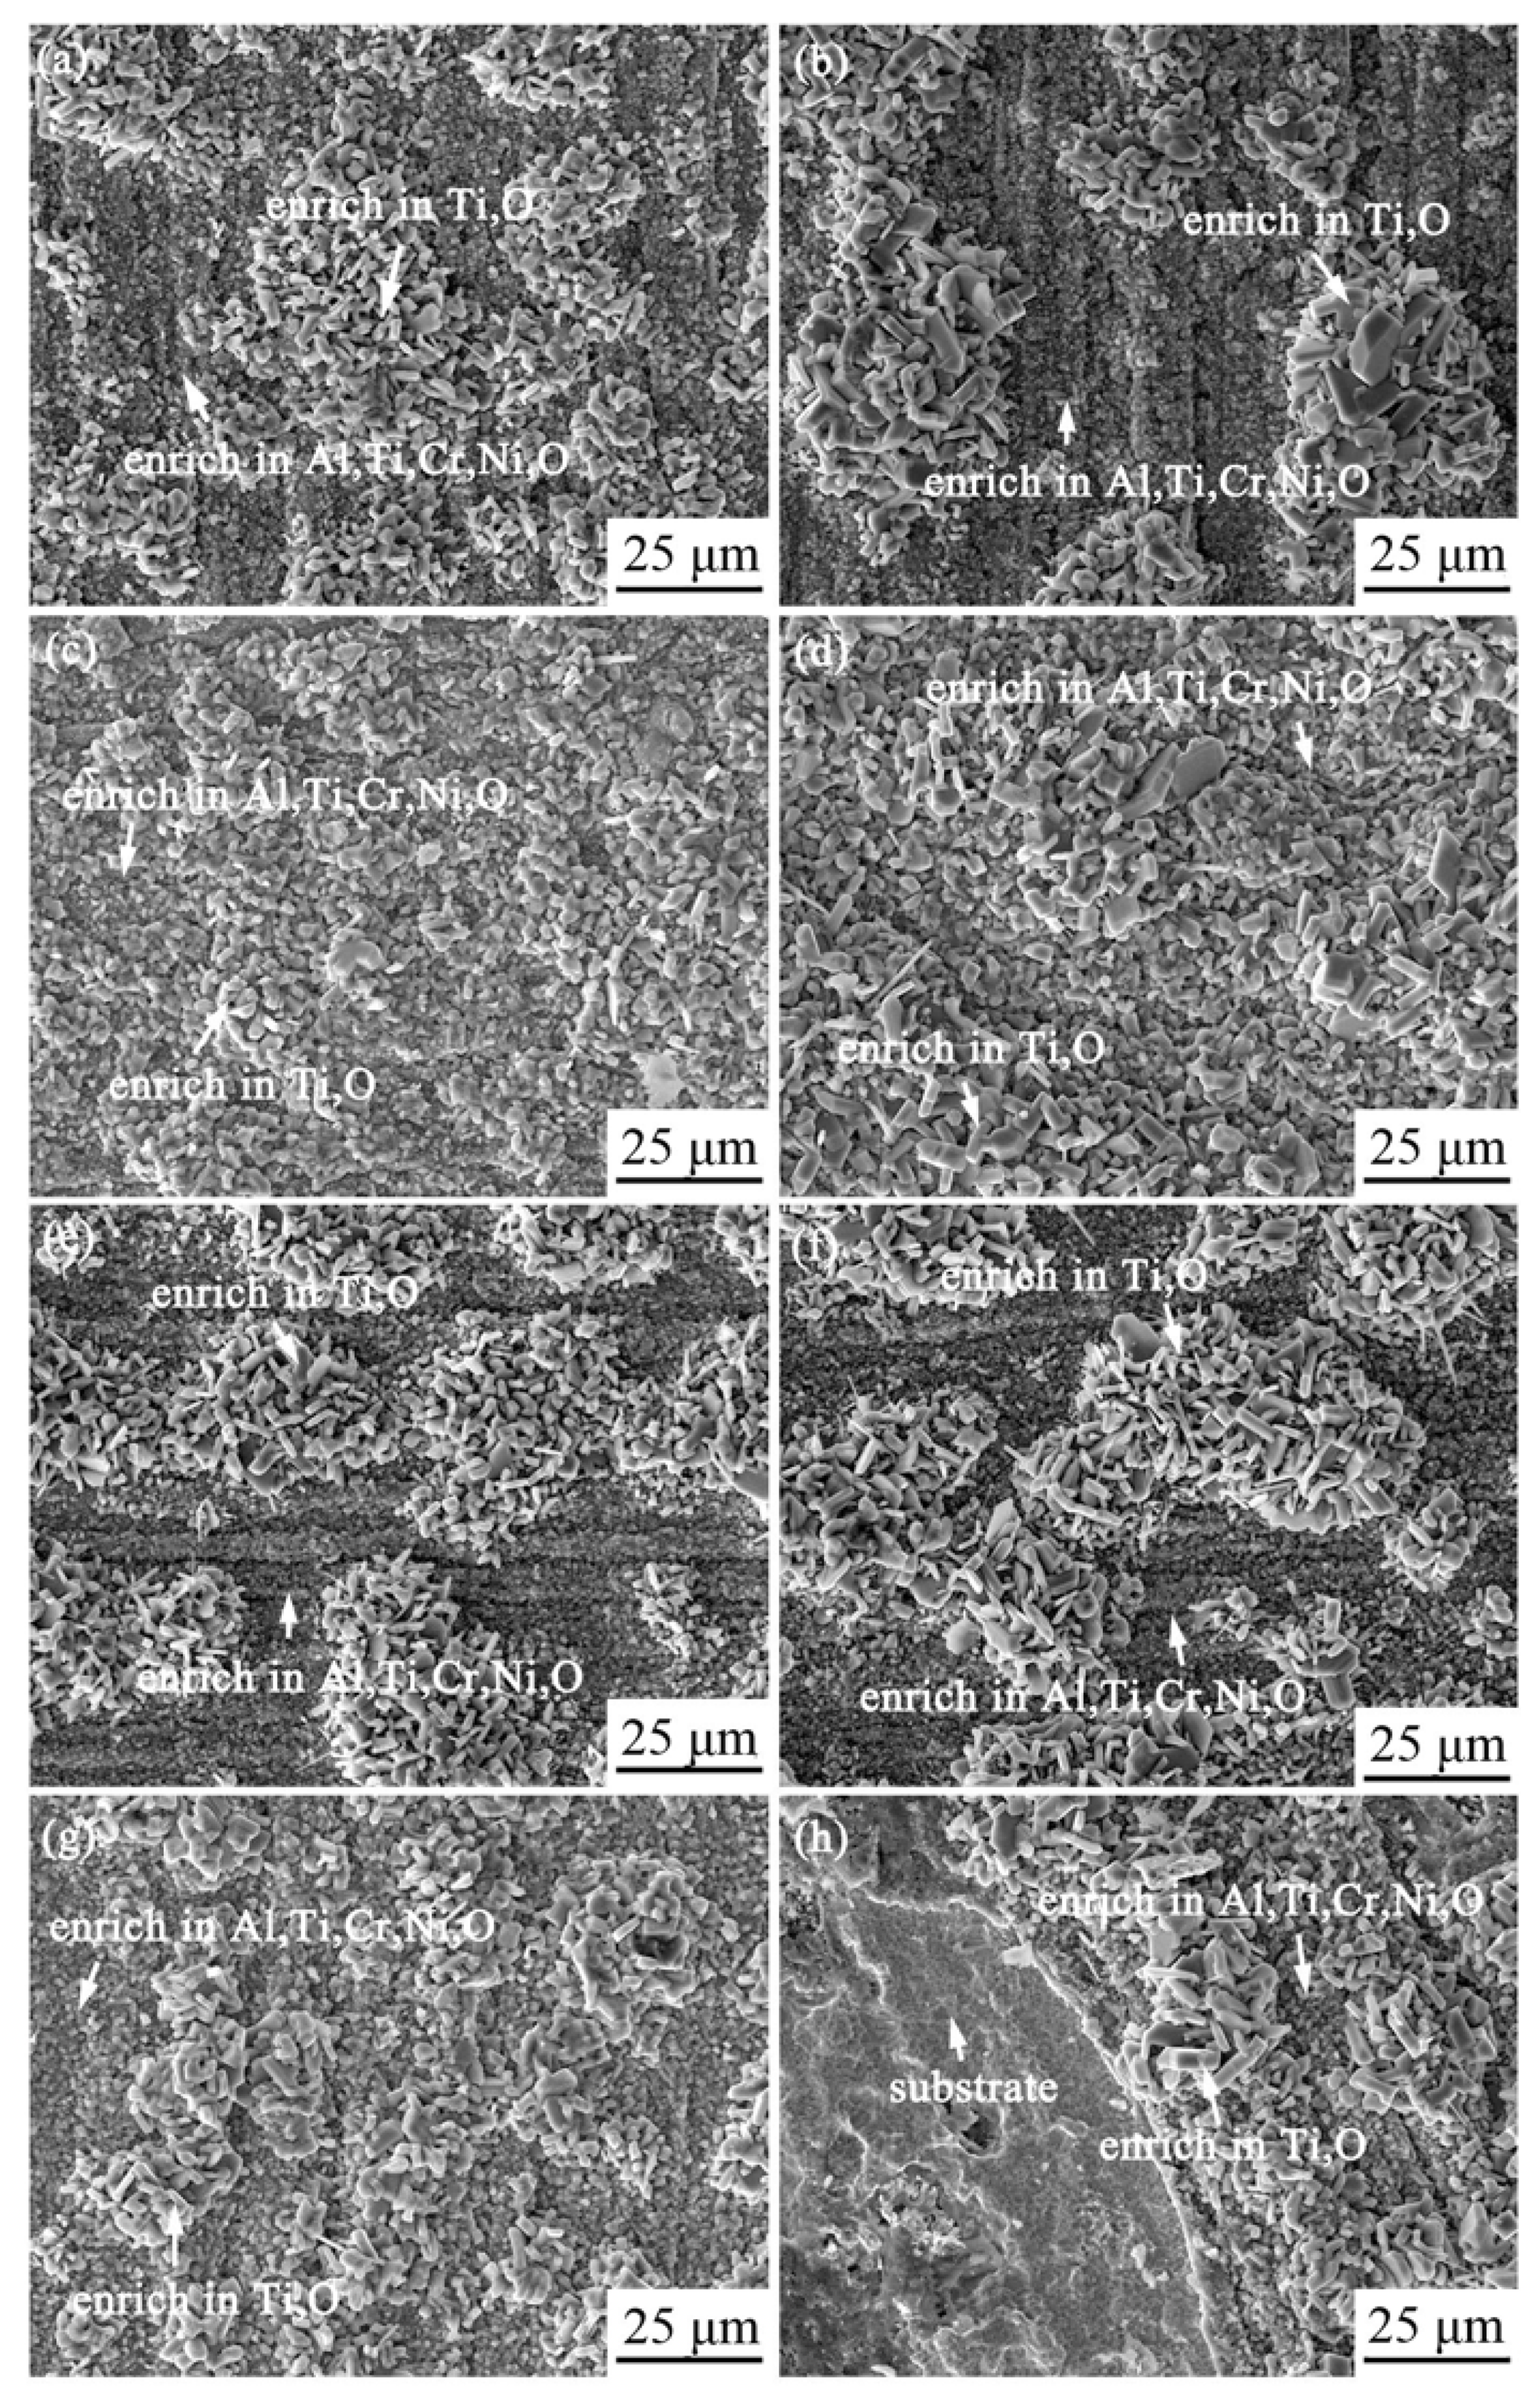
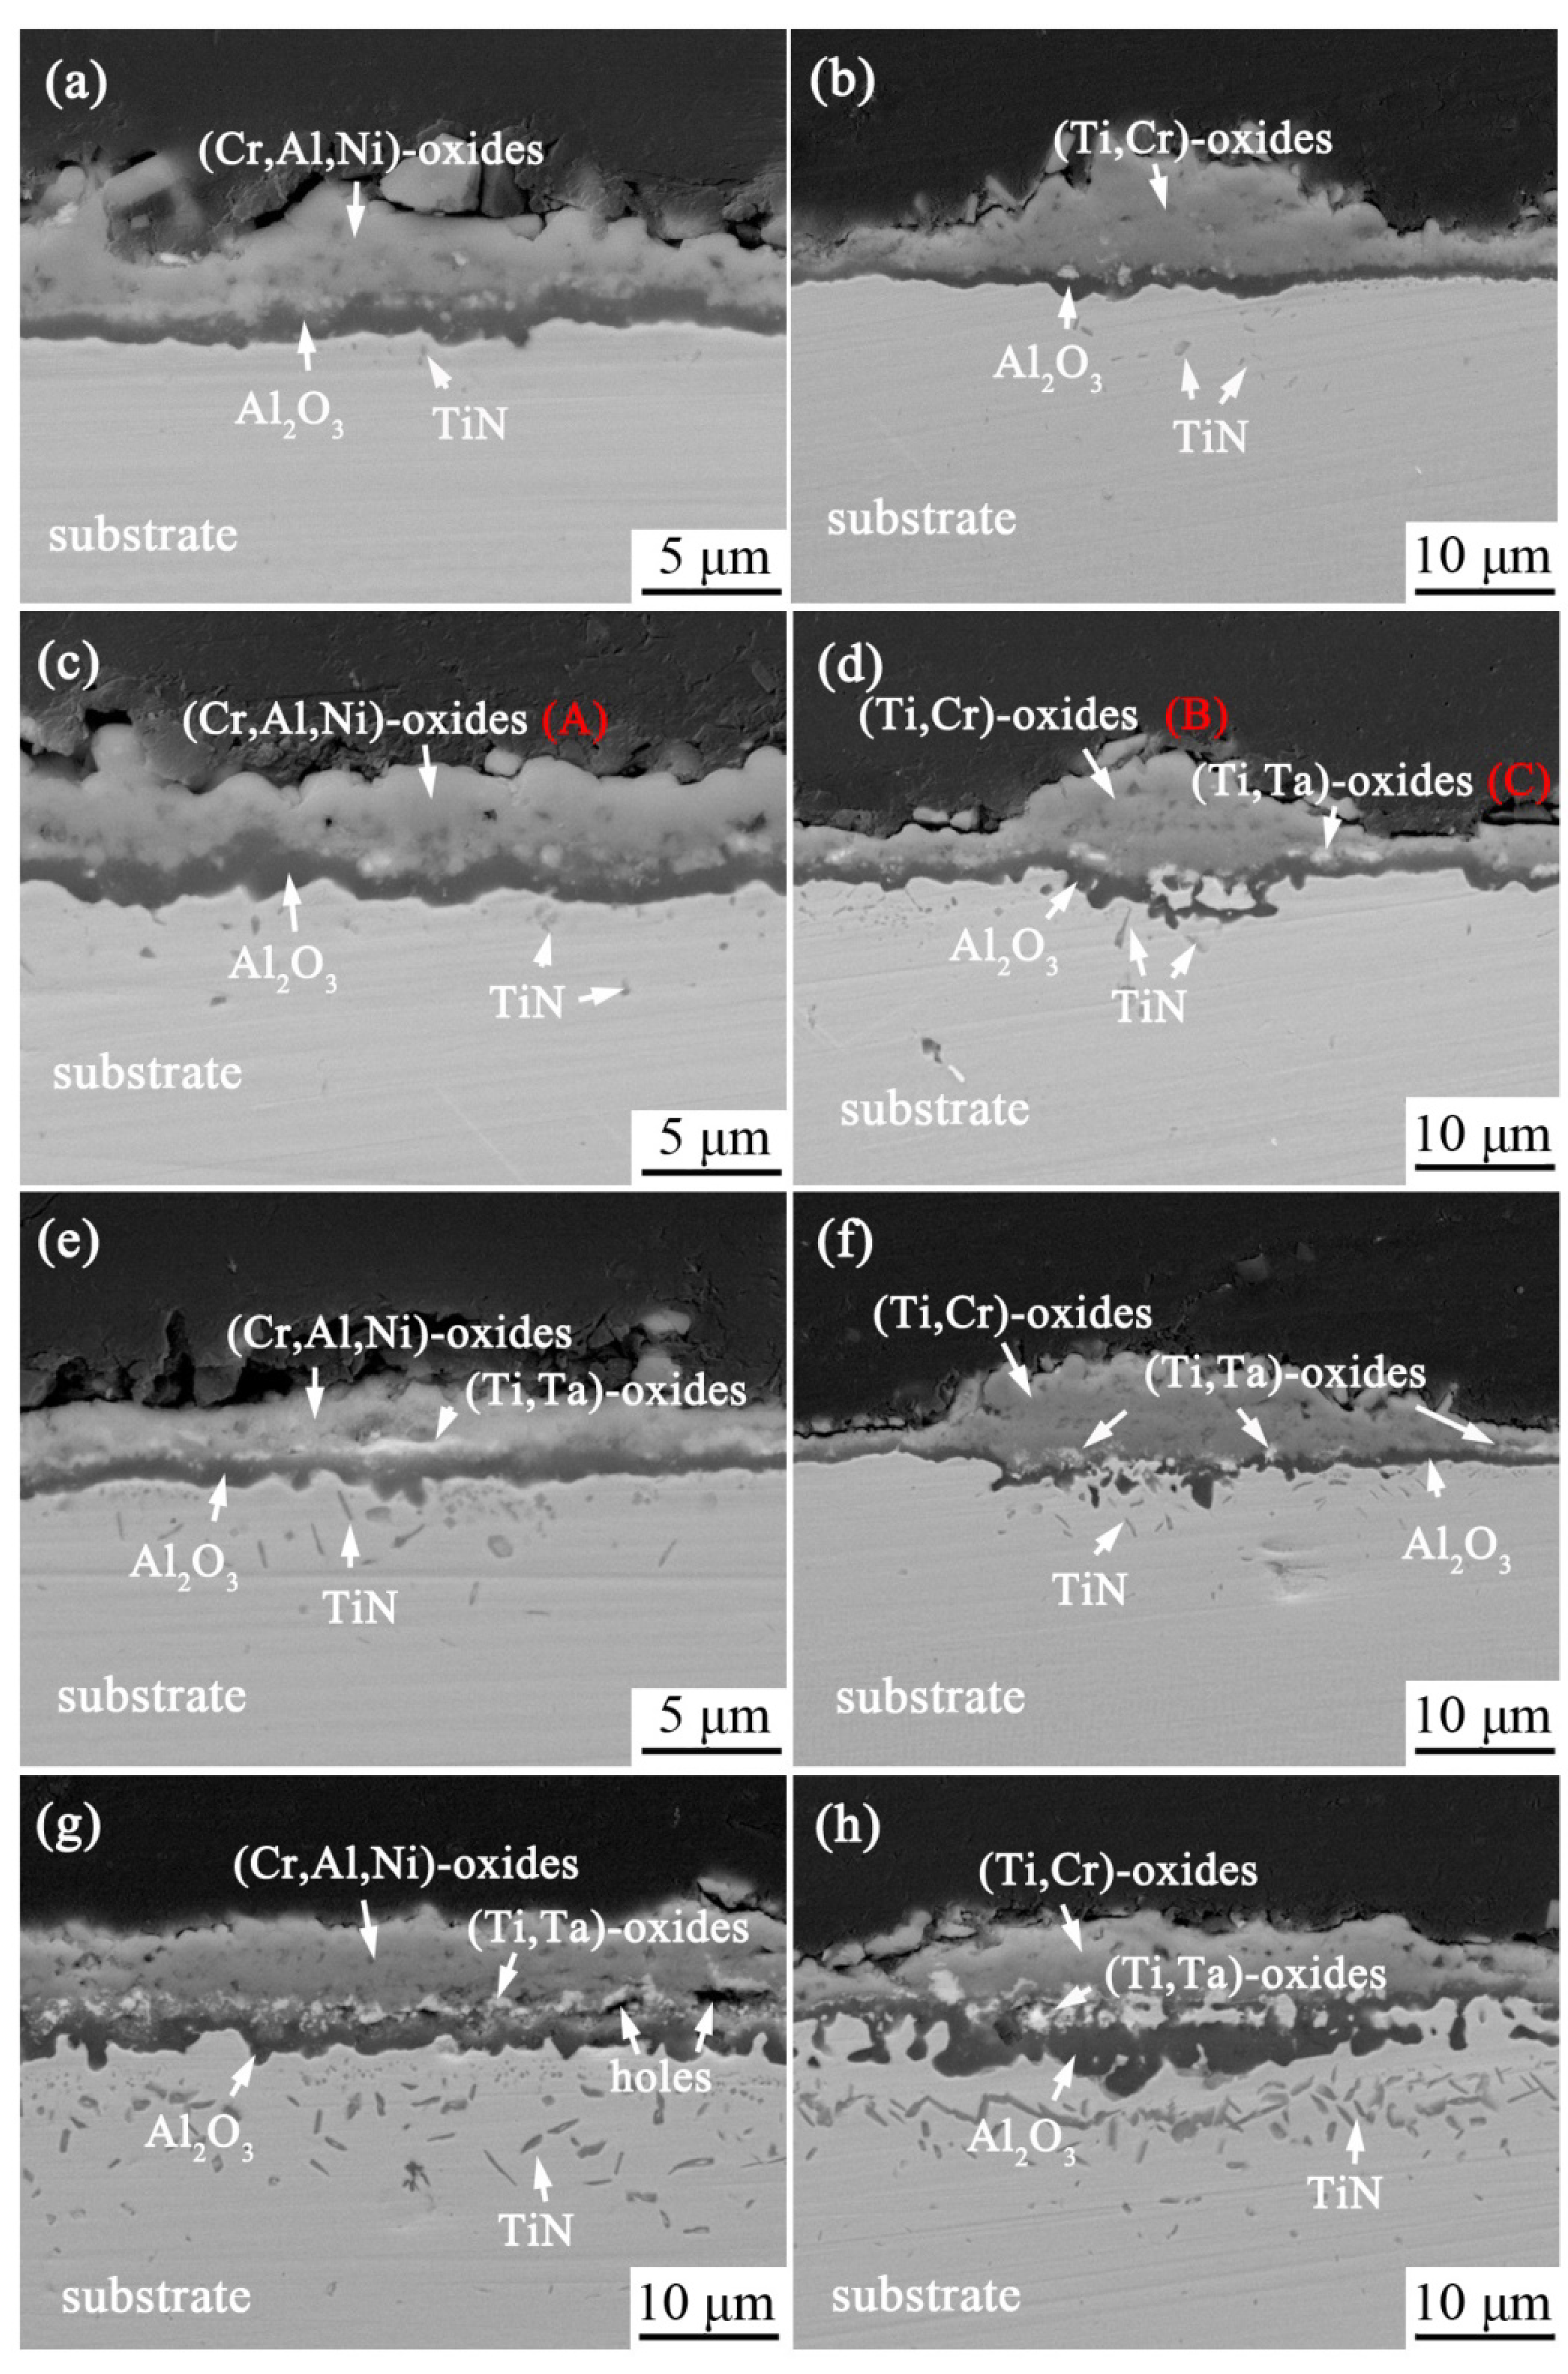
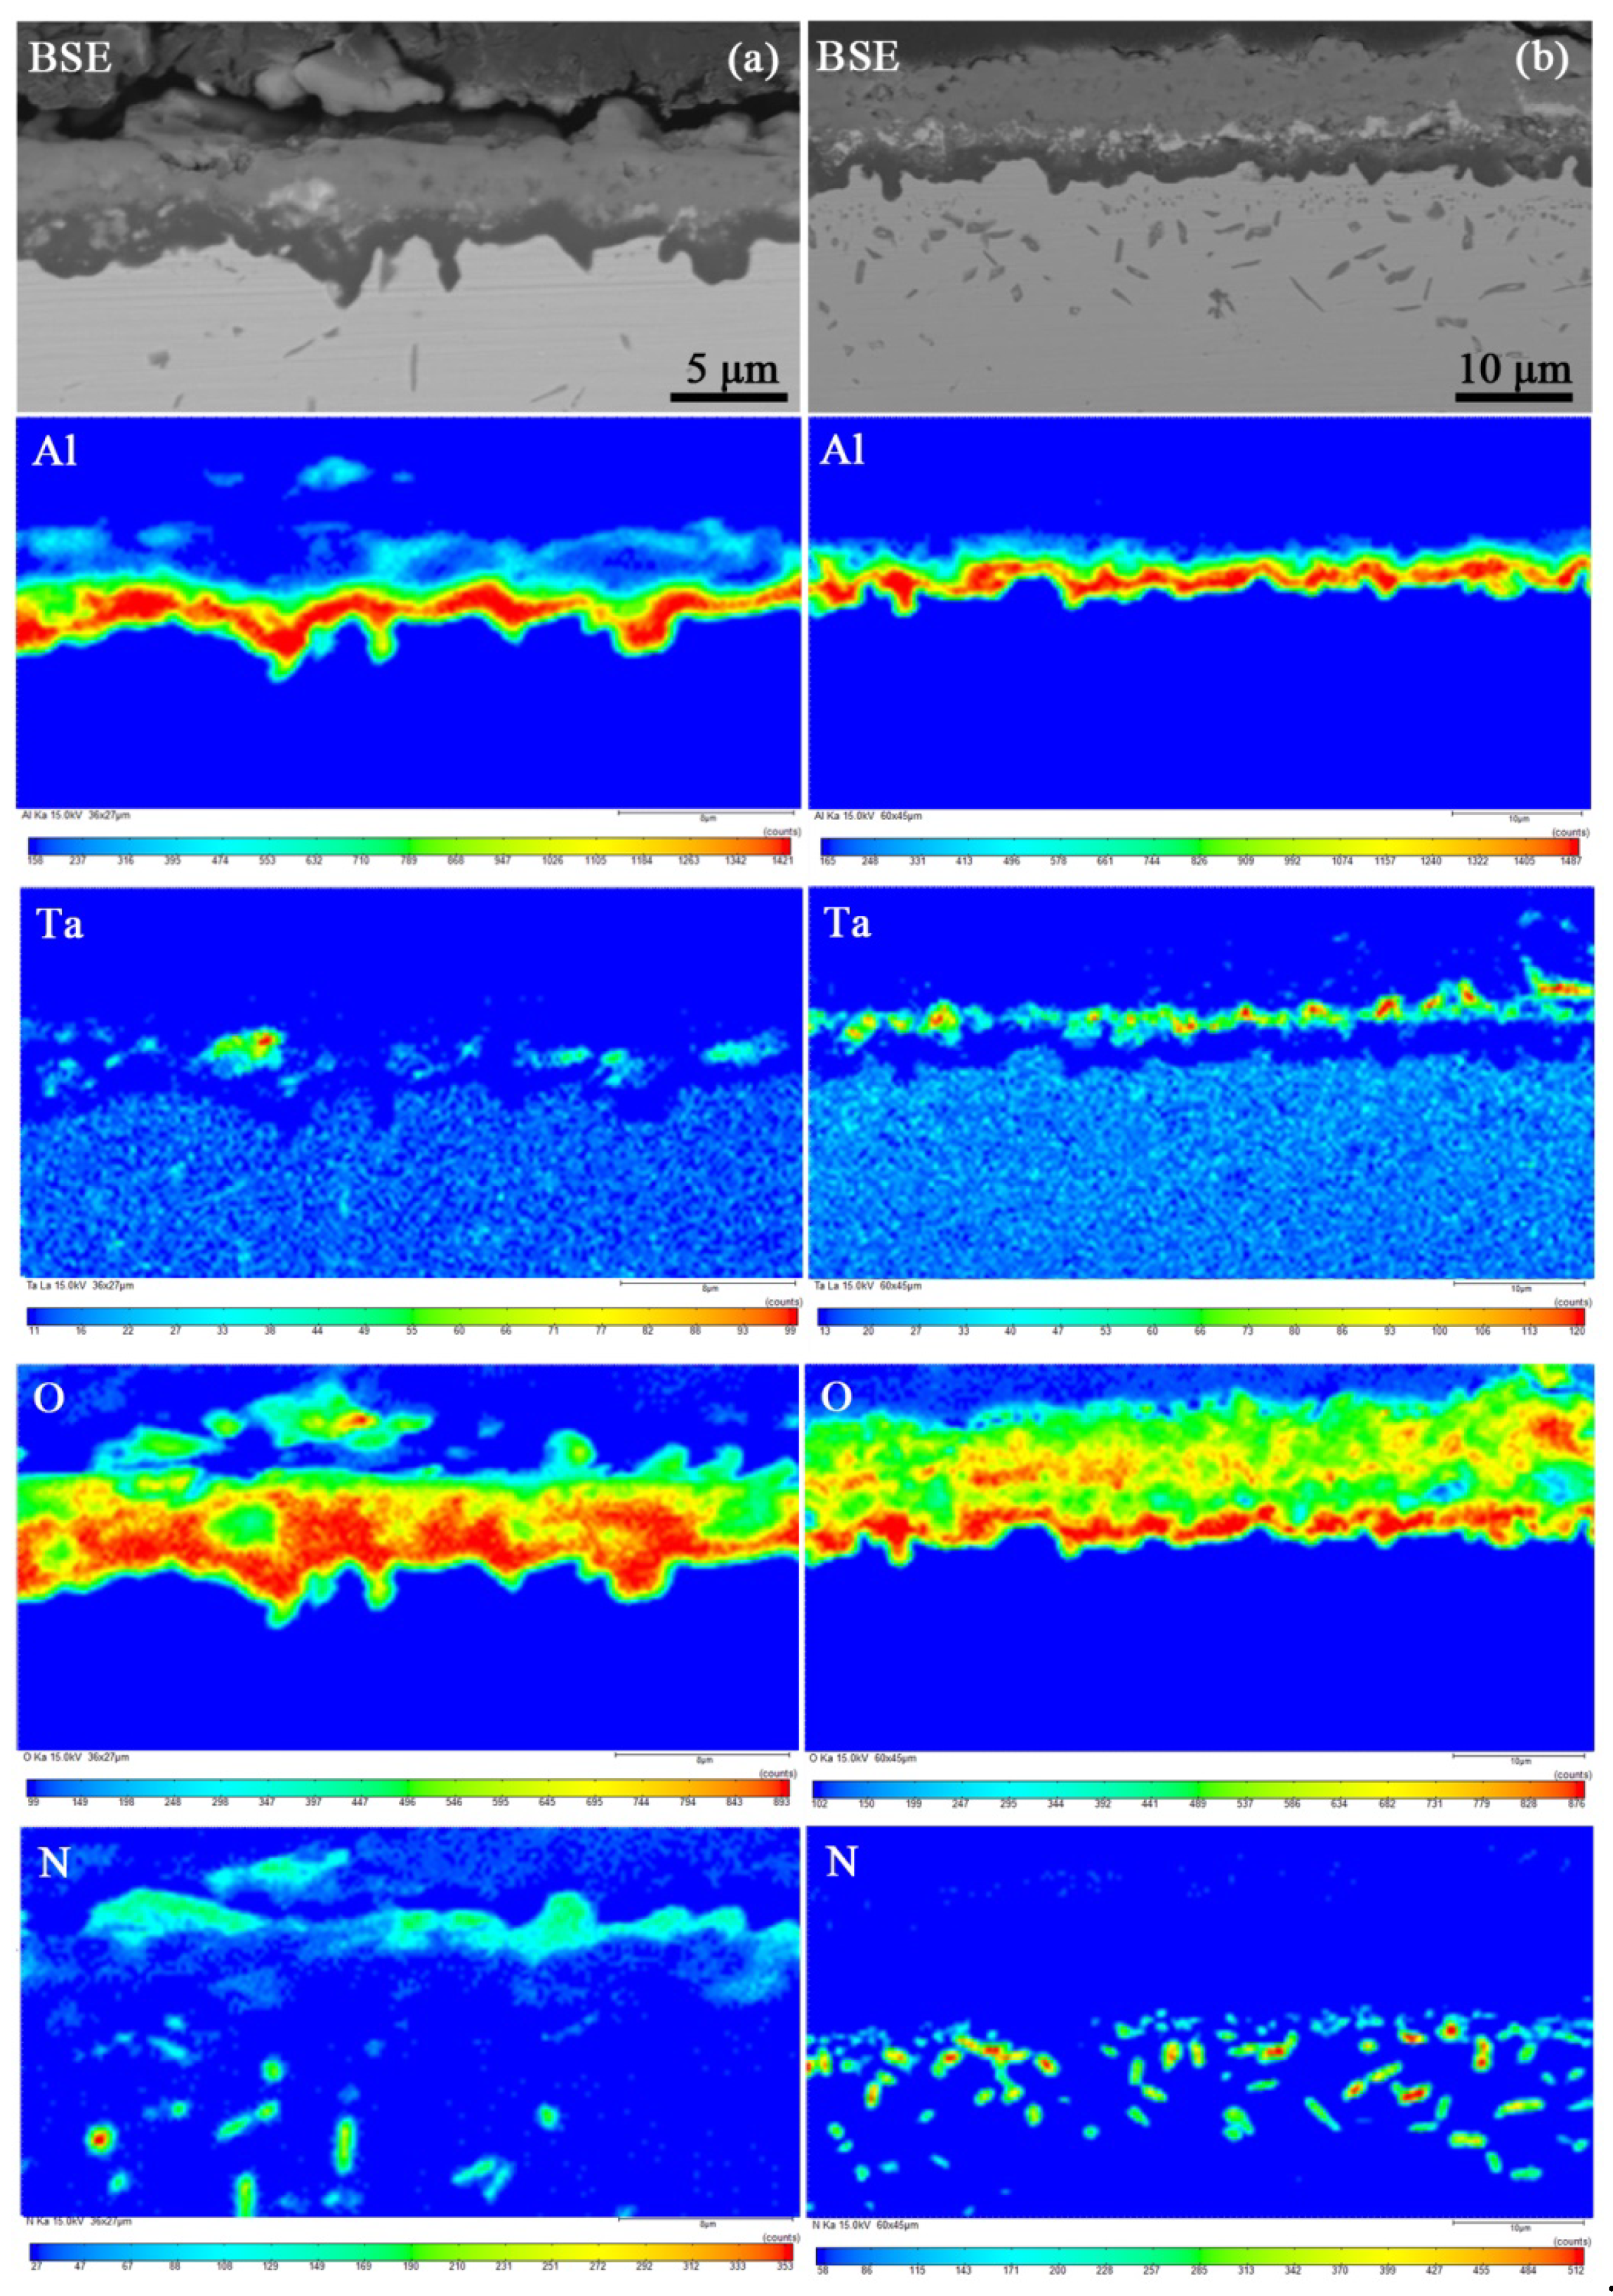
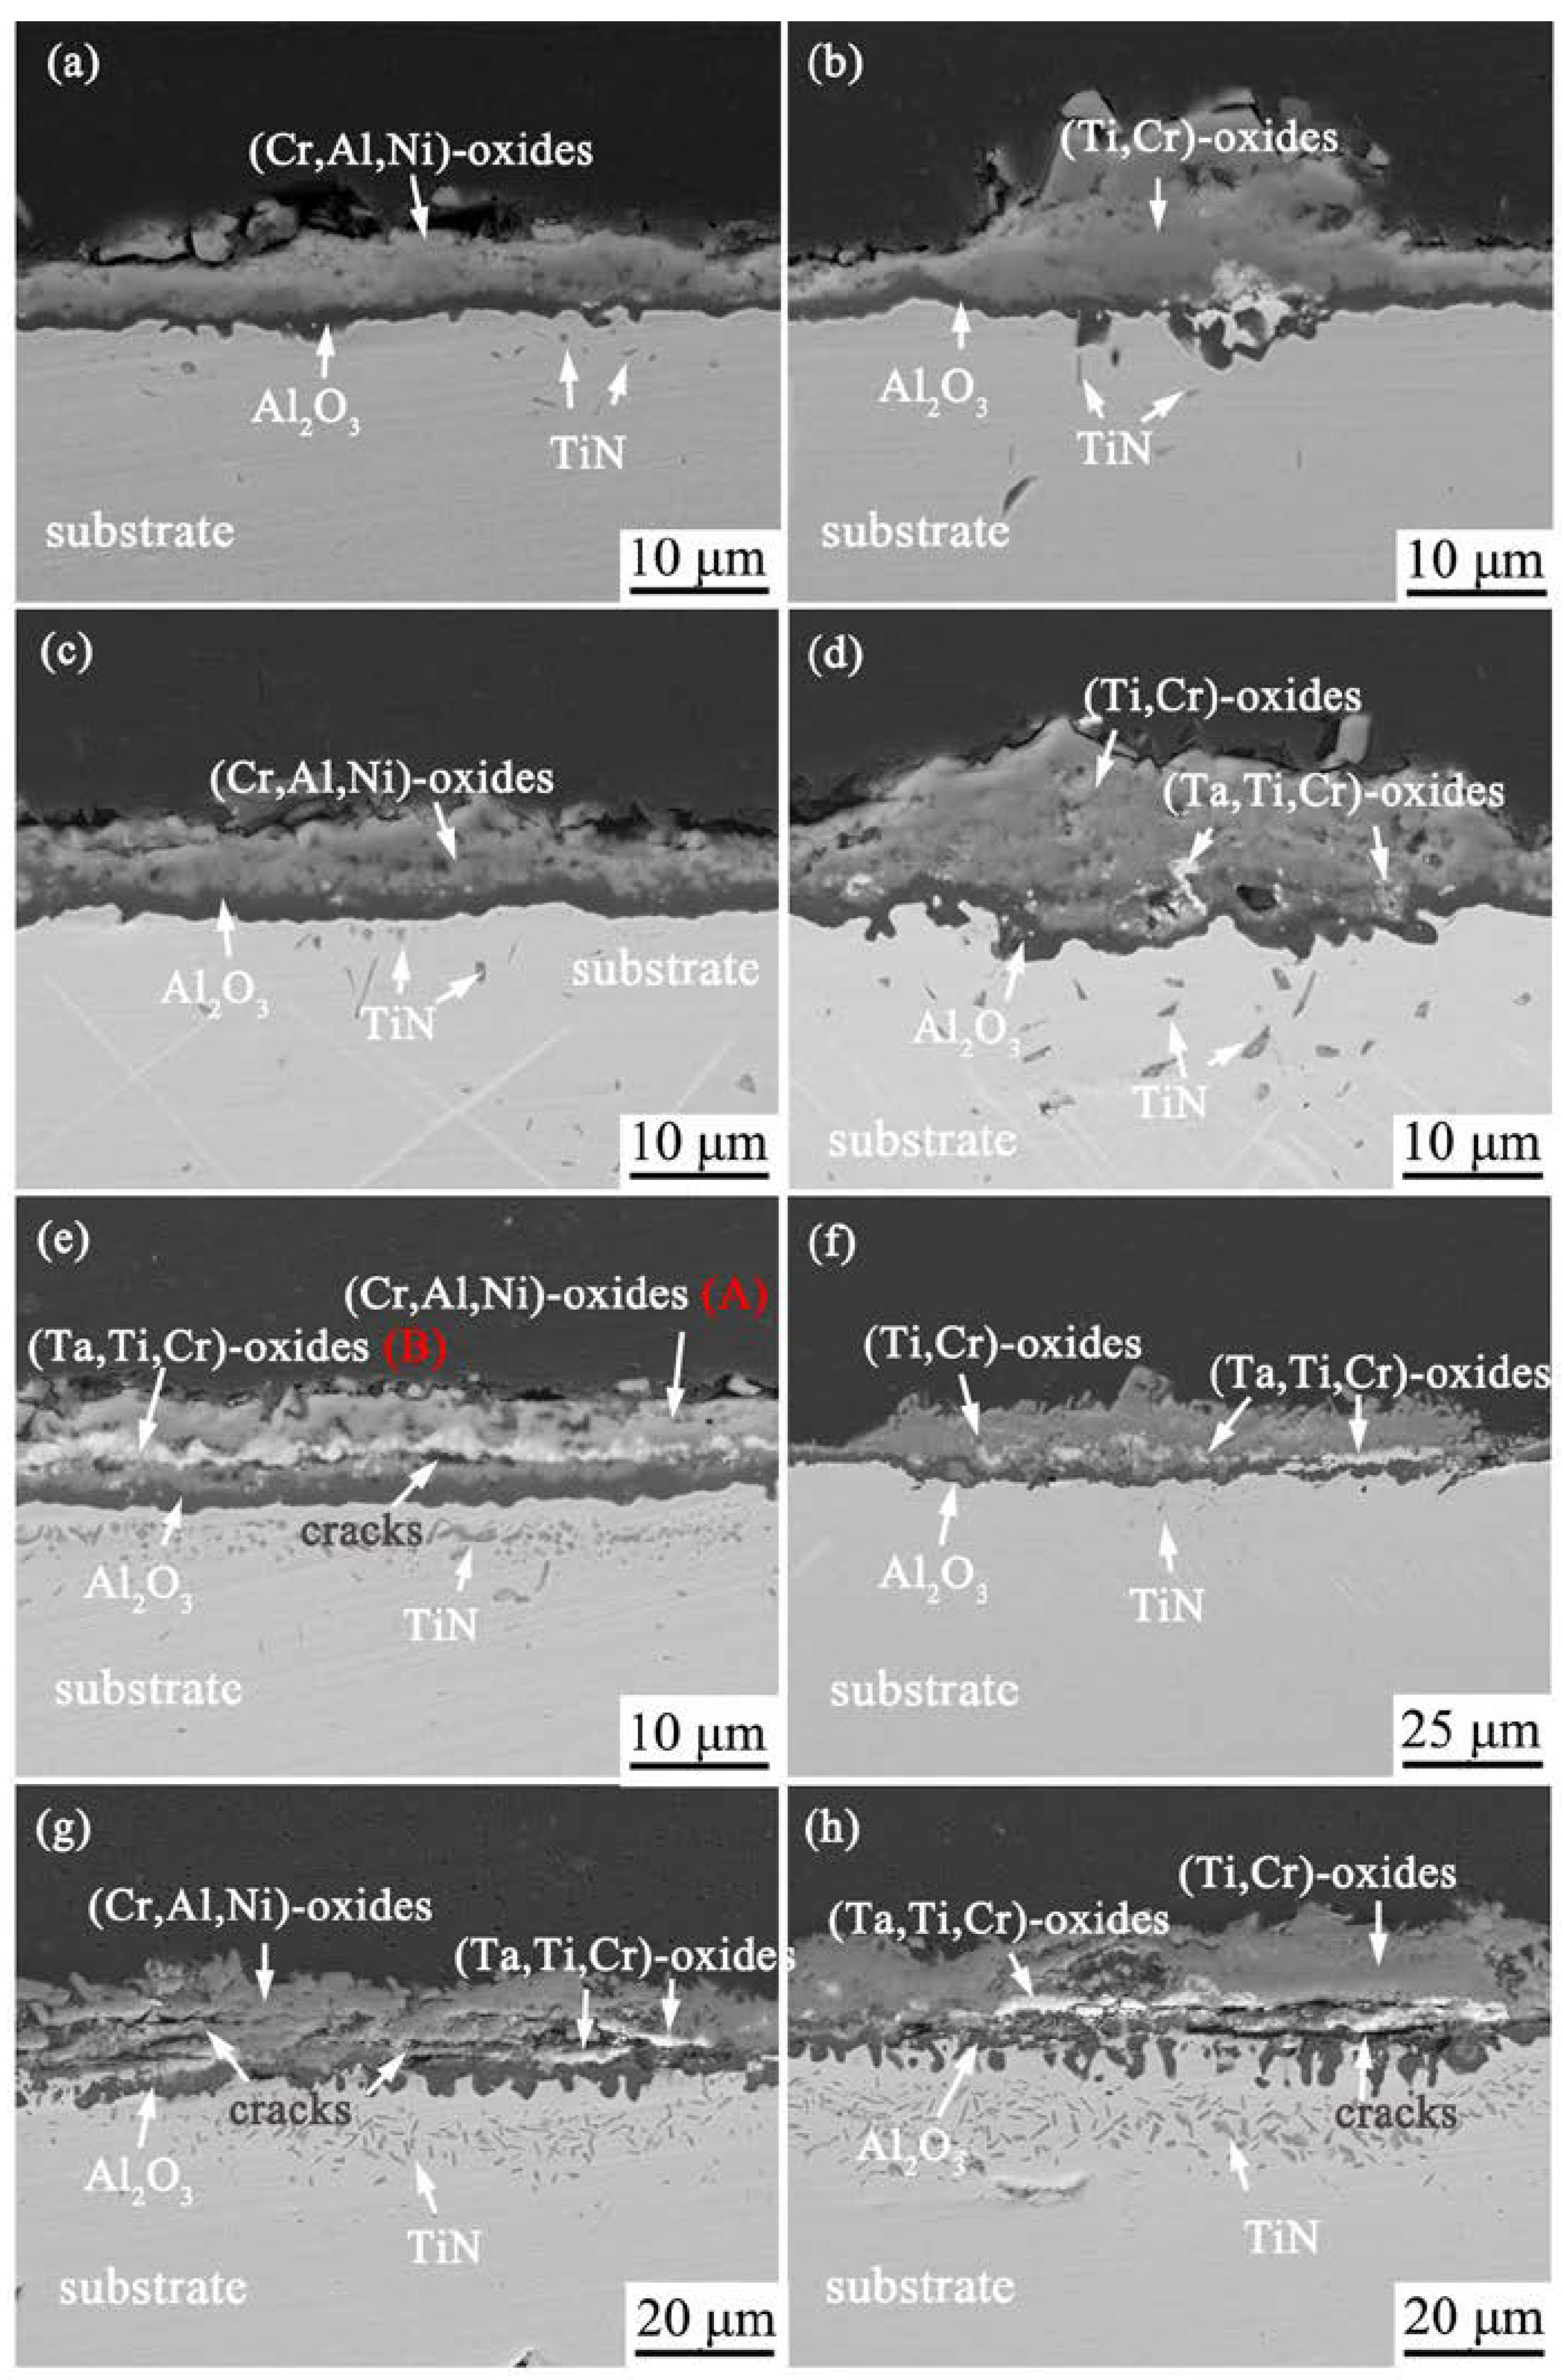
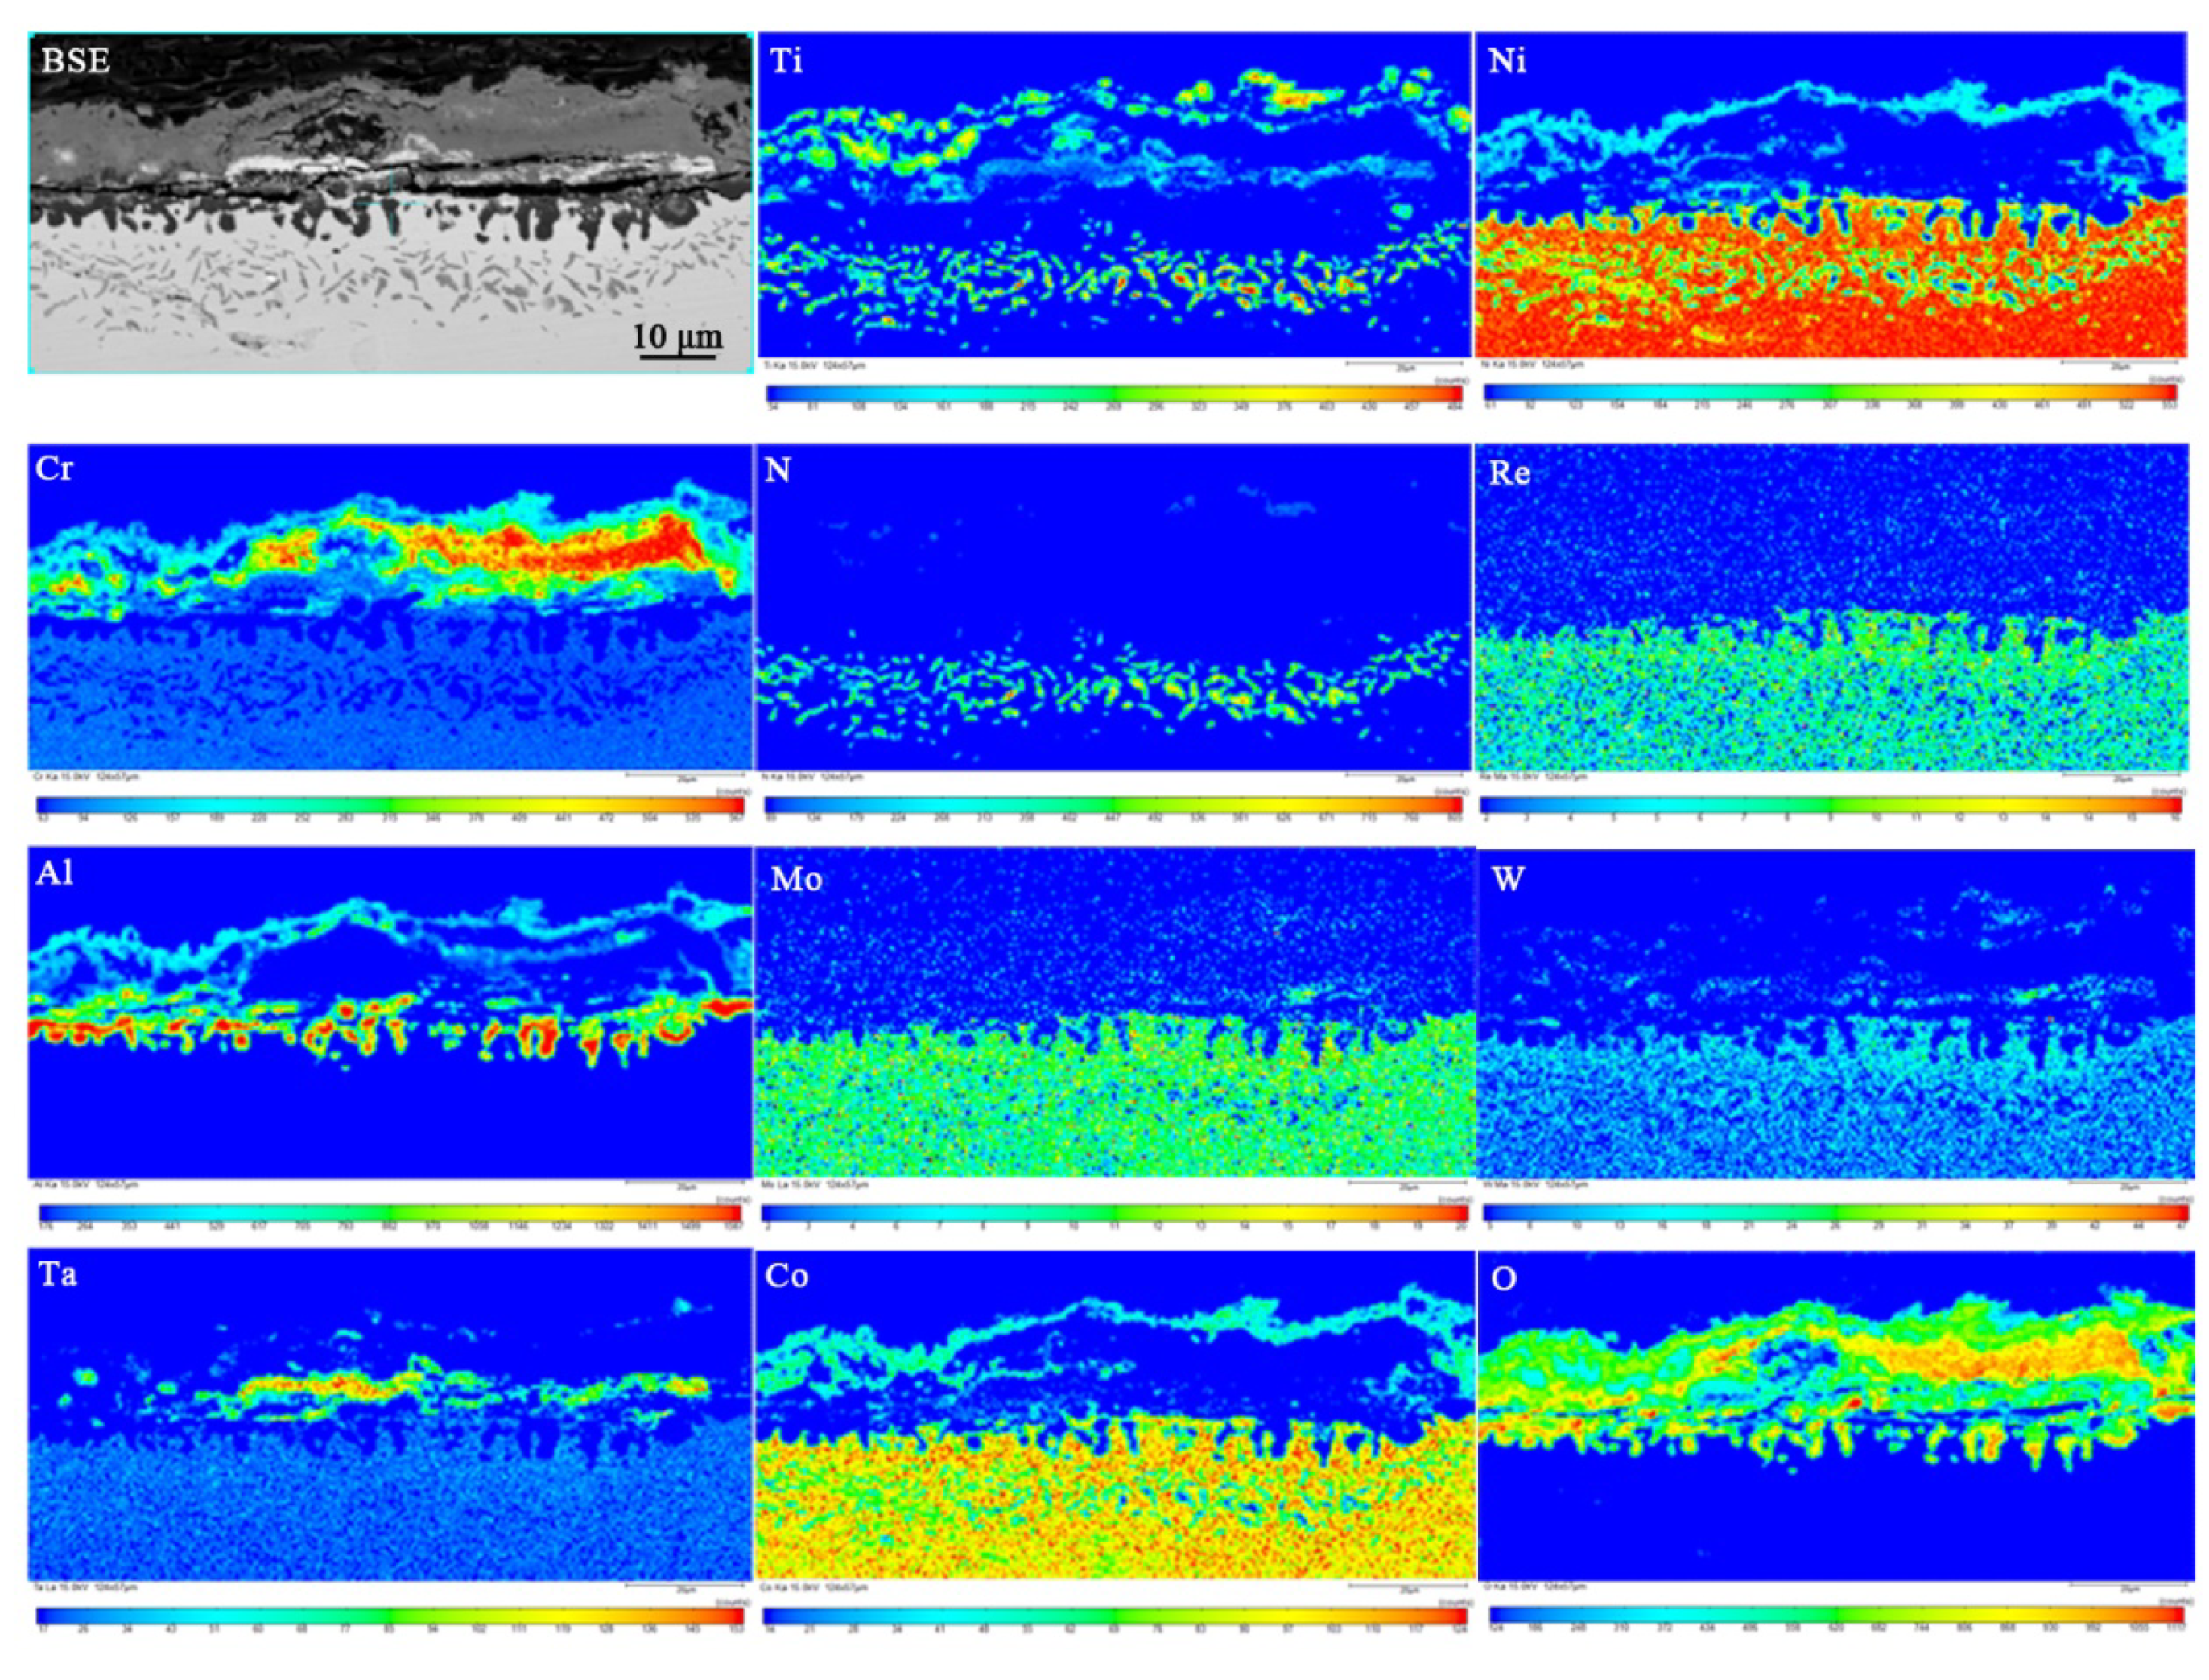
3.4. Surface and Cross-Section Morphology

After 4 h of oxidation, samples were analyzed to reveal the initial stages of the oxidation process. After 4 h of oxidation, all of the alloys revealed a similar microstructure. The representative cross-section microstructure and element distribution are shown in Figure 6 and Figure 7. A layer with a three-layer structure was formed. The outer layer was composed of mixed (Cr,Al,Co,Ni,Ti)-oxides. The middle layer was an Al2O3 layer. The inner layer was a nitride layer. The thickness of the scale was about 2 μm.
The surface morphologies of the experimental alloys after isothermal oxidation at 1000 °C are illustrated in Figure 8. Two types of regions with different morphologies and constituents were formed on the samples: one is the oxides cluster made up of small granular Ti-enriched oxides; the other is the plain oxides scale composed of fine oxides enriched in Al, Ti, Cr and Ni. The four alloys differed by the relative proportion of the two regions. After 100 h of oxidation, the surface morphologies of E7 (Figure 8a) and E73 (Figure 8e) were similar. The morphologies of E71 (Figure 8c) and E75 (Figure 8g) were alike. The amount of Ti-rich oxides on their surfaces was less than that of E7 and E73. The surface morphologies of E7, E71 and E73 alloys did not change significantly after 500 h of oxidation. For E75, however, spallation occurred, exposing the bare substrate.
Cross-section morphologies of the oxide scales formed on E7, E71, E73 and E75 alloys after oxidation at 1000 °C for 100 h are illustrated in Figure 9 and Figure 10. There are two types of regions in the cross-section: the raised surface region and the plain surface region, in correspondence with the two regions in Figure 8. For the E7 alloy oxidized for 100 h, the plain surface region consisted of three layers. The outer layer was a compact oxide layer enriched in Cr, Al and Ni. A small amount of white Ta-enriched oxides appeared in this layer. The inner layer was a continuous Al2O3 layer. In addition, small amounts of TiN particles were formed in the front of the oxidation layer (Figure 10a and Table 3). The raised surface region indicated the cross-section of the oxide clusters. The outer layer of this region was an oxide protrusion enriched in Ti and Cr. The inner layer was a smooth Al2O3 layer. Small amounts of TiN can be observed on the substrate. The scale morphologies of E71 were similar to that of E7. The main difference was that the amounts of Ta-enriched oxides and TiN were higher on E71 (Figure 9c). The amounts of Ta-enriched oxides and TiN in E73 increased further.
The cross-section morphology of E75 was significantly different from the other three alloys. Oxide clusters were almost invisible. In the plain surface region, an almost continuous Ta-enriched layer can be seen at the middle of the oxide layer, with a lot of holes dispersing between this layer and adjacent oxides. The Al2O3 layer was continuous, with a large number of needle-like TiN structures dispersed on the substrate (Figure 10b). While in the raised surface region, the Ta-enriched layer and Al2O3 layer are discontinuous. The amount of TiN increased further.
After 500 h oxidation (Figure 11), the composition and morphology of the oxide scale on the surface of E7 and E71 were almost unvaried. Cracks and large holes were formed on E75. The scale of E75 became porous and fragile. The EPMA results of the scale formed on E75 are illustrated in Figure 12. The Ta-enriched layer and Al2O3 layer are discontinuous. The scale on E73 at 500 h was similar to that of E75 at 100 h. A continuous Ta-rich layer was accompanied by the formation of a large number of porosities (Table 4). The number of TiN particles increased. The scale became thick and loose, with visible cracks and holes.

4. Discussion

4.1. Oxidation Process

As soon as the alloy was exposed to a high-temperature oxidation atmosphere, the surface of the alloy was oxidized. Alloying elements diffused outward to participate in the oxidation process and resulted in a thin initial oxide layer above the sample surface. At the same time, the inward diffusion of oxygen and nitrogen was also underway. Inner oxidation and nitrogenization took place simultaneously.
Cr2O3 layers and Al2O3 layers are effective protective outer scales formed on superalloys under the oxidation atmosphere [15]. Due to the moderate Cr and Al contents in the alloys, neither a complete outer Cr2O3 nor Al2O3 layer was formed after the initial transition period. Instead, a Cr2O3-dominant layer accompanied by mixed oxides of Ni, Co, Ti, Al and their spinel was formed on the sample surface [15]. Ti has a high affinity for oxygen and a high diffusion rate in the alloy [17]. Therefore, TiO2 was formed above the previously formed outer layer by outward diffusion of Ti.
Because of the establishment of an outer layer, the oxygen partial pressure at the interface of the outer layer and substrate was reduced. Consequently, the oxide that has the highest thermodynamic stability was formed here [15]. Thus, an inner Al2O3 layer was raised beneath the outer oxide layer. In the front of oxidation where the oxygen partial pressure was low, nitride was formed [18]. Since Al2O3 was extremely dense and the diffusion rate of ions passing through it was very low, it played an important role in hindering the inward diffusion of nitrogen/oxygen and the outward diffusion of alloying elements [18]. Thus, for samples that had complete and dense outer oxide layers and inner Al2O3 layers, small amounts of nitrides appeared. For samples that had incomplete layers, large amounts of nitrides were generated [18].
In the incubation period, all of the alloys underwent rapid oxidation and their masses changed rapidly. The slope of the kinetics curve was large. At the end of the incubation period, a stable three-layer oxide scale consisting of an outer Cr2O3-dominant layer, an inner Al2O3 layer and an inner nitride layer was formed on the sample. From then on, the inward or outward diffusion of ions was significantly retarded, and the samples’ masses changed slowly. Therefore, all alloys followed the logarithm law [19].

4.2. Interaction of Ta and Cr

During the oxidation process, the structure of the scale on E7, E71, E73 and E75 was similar. However, differences in microstructure and constituents exist. Ta-containing products were formed on all alloys, with the least on E7 and the most on E75. The Al2O3 layer on E7 and E71 was continuous, while that on the E73 and E75 alloys was discontinuous. The amount of TiN on the E7 and E71 alloy was much less than that on E73 and E75. Holes and cracks appeared on E73 and E75. According to the results, increasing Ta content has limited benefit for improving the oxidation performance. Excessive Ta content destroyed the compactness of the oxide scale and deteriorated the isothermal oxidation property. Based upon the previous research [10], it is believed that the influence of Ta on the oxidation performance was due to the competitive growth of Ta2O5 and Cr2O3.
As the oxidation proceeded, the structure and constituents of the scale were affected by thermodynamic factors, such as the thermodynamic stabilities of oxides, and kinetic factors, such as the concentration of elements and their diffusivities and mobilities [10]. The element which has the higher affinity for oxygen will be oxidized first. It is the most stable component during the whole process. However, the element with the highest concentration and diffusivities will be oxidized faster. The relevant oxides are the most abundant and were prone to deriving the corresponding spinels [20]. The constituents of the final scale were the result of the competitive growth of oxides.
The standard free energy of the formation of oxides is illustrated in Figure 13. As is revealed, the ΔG0 of Ta2O5 is more negative than that of Cr2O3. Ta2O5 was thermodynamically favored. In addition, the diffusivity and mobility of Ta were faster than Cr [17,21]. Thus, another kinetic factor, the concentration of the two elements, is an important factor in affecting the competitive growth of Ta2O5 and Cr2O3 and further affecting the scale composition and the corrosion behavior. In the initial hours of oxidation, a variety of oxides can form, while the final composition of the scale was determined by thermodynamic factors as well as kinetic factors.
Because of the content advantage of Cr over Ta in E7, the dominant oxide of the outer layer was Cr2O3. A small amount of Ta2O5 and Ta-containing spinels dispersed among the Cr2O3, playing the role of dopant. When Cr2O3 is doped with Ta2O5, higher valence Ta ions, Ta5+, will increase the concentration of cation vacancies in Cr2O3 scale and further accelerate the growth rate of Cr2O3 [10,22]:
3 Ta 2 O 5 = 6 Ta Cr . . + 15 O O + 4 V Cr
Cr2O3 is an effective protective oxide under high-temperature oxidation because it is compact and dense to suppress the inward diffusion of oxygen [23,24,25,26]. The improved proportion of Cr2O3 in the oxide scale reduced the oxygen partial pressure at the outer layer/substrate interface, which then accelerated the selective oxidation of Al [15]. Therefore, the Al2O3 layer in E7 is continuous and thick. Few internal nitrides were formed, even after 500 h of oxidation. Because of the superior protection of the scales formed in the incubation period, the sample was well protected afterwards. The rate of mass change was reduced to an extremely low level after 100 h. The schematic diagram of the oxidation mechanism of E7 is illustrated in Figure 14a.
For E71, the increase in the Ta/Cr value in the alloy enhanced the kinetic advantage of Ta. More Ta-containing spinel TiTaO4 (Table 3 “C”) was formed in E71. Spinel can reduce the diffusion rate of ions [27] and thereby improve the isothermal oxidation performance of the alloy. Small amounts of nitrides were formed. Thus, the rate of mass change was reduced to an extremely low level after 100 h. The oxidation mechanism of E71 can be described by the schematic diagram illustrated in Figure 14a.
The reduction in Cr and promotion of Ta in E73 and E75 narrowed the content difference between Ta and Cr, which reinforced the kinetic advantage of Ta. Competitive growth of Ta2O5 and Cr2O3 took place. The percentage of Cr2O3 in the outer layer was lowered. The reduction in Cr2O3 content retarded the selective oxidation of Al. Therefore, the Al2O3 layer in E73 and E75 was incomplete, and many more internal nitrides were produced. After long-term oxidation, the layers became loose and porous, with cracks and holes in them. The sample could not be protected by the scale. The rate of mass change remained high after 100h. The oxidation mechanism of E73 and E75 can be described by the schematic diagram illustrated in Figure 14b.

5. Conclusions

The isothermal oxidation behavior of a single crystal Ni-based superalloy with varying Ta/Cr ratio at 1000 °C was investigated. It was shown that excessive Ta content reduced the isothermal oxidation. Ta/Cr ratio affected the composition of the alloy oxide scale.
(1)
If Ta/Cr ≤ 0.5, Ta improved the growth rate of Cr2O3 and promoted the selective oxidation of Al. The oxidation resistance of the alloy was excellent. The mechanism was the doping effect induced by Ta cation.
(2)
If Ta/Cr > 0.5, Ta reduced the growth rate of Cr2O3 and suppressed the formation of Al2O3. The oxidation property of the alloy deteriorated. The mechanism was the competitive growth of Ta2O5 and Cr2O3.
(3)
A good oxidation performance can be expected with the value Ta/Cr ≤ 0.5.

Author Contributions

Conceptualization, D.W.; Data curation, W.F. and W.Z.; Funding acquisition, J.C. and J.D.; Investigation, J.C.; Methodology, J.C.; Resources, D.W.; Supervision, J.C. and D.W.; Writing—original draft, J.C.; Writing—review & editing, H.J., Y.L. and S.L. All authors have read and agreed to the published version of the manuscript.

Funding

This work was funded by the National Natural Science Foundation of China under grant No. 51901179, the National Science and Technology Major Project under grant No. 2017-VI-0019-0091 and the National Science Foundation of Shaanxi Province of China under grant No. 2018JQ5198.

Institutional Review Board Statement

Not applicable.

Informed Consent Statement

Not applicable.

Data Availability Statement

Not applicable.

Conflicts of Interest

The authors declare no conflict of interest.

References

  1. Oskarsson, H. Material challenges in industrial gas turbines. J. Iron Steel Res. Int. 2007, 14, 11–14. [Google Scholar] [CrossRef]
  2. Pettit, F.S.; Meier, G.H. Oxidation and hot corrosion of superalloys. In Superalloys 1984; TMS: Warrendale, PA, USA, 2012; pp. 651–687. [Google Scholar]
  3. Chang, J.X.; Wang, D.; Liu, T.; Zhang, G.; Lou, L.H.; Zhang, J. Role of tantalum in the hot corrosion of a Ni-base single crystal superalloy. Corros. Sci. 2015, 98, 585–591. [Google Scholar] [CrossRef]
  4. Bai, M.; Chen, Y.; Xiao, P. Investigations on the diffusion of platinum between CMSX-4 superalloy and platinum-enriched bond Coat. Coatings 2021, 11, 441. [Google Scholar] [CrossRef]
  5. Giamei, A.F.; Anton, D.L. Rhenium additions to a Ni-base superalloy—Effects on microstructure. Metall. Trans. A 1985, 16, 1997–2005. [Google Scholar] [CrossRef]
  6. Gurrappa, I.; Wilson, A.; Du, H.L.; Burnell-Gray, J.; Datta, P.K. Hot corrosion behavior of newly developed nickel based superalloy and comparison with other alloys. ECS Trans. 2008, 24, 105–115. [Google Scholar]
  7. Reed, R.C.; Moverare, J.J.; Sato, A.; Karlsson, F.; Hasselqvist, M. A new single crystal superalloy for power generation applications. In Superalloys 2012; TMS: Warrendale, PA, USA, 2012; pp. 197–204. [Google Scholar]
  8. Chang, J.X.; Wang, D.; Liu, X.G.; Lou, L.H.; Zhang, J. Effect of rhenium addition on hot corrosion resistance of Ni-based single crystal superalloys. Metall. Mater. Trans. A 2018, 4, 4343–4352. [Google Scholar] [CrossRef]
  9. Chang, J.X.; Wang, D.; Dong, J.S.; Wang, D.; Wu, H.C.; Zhang, G.; Lou, L.H. Effect of rhenium addition on isothermal oxidation behavior of a nickel-base single crystal superalloy. Chin. J. Mater. Res. 2017, 31, 695–702. [Google Scholar]
  10. Chang, J.X.; Wang, D.; Zhang, G.; Lou, L.H.; Zhang, J. Interaction of Ta and Cr on Type-I hot corrosion resistance of single crystal Ni-base superalloys. Corros. Sci. 2017, 117, 35–42. [Google Scholar] [CrossRef]
  11. Yang, S.W. Effect of Ti and Ta on the oxidation of a complex superalloy. Oxid. Met. 1981, 15, 375–397. [Google Scholar] [CrossRef]
  12. Barrett, C.A.; Miner, R.V.; Hull, D.R. The effects of Cr, Al, Ti, Mo, W, Ta and Cb on the cyclic oxidation behavior of cast Ni-base superalloys at 1100 and 1150 °C. Oxid. Met. 1983, 20, 255–278. [Google Scholar] [CrossRef]
  13. Wu, F.; Murakami, H.; Suzuki, A. Development of an iridium–tantalum modified aluminide coating as a diffusion barrier on nickel-base single crystal superalloy TMS-75. Surf. Coat. Technol. 2003, 168, 62–69. [Google Scholar] [CrossRef]
  14. Kuppusami, P.; Murakami, H. Effect of Ta on microstructure and phase distribution in cyclic oxidized Ir-Ta modified aluminide coatings on nickel base single crystal superalloy. Mater. Sci. Eng. A 2007, 452, 254–261. [Google Scholar] [CrossRef]
  15. Giggins, C.S.; Pettit, F.S. Oxidation of Ni-Cr-Al alloys between 1000 degrees and 1200 degrees C. J. Electrochem. Soc. 1971, 118, 1782–1790. [Google Scholar] [CrossRef]
  16. Li, Y.; Li, S.; Zhang, C.; Xu, N.; Bao, Z. Oxidation behavior and oxide transformation of a Pt-modified aluminide coating at moderate high temperature. Crystals 2021, 11, 972. [Google Scholar] [CrossRef]
  17. Campbell, C.E.; Boettinger, W.J.; Kattner, U.R. Development of a diffusion mobility database for Ni-base superalloys. Acta Mater. 2002, 50, 775–792. [Google Scholar] [CrossRef]
  18. Han, S.; Young, D.J. Simultaneous internal oxidation and nitridation of Ni-Cr-Al alloys. Oxid. Met. 2001, 55, 223–242. [Google Scholar] [CrossRef]
  19. Birks, N.; Meier, G.H.; Pettit, F.S. Introduce to the High-Temperature Oxidation of Metals, 2nd ed.; Cambridge University Press: Cambridge, UK, 2006; p. 16. [Google Scholar]
  20. Huang, L.; Sun, X.F.; Guan, H.R.; Hu, Z.Q. Oxidation behavior of the single-crystal Ni-base superalloy DD32 in Air at 900, 1000, and 1100 °C. Oxid. Met. 2006, 65, 391–408. [Google Scholar] [CrossRef]
  21. Pfennig, A.; Fedelich, B. Oxidation of single crystal PWA 1483 at 950 degrees C in flowing air. Corros. Sci. 2008, 50, 2484–2492. [Google Scholar] [CrossRef]
  22. Wagner, C.; Zimens, K.E. *Die oxydationsgeschwindigkeit von nickel bei kleinen zusatzen von chrom und mangan—Beitrag zur theorie des anlaufvorganges. Acta Chem. Scand. 1947, 1, 547–565. [Google Scholar] [CrossRef]
  23. Bornstein, N.S.; Decresce, M.A. Role of sodium in accelerated oxidation phenomenon termed sulfidation. Metall. Trans. 1971, 2, 2875–2883. [Google Scholar] [CrossRef]
  24. Bornstei, N.S.; Decresce, M.A.; Roth, H.A. Relationship between relative oxide ion content of Na2SO4, presence of liquid-metal oxides and sulfidation attack. Metall. Trans. 1973, 4, 1799–1810. [Google Scholar] [CrossRef]
  25. Goebel, J.A.; Pettit, F.S.; Goward, G.W. Mechanisms for the hot corrosion of nickel-base alloys. Metall. Trans. 1973, 4, 261–278. [Google Scholar] [CrossRef]
  26. Otsuka, N.; Rapp, R.A. Effects of chromate and vanadate anions on the hot corrosion of preoxidized Ni by a thin fused Na2SO4 film at 900-degreeS-C. J. Electrochem. Soc. 1990, 137, 53–60. [Google Scholar] [CrossRef]
  27. Han, F.F.; Chang, J.X.; Li, H.; Lou, L.H.; Zhang, J. Influence of Ta content on hot corrosion behaviour of a directionally solidified nickel base superalloy. J. Alloys Compd. 2015, 619, 102–108. [Google Scholar] [CrossRef]
Figure 1. SEM micrographs of the experimental alloys after standard heat treatment. (a,e): E7. (b,f): E71. (c,g): E73. (d,h): E75.
Crystals 11 01421 g001
Figure 2. Macroscopic morphologies of the E7, E71, E73 and E75 alloys after isothermal oxidation at 1000 °C. (a) E7—4 h. (b) E71—4 h. (c) E73—4 h. (d) E75—4 h. (e) E7—500 h. (f) E71—500 h. (g) E73—500 h. (h) E75—500 h.
Crystals 11 01421 g002
Figure 3. Oxidation kinetic curves of the E7, E71, E73 and E75 alloys after isothermal oxidation at 1000 °C.
Crystals 11 01421 g003
Figure 4. XRD patterns of samples exposed for 100 h at 1000 °C.
Crystals 11 01421 g004
Figure 5. XRD patterns of samples exposed for 500 h at 1000 °C.
Crystals 11 01421 g005
Figure 6. Cross-section morphologies of the oxide scale formed on the E7 alloy after oxidation at 1000 °C for 4 h.
Crystals 11 01421 g006
Figure 7. Secondary electron micrograph and corresponding X-ray micrograph of the E7 alloy after oxidation at 1000 °C for 4 h.
Crystals 11 01421 g007
Figure 8. Morphologies and EDS analyses of the oxide scales formed on E7, E71, E73 and E75 alloys after isothermal oxidation at 1000 °C. (a,c,e,g): E7, E71, E73 and E75 for 100 h, respectively. (b,d,f,h): E7, E71, E73 and E75 for 500 h, respectively.
Crystals 11 01421 g008
Figure 9. Cross-section morphologies of the oxide scales formed on the E7, E71, E73 and E75 alloys after oxidation at 1000 °C for 100 h. (a,c,e,g): Flat surface regions on the E7, E71, E73 and E75 alloys at 100 h, respectively. (b,d,f,h): Oxides clusters on the E7, E71, E73 and E75 alloys at 100 h, respectively. “A””B””C” represent the products at which it is labeled. The products information corresponding to “A””B””C” is listed in Table 3.
Crystals 11 01421 g009
Figure 10. Secondary electron micrograph and corresponding X-ray micrograph of the E7 (a) and E75 (b) alloys after oxidation at 1000 °C for 100 h.
Crystals 11 01421 g010
Figure 11. Cross-section morphologies of the oxide scales formed on the E7, E71, E73 and E75 alloys after oxidation at 1000 °C for 500 h. (a,c,e,g): Flat surface regions on the E7, E71, E73 and E75 alloys at 500 h, respectively. (b,d,f,h): Oxides clusters on the E7, E71, E73 and E75 alloys at 500 h, respectively. “A” and ”B” represent the products at which it is labeled. The products information corresponding to “A” and “B” is listed in Table 3.
Crystals 11 01421 g011
Figure 12. Secondary electron micrograph and the corresponding X-ray micrograph of the E75 alloy after oxidation at 1000 °C for 500 h.
Crystals 11 01421 g012
Figure 13. Standard free energy of formation of oxides. The diagram was plotted using data from HSC Chemistry® version 6.0.
Crystals 11 01421 g013
Figure 14. Schematic diagrams of the oxidation mechanisms of the alloys: (a) alloys with Ta/Cr ≤ 0.5; (b) alloys with Ta/Cr > 0.5.
Crystals 11 01421 g014
Table 1. Chemical compositions of the experimental alloys (wt. %).
AlloysCrTaReMoWTiAlCoCNiTa/Cr
E712.004.091.971.914.003.993.419.020.05Bal.0.34
E7112.006.152.031.934.013.943.399.040.04Bal.0.51
E739.846.042.042.013.993.943.309.010.04Bal.0.61
E759.896.872.001.033.823.963.468.940.06Bal.0.69
Table 2. XRD results of the E7, E71, E73 and E75 alloys after isothermal oxidation at 1000 °C.
TimeAlloysPhase Constituents
100 hE7TiO2, Co3O4, Al2O3, Cr2O3, γ + γ′
E71TiO2, Co3O4, Al2O3, Cr2O3, γ + γ′
E73TiO2, Co3O4, Al2O3, Cr2O3, NiAl2O4, γ + γ′
E75TiO2, NiAl2O4, (Ni,Co)Ta2O6, Cr2O3, (Ni,Co)O, γ + γ′
500 hE7TiO2, Co3O4, Cr2O3, Al2O3, NiCr2O4, γ + γ′
E71TiO2, Co3O4, Cr2O3, Al2O3, NiCr2O4, γ + γ′
E73TiO2, Co3O4, Cr2O3, γ + γ′
E75TiO2, NiAl2O4, (Ni,Co)Ta2O6, Cr2O3, (Ni,Co)O, γ + γ′
Table 3. EDS results of the regions “A”, “B” and “C” in Figure 9 (at. %).
AlCrTiNiTaO
A6.3128.263.591.07-60.76
B2.533.8723.220.36-69.45
C-1.1520.732.3613.1162.65
Table 4. EDS results of the regions “A” and “B” in Figure 11 (at. %).
AlCrTiNiTaCoO
A9.7119.635.223.85-0.6260.97
B-9.567.994.5411.940.6365.33
Publisher’s Note: MDPI stays neutral with regard to jurisdictional claims in published maps and institutional affiliations.

