Article

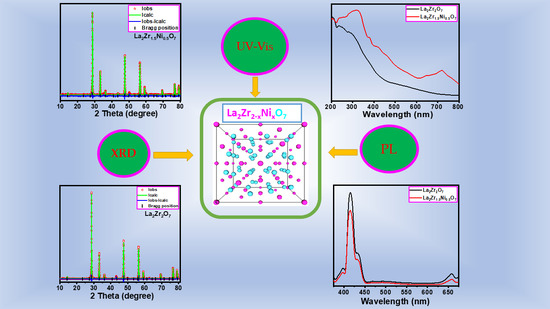
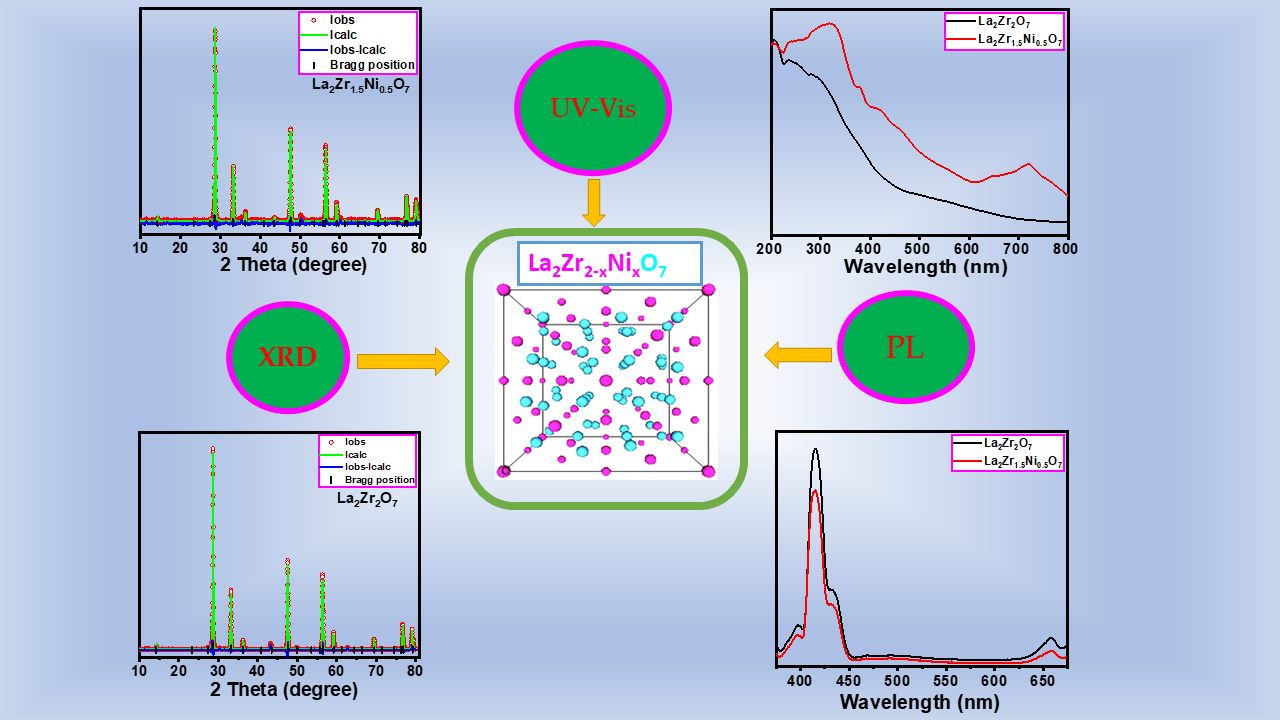
Effect of Preparation Method and Ni2+ Substitution on the Structural, Thermal, and Optical Properties of Nanocrystalline Lanthanum Zirconate Pyrochlore

1
Department of Chemistry, College of Science, King Saud University, P.O. Box 2454, Riyadh 11451, Saudi Arabia
2
Department of Zoology, College of Science, King Saud University, P.O. Box 2454, Riyadh 11451, Saudi Arabia
3
Central Laboratory, Department of Botany and Microbiology, College of Science, King Saud University, P.O. Box 2454, Riyadh 11451, Saudi Arabia
4
Central Laboratory, College of Science, King Saud University, P.O. Box 2454, Riyadh 11451, Saudi Arabia
*
Author to whom correspondence should be addressed.
Submission received: 18 October 2021 / Revised: 19 November 2021 / Accepted: 24 November 2021 / Published: 26 November 2021
(This article belongs to the Section Inorganic Crystalline Materials)

Abstract

:
In order to establish the effective application of materials in a particular area, it is important to first investigate the physical and chemical properties, such as the crystallinity, structure, and the optical and surface properties. The objective of the present study is to fabricate thermally stable pyrochlore oxides, namely, lanthanum zirconate (La2Zr2O7, LZ) and Ni-doped lanthanum zirconate (La2Zr1.5Ni0.5O7, LZN) by the solid-state and sol-gel methods. The effects of the preparation and substitution of Zr4+ by Ni2+ for the resulting nanocrystalline samples were characterized in terms of structure, purity, porosity, the thermal and optical properties, and photoluminescence by different techniques: XRD, FT-IR, BET, EDS, TG-DTG, UV-Vis-DRS, and PL. The XRD results confirm that the pyrochlores prepared via the sol-gel method (LZ-sg and LZN-sg) had a cubic unit-cell lattice, whereas the solid-state method (LZ-s and LZN-s) had impurities of the oxides. The XRD patterns, LZ-sg and LZN-sg, were further treated with the Rietveld technique. The textural measurements reveal that LZ-sg had a higher BET surface area compared to LZN-sg. In addition, the substitution of Zr4+ by the Ni2+ ion provides rational evidence for the improvement in the oxygen mobility, as well as the optical and photoluminescence properties through the lowering of the optical band energy and the electron–hole pairs.

Graphical Abstract

1. Introduction

Mixed metal oxides, such as pyrochlores, the derivatives of the fluorite structure, are the family of oxide materials with the general formula of A2B2O6O’, where A and B are the lanthanide and transition elements, respectively. For the perfect structure, the ratio of the ionic radius between A and B should be in the range of 1.4–1.6 [1,2]. Two kinds of oxygen are present in pyrochlore: The O’ anion connecting to the A (A2O’) site, and O anions linking to the A and/or B sites (BO6). Structurally, A2O’ is an arranged tetrahedral, and BO6 is an octahedral, onto which the A2O’ tetrahedral are connected by the corner-sharing BO6 octahedral. Generally, an ordered pyrochlore structure with an F d 3 ¯ m space group has two cations (16c and 16d) and two anion sites (8a and 48f) that can be tailored by the chemical composition, temperature, pressure, and so on [3,4,5].
A2B2O7 pyrochlores are typically inactive as bulk materials. However, because of their high structural and chemical flexibility, their inherent properties and defined structure can be tempered on both the A and B sites by substitution with other cations with different oxidation states and oxygen by other anions (e.g., S, P, F), which gives rise to various interesting changes in the thermal stability and the electronic and synergistic properties produced by the doping of a second metal [5,6,7,8,9]. Because of these changes, recently, pyrochlores have drawn great attention among researchers because of their multiple applications, such as for superconductivity, batteries, ferroelectricity, water spitting, photocatalysis, photoluminescence, as well as their laser, fuel cell, and magnetic capacities [8,10,11,12,13,14,15]. They have proven high-temperature stability in various applications, such as in gas-turbine thermal-barrier coatings and the endothermic dry reforming of the methane (DRM) reaction, and they near 1000 °C for syngas and H2 production [6,7,16,17]. Most of these nanostructures, such as Bi2Ti2O7, La2Ti2O7, and Ln2Zr2O7, have high-temperature piezoelectric properties since they have high curie points and superior thermal stability [18]. Sven Urban et al. [19] investigated the phase transformation of a pyrochlore from Ce2Zr2O7 to κ-Ce2Zr2O8 by the effect of temperature, which led to oxygen storage ability. They also observed that κ-Ce2Zr2O8 has more catalytic efficiency for the oxidation of carbon monoxide.
Several methods have been reported for the fabrication of a pyrochlore with specific features and a high efficiency for the particular application, which are directly associated with its purity, morphology, crystal size, and degree of crystallinity. Therefore, many researchers are focused on the fabrication and design of pyrochlores by the modification of the abovementioned factors. Among the pyrochlores, lanthanide zirconates (LnZr2O7) are the multifunctional class of materials that have been applied in diverse fields, such as thermal-protective-coating materials, diesel engines, as catalysts, in nuclear waste disposal, and so on [6,7,8,9,10,11,12,13,14,15,16,17,18,19]. They have been synthesized by solid-state, combustion, hydrothermal, electrolysis, the Pechini process, thermal-impedance, evaporation-induced self-assembly methods, and so on [20,21,22,23,24,25,26]. F. X. Zhang et al. [5] fabricated uranium-doped gadolinium zirconates by a high-temperature wet chemical method and investigated the structural, as well as the bonding environmental changes under the pressure range ambient of 40 GPa. James J. Spivey et al. [6,7] prepared face-centered cubic Rh-, Sr-, Ni-, and Ca-substituted lanthanum zirconate by a modified Pechini process and utilized it for the syngas production by DRM. Sven Urban et al. [19] fabricated single-phase Ce2Zr2O7, prepared by the conventional solid-state method. Saradhi et al. [27] prepared the nanocrystalline, Eu2Zr2O7, by the coprecipitation method in the presence of dilute NH4OH as the precipitator. Among the various rare-earth zirconates, La2Zr2O7 has drawn considerable attention because of its overwhelming properties, such as its high coercivity, ionic conductivity, and band energy, along with good mechanical hardness and chemical stability, and reliable preparation and crystallinity [21,22,23]. Zhang et al. [28] utilized glycine fuel and applied a combustion procedure to prepare Ni/Ln2Zr2O7 (Ln = La, Pr, Sm, and Y) as catalysts. Saitzek et al. [29] prepared thin films of La2Zr2O7 through a sol-gel procedure.
In the present work, La2Zr2O7 and Ni were substituted at the B site, and La2Zr1.5Ni0.5O7 pyrochlores were synthesized by two different techniques and were characterized by a number of techniques. The optical, textural, and structural aspects of the synthesized materials were explored using Fourier transform infrared UV–Visible absorption spectroscopy, photoluminescence, powder X-ray diffraction analysis, and the BET surface area, respectively.
The purpose of the addition of the Ni metal into the pristine La2Zr2O7 was our plan to utilize it for the syngas (H2 + CO) production by DRM processes, the more economical and widely used method for obtaining this energetic gas because the selection of nickel, compared to noble metals, in this particular field, is preferable because of its inherent availability, low cost, and high activity.

2. Experimental Section

2.1. Synthesis of Pyrochlores (La2Zr2-xNixO7)

(a)
Solid-State Method
Pyrochlore oxides, with the composition, La2Zr2-xNixO7 (x = 0.0 (LZ-s) and 0.5 (LZN-s)), were synthesized by the conventional mixed metal oxide process. Stoichiometric quantities of lanthanum oxide, zirconium dioxide, and nickel oxide (all Sigma Aldrich, St. Louis, MO, USA; purity, 99.9%) were properly mixed in acetone, followed by manual grinding for more than 30 min in a crucible. The obtained slurry was washed with deionized water and dried in an oven at 300 °C for 72 h and was then transferred to a furnace where it was heated to 1200 °C, at a rate of 5 °C min−1 for 6 h, followed by cooling in the furnace at 20 °C min−1.
(b)
Sol-Gel Auto-Combustion Method
The precursors used for La, Ni, and Zr were lanthanum nitrate [La(NO3)3·6H2O], nickel nitrate [Ni(NO3)2·6H2O], and zirconyl nitrate [ZrO(NO3)2·nH2O], respectively. The metal nitrate salts were separately dissolved in a mixture of deionized water + methanol and were then mixed with a citric acid solution in a molar ratio of citric acid:metal = 1.5:1. Then, 1 M of ammonia solution was added dropwise until the pH = 9. The obtained mixture was refluxed for 3 h at 90 °C for the formation of the metal complex. After that, the solution was transferred to a flask and heated on the hotplate until a viscous gel was obtained. The resultant gel was left to dry for 72 h in an oven at 300 °C; the gel turns into a fluffy mass and, eventually, into hard flakes. The mixture was then calcined at 1200 °C for 6 h to oxidize the organic precursors and form the pyrochlore. Pyrochlore oxides with the compositions, La2Zr2O7 and La2Zr1.5Ni0.5O7, are abbreviated as LZ-sg and LZN-sg, respectively.

2.2. Characterization

Simultaneous thermogravimetric analysis (TG-DTG) was carried out in order to find the thermal stability in the temperature range of 35–1000 °C, with a heating rate of 10 °C min−1, using a TGA/DSC analyzer (Mettler-Toledo TGA/SDTA851e thermal analyzer, Schwerzenbach, Switzerland) in an oxidative environment. X-ray diffraction (XRD) studies of the powder samples were performed on a Bruker/Siemens D5000 system (Columbia, SC, USA) fitted with a scintillation detector. The analysis was performed from 10° to 90°, with a step size of 0.020 °/min. The ceramic tube, with CuK radiation (λ = 1.54 Å), was set up to operate at a voltage of 40 kV and 30 mA current. HighScore Plus (HSP, Almelo, The Netherlands) software was used to identify the diffraction peaks. The chemical composition and purity were examined on a Bruker Tensor 27, (Karlsruhe, Germany) by Fourier transform infrared (FT-IR) spectroscopy, using KBr as a reference in the range of 400–4000 cm−1. The BET surface area, pore volume, and the pore size distribution were measured, using a Micromeritics apparatus (Gemini VII 2390 V1.03, Norcross, GA, USA), by adsorbing N2 at its liquefaction temperature of 77 K. Prior to the N2 adsorption–desorption process, the samples were degassed at 350 °C for 4 h. About 0.5 gm of the sample was used for each run. The optical absorption properties in DRS mode were recorded on a UV-Vis-NIR spectrophotometer (Jasco 770, Easton, Salt Lake City, TA, USA), equipped with an integrating sphere to record the diffuse reflectance spectra of the samples, and BaSO4 was used as a reference. The photoluminescence properties were studied using a Perkin Elmer (LS 55, Waltham, MA, USA) fluorescence spectrophotometer, at the different excitation wavelengths of 350 and 400 nm. The conditions were fixed in order to compare the PL intensities. The elemental analysis was performed using energy dispersive spectroscopy (EDS, JEOL, Benelux, The Netherlands).

3. Results and Discussion
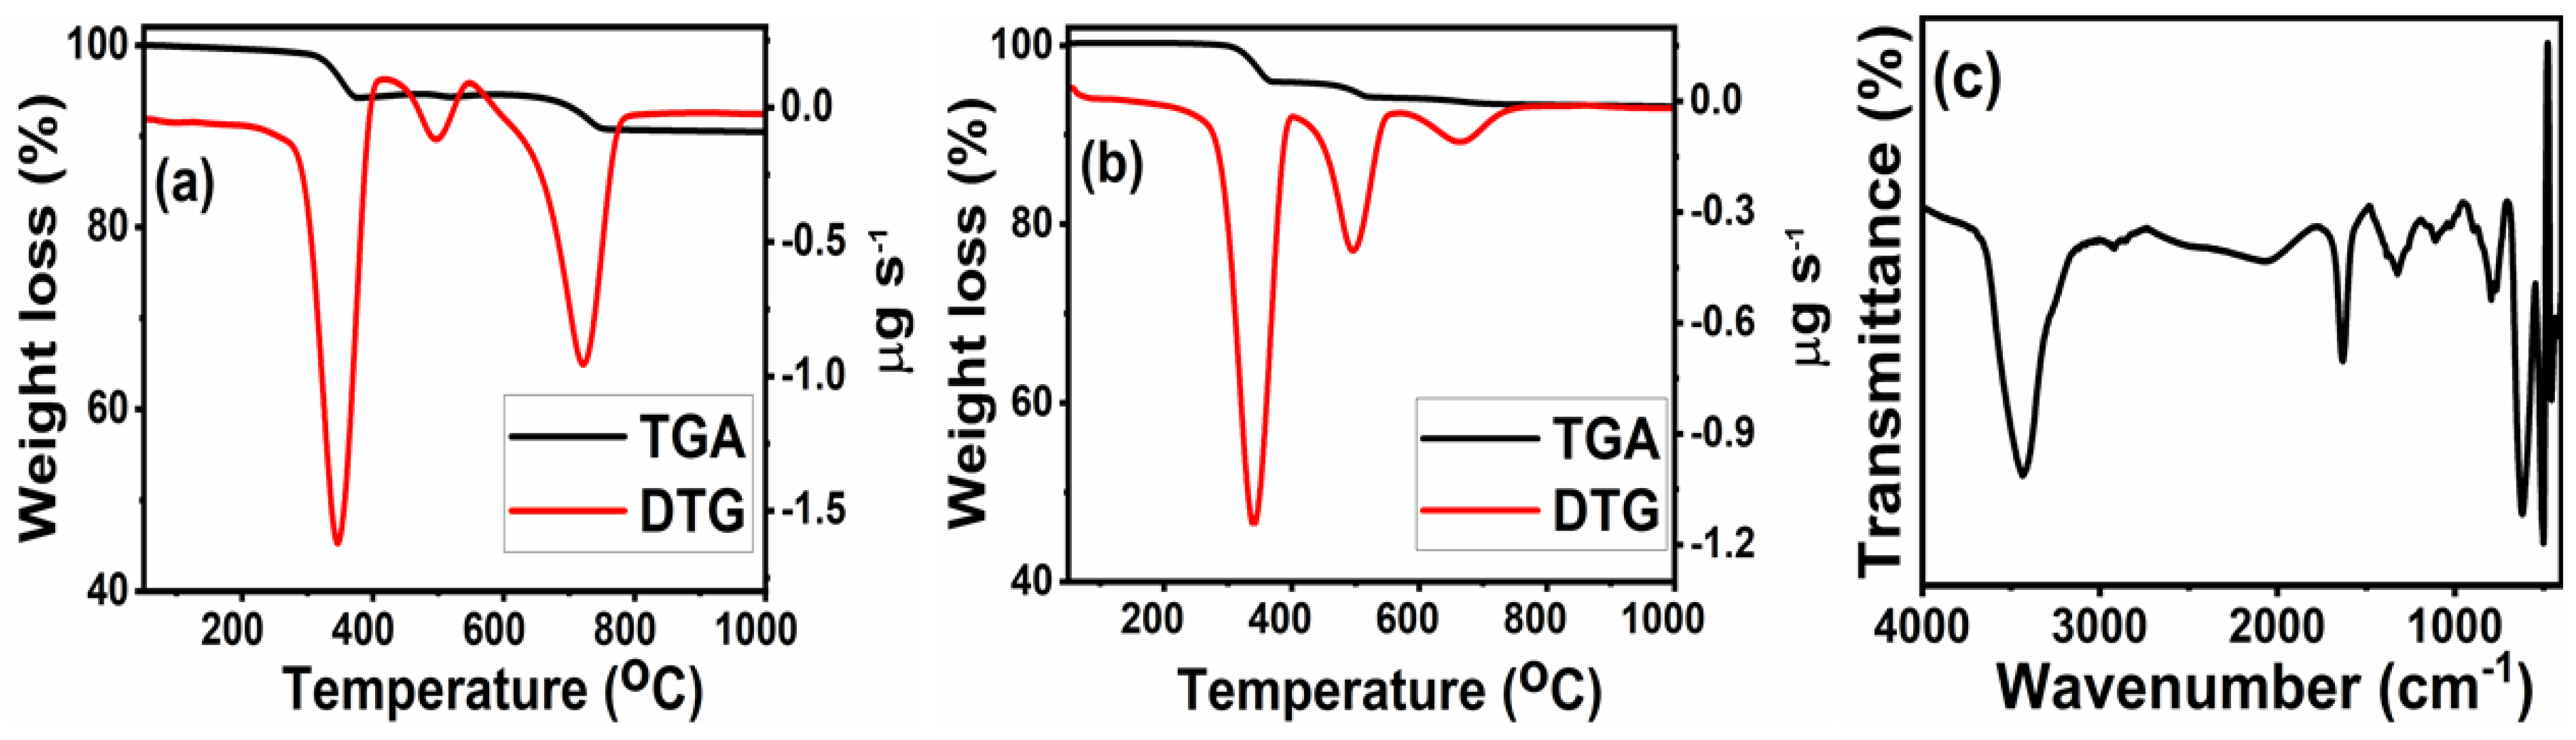
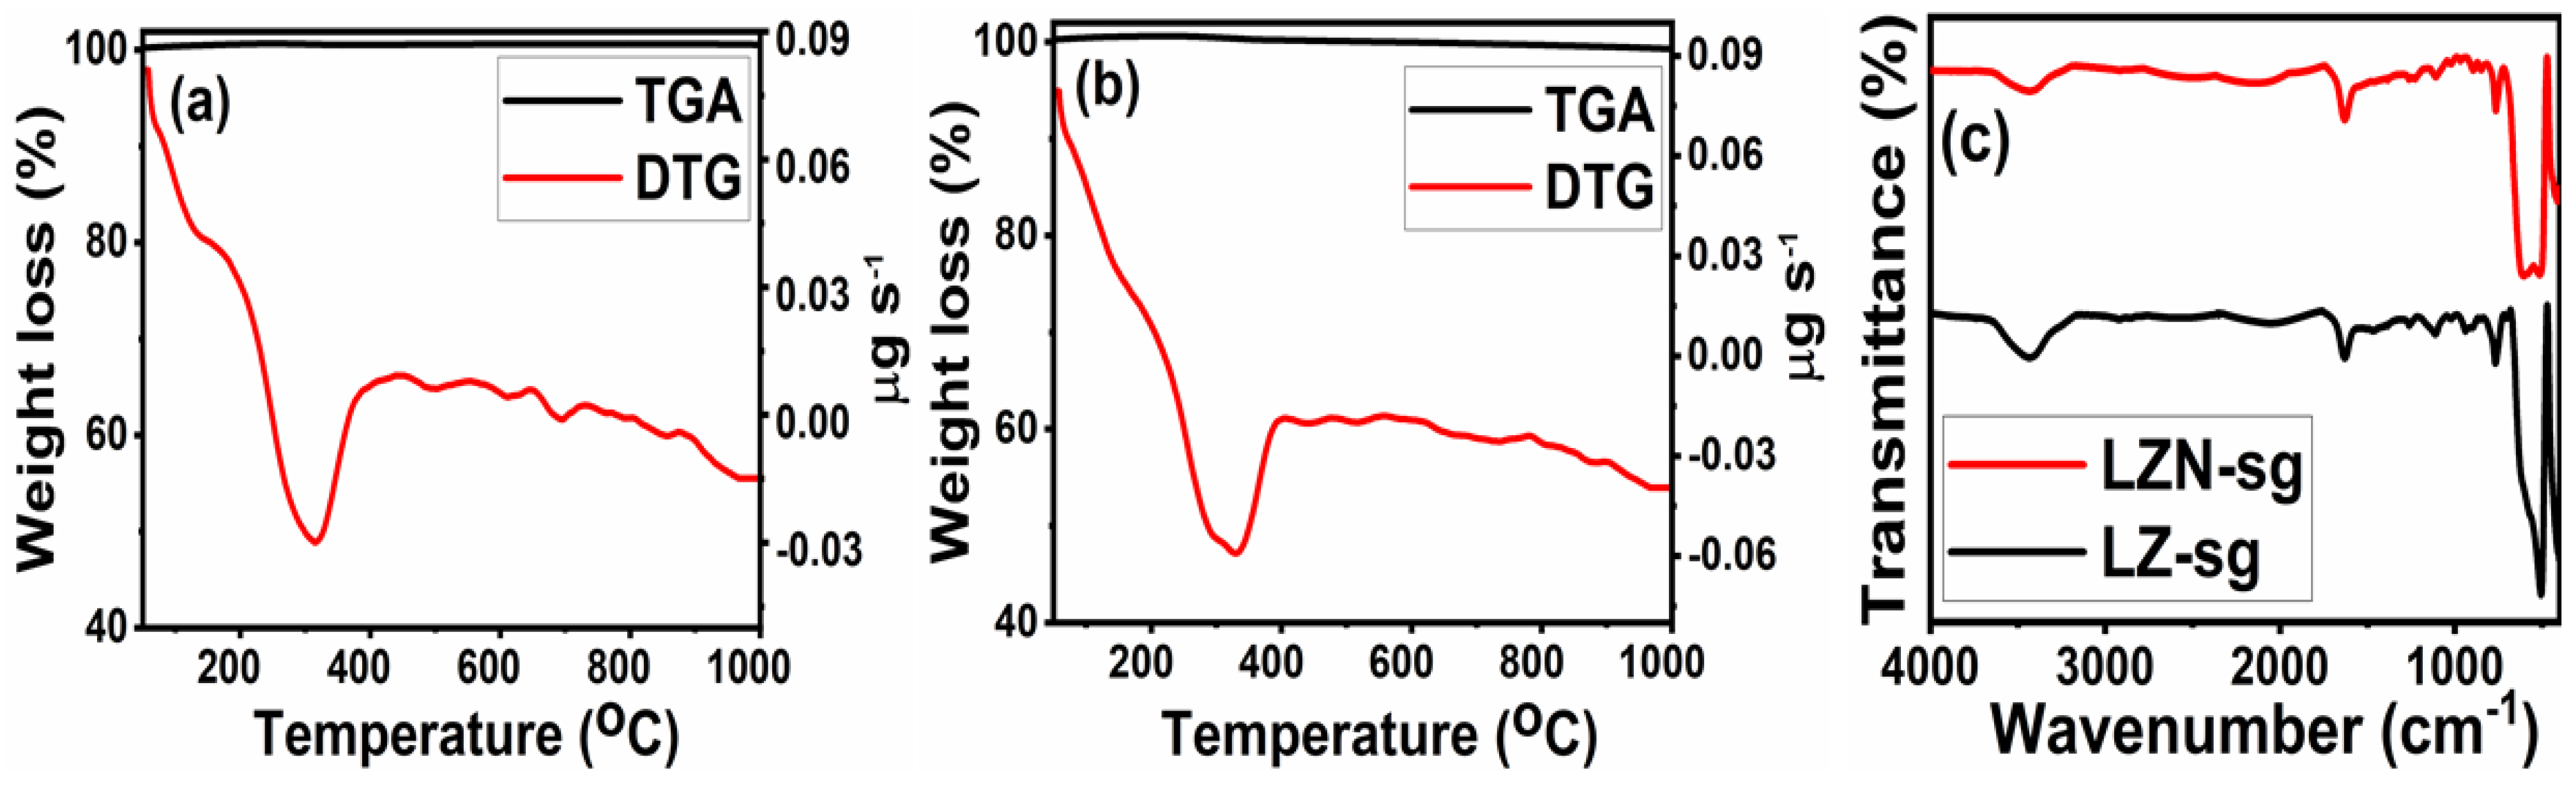
3.1. Thermal Study

To study the thermal degradation behavior of the synthesized samples, TG-DTG profiles were recorded in the temperature range of 35–1000 °C. The TG-DTG curves of the samples, prepared by the solid-state and sol-gel methods, are shown in Figure 1 and Figure 2, along with the IR spectra after the TGA-DTG analysis. It can be seen that the sol-gel samples possess excellent thermal stability and high purity. The samples prepared by the solid-state method show more weight loss compared to those prepared by the sol-gel method. From Figure 1a,b, it can be discerned that the samples prepared by the solid-state method show three decompositions, confirmed by the DTG peaks, and a final weight loss (up to a temperature of 1000 °C) in the range of 8–10%. The rapid first weight loss below 350 °C can be attributed to the desorption of the physisorbed water and to the decomposition of the untreated additives in the powder samples [30,31]. The maximum weight loss in the observed temperature range was about 6–8%. The second weight loss (about 0.4–0.6%) occurring between 350 and 500 °C, can be attributed to the loss of lattice oxygen species. Above 500 °C, there was about 2–3% decomposition. Compared to the LZN-s, the LZ-s show more weight loss, confirming that the Ni-containing oxide is more stable because of the close packing of atoms. The multistep decomposition, and the higher amount of weight loss of the calcined samples, reflect the presence of impurities along with the pyrochlore oxides. The impurities were confirmed by the IR spectrum of the LZN-s, after TGA-DTG analysis, shown in Figure 1c. The IR data show the bands of the Zr, La, and Ni oxides. In order to better confirm the above presumption, they were measured by XRD patterns, shown in Figure 3a and discussed in the Section 3.2.
The samples prepared by the sol-gel method displayed different thermal performances compared to the samples fabricated by the solid-state route, as displayed in Figure 2. It was observed that TG-DTG shows similar profiles for LZ-sg and LZN-sg, respectively, and they are recognized by a single step of decomposition at 315 °C and 325 °C, respectively. The LZN-sg show a higher maximum degradation as compared to the LZ-sg. After that, a slight and continuous weight loss was observed up to 1000 °C. No further degradation distinctly demonstrated that the thermal stability of the samples in this wide range of temperatures confirmed the formation of pure oxides. Furthermore, the purity of the residue materials after thermal analysis was confirmed from the IR spectra, depicted in Figure 2c. It can clearly be seen that there is more similarity between the IR spectra of the used TGA samples and the fresh calcined samples. Thus, the TG-DTG curves strongly support that the proposed molecular formula, La2Zr2-xNixO7, was reasonable. These observations are also comparable to the results obtained from the XRD patterns of the calcined samples (Figure 3b), which confirm the crystalline phase.

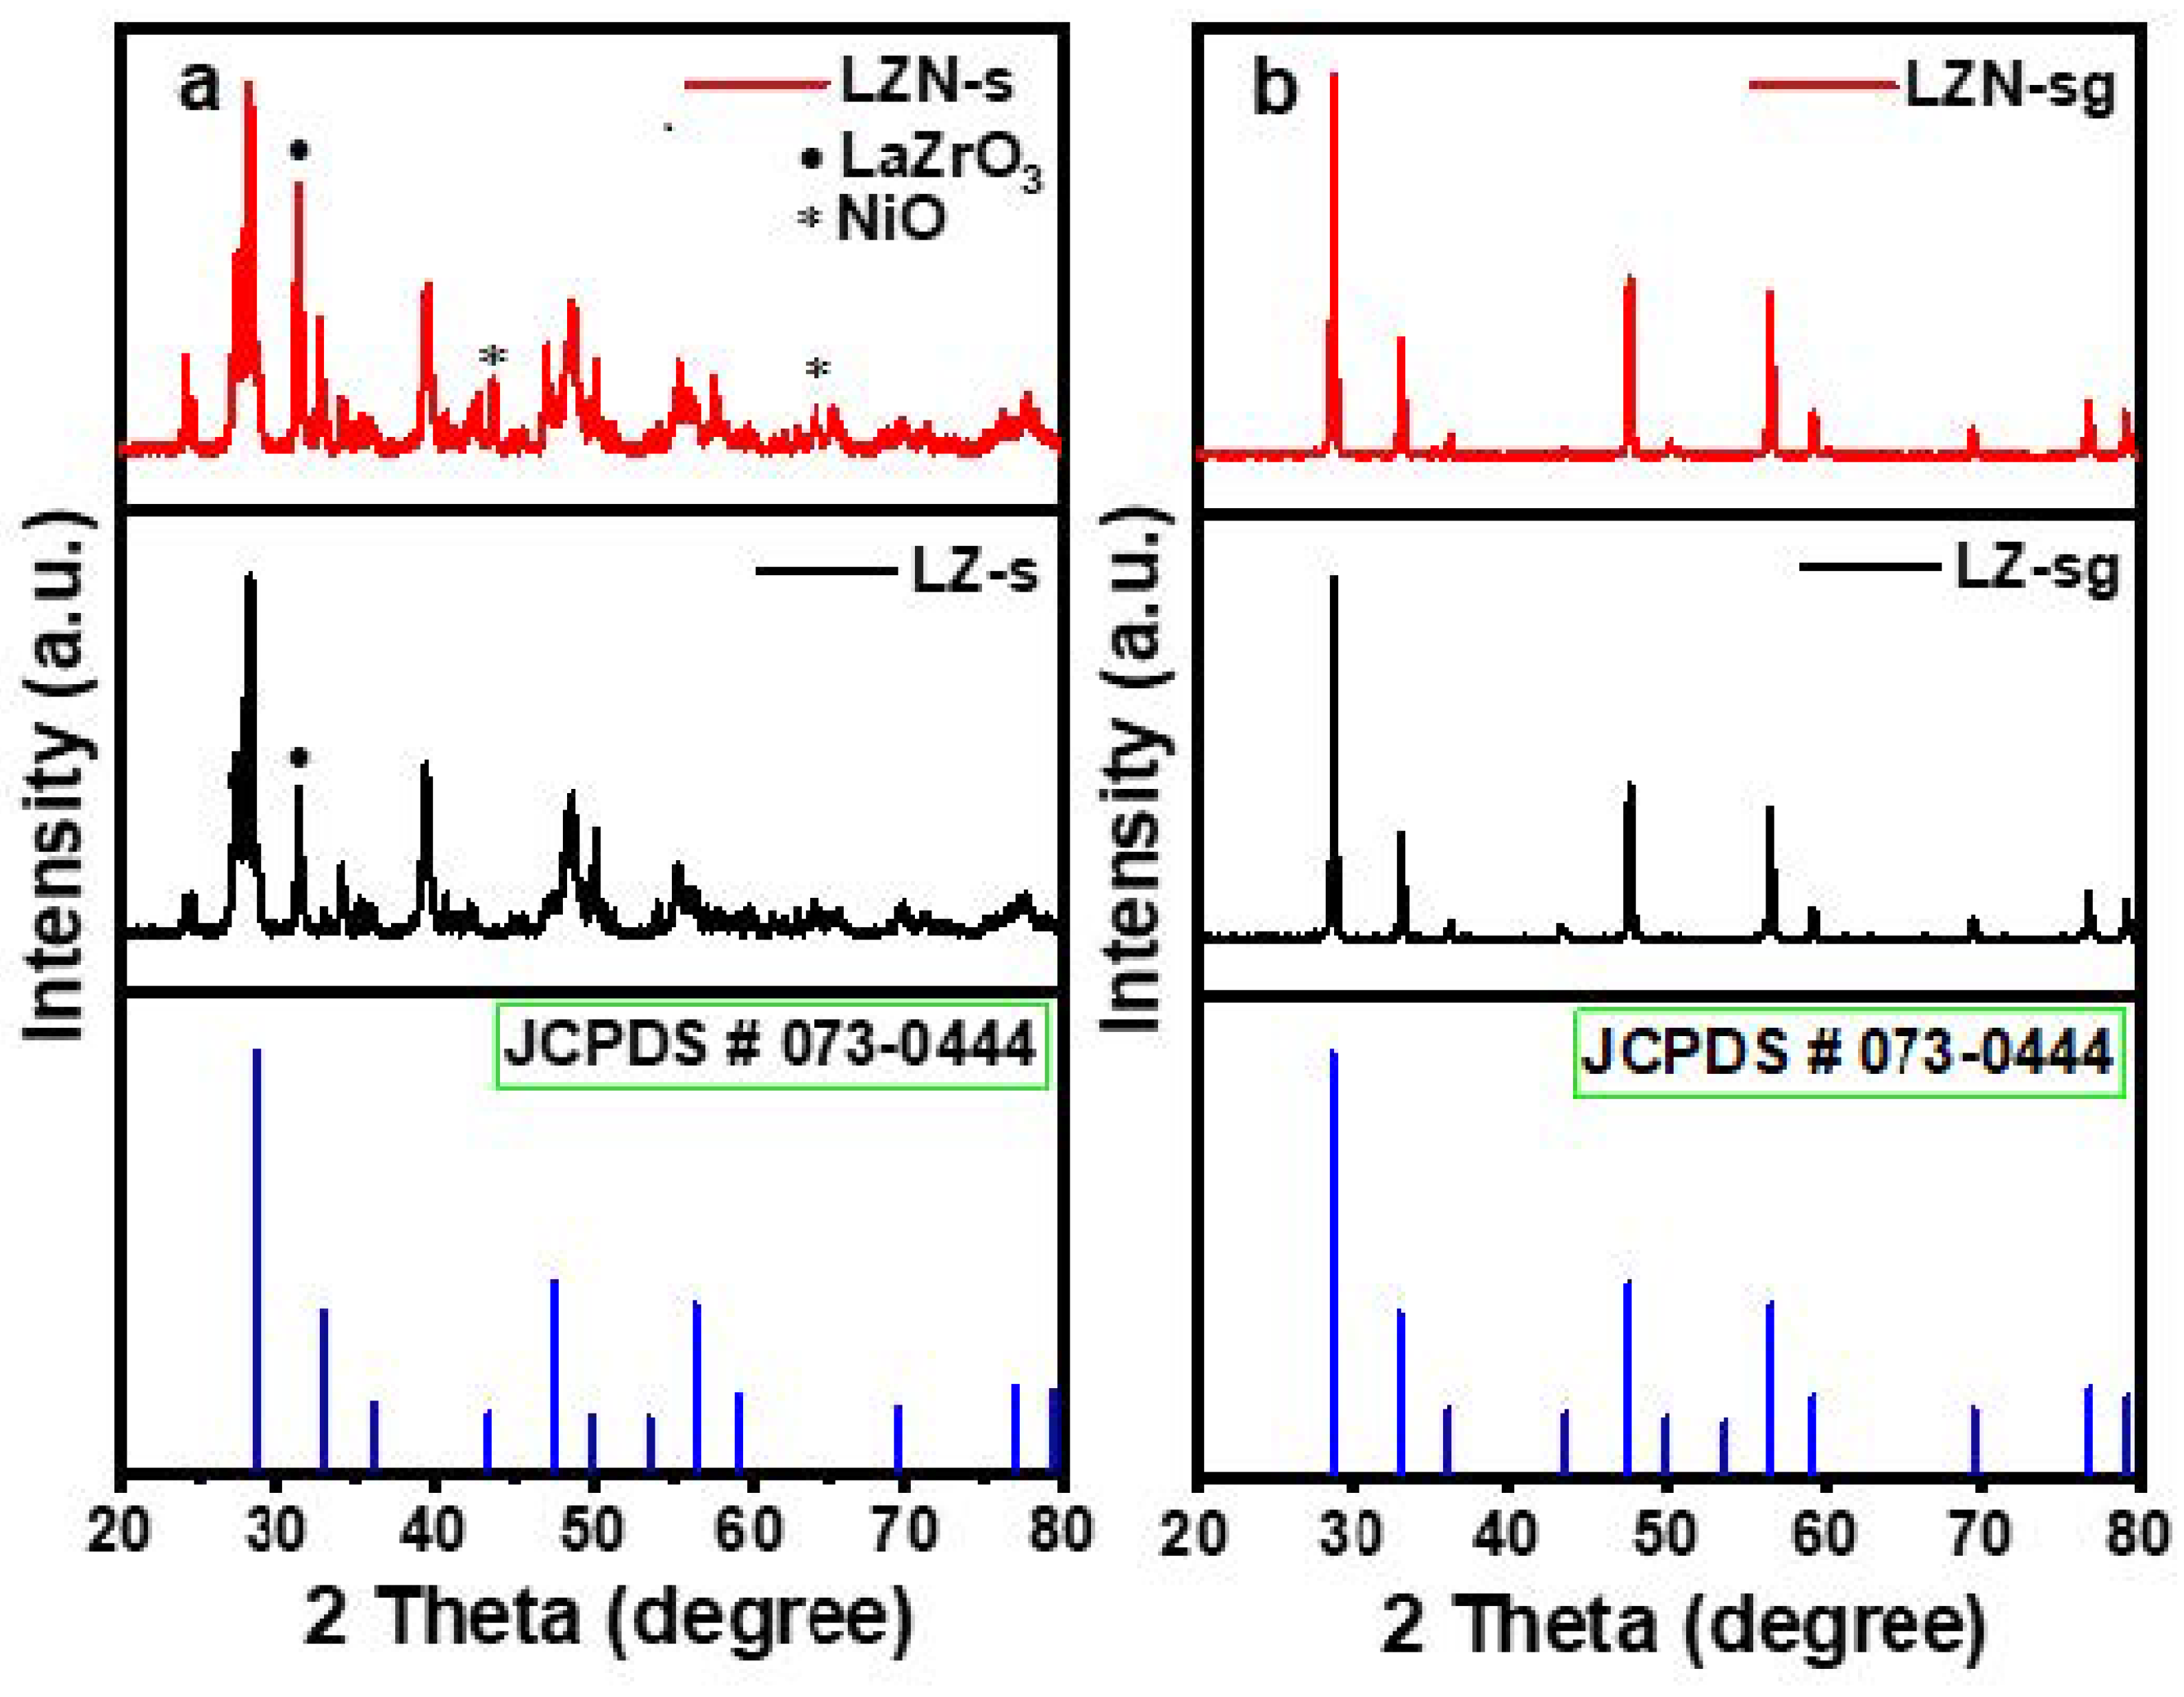
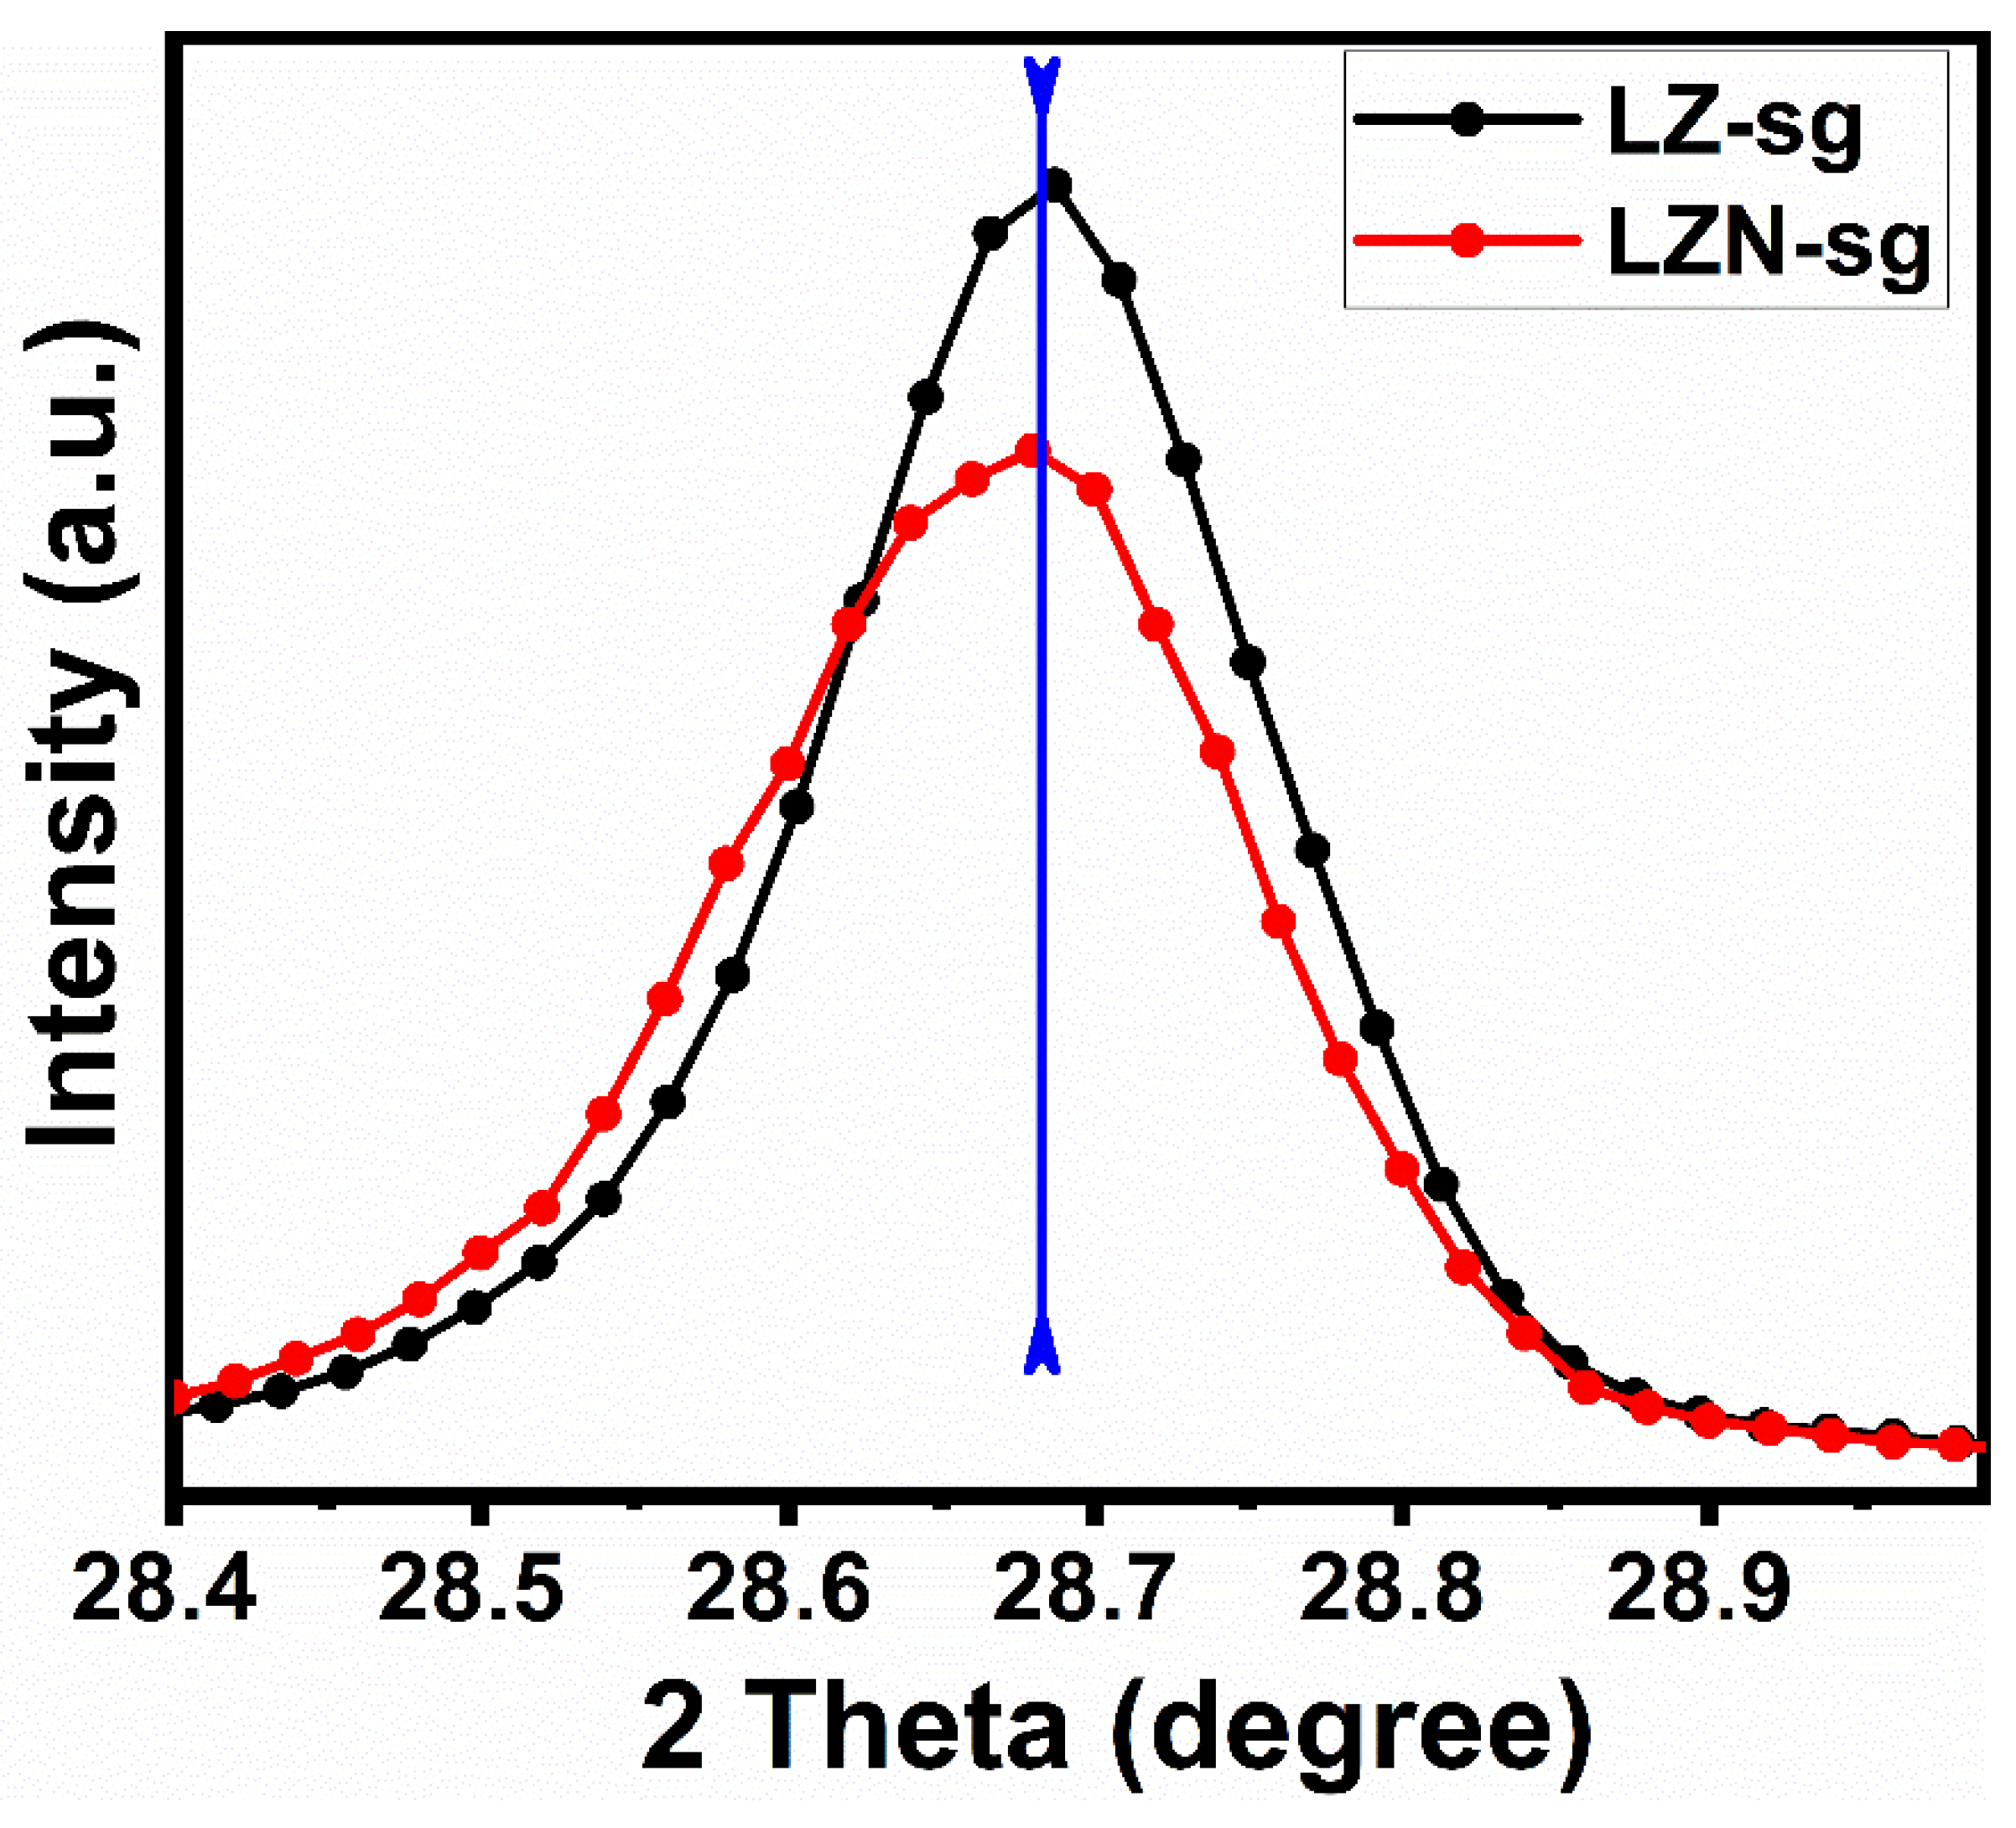
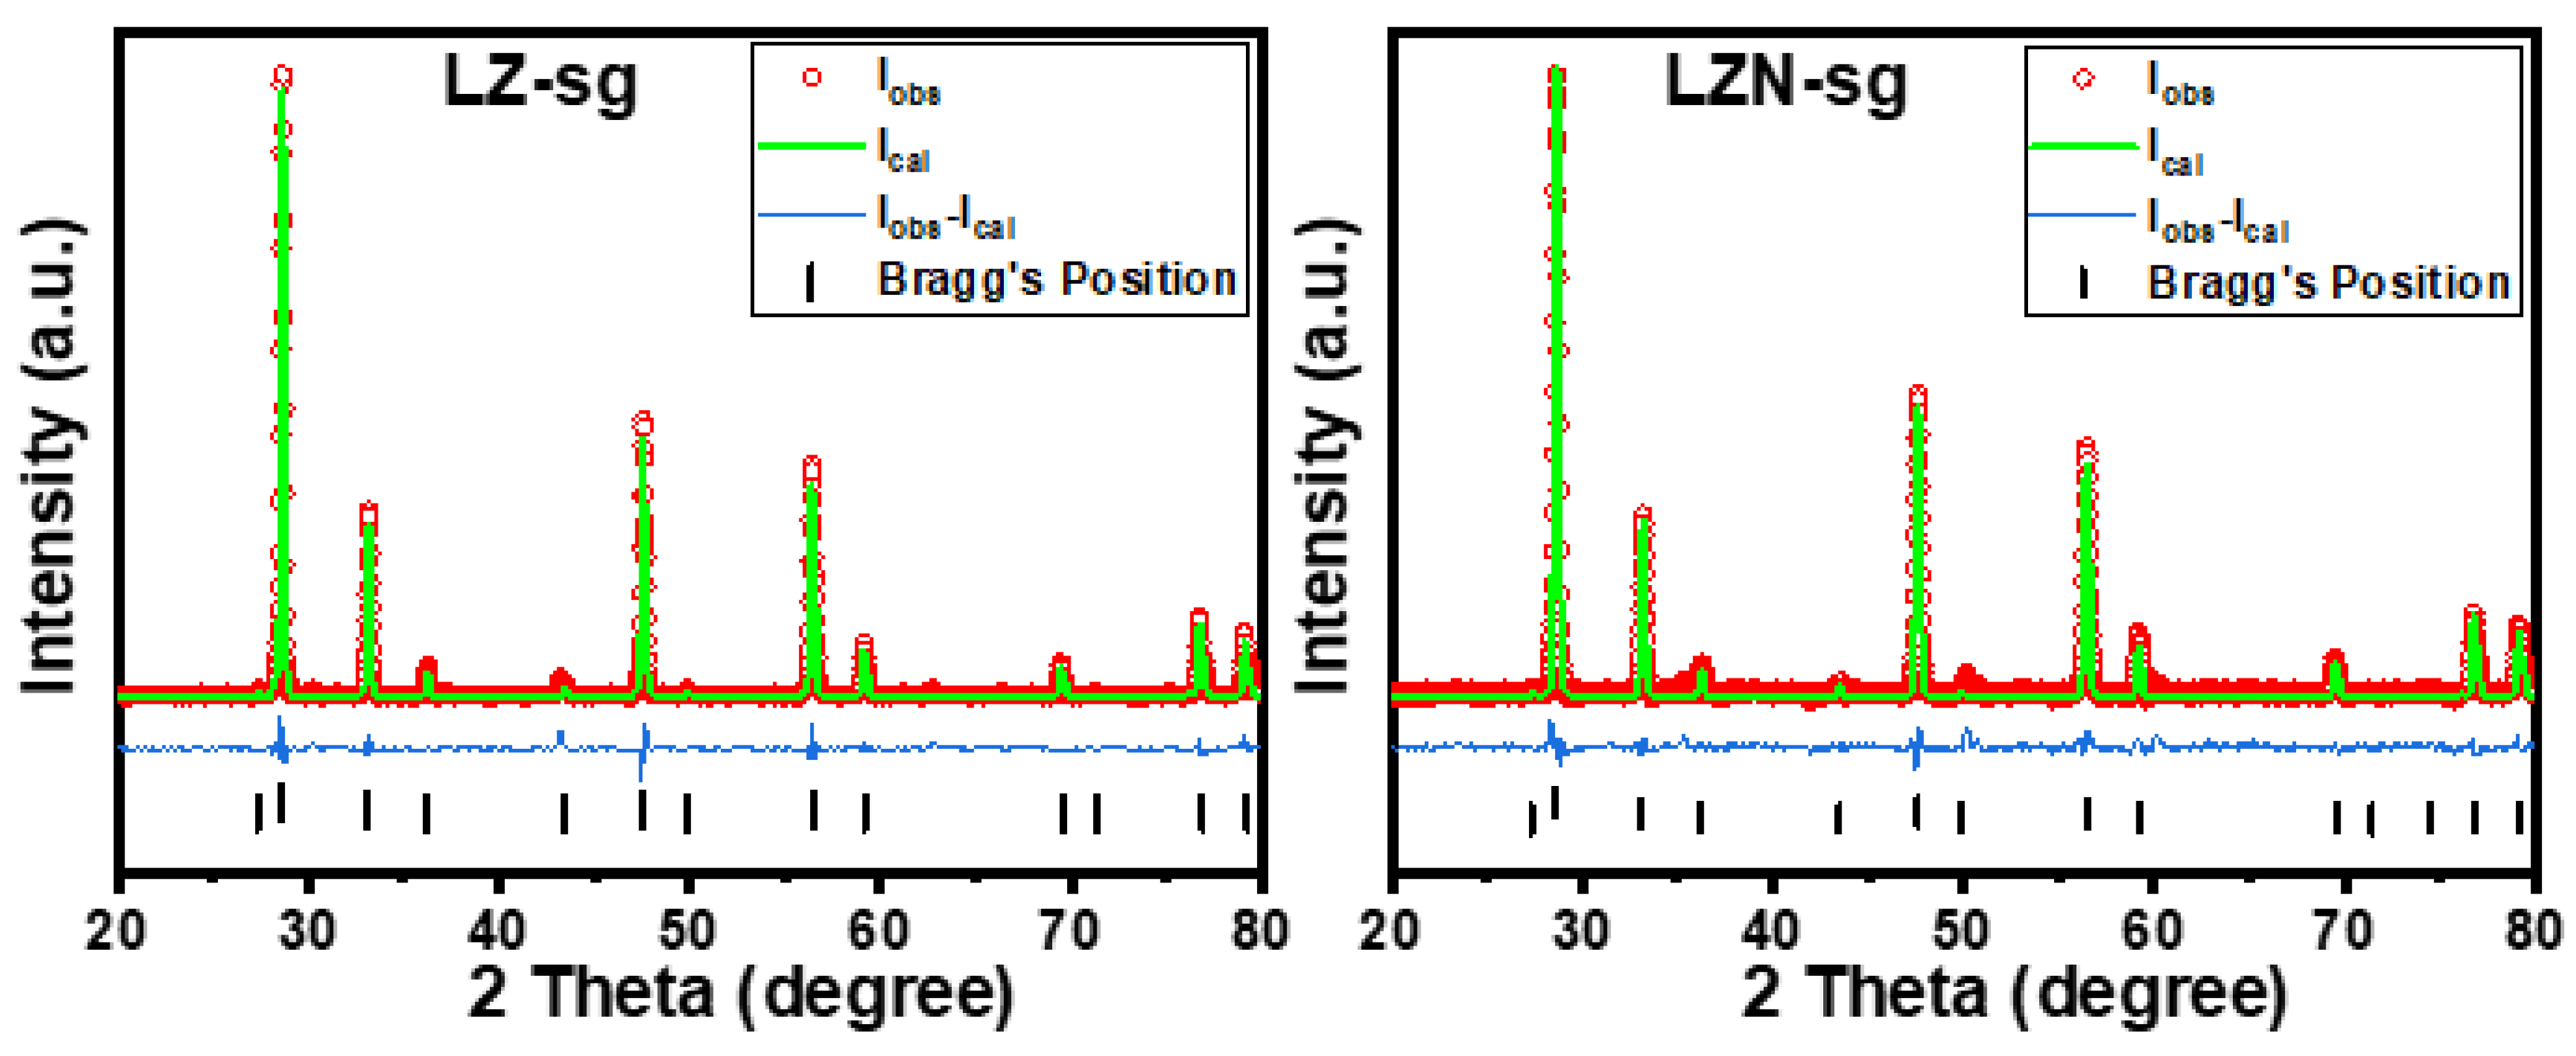
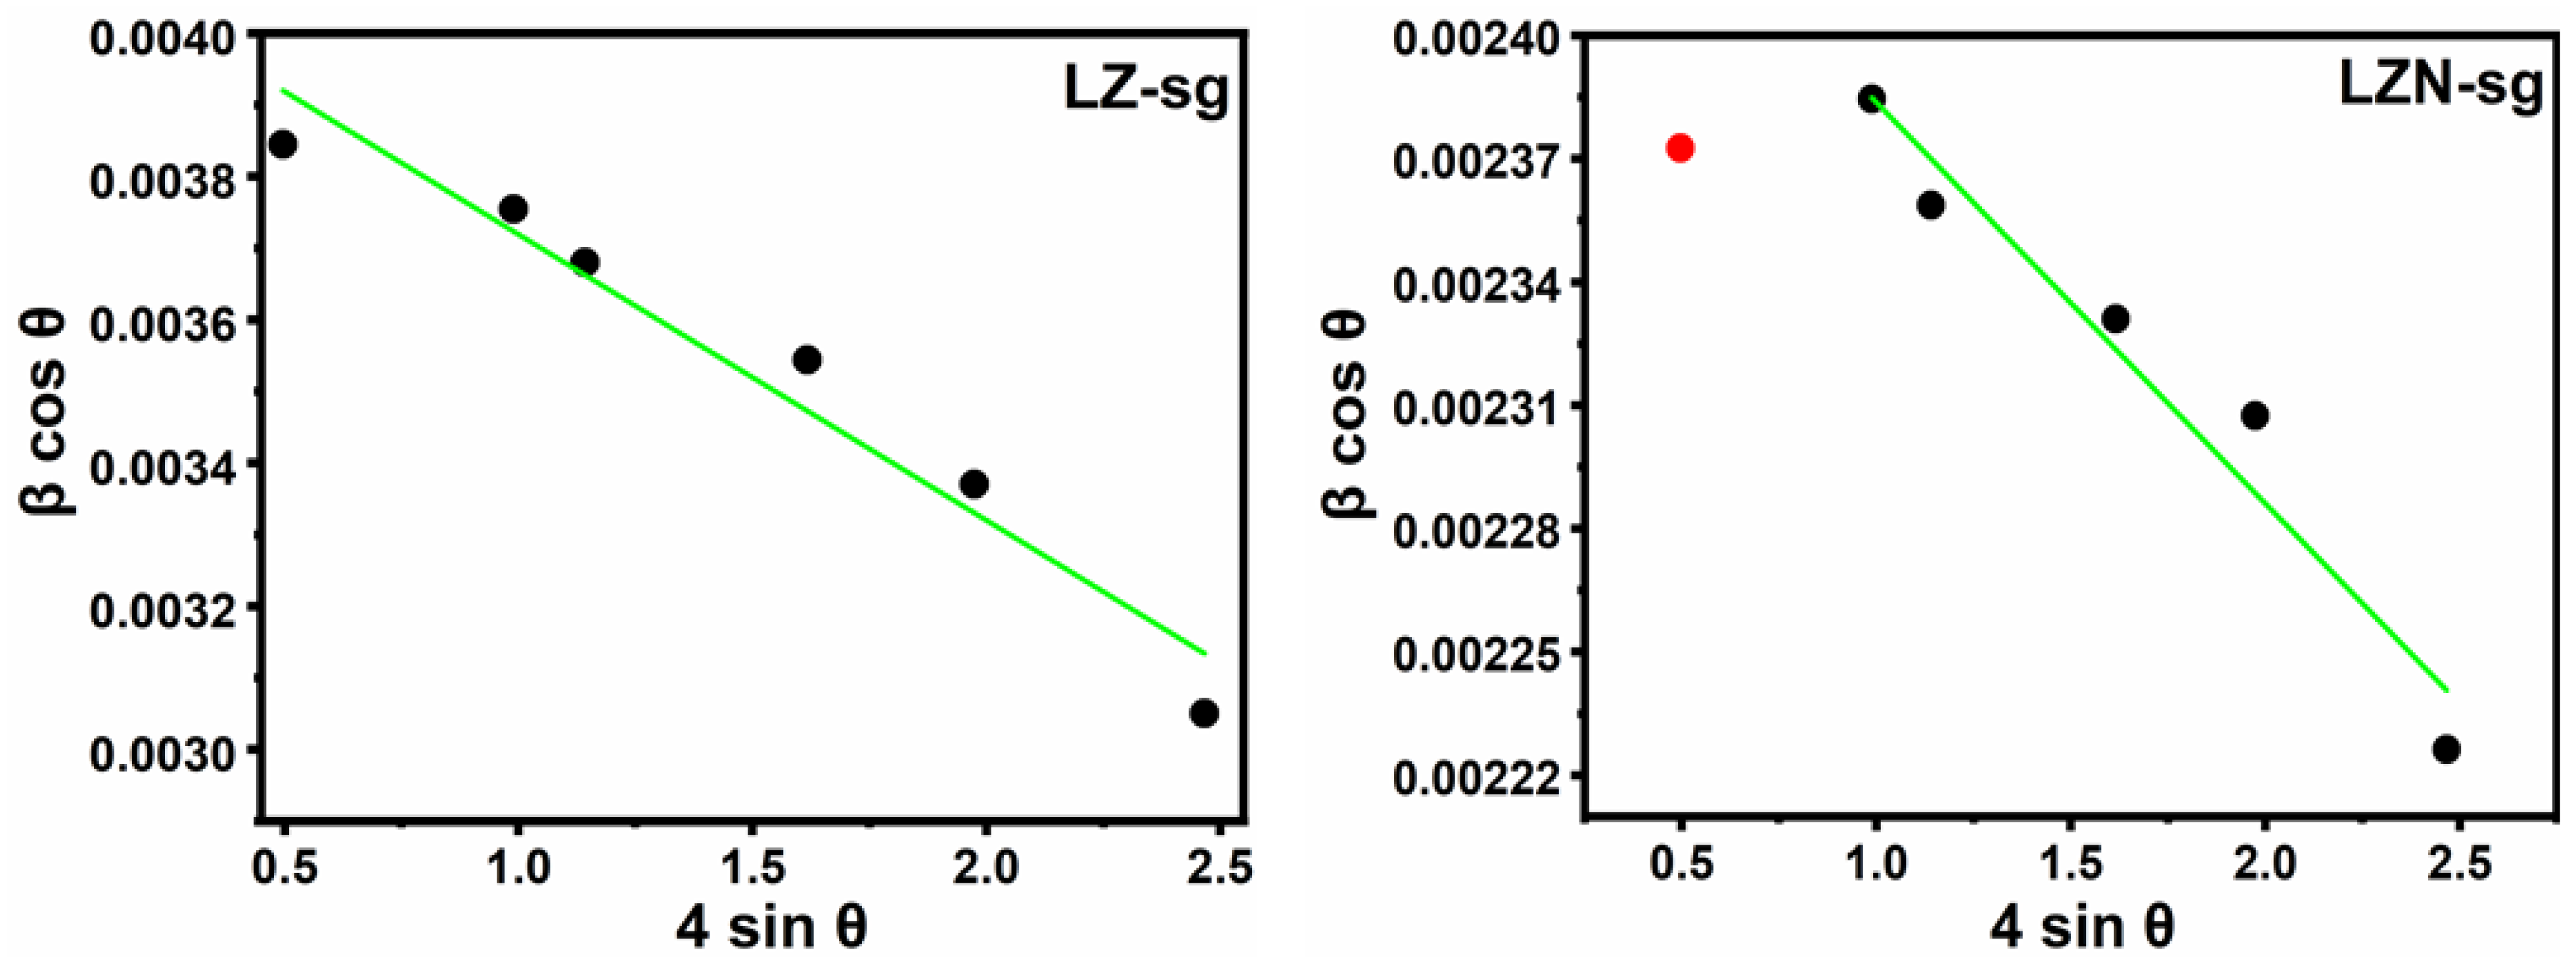
3.2. Crystal Structural Analysis by XRD
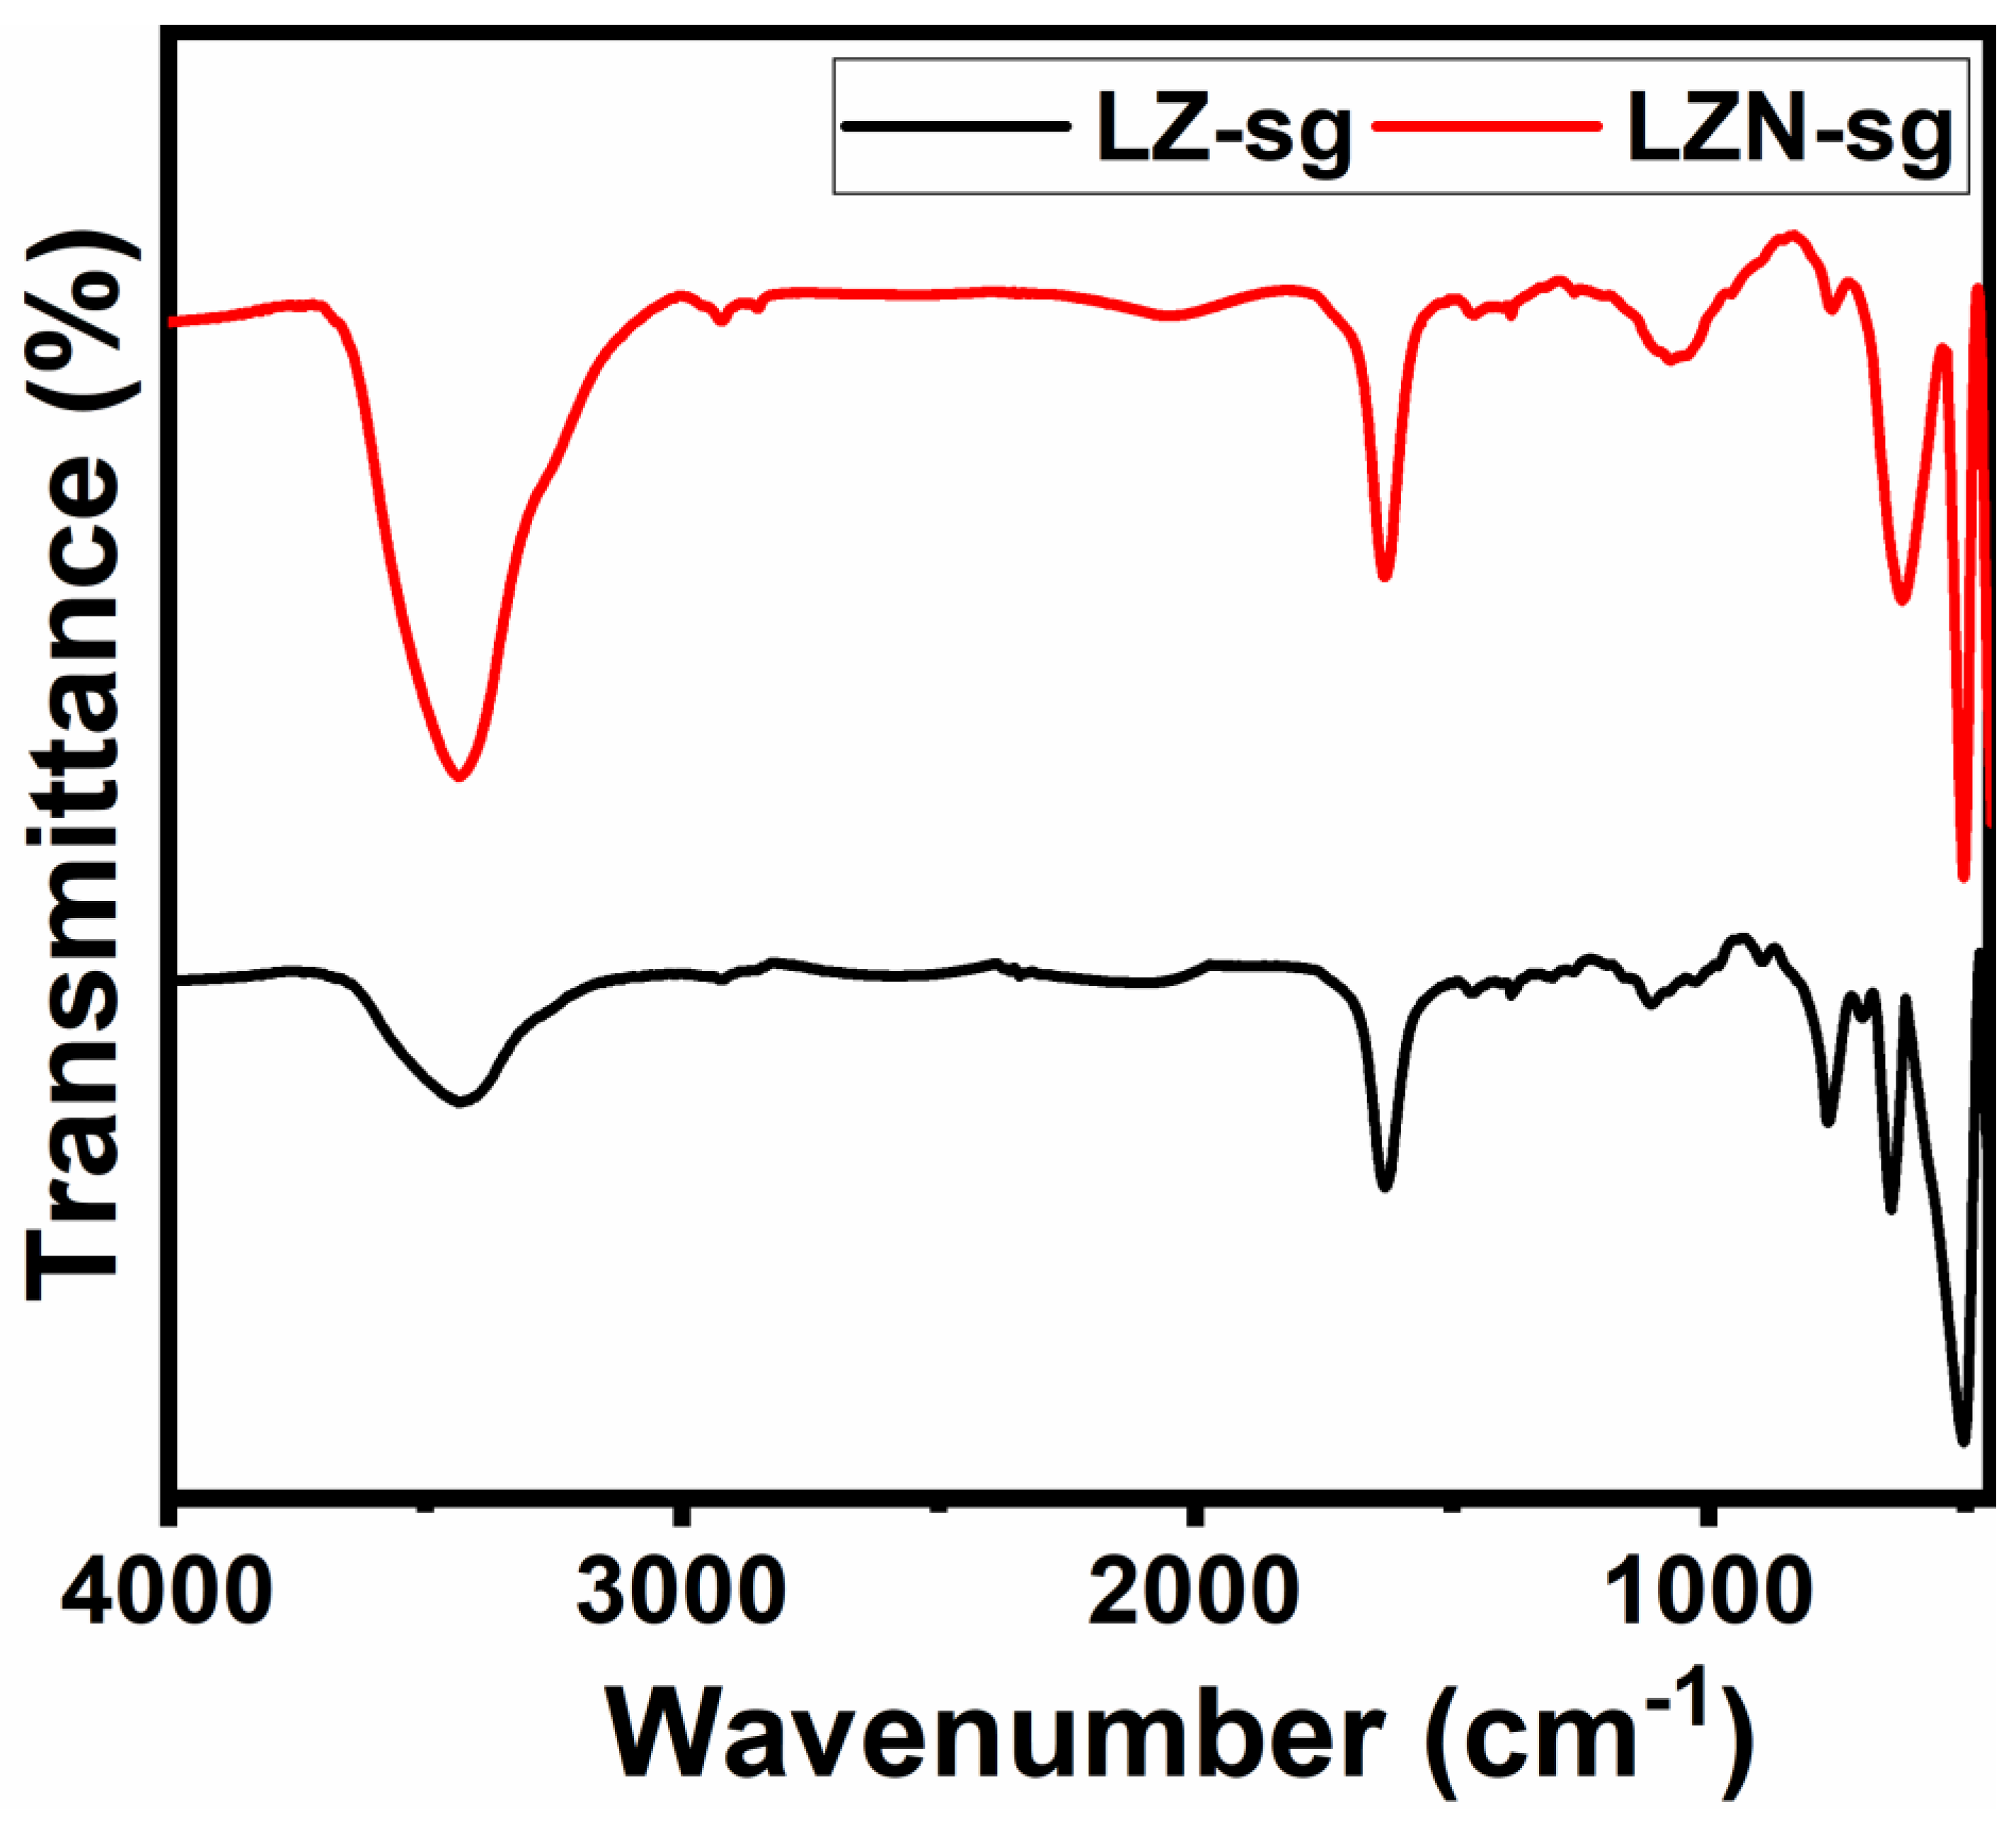
The powder XRD was used to recognize the phase purity and crystalline structure of the fabricated La2Zr2-xNixO7, depicted in Figure 3. The XRD patterns of LZ-s and the LZN-s pyrochlores fabricated by the solid method are shown in Figure 3a. It was observed that the peaks corresponding to the base pyrochlore cubic structure, instead of the fluorite phase, were detected in both samples. However, other phases also segregated, such as the perovskite phase (LaZrO3) and the NiO phase, in addition to the cubic phase [6]. The peaks of the (200) and (220) NiO phases, at 2θ values of 43.4° and 63.05°, respectively, were observed in the LZN-s sample. The (200) plane of NiO coincides with the low-intensity (511) plane of the pyrochlore [7]. This divulges that the chosen temperature and decomposition time (6 h and 1200 °C) were insufficient to grow into the pyrochlore structure; it needed more heat and time for the complete transformation.
Figure 3b shows the XRD patterns of the LZ-sg and LZN-sg samples fabricated by the sol-gel method. The sol-gel-prepared La2Zr2-xNixO7 showed the presence of high-intensity peaks, with 2θ values at 28.58°, 33.12°, 43.47°, 47.55°, 56.42°, 59.17°, and 69.52°, which are indexed with the following hkl planes: (222), (400), (511), (440), (622), (444), and (800), respectively. These findings confirm the cubic structure of the space group number, Fd3m (227), and good coherence with the JCPDS number, 01-073-0444, with the lattice constants, a = b = c = 10.83 Å. The unit cell volume was estimated for LN-sg (1271.97 (Å)3) and for LZN-sg (1271.73 (Å)3). Upon the substitution of Zr4+ (r = 0.72 Å) on the B-site by Ni2+ (r = 0.69 Å), no change was found change in the position, lattice parameters, and crystal structure, which confirms that the Ni2+ ion was incorporated into the cubic lattice, as well as the high solubility of it in the structure. However, we observed that the unit cell volume slightly decreases with the doping of the Ni ion. This is due to the smaller ionic radius of the Ni2+ compared to the Zr4+ ions. In addition, in Figure 3b, we observe a very strong peak before 2θ = 40 degrees, which was matched with the ICSD card number, 033-0963, and which belongs to the tetragonal phase of nickel zirconium (Ni11Zr29), with a space group of 14/m, and lattice constants of a = b = 9.8800 Å and c = 6.6100 Å.
The zoom plot of the (222) hkl plane is depicted in Figure 4. There is no shifting in the peak towards lower or higher 2θ values in the substituted pyrochlore, which confirms the high solubility of the Ni ions and that there are no changes in the pyrochlore structure. However, it can be observed that the scattering factor is decreased when Zr was substituted with Ni since the scattering factor is directly linked to the number of electrons, valences, and core electrons in an atom. Therefore, it is obvious that, when we substitute Zr with Ni, the scattering factor will decrease. On the basis of the fact that the XRD peaks of the 6-h-calcined samples fabricated by the sol-gel method were, under the same XRD conditions, sharper than the peaks of the 6-h-calcined samples fabricated by the solid-state method.
In addition to the XRD patterns of the samples prepared by sol-gel, we performed Rietveld refinements with the help of HSP software. Typical Rietveld refinements are shown in Figure 5 for the samples of the LZ-sg and the LZN-sg. The patterns were refined using the Fd3m space group. The observed and calculated intensities are symbolized as open circles and solid lines, respectively. The bottom line represents the difference between the observed and calculated intensities. The allowed Braggs positions for the Fd3m space group are marked as vertical lines. The fractional positions of the oxygen atom (x = y = z) were taken as free parameters, and the other atomic fractional positions were taken as constants. Parameters such as the lattice constants, isothermal parameters, occupancies, scale factors, and shape parameters were taken as free parameters. The background was refined by using the polynomial method. The obtained experimental hkl planes in the XRD patterns are in good agreement with the Bragg 2θ values. The refined XRD patterns show very slight, or no, deviation between the observed and calculated patterns. The diffuse scattering in the diffraction pattern becomes less significant at the nanoscale and this confirms the dominancy of Bragg scattering. The Rp, Rwp, Rexp, and χ2 are listed in Table 1. When these parameters reach their minimum value, the best fit to the experimental diffraction data is achieved, and the crystal structure is regarded as satisfactory [32,33,34,35]. The Rp and Rwp factors were found to be very close to the Rexp values. This could be due to the low signal-to-noise ratios of the XRD patterns for nanocrystalline materials. Moreover, we observed a low value of χ2 (goodness of fit), which justifies the goodness of refinement. Other parameters, such as the atomic position, site, and occupancy are tabulated in Table 2.
Furthermore, the analysis of the crystallite size was carried out by two methods: Scherrer [34] and Williamson–Hall (W–H) methods [36]. The W–H method is more useful because, in this method, all the instrumental factors are taken into account for the corrections of the peak broadening. Peak broadening comes from several sources, such as the instrumental effect, the finite crystallite size, and the strain effect within the crystalline lattice.
Scherrer’s formula is defined as:
D = k λ β c o s θ
where the constant, k, depends upon the shape of the crystallite size (k = 0.89, assuming the circular grain); β is the full width at half maximum (FWHM) of intensity (a.u.) vs. the 2θ profile; λ is the wavelength of the CuKα radiation (λ = 0.1542 nm); θ is Bragg’s diffraction angle; and D is the crystallite size. In Scherrer’s formula, the average crystallite size is calculated using a Gaussian fit to the peak sin XRD pattern. D has been taken as the average for all the major peaks.
According to the Williamson–Hall method, the individual contributions to the broadening of reflections can be expressed as:
β c o s θ = k λ D + 4 ε   s i n θ
where 4ε sinθ is the strain effect on the crystallites. Typical Williamson–Hall plots are displayed in Figure 6 for the LZ-sg and LZN-sg samples.
The values of the crystallite sizes by both of the aforementioned methods are listed in Table 1. The sizes of the crystallites increased with the substitution of the Ni2+ ions. Moreover, the crystallite sizes obtained by the Williamson–Hall method are less than those obtained by Scherrer’s formulae. This is because the strain correction factor has been taken into account in the case of the Williamson–Hall method, whereas it has not been taken into account in Scherrer’s method.

3.3. FT-IR Study

The production of the pyrochlores by sol-gel, their purity, and the interaction behind their unusual activities was also corroborated by the FT-IR results. The absorption bands of a crystalline solid are usually assigned to the vibration of the ions in the crystal lattices. The FT-IR spectra of the samples, measured at room temperature in the range of 400–4000 cm−1, are shown in Figure 7. In both cases, the various vibration bands of the surface functional groups are observed at various frequency regions, such as 3436.25, 2037.18, 1630.78, 1059.07, 746.03, 625.51, 500.14, and 455.45 cm−1. The peaks centered at around 3436.25 cm−1 and 1630.78 cm−1 may be assigned to the −OH bending and stretching vibrations, respectively, of the physically adsorbed water molecules and the surface hydroxyl groups strongly perturbed by hydrogen bonding [37,38]. These water molecules might have been incorporated during the sample preparation for the FT-IR measurements. The smaller peak, at 1059.07 cm−1, corresponds to the principal vibration of the (CO3)2− group because of the exposure to the ambient atmosphere, which was not detected in the XRD. The bands below 750 cm−1 indicate the presence of absorption bands in the range of 400–750 cm−1, which is a common feature of the metal–oxygen (Mtet/oct–O) in La2Zr2-xNixO7 oxide [39]. The higher frequency absorption band lies in the range of 600–500 cm−1, and it is assigned to the vibration band between the oxygen ion and the tetrahedral site metal ion (Mtet–O). The lower frequency absorption band lies in the range of 500–400 cm−1, and is assigned to the vibration band between the oxygen ion and the octahedral site metal ion (Moct–O). The peak positions of the absorption bands slightly change with the doping of the Ni ions at the B site. The change in the band positions is due to the change in the bond lengths of both sites [40]. The presence of Ni-O bond stretch was confirmed through the observed peaks at 455 cm−1 [39,41,42].

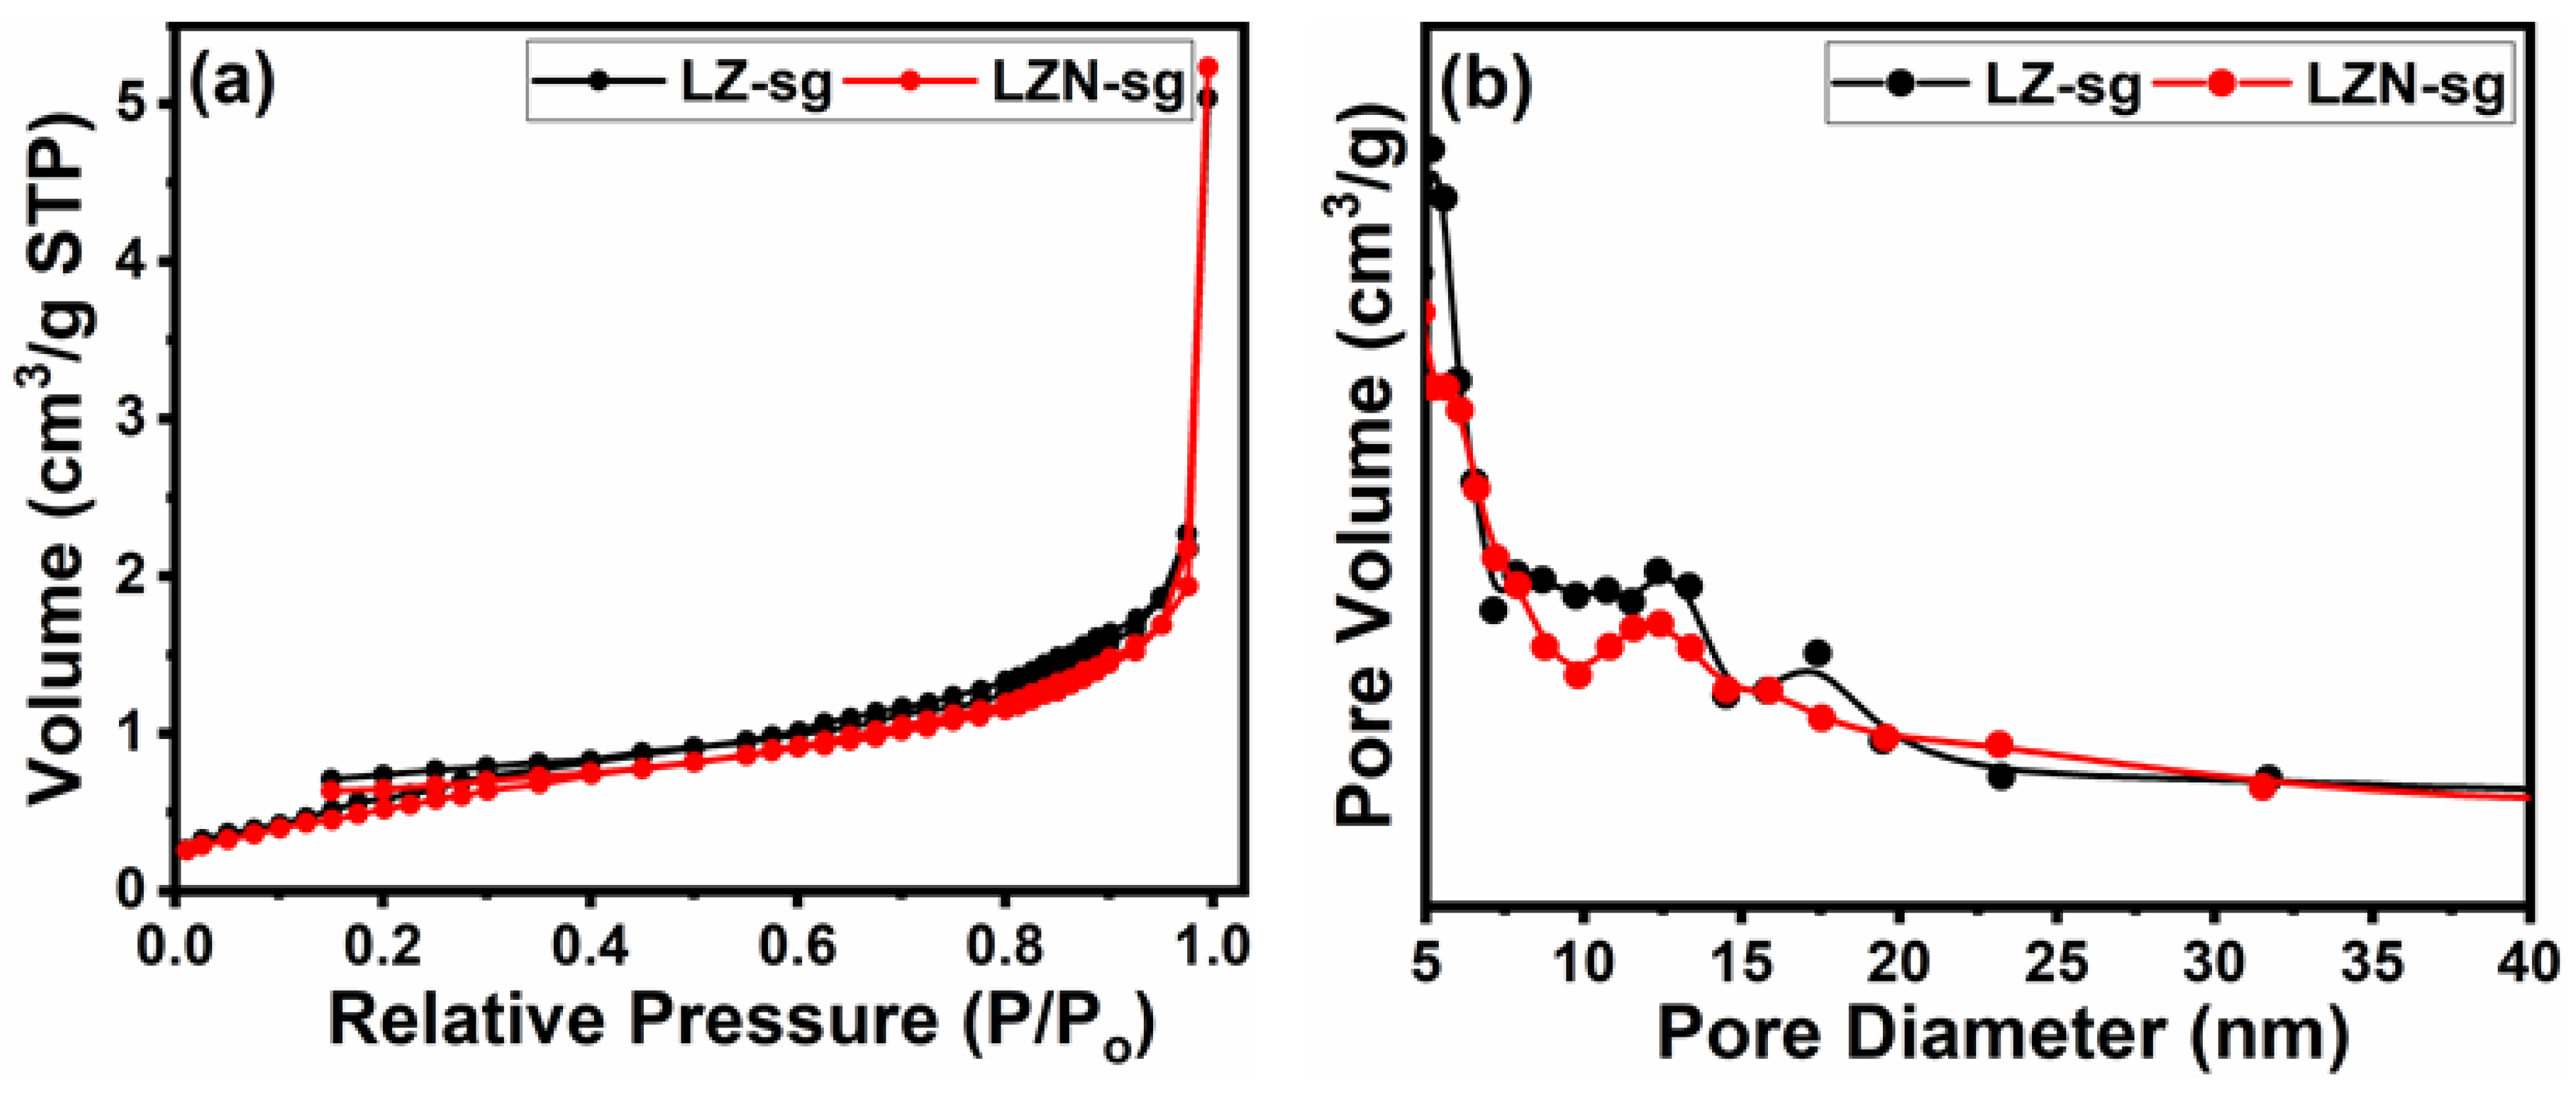
3.4. Textural Properties

Figure 8 points out the data of the N2 adsorption–desorption characterization, as well as the pore size distribution for the samples. The results from the porosity measurements are summarized in Table 3. The resultant adsorption–desorption characteristics of both samples displayed very similar-type isotherms. The results reveal a kind of type-IV isotherm with H3-type hysteresis at a high-pressure region [43]. It is observable that, compared with the LZN-sg sample, the LZ-sg sample possesses a high BET surface area. However, the pore volume and pore diameter of the LNZ-sg are higher than those of the LZ-sg, which could help to provide a more active site, which can be favorable and advantageous for catalytic applications [6].

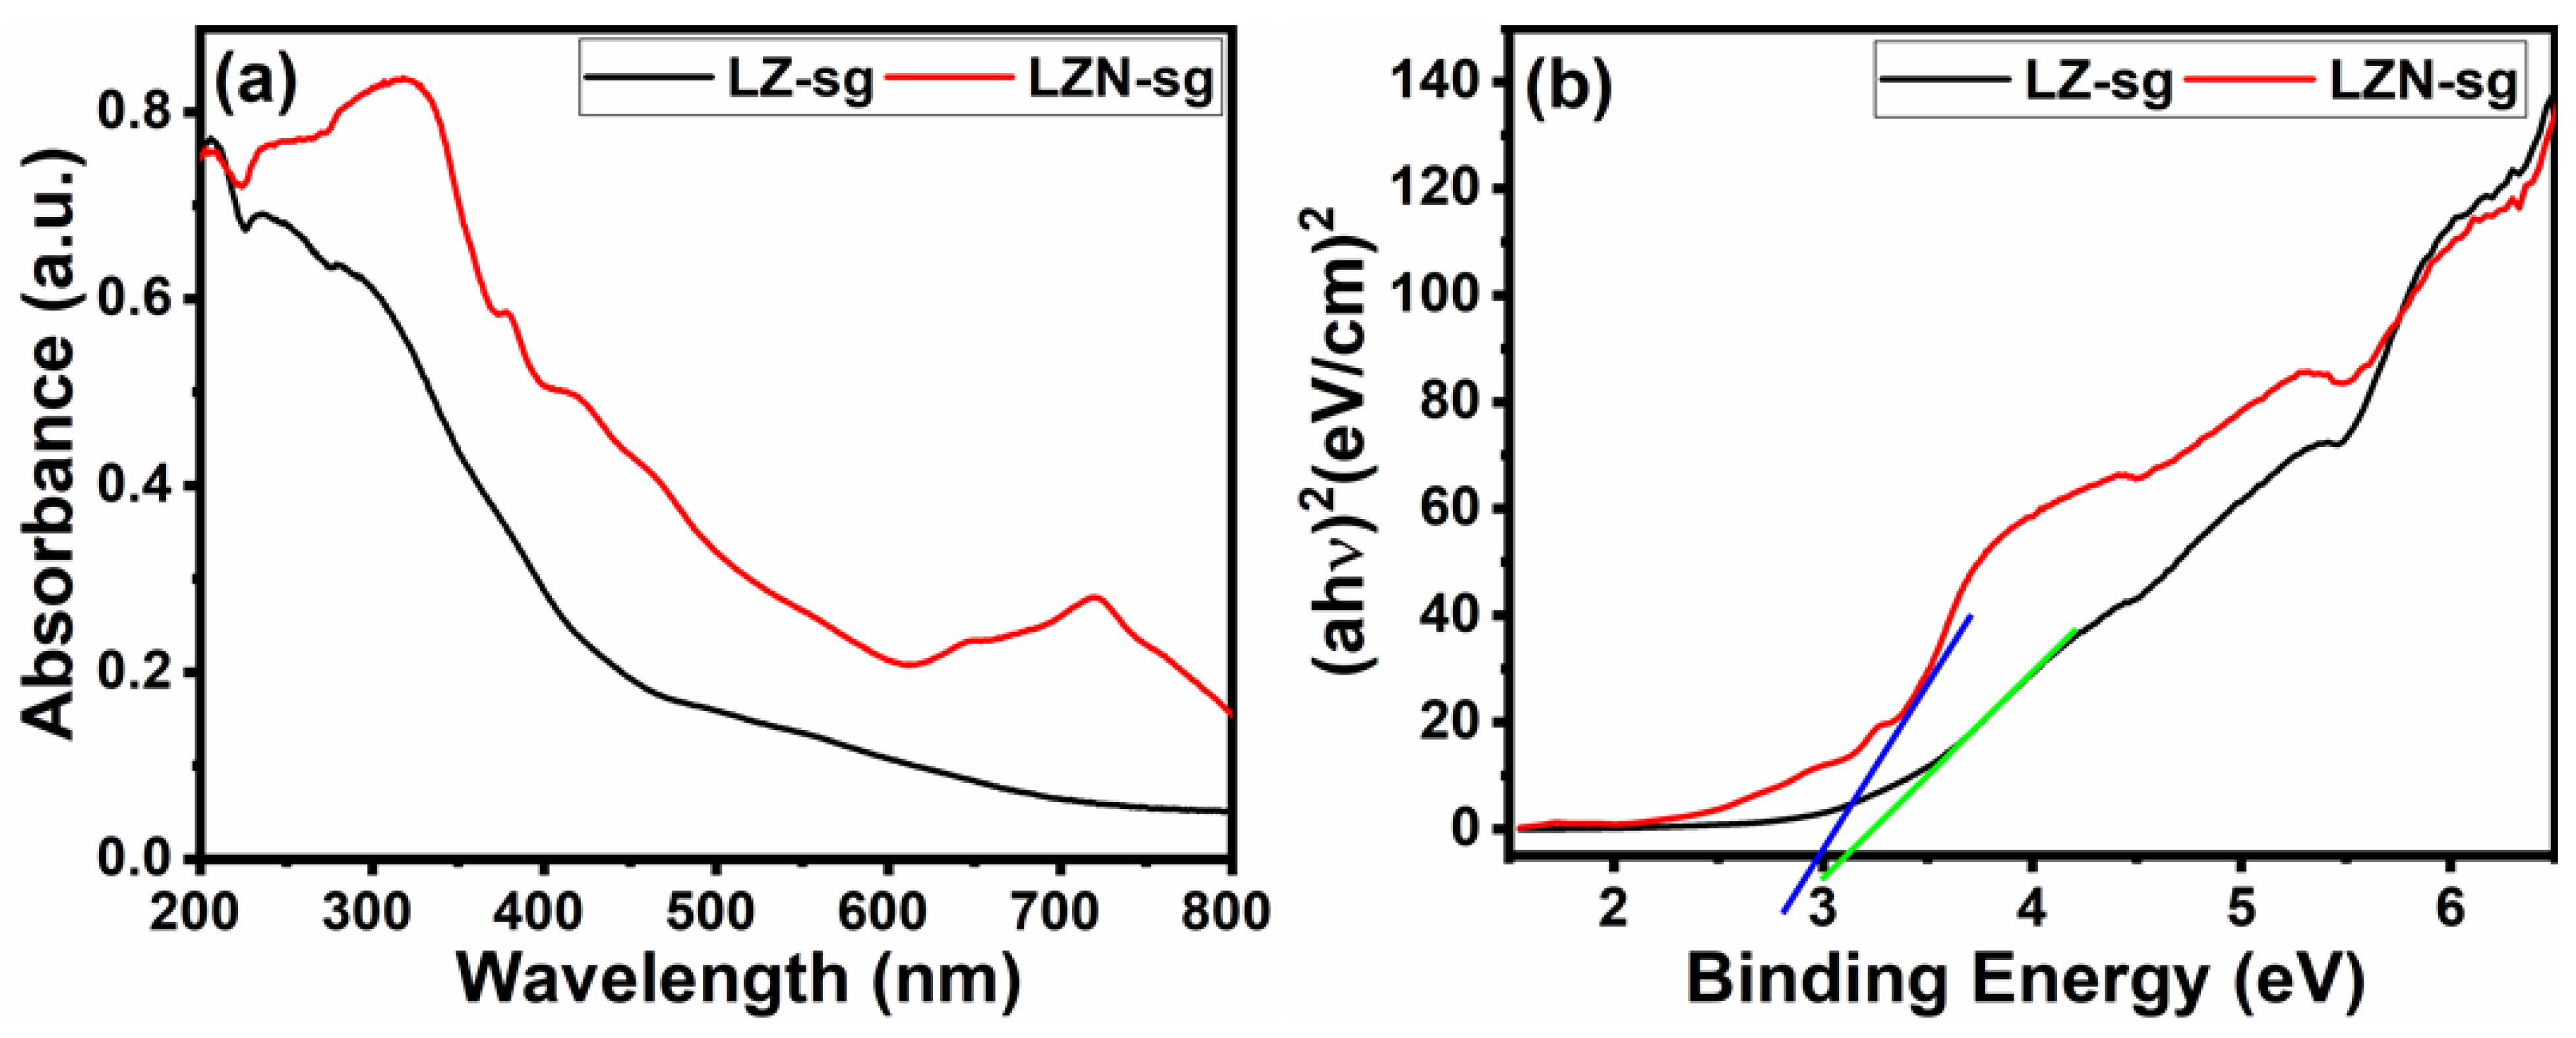
3.5. UV–Visible Diffused Reflectance Spectroscopy Study

The optical sensibility light absorption characteristics of the fabricating samples were characterized by UV–Visible spectral analysis in DRS mode and are depicted in Figure 9. As compared to pristine LZ-sg, a redshift of the optical absorption edge was noticed in LZN-sg, which might be due to the strong interfacial electronic coupling between the La2Zr2O7 and nickel, which causes the intense photon scattering. From Figure 9a, it can be observed that the LZ-sg have one absorption band in the UV region and reveal an absorption maximum at 285 nm, while LZN-sg show two absorption bands at the 316-nm and 700-nm peaks, which demonstrate the B-site substitution in the nano regime. The optical band gap (Eg) was estimated from the UV-Vis diffuse reflectance spectra of the powders using a Tauc plot [44]. Figure 9b represents the calculated direct band gap energy, found to be 3.28 eV and 2.91 eV for LZ-sg and LZN-sg, respectively. The conduction band (CB) and valence band (VB) energy levels of La2Zr2O7 were calculated using the formula mentioned in [45], and were found to −0.527 eV and 2.71 eV, respectively.

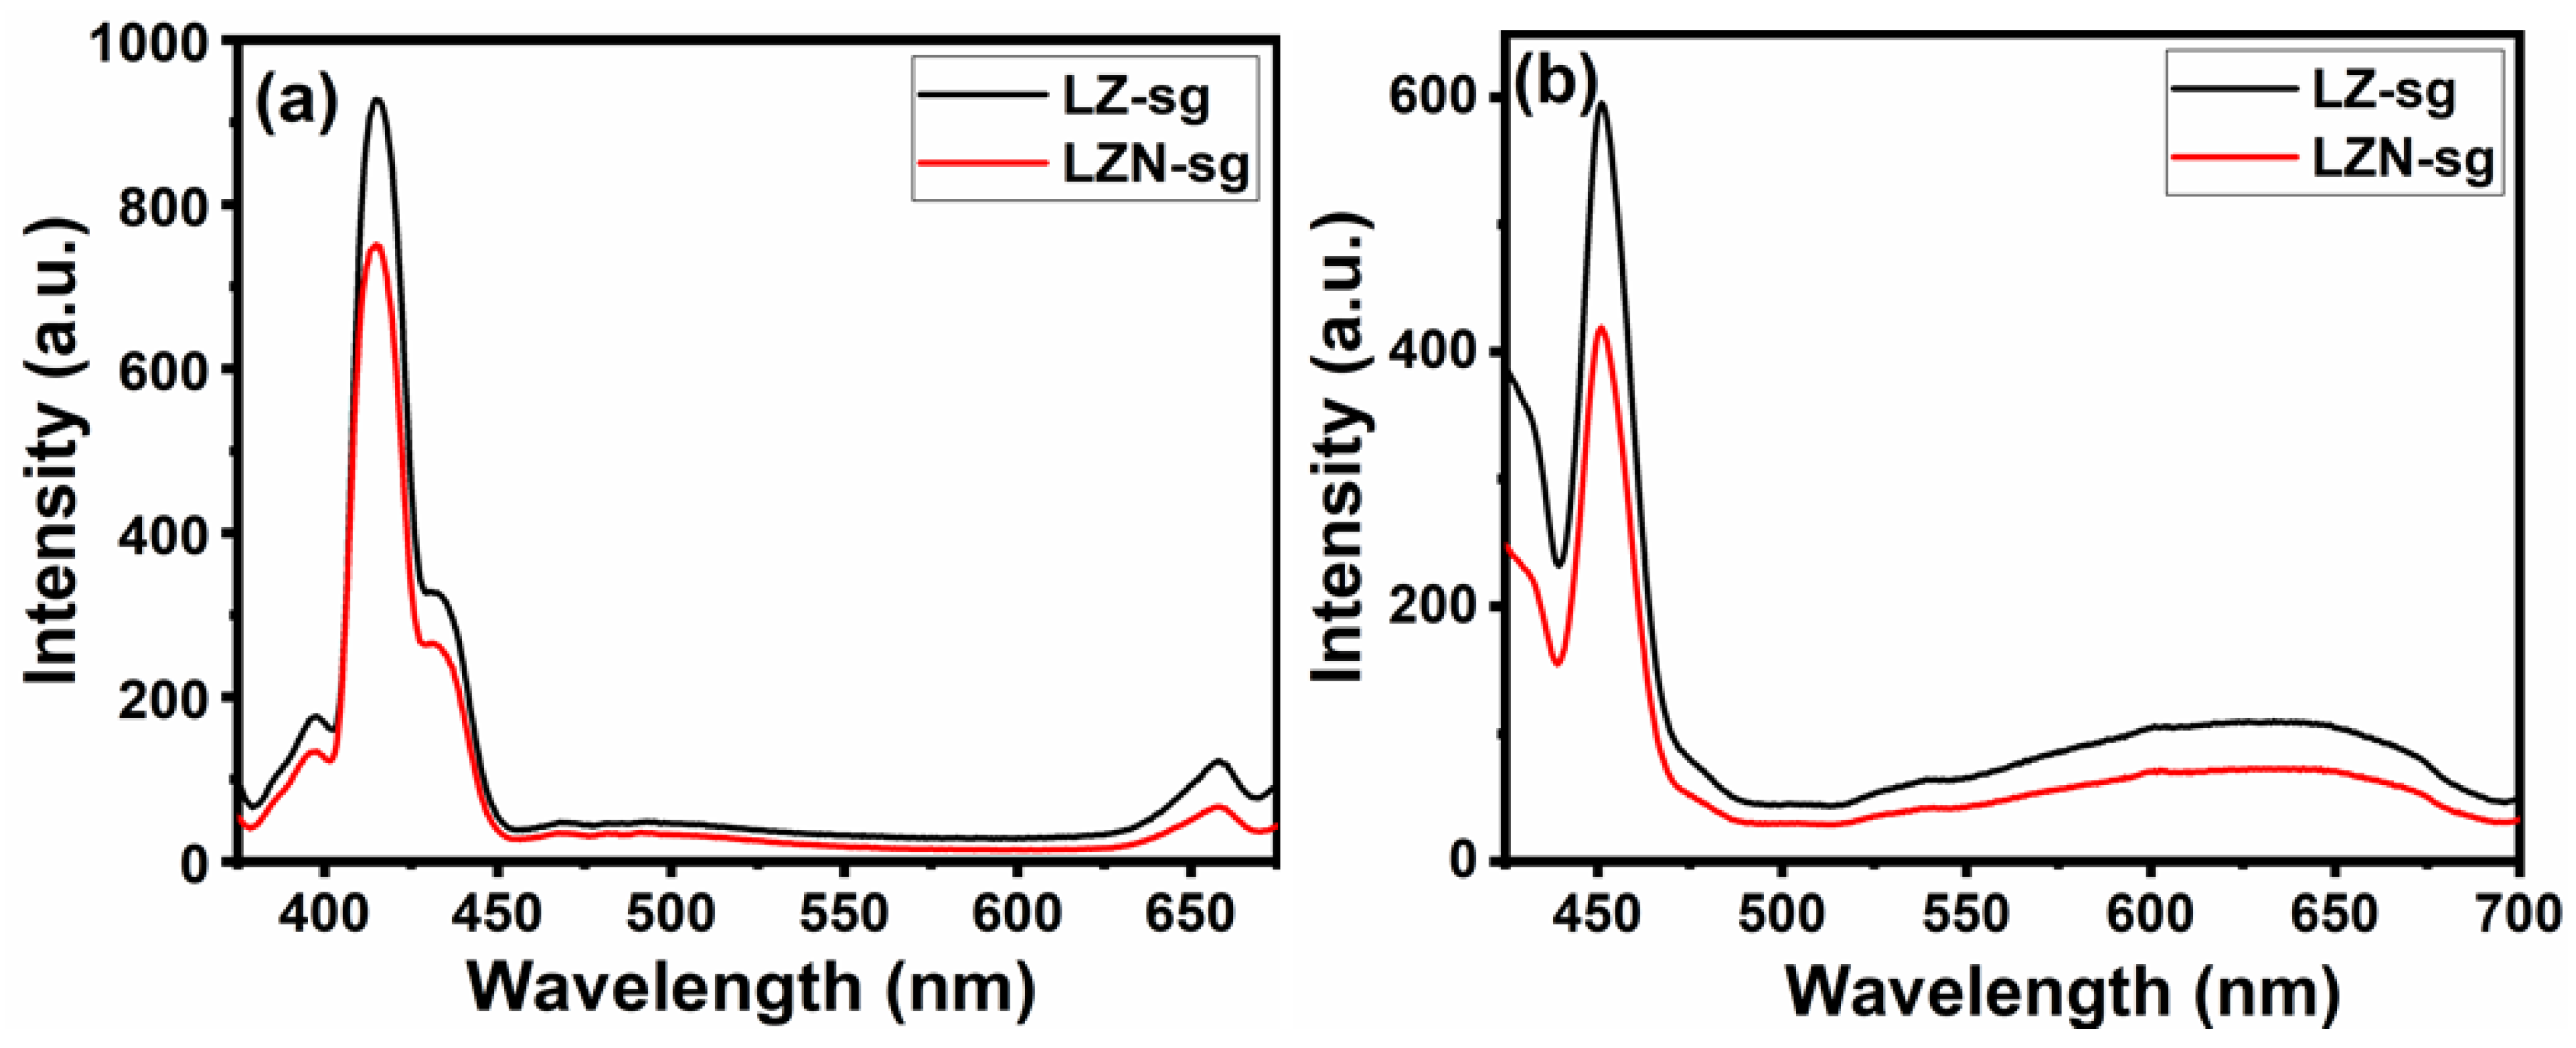
3.6. Photoluminescence Study

Previous studies have indicated that photoluminescence emission spectra are the result of electron–hole pairs. Photoluminescence measurement is a useful method for analyzing the separation efficiency and the lifetime of photogenerated carriers. The lower emission intensity suggests that the recombine rate was slower and that the separation of photogenerated electrons and holes was more effective [46]. Figure 10 displays the PL spectra of both samples at two different excitations, 350 and 400 nm. The emission peaks of the samples are positioned in the two-wavelength regions of 400–450 and 625–675 nm. From Table 4, it can be observed that both the emission bands were redshifted at a higher excitation energy. The LZ-sg sample appeared to have a higher intensity than that of the LZN-sg sample, which suggests that the doping of the Ni2+ ion in La2Zr2O7 could reduce the photogenerated electron–hole recombination rate [47]. This decrease could be attributed to the electron trapping effect of Ni, which acts as an electron acceptor that therefore hinders the recombination process [48,49]. These findings fully support the aforementioned UV–Vis spectra. This improved separation efficiency of the photogenerated carriers is preferable for the photocatalytic degradation of environmental pollutants, such as dyes and drugs. It can be clearly seen that the LZN-sg would be more active than the pristine LZ-sg sample. The binding energy of the major PL band was calculated at two different wavelengths (Table 3), and it was observed that the lower wavelength basically agrees with the optical band-gap energy; therefore, the luminescence could be associated with the band-edge emission.

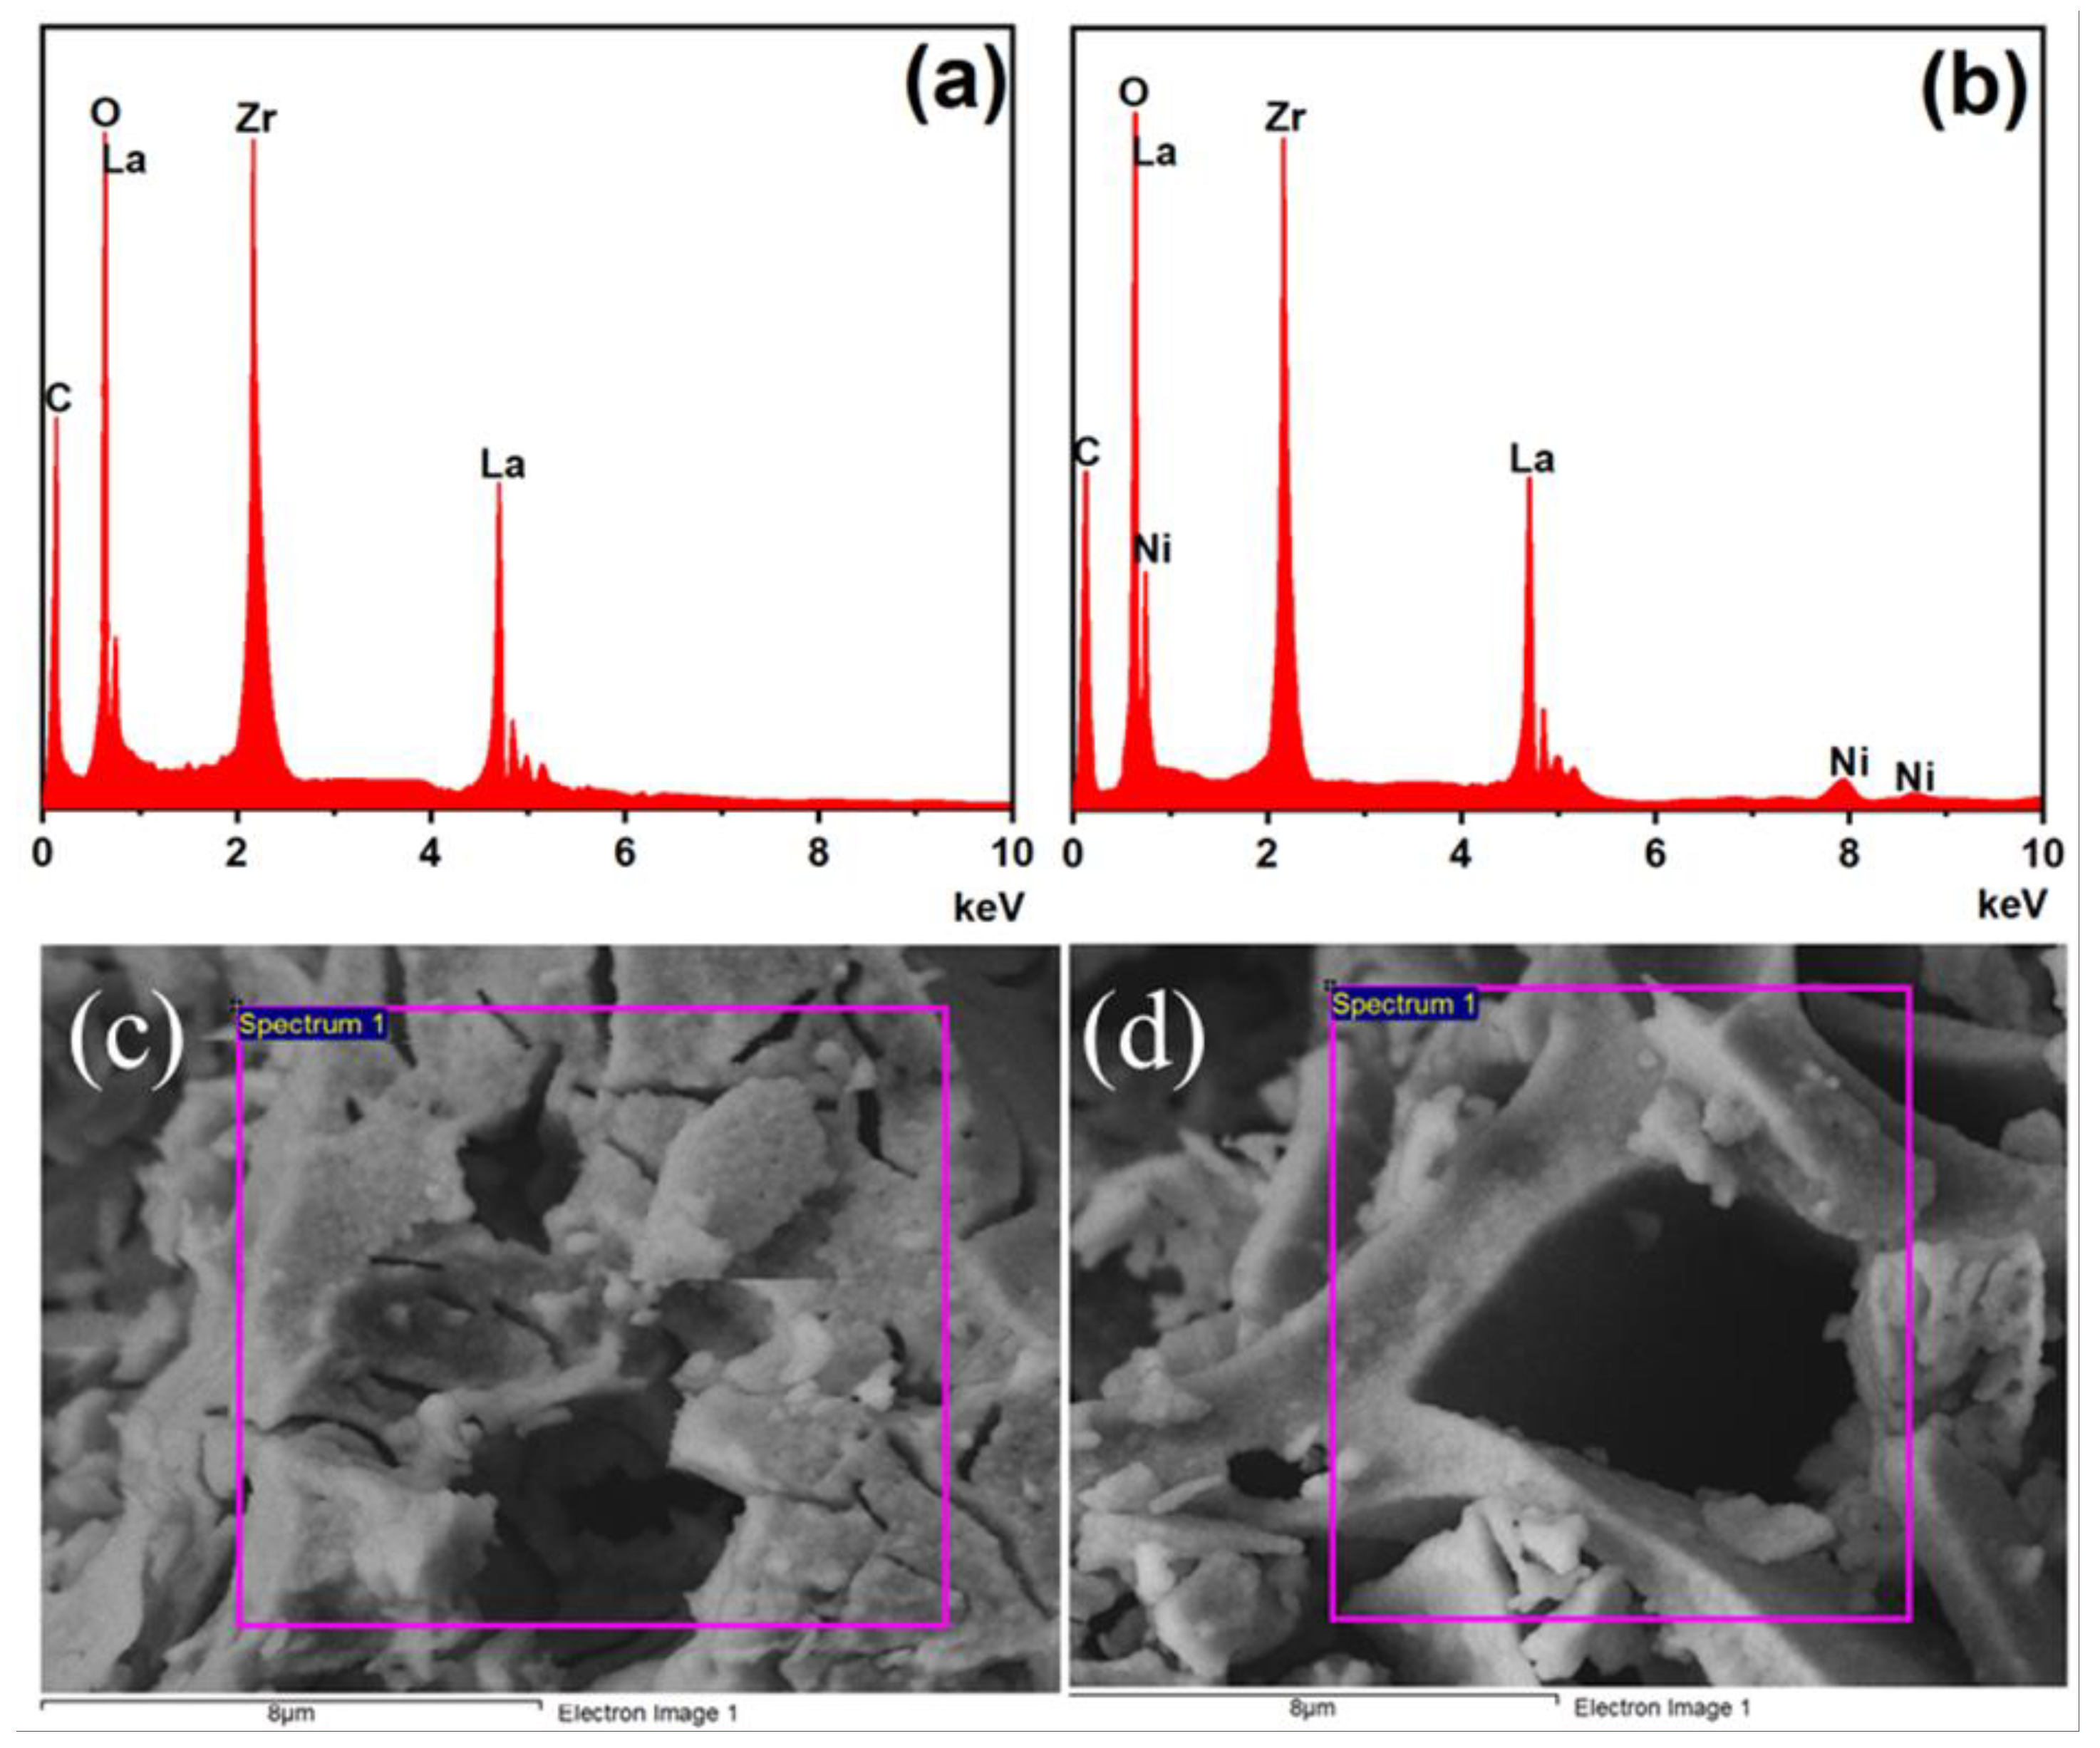
3.7. Chemical Analysis by EDS

Figure 11 shows the EDS spectra and the corresponding local captured areas of the LZ-sg and LZN-sg samples. Figure 11a reveals that the LZ-sg consists of La, Zr, and O elements, whereas Figure 11b shows that the LZN-sg consists of Ni along with La, Zr, and O elements. These results further confirm the purity and the successful formation of pyrochlores. The presence of C comes from adsorbed organic species. Table 5 displays the atomic and weight ratios of both samples, which are close to the theoretical stoichiometric proportions of the respective samples.

4. Conclusions

In summary, La2Zr2-xNixO7 pyrochlores have been fabricated by solid-state and sol-gel techniques, and the effects of the fabrication procedures were used to evaluate the important properties. The findings reveal that the sol-gel method was the easier and more repeatable route for the fabrication of the pure crystalline structure. As-fabricated samples were explored via diverse kinds of techniques. The TG-DTG, XRD, and FT-IR results confirm that the solid-state shows the presence of other oxides along with pyrochlore. On the other hand, the XRD, TG-DTG, FT-IR, BET, UV-vis, EDS, and PL outcomes by the sol-gel route denote the successful production of pure La2Zr2-xNixO7 in the presence of the complexing agent. The samples are cubic in structure, and their Rietveld refinement parameters were in good agreement with the experimental values. The significantly improved optical properties and the photoluminescence are observed by the addition of nickel ions to pristine La2Zr2O7 oxide, which can be applied as photoactive materials for the removal of hazardous materials from environments.

Author Contributions

Conceptualization, N.A. and F.A.; methodology, R.W.; software, N.A. and S.M.; validation, R.W., F.A. and N.A.; formal analysis, B.F.A.; investigation, N.A.; resources, F.A.; data curation, S.M.; writing—original draft preparation, N.A.; writing—review and editing, N.A. and R.W.; visualization, S.M.; supervision, F.A.; project administration, N.A.; funding acquisition, N.A. All authors have read and agreed to the published version of the manuscript.

Funding

NPST project (14-PET851-02).

Institutional Review Board Statement

Not applicable.

Informed Consent Statement

Not applicable.

Data Availability Statement

Not applicable.

Acknowledgments

The authors would like to extend their sincere appreciation to King Saud University for its funding for this NPST project (14-PET851-02).

Conflicts of Interest

The authors declare no conflict of interest.

References

  1. Chakoumakos, B.C. Systematics of the pyrochlore structure type, ideal A2B2X6Y. J. Solid State Chem. 1984, 53, 120–129. [Google Scholar] [CrossRef]
  2. Pirzada, M.; Grimes, R.W.; Maguire, J.; Sickafus, K. Predictions of strontium accommodation in A2B2O7 pyrochlores. J. Mater. Res. 2002, 17, 2041–2047. [Google Scholar] [CrossRef]
  3. Subramanian, M.A.; Aravamudan, M.A.G.; Subba Rao, G.V. Oxide pyrochlores—A review. Prog. Solid State Chem. 1983, 5, 155. [Google Scholar] [CrossRef]
  4. Heremans, C.; Wuensch, B.J.; Stalick, J.K.; Prince, E. Fast-Ion Conducting Y2(ZryTi1−y)2O7 Pyrochlores: Neutron Rietveld Analysis of Disorder Induced by Zr Substitution. J. Solid State Chem. 1995, 117, 108–121. [Google Scholar] [CrossRef]
  5. Zhang, F.X.; Lang, M.; Tracy, C.; Ewing, R.C.; Gregg, D.J.; Lumpkin, G.R. Incorporation of uraniumin pyrochlore oxides and pressure-induced phase transitions. J. Solid State Chem. 2014, 219, 49–54. [Google Scholar] [CrossRef] [Green Version]
  6. Gaura, S.; Haynesc, D.J.; Spiveya, J.J. Rh, Ni, and Ca substituted pyrochlore catalysts for dry reforming of methane. Appl. Catal. A Gen. 2011, 403, 142–151. [Google Scholar] [CrossRef]
  7. Bhattar, S.; Abedin, M.A.; Shekhawat, D.; Haynes, D.J.; Spivey, J.J. The effect of La substitution by Sr- and Ca- in Ni substi-tuted Lanthanum Zirconate pyrochlore catalysts for dry reforming of methane. Appl. Catal. A Gen. 2020, 602, 117721. [Google Scholar] [CrossRef]
  8. Zhong, F.; Zhao, J.; Shi, L.; Cai, G.; Zheng, Y.; Zheng, Y.; Xiao, Y.; Jiang, L. Pyrochlore Pr2Zr1.95In0.05O7+δ oxygen conductors: De-fect-induced electron transport and enhanced NO2 sensing performances. Electrochim. Acta 2019, 293, 338–347. [Google Scholar] [CrossRef]
  9. Lee, K.-S.; Seo, D.-K.; Whangbo, M.-H. Structural and Electronic Factors Governing the Metallic and Nonmetallic Properties of the PyrochloresA2Ru2O7−y. J. Solid State Chem. 1997, 131, 405–408. [Google Scholar] [CrossRef]
  10. Shafique, M.; Kennedy, B.J.; Iqbal, Y.; Ubic, R. The effect of B-site substitution on structural transformation and ionic conductivity in Ho2(ZryTi1−y)2O7. J. Alloys Compd. 2016, 671, 226–233. [Google Scholar] [CrossRef]
  11. Oh, S.H.; Black, R.; Pomerantseva, E.; Lee, J.-H.; Nazar, L. Synthesis of a metallic mesoporous pyrochlore as a catalyst for lithium–O2 batteries. Nat. Chem. 2012, 4, 1004–1010. [Google Scholar] [CrossRef]
  12. Mansingh, S.; Acharya, R.; Martha, S.; Parida, K.M. Pyrochlore Ce2Zr2O7 decorated over rGO: A photocatalyst that proves to be efficient towards the reduction of 4-nitrophenol and degradation of ciprofloxacin under visible light. Phys. Chem. Chem. Phys. 2018, 20, 9872–9885. [Google Scholar] [CrossRef]
  13. Ajabshir, S.Z.; Salehi, Z.; Niasari, M.S. Synthesis of dysprosium cerate nanostructures using Phoenix dactylifera extract as novel green fuel and investigation of their electrochemical hydrogen storage and Coulombic efficiency. J. Clean. Prod. 2019, 215, 480–487. [Google Scholar] [CrossRef]
  14. Christopher, J.; Swamy, C.S. Surface characterization and catalytic activity of Ln2Ti2O7 (Ln = Y, Sm, Gd and Tb). J. Mater. Sci. 1991, 26, 4966–4970. [Google Scholar] [CrossRef]
  15. Gaudet, J.; Smith, E.M.; Dudemaine, J.; Beare, J.; Buhariwalla, C.R.C.; Butch, N.P.; Stone, M.B.; Kolesnikov, A.I.; Xu, G.; Yahne, D.R.; et al. Quantum Spin Ice Dynamics in the Dipole-Octupole Pyrochlore Magnet Ce2Zr2O7. Phys. Rev. Lett. 2019, 122, 187201. [Google Scholar] [CrossRef] [Green Version]
  16. Cheng, J.; Li, J.; Ma, C.; Hao, Z. Catalytic combustion of methane over La2TM0.3Zr1.7O7−δ (TM = Mn, Fe, and Co) pyrochlore oxides. Catal. Commun. 2009, 10, 1170–1173. [Google Scholar] [CrossRef]
  17. Liu, C.-J.; Ye, J.; Jiang, J.; Panet, Y. Progresses in the Preparation of Coke Resistant Ni-based Catalyst for Steam and CO2 Reform-ing of Methane. ChemCatChem 2011, 3, 529–541. [Google Scholar] [CrossRef]
  18. Ramachandran, C.S.; Balasubramanian, V.; Ananthapadmanabhan, P.V. Thermal cycling behavior of plasma sprayed lanthanum zirconate based coatings under concurrent infiltration by a molten glass concoction. Ceram. Int. 2013, 39, 1413–1431. [Google Scholar]
  19. Urban, S.; Djerdj, I.; Dolcet, P.; Chen, L.; Möller, M.; Khalid, O.; Camuka, H.; Ellinghaus, R.; Li, C.; Gross, S.; et al. In Situ Study of the Oxygen-Induced Transformation of Pyrochlore Ce2Zr2O7+x to the κ-Ce2Zr2O8 Phase. Chem. Mater. 2017, 29, 9218–9226. [Google Scholar] [CrossRef]
  20. Modeshia, D.R.; Walton, R.I. Solvothermal synthesis of perovskites and pyrochlores: Crystallisation of functional oxides under mild conditions. Chem. Soc. Rev. 2010, 39, 4303–4325. [Google Scholar] [CrossRef]
  21. Wang, C.; Wang, Y.; Wang, L.; Sun, X.; Yang, C.; Zou, Z.; Li, X. Hydrothermal assisted synthesis and hot-corrosion resistance of nano lanthanum zirconate particles. Ceram. Int. 2014, 40, 3981–3988. [Google Scholar] [CrossRef]
  22. Omata, T.; Ikeda, K.; Tokashiki, R.; Otsuka-Yao-Matsuo, S. Proton solubility for La2Zr2O7 with a pyrochlore structure doped with a series of alkaline-earth ions. Solid State Ion. 2004, 167, 389–397. [Google Scholar] [CrossRef]
  23. Bai, Y.; Lu, L.; Bao, J. Synthesis and Characterization of Lanthanum Zirconate Nanocrystals Doped with Iron Ions by a Salt-Assistant Combustion Method. J. Inorg. Organomet. Polym. Mater. 2011, 21, 590–594. [Google Scholar] [CrossRef]
  24. Joulia, A.; Vardelle, M.; Rossignol, S. Synthesis and thermal stability of Re2Zr2O7, (Re = La, Gd) and La2(Zr1−xCex)2O7−δ com-pounds under reducing and oxidant atmospheres for thermal barrier coatings. J. Eur. Ceram. Soc. 2013, 33, 2633–2644. [Google Scholar] [CrossRef]
  25. Tang, H.; Sun, H.; Chen, D.; Jiao, X. Fabrication and characterization of nanostructured La2Zr2O7 fibers. Mater. Lett. 2012, 70, 48–50. [Google Scholar] [CrossRef]
  26. Liu, C.; Zhang, J.; Deng, S.; Wang, P.; He, Y. Direct preparation of La2Zr2O7 microspheres by cathode plasma electrolysis. J. Colloid Interface Sci. 2016, 474, 146–150. [Google Scholar] [CrossRef]
  27. Saradhi, M.P.; Ushakov, S.V.; Navrotsky, A. Fluorite-pyrochlore transformation in Eu2Zr2O7—Direct calorimetric measurement of phase transition, formation and surface enthalpies. RSC Adv. 2012, 2, 3328–3334. [Google Scholar] [CrossRef]
  28. Zhang, X.; Fang, X.; Feng, X.; Li, X.; Liu, W.; Xu, X.; Zhang, N.; Gao, Z.; Wang, X.; Zhou, W. Ni/Ln2Zr2O7 (Ln = La, Pr, Sm and Y) catalysts for methane steam reforming: The effects of A site replacement. Catal. Sci. Technol. 2017, 7, 2729–2743. [Google Scholar] [CrossRef]
  29. Saitzek, S.; Shao, Z.; Bayart, A.; Ferri, A.; Huvé, M.; Roussel, P.; Desfeux, R. Ferroelectricity in La2Zr2O7 thin films with a frustrated pyrochlore-type structure. J. Mater. Chem. C 2014, 2, 4037–4043. [Google Scholar] [CrossRef]
  30. Wang, Y.; Zhu, J.; Zhang, L.; Yang, X.; Lu, L.; Wang, X. Preparation and characterization of perovskite LaFeO3 nanocrystals. Mater. Lett. 2006, 60, 1767–1770. [Google Scholar] [CrossRef]
  31. Qi, X.; Zhou, J.; Yue, Z.; Gui, Z.; Li, L. Auto-combustion synthesis of nanocrystalline LaFeO3. Mater. Chem. Phys. 2003, 78, 25–29. [Google Scholar] [CrossRef]
  32. Carbonin, S.; Martignago, F.; Menegazzo, G.; Negro, A. X-ray single-crystal study of spinels: In situ heating. Phys. Chem. Miner. 2002, 29, 503–514. [Google Scholar] [CrossRef]
  33. Kumar, L.; Kumar, P.; Narayan, A.; Kar, M. Rietveld analysis of XRD patterns of different sizes of nanocrystalline cobalt ferrite. Int. Nano Lett. 2013, 3, 8. [Google Scholar] [CrossRef] [Green Version]
  34. Kumar, L.; Kar, M. Effect of La3+ substitution on the structural and magnetocrystalline anisotropy of nanocrystalline cobalt ferrite (CoFe2-xLaxO4). Ceram. Int. 2012, 38, 4771–4782. [Google Scholar] [CrossRef]
  35. Hatnean, M.C.; Lees, M.; Balakrishnan, G. Growth of single-crystals of rare-earth zirconate pyrochlores, Ln2Zr2O7 (with Ln = La, Nd, Sm, and Gd) by the floating zone technique. J. Cryst. Growth 2015, 418, 1–6. [Google Scholar] [CrossRef]
  36. Culity, B.D. Elements of X-ray Diffraction, 2nd ed.; Addison-Wesley Series; Addison-Wesley: Boston, MA, USA, 1978. [Google Scholar]
  37. Suryanarayana, C.; Grant Nortan, M. X-ray Diffraction: A Practical Approach; Plenum Publishing Corporation: New York, NY, USA, 1998. [Google Scholar]
  38. Tangwiwat, S.; Milne, S.J. Barium titanate sols prepared by a diol-based sol–gel route. J. Non-Cryst. Solids 2005, 351, 976–980. [Google Scholar] [CrossRef]
  39. Slamovich, E.B.; Aksay, I.A. Structure Evolution in Hydrothermally Processed (<100 °C) BaTiO3 Films. J. Am. Ceram. Soc. 1996, 79, 239. [Google Scholar] [CrossRef]
  40. Thiagarajan, K.; Theerthagiri, J.; Senthil, R.A.; Arunachalam, P.; Madhavan, J.; Ghanem, M.A. Synthesis of Ni3V2O8@graphene oxide nanocomposite as an efficient electrode material for supercapacitor applications. J. Solid State Electrochem. 2018, 22, 527–536. [Google Scholar] [CrossRef]
  41. Kambale, R.C.; Song, K.M.; Koo, Y.S.; Hur, N. Low temperature synthesis of nanocrystalline Dy3+ doped cobalt ferrite: Structural and magnetic properties. J. Appl. Phys. 2011, 110, 053910. [Google Scholar] [CrossRef]
  42. Dos Santos, M.; Lima, R.; Riccardi, C.; Tranquilin, R.; Bueno, P.; Varela, J.; Longo, E. Preparation and characterization of ceria nanospheres by microwave-hydrothermal method. Mater. Lett. 2008, 62, 4509–4511. [Google Scholar] [CrossRef]
  43. Jiang, H.; Sun, T.; Li, C.; Ma, J. Peapod-like nickel@mesoporous carbon core-shell nanowires: A novel electrode material for supercapacitors. RSC Adv. 2011, 1, 954–957. [Google Scholar] [CrossRef]
  44. Jayaraman, V.; Mani, A. Interfacial coupling effect of high surface area Pyrochlore like Ce2Zr2O7 over 2D g-C3N4 sheet pho-toactive material for efficient removal of organic Pollutants. Sep. Purif. Technol. 2020, 235, 116242. [Google Scholar] [CrossRef]
  45. Bencina, M.; Valant, M. Bi2Ti2O7-based pyrochlore nanoparticles and their superior photocatalytic activity under visible light. J. Am. Ceram. Soc. 2018, 101, 82–90. [Google Scholar] [CrossRef]
  46. Gan, Y.P.; Qin, H.P.; Huang, H.; Tao, X.Y.; Fang, J.W.; Zhang, W.K. Preparation and Photocatalytic Activity of Rutile TiO2-Graphene Composites. Acta Phys. Chim. Sin. 2013, 29, 403–410. [Google Scholar]
  47. Ong, W.J.; Tan, L.L.; Chai, S.P.; Yong, S.T.; Mohamed, A.R. Facet-dependent photocatalytic properties of TiO2-based compo-sites for energy conversion and environmental remediation. ChemSusChem 2014, 7, 690–719. [Google Scholar] [CrossRef] [PubMed]
  48. Motlagh, P.Y.; Khataee, A.; Sadeghi Rad, T.; Hassani, A.; Joo, S.W. Fabrication of ZnFe-layered double hydroxides with graphene oxide for efficient visible light photocatalytic performance. J. Taiwan Inst. Chem. Eng. 2019, 101, 186–203. [Google Scholar] [CrossRef]
  49. Pugazhenthiran, N.; Mangalaraja, R.V.; Sathishkumar, P.; Murugesan, S.; Muneeswaran, T.; Pandiyarajan, T.; Naveenraj, S.; Contreras, D.; Anandan, S. Green synthesis of porous Au–Nx-TiO2 nanospheres for solar light induced photocatalytic degradation of diazo and triazo dyes and their eco-toxic effects. New J. Chem. 2018, 42, 18717–18728. [Google Scholar] [CrossRef]
Figure 1. TGA-DTG curves of: (a,b) LZ-s and LNZ-s by the solid-state route; and (c) FT-IR spectrum of LZN-s after thermal degradation.
Crystals 11 01463 g001
Figure 2. TGA-DTG curves of (a,b) LZ-sg and LNZ-sg by the sol-gel route; and (c) FT-IR spectra after thermal degradation.
Crystals 11 01463 g002
Figure 3. XRD patterns of La2Zr2-xNixO7 (x = 0.0, 0.5) fabricated by the (a) solid-state and (b) sol-gel routes.
Crystals 11 01463 g003
Figure 4. XRD patterns of La2Zr2-xO7 (x = 0.0 and 0.5) oxides corresponding to the (222) hkl plane.
Crystals 11 01463 g004
Figure 5. Rietveld-refined XRD patterns for sample LZ-sg and LZN-sg, calcined at 1200 °C.
Crystals 11 01463 g005
Figure 6. W–H plot of LZ-sg and LZN-sg (• = correct data point) pyrochlores.
Crystals 11 01463 g006
Figure 7. FT-IR spectra of LZ-sg and LZN-sg pyrochlores.
Crystals 11 01463 g007
Figure 8. (a) BET isotherms; and (b) PSD of LZ-sg and LZN-sg pyrochlores.
Crystals 11 01463 g008
Figure 9. (a) UV–Vis spectra; and (b) band gap energy of LZ-sg (Green line) and LZN-sg (Blue line) pyrochlores.
Crystals 11 01463 g009
Figure 10. Photoluminescence emission spectra of LZ-sg and LZN-sg at two excitation wavelengths: (a) 350 nm, and (b) 400 nm, respectively.
Crystals 11 01463 g010
Figure 11. EDS spectra (a,b) and the corresponding captured area (c,d) of LZ-sg and LZN-sg pyrochlores.
Crystals 11 01463 g011
Table 1. Summary of various parameters of La2Zr2-xNixO7 pyrochlores.
SampleVolume
(Å)3
Unit Cell (Å)Crystallite Size (nm)R-FactorsGOF
a = b = cS. MethodW–H MethodRpRexpRwpχ2
LZ-sg1271.9710.8349 ± 0.000140.8035.1513.1813.4016.271.47
LZN-sg1271.7310.8342 ± 0.000163.0059.3612.0513.8615.351.21
Table 2. Typical atomic coordinate (x, y, z), sites and occupancies of different atoms for La2Zr2-xNixO7 pyrochlores.
SampleAtomsSitexyzOccupancy
LZ-sg
La16c0001
Zr16d0.50.50.51
O148f0.420.1250.1251
O28a0.1250.1250.1251
LZN-sg
La16c0001
Zr/Ni16d0.50.50.50.9430
O148f0.420.1250.1250.9991
O28a0.1250.1250.1250.9933
Table 3. Summary of porosity measurements of La2Zr2-xNixO7 pyrochlores.
SampleSBET (cm2 g−1)Pore Volume (cm3 g−1)Average Pore Diameter (nm)
LZ-sg2.350.007421.11
LZN-sg2.050.007924.02
Table 4. Summary of photoluminescence emission spectra of La2Zr2-xNixO7 pyrochlores.
SampleExcitation at 350 nmExcitation at 400 nmBEBE a
350 nm400 nm
LZ-sg4156574506352.982.72.9
LZN-sg4156574506352.982.73.2
a Optical band gab energy calculated by the Tauc method, from UV-DRS data.
Table 5. Chemical composition of of La2Zr2-xNixO7 pyrochlores by EDS analysis.
SampleWeight%Atomic%
LaZrNiOLaZrNiO
LZ-sg34.9834.43 25.809.5414.29 61.06
LNZ-sg39.8527.145.1424.0611.5011.933.5160.23
Publisher’s Note: MDPI stays neutral with regard to jurisdictional claims in published maps and institutional affiliations.

