
Sensing Glucose Concentration Using Symmetric Metasurfaces under Oblique Incident Terahertz Waves


Biomedical Engineering Department, College of Engineering, Imam Abdulrahman Bin Faisal University, Dammam 34212, Saudi Arabia
Crystals 2021, 11(12), 1578; https://0-doi-org.brum.beds.ac.uk/10.3390/cryst11121578
Submission received: 13 November 2021
/
Revised: 14 December 2021
/
Accepted: 15 December 2021
/
Published: 17 December 2021
(This article belongs to the Special Issue Advances in Metamaterials)
Abstract
:In this article, a planar metamaterial sensor designed at terahertz (THz) frequencies is utilized to sense glucose concentration levels that cover hypoglycemia, normal, and hyperglycemia conditions that vary from 54 to 342 mg/dL. The sensor was developed using a symmetric complementary split rectangular resonator at an oblique incidence angle. The resonance frequency shift was used as a measure of the changes in the glucose level of the samples. The increase in the glucose concentration level exhibited clear and noticeable redshifts in the resonance frequency. For instance, a 67.5 GHz redshift has been observed for a concentration level of 54 mg/dL and increased up to 122 GHz for the 342 mg/dL concentration level. Moreover, a high sensitivity level of 75,700 nm/RIU was observed for this design. In the future, the proposed THz sensors may have potential applications in diagnosing hypocalcemia and hyperglycemia cases.
1. Introduction
Recently, diabetes has become one of the main reasons behind the death of millions of people around the world [1,2]. In 2019, the World Health Organization and the international diabetes federation reported that diabetes cases reached 463 million worldwide [3,4]. When there is not enough insulin produced by the pancreas or the insulin is not delivered to the cells, the situation is classified as type 1 and type 2 diabetes, respectively. While a glucose level in the blood between 70 and 120 mg/dL when fasting is considered normal, less, or more than this range, the person has hypoglycemia and hyperglycemia, respectively [5,6,7]. Therefore, monitoring the glucose level is crucial to prevent a lot of well-known consequences of abnormal glucose levels in the blood [8]. It can be observed using invasive, minimally invasive, and non-invasive devices [9,10,11,12,13,14].
Recently, many research activities have been carried out to propose different kinds of noninvasive devices, where the measurements can be performed without pain or the need of needles and, most importantly, can be continuous [5,6,15,16]. Among a plethora of different techniques proposed for glucose level measurements, optical methods at different wavelengths have shown high potential for future continuous glucose monitoring (CGM) devices [9]. More specifically, terahertz (THz) technology has attracted a lot of attention recently due to the very low photon energy at THz frequencies, and the fact that many biomolecules have very clear fingerprints within the THz band [17,18,19,20]. More interestingly, sensing various samples and analytes can be carried out in a label-free fashion [19,21,22,23].
However, there is a hurdle to achieving the potential of label-free sensing at THz frequencies due to the large difference between the relatively large light excitation wavelength and the small quantity of the samples. To address this challenge, biosensors that are sensitive enough for a given analyte with a certain dielectric constant have to be designed that use a small quantity of the analytes and, at the same time, have a very high level of field confinement in order to increase the light–matter interaction. Fortunately, a number of configurations have been proposed in recent years [22,24]. Planar metamaterials or metasurfaces comprised of arrays of identical split rectangular resonators have been considered as potential candidates for such sensing applications [24,25,26,27]. When the sensor surface is coated with the analyte, a redshift of the resonance frequency and a change in the resonance depth occur due to the alteration of the dielectric environment. This shift and depth, which corresponds with the refractive index of the analyte, can be utilized to identify the analyte type. A few designs at terahertz frequencies have been proposed to measure the glucose level [28,29,30].
For these sensors to operate effectively, a very high-quality (Q-) factor that correlates with a sharp transition in the frequency response must be achieved to allow the identification of small modifications in the dielectric environment. The Q-factor has been traditionally correlated with sensor sensitivity [31,32,33,34,35]. The conventional metasurfaces experience a drawback of quite a low Q-factor due to its strong free-space coupling correlated with high radiation losses [25]. To address this problem, various configurations and structures have been developed to minimize the radiation losses [24,26,33]. Several approaches have been suggested to achieve a high Q-factor using asymmetric Fano resonance [36,37], electromagnetic-induced transparency resonance [38,39,40,41], and many other strategies [31,42,43,44,45,46,47,48,49]. In most, if not all, of these structures, the unit cell dimensions must be carefully altered compared to the symmetric structures that in turn lead to low performance when there is a small change in the dimensions due to the fabrication process that is normally unavoidable. Interestingly, simple mesh cells have been utilized under oblique incidence for THz sensing applications [50,51,52]. Interestingly, a magnetic response has been shown in 2004 using metasurfaces consisting of double split-ring resonators (SRRs) with a single slit in each ring under oblique incidence excitation [53]. Moreover, the effective properties of such a configuration have been studied as well [54]. Furthermore, various asymmetric resonators and supercells consisting of dissimilar SRRs have been investigated under oblique illumination [43,55,56,57]. Remarkably, a very high Q-factor resonance has been observed under oblique incidence angles that illuminated an array of metalized crosses [58]. However, none of these studies investigated symmetric SRRs with two slits under oblique illumination. Hence, the question remains, can we design a symmetric split rectangular resonator structure excited under oblique incidence that can be easily fabricated and feature a high-quality factor and sensitivity?
Therefore, in this paper, a terahertz metasurface with a symmetric complementary split rectangular resonator (CSRR) with respect to the excitation field is proposed. The structure can be easily fabricated due to its simple configuration. To investigate the sharpness of the induced resonance, the transmission and reflection frequency response of the structure under different incidence angles is discussed in detail. More importantly, the response to different glucose concentrations has been presented by sweeping the glucose concentration level from 54 to 342 mg/dL, which covers the range from the hypoglycemia case to the hypercalcemia case. Moreover, we study the sensitivity of the sensor by sweeping the coated layer refractive index. Furthermore, we discuss the effect of the metal conductivity on the sharpness of the frequency response
2. Sensor Design and Simulation Methods
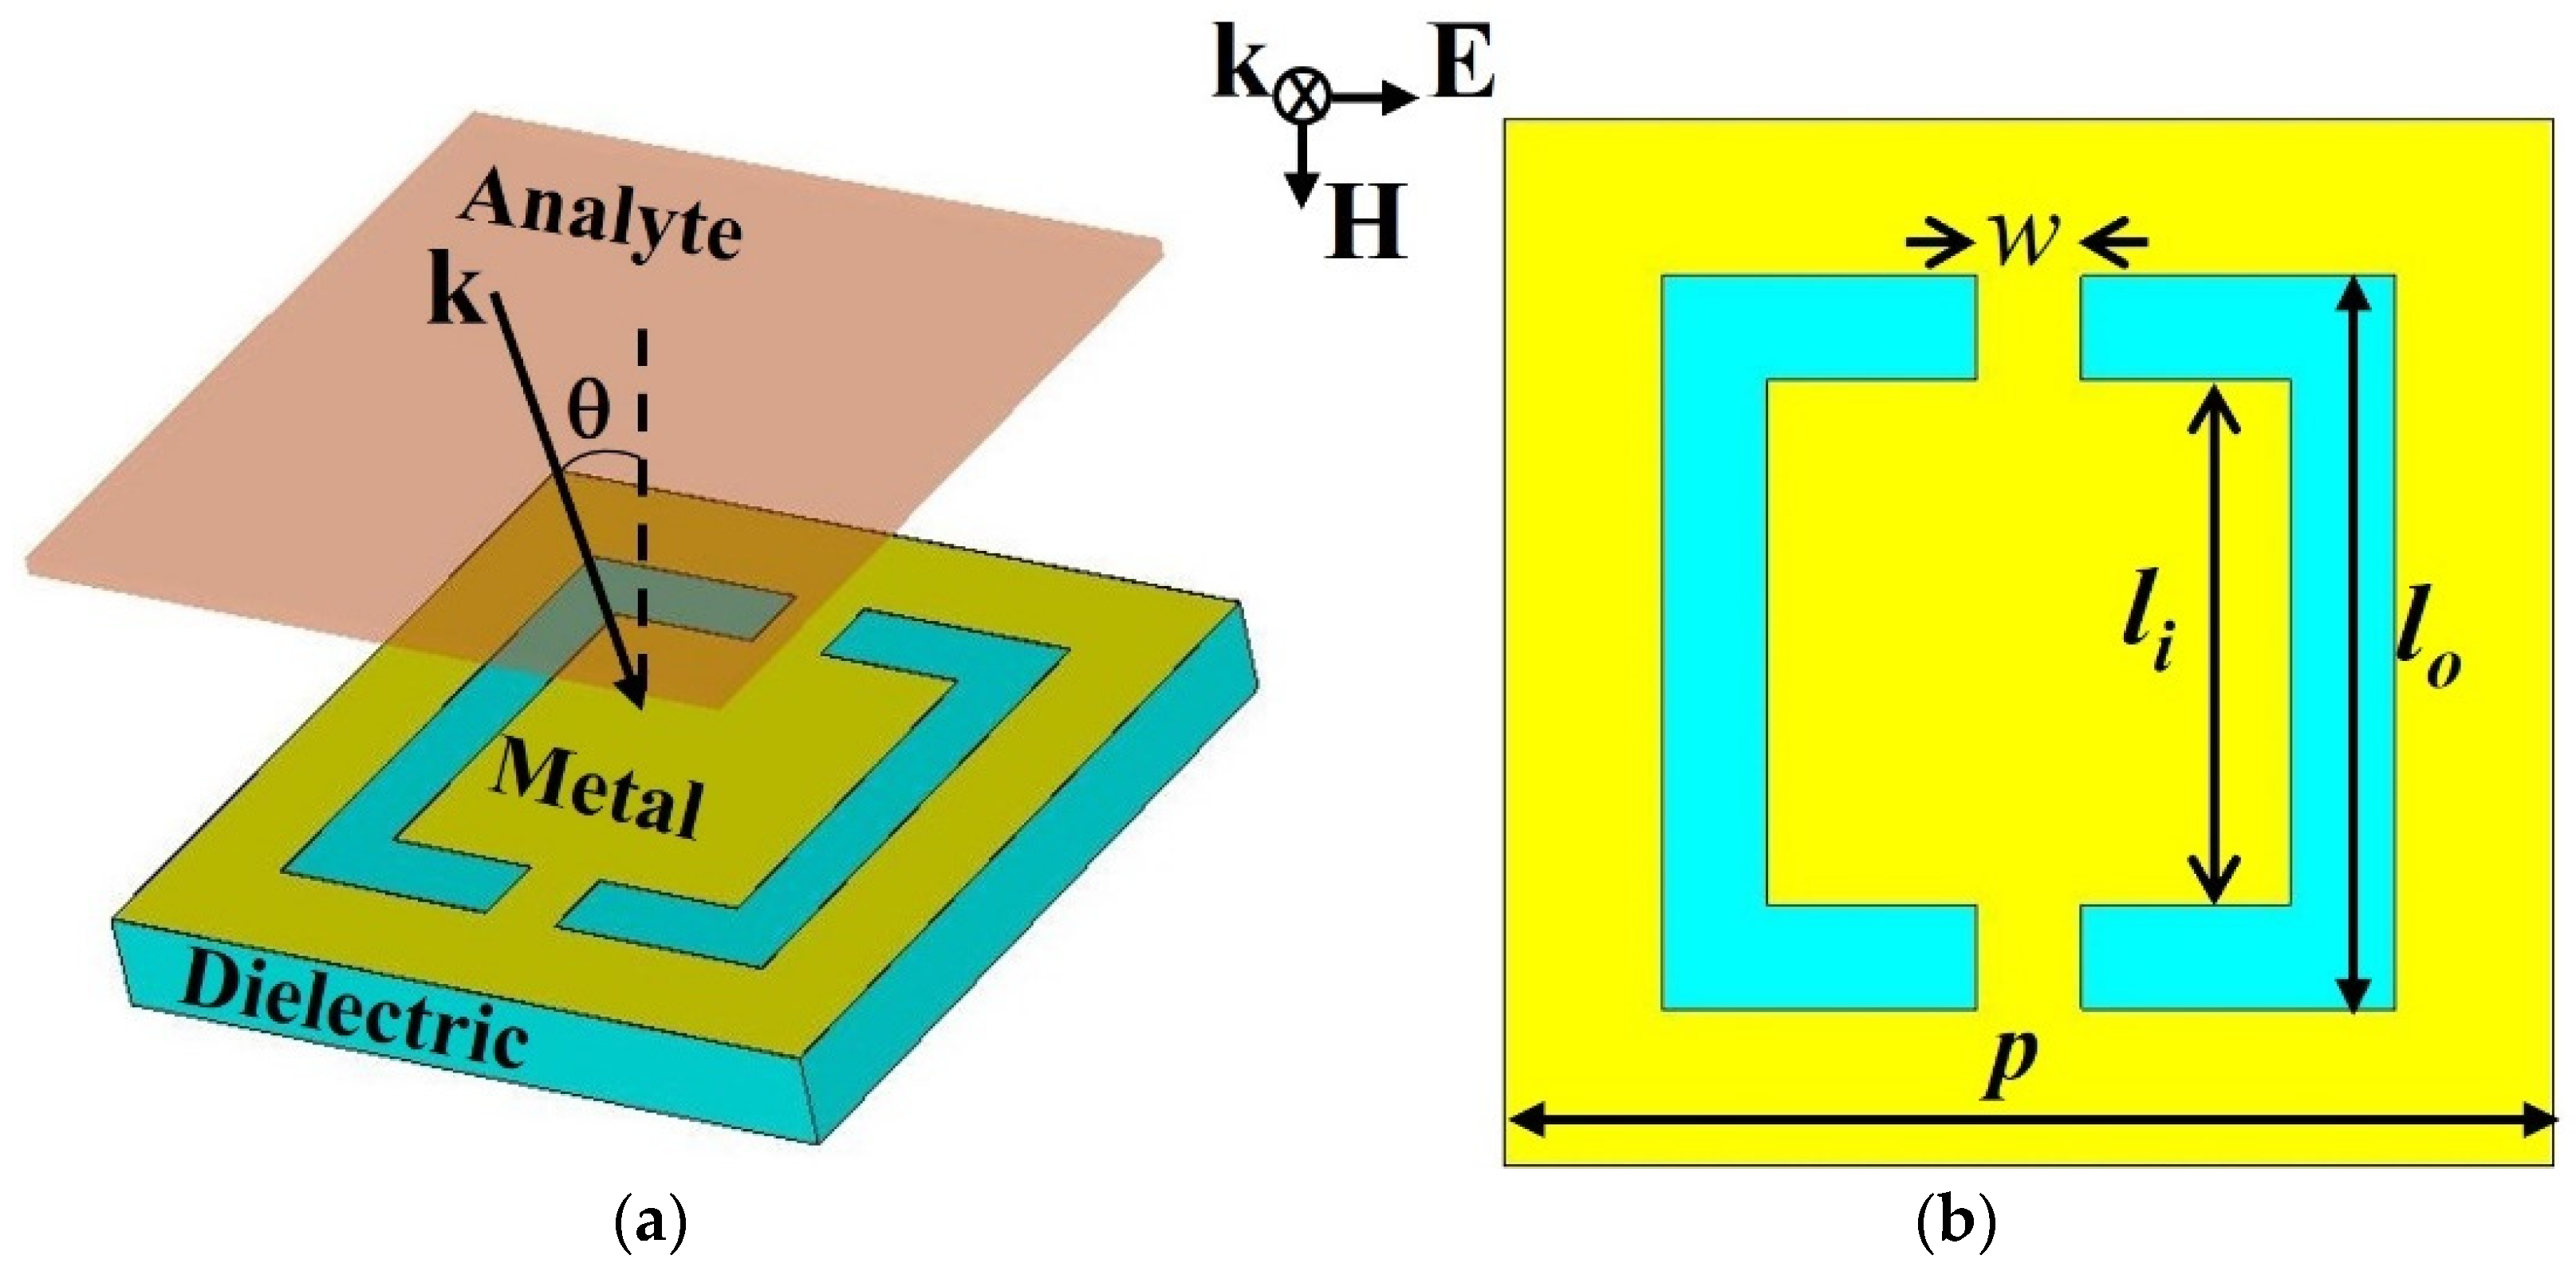
Figure 1 shows the 3D and 2D configurations of the unit cell in parts (a) and (b), respectively. It consists of a complementary split rectangular resonator metalized on a dielectric substrate. To get this design, Babinet’s principle has been employed, and therefore the metallic layer here is shown in a yellow color [59,60,61]. The unidentified sample is coated onto the metalized side and covers the whole area. The geometrical dimensions of the CSRR are shown in Figure 1b with the relevant geometrical dimensions: an outer side length of lo = 140 μm, an inner side length of li = 100 μm, a microstrip line width of w = 20 μm, and a periodicity of p = 200 μm. The substrate is chosen to be a cyclic olefin copolymer with a thickness of 25 μm and a refractive index of 1.53 [27]. Finally, the gold metalized layer thickness is 200 nm. It is worth mentioning that the values of the dielectric constant (εr) of the sample layer have been adopted from Ref. [28], which were taken from Ref. [30], that is based on the characterization of real blood samples. Table 1 shows the exact values of the dielectric constant that were used in the simulations. At each glucose level, three values of the dielectric constant at 0.3, 0.4, and 0.5 THz were entered in the CST package in order to model the dielectric dispersion and fit that with a maximum order of 10 and an error limit of 1%.
The simulations were carried out by utilizing the simulation software Computer Simulation Technology (CST) Microwave Studio (version 2021, https://www.3ds.com/products-services/simulia/products/cst-studio-suite/ (accessed on 20 September 2021)). It is based on a finite integration technique to solve Maxwell equations in the frequency domain. Hence, it is a suitable approach to study structures that feature sharp frequency responses. Hence, the frequency domain solver of the package was used. Periodic boundary conditions have been chosen and the excitation of a plane wave with different incidence angles has been applied to mimic the actual scenario. The electric field is horizontally oriented parallel to the two microstrip lines that are structured in the middle of the top and bottom slots, as illustrated in the inset of Figure 1. Therefore, we should expect the excitation of symmetric dipole resonance under normal incidence. In this paper, the following question is going to be answered: What will happen when this kind of resonator, that is symmetric with respect to the excitation field, is excited in oblique incidence THz waves?
3. Results and Discussion
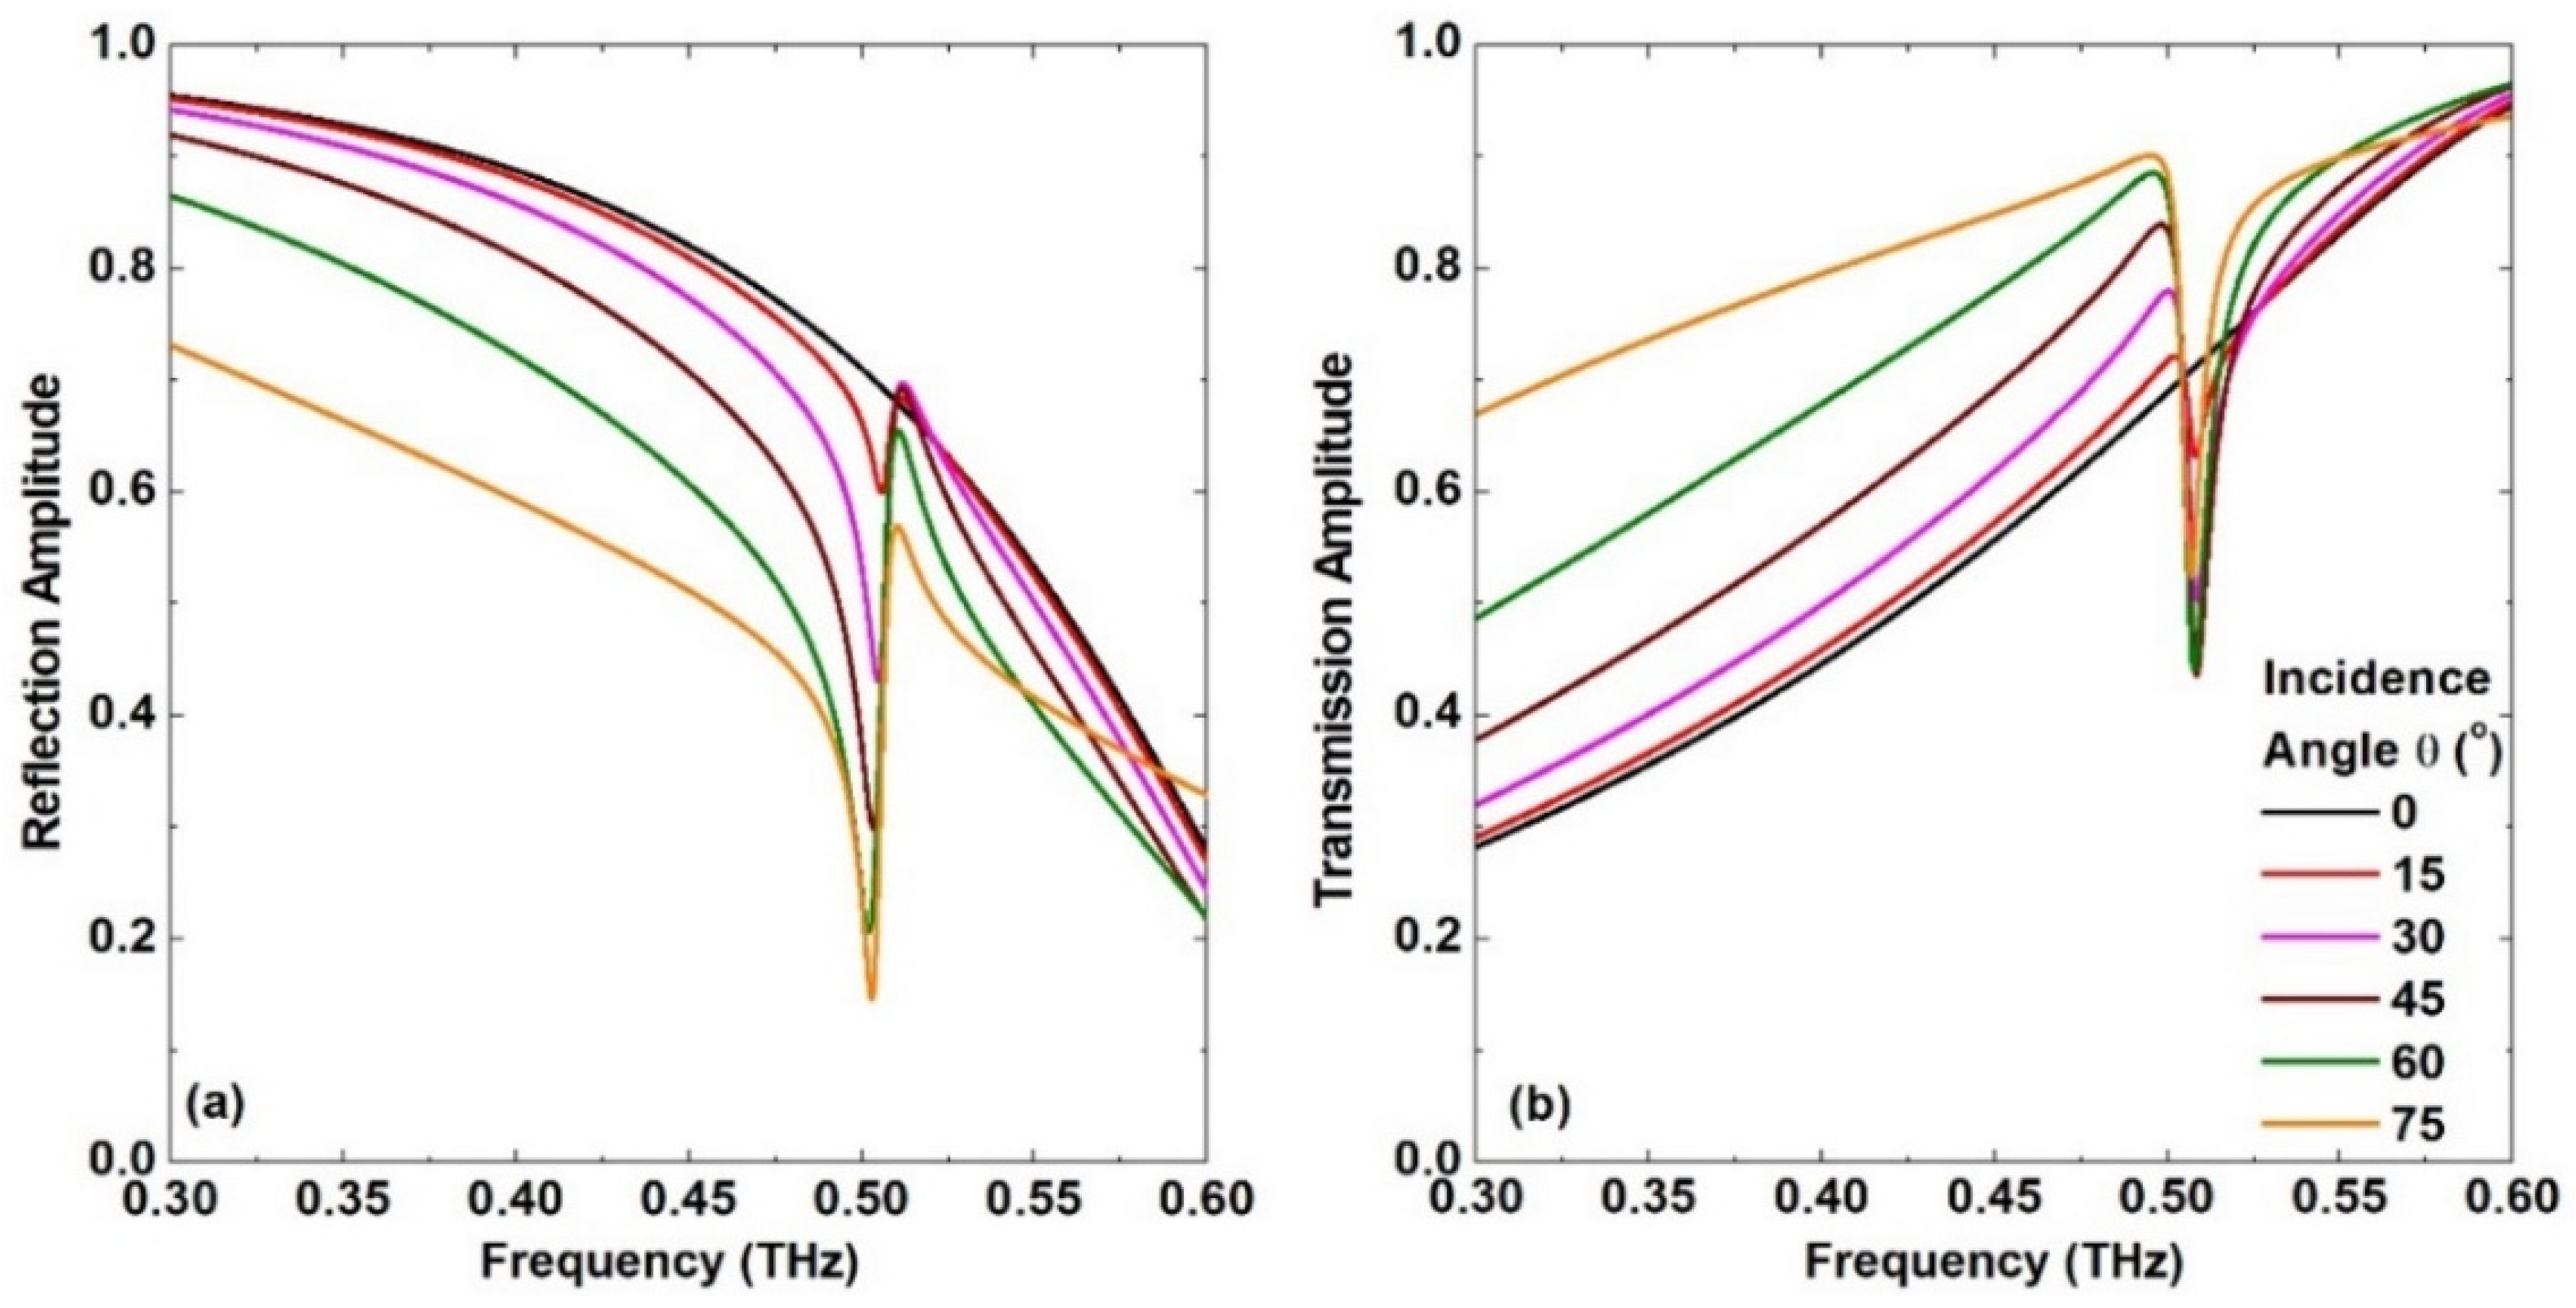
Figure 2 shows the reflection and transmission amplitude spectra for the above structure for a sweep of incident angles (θ) between 0° and 75° with a step of 15°. As expected, when the THz waves excite the symmetric structure under normal incidence (θ = 0°), only the dipole resonance mode at 0.645 THz is excited (not shown within the frequency range in Figure 2).
More interestingly, the excitation of a clear asymmetric resonance is observed around 0.506 THz with a very sharp transition when the incident angle is increased in both the reflection and transmission spectra. Increasing the incidence angle leads to a broad bandwidth and a larger depth of the resonance. For example, when θ = 15°, the spectral response features a bandwidth of 8.18 GHz. Hence, the quality factor that is defined as the ratio of the resonance frequency and the bandwidth is almost 61.9. As the incidence angle increases, the resonance line width and the resonance depth increase as well. To examine the performance of this structure for biosensing, an incident angle of 30° has been chosen for all the results presented in the rest of the paper. To facilitate reliable measurements, a different value of the incidence angle might be chosen based on the dynamic range of the available THz spectrometer and the scan time window that can be measured.
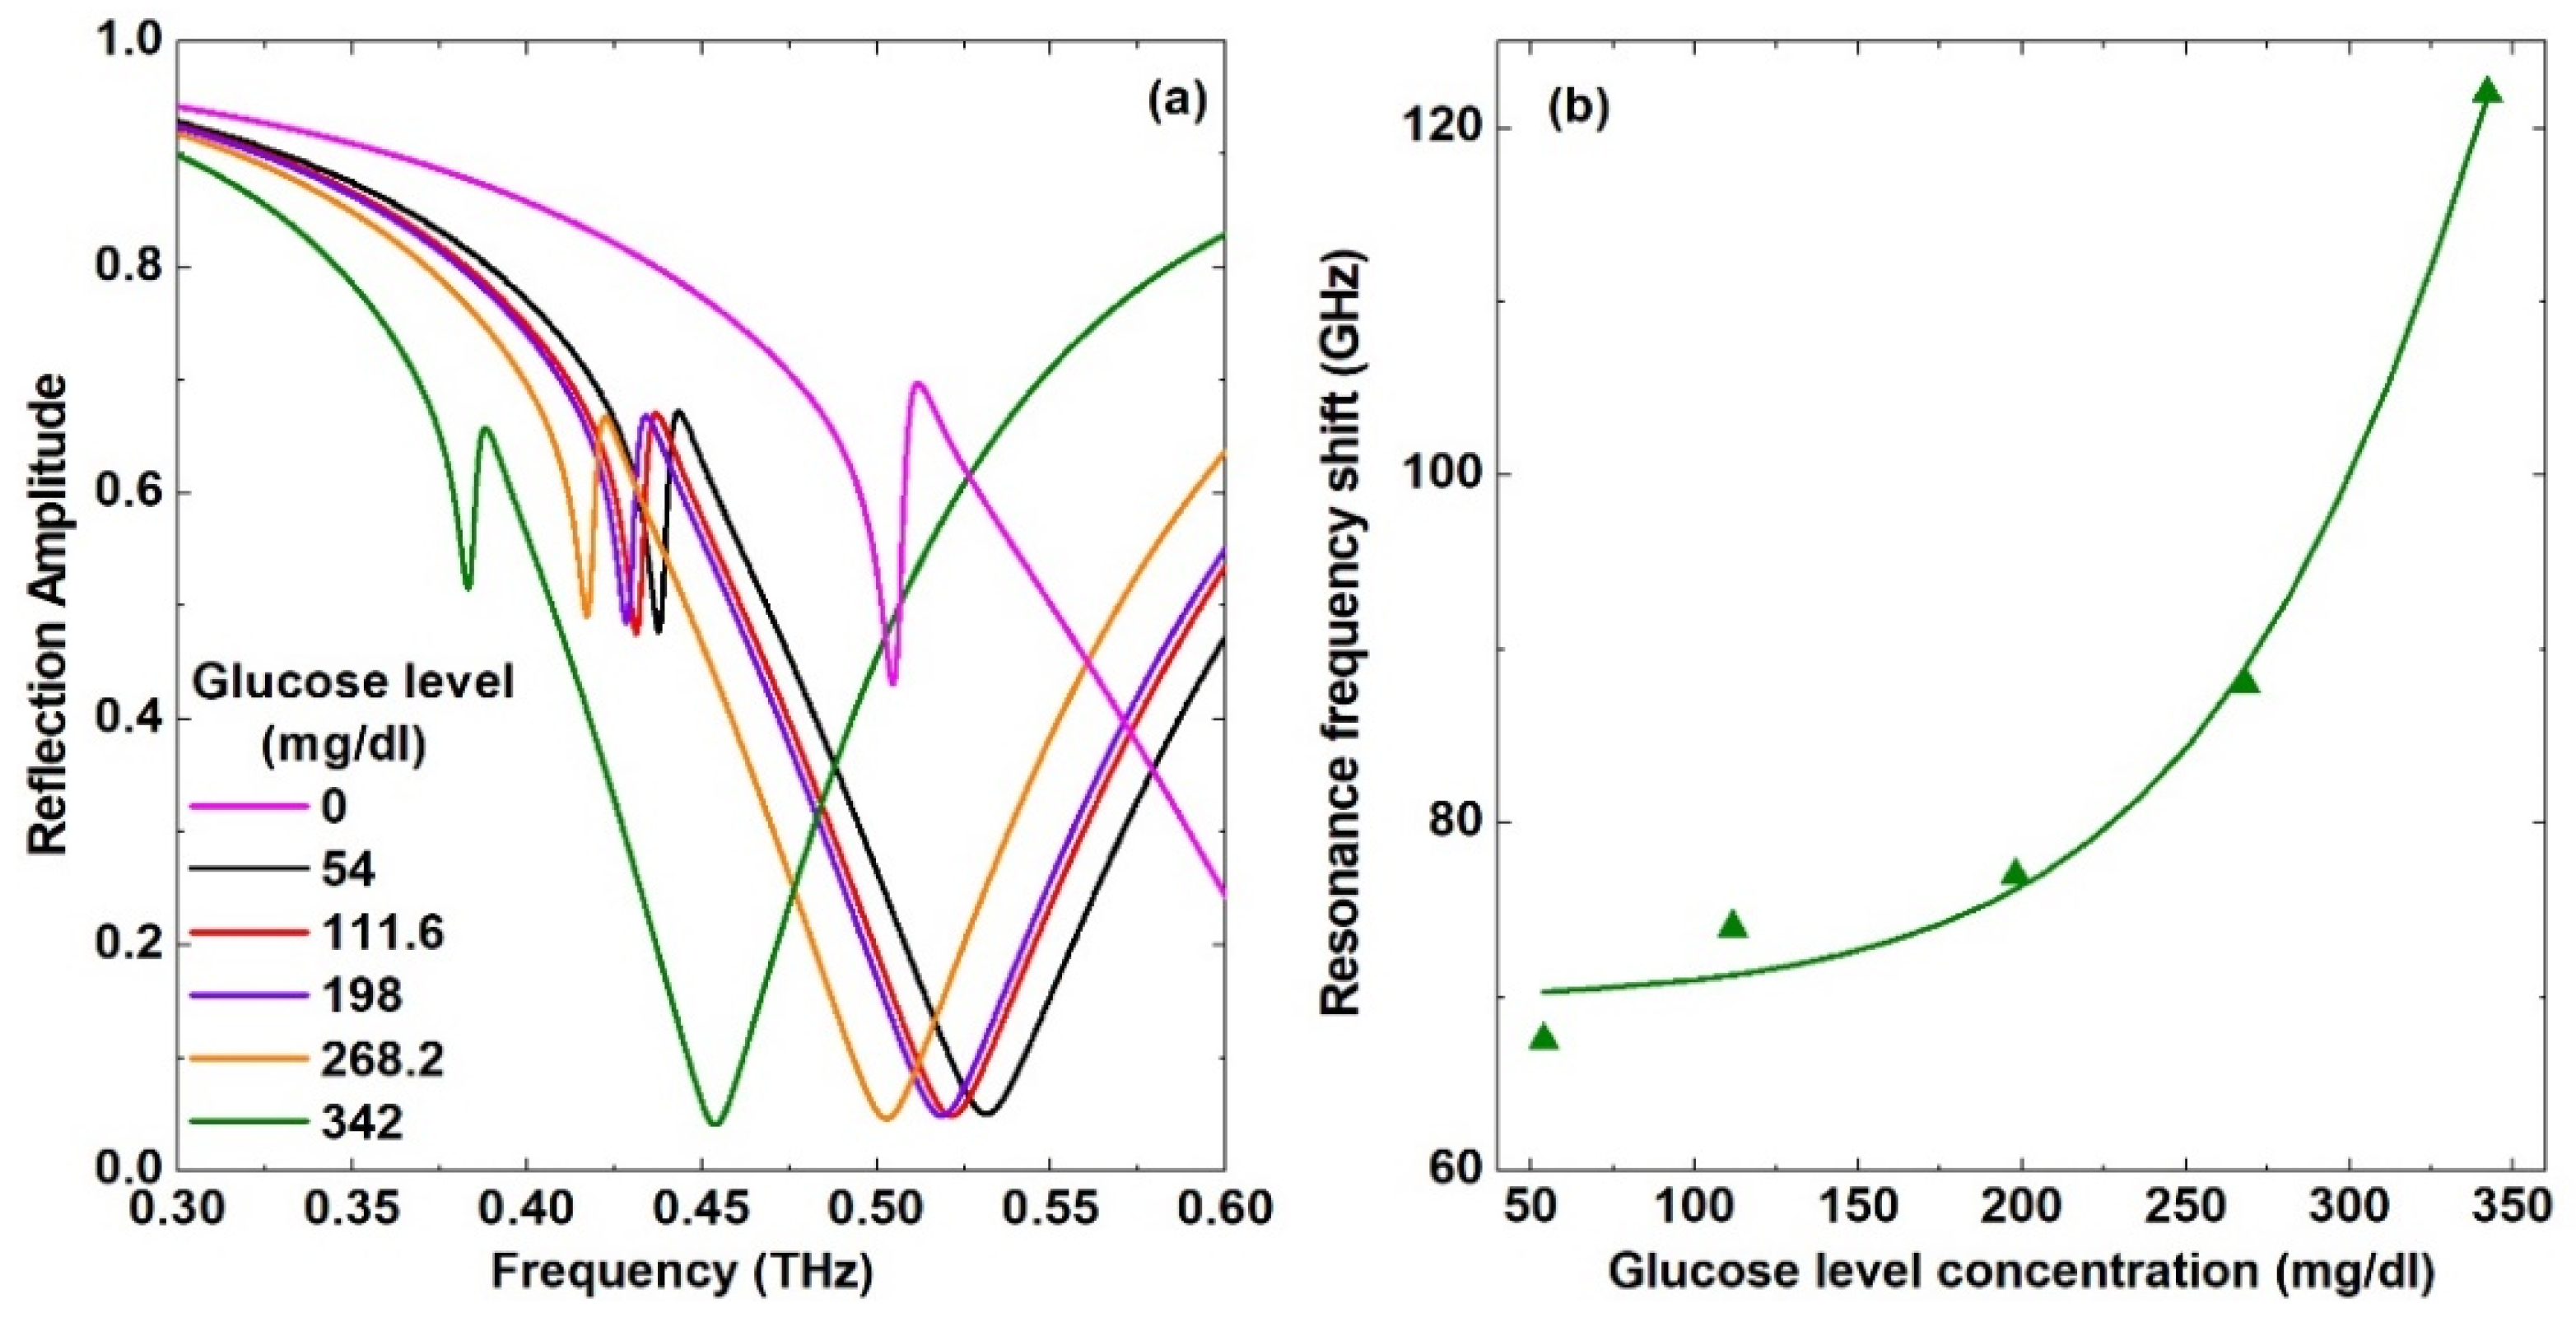
Next, we investigate the performance of the proposed design when a layer of glucose analyte with a different concentration level between 54 and 342 mg/dL and a thickness of 5 μm is coated on top of the metasurface. The reflection spectra are shown in Figure 3a, where a clear redshift is observed as the concentration of the glucose level is increased as a result of the modification in the dielectric environment of the resonators. The redshift in the frequency response is 67.5, 74, 77, 88, and 122 GHz for the glucose concentration levels of 54, 111.6, 198, 268.2, and 342 g/dL, respectively. It is noted that there is a significant redshift even with a small concentration level of 54 mg/dL. This means that this sensor can be utilized to measure small glucose concentration levels in the hypocalcemia range that are considered very dangerous for diabetic people. Moreover, there is a clear increase in the shift when the glucose concentration level is further increased. It is evident from these results that the rather simple design of a symmetric complementary split rectangular resonator has the potential to be used for glucose concentration levels within the important ranges of hypocalcemia and hypercalcemia.
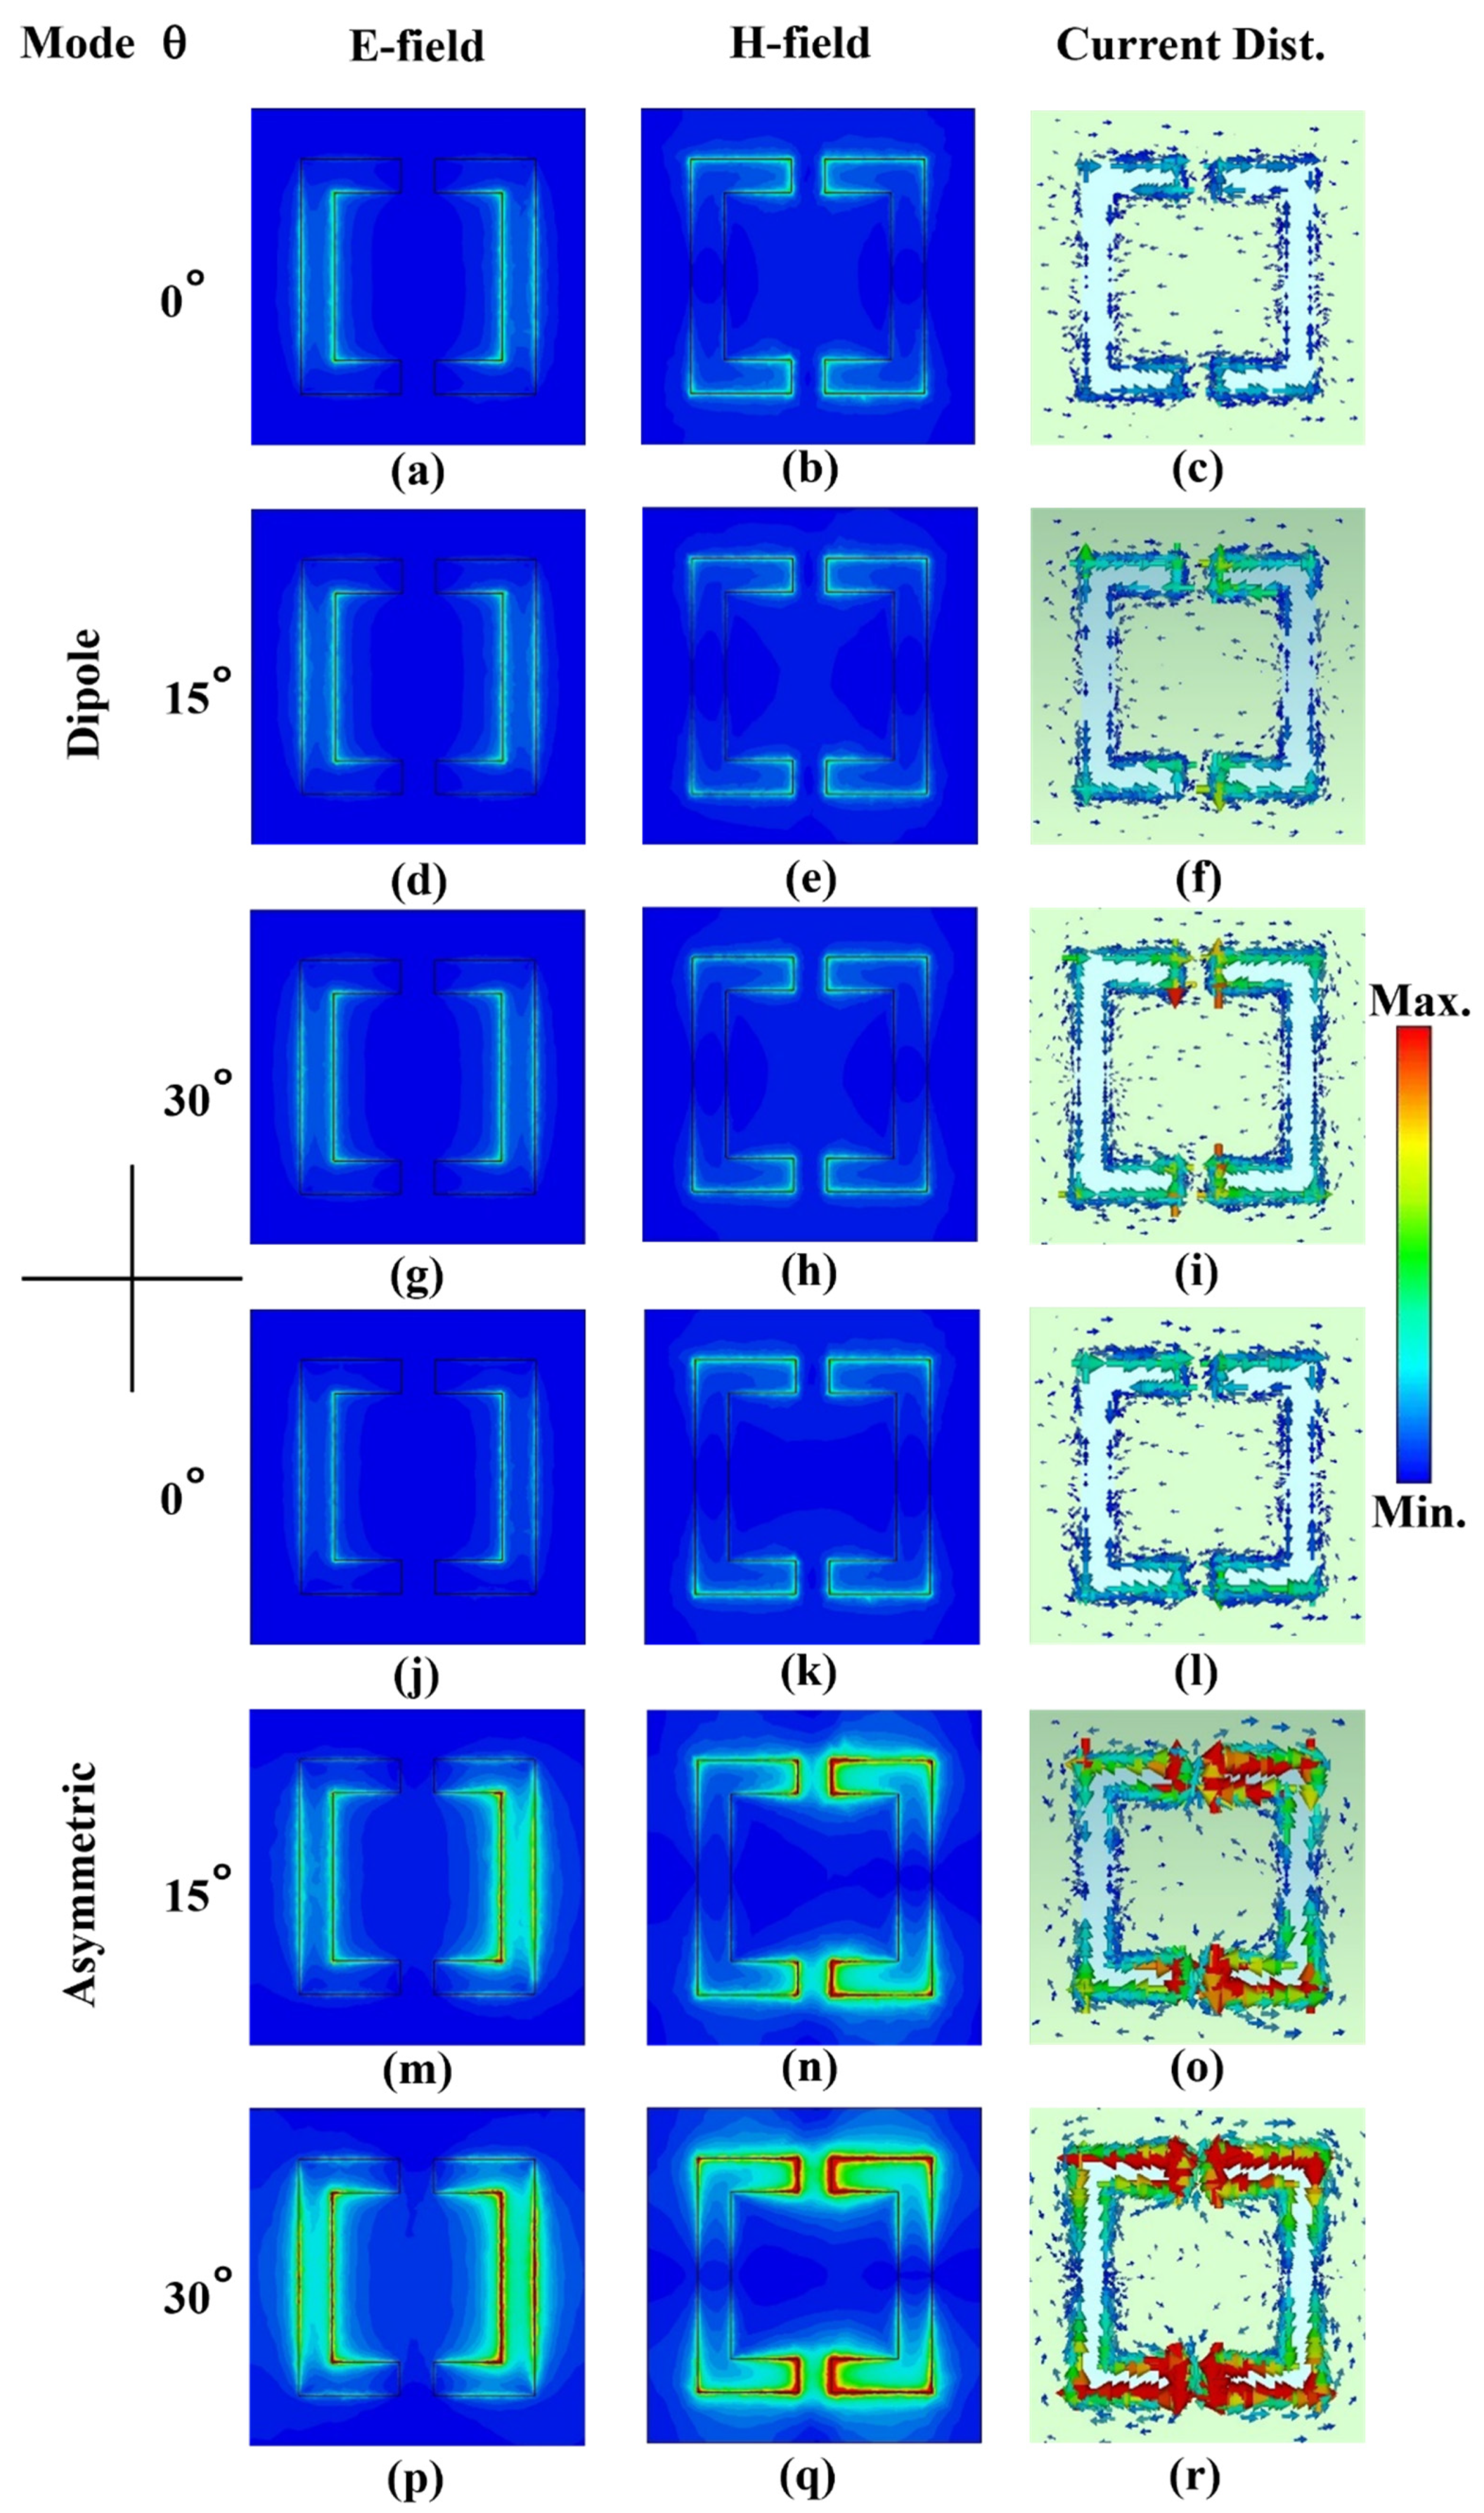
In order to get an insight into the physical mechanism of the resonance excitation, we carried out further simulations to monitor the spatial electric and magnetic nearfield distributions as well as the surface current distribution at the dipole frequency of about 0.645 THz and the asymmetric resonance frequency at 0.506 THz when the incident angle was at 0°, 15°, and 30°, as shown in Figure 4. The first half (rows 1–3) of the figure shows the results for the dipole mode. At an incidence angle of 0°, there is a small but quite clear excitation of the electric field in the vertical slots of the CSRR, while the magnetic field is excited around the two (“gaps”) microstrip lines of the CSRR. The current distribution is seen as a mirror image around the symmetry line of the resonator with respect to the excitation field, i.e., the horizontal midline of the CSRR. This confirms the in-phase nature of the dipole mode, and hence it is well coupled to free space that leads to its low Q-factor. Increasing the incidence angle from 0° to 15° and then to 30° showed very little change in the field distributions as well as in the surface current distribution.
The second half of the figure (rows 4–6) presents the results for the asymmetric mode. When the incidence angle is 0°, the strength of the fields and the surface current is quite small. Interestingly, the spatial distribution of both the electric and magnetic fields shows a remarkable increase in its strength as soon as the incident angle is increased to 15°. The electric field shown in Figure 4m is confined more on the right slot compared to the left slot of the resonator. Moreover, the magnetic field presented in Figure 4n is confined in the right-hand side of the upper and lower arms close to the two microstrip lines connecting the left and right slots. This asymmetry in the field distribution leads to the excitation of the asymmetric resonance. Most importantly, the surface current distribution at this angle, shown in Figure 4o, reveals not only a much larger strength than its counterpart of the dipole mode shown in Figure 4f, but also an out-of-phase behavior. The latter explains the sharpness of the asymmetric resonance and its high Q-factor that was evident in the spectra in Figure 2. Likewise, increasing the incidence angle to 30° showed a further increase in the strength of all distributions. It is worth mentioning that the visualization of the fields helps in choosing the best locations where the analyte can be applied. More specifically, it is rather useful to coat the areas with high field confinement for better interaction between the THz field and the matter. This aspect was a topic of a recent paper [23].
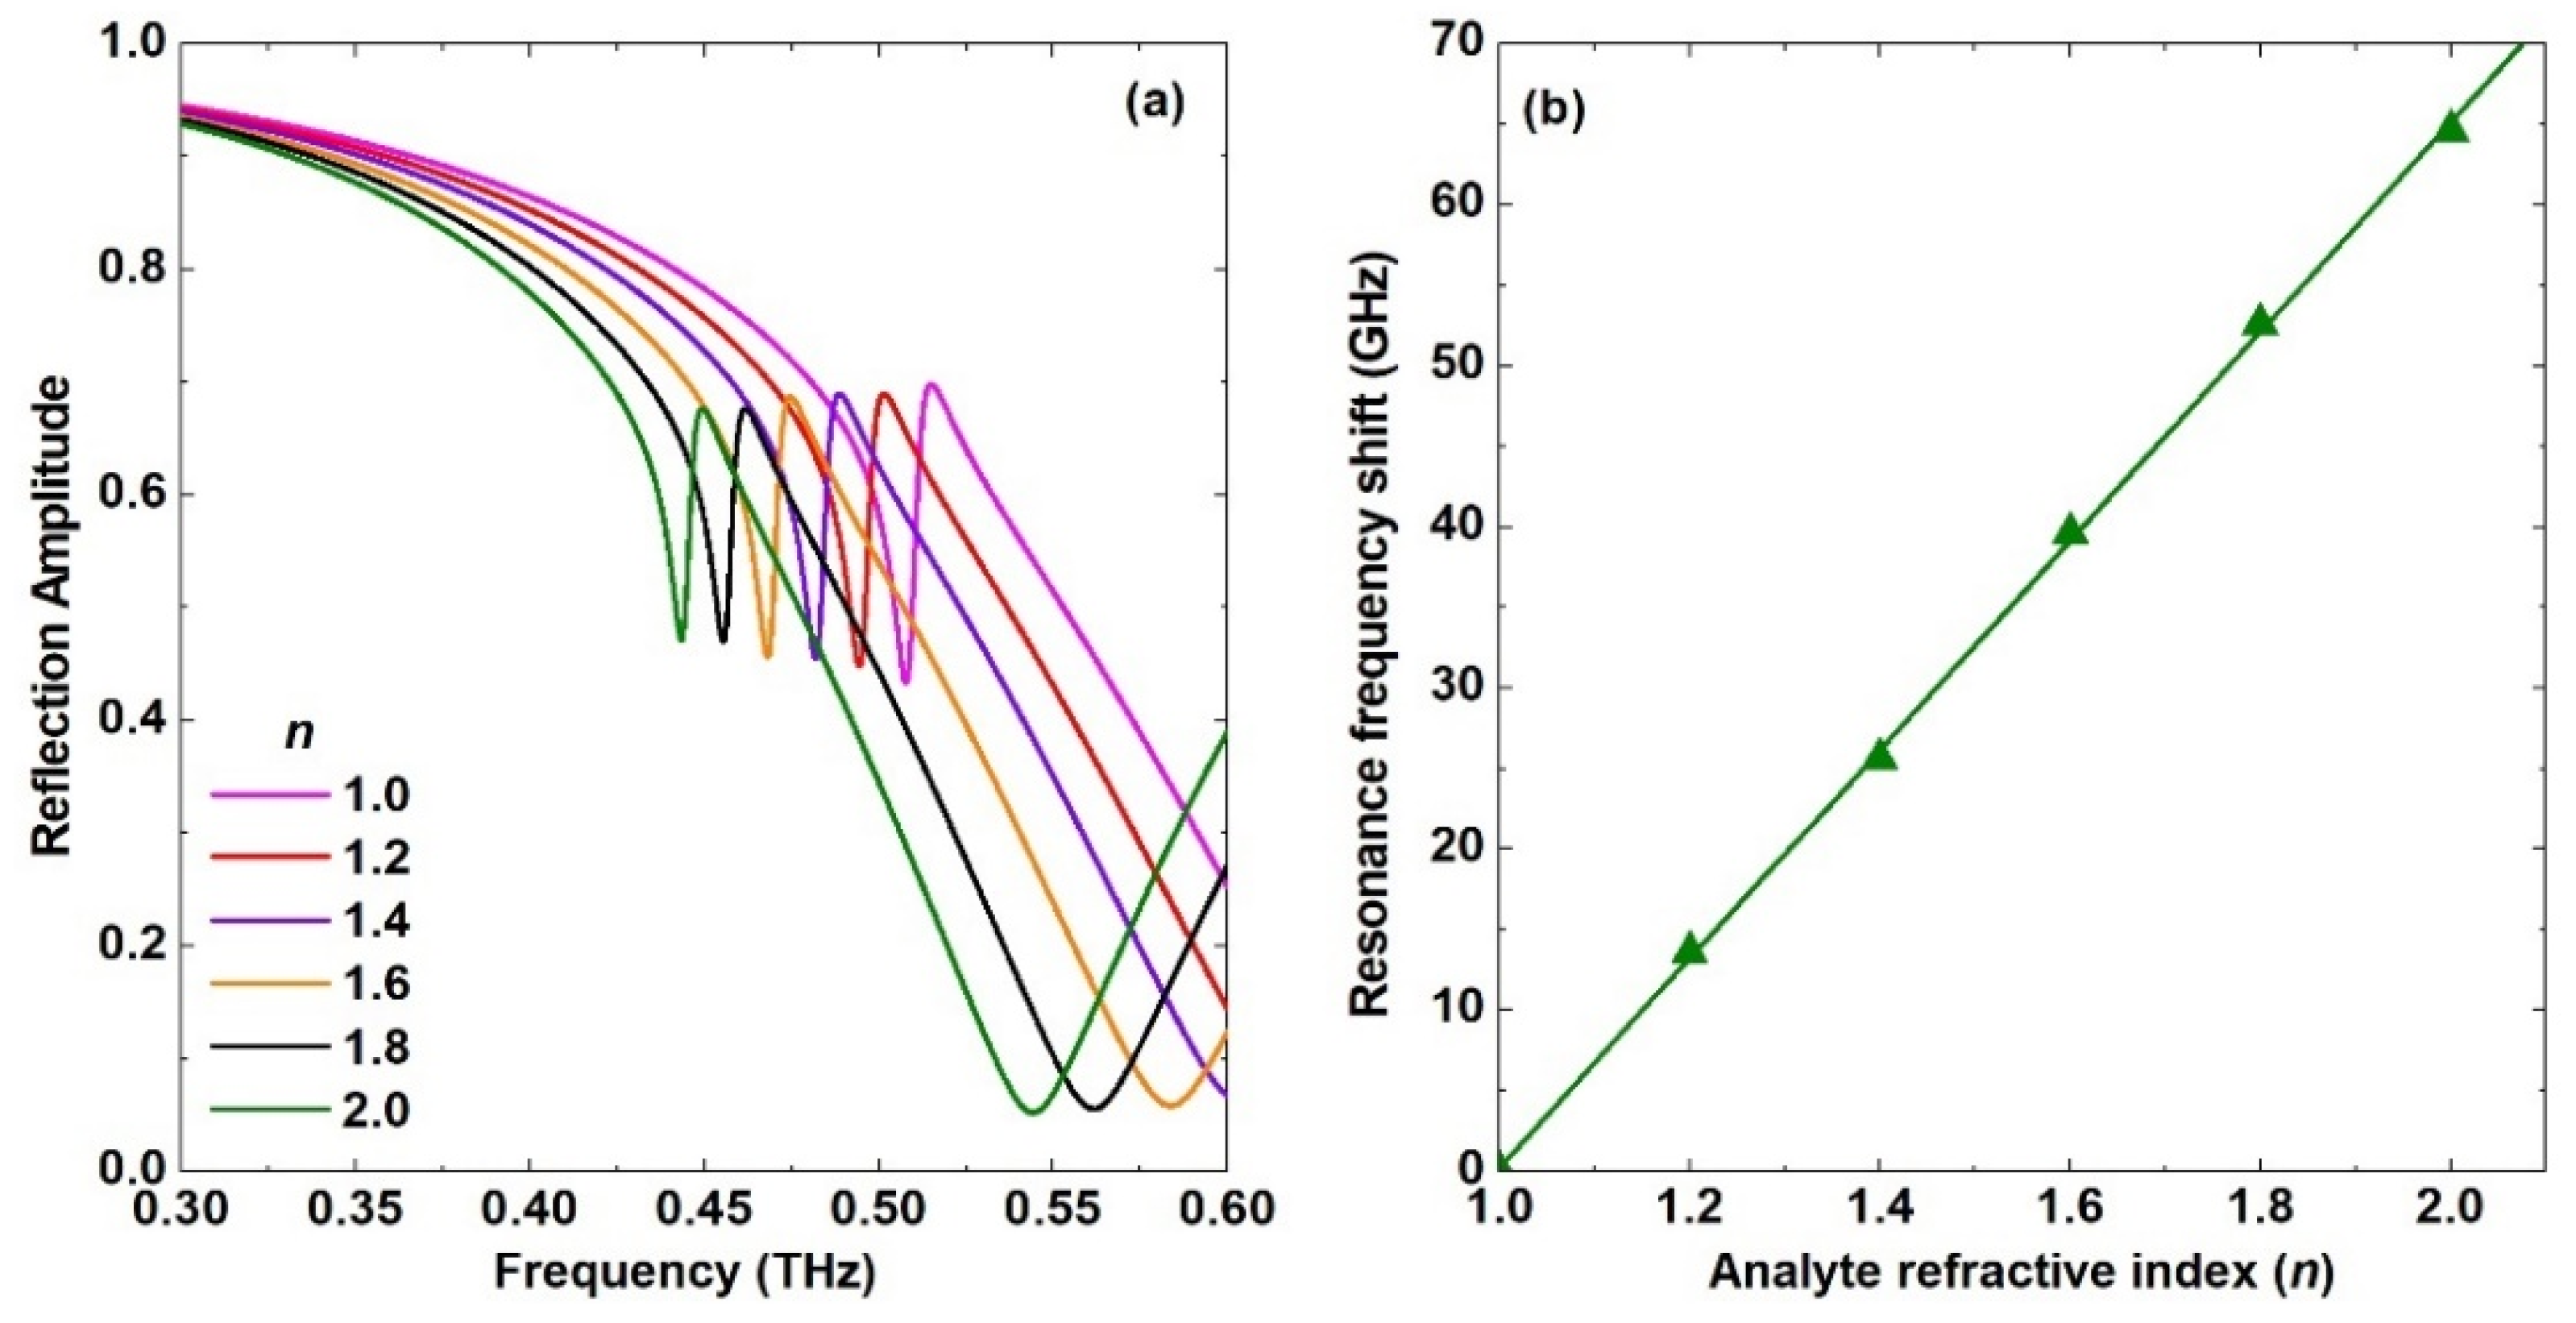
Next, conventional analysis of sensing evaluation has been carried out. A virtual analyte of the same thickness used earlier in the paper of 5 μm has been utilized and the refractive index of this analyte has been swept from 1.0 to 2.0 with a step of 0.2. Figure 5a shows the reflection amplitude spectra of the results. The redshift of the resonance frequency has also been calculated and is presented in Figure 5b. The linear fitting of the redshifts showed a slope of 32.3 GHz per refractive index unit (RIU). Using such a parameter as the only measure of the sensor performance is not rigorous as will be explained next. Nevertheless, it is routinely calculated for different configurations as a measure of sensor performance.
Moreover, one of the well-known evaluation techniques is to calculate the wavelength sensitivity using [23,45]:
where “c0” is the speed of light in free space, df is the resonance frequency shift, fr is the resonance frequency, and dn is different in the refractive index. This approach is rather comprehensive, since the resonance frequency is considered in the equation. A high sensitivity of 75,700 nm/RIU has been reached for the metasurface design at an incidence angle of 30°. Moreover, a figure of merit (FOM) has been utilized to evaluate the performance of the sensors with different techniques and configurations [26]. Moreover, the same term has been utilized to evaluate the trade-off between the sharpness of the resonators and the transmission intensity of the resonance [41,46]. Furthermore, the author has proposed recently to use the amplitude difference between the frequency response when the analyte is applied and its counterpart of the bare metasurface instead of the frequency shift, especially for very thin samples with a thickness of 2 μm or less [62]. Hence, there is no universal definition of FOM. Nevertheless, this matter has been extensively discussed in a well-written review paper by Beruete and Jáuregui-López [26]. The authors proposed a definition that takes into account many parameters, including the (i) resonance frequency shift, (ii) the refractive index unit, (iii) the analyte thickness of ha, and (iv) the full width at half maximum (FWHM):
As an observable frequency shift (df) is not enough to discern a possible overlapping between two analytes with close values of refractive index, the FWHM was considered in this equation to have resonances with narrow peaks or dips in order to achieve that. However, the frequency shift is not constant for different resonance frequencies. For the same sample thickness and refractive index, the frequency shift increases as the resonance frequency is increased. Therefore, (v) the resonance frequency should be included in Equation (2) to take this fact into account. Another factor that could be important to consider is (vi) the transmission intensity, as large intensity makes it easy to measure for a given dynamic range of the THz spectrometer and vice versa. Moreover, (vii) the thickness of the substrate and (viii) its refractive index affects the resonance frequency shift [45,63]. Furthermore, (ix) the total amount of the analyte is also another factor that needs to be considered, as extracted biomolecular analytes are normally come with a small amount. Luckily, it has been shown that specific areas of the sensors can be covered in order to get quite comparable results to the case of covering the whole area [23]. Hence, a more reasonable approach to calculate the FOM is to include such a parameter. Finally, (x) the fabrication complexity of the sensor is another factor that might be considered. For instance, a certain weight could be given that correlates with the difficulty level of the fabrication process. Therefore, there will be a bias in the comparison unless most, if not all, of the above ten parameters are taken properly into account. It is a very important topic that could be the subject of a project or a paper by itself and is beyond the scope of this paper.
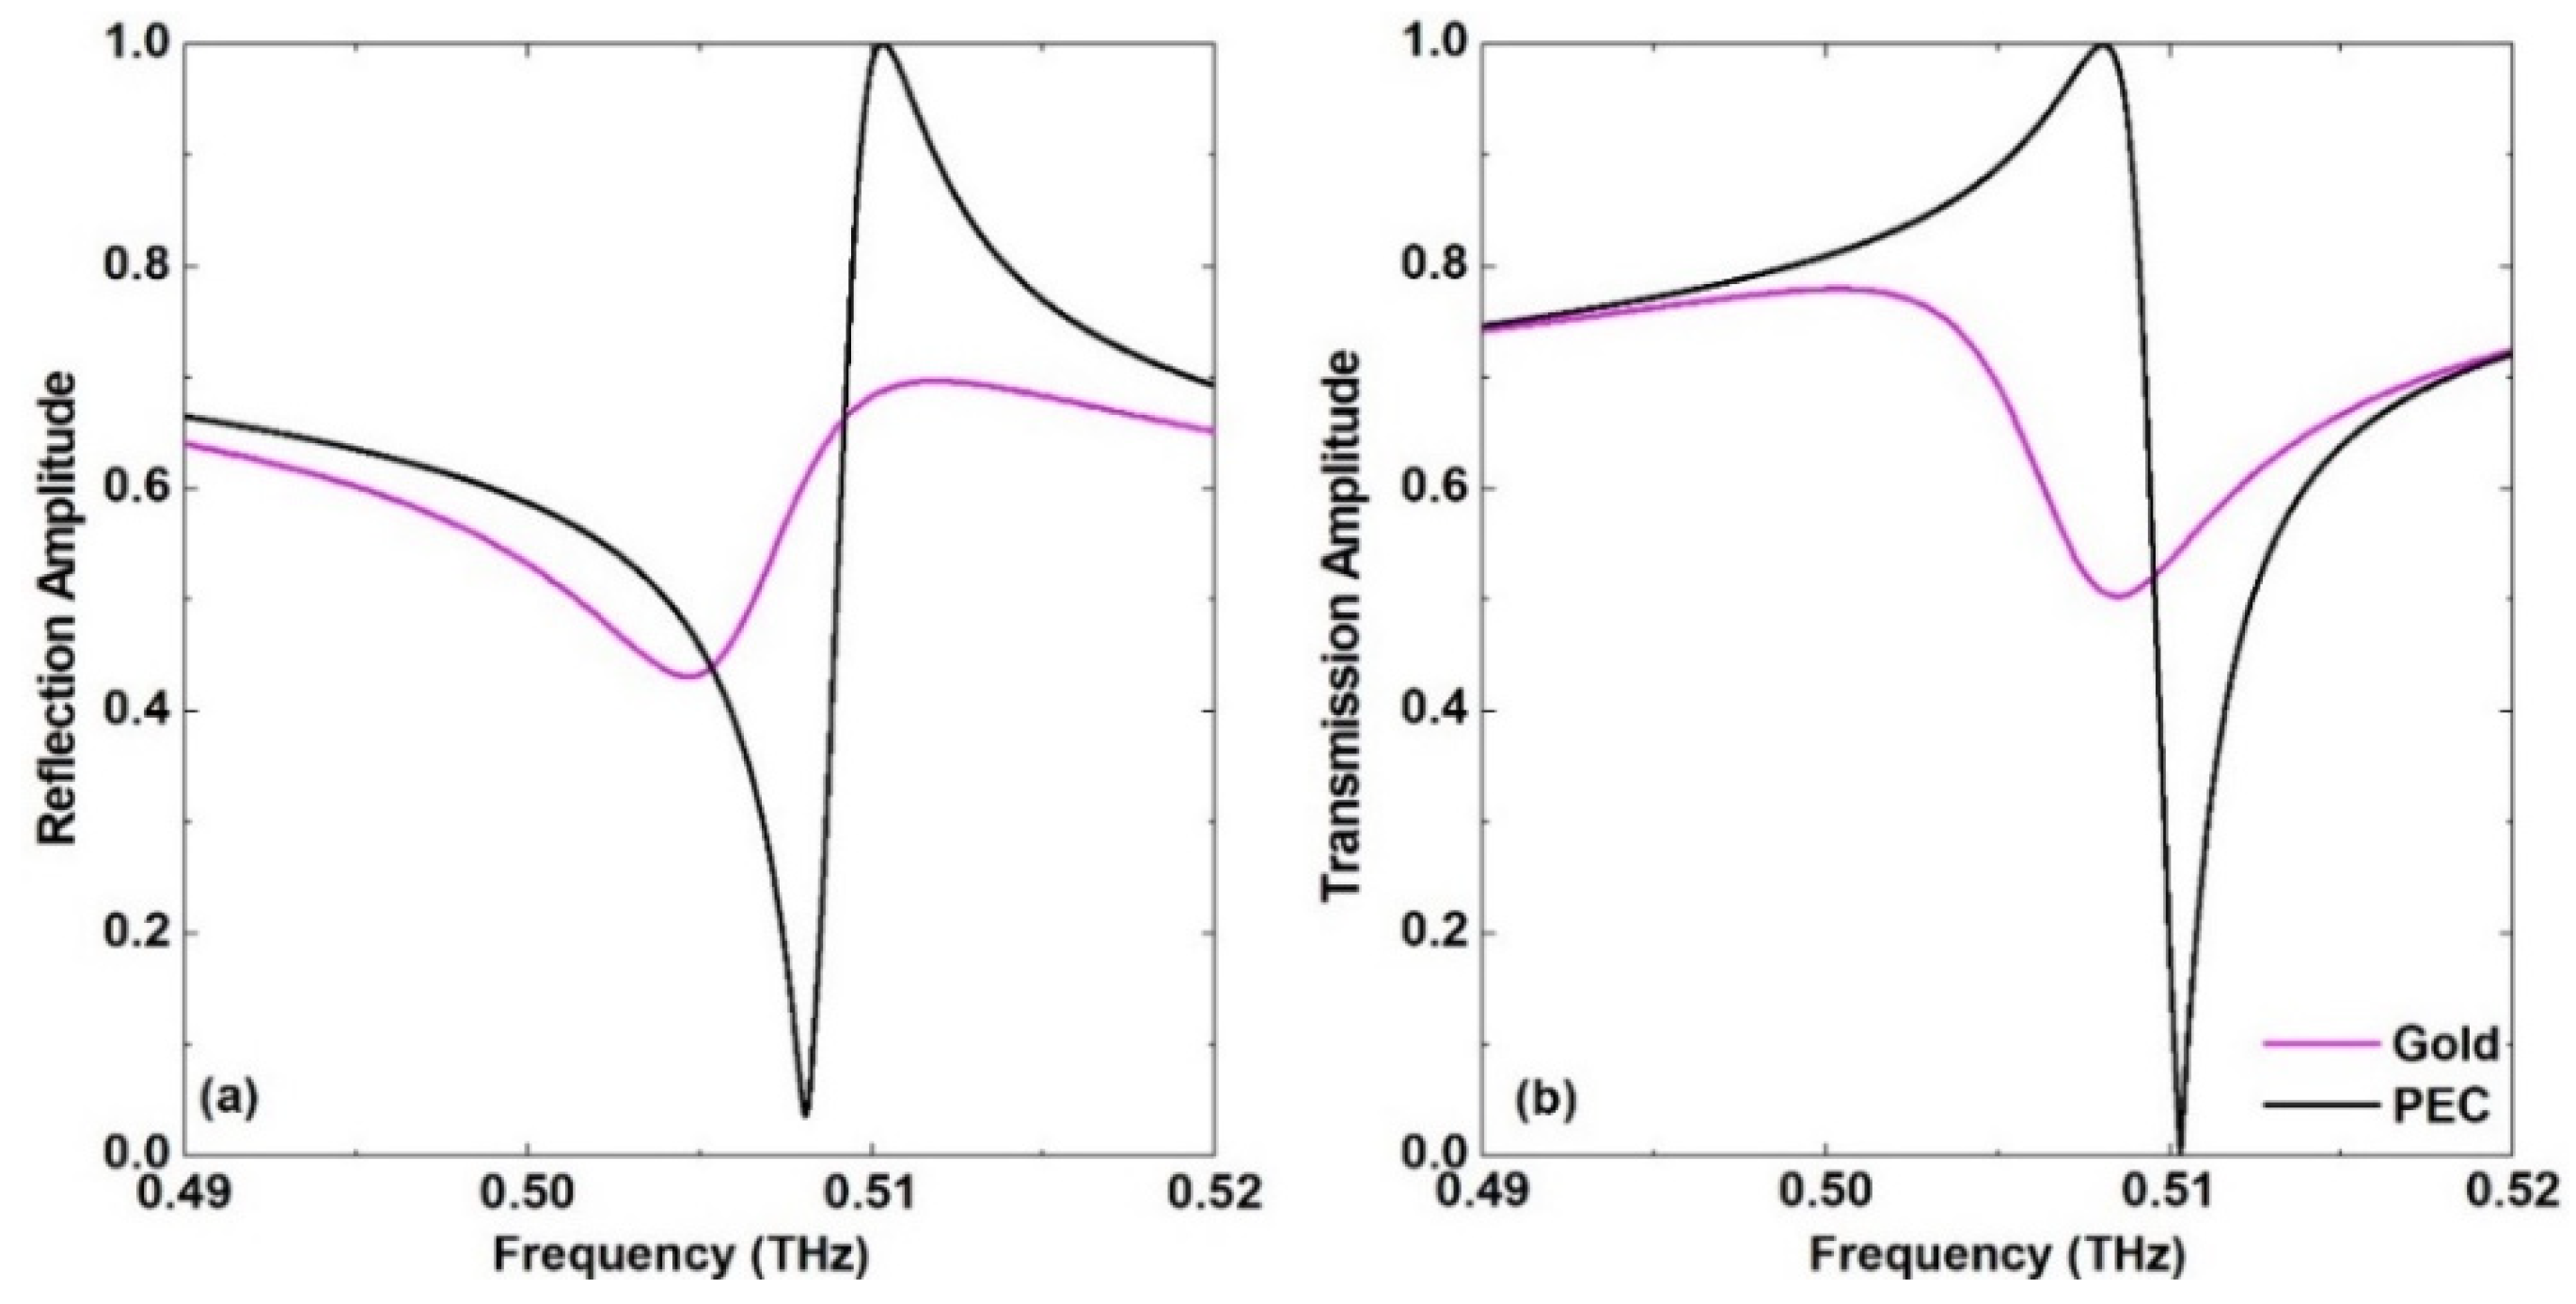
Though the ohmic losses at terahertz frequencies are quite small and they should, in principle, not modify the frequency response, it has been shown that the conductivity of the resonators has a significant role, especially when the frequency response exhibits a sharp transition [46]. Hence, it is quite important to investigate such an effect on the proposed design in this paper. The same structure shown in Figure 1 has been simulated again at the same incidence angle of 30° but employing a perfect electric conductor (PEC) instead of gold, and the results are shown in Figure 6. The slope of the transition from the dip to the peak of the reflection amplitude response is 6.3%/GHz and 63.4%/GHz for both gold and PEC cases, respectively. It is evident from these results that conductivity has a strong influence. It plays a critical role in determining the sharpness of the frequency response and the depth of the resonance. Further simulations have been carried out (not shown here) at a smaller value of the incidence angle that equals 5°. The corresponding slope was found to reach a very high value of 1750%/GHz for the PEC case and there was no sign of any resonance when gold was used at the same angle. The latter result means that the confined field in the resonator leads to losses in the conducting layer that prevent the resonance from being observable in the far field. Therefore, superconductors might be a good choice in case quite a small incidence angle is sought to be utilized for extremely sharp frequency responses.
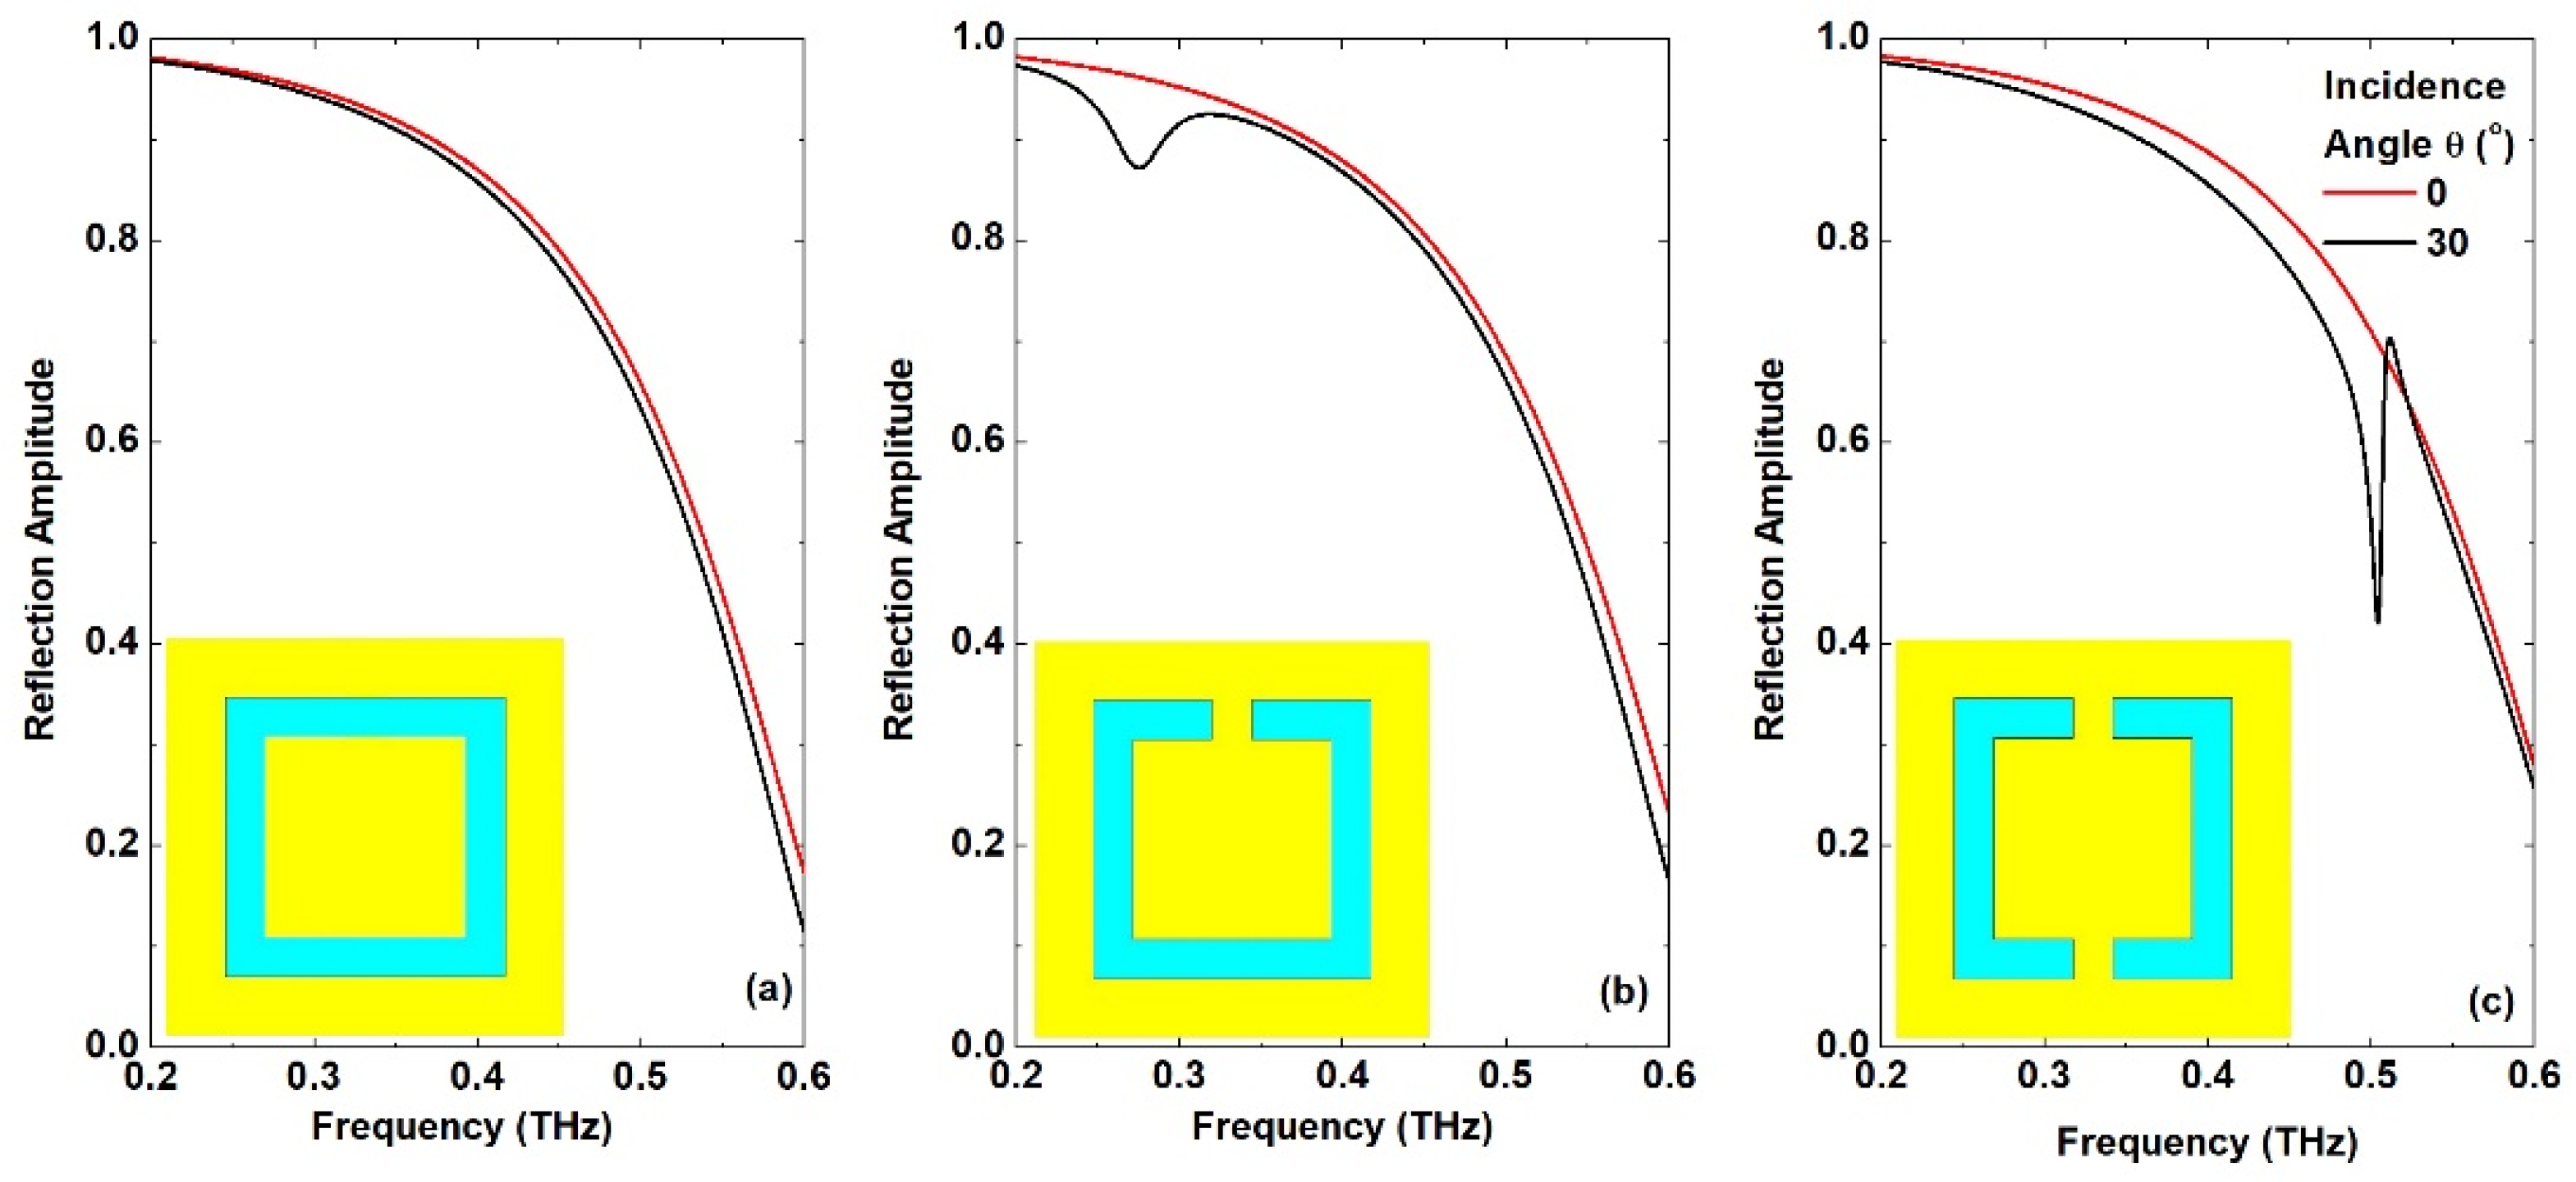
Finally, it is worth mentioning that the asymmetric resonance discussed in this paper can be excited only when using two “gaps”, i.e., the two microstrip lines in the top and bottom slots. Figure 7 shows the reflection spectra of three different configurations in order to illustrate the importance of the two microstrip lines in this design. The three structures shown in the figure as insets with their corresponding spectra have been simulated under the normal incidence and oblique incidence angle of 30°. While there is almost no change in the spectrum for the rectangular structure in part (a), one can observe a quite broad resonance with a small depth when one microstrip line was added in the middle of the top slot. Interestingly, as was shown above, once the second microstrip line was added in the middle of the bottom slot, a very sharp asymmetric resonance was excited. The excitation with the oblique incidence induces the asymmetric resonance due to the asymmetry in the excitation of the two slots of the CSRR shown in Figure 4, which can be easily achieved with the two “gaps” structure.
4. Conclusions
In summary, a biosensor for glucose levels has been designed based on a symmetric complementary split rectangular resonator. The key to exciting a very sharp frequency response was the use of oblique THz wave excitation. The biosensor showed a clear frequency redshift of the resonance frequency as soon as the sample layer with a concentration of 54 mg/dL was applied to the sensor. A thorough analysis of the field distribution has been carried out that can help in understanding the physical mechanism of the structure, as well as in identifying the best areas to cover the structure with the analyte. Moreover, sensitivity analysis showed a very good level of 75,700 nm/RIU. Utilizing a different incidence angle other than 30° may prove advantageous, especially a smaller one to increase the FOM, but the dynamic range of the THz spectrometer should be considered in order to make sure that the measurements will be performed successfully. Though it is very tempting to use a few parameters to compare the performance of different sensors, such an approach may lead to unfair judgment. Therefore, various parameters that could contribute to the calculations of the figure of merit have been thoroughly discussed. Further simulations of the same structure with the PEC metallic layer revealed that much sharper frequency response is possible, especially for a small incidence angle of only 5°. This finding could help in building rather simple biosensors with high performance that are easy to fabricate and not prone to fabrication imperfections.
Funding
The authors extend their appreciation to the Deputyship for Research and Innovation, Ministry of Education in Saudi Arabia for funding this research work through the project number IF-2020-013-Eng at the Imam Abdulrahman bin Faisal University/College of Engineering.
Conflicts of Interest
The author declares no conflict of interest. The funders had no role in the design of the study; in the collection, analyses, or interpretation of data; in the writing of the manuscript, or in the decision to publish the results.
References
- Cho, N.H.; Shaw, J.E.; Karuranga, S.; Huang, Y.; da Rocha Fernandes, J.D.; Ohlrogge, A.W.; Malanda, B. IDF Diabetes Atlas: Global estimates of diabetes prevalence for 2017 and projections for 2045. Diabetes Res. Clin. Pract. 2018, 138, 271–281. [Google Scholar] [CrossRef] [PubMed]
- De Pretto, L.R.; Yoshimura, T.M.; Ribeiro, M.S.; Zanardi de Freitas, A. Optical coherence tomography for blood glucose monitoring in vitro through spatial and temporal approaches. J. Biomed. Opt. 2016, 21, 086007. [Google Scholar] [CrossRef] [PubMed]
- World Health Organization. Diabetes. Available online: https://www.who.int/news-room/fact-sheets/detail/diabetes (accessed on 1 November 2021).
- Saeedi, P.; Petersohn, I.; Salpea, P.; Malanda, B.; Karuranga, S.; Unwin, N.; Colagiuri, S.; Guariguata, L.; Motala, A.A.; Ogurtsova, K.; et al. Global and regional diabetes prevalence estimates for 2019 and projections for 2030 and 2045: Results from the International Diabetes Federation Diabetes Atlas, 9th edition. Diabetes Res. Clin. Pract. 2019, 157, 107843. [Google Scholar] [CrossRef] [PubMed] [Green Version]
- Danne, T.; Nimri, R.; Battelino, T.; Bergenstal, R.M.; Close, K.L.; DeVries, J.H.; Garg, S.; Heinemann, L.; Hirsch, I.; Amiel, S.A.; et al. International consensus on use of continuous glucose monitoring. Diabetes Care 2017, 40, 1631–1640. [Google Scholar] [CrossRef] [PubMed] [Green Version]
- Rodbard, D. Continuous Glucose Monitoring: A Review of Successes, Challenges, and Opportunities. Diabetes Technol. Ther. 2016, 18, S23–S213. [Google Scholar] [CrossRef] [PubMed] [Green Version]
- Association, A.D. 2. Classification and Diagnosis of Diabetes: Standards of Medical Care in Diabetes—2018. Diabetes Care 2018, 41, S13–S27. [Google Scholar] [CrossRef] [PubMed] [Green Version]
- Woldaregay, A.Z.; Årsand, E.; Botsis, T.; Albers, D.; Mamykina, L.; Hartvigsen, G. Data-driven blood glucose pattern classification and anomalies detection: Machine-learning applications in type 1 diabetes. J. Med. Internet Res. 2019, 21. [Google Scholar] [CrossRef] [Green Version]
- Alsunaidi, B.; Althobaiti, M.; Tamal, M.; Albaker, W.; Al-Naib, I. A review of non-invasive optical systems for continuous blood glucose monitoring. Sensors 2021, 21, 6820. [Google Scholar] [CrossRef] [PubMed]
- Shokrekhodaei, M.; Quinones, S. Review of non-invasive glucose sensing techniques: Optical, electrical and breath acetone. Sensors 2020, 20, 1251. [Google Scholar] [CrossRef] [PubMed] [Green Version]
- Gonzales, W.V.; Mobashsher, A.T.; Abbosh, A. The progress of glucose monitoring—A review of invasive to minimally and non-invasive techniques, devices and sensors. Sensors 2019, 19, 800. [Google Scholar] [CrossRef] [PubMed] [Green Version]
- Siddiqui, S.A.; Zhang, Y.; Lloret, J.; Song, H.; Obradovic, Z. Pain-Free Blood Glucose Monitoring Using Wearable Sensors: Recent Advancements and Future Prospects. IEEE Rev. Biomed. Eng. 2018, 11, 21–35. [Google Scholar] [CrossRef]
- Yadav, J.; Rani, A.; Singh, V.; Mohan, B.; Murari, B.M. Prospects and limitations of non-invasive blood glucose monitoring using near-infrared spectroscopy. Biomed. Signal Process. Control 2015, 18, 214–227. [Google Scholar] [CrossRef]
- Bandodkar, A.J.; Wang, J. Non-invasive wearable electrochemical sensors: A review. Trends Biotechnol. 2014, 32, 363–371. [Google Scholar] [CrossRef] [PubMed]
- Jernelv, I.L.; Milenko, K.; Fuglerud, S.S.; Hjelme, D.R.; Ellingsen, R.; Aksnes, A. A review of optical methods for continuous glucose monitoring. Appl. Spectrosc. Rev. 2019, 54, 543–572. [Google Scholar] [CrossRef]
- Vettoretti, M.; Cappon, G.; Facchinetti, A.; Sparacino, G. Advanced diabetes management using artificial intelligence and continuous glucose monitoring sensors. Sensors 2020, 20, 3870. [Google Scholar] [CrossRef] [PubMed]
- Lee, D.-K.; Kang, J.-H.; Lee, J.-S.; Kim, H.-S.; Kim, C.; Hun Kim, J.; Lee, T.; Son, J.-H.; Park, Q.-H.; Seo, M. Highly sensitive and selective sugar detection by terahertz nano-antennas. Sci. Rep. 2015, 5, 15459. [Google Scholar] [CrossRef] [PubMed]
- Cherkasova, O.; Nazarov, M.; Shkurinov, A. Noninvasive blood glucose monitoring in the terahertz frequency range. Opt. Quantum Electron. 2016, 48, 1–12. [Google Scholar] [CrossRef]
- Zhou, J.; Zhao, X.; Huang, G.; Yang, X.; Zhang, Y.; Zhan, X.; Tian, H.; Xiong, Y.; Wang, Y.; Fu, W. Molecule-Specific Terahertz Biosensors Based on an Aptamer Hydrogel-Functionalized Metamaterial for Sensitive Assays in Aqueous Environments. ACS Sensors 2021, 6, 1884–1890. [Google Scholar] [CrossRef]
- Lykina, A.A.; Nazarov, M.M.; Konnikova, M.R.; Mustafin, I.A.; Vaks, V.L.; Anfertev, V.A.; Domracheva, E.G.; Chernyaeva, M.B.; Kistenev, Y.V.; Vrazhnov, D.A.; et al. Terahertz spectroscopy of diabetic and non-diabetic human blood plasma pellets. J. Biomed. Opt. 2021, 26, 043006. [Google Scholar] [CrossRef] [PubMed]
- Bolivar, P.H.; Brucherseifer, M.; Nagel, M.; Kurz, H.; Bosserhoff, A. Label-free probing of genes by time-domain terahertz sensing. Phys. Med. Biol. 2002, 47, 3815. [Google Scholar] [CrossRef]
- O’Hara, J.F.; Withayachumnankul, W.; Al-Naib, I. A Review on Thin-film Sensing with Terahertz Waves. J. Infrared Millim. Terahertz Waves 2012, 33, 245–291. [Google Scholar] [CrossRef]
- Al-Naib, I. Biomedical Sensing with Conductively Coupled Terahertz Metamaterial Resonators. IEEE J. Sel. Top. Quantum Electron. 2017, 23, 4700405. [Google Scholar] [CrossRef]
- Al-Naib, I.; Withayachumnankul, W. Recent Progress in Terahertz Metasurfaces. J. Infrared Millim. Terahertz Waves 2017, 38, 1067–1084. [Google Scholar] [CrossRef]
- Al-Naib, I.; Singh, R.; Shalaby, M.; Ozaki, T.; Morandotti, R. Enhanced Q-factor in Optimally Coupled Macrocell THz Metamaterials: Effect of Spatial Arrangement. IEEE J. Sel. Top. Quantum Electron. 2013, 19, 8400807. [Google Scholar] [CrossRef]
- Beruete, M.; Jáuregui-López, I. Terahertz sensing based on metasurfaces. Adv. Opt. Mater. 2020, 1900721. [Google Scholar] [CrossRef] [Green Version]
- Srivastava, Y.K.; Ako, R.T.; Gupta, M.; Bhaskaran, M.; Sriram, S.; Singh, R. Terahertz sensing of 7 nm dielectric film with bound states in the continuum metasurfaces. Appl. Phys. Lett. 2019, 115. [Google Scholar] [CrossRef] [Green Version]
- Gusev, S.I.; Soboleva, V.Y.; Kublanova, I.L.; Khodzitsky, M.K. Glucose level sensor based on metasurface in THz frequency range. AIP Conf. Proc. 2019, 2098, 020008. [Google Scholar] [CrossRef]
- Yang, J.; Qi, L.; Li, B.; Wu, L.; Shi, D.; Ahmed Uqaili, J.; Tao, X. A terahertz metamaterial sensor used for distinguishing glucose concentration. Results Phys. 2021, 26, 104332. [Google Scholar] [CrossRef]
- Gusev, S.I.; Demchenko, P.S.; Cherkasova, O.P.; Fedorov, V.I.; Khodzitsky, M.K. Influence of glucose concentration on blood optical properties in THz frequency range. Chinese Opt. 2018, 11, 182–189. [Google Scholar] [CrossRef]
- Al-Naib, I. Biomedical sensing with free-standing complementary supercell terahertz metasurfaces. Crystals 2020, 10, 26–30. [Google Scholar] [CrossRef]
- Singh, R.; Al-Naib, I.; Cao, W.; Rockstuhl, C.; Koch, M.; Zhang, W. The Fano resonance in symmetry broken terahertz metamaterials. IEEE Trans. Terahertz Sci. Technol. 2013, 3, 19. [Google Scholar] [CrossRef]
- Gupta, M.; Singh, R. Terahertz Sensing with Optimized Q/Veff Metasurface Cavities. Adv. Opt. Mater. 2020, 8, 1902025. [Google Scholar] [CrossRef]
- Kumar, A.; Wang, C.; Meng, F.Y.; Zhou, Z.L.; Zhao, M.; Yan, G.F.; Kim, E.S.; Kim, N.Y. High-sensitivity, quantified, linear and mediator-free resonator-based microwave biosensor for glucose detection. Sensors 2020, 20, 4024. [Google Scholar] [CrossRef]
- Al-Naib, I. Novel terahertz metasurfaces based on complementary coupled split ring resonators. Opt. Mater. 2020, 99, 109596. [Google Scholar] [CrossRef]
- Fedotov, V.A.; Rose, M.; Prosvirnin, S.L.; Papasimakis, N.; Zheludev, N.I. Sharp trapped-mode resonances in planar metamaterials with a broken structural symmetry. Phys. Rev. Lett. 2007, 99, 147401. [Google Scholar] [CrossRef] [Green Version]
- Singh, R.; Al-Naib, I.A.I.; Koch, M.; Zhang, W. Sharp Fano resonances in THz metamaterials. Opt. Express 2011, 19, 6312–6319. [Google Scholar] [CrossRef] [PubMed] [Green Version]
- Liu, N.; Weiss, T.; Mesch, M.; Langguth, L.; Eigenthaler, U.; Hirscher, M.; Sönnichsen, C.; Giessen, H. Planar metamaterial analogue of electromagnetically induced transparency for plasmonic sensing. Nano Lett. 2010, 10, 1103–1107. [Google Scholar] [CrossRef]
- Liu, N.; Langguth, L.; Weiss, T.; Kästel, J.; Fleischhauer, M.; Pfau, T.; Giessen, H. Plasmonic analogue of electromagnetically induced transparency at the Drude damping limit. Nat. Mater. 2009, 8, 758–762. [Google Scholar] [CrossRef]
- Yan, X.; Yang, M.; Zhang, Z.; Liang, L.; Wei, D.; Wang, M.; Zhang, M.; Wang, T.; Liu, L.; Xie, J.; et al. The terahertz electromagnetically induced transparency-like metamaterials for sensitive biosensors in the detection of cancer cells. Biosens. Bioelectron. 2019, 126, 485–492. [Google Scholar] [CrossRef]
- Al-Naib, I. Electromagnetic-Induced Transparency Resonance with Ultrahigh Figure of Merit Using Terahertz Metasurfaces. J. Infrared Millim. Terahertz Waves 2021, 42, 371–379. [Google Scholar] [CrossRef]
- Al-Naib, I.; Yang, Y.; Dignam, M.M.; Zhang, W.; Singh, R. Ultra-high Q even eigenmode resonance in terahertz metamaterials. Appl. Phys. Lett. 2015, 106, 11102. [Google Scholar] [CrossRef]
- Born, N.; Al-Naib, I.; Jansen, C.; Singh, R.; Moloney, J.V.; Scheller, M.; Koch, M. Terahertz Metamaterials with Ultrahigh Angular Sensitivity. Adv. Opt. Mater. 2015, 3, 642–645. [Google Scholar] [CrossRef]
- Tan, T.C.W.; Srivastava, Y.K.; Ako, R.T.; Wang, W.; Bhaskaran, M.; Sriram, S.; Al-Naib, I.; Plum, E.; Singh, R. Active Control of Nanodielectric-Induced THz Quasi-BIC in Flexible Metasurfaces: A Platform for Modulation and Sensing. Adv. Mater. 2021, 2100836, 1–11. [Google Scholar] [CrossRef]
- Singh, R.; Cao, W.; Al-Naib, I.; Cong, L.; Withayachumnankul, W.; Zhang, W. Ultrasensitive terahertz sensing with high- Q Fano resonances in metasurfaces. Appl. Phys. Lett. 2014, 105, 171101. [Google Scholar] [CrossRef] [Green Version]
- Srivastava, Y.K.; Manjappa, M.; Cong, L.; Cao, W.; Al-Naib, I.; Zhang, W.; Singh, R. Ultrahigh-Q Fano Resonances in Terahertz Metasurfaces: Strong Influence of Metallic Conductivity at Extremely Low Asymmetry. Adv. Opt. Mater. 2016, 4, 457–463. [Google Scholar] [CrossRef]
- Yahiaoui, R.; Tan, S.; Cong, L.; Singh, R.; Yan, F.; Zhang, W. Multispectral terahertz sensing with highly flexible ultrathin metamaterial absorber. J. Appl. Phys. 2015, 118, 083103. [Google Scholar] [CrossRef]
- Sarangan, A.; Agha, I.; Mathews, J.; Burrow, J.A.; Yahiaoui, R.; Searles, T.A. Polarization-dependent electromagnetic responses of ultrathin and highly flexible asymmetric terahertz metasurfaces. Opt. Express 2017, 25, 32540–32549. [Google Scholar] [CrossRef] [Green Version]
- Yahiaoui, R.; Burrow, J.A.; Mekonen, S.M.; Sarangan, A.; Mathews, J.; Agha, I.; Searles, T.A. Electromagnetically induced transparency control in terahertz metasurfaces based on bright-bright mode coupling. Phys. Rev. B 2018, 97, 155403. [Google Scholar] [CrossRef] [Green Version]
- Hasebe, T.; Yamada, Y.; Tabata, H. Biochemical and Biophysical Research Communications Label-free THz sensing of living body-related molecular binding using a metallic mesh. Biochem. Biophys. Res. Commun. 2011, 414, 192–198. [Google Scholar] [CrossRef] [PubMed]
- Yoshida, H.; Ogawa, Y.; Kawai, Y.; Hayashi, S.; Hayashi, A.; Otani, C.; Kato, E.; Miyamaru, F.; Kawase, K. Terahertz sensing method for protein detection using a thin metallic mesh. Appl. Phys. Lett. 2007, 91, 78–80. [Google Scholar] [CrossRef]
- Yoshida, S.; Kato, E.; Suizu, K.; Nakagomi, Y.; Ogawa, Y.; Kawase, K. Terahertz Sensing of Thin Poly(ethylene Terephthalate) Film Thickness Using a Metallic Mesh. Appl. Phys. Express 2009, 2, 12301. [Google Scholar] [CrossRef]
- Yen, T.J.; Padilla, W.J.; Fang, N.; Vier, D.C.; Smith, D.R.; Pendry, J.B.; Basov, D.N.; Zhang, X. Terahertz Magnetic Response from Artificial Materials. Science 2004, 303, 1494–1496. [Google Scholar] [CrossRef] [PubMed] [Green Version]
- Menzel, C.; Singh, R.; Rockstuhl, C.; Zhang, W.; Lederer, F. Effective properties of terahertz double split-ring resonators at oblique incidence. J. Opt. Soc. Am. B 2009, 26, B143–B147. [Google Scholar] [CrossRef]
- Plum, E.; Liu, X.X.; Fedotov, V.A.; Chen, Y.; Tsai, D.P.; Zheludev, N.I. Metamaterials: Optical activity without chirality. Phys. Rev. Lett. 2009, 102, 113902. [Google Scholar] [CrossRef] [PubMed] [Green Version]
- Zhang, C.; Xue, T.; Zhang, J.; Liu, L.; Xie, J.; Wang, G.; Yao, J.; Zhu, W.; Ye, X. Terahertz toroidal metasurface biosensor for sensitive distinction of lung cancer cells. Nanophotonics 2021, 11, 101–109. [Google Scholar] [CrossRef]
- Tamayama, Y.; Kida, Y. Tunable group delay in a doubly resonant metasurface composed of two dissimilar split-ring resonators. JOSA B 2019, 36, 2694–2699. [Google Scholar] [CrossRef]
- Rodríguez-Ulibarri, P.; Kuznetsov, S.A.; Beruete, M. Wide angle terahertz sensing with a cross-dipole frequency selective surface. Appl. Phys. Lett. 2016, 108, 111104. [Google Scholar] [CrossRef]
- Falcone, F.; Lopetegi, T.; Laso, M.A.G.; Baena, J.D.; Bonache, J.; Beruete, M.; Marqués, R.; Martín, F.; Sorolla, M.; Marques, R.; et al. Babinet Principle Applied to the Design of Metasurfaces and Metamaterials. Phys. Rev. Lett. 2004, 2, 2–5. [Google Scholar] [CrossRef] [Green Version]
- Chen, H.-T.; O’Hara, J.F.; Taylor, A.J.; Averitt, R.D.; Highstrete, C.; Lee, M.; Padilla, W.J. Complementary planar terahertz metamaterials. Opt. Express 2007, 15, 1084. [Google Scholar] [CrossRef] [PubMed]
- Bitzer, A.; Ortner, A.; Merbold, H.; Feurer, T.; Walther, M. Terahertz near-field microscopy of complementary planar metamaterials: Babinet’s principle. Opt. Express 2011, 19, 22108–22113. [Google Scholar] [CrossRef]
- Al-Naib, I. Evaluation of amplitude difference referencing technique with terahertz metasurfaces for sub-micron analytes sensing. J. King Saud Univ. Sci. 2019, 31, 1384–1387. [Google Scholar] [CrossRef]
- Tao, H.; Strikwerda, A.C.; Liu, M.; Mondia, J.P.; Ekmekci, E.; Fan, K.; Kaplan, D.L.; Padilla, W.J.; Zhang, X.; Averitt, R.D.; et al. Performance enhancement of terahertz metamaterials on ultrathin substrates for sensing applications. Appl. Phys. Lett. 2010, 97, 2009–2012. [Google Scholar] [CrossRef]
Figure 1.
Geometrical schematic of the resonator: (a) 3D representation showing the analyte top coating layer with the incidence angle (θ) and (b) 2D of the symmetric complementary split rectangular resonators with the related dimensions, respectively. The inset illustrates the field polarization.
Figure 1.
Geometrical schematic of the resonator: (a) 3D representation showing the analyte top coating layer with the incidence angle (θ) and (b) 2D of the symmetric complementary split rectangular resonators with the related dimensions, respectively. The inset illustrates the field polarization.

Figure 2.
(a) Reflection and (b) transmission frequency response of the symmetric complementary split rectangular resonators for a sweep of incidence angle (θ) between 0° and 75° with a step of 15°.
Figure 2.
(a) Reflection and (b) transmission frequency response of the symmetric complementary split rectangular resonators for a sweep of incidence angle (θ) between 0° and 75° with a step of 15°.

Figure 3.
(a) Reflection spectra of the symmetric complementary split rectangular resonators for a sweep of glucose concentration levels between 54 and 342 mg/dL; (b) The corresponding resonance frequency shift versus the glucose level concentration.
Figure 3.
(a) Reflection spectra of the symmetric complementary split rectangular resonators for a sweep of glucose concentration levels between 54 and 342 mg/dL; (b) The corresponding resonance frequency shift versus the glucose level concentration.

Figure 4.
Spatial distribution of (a,d,g,j,m,p) electric, (b,e,h,k,n,q) magnetic field, and (c,f,i,l,o,r) current distribution at the dipole frequency (rows 1–3) and the asymmetric resonance frequency (rows 4–6) for an incident angle of 0°, 15°, and 30°.
Figure 4.
Spatial distribution of (a,d,g,j,m,p) electric, (b,e,h,k,n,q) magnetic field, and (c,f,i,l,o,r) current distribution at the dipole frequency (rows 1–3) and the asymmetric resonance frequency (rows 4–6) for an incident angle of 0°, 15°, and 30°.

Figure 5.
(a) Reflection amplitude spectra of the symmetric CSRRs when coated with a 5 μm thick analyte by changing its refractive index value between 1.2 and 2.0, and the corresponding (b) frequency redshift.
Figure 5.
(a) Reflection amplitude spectra of the symmetric CSRRs when coated with a 5 μm thick analyte by changing its refractive index value between 1.2 and 2.0, and the corresponding (b) frequency redshift.

Figure 6.
(a) Reflection and (b) transmission spectra of the symmetric CSRRs at an incidence angle of 30o for both gold and PEC metallic layers.
Figure 6.
(a) Reflection and (b) transmission spectra of the symmetric CSRRs at an incidence angle of 30o for both gold and PEC metallic layers.

Figure 7.
Reflection spectra of (a) symmetric complementary rectangular resonator, (b) symmetric complementary split rectangular resonator with one microstrip line on the top slot, and (c) symmetric complementary split rectangular resonator with two microstrip lines on the top and bottom slots.
Figure 7.
Reflection spectra of (a) symmetric complementary rectangular resonator, (b) symmetric complementary split rectangular resonator with one microstrip line on the top slot, and (c) symmetric complementary split rectangular resonator with two microstrip lines on the top and bottom slots.


Table 1.
The dielectric constant of the sample layer.
| Glucose Level (mg/dL) | εr at 0.3 THz | εr at 0.4 THz | εr at 0.5 THz |
|---|---|---|---|
| 54 | 4.00 | 4.25 | 4.50 |
| 111.6 | 4.80 | 4.70 | 4.90 |
| 198 | 5.00 | 4.95 | 5.10 |
| 268.2 | 5.90 | 5.80 | 5.90 |
| 342 | 8.50 | 8.60 | 8.80 |
Publisher’s Note: MDPI stays neutral with regard to jurisdictional claims in published maps and institutional affiliations. |
© 2021 by the author. Licensee MDPI, Basel, Switzerland. This article is an open access article distributed under the terms and conditions of the Creative Commons Attribution (CC BY) license (https://creativecommons.org/licenses/by/4.0/).
Share and Cite
MDPI and ACS Style
Al-Naib, I. Sensing Glucose Concentration Using Symmetric Metasurfaces under Oblique Incident Terahertz Waves. Crystals 2021, 11, 1578. https://0-doi-org.brum.beds.ac.uk/10.3390/cryst11121578
AMA Style
Al-Naib I. Sensing Glucose Concentration Using Symmetric Metasurfaces under Oblique Incident Terahertz Waves. Crystals. 2021; 11(12):1578. https://0-doi-org.brum.beds.ac.uk/10.3390/cryst11121578
Chicago/Turabian StyleAl-Naib, Ibraheem. 2021. "Sensing Glucose Concentration Using Symmetric Metasurfaces under Oblique Incident Terahertz Waves" Crystals 11, no. 12: 1578. https://0-doi-org.brum.beds.ac.uk/10.3390/cryst11121578
Note that from the first issue of 2016, this journal uses article numbers instead of page numbers. See further details here.