2. Materials and Methods
ZrO2—Y2O3—R2O3 solid solution single crystals (R = Nd, Ce, Er, Tb, Yb) were obtained by directed crystallization of the melt in a cold container. The crystallization rate was 10 mm/h. As initial components, powders of Zr, Y, Nd, Ce, Er, Tb and Yb oxides (China) were used. The raw powders (main component content of at least 99.99%) were preliminarily mechanically stirred and loaded into the crucible. Initial melting was carried out with metallic zirconium. After melting the melt container was mechanically driven out from the heating zone at a 5 mm/h speed. The cross-section and height of the as-grown single crystals were 5 to 20 mm and 30 to 40 mm, respectively.
The phase composition of the single crystals was determined using X-ray diffraction with a Bruker D8 diffractometer. The test wafers for the phase composition study were cut out from the single crystals perpendicularly to the <100> axis. Since the reflection intensity of single crystals is far higher than that of polycrystals, (100) plane reflection allows simultaneous detection of reflections from different phases on one wafer cut, these reflections being separated at high angles of 2Θ ~ 130 deg. The phase fraction was determined from the intensity of the diffraction peaks which was normalized to the integral reflection coefficient for different phases.
The transmittance spectra were recorded on a Lambda 950 Perkin Elmer spectrometer at T = 300 K. The absorption spectra of the 4I9/2 → 4F3/2 transition of the Nd3+ ions, the 4I15/2 → 4S3/2 transition of the Er3+ ions and the 2F7/2 → 2F5/2 transition of the Yb3+ ions at T = 77 K were recorded in a single-beam setup with an MDR-23 monochromator fitted with a set of diffraction gratings for operation in the 200–2000 nm range. The radiation source was an incandescent halogen lamp.
The radiation source for the recording of the luminescence spectra for the 4F3/2 → 4I9/2 transition of the Nd3+ ions at T = 77 K was an 800 nm semiconductor laser with a 10 nm bandwidth. Non-selective luminescence spectra of Er3+ ions were recorded with excitation by a luminescent diode. A Al2O3:Ti crystal laser was used for the selective laser excitation of Er3+ and Yb3+ ions. The wavelength range of fundamental frequency sweep for the laser used was 700 to 980 nm and for the second harmonic, 350–490 nm. The spectral bandwidth was within 0.05 nm. The excitation pulse duration was 10–15 ns. The excitation source for the time-delay luminescence spectra of Er3+ ions was the second harmonic of a YAG:Nd laser (λ = 532 nm). The time delay and the time lapse for luminescence spectra recording were set with an SR250 boxcar average. The time delay was varied within 2 to 200 μs and the time lapse was set to 15 μs. Depending on the recording spectral range the radiation detectors were FEU-79 and FEU-89 photomultipliers for the 400–1200 nm spectral sensitivity range and an FD-7G photodiode for the 800–1700 nm spectral sensitivity range. The luminescence extinction kinetics was recorded with a GDS-820 C digital oscilloscope.
To obtain the true luminescence spectra of rare-earth ions in the test single crystals, we calibrated the resultant spectra to allow for the spectral sensitivity of the instrument.
The structure of the crystals was studied using transmission electron microscopy under a JEM-2100 microscope at a 200 kV accelerating voltage.
The microhardness and fracture toughness were measured using microindentation on a DM8 B AUTO microhardness tester and a Wolpert Hardness Tester 930 with a four-face diamond Vickers pyramid.
The microhardness tests were conducted at a 3 N load with
being calculated for a 100 N load.
K1c for Palmqvist type cracks was calculated using the Nihara Equation (1):
where
K1c is the tension intensity coefficient, MPa∙m
−1/2; L is the length of the radial crack, m; a is the indentation half width, m; E is Young’s modulus, Pa; H is the hardness and Pa; C is the relation of the hardness H to the yield stress σ. For zirconia-based materials C = H/σ ≈ 3 [
3].
3. Results and Discussion
To evaluate the effect of additionally introduced cations (Nd, Ce, Er, Tb, Yb and Sc) on the ZrO
2–Y
2O
3 solid solutions, the total concentrations of the stabilizing (Y
2O
3) and doping (Nd
2O
3, CeO
2, Er
2O
3, Tb
2O
3 and Yb
2O
3) oxides were varied from 2.8 to 3.2 mol.% since high fracture toughness was obtained earlier in this Y
2O
3 concentration range for the ZrO
2–Y
2O
3 system [
25]. The crystal compositions are hereinafter denoted as
xY
yRSZ where x and y are the concentrations of the stabilizing (Y
2O
3) and doping (Nd
2O
3, CeO
2, Er
2O
3, Tb
2O
3 and Yb
2O
3) oxides in mol.%, respectively. The Y
2O
3 concentration in the test solid solutions was 2 or 2.5 mol.%. The concentration of the doping oxides varied within 0.5 to 1.2 mol.%.
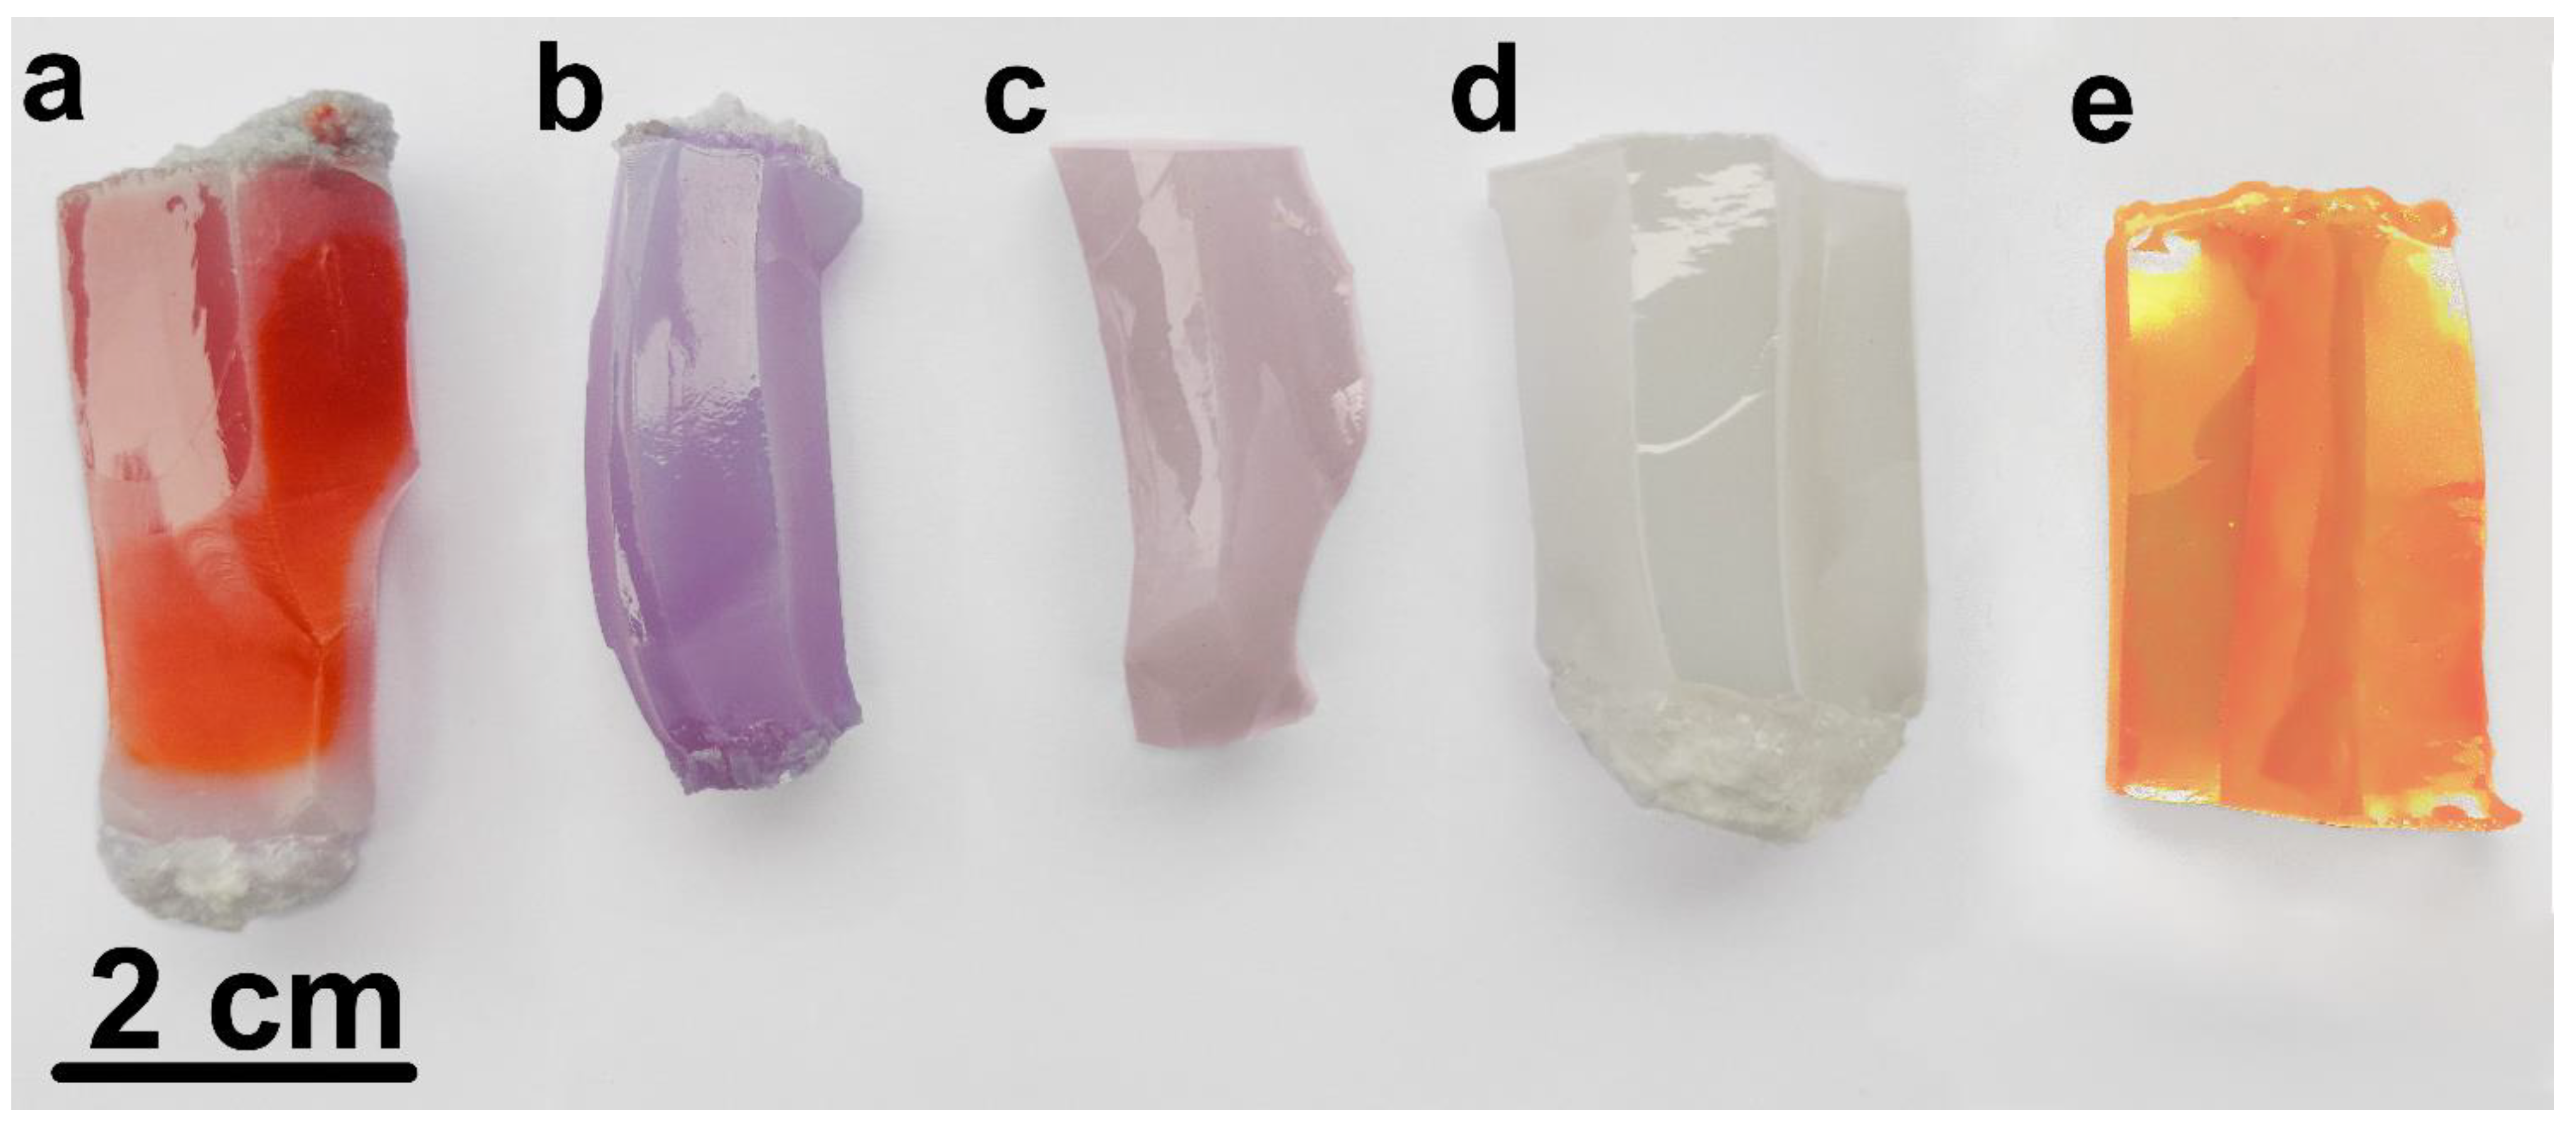
Crystals doped with various impurities had a columnar shape characteristic of directional crystallization of the melt. The crystals were non-transparent, their color being similar regardless of doping impurity type.
Figure 1 shows the appearance of 2.0Y0.8RSZ crystals where R = Nd, Ce, Er, Tb and Yb.
The phase composition of the crystals was studied using X-ray diffraction on a BrukerD8 instrument for wafers cut from the crystals perpendicularly to the <100> direction. From all the test crystal compositions, only the 2.0Y0.8NdSZ specimen was a single-phase tetragonal one. Other crystals contained two tetragonal phases, t and t’, having different tetragonality degrees.
Table 1 shows the phase composition, weight ratio of phases and tetragonality degree of the test crystals.
The tetragonal phase with a high degree of tetragonality (t) is responsible for the transformation hardening of the material, since it is subject to stress-induced tetragonal to monoclinic transition. The second tetragonal phase (t’) is non-transformable and does not contribute to this hardening mechanism.
The data summarized in
Table 1 suggest that the tetragonality degree of the phases depends on the concentration of stabilizing oxides to a lesser extent in comparison with binary systems. An important factor for zirconia stabilization with two oxides is the substitution of stabilizing oxide cations (Y) for doping oxide cations (Nd, Ce, Er, Tb and Yb) in the solid solution. For an equal total concentration of 3.2 mol.% the quantity of the transformable phase is significantly lower in the 2.0Y1.2RSZ specimens in comparison with the 2.5Y0.7RSZ specimens (R = Er, Yb, Tb and Sc). The use of doping with two stabilizing oxides allowed the retention of the quantity and tetragonality degree of the transformable phase at levels comparable with those for the 2.8YSZ specimens which exhibited the highest fracture toughness for the YSZ system [
25]. Changes in the parameters of the crystal structure at constant Y
2O
3 concentrations in solid solutions are related to the ionic radius of the co-doping cations and, probably, with their position in the lattice sites of t and t’ tetragonal phases. The incorporation of rare-earth elements (Nd
3+, Er
3+ and Yb
3+) with different ionic radii into the t and t’ phases was studied using selective laser spectroscopy and time resolution spectroscopy.
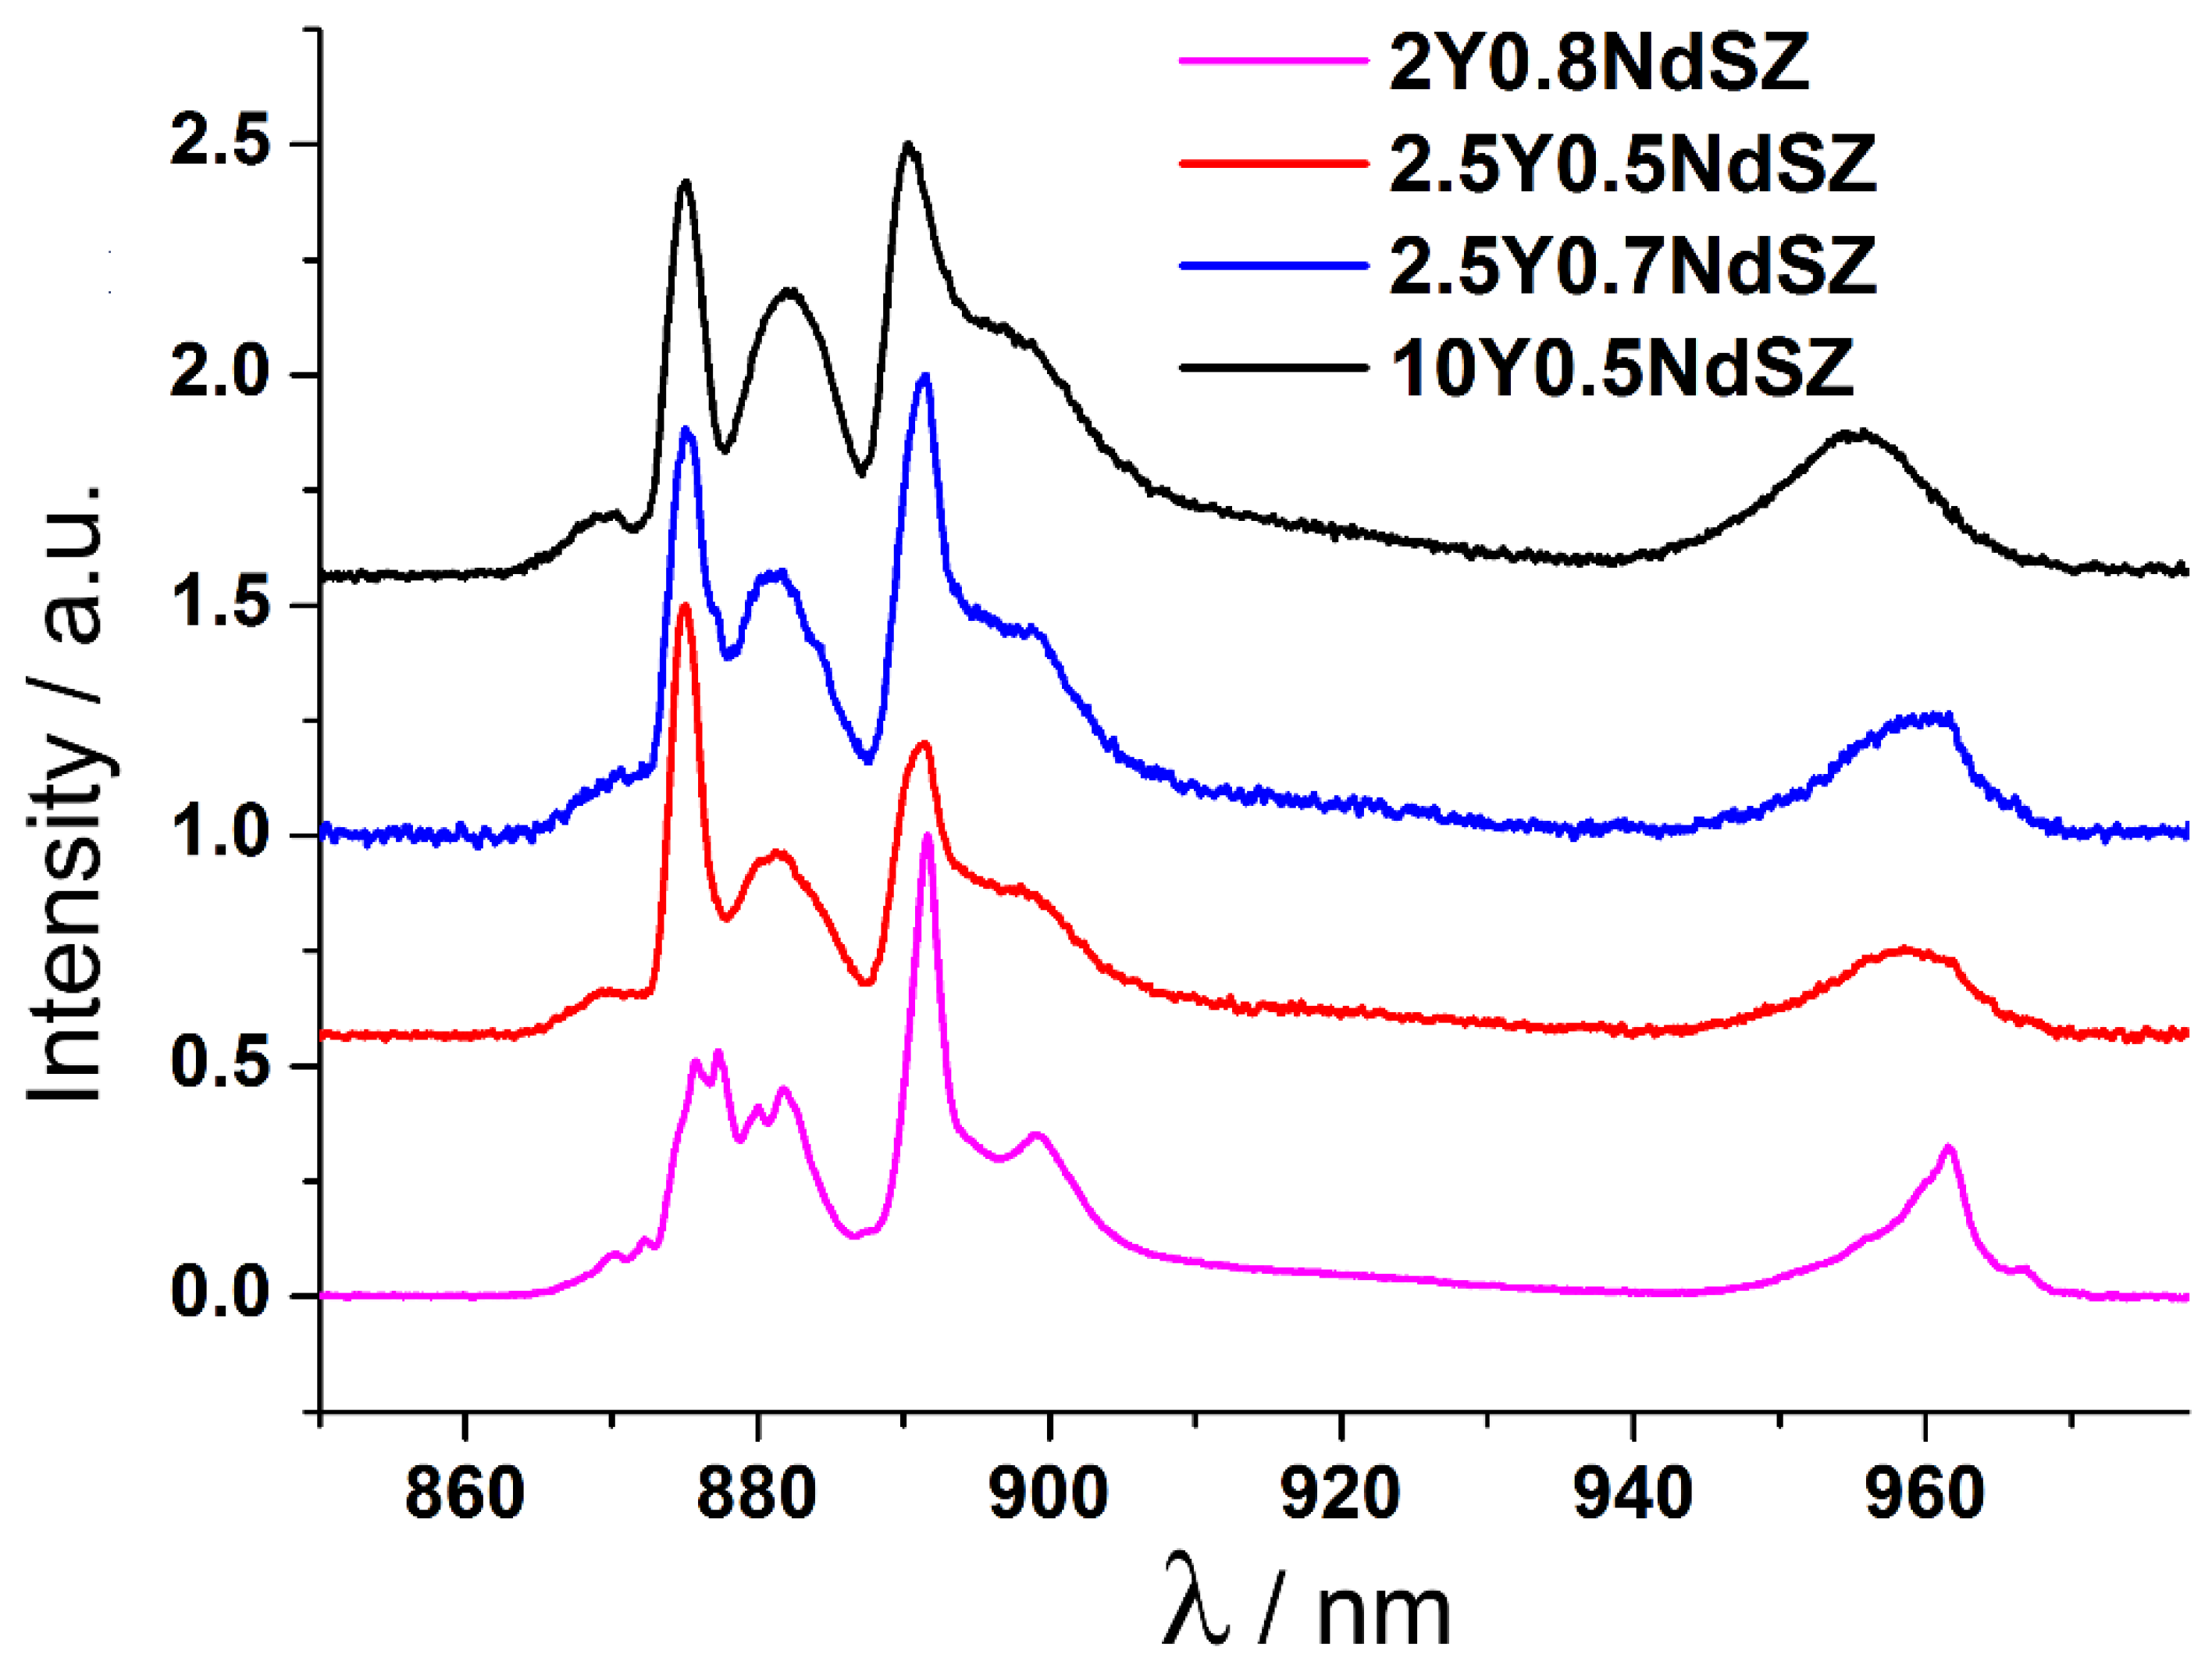
Figure 2 shows the
4F
3/2 →
4I
9/2 transition luminescence spectra of Nd
3+ ions for Nd
3+ ion
4F
5/2 level excitation at T = 77 K for the 2Y0.8NdSZ, 2.5Y0.5NdSZ and 2.5Y0.7NdSZ concentration range of the crystals. The luminescence spectrum of the cubic 10Y0.5NdSZ single crystal is shown for comparison.
Comparison of the luminescence spectra of Nd3+ ions in the YNdSZ crystals showed that the luminescence spectrum pattern of the 2.0Y0.8NdSZ crystal that contains only one phase differs from the luminescence spectra of the 2.5Y0.5NdSZ and 2.5Y0.7NdSZ crystals which have a tetragonal structure and contain the t and t’ phases. For most tetragonal crystals containing the t and t’ phases, the shapes of the spectral bands are close to that for the luminescence spectrum of the cubic 10Y0.5NdSZ zirconia crystal. Since the tetragonality degree of the transformable phase is close to unity (c/√2a ~1.006), and taking into account that the Nd3+ ions have a larger ionic radius than the Y3+ ions it was concluded that the crystals co-doped with neodymia contain predominantly Nd3+ optical centers in the non-transformable tetragonal phase. The pattern of the spectral bands of these centers is close to that of the bands in the spectra of cubic zirconia crystals, differing only in the splitting magnitude of the top Stark sublevel of the main 4I9/2 state.
Thus, the results above suggest that for the 2.5Y0.5NdSZ and 2.5Y0.7NdSZ crystals which contain the t and t’ phases, Nd3+ ions are predominantly contained in the non-transformable phase.
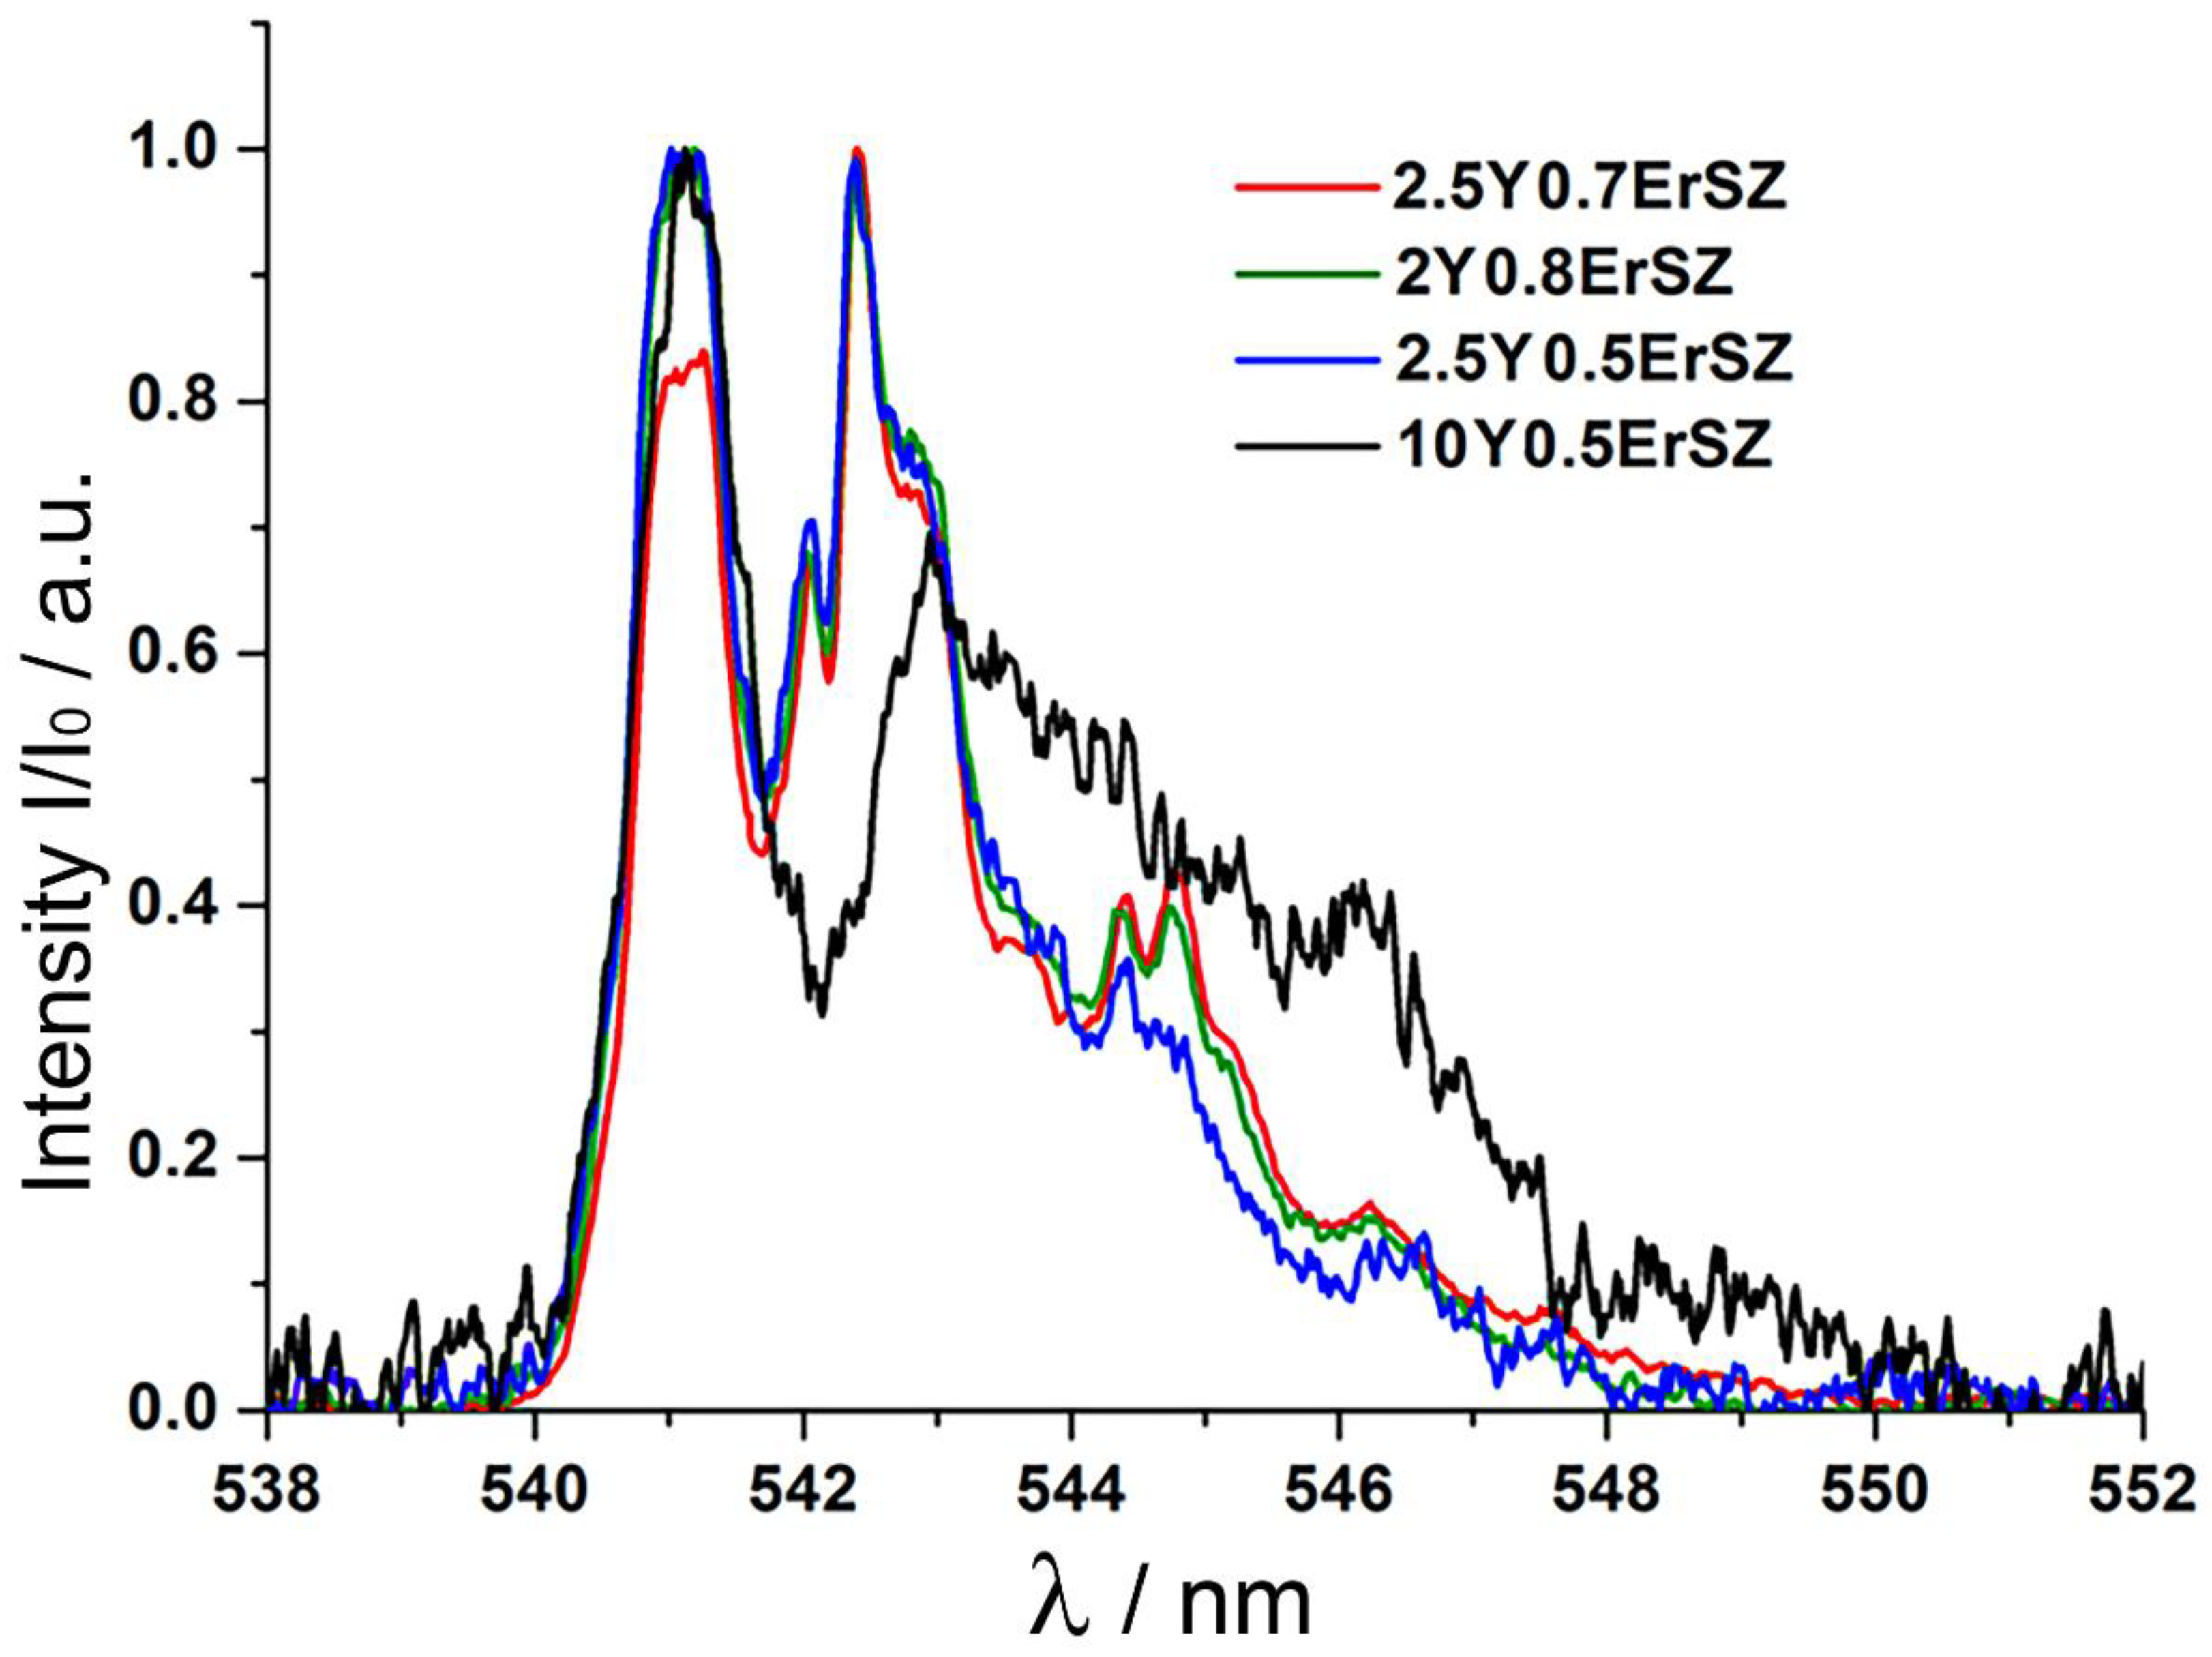
In order to study the parameters of the optical centers for ions in the end of the lanthanide series (Er3+, Yb3+) which have smaller ionic radii, absorption and luminescence spectra of Er3+ ions for the 2Y0.8ErSZ, 2.5Y0.5ErSZ and 2.5Y0.7ErSZ crystals containing the t and t’ phases were recorded and the parameters of the spectra were compared with those of the respective spectra for the cubic 10Y0.5ErSZ crystal.
The absorption spectra of the 2Y0.8ErSZ, 2.5Y0.5ErSZ and 2.5Y0.7ErSZ crystals corresponding to the transition from the main
4I
15/2 multiplet to the excited
4S
3/2 multiplet at T = 77 K are shown in
Figure 3.
The patterns of the absorption spectra for the 2Y0.8ErSZ, 2.5Y0.5ErSZ and 2.5Y0.7ErSZ crystals are similar. For the 10Y0.5ErSZ crystal, the absorption center transforms: the band near 542.1 nm and the asymmetrical band near 542.4 nm are replaced for an asymmetrical band peaking at 542.7 nm.
For a more detailed study of the formation of the optical centers in these crystals, the
4S
3/2 →
4I
15/2 transition luminescence spectra of Er
3+ ions were recorded with selective excitation to the
4F
7/2 level of Er
3+ ions by radiation in the 439 to 446 nm range with a 1 nm step. The excitation luminescence spectra for excitation with λ
ex = 440 nm and λ
ex = 445 nm for the 2Y0.8ErSZ, 2.5Y0.5ErSZ, 2.5Y0.7ErSZ and 10Y0.5ErSZ crystals are shown in
Figure 4.
For all the test crystals, a change in the excitation wavelength leads to a noticeable transformation of the luminescence spectrum patterns. Excitation at 440 nm mainly produces bands at 540–545 nm whereas excitation at 445 nm makes bands in the 546–550 nm range clearer. This indicates the presence of different optical centers of Er3+ ions in the crystals, these optical centers differing in the symmetry of their local crystalline neighborhood.
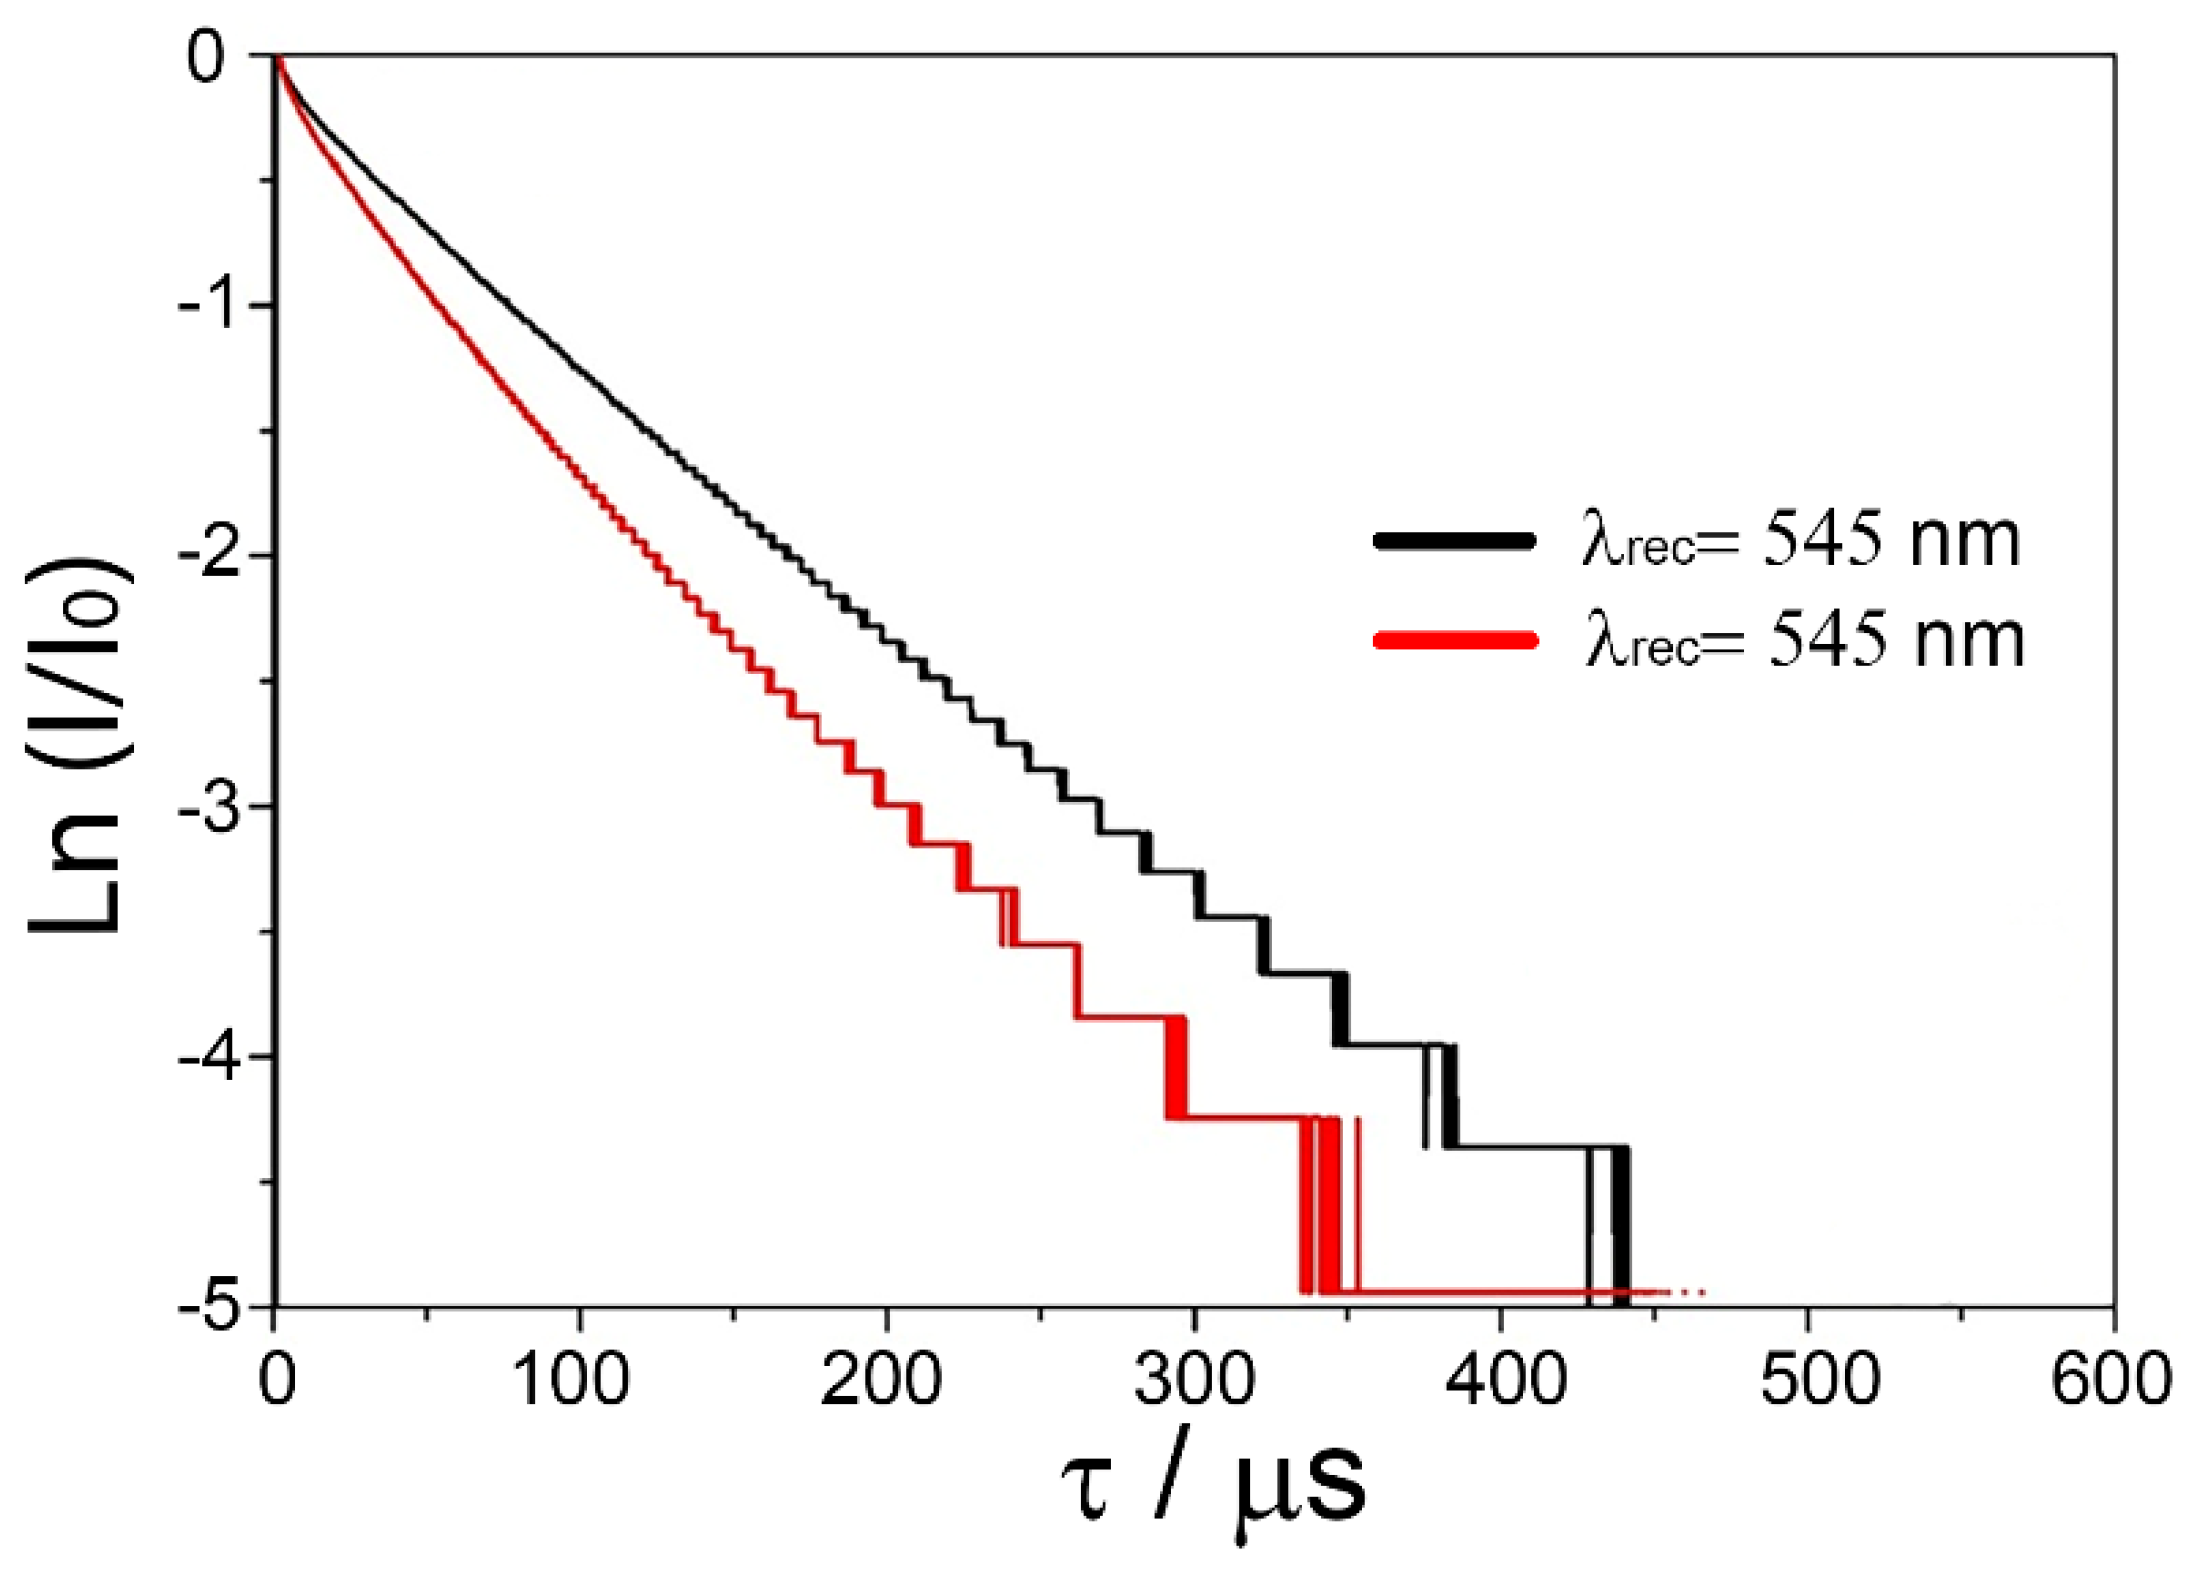
The fact that the bands in the 540–545 nm and 546–550 nm regions correspond to Er
3+ optical centers with different local neighborhood symmetry is further supported by the results of luminescence extinction kinetics analysis for the
4S
3/2 level of Er
3+ ions in the 2.5Y0.5ErSZ crystal as shown in
Figure 5. The luminescence extinction curves were recorded at λ
rec = 545 nm and λ
rec = 549 nm at excitation by the second harmonic of a λ = 532 nm YAG:Nd laser.
The non-exponential pattern of the luminescence extinction curves for the 4S3/2 level recorded at different excitation wavelengths suggests the presence of several types of Er3+ ion optical centers in the specimen. The times in which luminescence intensity declines by e times which are equal to 70 and 55 μs as determined from the decomposition curves recorded at 545 and 549 nm suggest the presence of Er3+ ion optical centers with different local neighborhood in the 2.5Y0.5ErSZ crystal. Er3+ ions with a lower local neighborhood symmetry exhibit shorter lifetime (τ = 55 μs). For Er3+ ion optical centers whose local neighborhood does not contain anion vacancies, the crystalline field will be distorted to a lesser extent and their lifetime will be longer (τ = 80 μs).
Experimental data on the luminescent spectral properties of the 2Y0.8ErSZ, 2.5Y0.5ErSZ and 2.5Y0.7ErSZ crystals did not reveal any indications of selective incorporation of Er3+ ions into the t and t’ phases. The predominant factor controlling the formation of Er3+ ion optical centers in all the test crystals is the presence oxygen vacancies in the neighborhood of rare-earth ions.
Yb3+ ions follow Er3+ ions in the lanthanide series and mark the end of the lanthanide series. The Yb3+ ionic radius is smaller than the Er3+ one.
The structure of the Stark levels of the
2F
7/2 and
2F
5/2 multiplets of Yb
3+ ions is shown in
Figure 6. The red arrow corresponds to the transition between the lower Stark level of the
2F
7/2 multiplet and the lower Stark level of the
2F
5/2 multiplet of Yb
3+ ions. The blue arrow corresponds to the transition between the lower Stark level of the
2F
5/2 multiplet and the lower Stark level of the
2F
7/2 multiplet of Yb
3+ ions.
Previously, the spectral-luminescent properties of crystals of yttrium-stabilized zirconium dioxide doped with Yb
3+ ions were studied in [
26]. The authors of this work discriminate in the spectra of crystals of cubic stabilized zirconia doped with Yb
3+ ions, characteristic lines in the absorption and luminescence spectra, designated by them as A, B, and C, due to transitions between the lower Stark levels of the
2F
7/2 and
2F
5/2 multiplets of Yb
3+ ions (
Figure 6). Line A corresponds to Yb
3+ ions occupying positions in the center of the oxygen eight-vertex. Line B corresponds to Yb
3+ ions located in the center of an eight-vertex structure and having a vacancy in the second coordination sphere. Line C belong to Yb
3+ ions occupying positions in the center of the seven-vertex formed by oxygen ions.
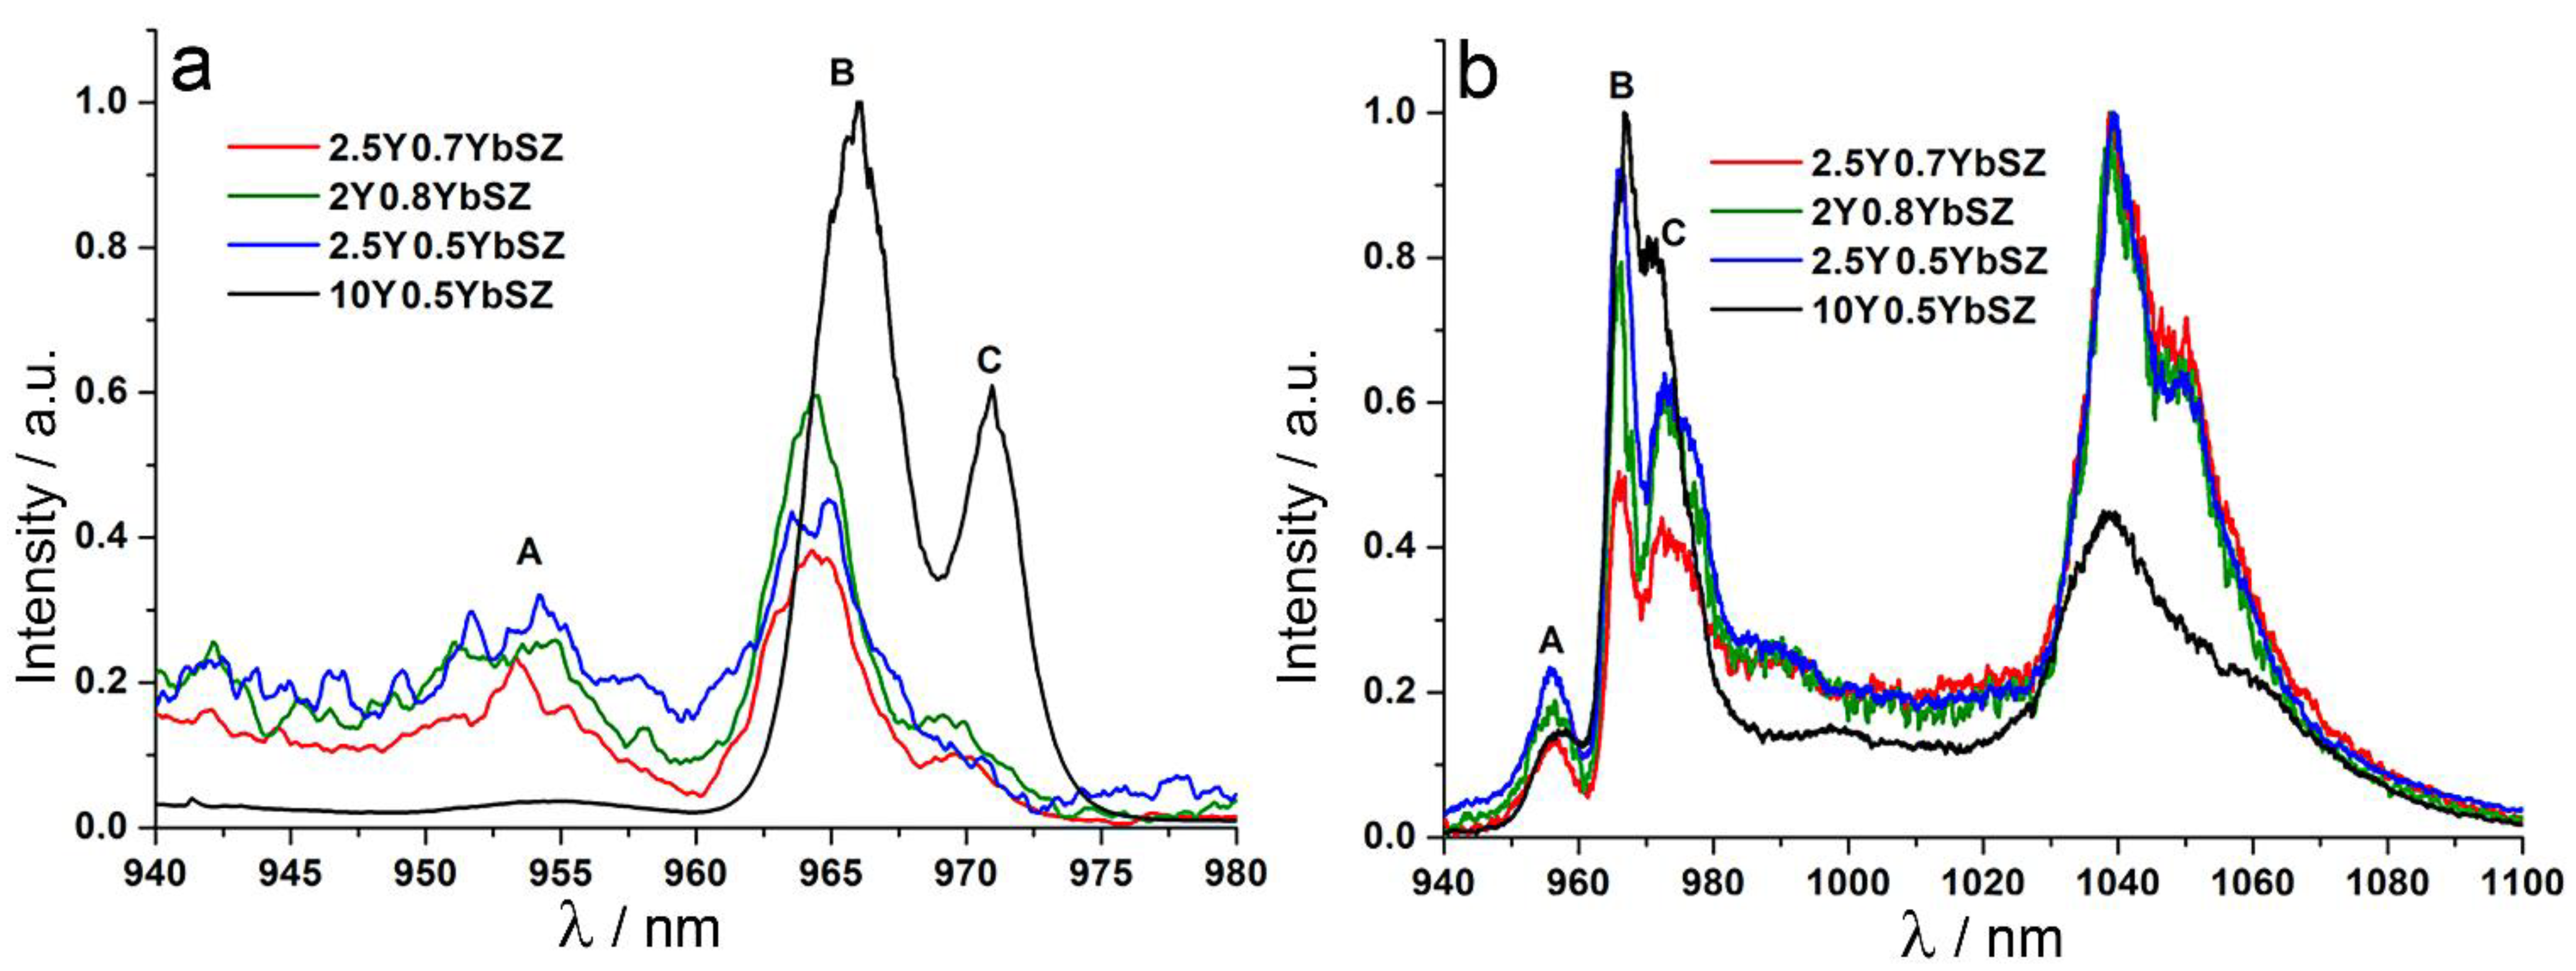
Absorption spectra for the transition the main 2F7/2 multiplet to the excited 2F5/2 multiplet of Yb3+ ions were recorded for the 2Y0.8YbSZ, 2.5Y0.5YbSZ and 2.5Y0.7YbSZ crystals at T = 77 K. The spectrum of the cubic 10Y0.5NdSZ single crystal is shown for comparison.
Fragment of the
2F
7/2 →
2F
5/2 absorption spectra for Yb
3+ ions of the test crystals corresponding to the transition between the bottom Stark components of the
2F
7/2 and
2F
5/2 multiplets of Yb
3+ ions (red arrow in
Figure 6) is shown in
Figure 7.
The absorption spectra of the tetragonal crystals, by analogy with those for the cubic 10Y0.5YbSZ crystals, contain only three spectral bands marked as A, B and C. The band A is attributed to Yb3+ ions located in the centers of the eight-vertex stars and having a vacancy in the second coordination shell. The band C refers to Yb3+ ions located in the centers of the seven-vertex stars.
Comparison between the luminescence spectra of the 2Y0.8YbSZ, 2.5Y0.5YbSZ and 2.5Y0.7YbSZ tetragonal crystals and the stabilized 10Y0.5YbSZ zirconia crystal showed that the patterns of the spectra are close while having a number of differences. The tetragonal crystals exhibit a slight shift of the A and B band peaks towards shorter wavelengths relative to the respective peaks for the cubic zirconia crystal. The band C in the spectra of the tetragonal crystals has a more complex pattern as compared with that of the cubic crystal and contains at least two differently broadened bands.
The phase analysis data that indicate the presence the t and t’ tetragonal phases in all the test tetragonal YYbSZ crystals suggest that the absorption and luminescence spectra of the 2Y0.8YbSZ, 2.5Y0.5YbSZ and 2.5Y0.7YbSZ crystals shown in
Figure 7 are superpositions of the spectral bands A, B and C of Yb
3+ ion optical centers that occupy positions in the t and t’ phases.
Spectroscopic studies of the local crystalline structure of the rare-earth ions having small ionic radii (R = Er3+, Yb3+) in the YRSZ solid solutions suggest the following. The predominant factor controlling the formation of Er3+ and Yb3+ optical centers in the YErSZ and YYbSZ tetragonal solid solutions is the presence oxygen vacancies in the neighborhood of rare-earth ion. The Er3+ and Yb3+ ions occupy positions in the t and t’ tetragonal phases. With an increase in the total concentration of stabilizing oxides, the fraction of the lower symmetry optical centers increases.
Thus optical spectroscopy studies showed that rare-earth ions of the beginning of the lanthanide series (Nd3+) are mainly incorporated in the crystal lattice of the t’ tetragonal phase. On the contrary ions of the end of the lanthanide series (Er3+, Yb3+) do not exhibit selectivity upon incorporation into t and t’ phases.
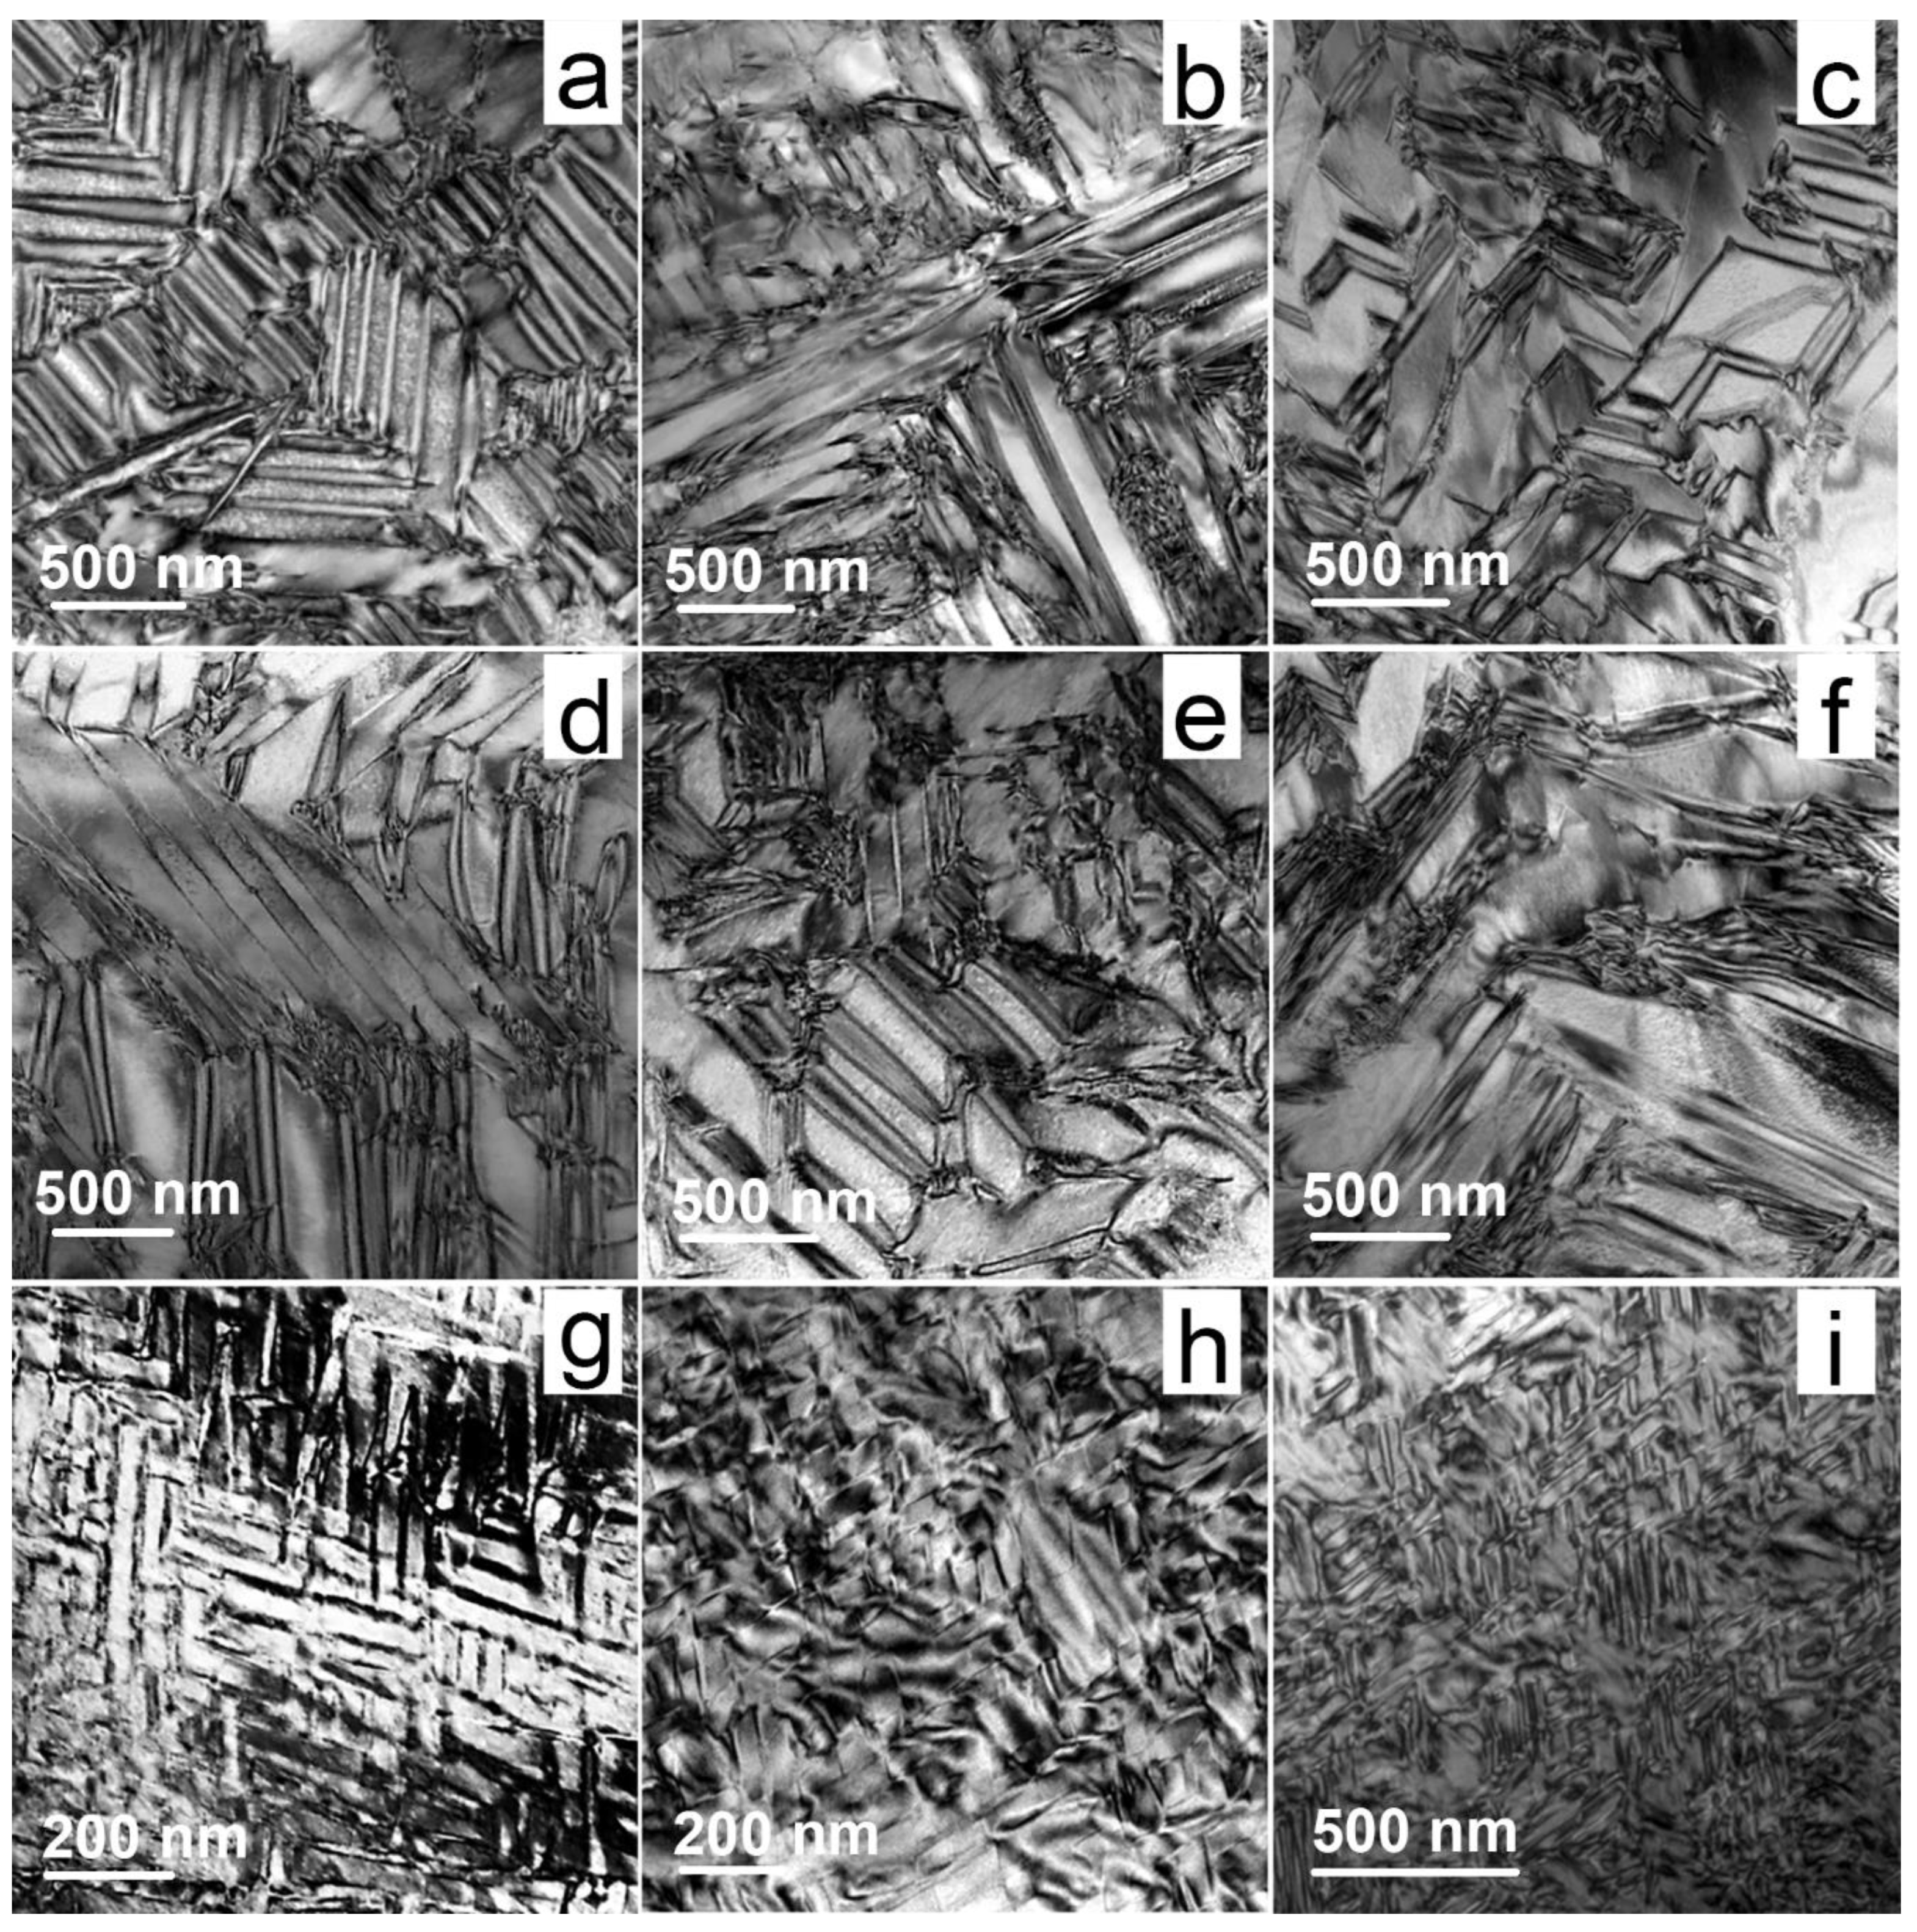
Transmission electron microscopy study of the structure of the crystals showed that all the crystals contain twins (
Figure 8). The morphology of the twins in the 2Y1.2RSZ crystals (R = Er, Yb, Tb and Sc) differed from those of the other crystals. The 2Y1.2RSZ specimens only contained small twins having quite homogeneous sizes, unlike other crystals that contained mixtures of large and small twins.
Twins form upon crystal cooling due to the transition from the single-phase cubic region to the two-phase region in accordance with the equilibrium phase diagrams. The stresses induced upon the cubic to tetragonal phase transition in the test crystals are mainly relieved by twinning rather than through dislocation formation. The twin creation completes at ~1400 °C when the diffusion mobility of cations is negligible [
27]. The phase transition temperature decreases with an increase in the stabilizing oxide concentration and hence the temperature range in which the twin structure forms becomes narrower. However the data presented in
Figure 8 suggest that the type and sizes of the twins may depend on the substitution degree of stabilizing impurity cations (Y
3+) for doping impurity cations in the solid solution while retaining the total concentration of the introduced oxides at 3.2 mol.%. For example, twins in the 2.0Y1.2RSZ crystals are finer and more homogeneous in size than in the 2.5Y0.7RSZ crystals (R = Er, Yb and Tb), potentially attributable to the difference in the temperatures of the cubic to tetragonal phase transition in these crystals.
Table 2 shows the microhardness of the test crystals. The table shows the average values of microhardness according to the results of 25 measurements. The microhardness showed no anisotropy associated with the crystallographic orientation.
The data shown in
Table 2 suggest that the microhardness increases with a decrease in the radius of the rare-earth element of the co-doping oxide: the highest microhardness was observed in the crystals co-doped with Yb
2O
3.
No fracture toughness anisotropy was found in the 2Y1.2RSZ crystals (R = Tb, Er, Yb). The fracture toughness hardly depended on the crystallographic orientation of the specimen plane and varied but slightly (by less than 10%) for different indenter diagonal orientations in the specimen plane. For the 2Y1.2TbSZ, 2Y1.2ErSZ, 2Y1.2YbSZ and 2Y1.2ScSZ crystals, the fracture toughness was close: 6.5 ± 0.5, 5.5 ± 0.5, 5.5 ± 0.5 and 5.0 ± 0.5 MPa∙m1/2, respectively. The moderate fracture toughness of these crystals can be attributed to the relatively high content of the non-transformable tetragonal phase in these crystals (~30 vol.%) in comparison with other crystals studied.
Table 3 shows the fracture toughness for the 2Y0.8RSZ crystals (R = Ce, Nd, Tb, Er and Yb) for two indenter diagonal orientation in the specimen plane.
Analysis of the data in
Table 3 showed a trend of increasing K
1c with an increase in the radius of co-doping oxide cation. The highest fracture toughness of 15 MPa∙m
1/2 was observed in the 2Y0.8CeSZ crystals for the <100> orientation of the indenter diagonal. The data in
Table 3 also suggest that the fracture toughness anisotropy is expressed to the greatest extent for the compositions having the highest fracture toughness, i.e., 2Y0.8CeSZ and 2Y0.8NdSZ.
Table 4 and
Table 5 show the fracture toughness for the 2.5Y0.5RSZ and 2.5Y0.7RSZ crystals (R = Ce, Nd, Tb, Er, Yb and Sc) for different indenter diagonal orientations in the specimen plane.
A change in the co-doping oxide concentration from 0.5 to 0.7 mol.% at a constant Y2O3 concentration of 2.5 mol.% did not cause any significant changes in the fracture toughness. The fracture toughness values of the 2.5Y0.5RSZ and 2.5Y0.7RSZ crystals for the same doping oxides were close.
The fracture toughness decreases in the 2.5Y0.5CeSZ → 2.5Y0.5NdSZ → 2.5Y0.5ErSZ → 2.5Y0.5YbSZ range of solid solutions. This trend is also observed in the 2.5Y0.7RSZ crystals (R = Ce, Nd, Er and Yb). The data in
Table 4 and
Table 5 also suggest that an increase in the fracture toughness is accompanied by an increase in the fracture toughness anisotropy. Thus, the higher the fracture toughness of the crystals, the clearer the dependence of the fracture toughness on the crystallographic orientation of the specimens.


 ,
, 


