Article

Experimental Study and Design of Experiment Using Statistical Analysis for the Development of Geopolymer Matrix for Oil-Well Cementing for Enhancing the Integrity

by
Siti Humairah A. Rahman
1,*,
Nurul Nazmin Zulkarnain
2,* and
Nasir Shafiq
2,*
1
PETRONAS Research Sdn Bhd, Bangi, Selangor 43000, Malaysia
2
Department of Civil and Environment Engineering, Universiti Teknologi Petronas, Perak 32610, Malaysia
*
Authors to whom correspondence should be addressed.
Submission received: 28 December 2020 / Revised: 26 January 2021 / Accepted: 27 January 2021 / Published: 29 January 2021

Abstract

:
This paper presents an experimental investigation on geopolymer cement formulations for enhancing oil-well integrity. Fresh slurry properties, mixability, density, free-water, and rheology were determined for possible field applications. The compressive strength and expansion characteristics were studied for the durability and integrity of the well system. Mix formulations complied with the requirements of API RP 10B-2. All formulations showed homogeneous mixability, rheological properties, the plastic viscosity (PV), and yield point (YP) were increased from 48 cP to 104 cP and 3.8 N/m2 12.4 N/m2, respectively, with the increase of the dosage of elastomeric type expandable material (R additive). The highest compressive strength of 15 MPa was obtained using 10% R additive in the mix-blend after 60 days of curing. Increasing the amount of R additive provides the optimum strength at 10.4 MPa with design 2, 3, and 4. The linear expansion was increased to about 1% at 60 days with 20% and 25% of the R additive dosage. Design of Experiment (DOE) was performed for setting three factors: curing time (A), curing temperature (B), and concentration of R additive (C) to optimize the linear expansion (response).

1. Introduction

Cementing in oil wells is a primary process that creates a cement sheath to build and maintain zonal isolation, supports the casing, and protects it against external corrosion. The operation is influenced by many geological, chemical, and mechanical parameters. For most of the cementing jobs, ordinary Portland cement (OPC) complying with American Concrete Institute (API) class G cement requirements [1]. Failure of the cement sheaths weakens the oil well integrity and is considered to be a critical issue. One of the dominant causes of cement sheath failure is cement shrinkage during the setting phase, which forms microannulus cracks [2]. Various kinds of expandable additives are mixed with the cement slurry to address the cement shrinkage issues. The philosophy of adding expandable materials is that they behave as a shape memory agent. The mechanism involves, after placing the slurry, expanding before the cement sets. When the expansion happens after the cement setting, microfractures may lead to API class-G cementing, commonly used for most oil-well cementing. However, its application has some limitations in some critical circumstances: deep-water wells, geothermal wells, and acid-rich wells [1]. Such conditions cause strength reduction, increase in porosity, and durability issues. When the cement system is subjected to high temperature and corrosion environments, OPC loses its sealing property quickly [2].
Geopolymer cement (GPC) is an aluminosilicate-based binder system that can achieve high compressive strength, resist acidic attacks, and offer a cost-effective solution. An eco-friendly binder is qualified for green cement technology. GPC can be considered an alternative to OPC for applications in critical conditions. The properties and criteria specified for developing OPC mixtures could also be used in geopolymer systems. As discussed above, establishing zonal isolation is the main criteria for cementing system design. Other requirements are holding the casing string and exhibiting long-term well integrity [1,3]. For several years, the oil-well cementing stakeholders have made concerted efforts to advance the formulation, placement, and characteristics of hardened cement mixtures. The design of a cementing system for a downhole is required to perform over a wide range of temperatures, below freezing temperature in permafrost zones to temperatures exceeding 500 °C in geothermal wells [1,3].
In the cement mixture preparation, the mixability of ingredients in the form of slurry is an essential requirement that ensures the formulation’s homogeneity and compatibility. Mixing operation is characterized by applying the amount of energy to the cement system. When a large amount of energy is used for mixing, it is not considered an optimum mix. When a small amount of energy is applied for a short period to achieve homogeneous mixing, it is preferred because it ensures adequate cement slurry de-flocculation. The mixing procedure described by API RP10B-2 [1] recommends shearing of the cement system for 15 s at 4000 rpm or for 35 s at 12,000 rpm in a Warring blender. It usually applies 5.9 KJ/kg of energy to the cement slurry. In such a case, the mixability of cement can be adjusted with the addition of a suitable type dispersant or changing the total volume fraction of solids in the cement system [4].
Cement slurry density is very critical to control the pumping operation. For the cementing operation, slurry density is the total equivalent circulating density (ECD) during the cementing job. In this respect, ECD is the effective density, which combines current mud density or cement slurry density and annular pressure drop. ECD is crucial in designing drilling engineering jobs because it limits each section’s depth to be drilled and leads to losses. In SI units (Kg/m3), ECD can be calculated as:
ECD = Annular   Pressure   Loss × 100 9.81 × True   Vertical   Depth   ( TVD ) + Cement   Slurry   Density
Rheology of the cement slurry in the fresh is another influencing characteristic. The cement slurry’s rheological properties are characterized by yield point (YP) and plastic viscosity (PV). The yield point or yield stress values indicate the amount of force or stress required to move the fluid until it exceeds the elastic limit. Simultaneously, the plastic viscosity is the measure of resistance against the flow, expressed in centipoise (cP). Basic rheological modeling used for cement slurry is defined by the Herschel-Bulkley, Power and Bingham model [5]. In an experimental study, rheological properties are measured using a standard rheometer or rotational viscometer. Torque, as a function of rotation per minutes (rpm), is used to derive the plastic viscosity and yield stresses [5,6]. Sometimes, by adding a small dosage of a suitable type of dispersant, the cement system’s rheological properties can be controlled to the desired level.
Evaluating the amount of free water and determining static stability during pumping is another essential requirement. The presence of free water and cement instability indicates a cement system [1,7,8]. This issue may jeopardize zonal isolation, especially in highly deviated wells, including the horizontal well. Free water provides a path for gas to migrate through. It is a very fundamental property to control, especially when cementing across the gas formation. Zero free water is a mandatory requirement when cementing across this area. The cement system’s instability can be detected in the lab by checking the cement slurry sedimentation when left static. Sedimentation occurs when the cement particles are free to fall to the bottom. It describes the particle polydispersity concept. The small and large particle do not behave identically [9,10,11]. Free water and stability can be controlled with dispersant or anti-settling or water absorption chemicals such as bentonite. Eric et al. [12] reviewed various types of common additives used in the industry for improving the cementing operation.
After pouring and placing the cement slurry inside the targeted zone, it starts to stiffen and harden, which reaches the designed strength at some point in time. Monitoring and estimating the cement strength is one of the essential requirements for the cementing operation qualification. In such cases, compressive strength measurement data provides valuable information for making a decision prior to drilling and casting the next section, or to perforate the well, or either to kill and kick the well. Similarly, dimensional changes in hardened cement indicate the level of stability of the hardened cement system’s internal volume. Shrinkage can cause de-bonding between the cementing system and the casing, and between the cementing system and the formation, which creates a path for formation gas and liquid to migrate through. Shrinkage of cement happens during the hydration process of cement mass. Most of the cementing system’s integrity issues are primarily initiated due to the system’s cracking, which may be caused due to cement shrinkage. To avoid cement shrinkage, cement must expand instead of shrinking by adding the chemical that makes the cement expand [9,12,13]. The formation of cracks in the cement sheath allows for the migration of fluid to increase the casing pressure [10,14]. The extended service life of the cementing system is essential for the integrity of the wells.
There are usually two methods to enhance cement’s service life: repairing cracks or adding self-healing additives to design the cement matrix [14]. Cement expansion is evaluated by measuring cement’s linear expansion using international standard API RP 10B-5/ISO 10426-5:2003 [6]. An Investigation of the geopolymer matrix revealed that it exhibited 100–1000 times lower CO2 permeability than that of the API class G cement paste [9]. Adding an amount of 15% slag in the GPC system improved the microstructure. It reduced the CO2 permeability by ten times compared to GPC without slag [2,9].
There is very little research available on the application of the geopolymer binder in oil well-cementing jobs. However, a wide range of research is available on developing geopolymer concrete for civil engineering applications. Such research results could be referred for investigating the potentials of geopolymer for oil well operations. Rheology and fresh paste properties are some of the control parameters for pumping and pouring the slurry deep inside the well. Rheological studies of geopolymer concrete could be useful references for the feasibility of the geopolymer in oil-well cementing. Plank et al. [15] discussed the effects of Polycarboxylate Superplasticizers on improving the plasticizing behavior of standard cement concrete and dispersion of the cement particles within the matrix homogeneity. Some other studies reported that polycarboxylate superplasticizers heavily influenced the rheological properties of cement pastes. In such studies, researchers used self-synthesized PCE copolymers with different carboxylic densities. The researchers used three available models for theoretical analysis of the experimental results: Power-law, Bingham, and Herschel-Buikley [16,17].
This study aimed to develop the geopolymer binder formulation using fly ash as the base material for enhancing the well system’s integrity. To induce expansion characteristics in the geopolymer binders, different dosages of elastomeric material called the R additive were mixed. For that purpose, four types of trial formulations were prepared and tested in the laboratory to investigate the system’s performance in an anticipated borehole environment, such as the temperature of 60 °C. The experimental analysis included investigating the cement slurry properties in the fresh and hardened state, such as density, mixability, rheology, free water, static stability, fluid loss, compressive strength, and cement expansion. To control such properties, effects of the addition of chemical admixtures were also included in the scope. Achieving the most optimum cement formulation for the desired conditions is a challenging task. Therefore, experimental results referred to predicting the best formulation for application in the desired conditions.

2. Material Properties, Methodology and Testing Procedures

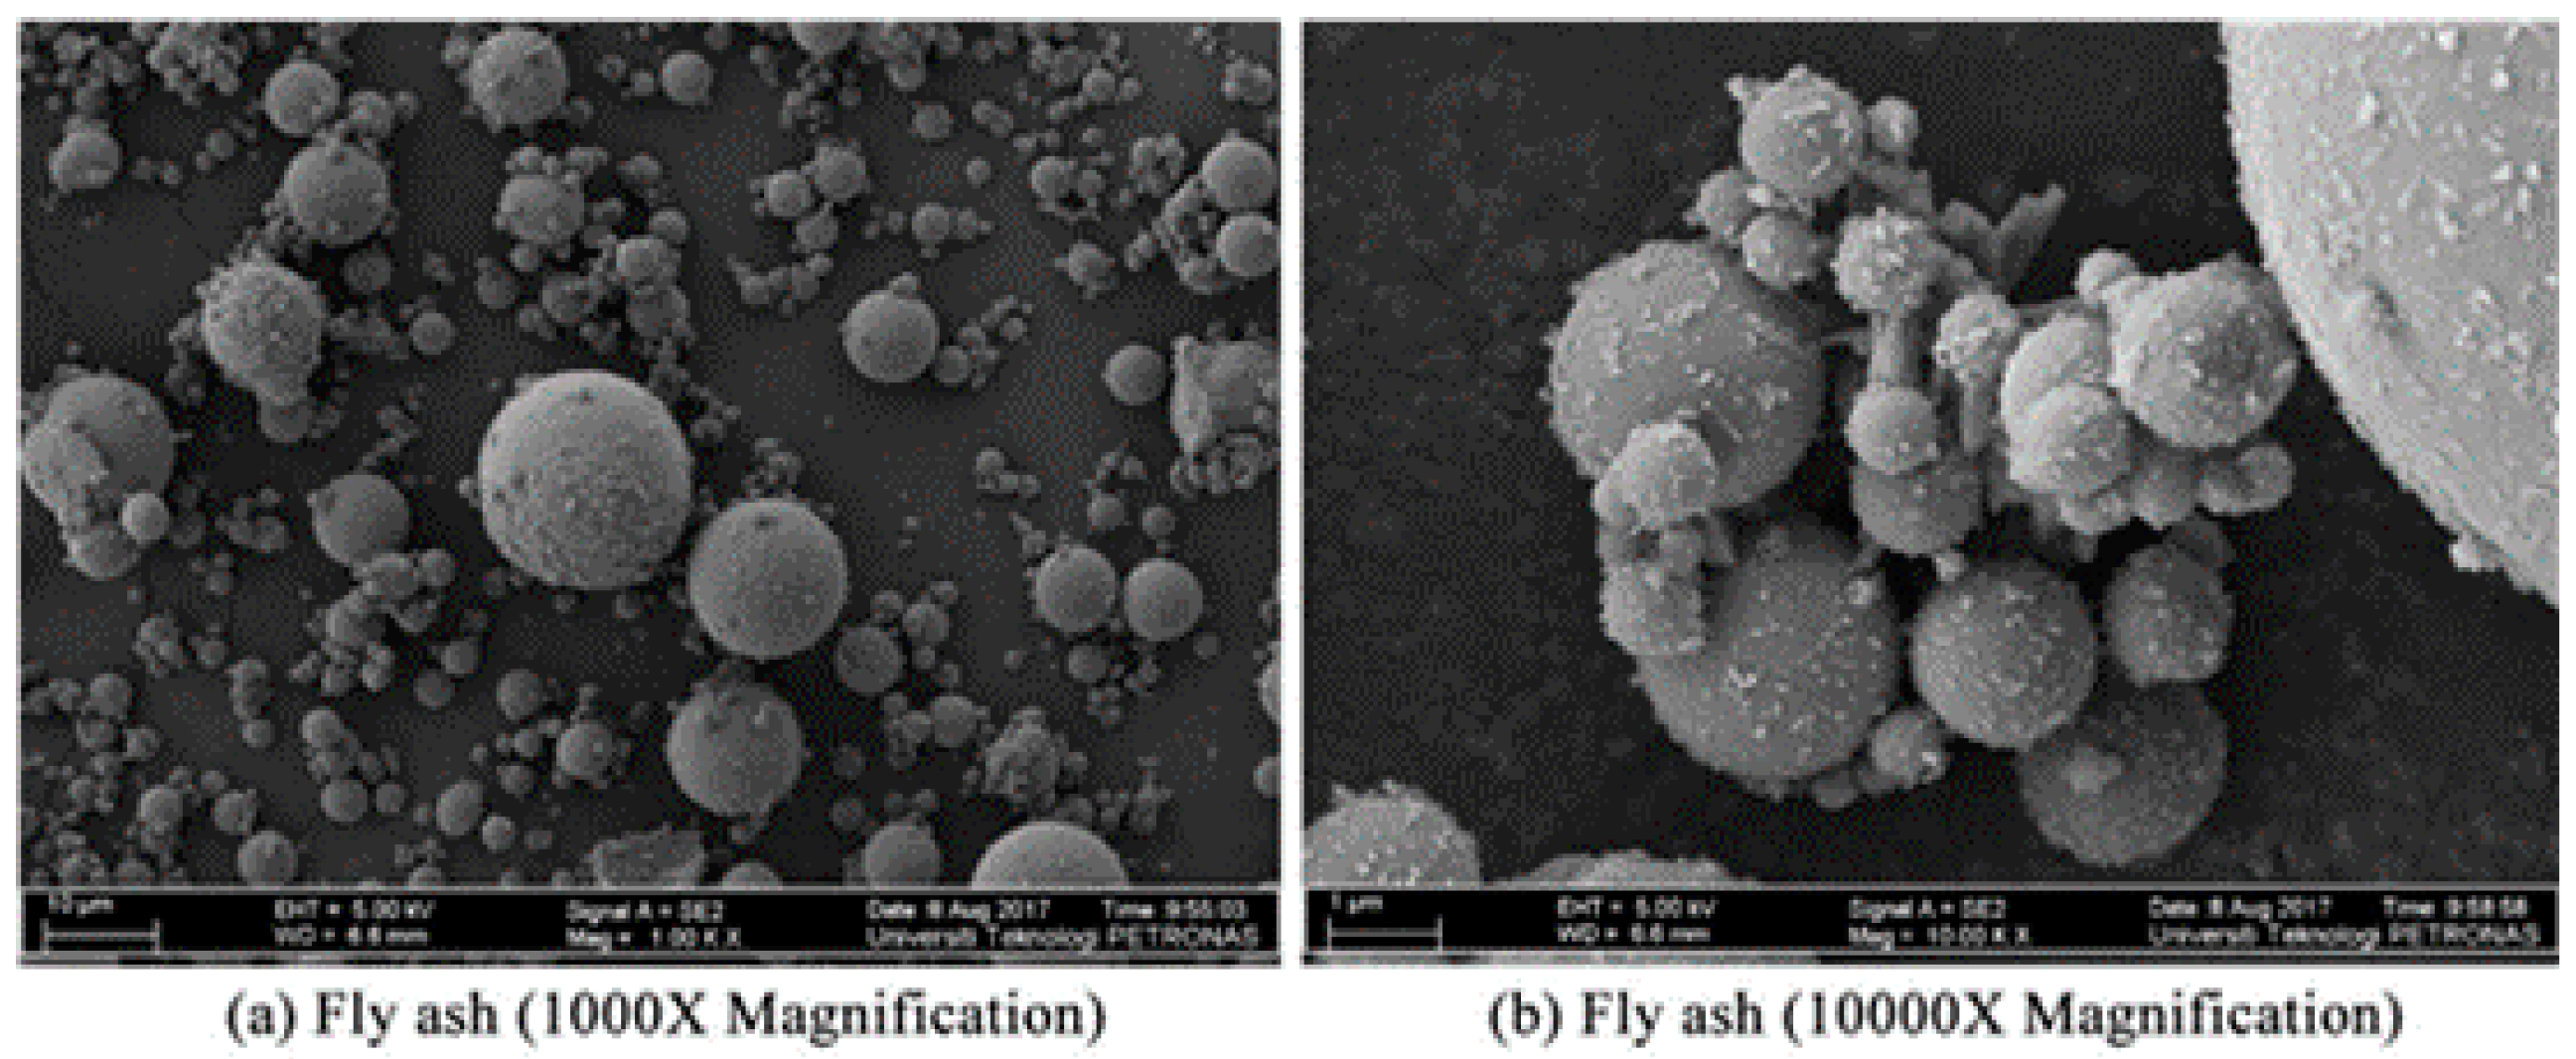
2.1. Materials and Properties

Low calcium fly ash conforming to ASTM class F was used as the base material or precursor obtained from Malaysia’s local source. Table 1 shows the chemical composition measured using X-ray fluorescence, XRF technique. Sodium hydroxide of 8 molar concentration was prepared and mixed with sodium silicate with a ratio of 0.25. This solution was used as an alkaline activator in the geopolymer cementing system. As discussed in many research studies [1,2,11,12], the industry uses many additives to improve its performance to the desired level. In this study, slag cement was used as a strength enhancer; the slag fraction was kept at 10% by fly ash weight. To enhance rheology and other properties in the fresh state, elastomeric material was used with different concentrations in the solid blend component. The details are given in Table 2.
To isolate the potential flow zones, the cement slurry is designed to provide a physical barrier only when it attains a minimum of 0.35 MPa compressive or sonic strength. This threshold exceeds the minimum static gel strength value needed to prevent fluid influx. In the oil industry, the time required to attain the compressive strength threshold value is called wait on cement (WOC). In the drilling operation, the wait on cement time (WOC) is considered to be an essential parameter.

2.2. Mixing and Sample Preparation

Geopolymer cement slurry was prepared by mixing the solid blend with an alkaline activator. The solid blend was prepared by mixing the fly ash (FA) with expandable material (R additive) using different percentages. The different mixes were designated by designs 1, 2, 3, and 4. The R additive was made from elastomer-based material with an SG of 0.945. All designs used in this study are summarized in Table 2. All cement slurries were mixed at 4000 rpm and 12,000 rpm, as per API RP10B-2 [3].

2.3. Apparatus and Testing Procedures

2.3.1. Mixer

Constant Speed Mixer Model 3260 was used to mix cement formulations, as per API RP 10B-2. The mixer features included digital speed control and displays with built-in tachometer and programming capabilities. Up to 600 mL of the slurry was prepared for every mixture. The mixer was first operated at 4000 rpm for 15 s to allow cement solids to be added to the water, and then it was run for 35 s at 12,000 rpm.

2.3.2. Slurry Density

Pressurized mud balance was used to measure the cement slurry density. The testing procedure included pouring cement slurry in the cup and then screwing the pressure cap. A pressurizing plunger filled with slurry was attached to the cap. The pressure was applied to allow air bubbles entrained in the slurry to escape. The device was then placed on a fulcrum, and a sliding weight was adjusted until both sides were balanced.

2.3.3. Free Water

A measuring cylinder was used to determine the free water in the cement slurry. The testing method followed the procedure illustrated in API RP10B-2. The cement slurry was poured into the 250 mL measuring cylinder and left undisturbed for 2 h. The water presented on the top of cement was collected and measured as the free water.

2.3.4. Rheology

The rheology tests of GPC samples were performed according to API RP 10-B2 using Fann-35 atmospheric rheometer. Five average readings were recorded from a lower speed to a higher speed (3 rpm, 6 rpm, 100 rpm, 200 rpm, and 300 rpm), and similarly, from a higher speed to a slower speed. Plastic viscosity (PV) and Yield Point (YP) were calculated using the average reading using Equations (1) and (2).
PV = ( Reading   at   300   rpm Reading   at   100   rpm ) ×   1.5
YP = Reading   at   300   rpm PV
The 10 s and the 10 min gel was also recorded by taking the highest deflection reading at 3 rpm after the cement was left static.

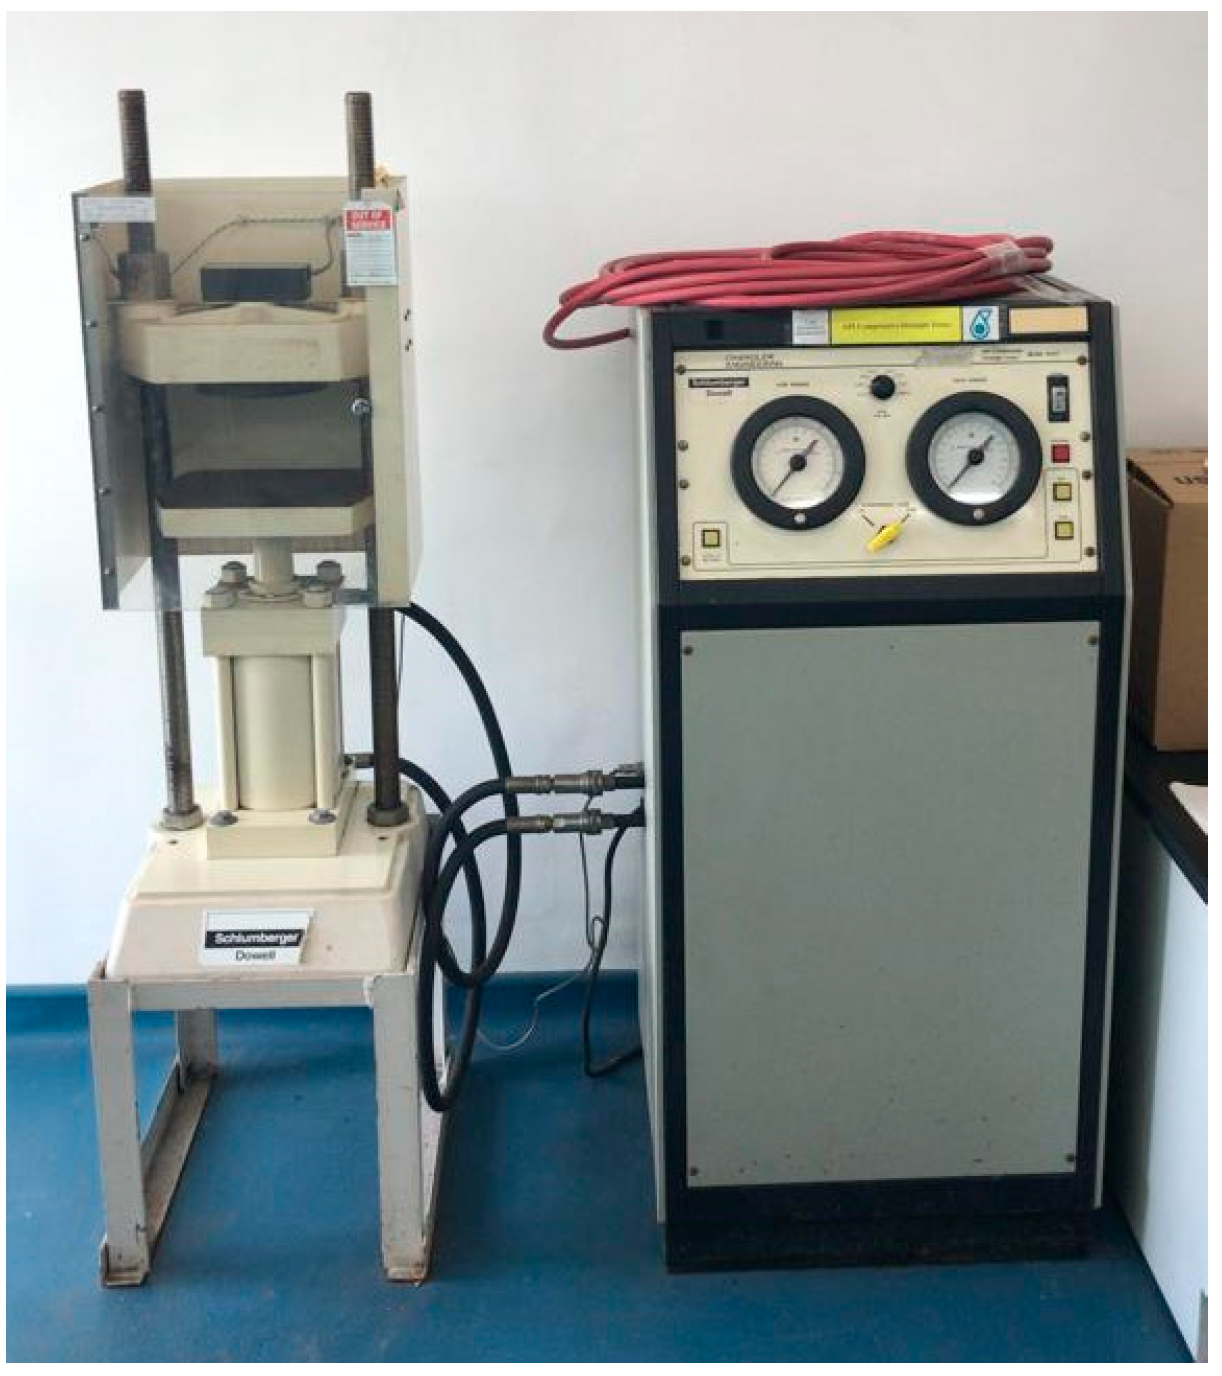
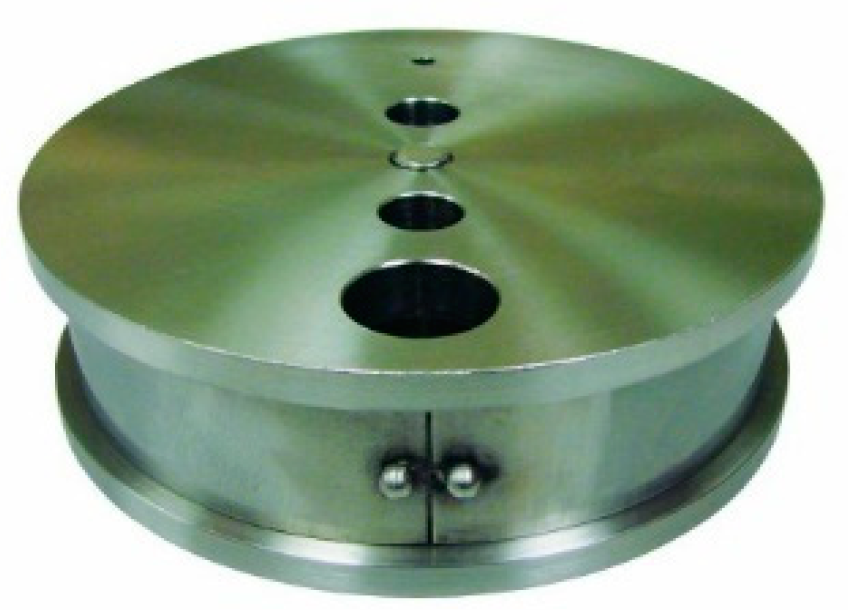
2.3.5. Compressive Strength

Test samples of cement slurries were prepared according to the API/ISO mixing procedure. The fresh cement slurry was poured into 50 mm (2 inches) size cubic molds. After casting, samples were cured for different periods at a temperature of 60 °C. When samples reached the desired curing time, they were removed from the molds and placed in a hydraulic press called the API Compressive Strength Tester to determine the compressive strength, as shown in Figure 1. The load was applied to the samples until they failed or were crushed. The compressive strength was estimated by dividing the failure load with the cube surface area.

2.3.6. Linear Expansion

Figure 2 shows the expansion cell used for measuring the linear expansion of cement conforming to API RP10B-5 requirements.

2.3.7. Water Bath

A water bath is used in this study to cure the cement with a 60 °C test temperature and at atmospheric pressure.

3. Results and Discussion

3.1. Mixability, Density, and Free Water

It was observed that all mixture types were easily mixed according to the procedure and did not show any instability. No additional mixing time was required. The cement slurry density of all mixtures was measured upon completion of the mixing phase using pressurized mud balance. The slurry density of the mixture design-1 was measured at 1.76 g/cm3, design-2 was 1.74 g/cm3, design-3, 1.66 g/cm3, and design-4 density was 1.64 g/cm3. The increase in the R additive (elastomeric material) dosage caused a slight reduction in slurry density. Zero amount of free water was obtained in all designs after the cement was left in stationary conditions for 2 h.
Thickening time and fluid loss are two critical parameters of the fresh cement slurry for oil well-cementing operation. It was observed that the addition of elastomers R additives caused a reduction in the thickening time of the matrices. The lowest R additive thickening time was measured as 4 h reduced to 1 h 40 min with the highest dosage. A static fluid loss tester was used to measure fluid loss under static conditions. A 7 MPa pressure was applied on the cement slurry, and the filtrate was collected at the bottom for 30 min. It was observed that the R additives behaved towards controlling the fluid loss of the matrix. The increase in R additive dosage improved the API fluid loss measurement from the lowest dosage to the highest dosage. It was measured as 95 mL/30 min to 40 mL/30 min.

3.2. Rheology

The rheological properties of the cement mixture are strongly affected by many factors, such as the solid/water ratio, homogeneity of the cement mixture in the presence of dispersant, the interaction between cement and chemical admixture, and curing temperature. This section discussed the effect of polycarboxylate-based dispersant when added into cement slurry. Dispersants, also known as a friction reducer, are used in oil well cement slurries to improve the slurry’s flow behavior and rheological properties. Table 3 shows the rheological behavior of all four mixture designs that varied by the percentage of the R additive (10% to 25% by weight of the concrete blend). As shown in Table 3, it can be observed that the increase in the dispersant content from 10% to 25% has increased the rheological parameters, plastic viscosity (PV), and the yield point (YP). The mixture design-1 contained 90% fly ash and 10% R additive showed PV’s value 48 cP. The 15% dosage of R enhanced the plastic viscosity by 54%, and with 25%, it obtained 2.17 times higher than the design-1. It is indicated in the literature that difficulties in pumping the cement slurry through the wellbore happen with the slurry showing plastic viscosity more than 100 cP [18,19]. Therefore, adding a dispersant dosage of up to 20% did not cause any difficulty in the pumping to the downhole.
Similarly, the yield point Y also increased with the increase in the dosage of R additive. With a 25% dosage, it was measured as 3.25 the value of YP, which was measured with 10% content. It can be concluded that, with the increment in dispersant content, the rheological parameters increased, and the density was slightly decreased.
The observations on R additives’ performance agreed with the results of researchers studying expandable materials to optimize the rheological characteristics and self-healing behavior of cement slurries. In 2020, Richhariya et al. [20] published research on the cement slurry’s rheological and self-healing characteristics using dual-coated polyacrylamide (DPAM). In their findings, cement slurry containing a 16% dosage of DPAM showed the optimal rheological characteristics and self-healing performance. The shear stress and the shear rate results indicated that the slurries behaved like Bingham plastic. It was inferred that the cement slurry achieved higher viscosity because of the gelation characteristics. Whereas, at a lower shear rate, the yield point (YP) of the cement slurry’s gelation dropped quickly. The viscosity caused a sudden reduction in viscosity. Hence, viscosity with the increase in the shear rate also showed that the viscosity also increased. They did not find many variations in shear stress and viscosity due to further changes in the dosage of DPAM in the cement slurry.

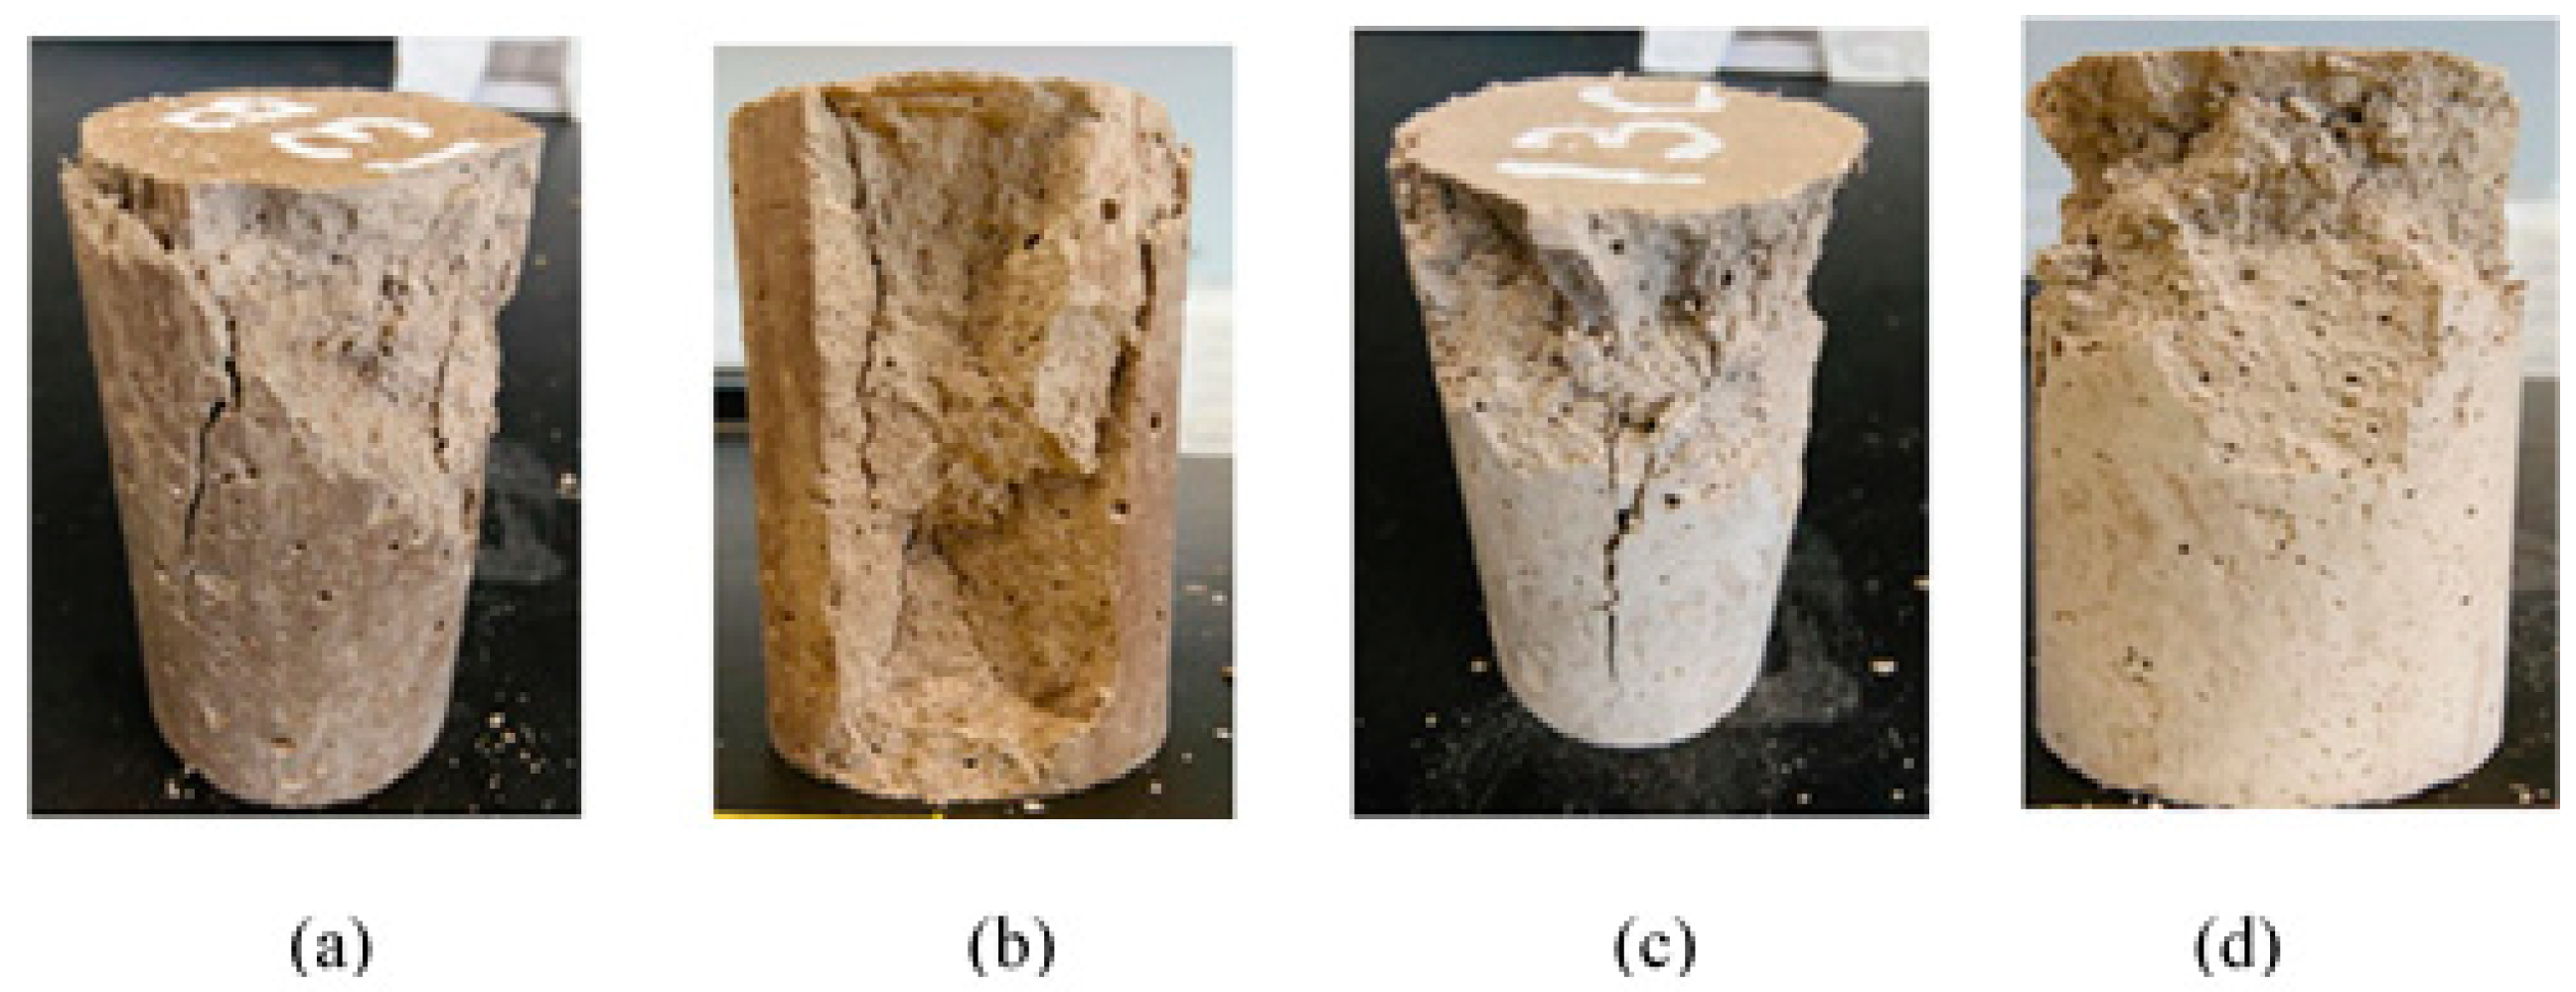
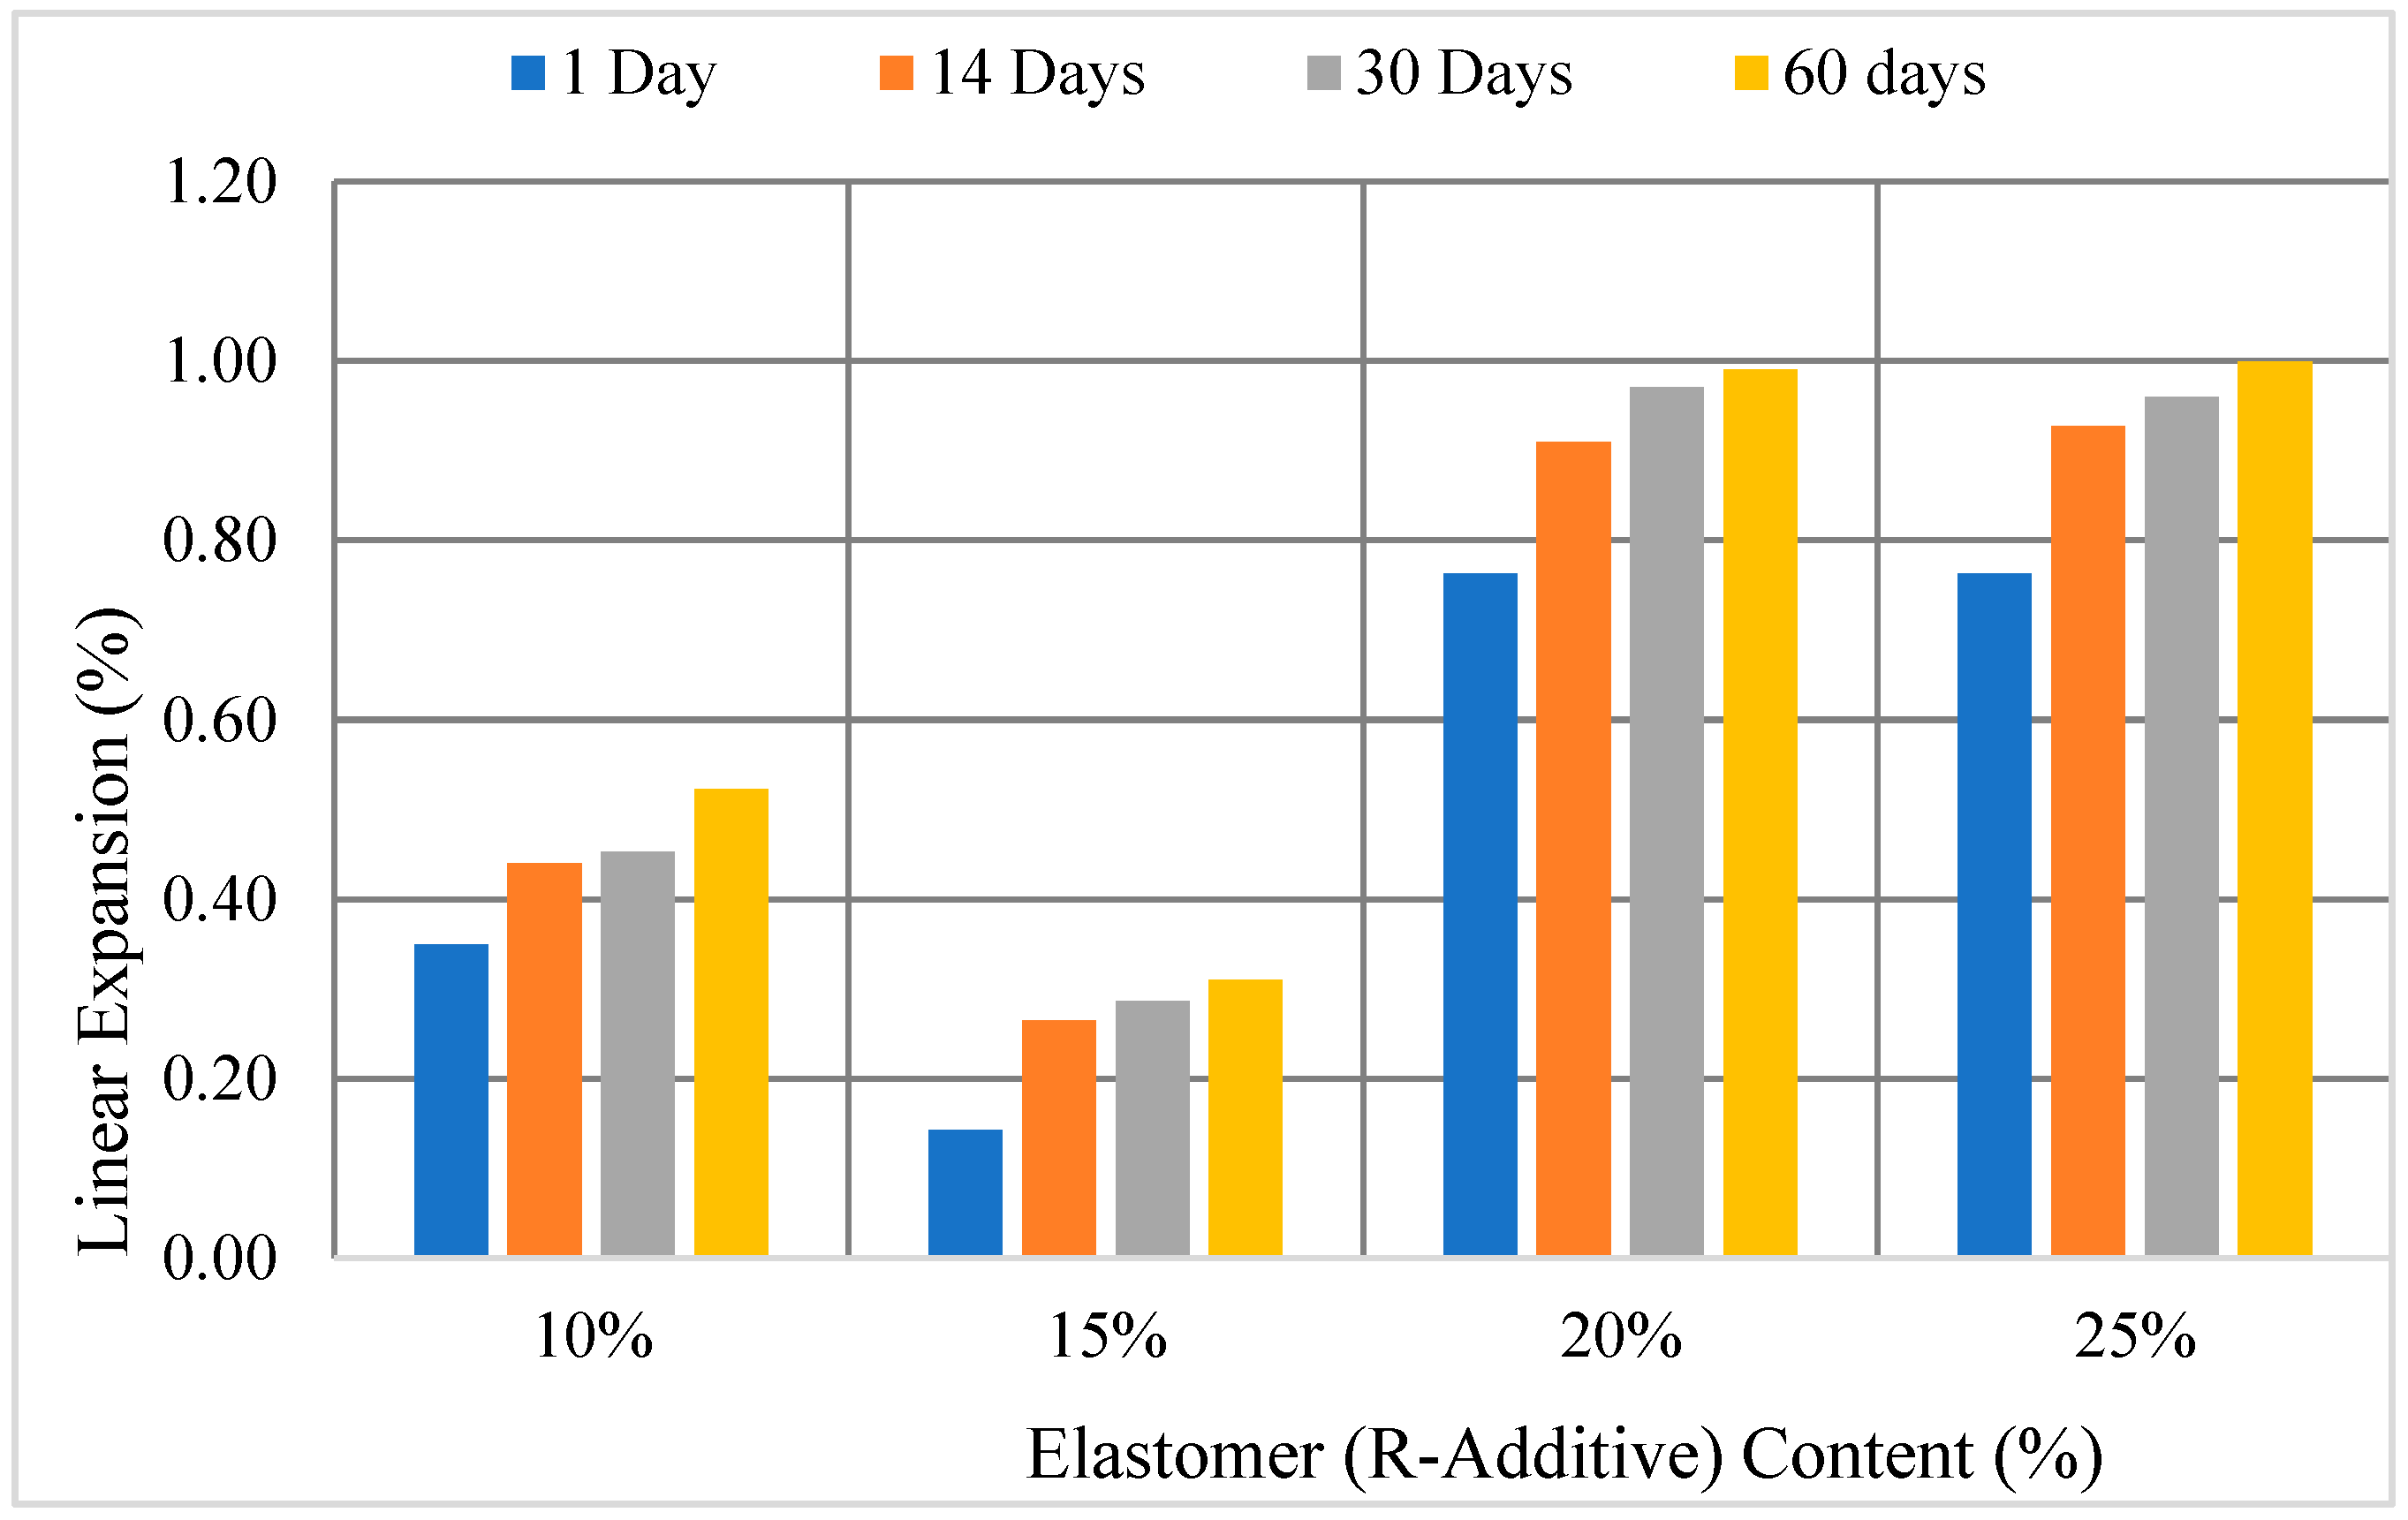
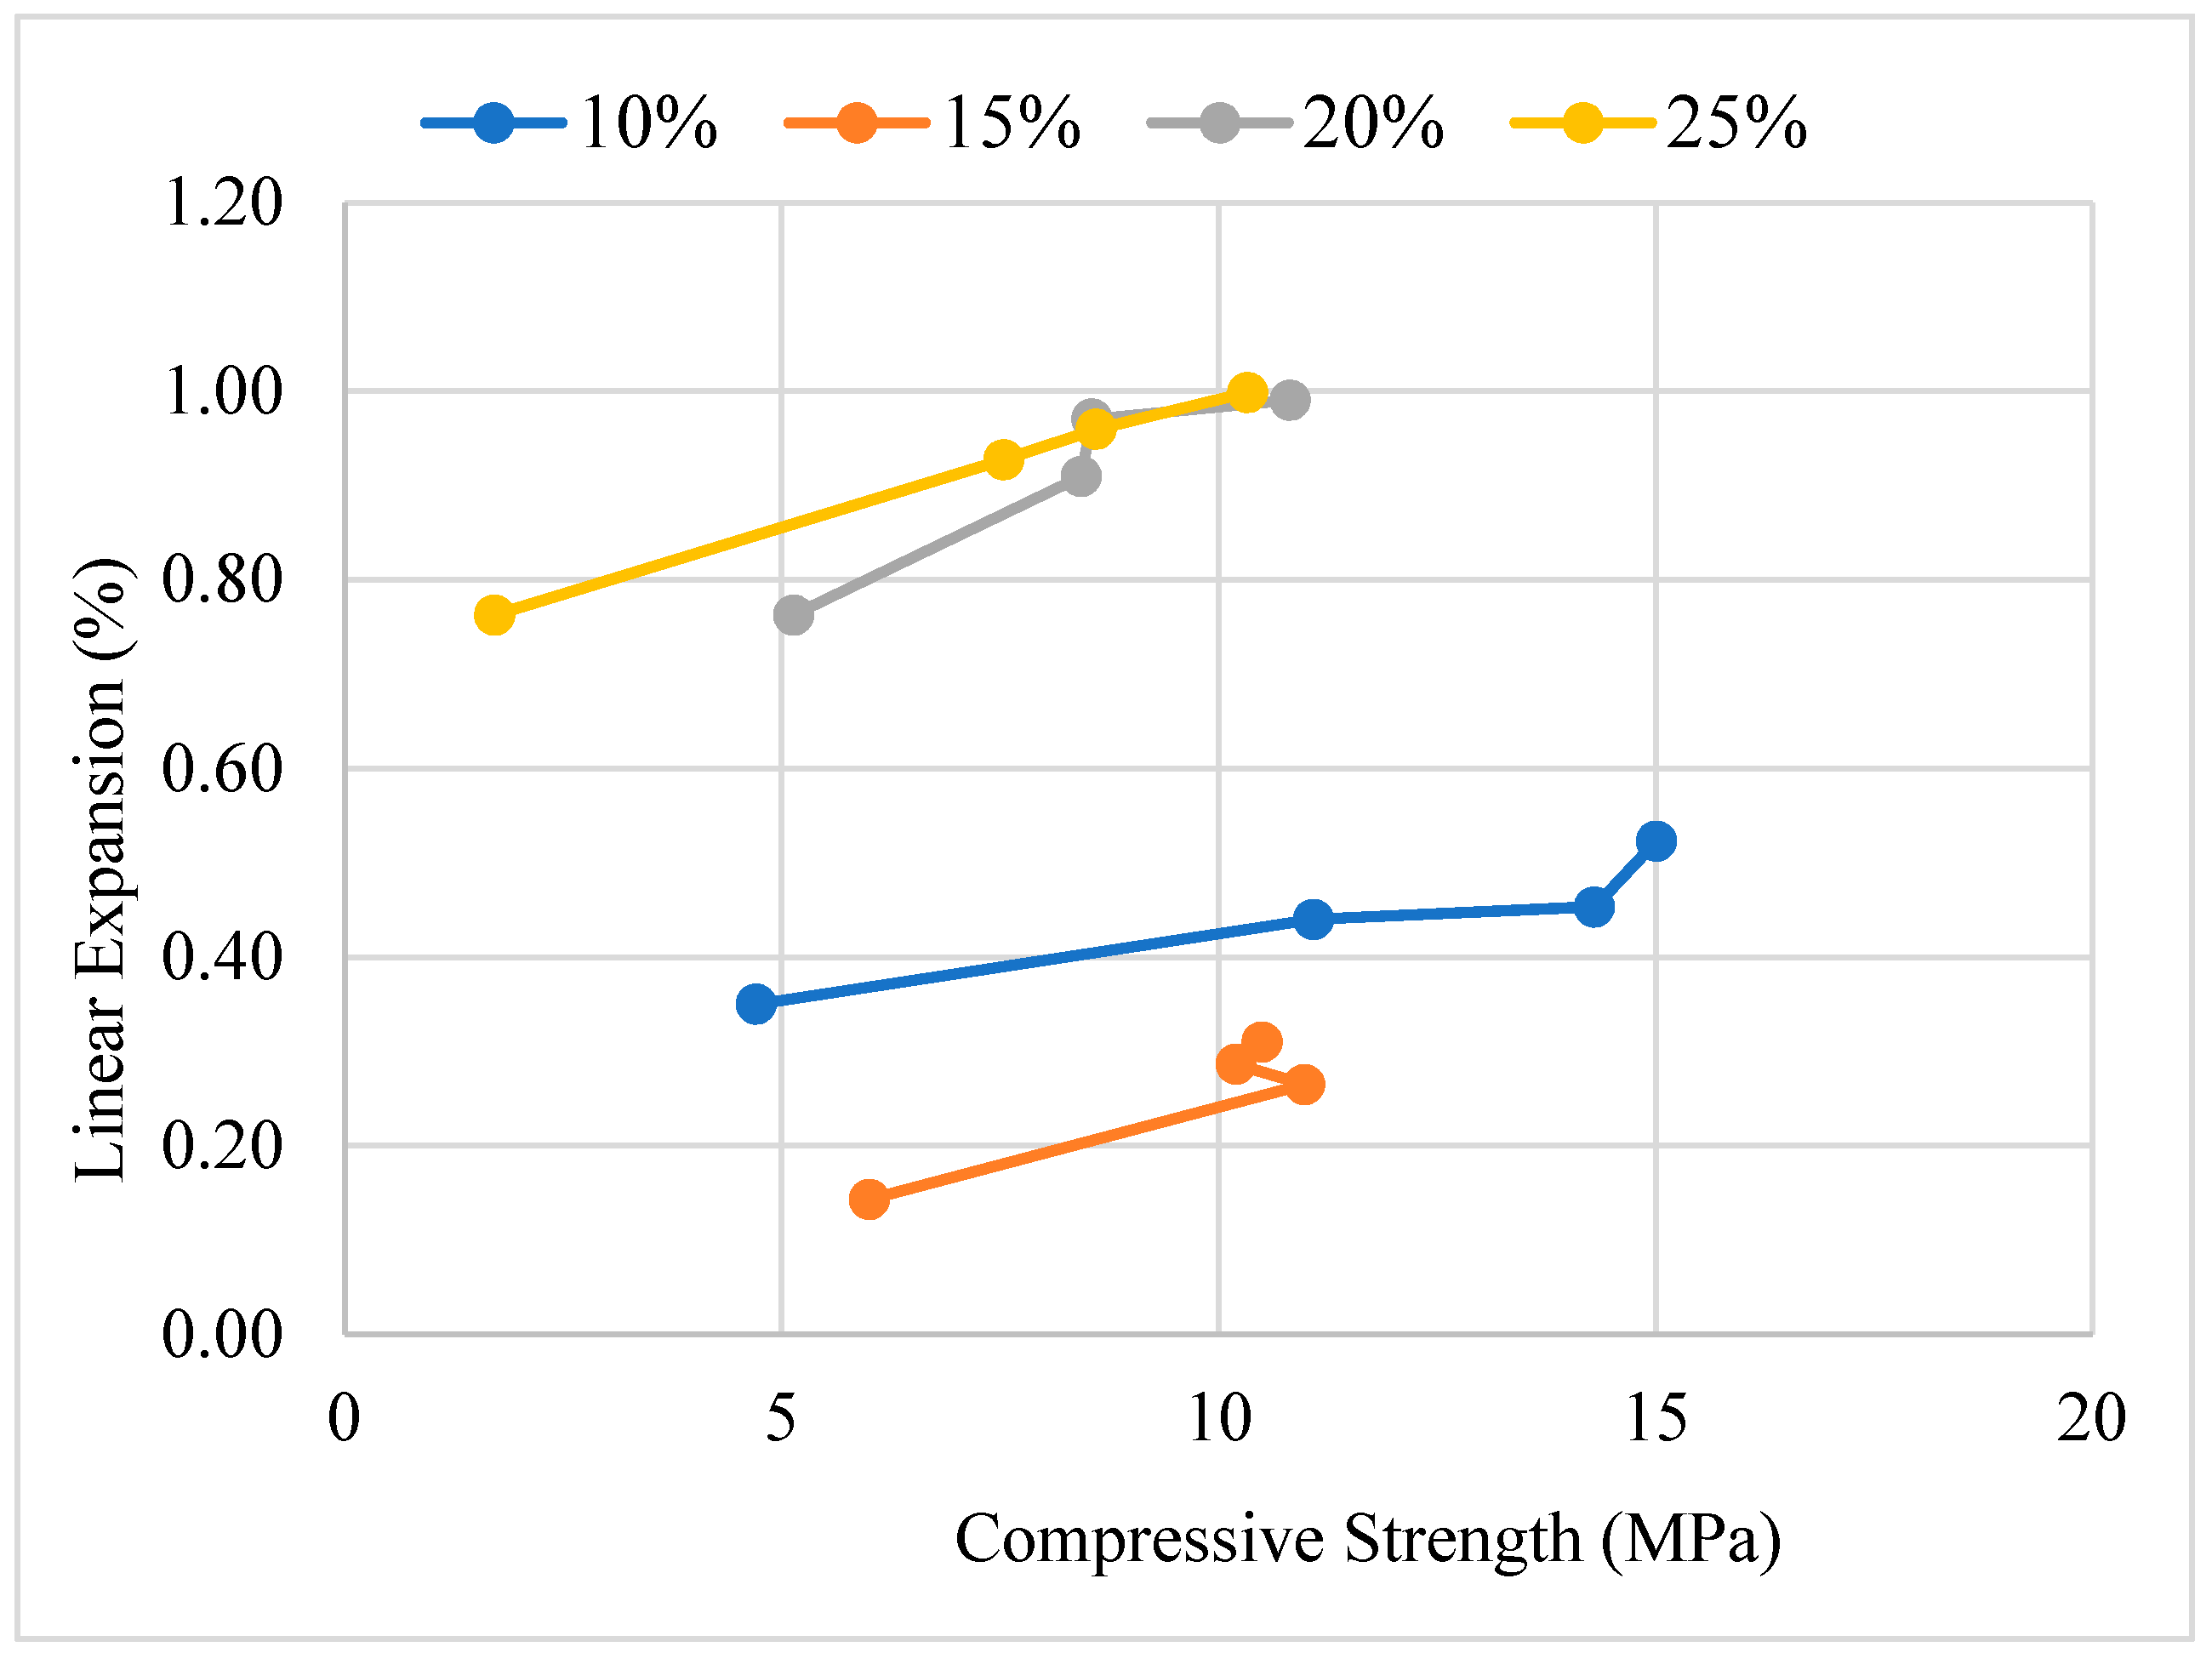
3.3. Compressive Strength and Linear Expansion

Compressive strength test and linear expansion for all mixture designs were performed at 60 °C in a water bath. Samples were cured for 1 day, 14 days, 30 days, and 60 days inside a water bath at atmospheric pressure. Figure 3 shows the effects of different contents of R-additive on compressive strength development up to 60 days of curing. Various standards, such as API, have recommended a minimum value of compressive strength of 3.5 MPa for the oil-well cementing job. When comparing all specimens’ compressive strength, all formulations have satisfied the recommended value except design 4 (25% R-additive) after 1-day curing. It was observed that the strength of all designs increased when the curing time is increased. After 24 h, design 2 achieved the highest strength of 6 MPa.
In contrast, design 1 gained the highest strength at 14, 30, and 60 days of curing. It showed the highest strength of 15 MPa after 60 days of curing, which was 3-fold more than the 1 day strength. Design 2 and design 3 showed slow strength development after 14 days of curing. Achieving the compressive strength, quality, and grain structure of fly ash plays an essential role. Therefore, scanning electron microscopy of fly ash samples was performed. Figure 4 shows the micrograph of the samples used in this study.
In comparison, the other three designs exhibited 60 days of strength, about 45% lower than the strength of design 1. Figure 3 illustrate the compressive strength development process from one day until 60 days. It was observed that design 2 achieved a higher compressive strength after one day than design 1, and at 14 days, both mixtures showed a similar strength. After one day of curing, design 1 achieved only 33% of the 30 days strength, and design 2 reached almost 55% of the 30 days strength, and after 30 days of curing, design 2 showed a minimal increment in strength. Design 4 showed relatively low compressive strength (1.7 MPa) after 24 h of curing, and for 30 days, it achieved 8.6 MPa, which was five times that of the one day strength.
Figure 5 shows the samples that went through a compressive strength test after 1 day of curing in a water bath at 60 °C. Figure 5 illustrates the failure mode and the behavior of samples when subjected to compressive load until failure. All the samples were not wholly crushed upon reaching the ultimate load, which indicates that the slurry design tended to resist the load after cracking initiated.
Once pumping is stopped, cement transitions start from a liquid phase to a gel state to a set of cement changes. These changes can directly affect the performance of cement slurry to control fluid migration. With the advent of the Ultrasonic Cement Analyzer (UCA), the term “transition time” of cement slurries was redefined. UCA’s have developed into an essential piece of equipment. Not only can they achieve compressive strength information, but the apparatus can also provide a continuous measurement of cement set in a static state. This information has a shortened wait on cement (WOC) time and provides an excellent profile on how fast cement develops strength. However, the transducers in a standard UCA only provides information after the cement develops a compressive strength set. With improved computerization and transducers, a more sensitive evaluation of gel strength development can be studied. Another definition for transition time is using a static gel strength (SGS) analyzer to measure when cement achieves a strength from 48 Pa to 240 Pa. It has become an industry standard that, once cement slurries reach an SGS of 240 Pa, WOC is considered.
Figure 6 compares the effects of elastomer (R-additive) content on the linear expansion measured at 1, 14, 30, and 60 days of curing. It can be observed that design 3 and four that contained 20% and 25% dosages of R-additive content, expanded about 1% after 60 days of curing, which was almost two times the expansion of design 1 (the expansion was 0.5% after 60 days). Designs 3 and 4 even achieved 0.76% expansion after one day of curing, which is evidence that the higher the amount of additive, the higher the expansion. The addition of a dosage of 10%, 15%, and 20% R additive showed satisfactory results for application in oil well cement operations. However, a design of experiment (DOE) using statistical analysis of data can help find the optimum formulation.
Figure 7 shows the relationship between linear expansion and compressive strength made of 10% to 25% R-additive content. It can be observed that, with the increase in curing time, the compressive strength was increased, so there was a linear expansion of the samples. It was observed that design 2 showed almost the same strength from 14 days to 60 days of curing, and it showed a lower expansion than design 1.
The four designs prepared in this research aligned with the oil and gas industry requirements and specifications. These four formulations were selected out of the many trial designs made to qualify API specification. Since geopolymer research is relatively new for oil well-cementing applications, these results are compared with the available research on API class-G cement. The fresh paste properties and the mechanical properties obtained for these formulations align with the literature’s reported results and satisfying the API specifications for well-cementing [11,12,13,14].

3.4. Design of Experiment (DOE)

3.4.1. Experimental Design

In the oil and gas industry, cementing is one of the most critical operations for the well integrity throughout its operational life. Therefore, cement slurry design requires the best practices for the success of the job. For example, in designing the slurry formulation, characteristic compressive strength is set as one of the critical design parameters. Often laboratory experiments are conducted to test the trial formulations to achieve the desired compressive strength. To meet the industry requirements, 100% reliance on laboratory experiments is a tedious exercise and expensive. The design of the experiment (DOE) design is the technique used to establish interaction among multiple factors. DOE is successfully employed in solving material engineering problems, for example, analysis of rheological properties and mechanical characteristics of a newly developed material. For this study, through laboratory experiments, a set of data for various parameters was created. The data set was used to develop a statistical model to predict the desired response, i.e., linear expansions with the estimated parameters.
Design-expert software was used to perform the design of the experiment for this study. The traditional two-level factorial design with three factors (23) was chosen. The limited chance to run the experiment caused the experiment to be done with two replications. Sixteen different settings of the experiment were generated [17,18].

3.4.2. Parameter Setting

Each factor was set at two levels: high level and low level. The profile setting for each factor is shown in Table 4. Three factors are used: Factor-A, curing time, Factor-B, curing temperature, and Factor-C, R additive Concentration (Table 5). R additive is an elastomeric type expandable material used to enhance the expansion properties of the mixture. Since the research aimed to enhance the oil well’s integrity, the response set was the percentage of the linear expansion of cement. The analysis and model fitting for the 2k factorial design used the encoded design variables (true value).

3.4.3. Pilot Run for Experiments

The total number of treatment combinations was 16, and all sets ran with randomization. Randomization is the design technique used to guard against such a lurking nuisance factor. The results obtained for the response are tabulated in Table 5. The nuisance factor must be kept at a lower percentage level to avoid or eliminate it from contributing to the experiment. Recommended power is at least 80%. For the ratio of signal to noise (delta/sigma) of 2, the power reported for the design is at the 0.5% alpha level with the percent of power as below Factor A: 95.6%, Factor B: 95.6%, Factor C: 95.6%.

3.4.4. Analysis of Variance (ANOVA)

Based on the table of ANOVA, six factors have a significant effect on the percentage of cement linear expansion, which are factor A (curing time), factor B (curing temperature), factor C (R concentration), a combination of factor A and C, B and C and a combination of all factors A, B, and C. The model F value of 185.33 implies that the model is significant, with only a 0.01% chance that the F value occurred due to noise. The value of Prob > F is less than 0.05, indicating that the model term is significant. In contrast, a value greater than 0.1 indicates that the model term is insignificant. From the p-value, all factors, A, B, C, a combination of A and C, B and C, and ABC, had very low p-values (<0.05), which is significant. In contrast, factors A and B showed that a higher p-value is insignificant. The predicted R-squared of 0.9755 was in good agreement with the adjustable R-Squared of 0.9885 with a difference of less than 0.2. The final equation in terms of the actual factor found is shown below:
Ln (Linear Expansion) = 2.65 − (0.02A) − (0.07B) − (0.08C) + (6.59E − 004AB) + (1.33E−003AC) + (3.12E − 003BC) − (3.24E − 005ABC)

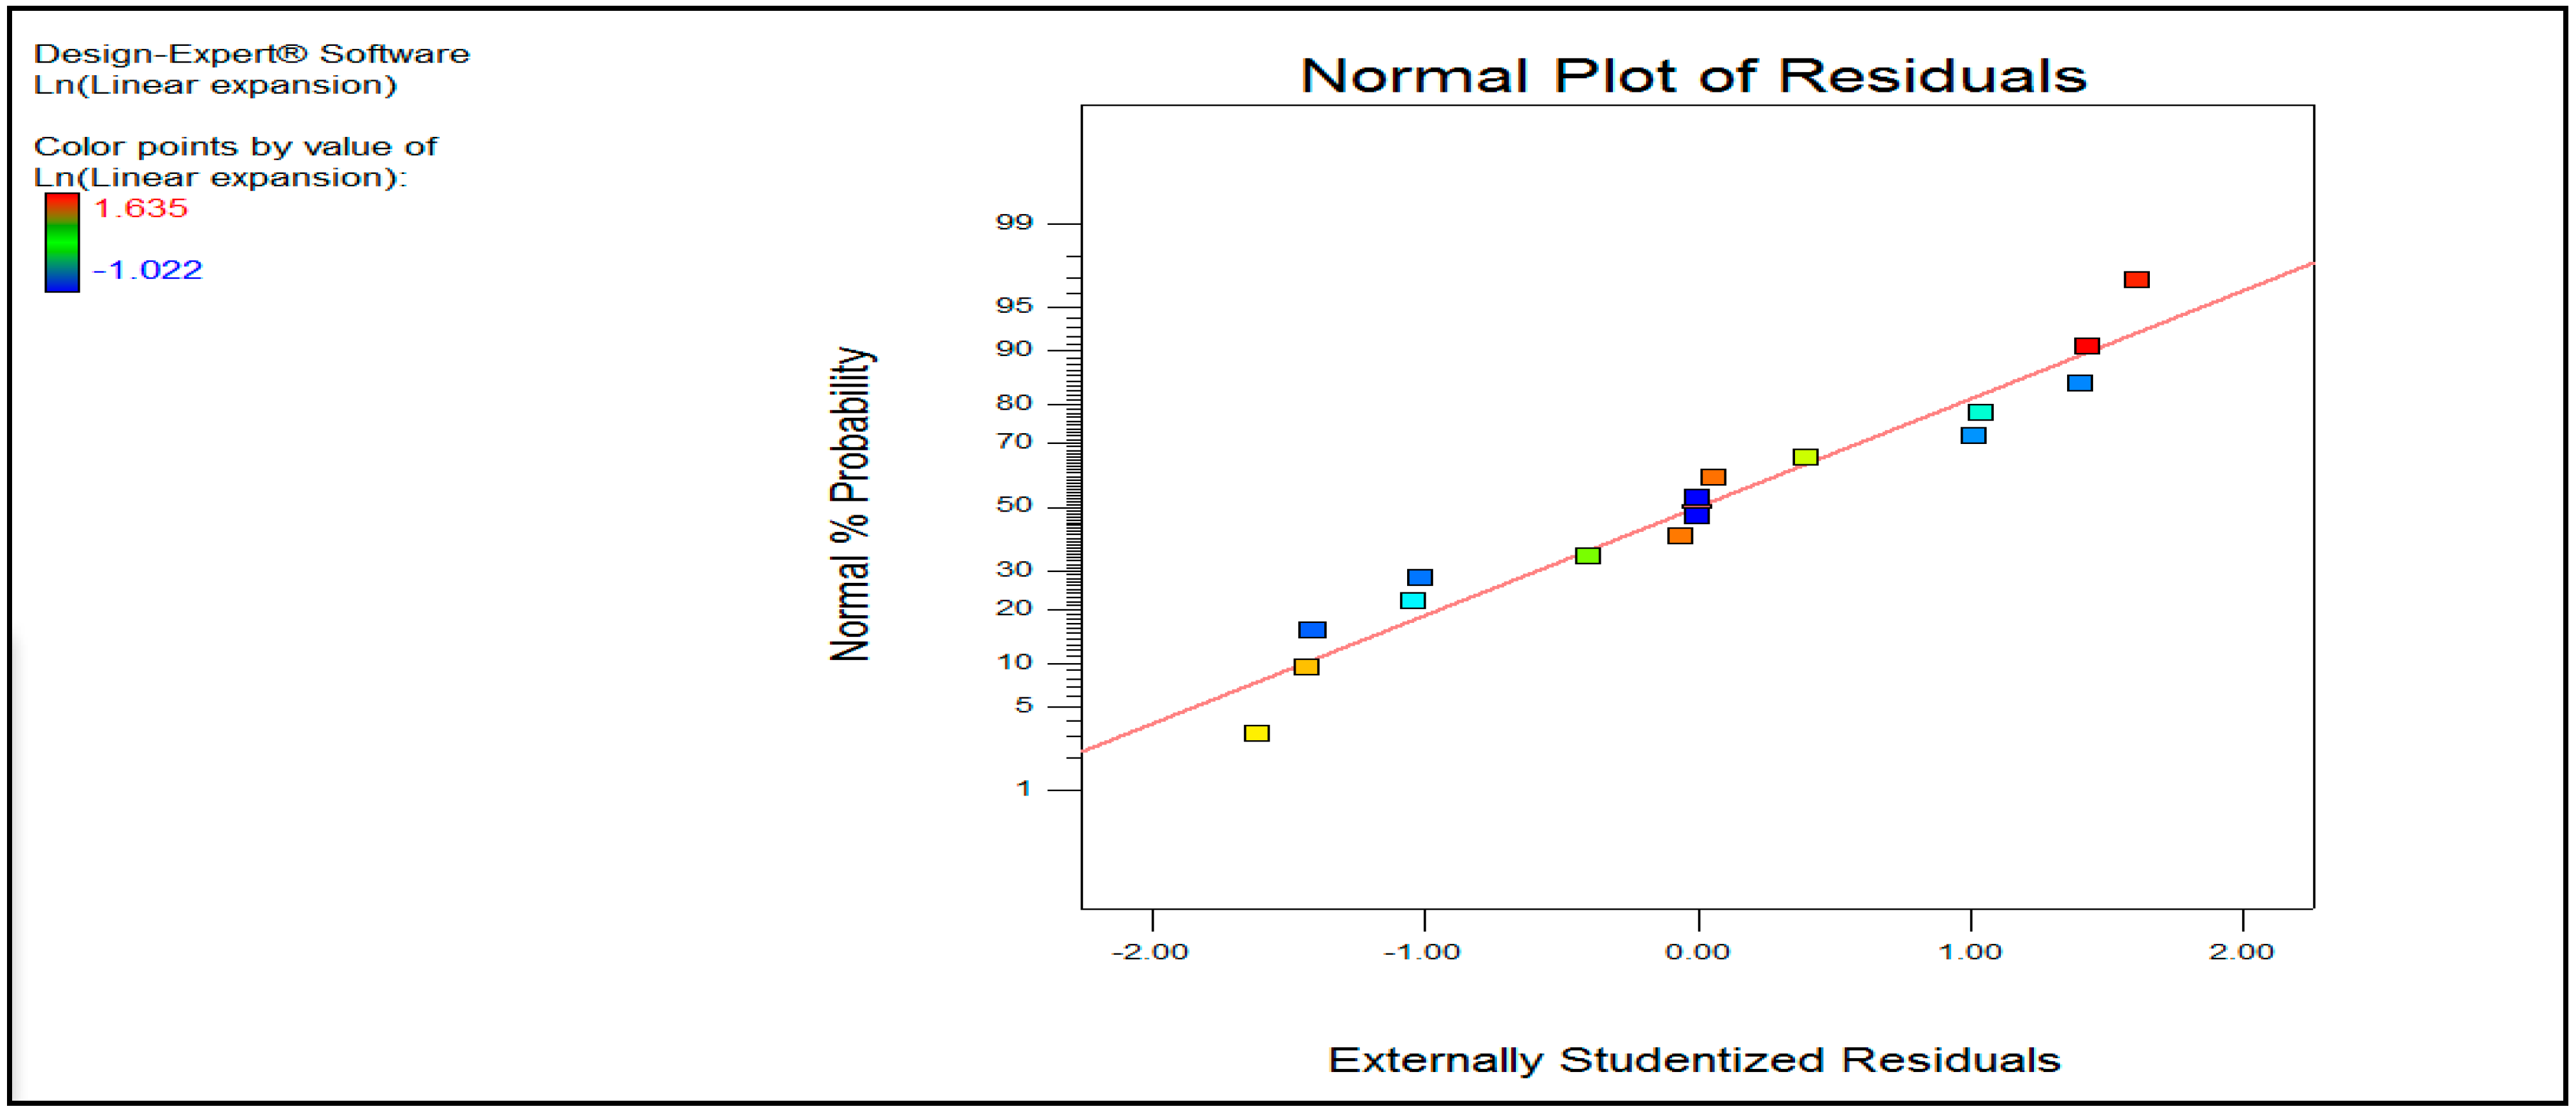
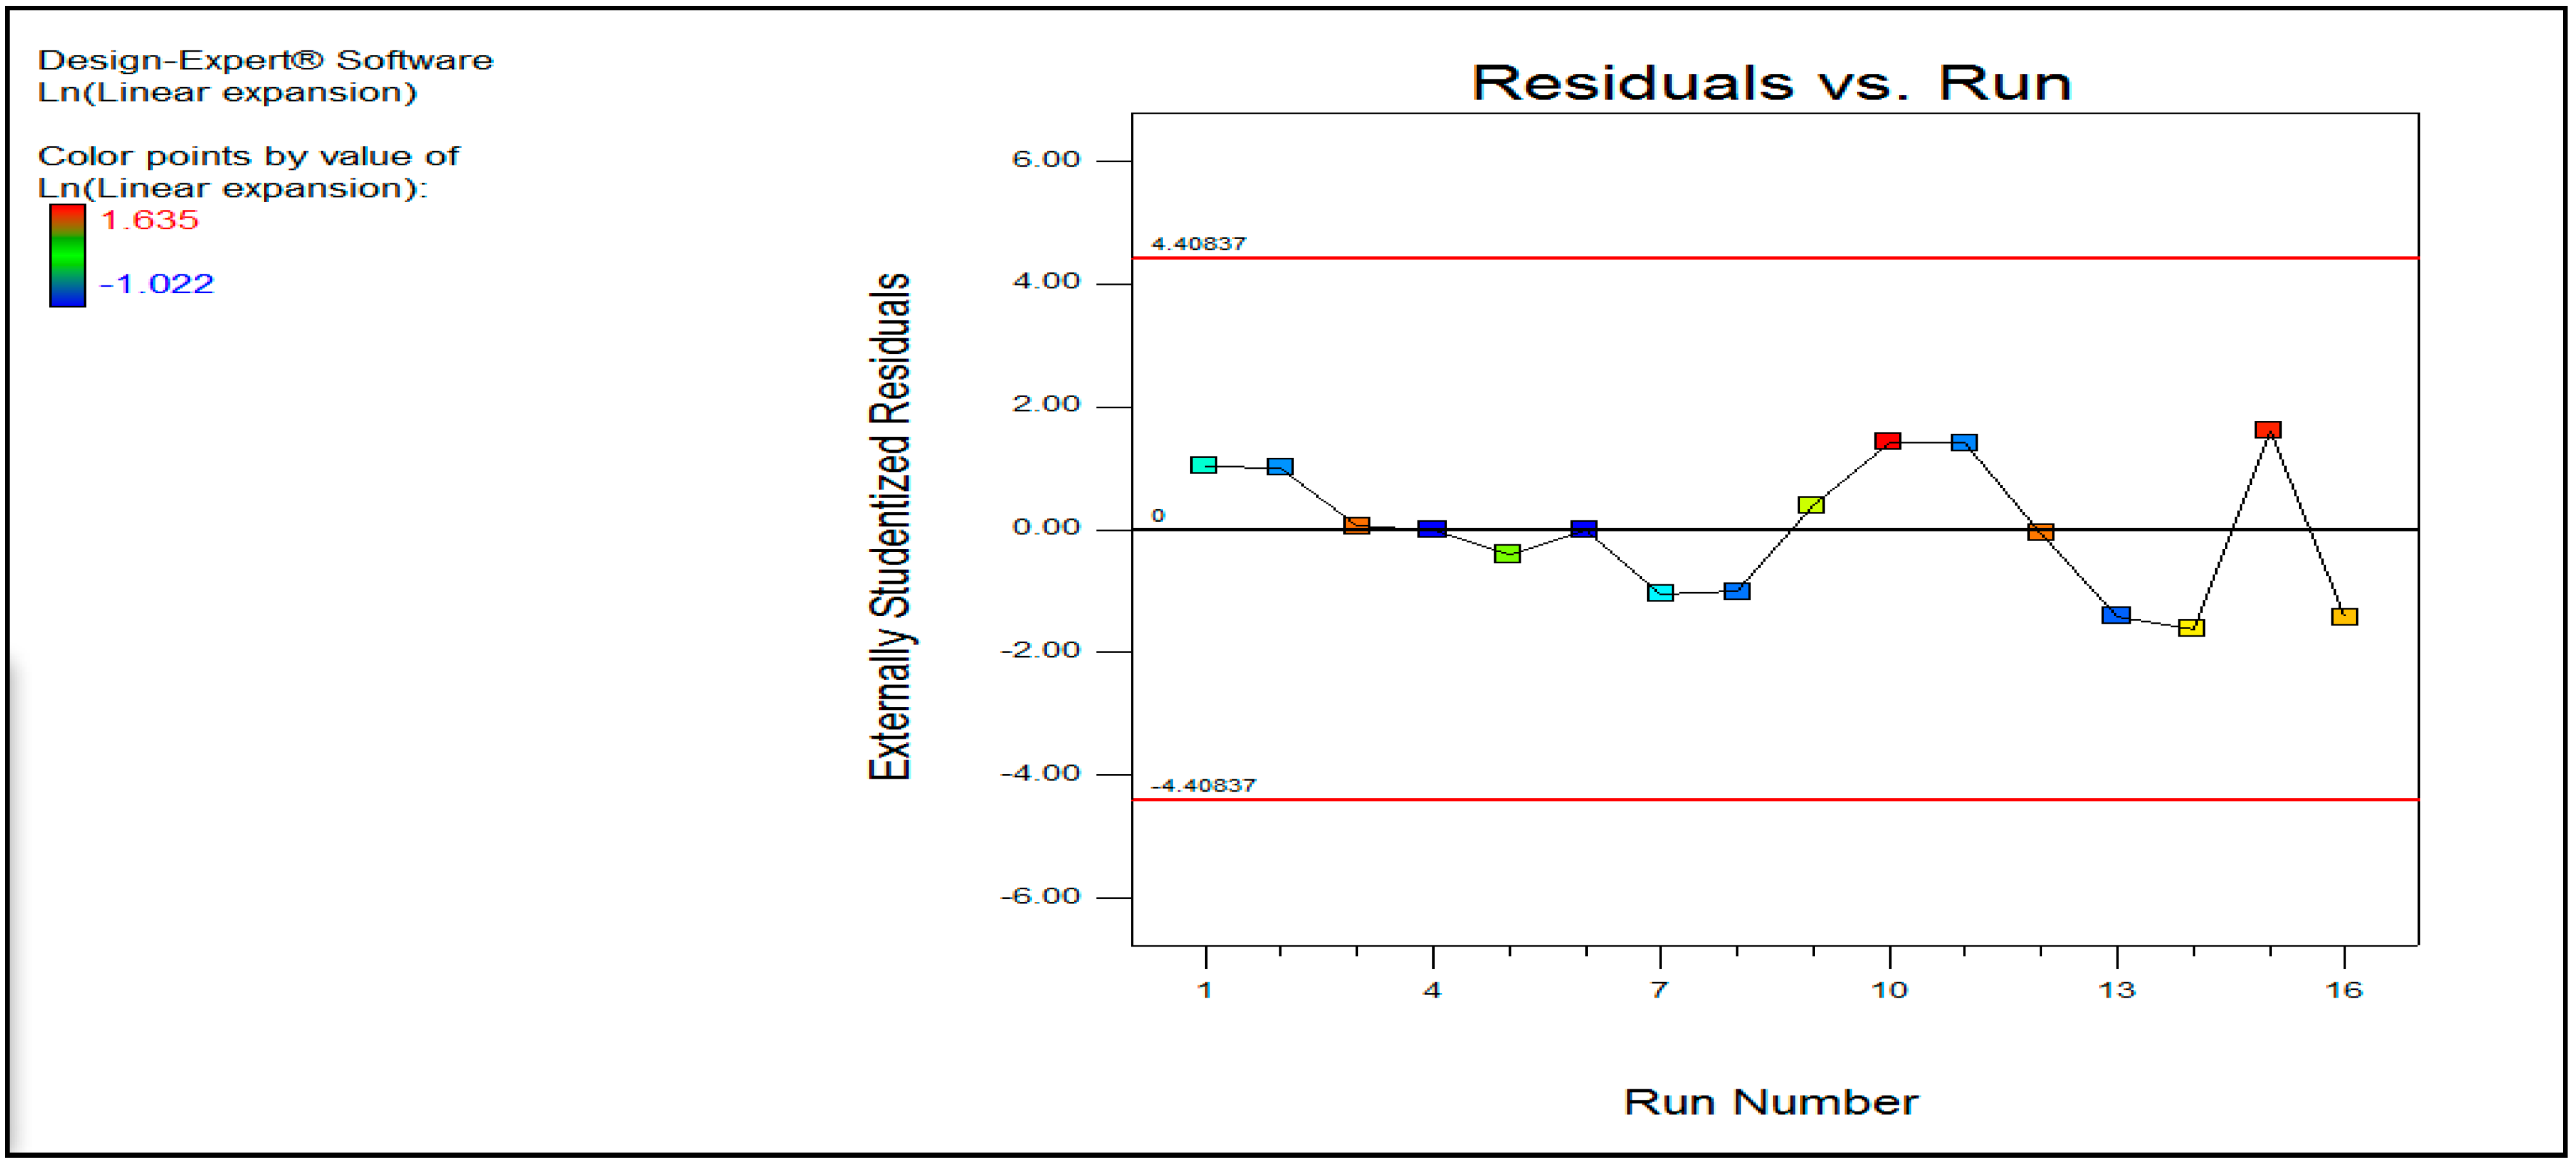
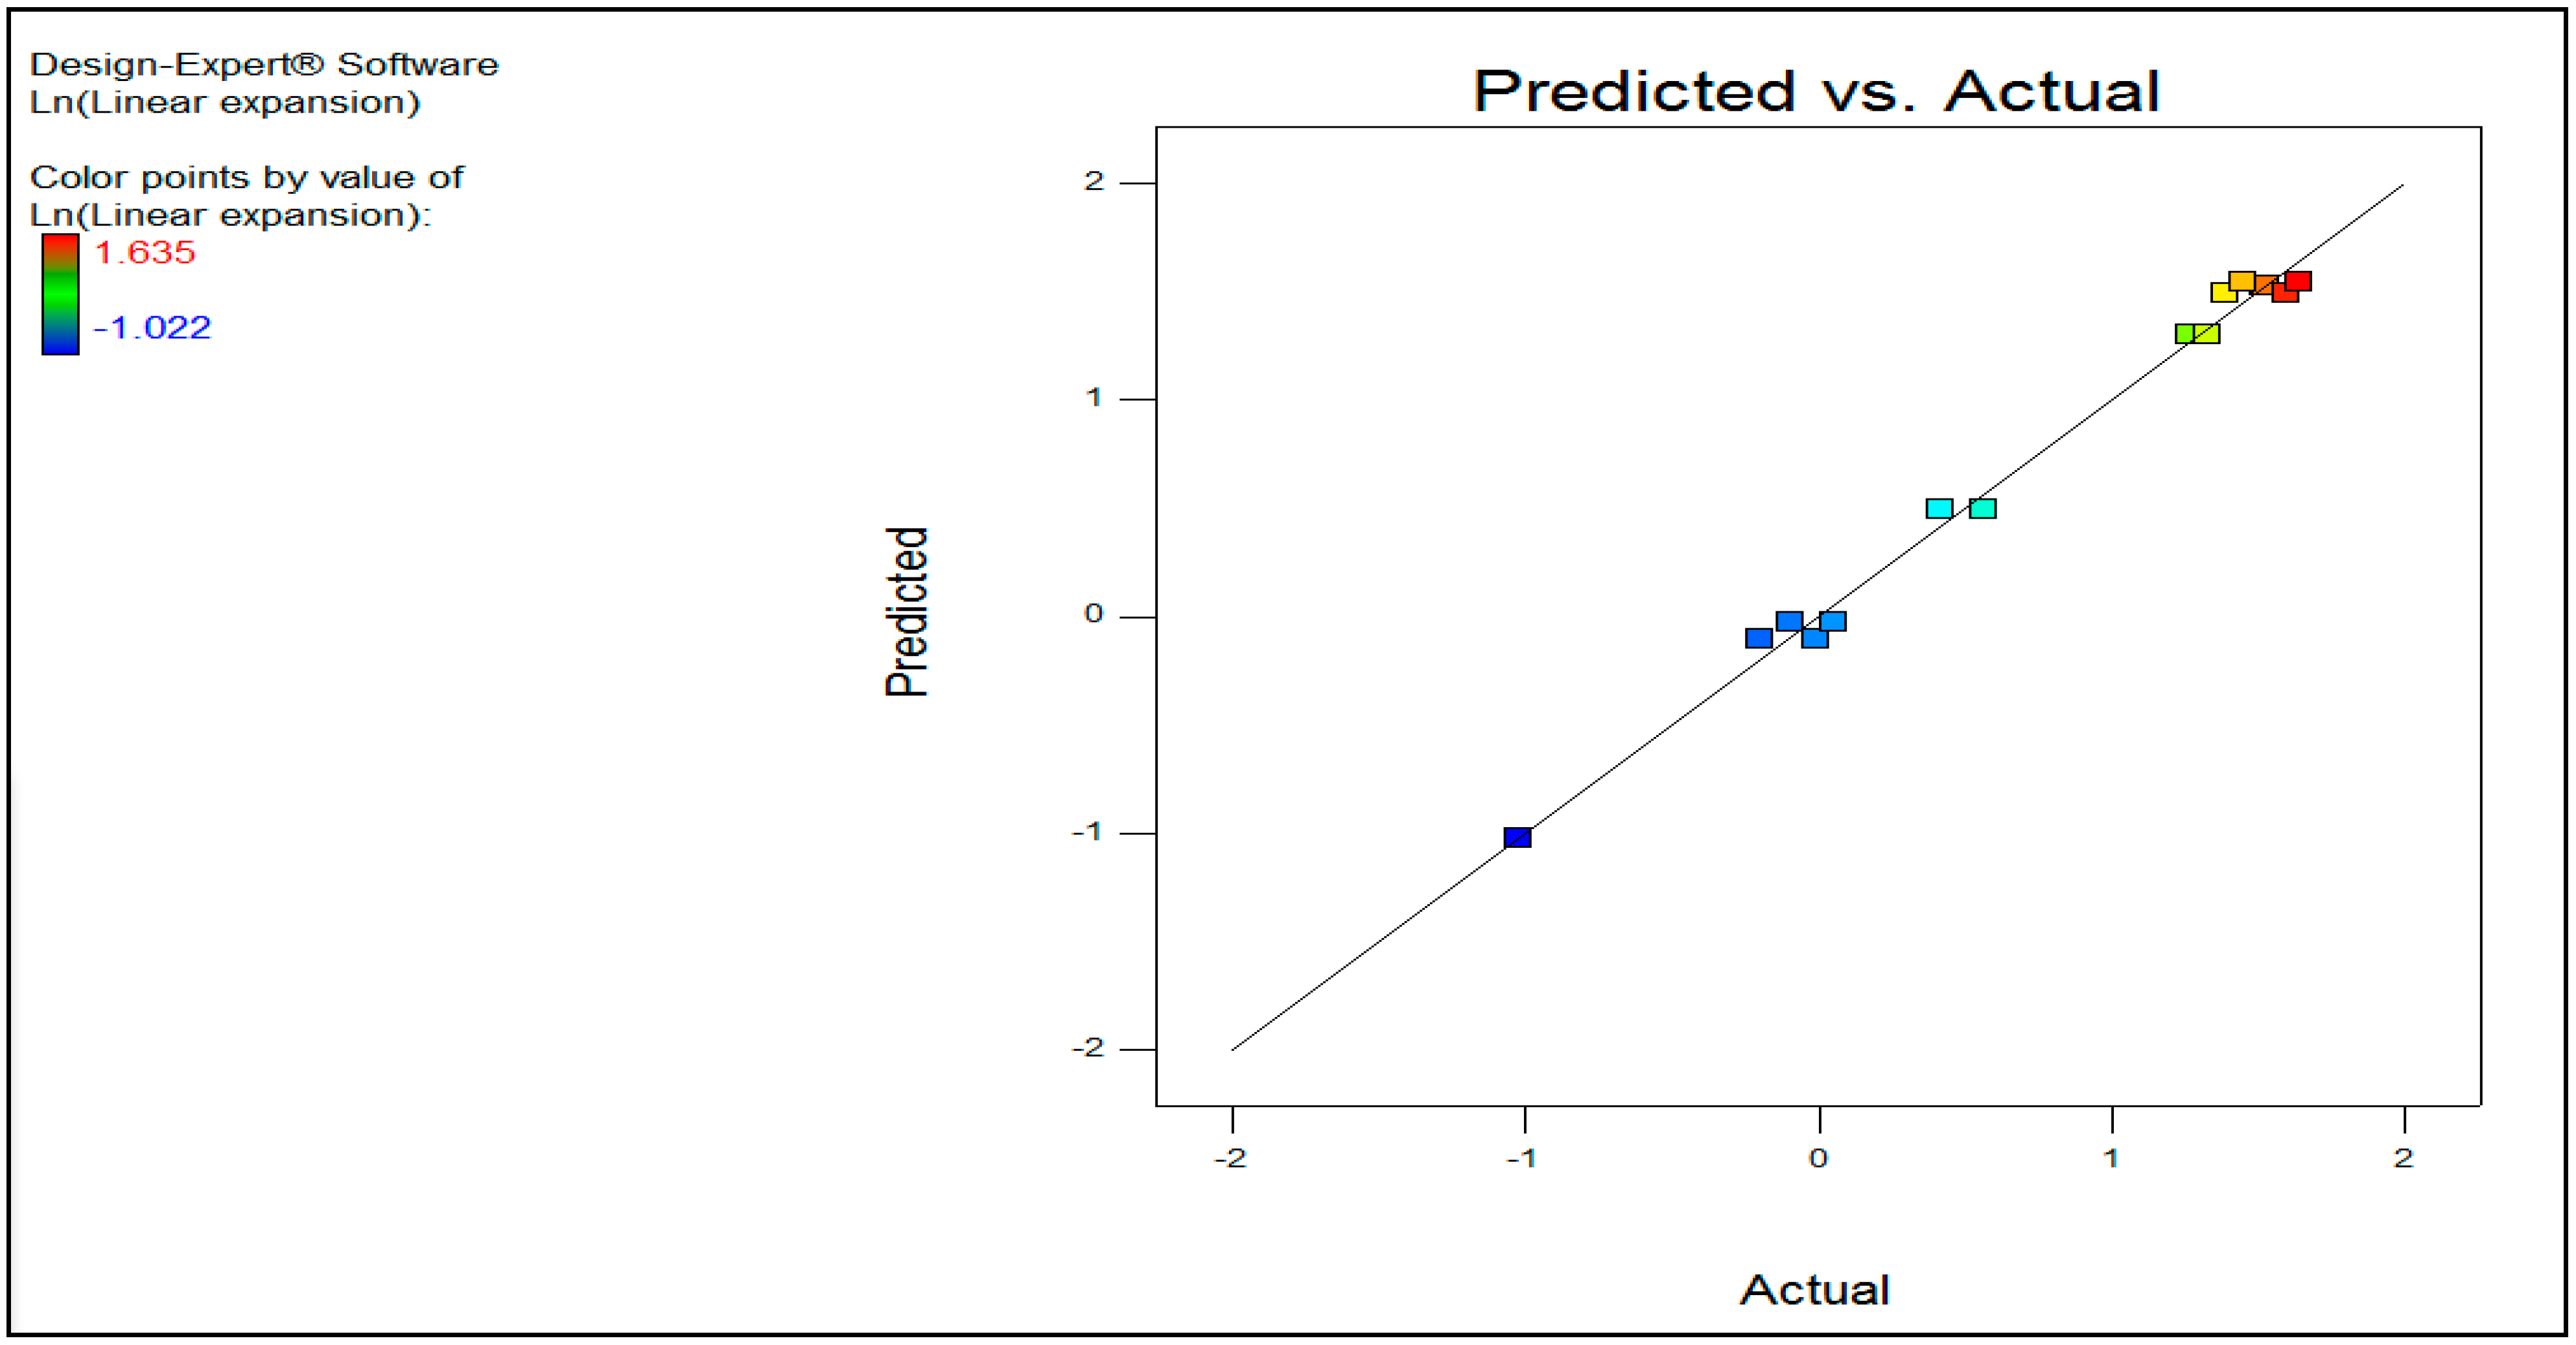
3.4.5. Diagnostic Plot

A diagnostic plot is cross-checking the normality of the residual, constant error, or outliers. A normal probability plot of the studentized residual is to check for the normality of residuals. The normal probability plot indicates whether the residuals follow a normal distribution, and thus follow the straight line. Figure 8 shows that data distribution followed the line, which showed normality of the residual. The residual versus the predicted values plot is shown in Figure 9. The residual plot was found to be randomly dispersed along the horizontal line, which showed the appropriate regression model. Figure 10 shows the residual vs. experimental run order. This plot provided information of whether any lurking variables may have influenced the response during the experiment. The predicted versus actual plot in Figure 11 shows data scattered within the line, which indicated a good fit and no possible outlier.

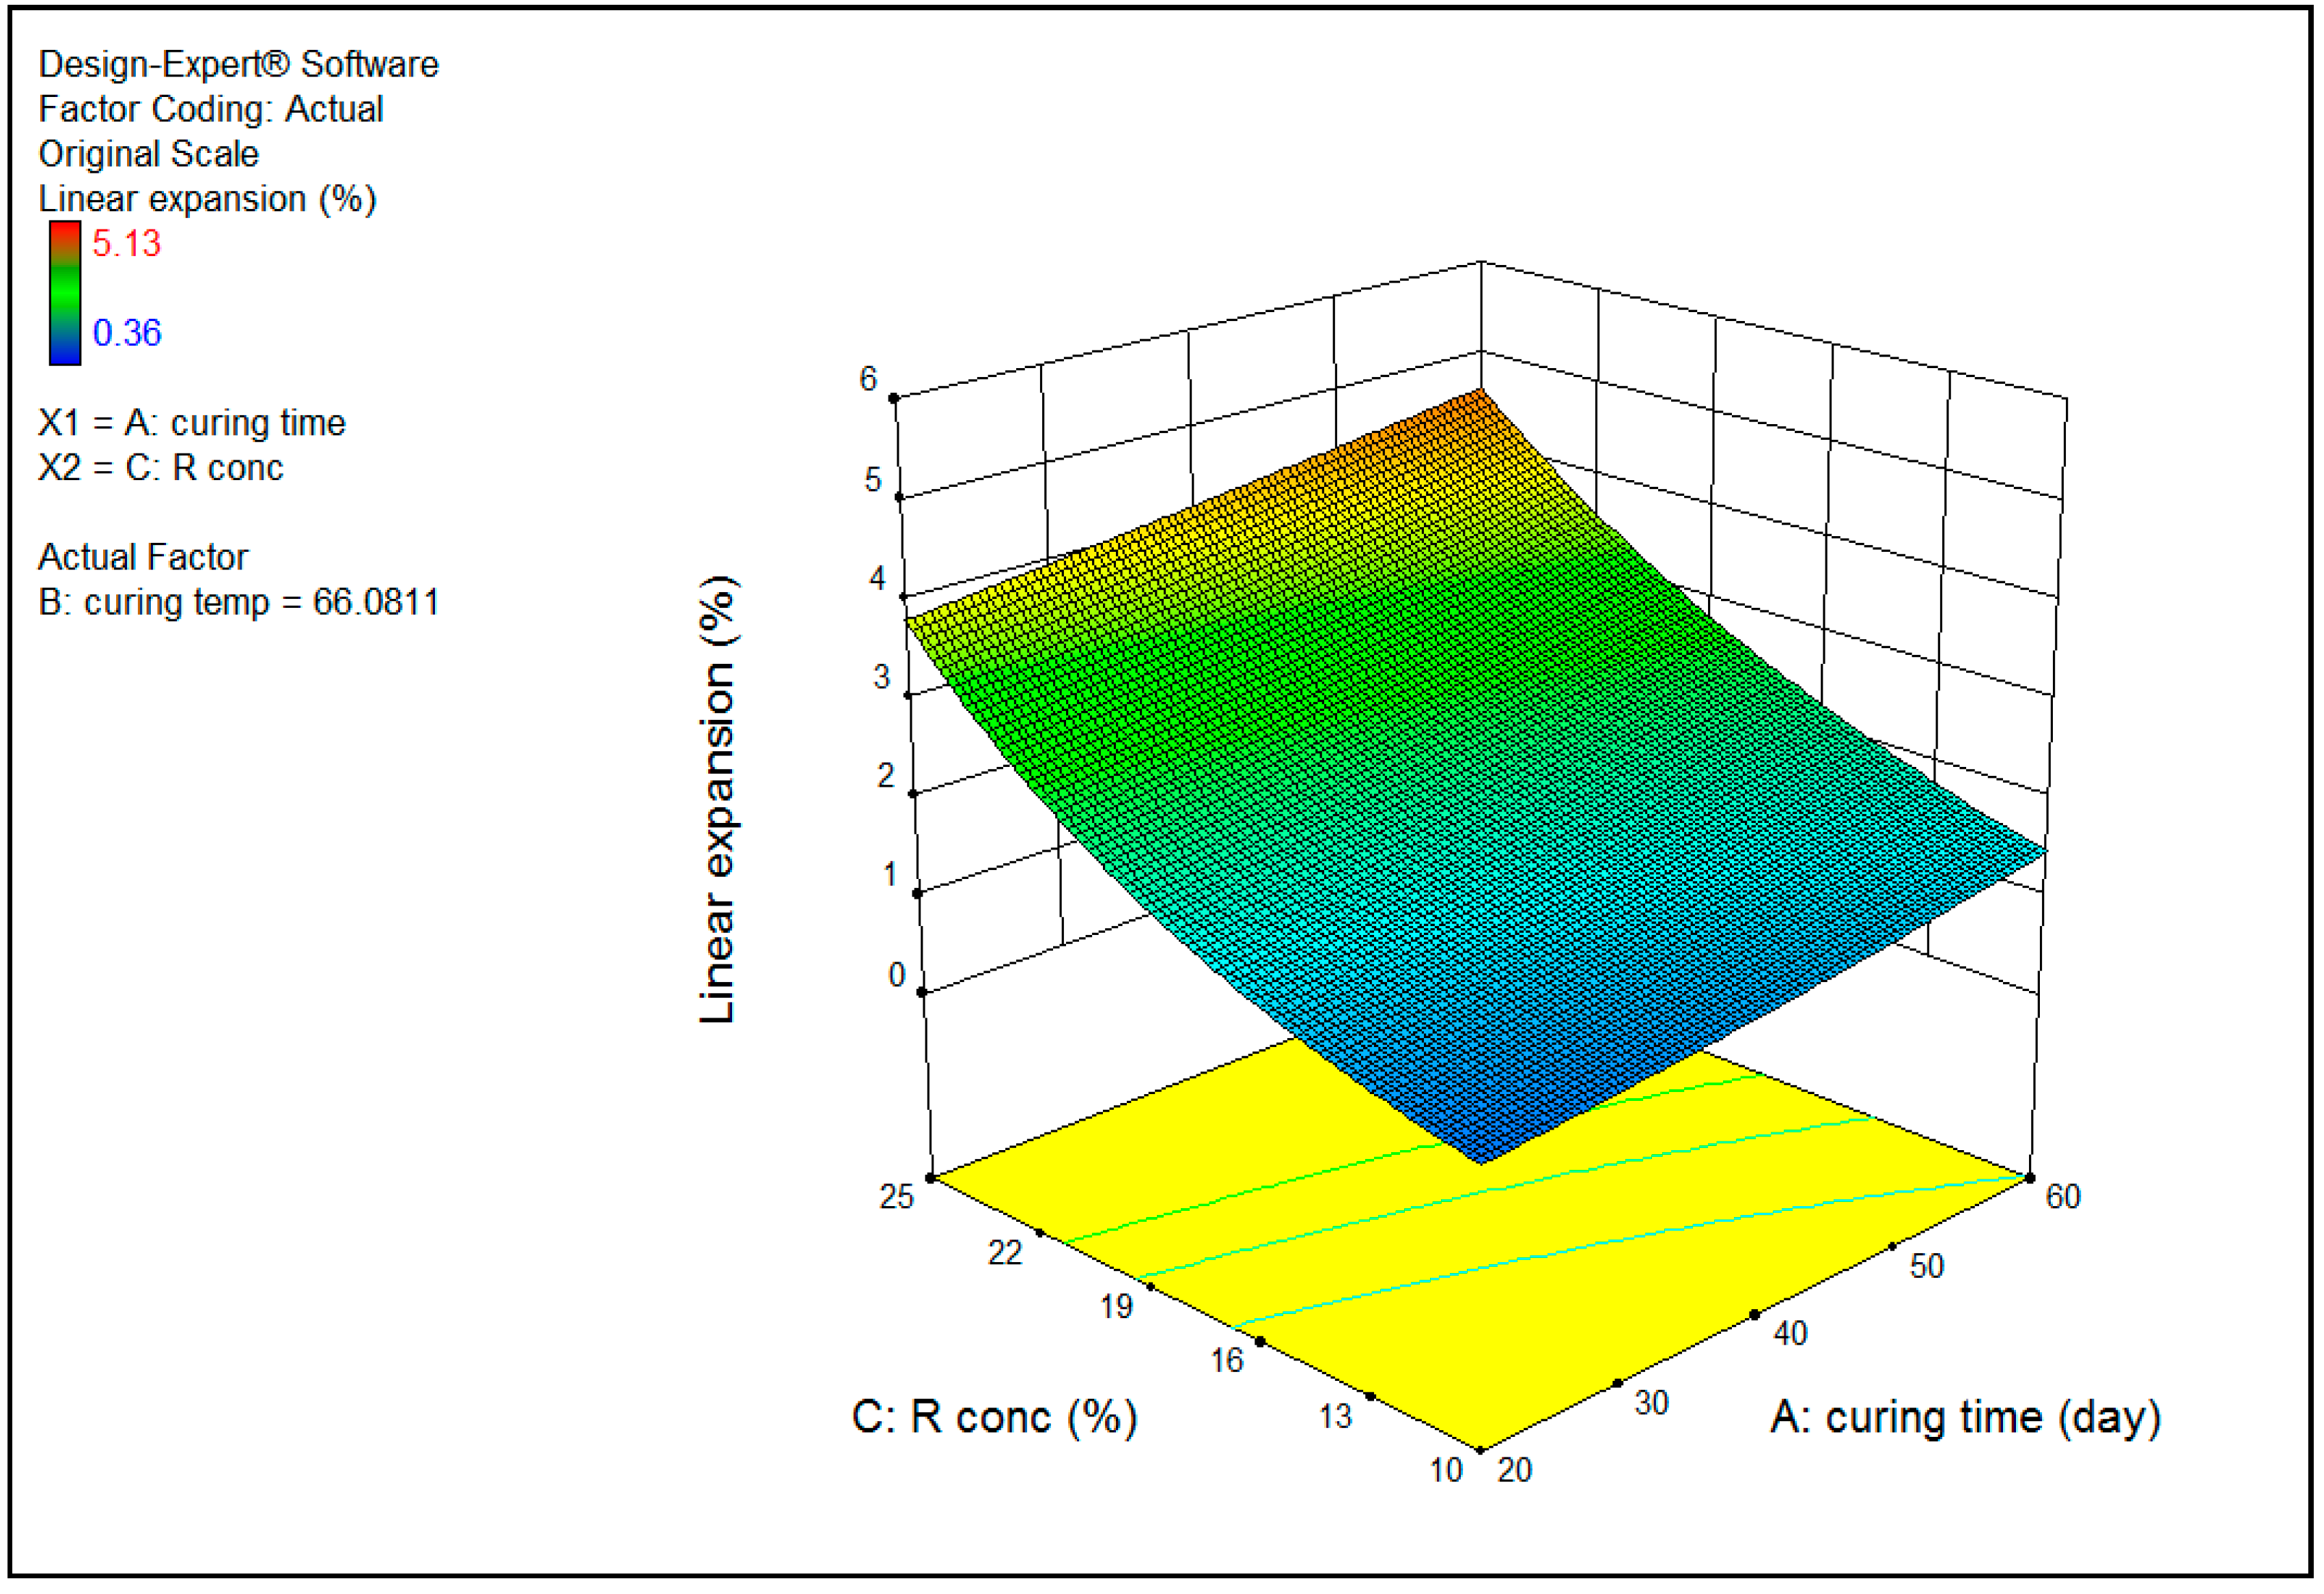
3.4.6. 3D Surface Plot

3D surface plots provided information on the percentage of linear expansion at different curing times (Factor A) and R concentrations (Factor C) at selected curing temperatures (Factor B). It was found that the expansion of cement could increase when a higher concentration of R is used at a longer curing time. A similar trend was observed at curing temperatures: 81 °C (Figure 12) and 66 °C (Figure 13).

4. Conclusions

This research focused on investing the fresh and hardened geopolymer binder properties for application in the oil-well cementing job concerning the API standards. The following conclusions can be drawn from this study:
  • Following the API guidelines for the fresh slurry properties, all geopolymer formulations were found to be homogeneous and showed no free water traces. The rheological properties with the addition of elastomer content complied with the code recommended values. The plastic viscosity (PV) and the yield point (YP) were increased from 48 cP to 104 cP and 3.8 N/m2 to 12.4 N/m2 by increasing the elastomeric content material and R additive in the blend. Similarly, thickening time and the fluid loss results satisfied the API requirements.
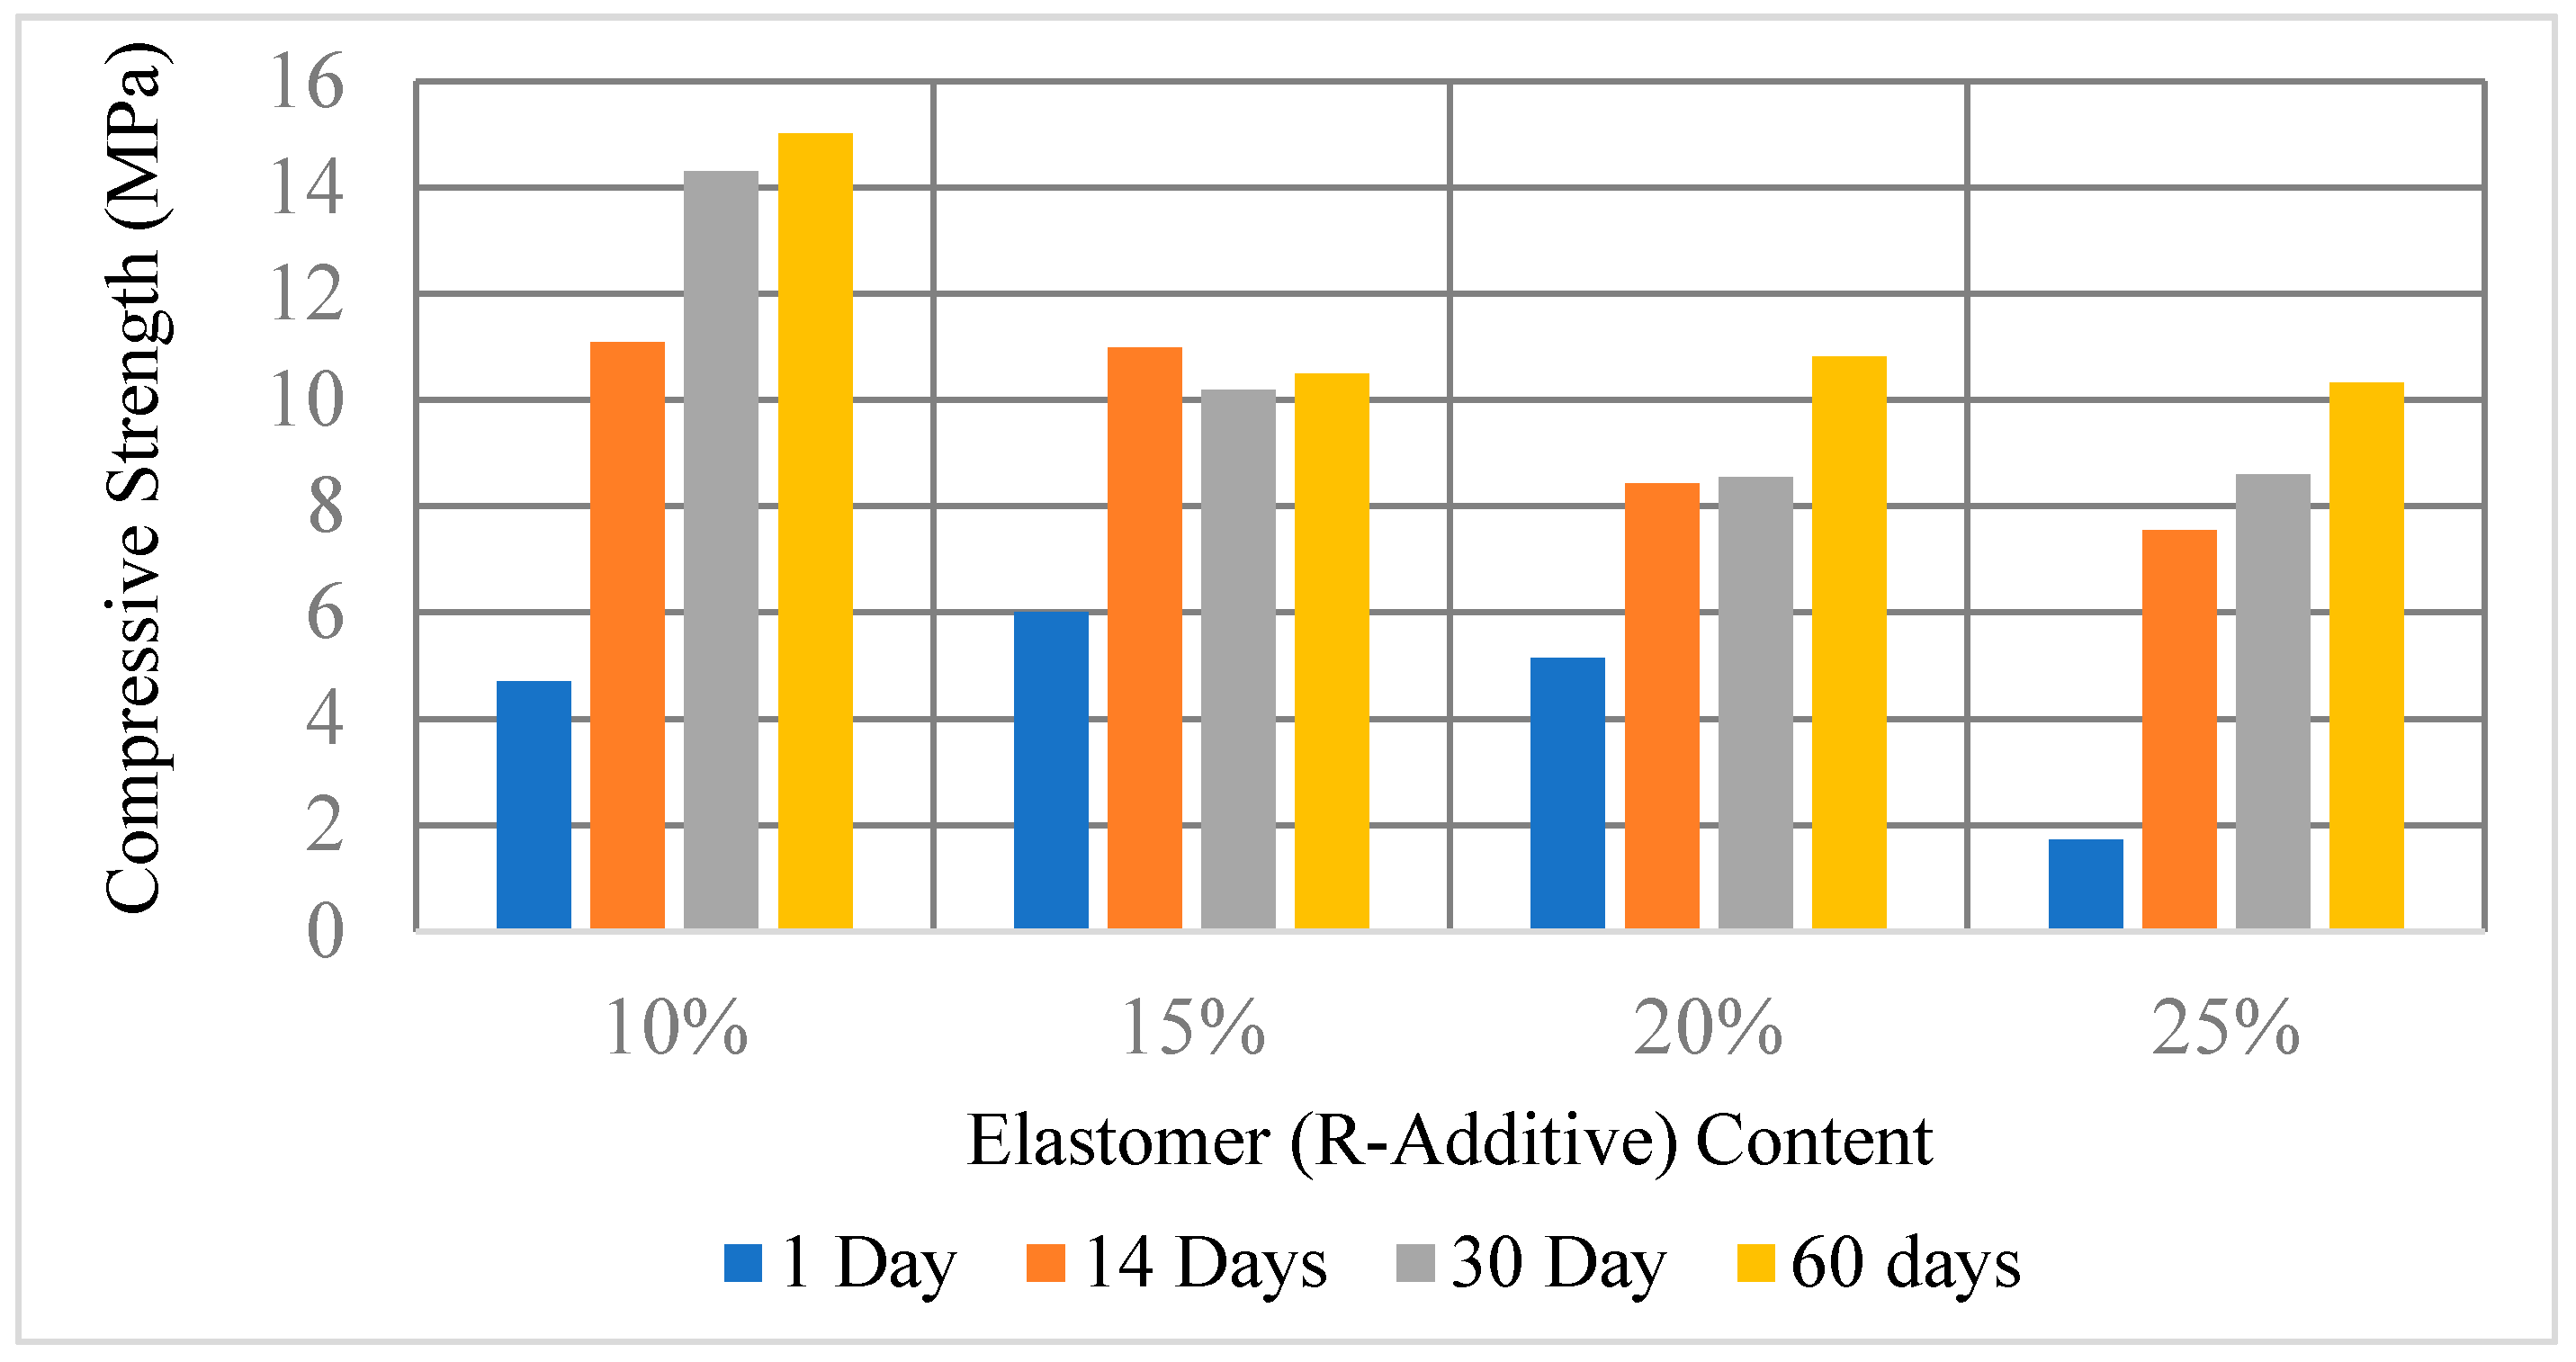
  • Design 1, containing 10% elastomer content, showed excellent compressive strength development until 60 days of curing. At 60 days, it achieved compressive strength in three folds of the one-day compressive strength. All other mixes did not show any remarkable increase in the compressive strength after 14 days. From 14 days until 60 days, design 1 showed 30% higher strength than all other mixes.
  • In contrast to the compressive strength, the percentage of linear expansion was increased when a higher amount of R additive was used. With 20% and 25% R additive, it was measured as 0.99% after 60 days of curing. Thus, it can be concluded that the highest value of compressive strength was obtained using a lower amount of R additive and a higher amount of fly ash.
  • DOE was applied to screen out the significant factors that affect the response output and percentage of cement linear expansion. The three parameters/factor settings, which are the curing time (Factor A), curing temperature (Factor B), and R additive concentration (Factor C), has been set as input parameters. The full fractional factorial design, 23 with 16 experiments run with two replications. The main factor affecting the response output is A, B, and C, based on data analysis. The combination of factors between A and C and B and C also affect the % of linear-expansion. However, the combined factor of A and B is the insignificant factor that can increase or decrease the response output.

Author Contributions

S.H.A.R. designed the experiment of this research, developed data and performed analysis, and produce manuscript draft, N.N.Z. involved in data analysis and review, N.S. supervised the overall research and manuscript writing. All authors have read and agreed to the published version of the manuscript.

Funding

This research was funded by the PETRONAS research (PRSB) under grant number 015MD-064.

Acknowledgments

The authors would like to acknowledge PETRONAS research (PRSB) for providing financial under grant number 015MD)-064, technical resources, and university Teknologi Petronas to offer facilities and technical capabilities for conducting this research.

Conflicts of Interest

The authors declared that there is no conflict of interest.

References

  1. Bu, Y.; Du, J.; Guo, S.; Liu, H.; Huang, C. Properties of oil well cement with high dosage of metakaolin. Constr. Build. Mater. 2016, 112, 39–48. [Google Scholar] [CrossRef]
  2. Nasvi, M.; Ranjith, P.; Sanjayan, J.; Bui, H.H. Effect of temperature on permeability of geopolymer: A primary well sealant for carbon capture and storage wells. Fuel 2014, 117, 354–363. [Google Scholar] [CrossRef]
  3. API. Recommended Practice for Testing Well Cements; API: Washington, DC, USA, 2013. [Google Scholar]
  4. Nelson, E.B. Well Cementing, 2nd ed.; Schlumberger: Houston, TX, USA, 2006. [Google Scholar]
  5. Lavrov, A.; Torsæter, M. Physics and Mechanics of Primary Well Cementing; Springer: Berlin/Heidelberg, Germany, 2016. [Google Scholar]
  6. API. Recommended Practice on Determination of Shrinkage and Expansion of Well Cement Formulations at Atmospheric Pressure; API RP 10B-5; American Petroleum Institute (API): Washington, DC, USA, 2015. [Google Scholar]
  7. Nasvi, M.; Ranjith, P.; Sanjayan, J.G. Effect of different mix compositions on apparent carbon dioxide (CO2) permeability of geopolymer: Suitability as well cement for CO2 sequestration wells. Appl. Energy 2014, 114, 939–948. [Google Scholar] [CrossRef]
  8. Tan, H.; Zheng, X.; Ma, L.; Huang, H.; Xia, B. A study on the effects of starches on the proper-ties of alkali-activated cement and the potential of starch as a self-degradable additive. Energies 2017, 10, 1048. [Google Scholar] [CrossRef] [Green Version]
  9. Nagral, M.R.; Ostwal, T.; Chitawadagi, M.V. Effect of curing temperature and curing hours on the properties of geo-polymer concrete. Int. J. Comput. Eng. Res. 2014, 4, 1–11. [Google Scholar]
  10. Ridha, S.; Hamid, A.I.A.; Halim, A.H.A.; Zamzuri, N.A. Elasticity and expansion test performance of geopolymer as oil well cement. IOP Conf. Series Earth Environ. Sci. 2018, 140, 012147. [Google Scholar] [CrossRef] [Green Version]
  11. Abbas, G.; Irawan, S.; Kumar, S.; Elrayah, A.A.I. Improving oil well cement slurry performance using hy-droxy-propylmethyl cellulose polymer. Adv. Mater. Res. 2013, 787, 222–227. [Google Scholar] [CrossRef]
  12. Eric, B.; Joel, F.; Grace, O. Oil well cement additives: A review of the common types. Oil Gas Res. 2016, 2, 112. [Google Scholar] [CrossRef]
  13. Mao, W.; Litina, C.; Al-Tabbaa, A. Development and application of novel sodium silicate microcap-sule-based self-healing oil well cement. Materials 2020, 13, 456. [Google Scholar] [CrossRef] [PubMed] [Green Version]
  14. Richhariya, G.; Dora, D.T.K.; Parmar, K.R.; Pant, K.K.; Singhal, N.; Lal, K.; Kundu, P.P. Development of self-healing ce-ment slurry through the incorporation of dual-encapsulated polyacrylamide for the prevention of water ingress in oil-well. Materials 2020, 13, 2921. [Google Scholar] [CrossRef] [PubMed]
  15. Plank, J.; Schroefl, C.; Gruber, M.; Lesti, M.; Sieber, R. Effectiveness of Polycarboxylate Superplasticizers in Ultra-High Strength Concrete: The Importance of PCE Compatibility with Silica Fume. J. Adv. Concr. Technol. 2009, 7, 5–12. [Google Scholar] [CrossRef] [Green Version]
  16. Leonelli, C.; Romagnoli, M. Rheology parameters of alkali-activated geopolymeric concrete binders. In Handbook of Alkali-Activated Cements, Mortars and Concretes; Elsevier: Amsterdam, The Netherlands, 2015; pp. 133–169. [Google Scholar]
  17. He, Y.; Zhang, X.; Kong, Y.; Wang, X.; Shui, L.; Wang, H. Influence of Polycarboxylate Superplasticizer on Rheological Behavior in Cement Paste. J. Wuhan Univ. Technol. Sci. Ed. 2018, 33, 932–937. [Google Scholar] [CrossRef]
  18. Igbani, S.; Appah, D.; Ogoni, H.A. The application of response surface methodology in minitab 16, to identify the optimal, comfort, and adverse zones of compressive strength responses in ferrous oilwell cement sheath systems. Int. J. Eng. Mod. Technol. 2020, 6, 1–20. [Google Scholar]
  19. Zahid, M.; Shafiq, N.; Isa, M.H.; Gil, L. Statistical modeling and mix design optimization of fly ash based engineered geopolymer composite using response surface methodology. J. Clean. Prod. 2018, 194, 483–498. [Google Scholar] [CrossRef]
  20. Rahman, S.H.B.A.; Irawan, S.; Shafiq, N.; Rajeswary, R. Investigating the expansion characteristics of geopolymer cement samples in a water bath and compared with the expansion of ASTM Class-G cement. Heliyon 2020, 6, e03478. [Google Scholar] [CrossRef] [PubMed] [Green Version]
Figure 1. API Compressive Strength Tester.
Crystals 11 00139 g001
Figure 2. Expansion Cell as per API RP 10B5.
Crystals 11 00139 g002
Figure 3. Effects of elastomer (R-Additive) content on compressive strength cured at 60 °C inside the water bath.
Crystals 11 00139 g003
Figure 4. SEM micrograph of fly ash samples.
Crystals 11 00139 g004
Figure 5. The failure mode of the samples subjected to a compressive strength test (a) Design 1, (b) Design 2, (c) Design 3, and (d) Design 4.
Crystals 11 00139 g005
Figure 6. Effects of elastomer (R-Additive) content on the linear expansion.
Crystals 11 00139 g006
Figure 7. Relationship between compressive strength and linear expansion of samples containing different contents of R additive.
Crystals 11 00139 g007
Figure 8. Normal plot of residual.
Crystals 11 00139 g008
Figure 9. Residual vs. Predicted.
Crystals 11 00139 g009
Figure 10. Residual versus experimental run.
Crystals 11 00139 g010
Figure 11. Predicted versus actual.
Crystals 11 00139 g011
Figure 12. 3D Plot for linear expansion at 81 °C curing temperature.
Crystals 11 00139 g012
Figure 13. 3D Plot for linear expansion at 66 °C curing temperature.
Crystals 11 00139 g013
Table 1. Fly ash components.
Parameter/ElementsWeight%
SiO246.47
Al2O325.95
TiO21.16
Fe2O38.31
CaO6.88
MgO4.95
Na2O1.72
K2O2.11
SO30.63
Cl<0.1
Moisture0.11
Loss of ignition1.61
Table 2. Details of geopolymer trial mixture formulations.
Design Solid Blend (SB)Alkaline Solution (g/L)
Fly Ash, FASlagExpandable Material R Additive
%Content g/L%Content g/L%Content g/L
18152.795.9106.535
276.549.78.55.5159.7535
37246.885.2201335
467.543.97.54.92516.2535
Note: All ingredients are the percentage by weight of the mixture—Solid Blend (SB) was fixed to 65%, and Alkaline Solution was fixed to 35% Fly ash, slag, and R additives are % by weight of SB Expandable Material is Styrene-butadiene rubber-R.
Table 3. Effects of different dosages of R additive on the rheological properties of the mixture.
Mixture Design 1234
R additive (% of SB)10152025
PVMeasured (cP)487483104
Relative1.001.541.732.17
YP Measured (N/m2)3.86.710.112.3
Relative1.001.752.633.25
Table 4. Parameters for design of experiments.
TermFactorUnitLow LevelHigh Level
ACuring TimeDays2060
BCuring Temperature°C6090
CR Concentration%1025
Table 5. The pilot runs for experiments.
Run OrderFactor 1
A: Curing Time
Day
Factor 2
B: Curing Temperature
°C
Factor 3
C: R Concentration
%
Response 1:
Linear Expansion
%
16060101.76
26090101.05
36060254.61
42090100.36
52060253.55
62090100.36
76060101.52
86090100.91
92060253.77
106090255.13
112060100.99
126060254.57
132060100.82
142090254.01
152090254.94
166090254.24
Publisher’s Note: MDPI stays neutral with regard to jurisdictional claims in published maps and institutional affiliations.

