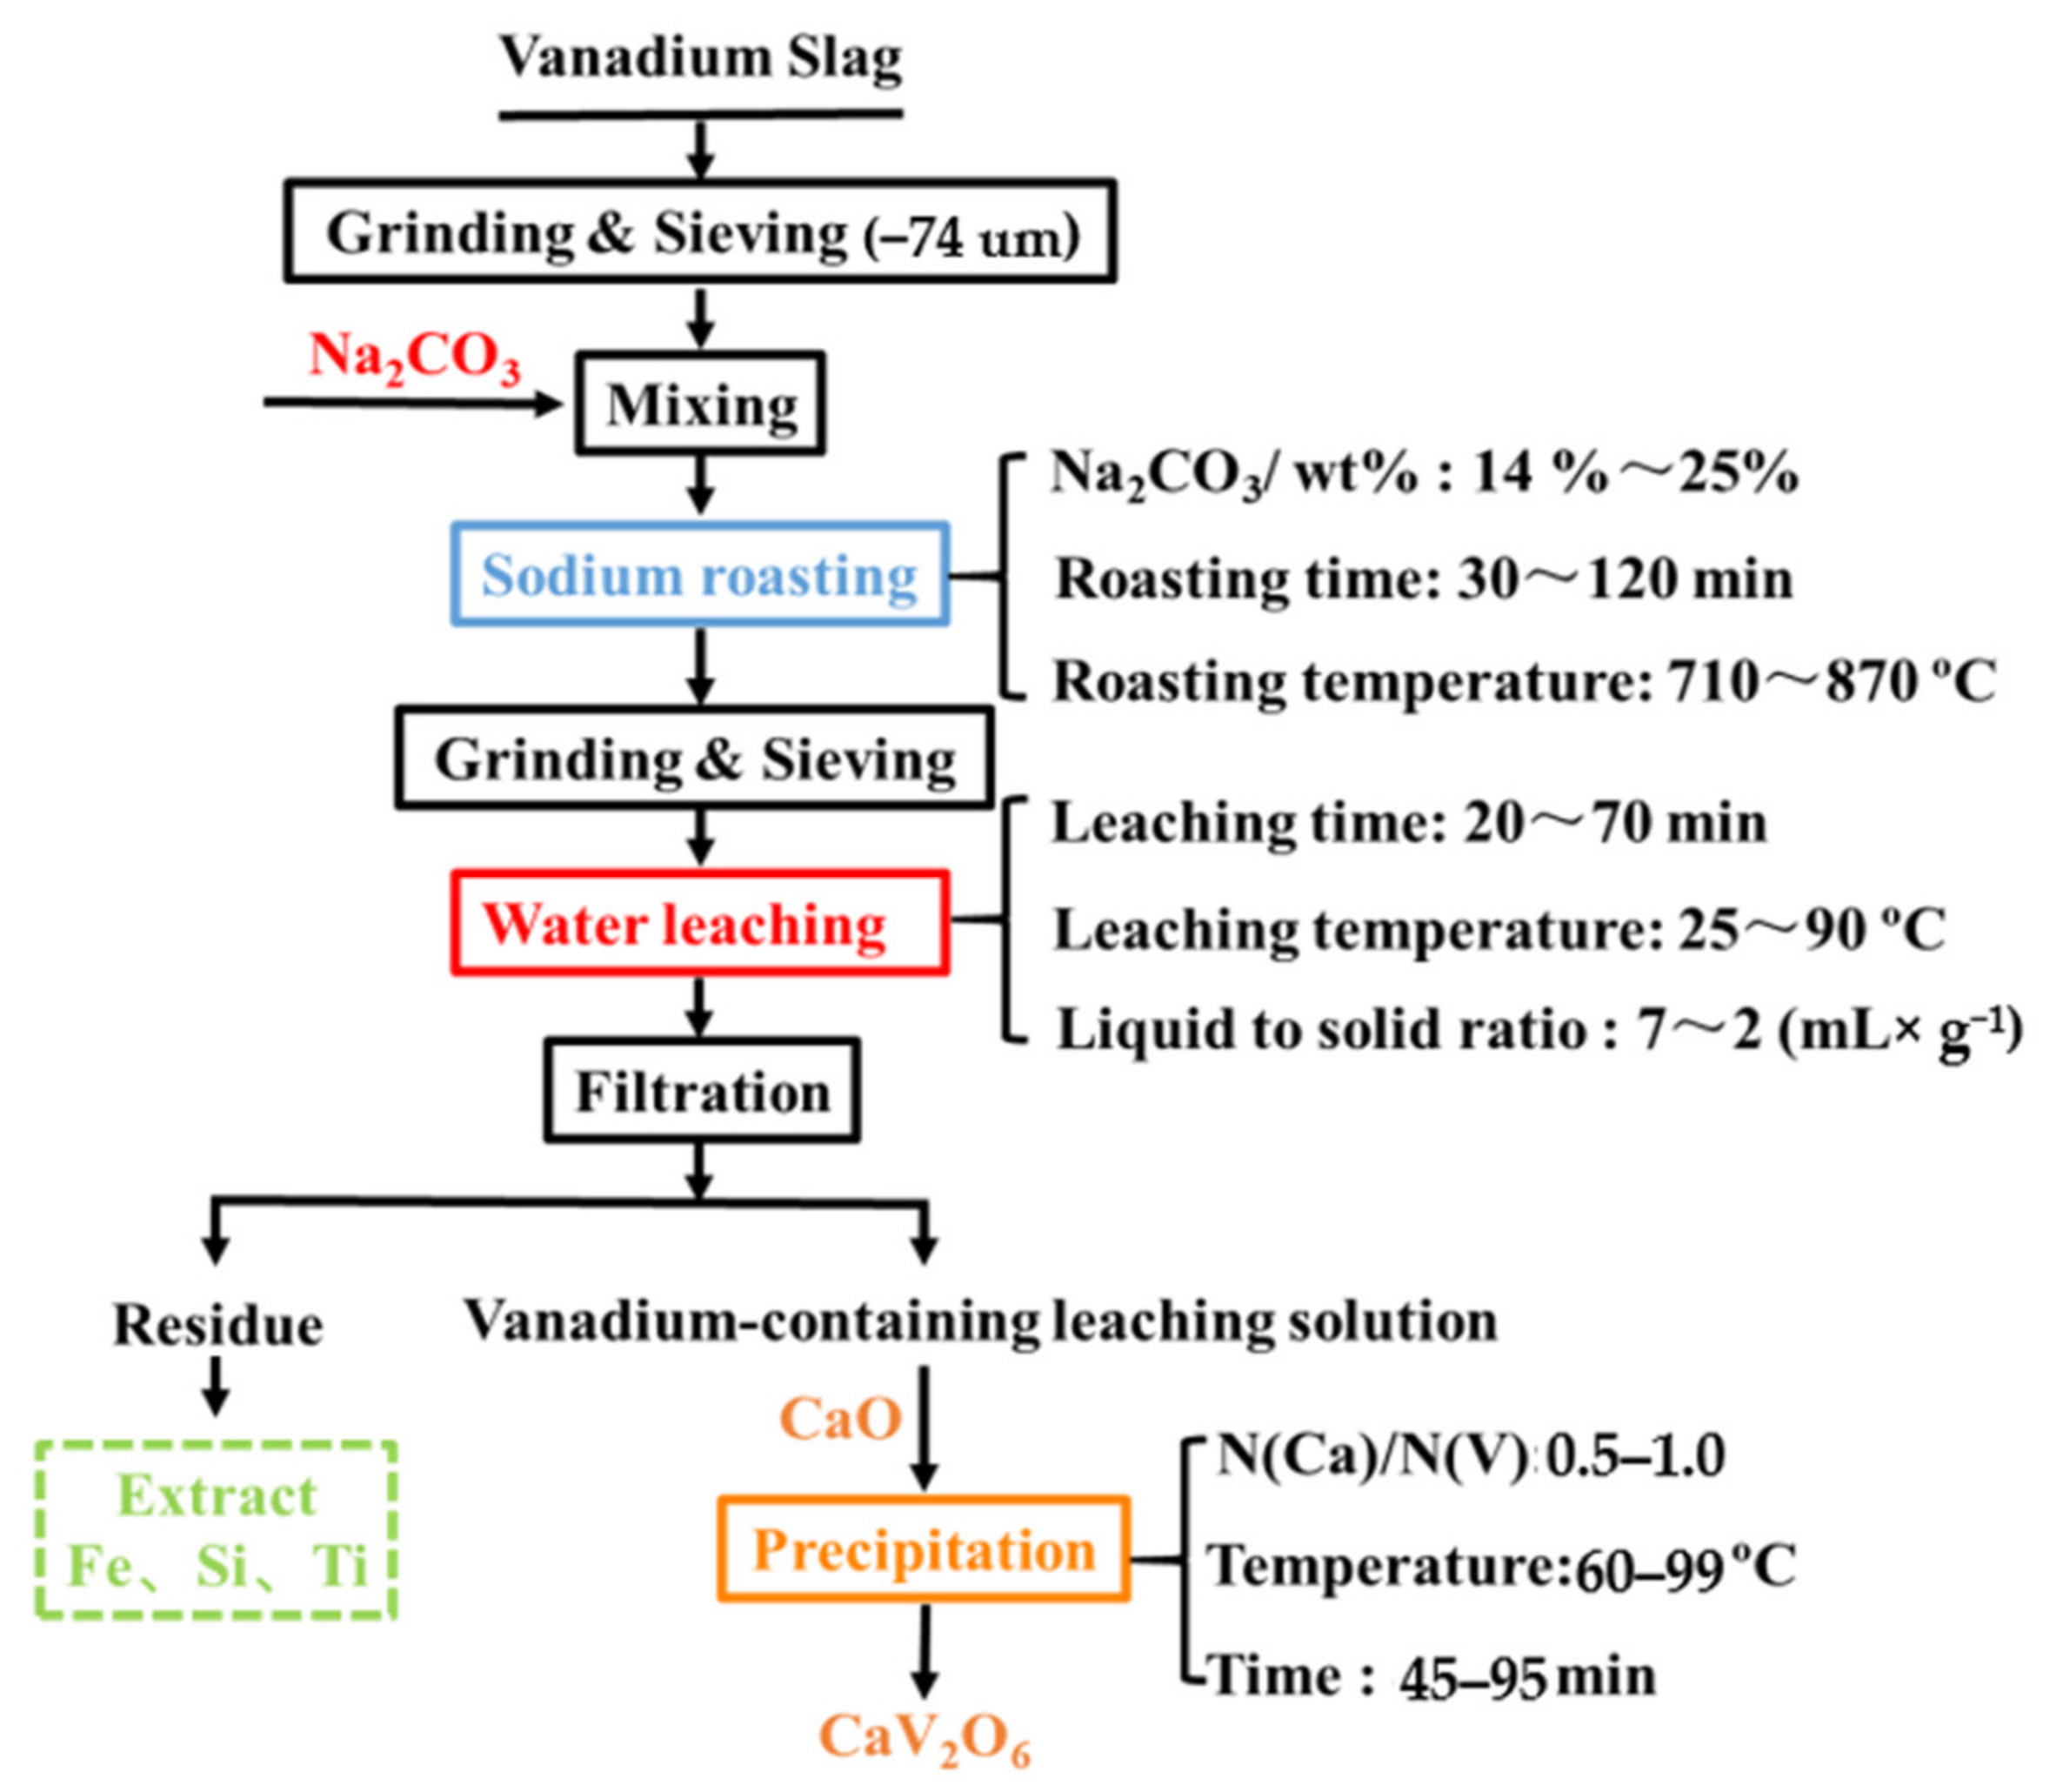
3.1. Effect of Conditions of Roasting with Sodium on The Leaching Rate of Vanadium and Silicon
Figure 2 shows the effects of Na
2CO
3 addition, roasting temperature, and roasting time on the leaching rate of V and Si. The roasted sample is leached with water at 90 °C for 60 min, the ratio of liquid to solid is 5 to 1, and the stirring speed is 300 rpm. In
Figure 2a, the vanadium leaching rate increases at first and then decreases with the increase of Na
2CO
3 content. When the mass fraction of Na
2CO
3 is 20%, the maximum leaching rate of vanadium is 89.54%, which is due to the formation of soluble sodium salts such as NaVO
3, Na
3VO
4 and Na
4V
2O
7. When the amount of sodium carbonate is more than 20%, the leaching rate of vanadium decreases, mainly because too much Na
2CO
3 is easy to form a substance (NaFeSi
2O
6) with a low melting point with vanadium slag, which leads to melting and sintering of the sample, wrapping on the surface of roasting slag and reducing the leaching of vanadium. For the leaching behavior of Si, the results show that the leaching rate of Si increases gradually with the increase of Na
2SiO
3 content, this is because part of excess Na
2CO
3 is easy to combine with SiO
2 in vanadium slag to form Na
2SiO
3, When the leaching solution is alkaline, Na
2SiO
3 is retained in the leaching solution, so that the leaching rate of Si in the leaching solution gradually increases. When the leaching rate of vanadium reaches the highest, the leaching rate of Si is 1.96%.
In
Figure 2b, when the roasting temperature of vanadium slag is 710 °C, 69.25% of V is leached. It can be inferred that most of the vanadium in the vanadium slag has undergone sodiumization and oxidation at 710 °C, forming soluble sodium vanadate. When the temperature rises to 790 °C, the highest vanadium leaching rate is 89.54%. When the temperature exceeds 790 °C, the vanadium leaching rate decreases gradually, This is since the high roasting temperature leads to the appearance of the glass phase in the roasted sample, which makes the material denser and reduces the vanadium leaching. However, the leaching rate of Si is opposite to that of V, which is attributed to the insoluble NaFeSi
2O
6 and NaTiSi
2O
6 in the phase of vanadium slag when the roasting temperature is higher than 710 °C, which reduces the leaching rate of Si. The leaching rate of silicon is 1.96% at 790 °C.
The effect of roasting time on the leaching rate of V and Si is shown in
Figure 2c. With the extension of roasting time, the leaching rate of vanadium increases gradually, mainly because the trivalent vanadium in vanadium slag is fully oxidized and natrified with the extension of roasting time. When the roasting time exceeds 120 min, the leaching rate of vanadium decreases, which is mainly due to the long residence time of vanadium slag in the high-temperature zone and the caking of vanadium slag samples. It is not conducive to the oxidation and natrification of low-valent vanadium. At the same time, with the extension of roasting time, the leaching rate of Si increased slightly, and when the roasting time was 120 min, the leaching rates of vanadium and Si were 89.54% and 1.96%, respectively. Through the single factor roasting experiment, the optimum roasting conditions are determined as follows: the roasting temperature is 790 °C, the roasting time is 120 min and the amount of Na
2CO
3 is 20%.
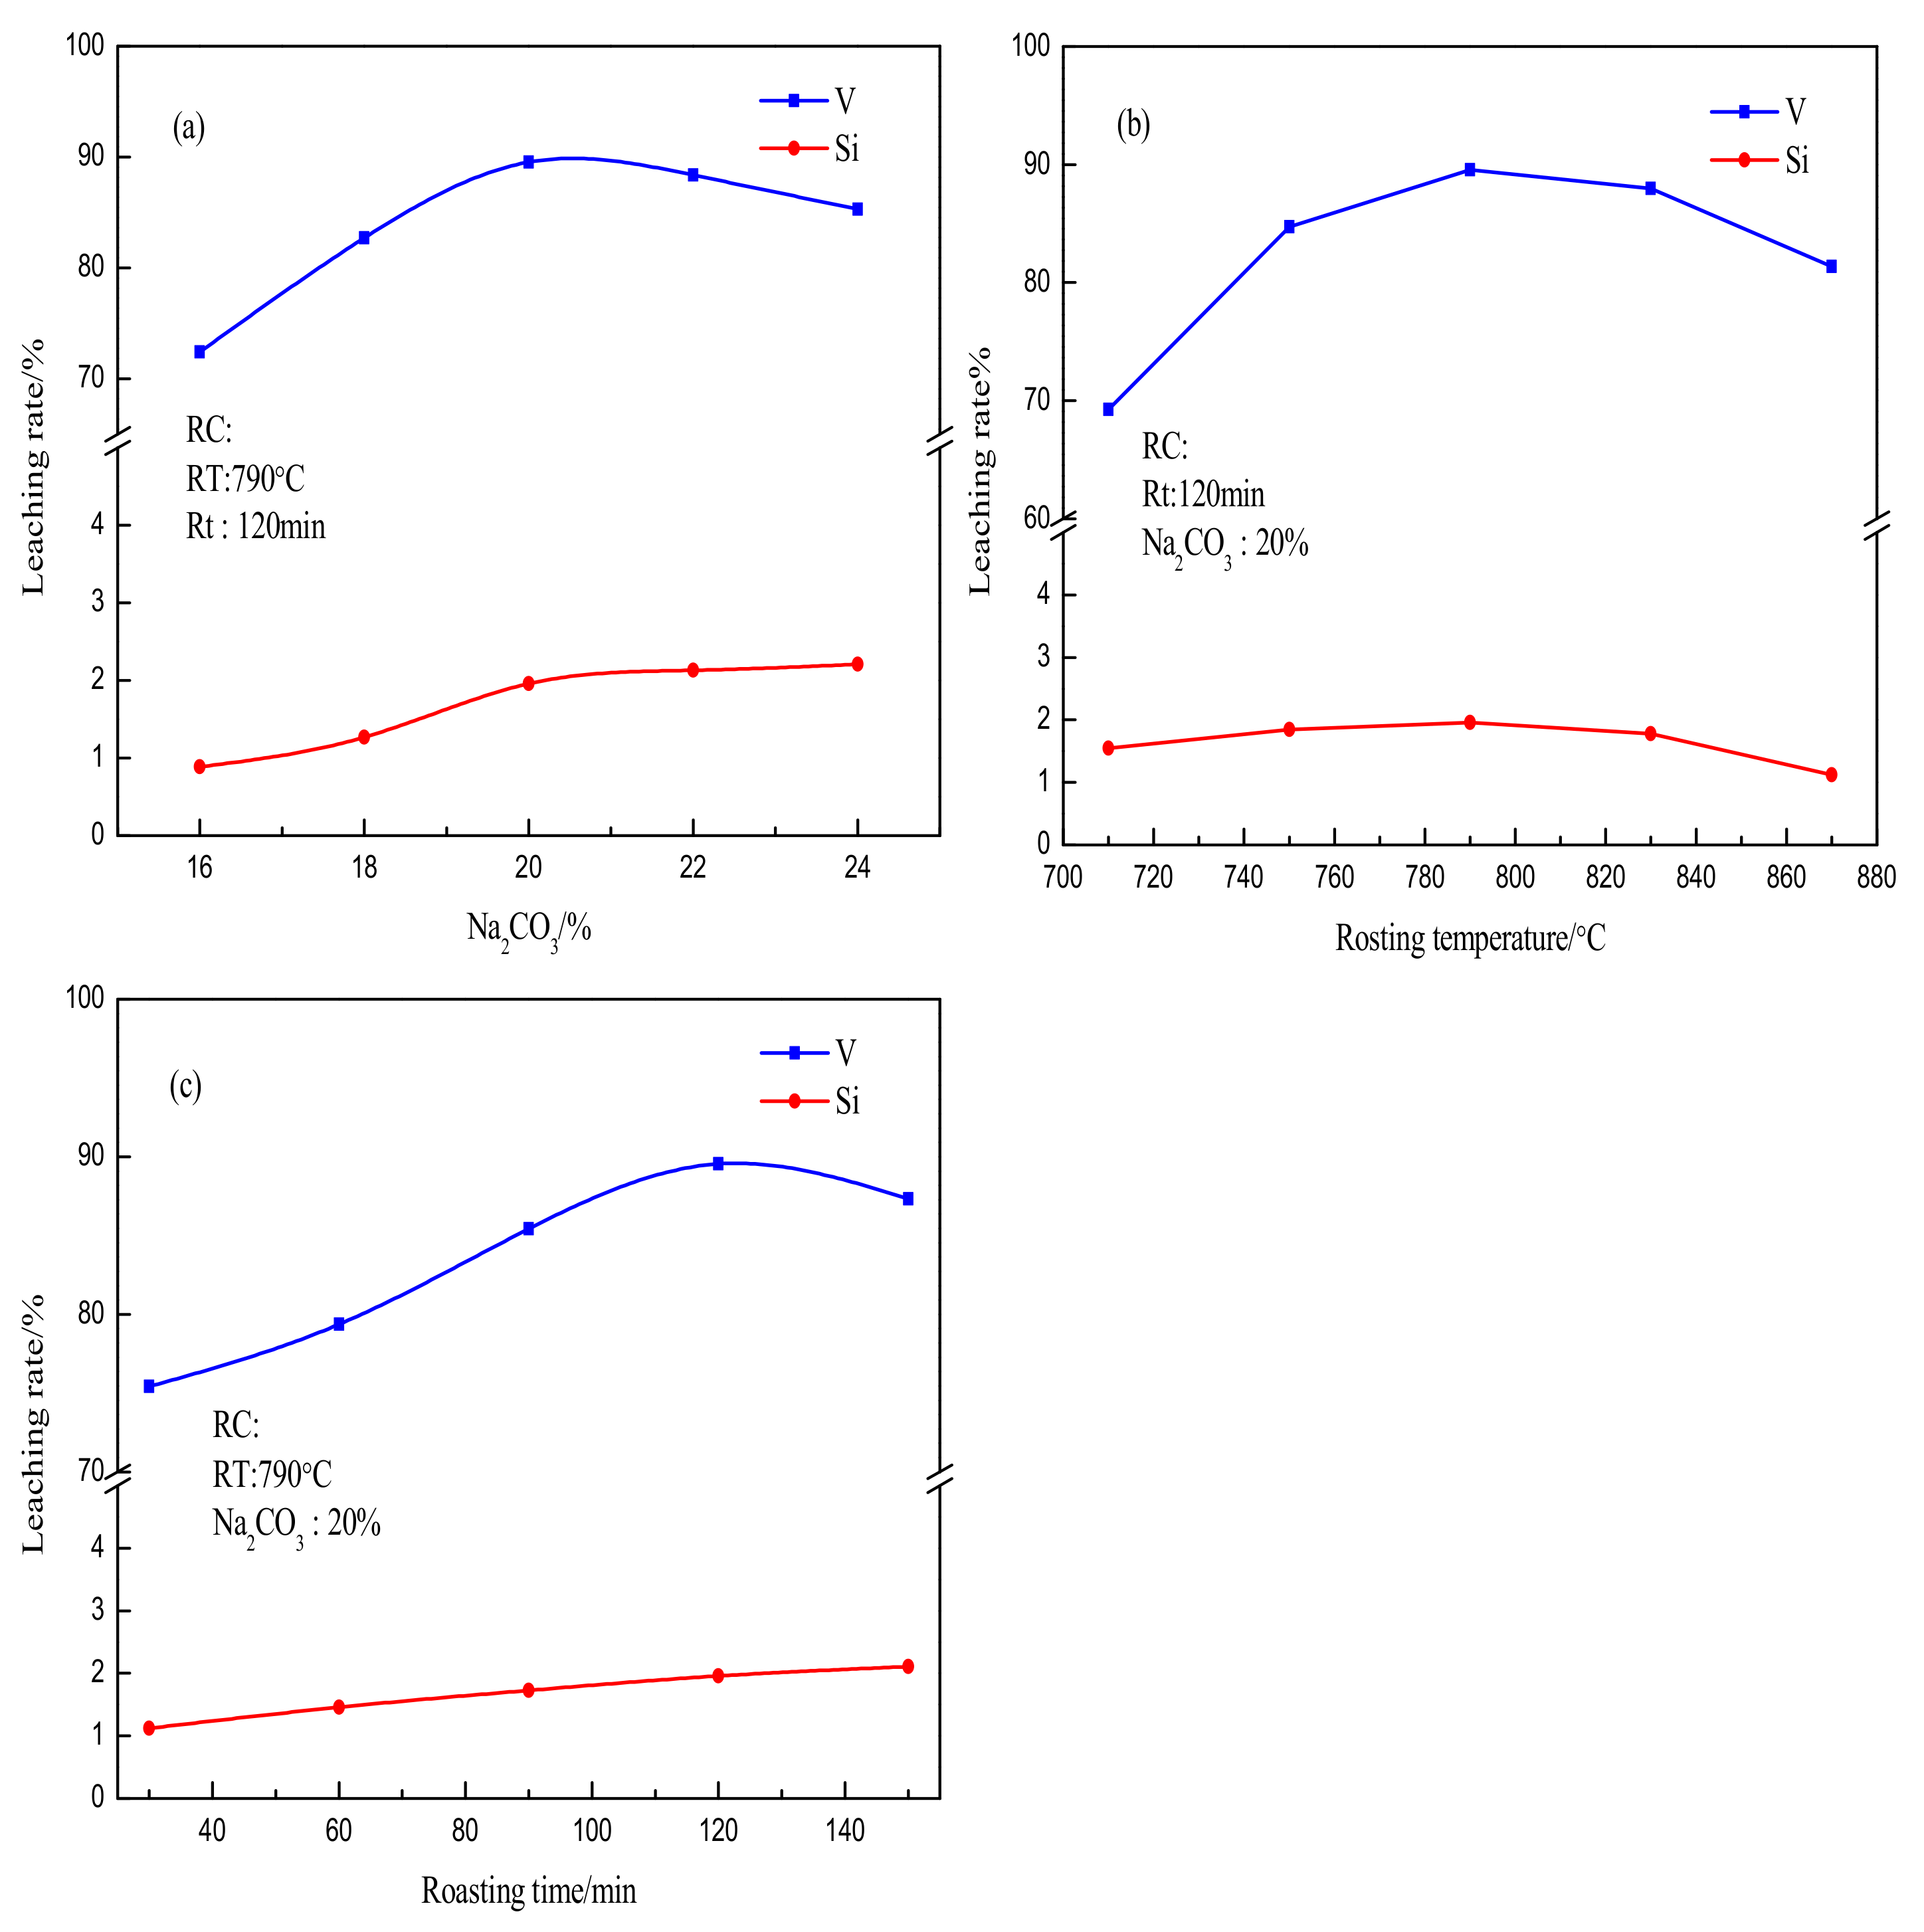
3.2. Effect of Leaching Conditions on The Leaching Rate of Vanadium and Silicon
Figure 3 shows the effects of leaching liquid-solid ratio, leaching time, and leaching temperature on the leaching rate of V and Si. The roasting sample was obtained under the conditions of 20% Na
2CO
3 addition, roasting temperature 790 °C, roasting time 120 min, and leaching solution stirring speed 300 r/min. In
Figure 3a, the leaching rate of vanadium increases gradually with the increase of the liquid-solid ratio, and the maximum vanadium leaching rate reaches 89.54% when the liquid-solid ratio is 5 to 1. This is mainly because the viscosity of the leaching solution decreases gradually with the increase of liquid-solid ratio, and the diffusion resistance of soluble sodium vanadate into the solution decreases gradually, which makes the soluble sodium vanadate can be leached more easily. Meanwhile, with the increase of solid-liquid ratio, the alkalinity of vanadium leaching solution also decreases, which is harmful to the leaching of vanadium (sodium vanadate is the salt of strong alkali weak acid, the vanadate ion is easily hydrolyzed, making the solution alkaline. The higher the alkalinity, the more it can inhibit the hydrolysis of vanadate ion, which is beneficial to the leaching of vanadium.), This explains why the leaching rate of vanadium will decrease when the liquid-to-solid ratio is greater than 5:1 When the leaching rate of vanadium reaches the maximum, the leaching rate of Si is 1.96%.
Figure 3b shows the effect of leaching time on the leaching rate of V and Si. With the increase of leaching time, the leaching rate increases gradually. When the leaching time is 60min, the leaching rate of vanadium reaches 89.54%. This is due to the physical dissolution of soluble sodium vanadate in the roasted sample and increasing the leaching time can effectively increase the leaching rate. When the leaching time exceeds 60min, the leaching rate of vanadium increases slightly. Therefore, the suitable leaching time is 60min. The leaching rate of Si is the same as that of vanadium. When the leaching time is 70min, the maximum leaching rate of Si is 2.18%.
Figure 3c shows the effect of leaching temperature on the leaching rate of V and Si. With the increase of leaching temperature, the leaching rate of vanadium increases gradually. When the Leaching temperature is 50 °C, the leaching rate of vanadium is only 62.45%. When the temperature rises to 90 °C, the leaching rate of vanadium is 89.54%. This is mainly since increasing temperature can improve the solubility of soluble sodium vanadate, on the other hand, the increasing temperature can improve the movement ability of water molecules, reduce the viscosity of the solution and gradually increase the leaching rate of vanadium. When the temperature of the leaching solution rises to 99 °C, the leaching rate of vanadium is 90.13%, which indicates that when the leaching temperature is higher than 90 °C, the contribution of temperature to the leaching rate of vanadium becomes very small. The leaching trend of Si is consistent with that of vanadium. Increasing temperature will increase the leaching rate of Si. When the temperature is 99 °C, the maximum leaching rate of Si is 2.01%. Through the single factor leaching method, the optimum leaching conditions can be determined as follows: the ratio of liquid to solid is 5 to 1, the leaching time is 60 min and the leaching temperature is 90 °C.
Besides, the concentration of the main ions in the vanadium leaching solution under the optimal conditions is shown in
Table 2. The results show that the concentration of impurities is far less than that of vanadium ion, which indicates that the vanadium-containing leaching solution can be directly used as a vanadium source without purification.
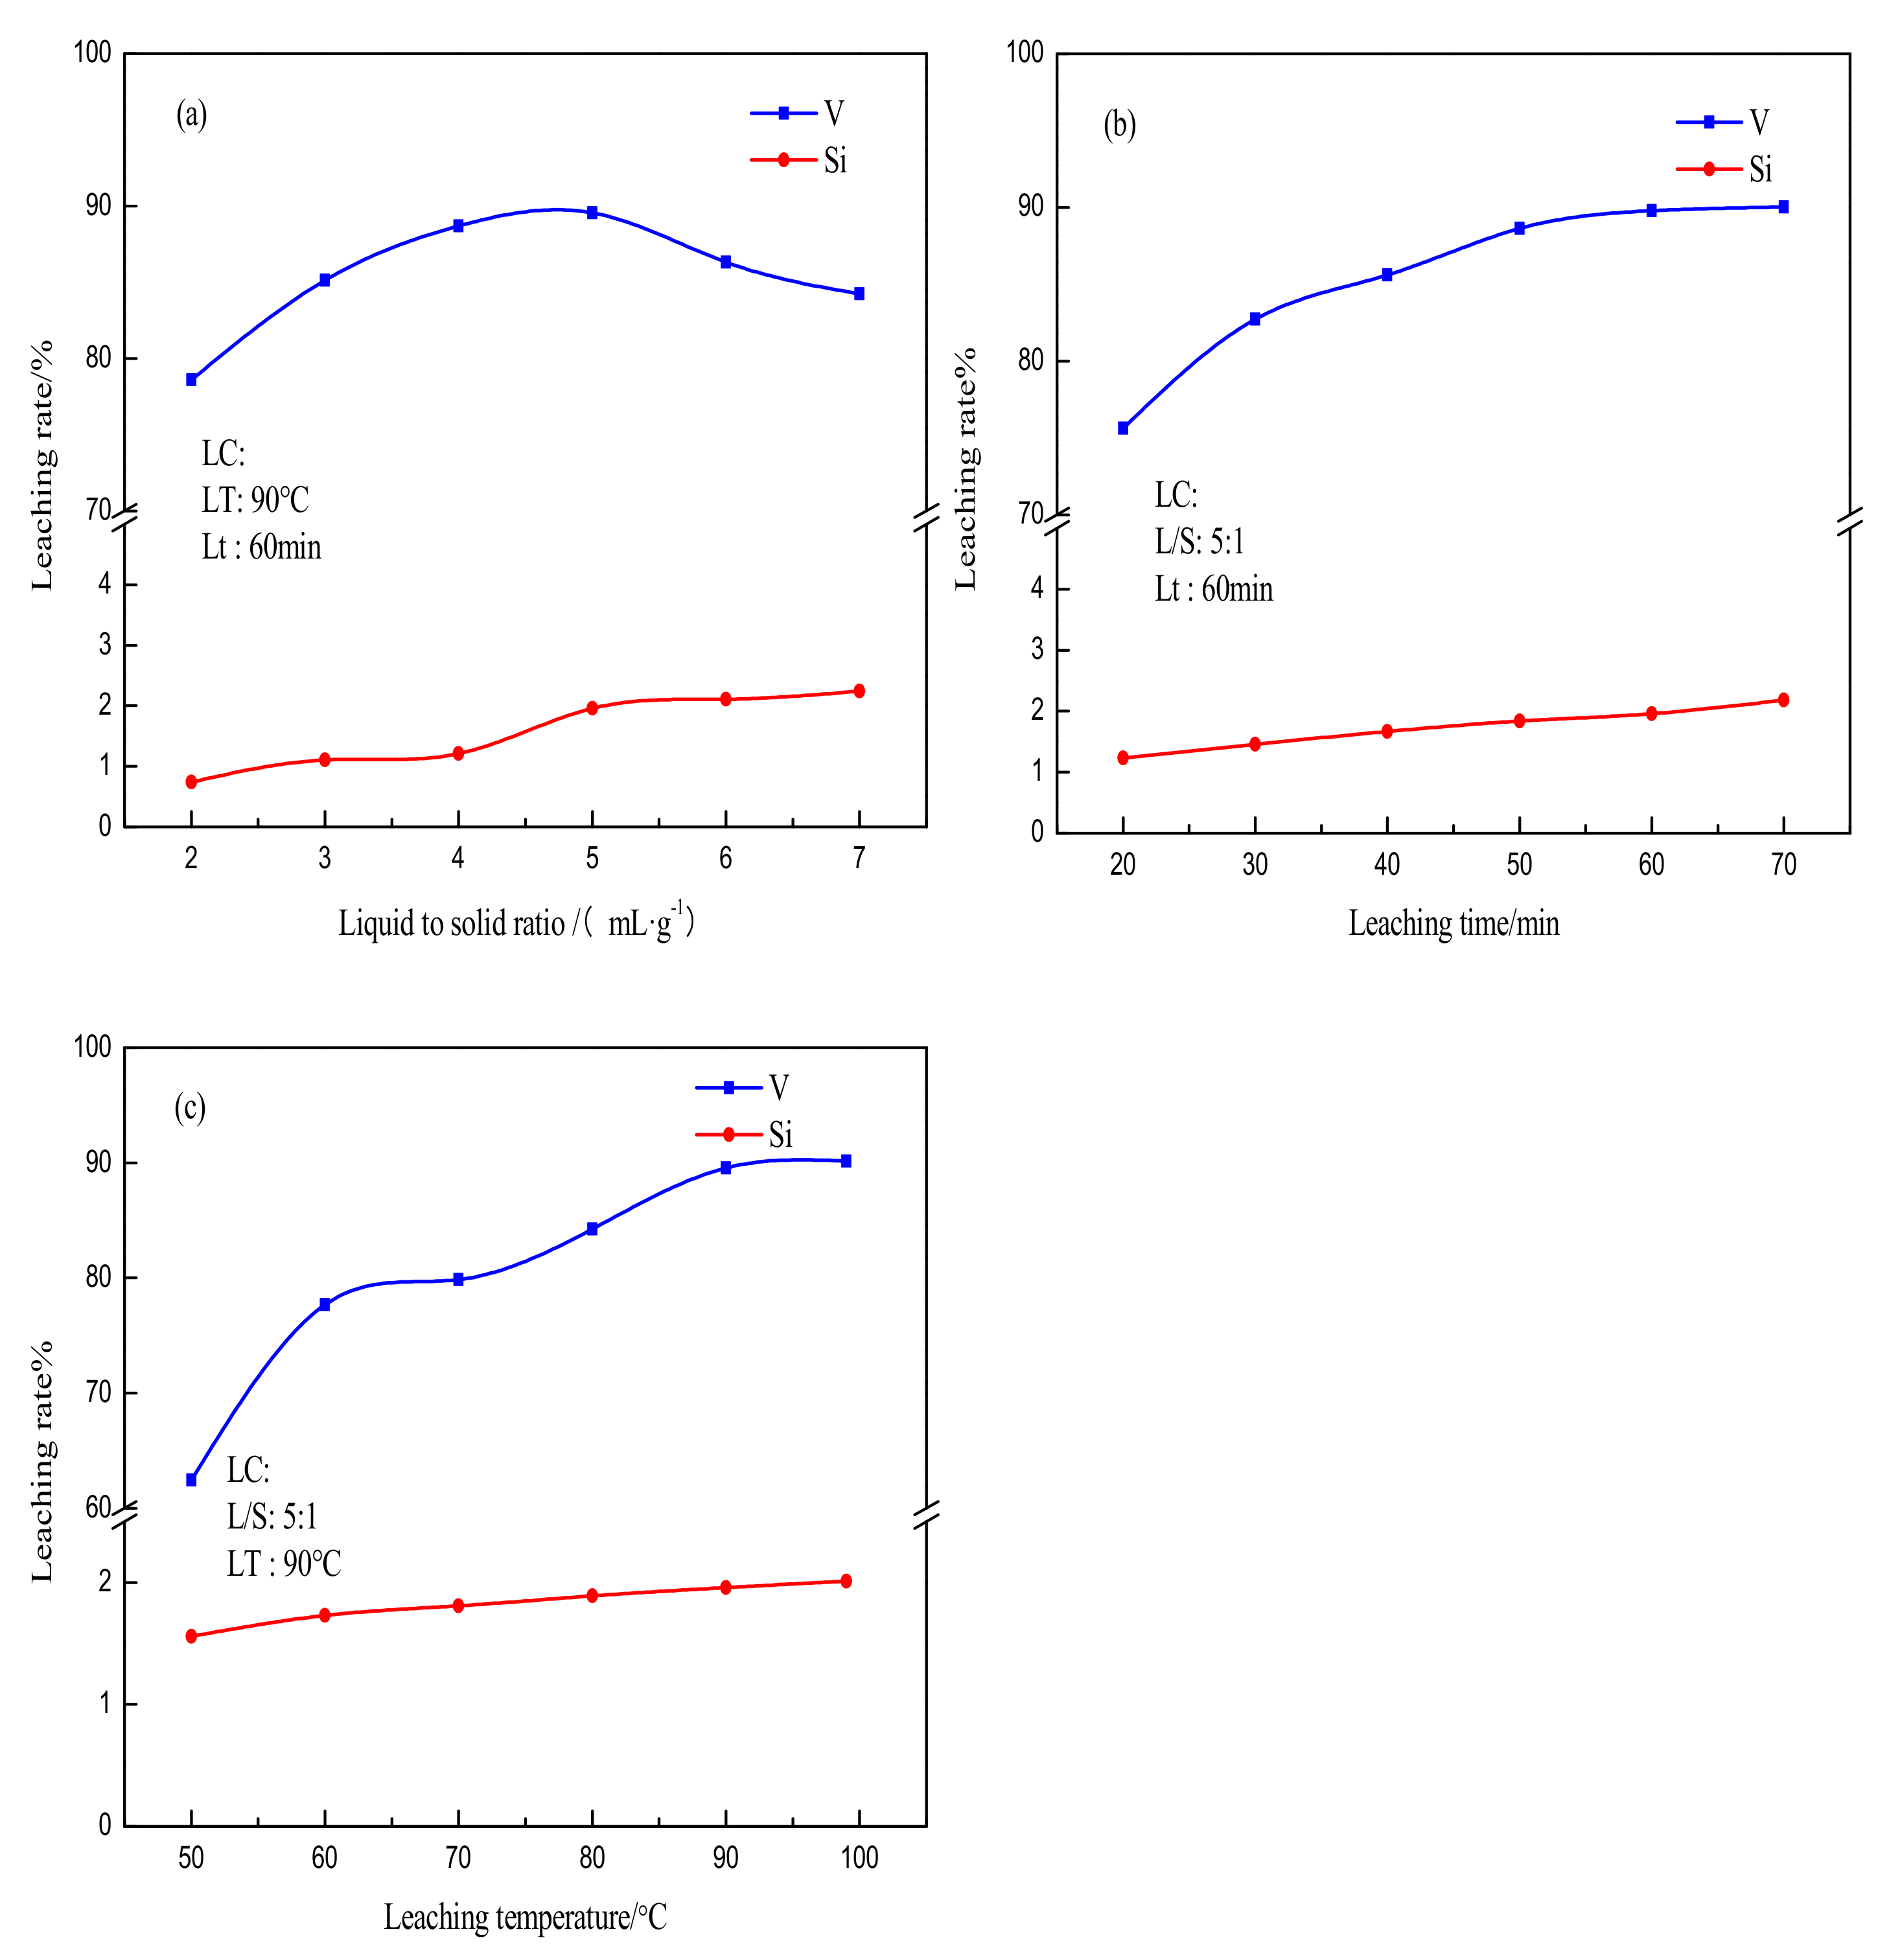
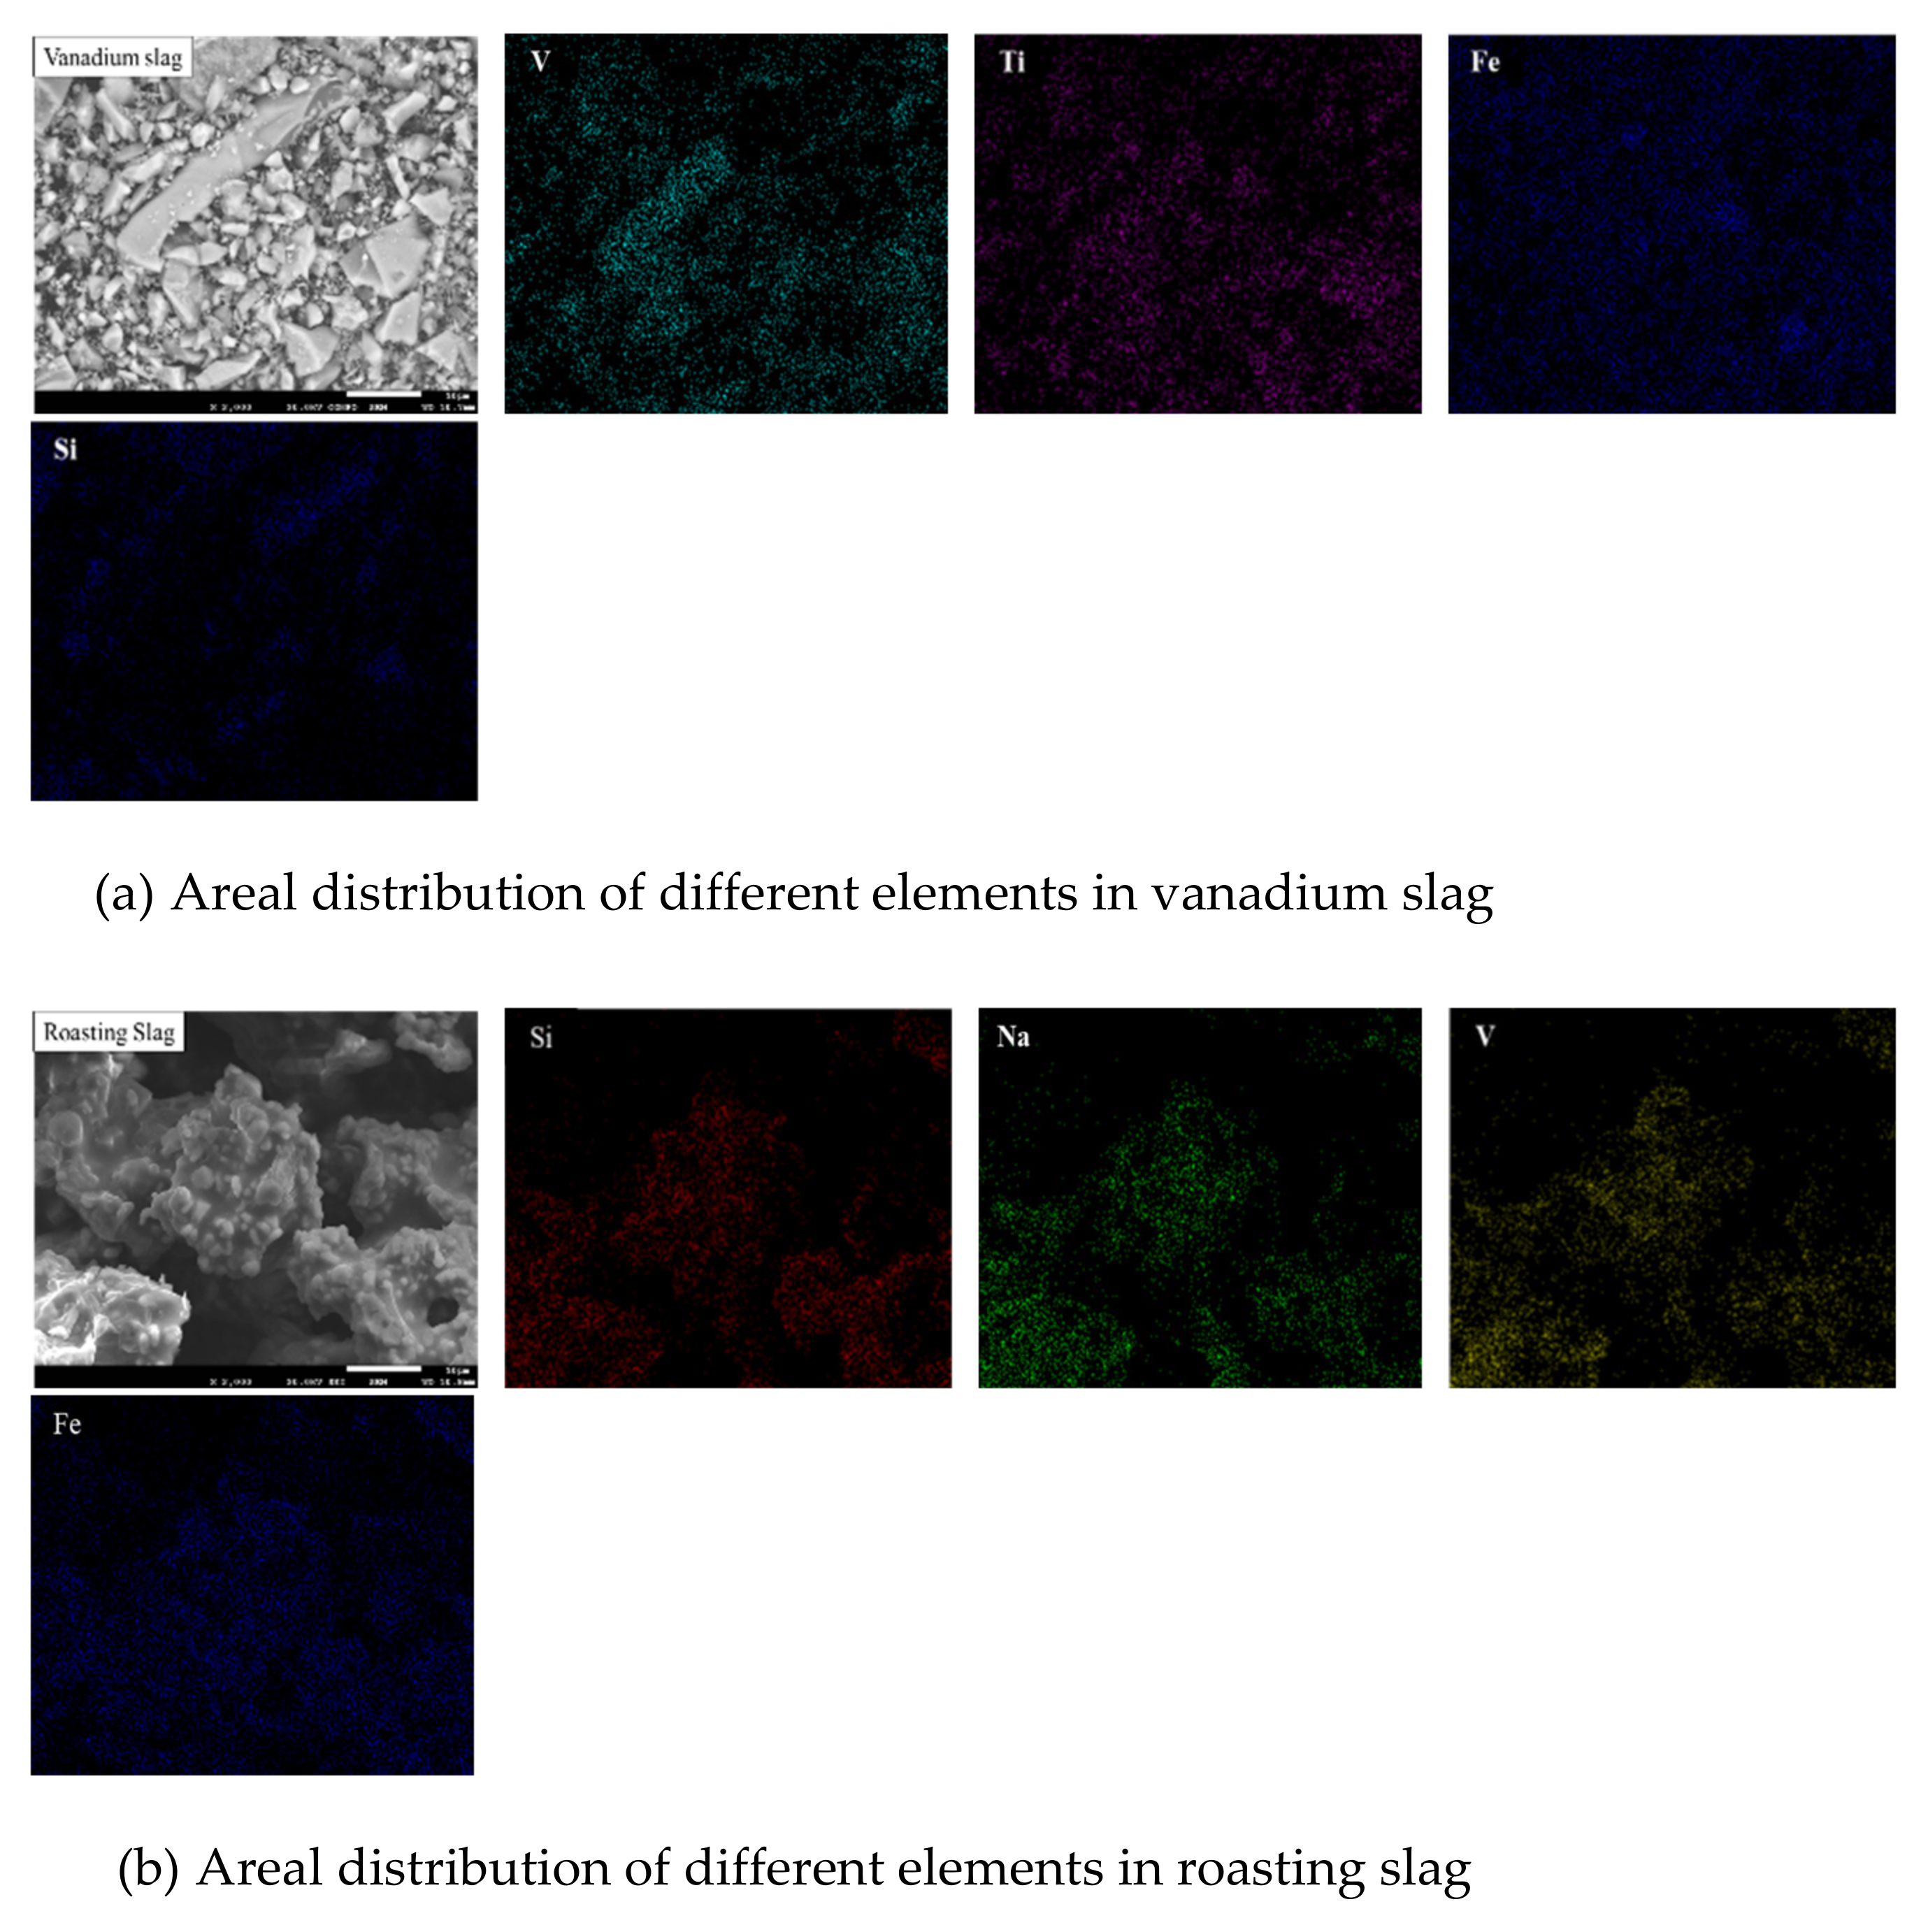
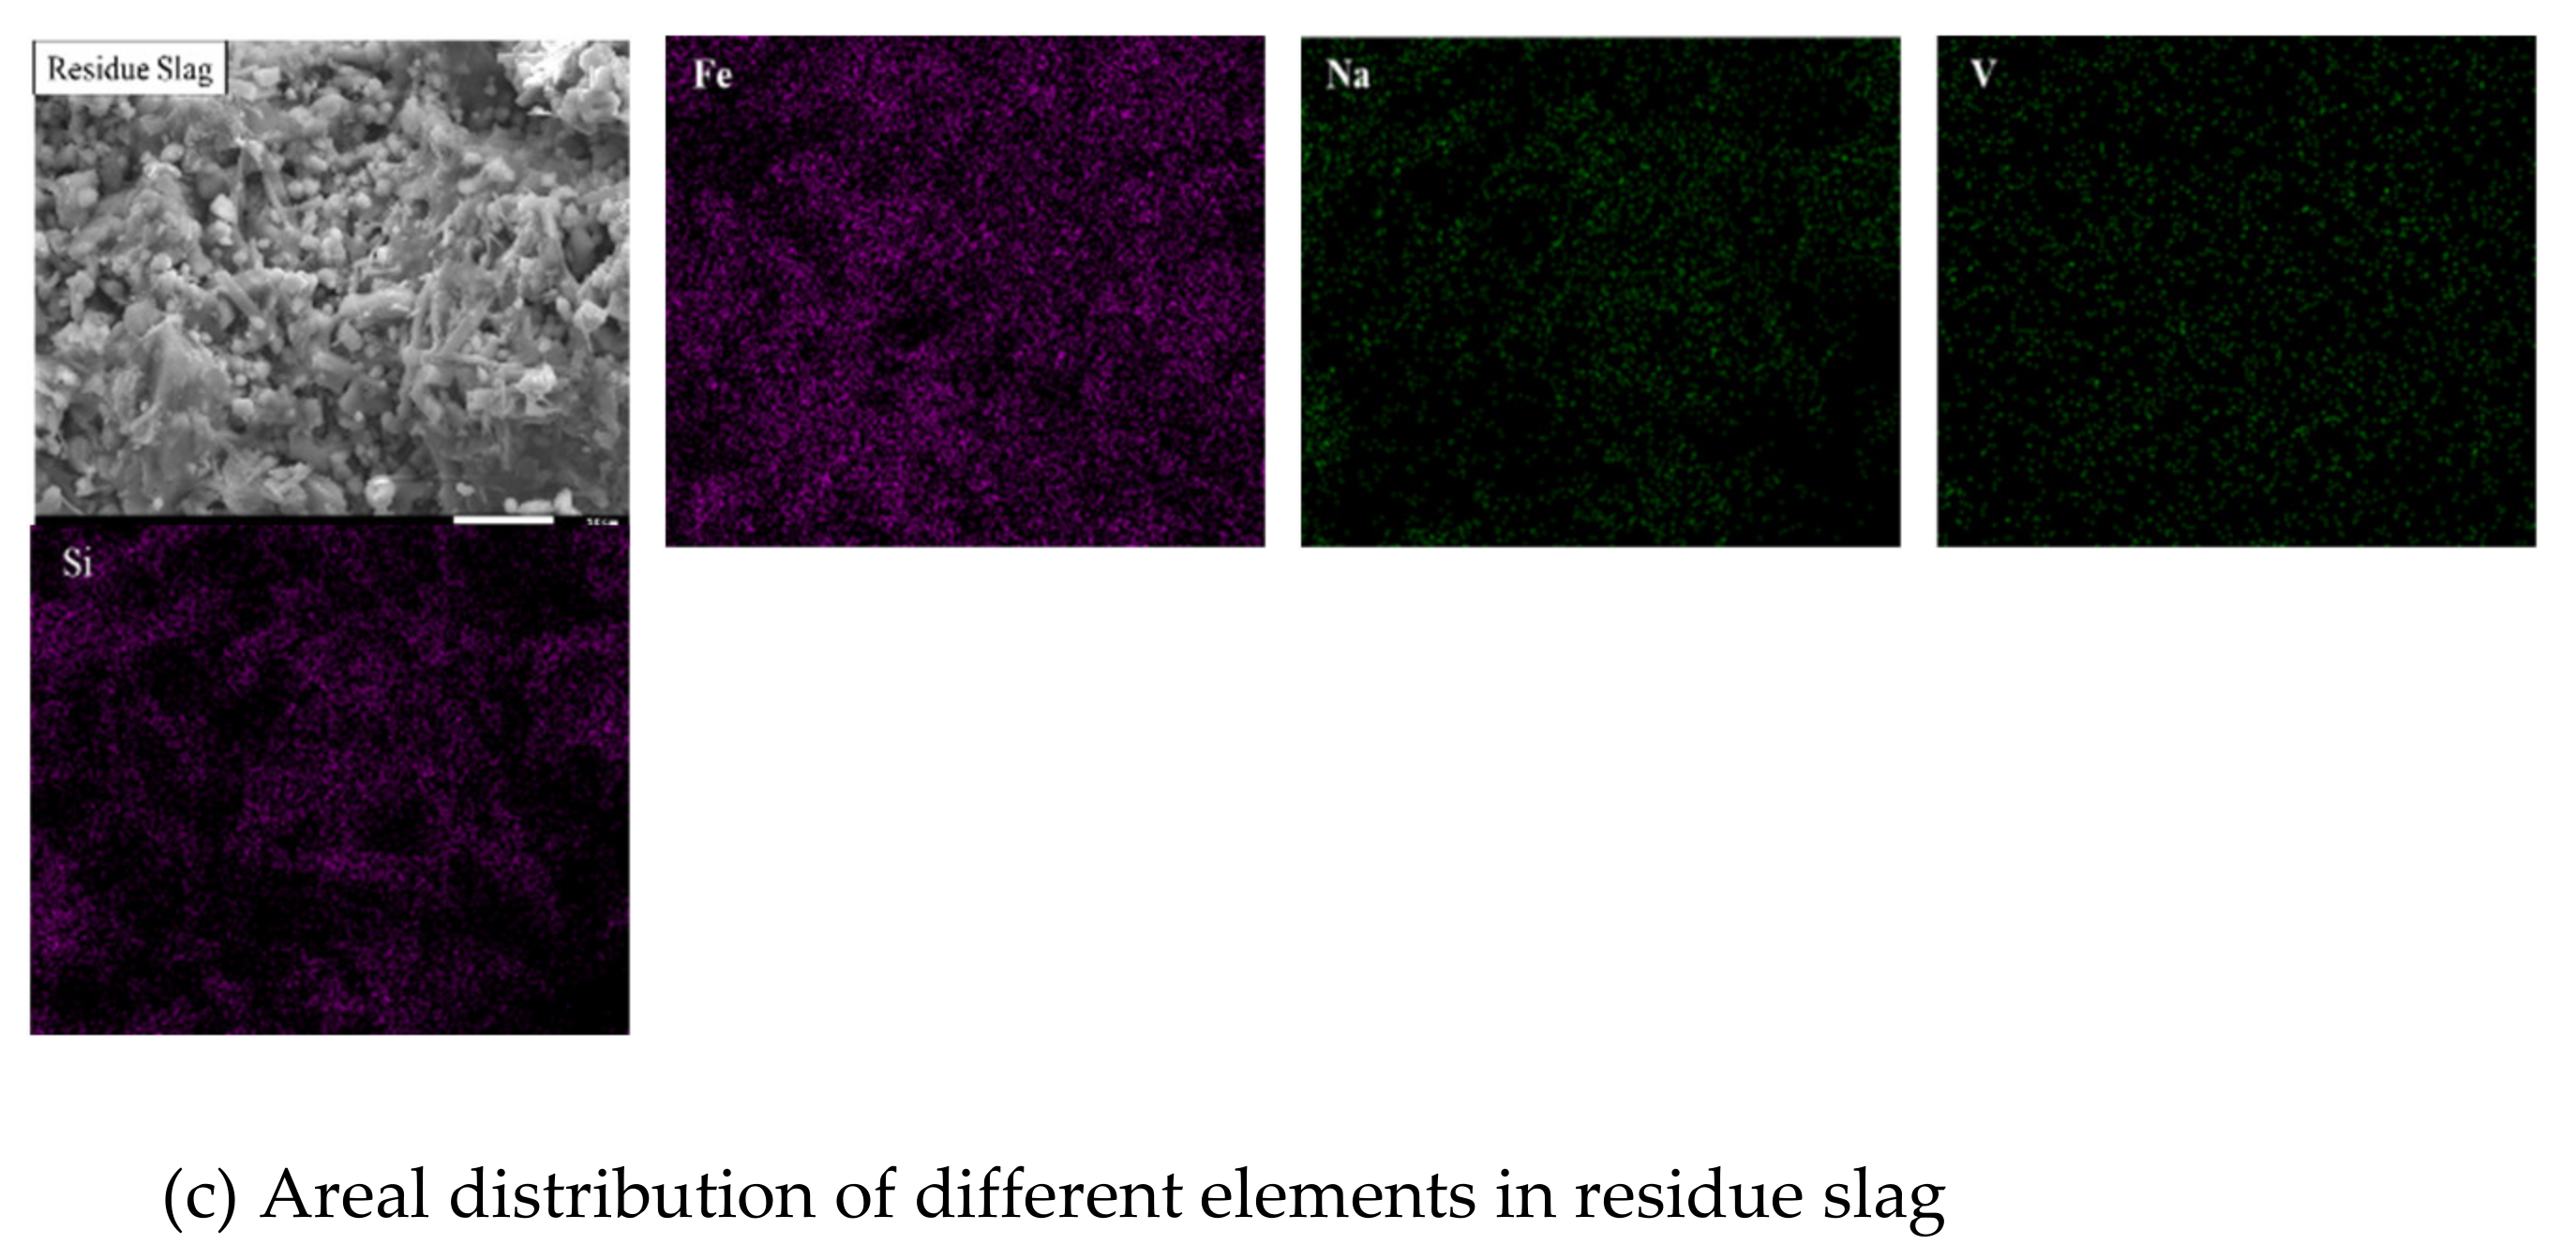
Figure 4 and
Figure 5 show the phase, surface morphology, and element distribution of vanadium slag, roasting slag, and residue. It can be seen from
Figure 4 that vanadium slag is mainly composed of vanadium iron spinel phase (FeV
2O
4), silicate phase (Fe
2SiO
4), and titanium spinel phase (Fe
2.5Ti
0.5O
4). Combined with
Figure 5a, it can be seen that most of the surface distribution of vanadium and titanium elements coincide with each other, mainly because the chemical properties of titanium and vanadium are similar and often associated. It can be seen from
Figure 4 that the spinel and silicate phases in vanadium slag have been decomposed after roasting, which can be observed from the disappearance of the peaks of these phases in the roasting slag, and replaced by new phases such as Fe
2O
3, Na
2SiO
3, Na
4V
2O
7, and NaVO
3, the main reactions of sodium vanadate formation in Equations (3) and (4).The distribution of vanadium and sodium in
Figure 5b is almost the same, which proves the existence of sodium vanadate and the repeated distribution of Na, Fe, and Si, which proves the existence of NaFeSi
2O
6. This corresponds to the diffraction peak of NaFeSi
2O
6 in
Figure 4. After the roasting slag was leached by water, the soluble Na
4V
2O
7, NaVO
3, and NaSiO
3 phases disappeared and transferred into the vanadium leaching solution, and the insoluble Fe
2O
3, NaFeSi
2O
6, and NaTiSi
2O
6 remained in the residue. At the same time, combined with
Figure 5c, it is known that the V in the residue is uniformly distributed and the content is greatly reduced, which is different from the segregation behavior in the roasting slag, which is a typical manifestation of vanadium water leaching. At the same time, the surface distributions of Fe, Si, and Na are also highly overlapping, which shows that silicon is retained in the residue mainly in the form of NaFeSi
2O
6:
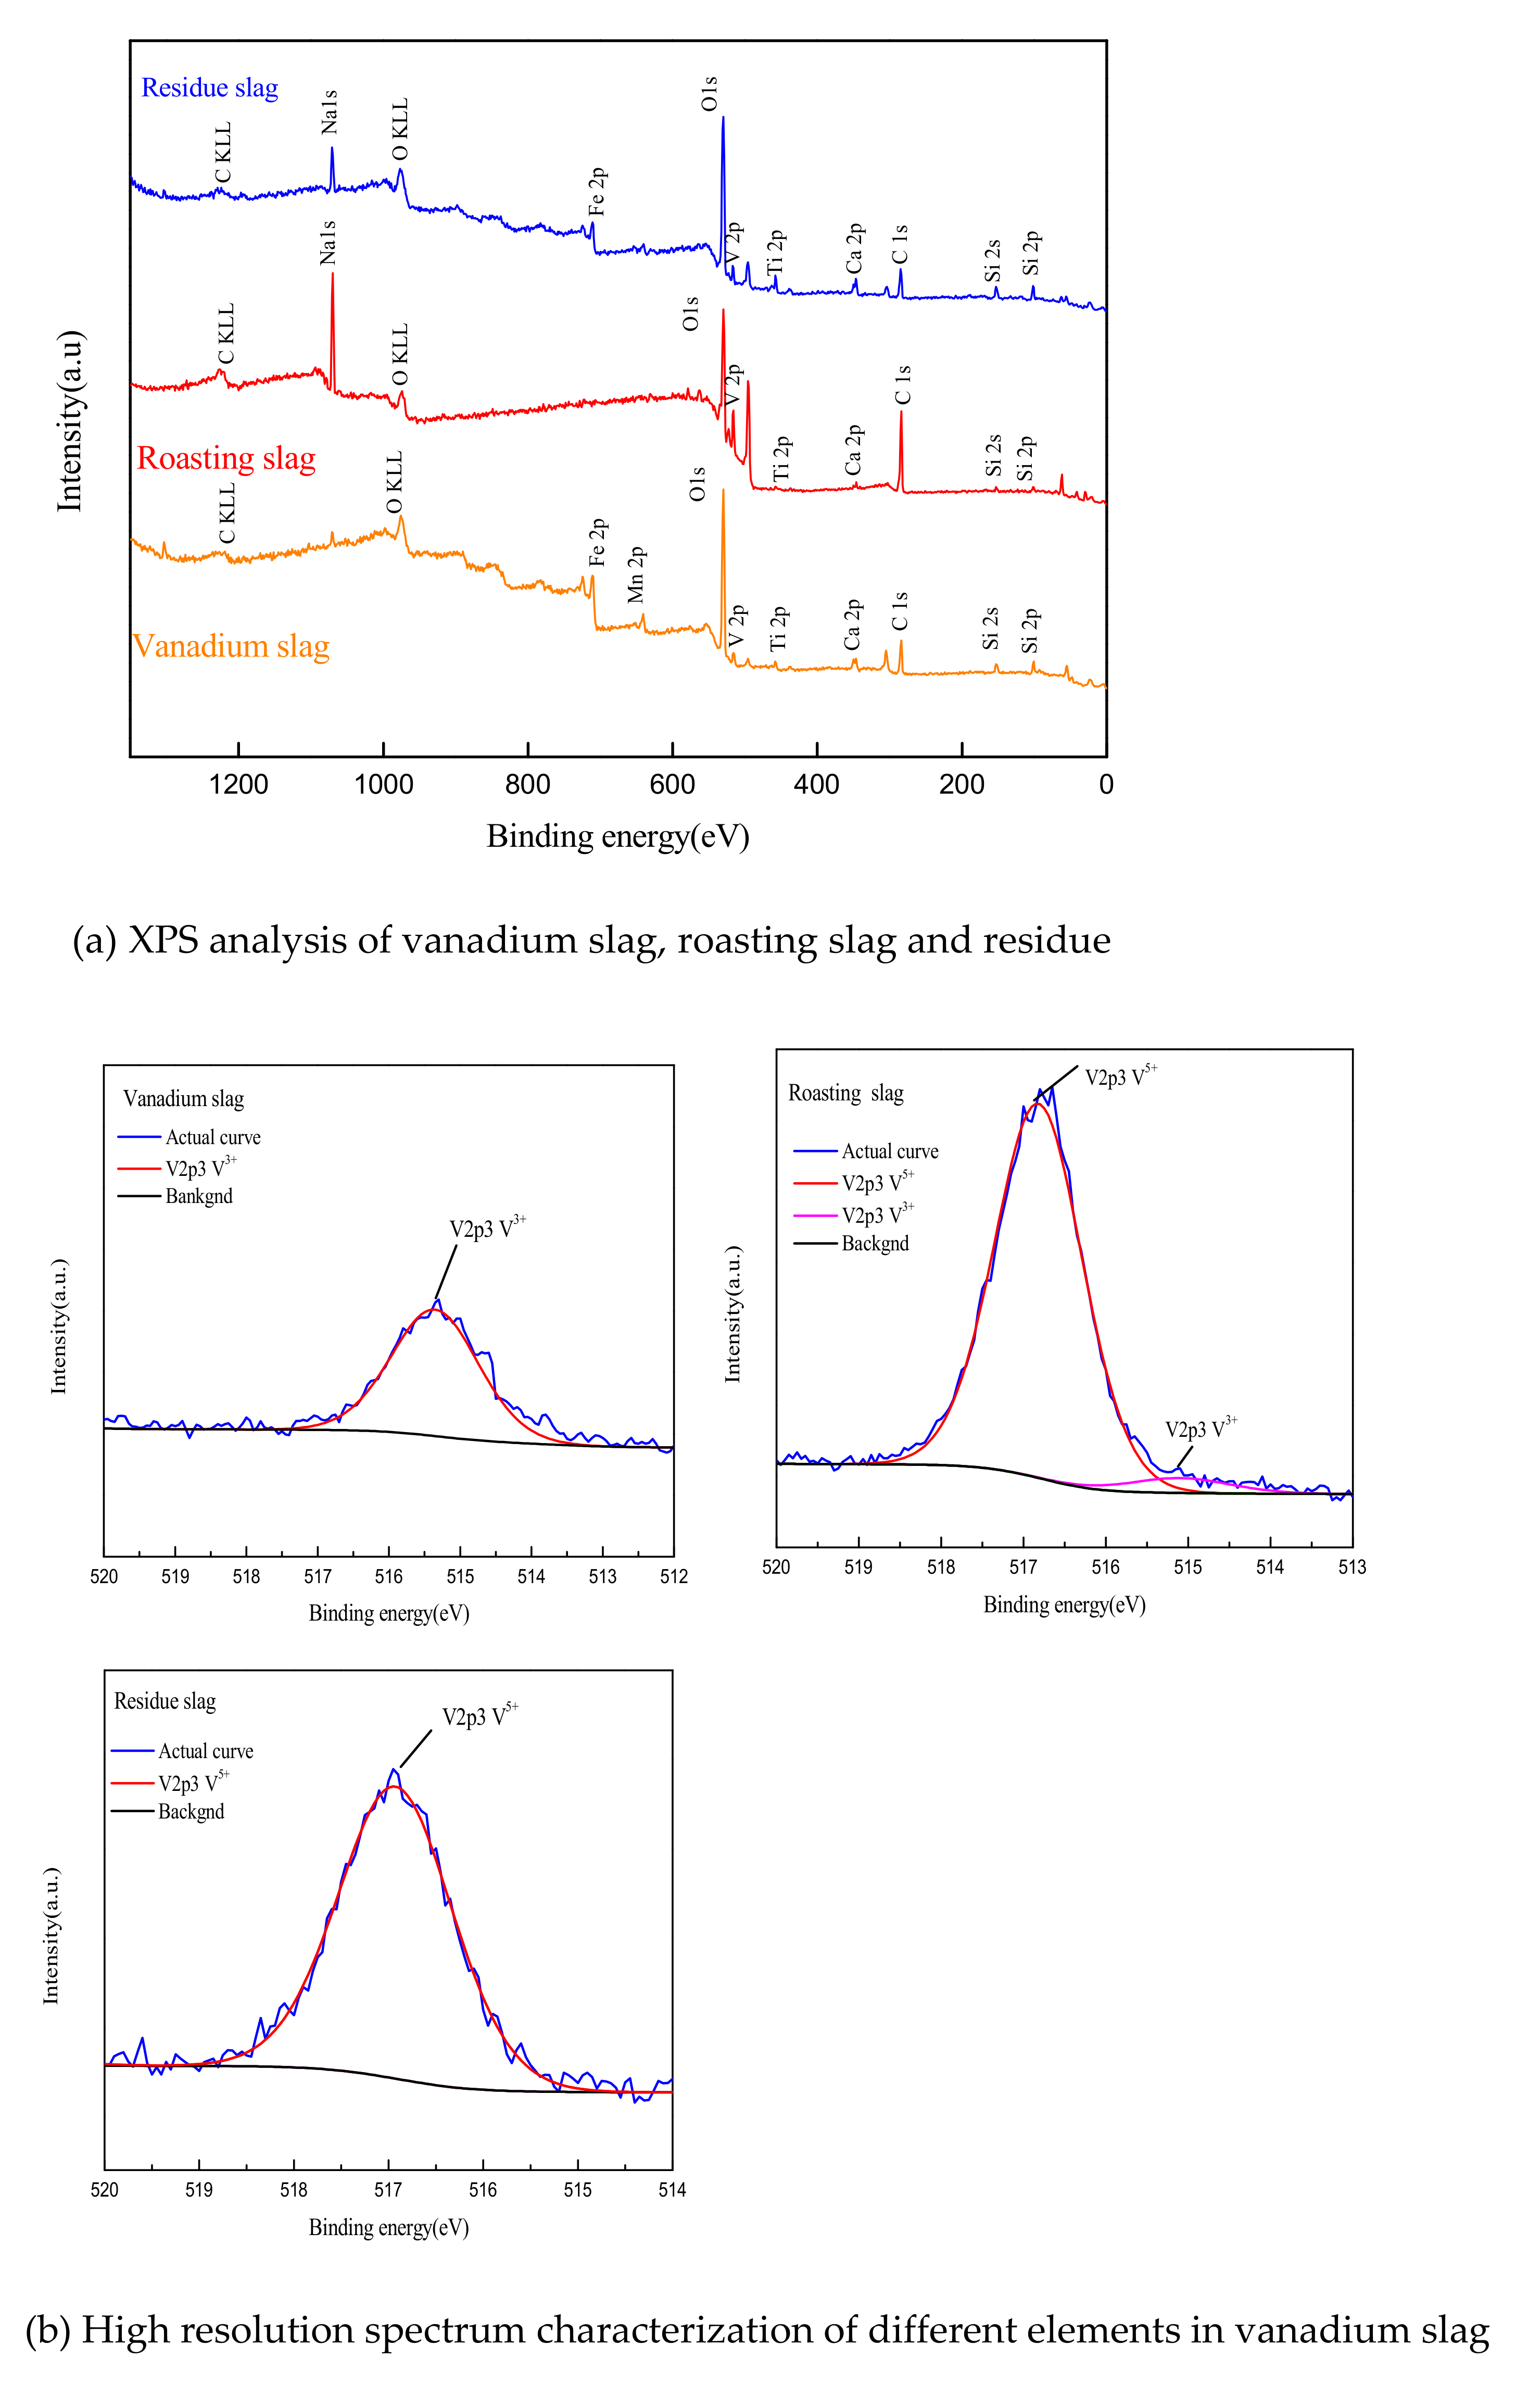
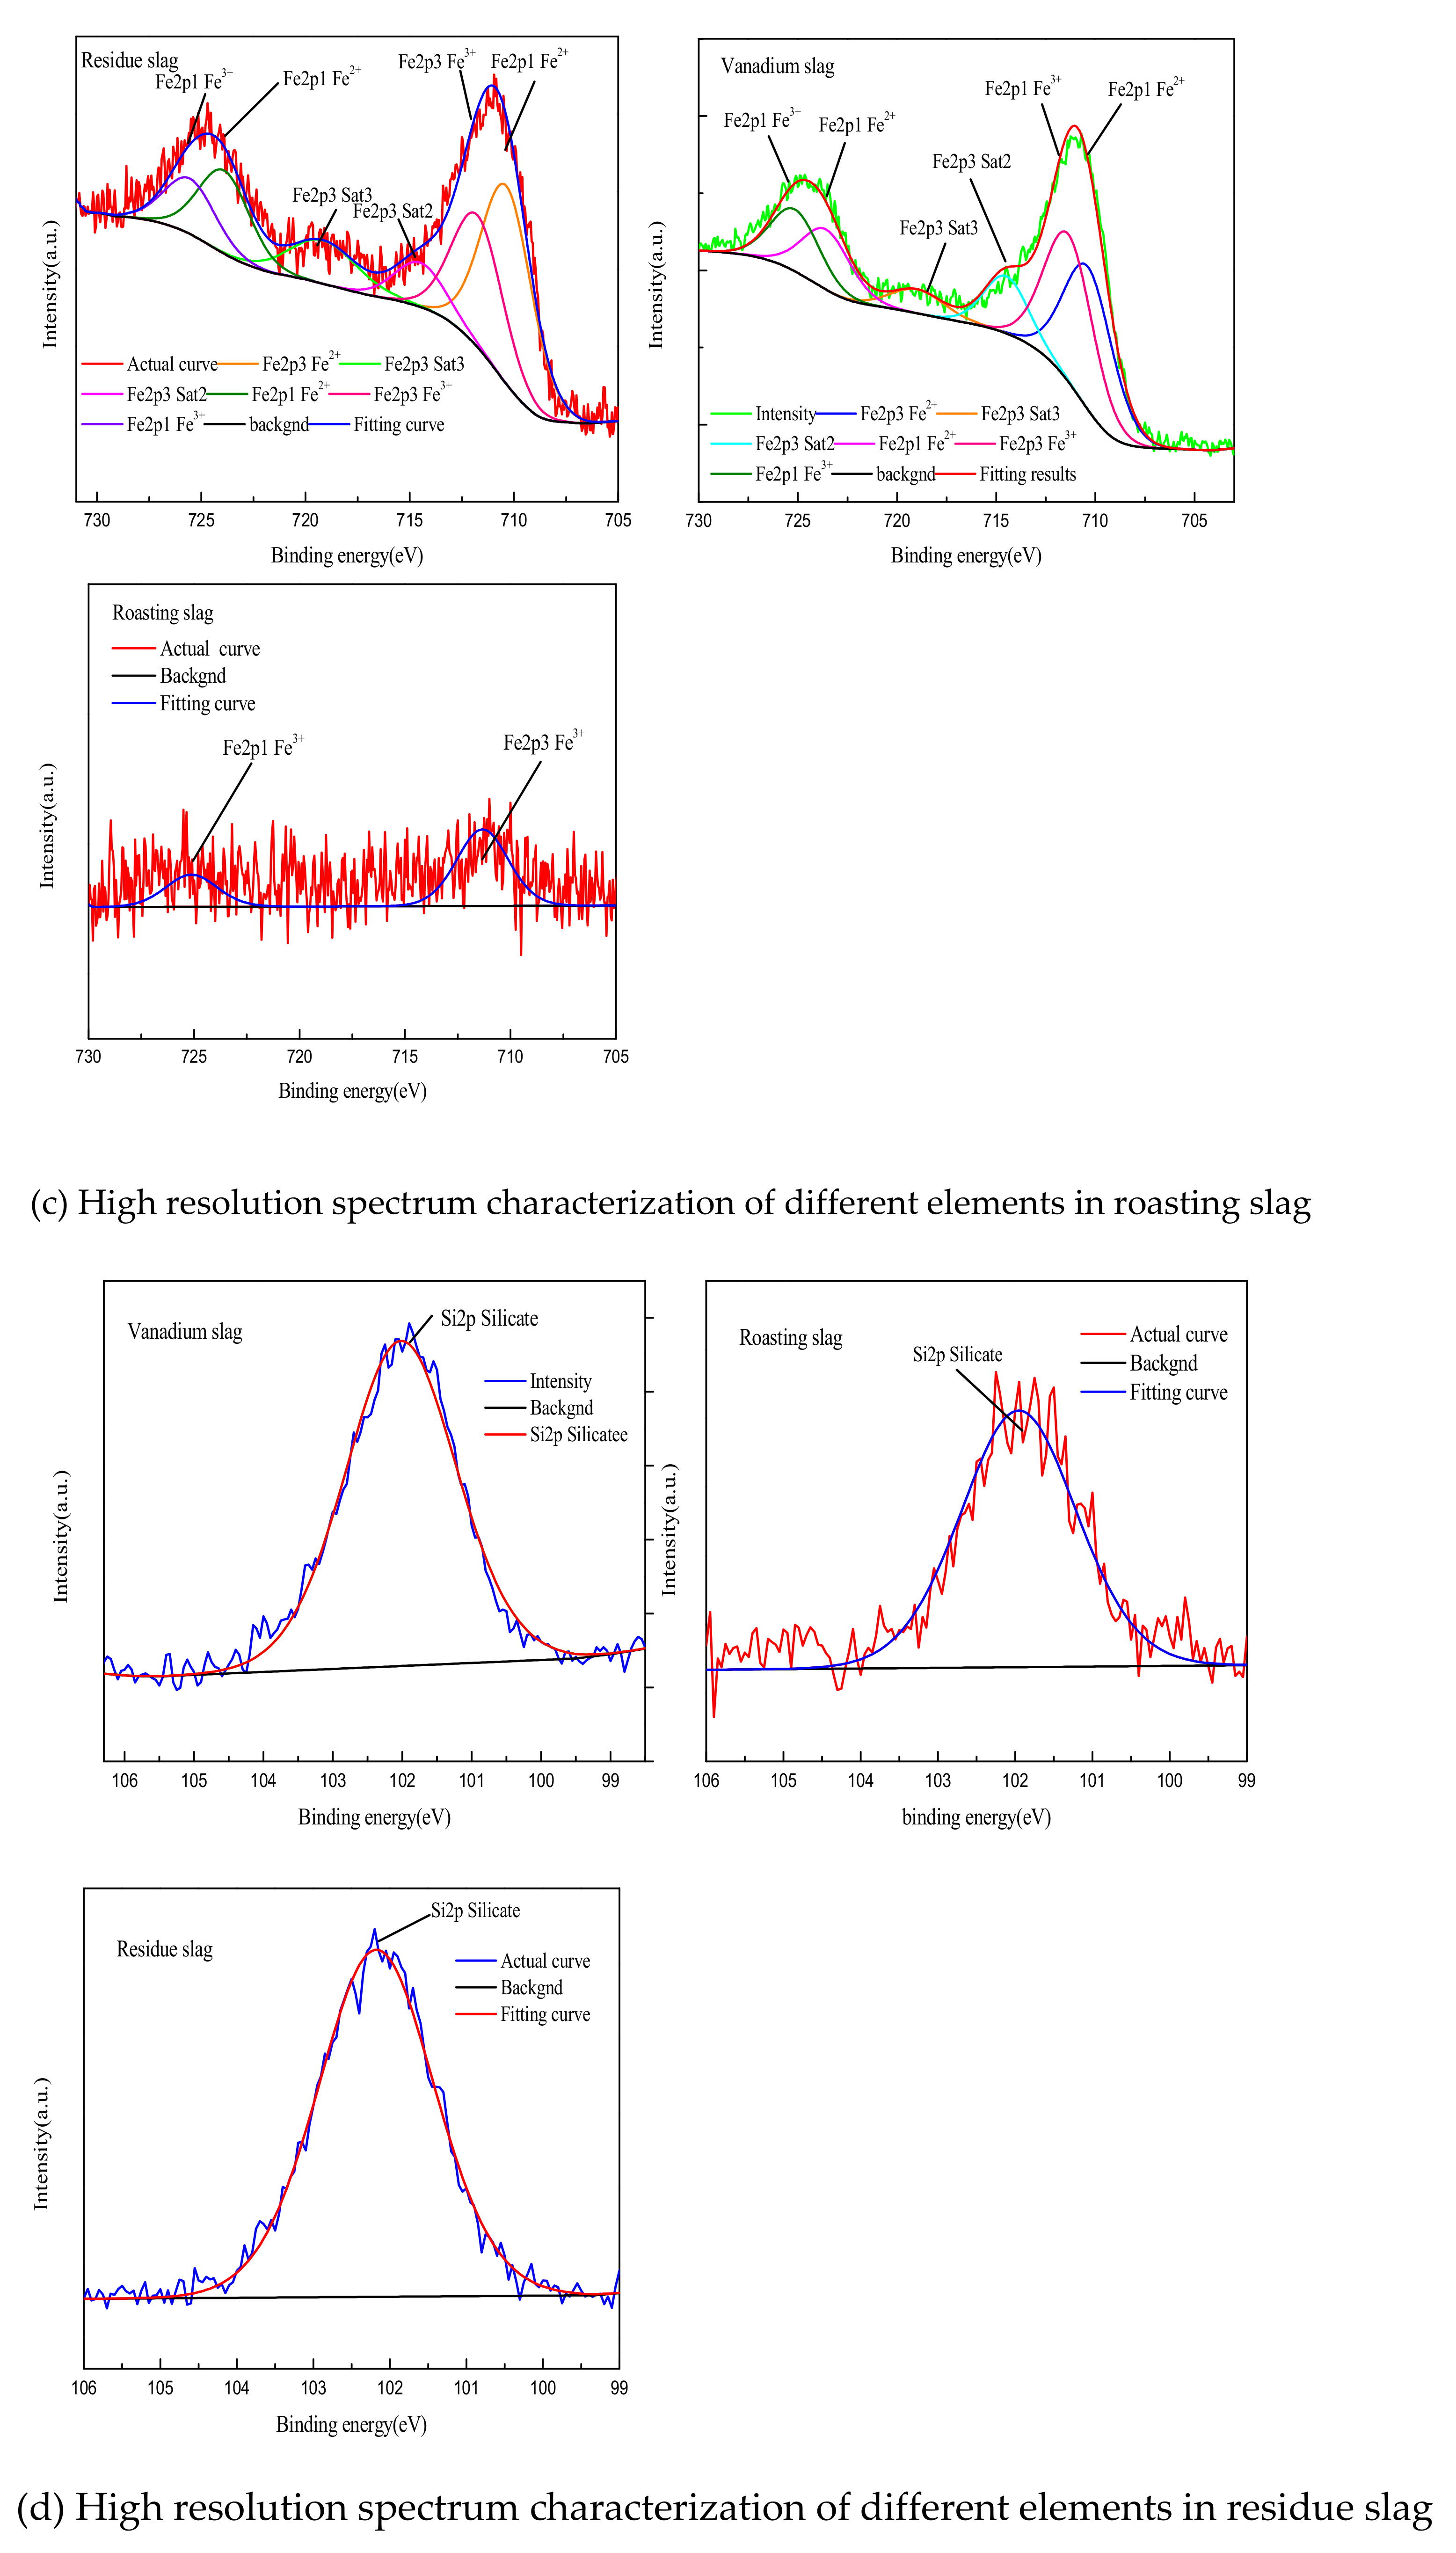
Figure 6 shows the X-ray photoelectron spectroscopy of vanadium slag, roasted slag, and residue samples (a) global XPS; (b) the valence change of V; and the valence change of Fe. It can be seen from
Figure 6 that vanadium slag mainly contains Fe, Mn, V, Si, O, Ca, and C elements; roasting slag mainly contains C, Na, O, V, Ca, C and Si, but Fe element peak is very small, this is because XPS is a surface analysis technique, the formed sodium vanadate covers the surface of vanadium slag, resulting in the annihilation of Fe peak; the residue mainly contains C, Na, O, Fe, V, Ti, Ca and Si.
The vanadium on the surface of vanadium slag mainly exists in the form of trivalent vanadium, and the binding energy of trivalent vanadium is 515.5 eV, which is consistent with the reference [
17] this is the characteristic valence state of vanadium in Spinel of vanadium slag. The Fe element is in the state of coexistence of trivalent iron and bivalent Fe, in which the proportion of bivalent Fe
2+ is 52.89%. The proportion of Fe
3+ is 47.11%, such as bivalent Fe2p
3/2 near 710 eV and trivalent Fe2p
3/2, near 711 ev, bivalent Fe2p
1/2 near 723eV and trivalent Fe2p
1/2, near 725 eV, which corresponds to Fe
2SiO
4 and FeV
2O
4 in vanadium slag. It can be seen from
Figure 6, When the vanadium slag is roasted by sodiumization, the valence state of vanadium is mainly 5, and the binding energy of the V element in the roasted slag increases from about 515.5 eV to near 517 eV, which is due to the oxidation of spinel. Among them, the proportion of V
5+ is 95.6% and the proportion of V
3+ is 4.4%, which shows that vanadium has been transformed from trivalent vanadium to pentavalent vanadium after roasting at 790 °C for 120 min, which achieves the purpose of sodium roasting. The Fe element mainly exists in the form of Fe
3+, which indicates that Fe
2+ has been oxidized to Fe
3+. It is worth noting that the Fe and high-resolution peaks are so weak that they cannot be shown on the full spectrum peak. This is because the sodium vanadate formed during roasting is mostly distributed on the surface of the roasting slag, and the formation of sodium vanadate benefits from the decomposition of vanadate spinel. Under this condition, the material interdependent with sodium vanadate must be the Fe
3+ ion after oxidation. Therefore, the roasting slag can only detect Fe
3+ with low peak strength during XPS scanning but cannot detect oxidized Fe
2+.
The high-resolution characterization of different elements in the leaching residue shows that the V element mainly exists in the form of pentavalent vanadate, which indicates that some vanadates of pentavalent V ions are not leached, and the distribution of Fe elements shows the coexistence of bivalent Fe and trivalent Fe, which is because the naked leakage of internal unoxidized Fe2+ was detected by XPS after the leaching of roasting slag.
For silicon element, its XPS analysis shows that the binding energy of silicon element in three kinds of slag is all near 102 eV in
Figure 6, indicating that Si element mainly shows the chemical state of silicate, which is consistent with the corresponding XRD diagram. Silicon exists in the form of Fe
2SiO
4 in vanadium slag and in roasting slag and residue in the form of NaFeSi
2O
6 and NaTiSi
2O
6.
3.3. Thermodynamic Simulation
The thermodynamic simulation is carried out by Factsage software (Montreal, Canada and, Achen, Germany). According to the composition and phase of vanadium slag, vanadium in vanadium slag mainly exists in the form of FeV
2O
4 and silicon mainly in the form of Fe
2SiO
4. According to the calculation of
Table 1, in the balance module of Factsage software, the relative amount of initial FeV
2O
4 is simplified to be 0.5 mol and the relative amount of Fe
2SiO
4 is 1.5 mol. The effects of the amount of oxygen and sodium carbonate on the phase transformation of Si and V elements in vanadium slag were simulated.
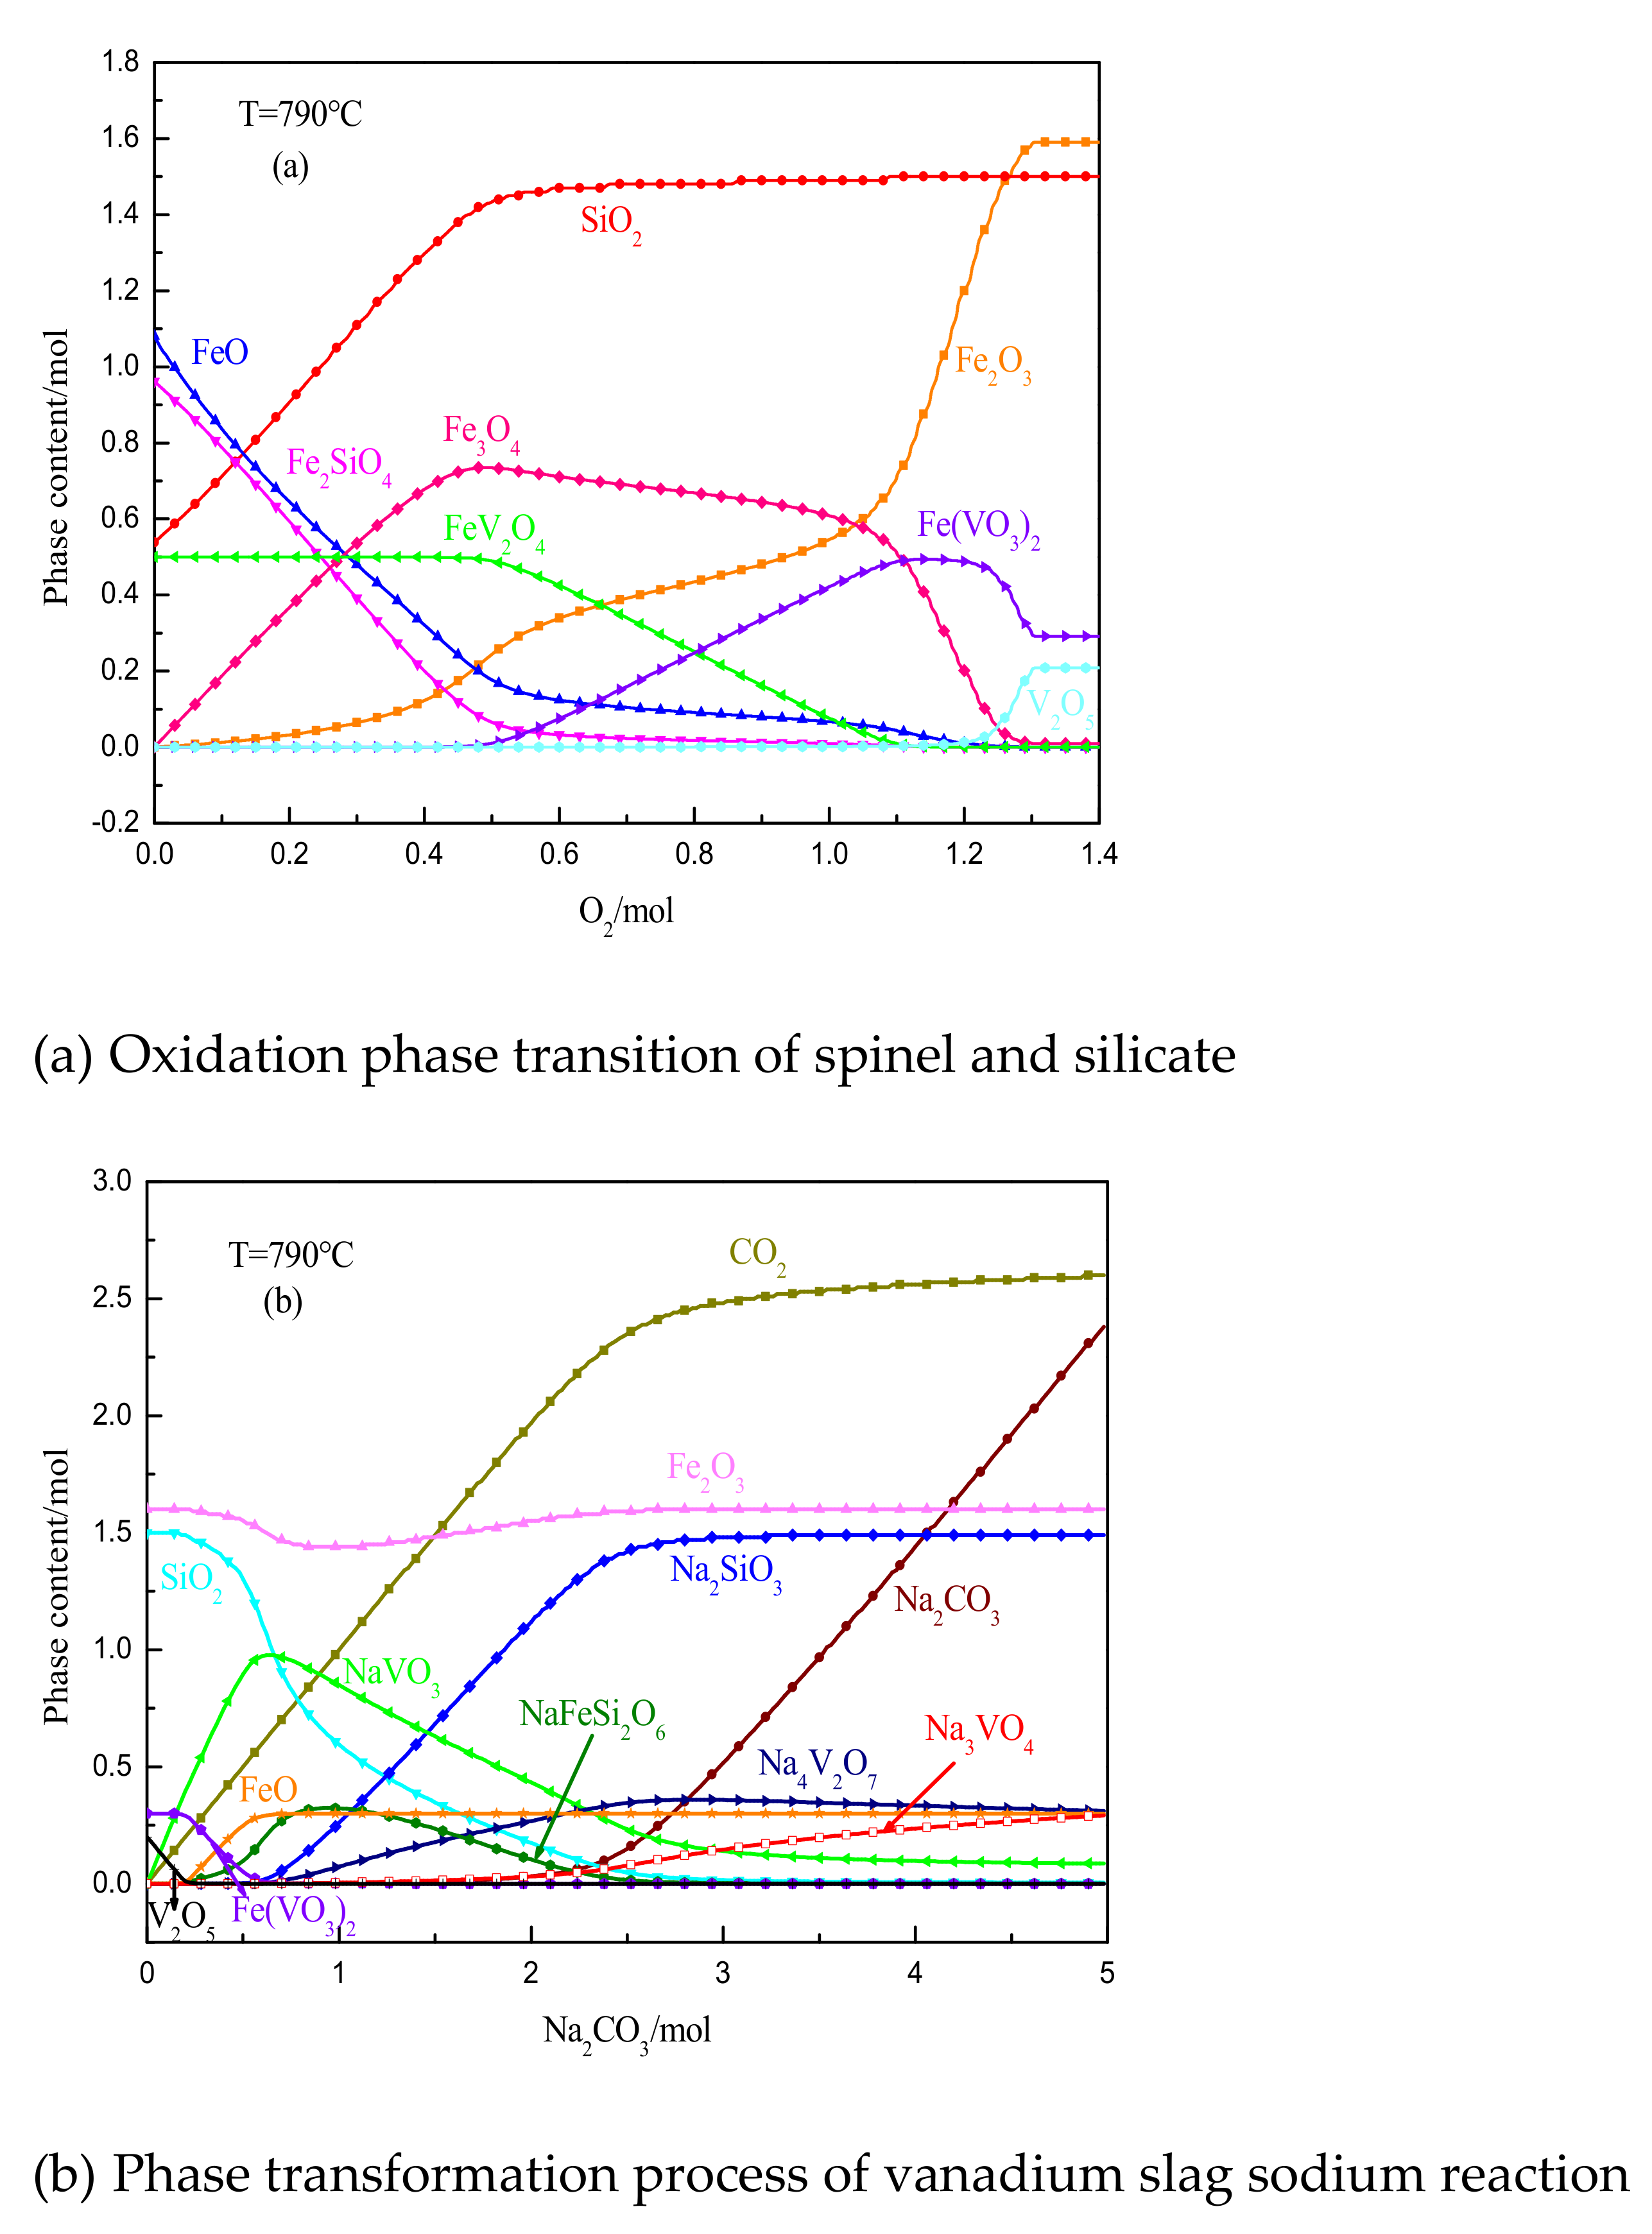
As shown in
Figure 7a, when the initial Fe
2SiO
4 and FeV
2O
4 with an initial content of 1.5 mol and 0.5 mol were oxidized at 790 °C, 0.538 mol of Fe
2SiO
4 was decomposed into 1.076 mol of FeO and 0.538 mol of SiO
2. After that, the oxidation reaction began, 0.962 mol of Fe
2SiO
4 was oxidized into Fe
2O
3, Fe
3O
4, and SiO
2. With the formation of Fe
2O
3 FeO and oxidation and Fe
3O
4, which is given priority to with oxidation for Fe
3O
4, this suggests that the affinity of Fe and O 8/3 valence than the valence of 3 Fe affinity, and FeV
2O4 oxidation decomposition, until the O
2 consumption came to 0.42 mol, FeV
2O
4 oxidative decomposition of the beginning of the formation of Fe (VO
3)
2 and V
2O
5, and after that with the increase of oxygen consumption, SiO
2 content remains the same, gradually transforms the Fe
3O
4 Fe
2O
3, As a result, the Content of Fe
2O
3 gradually increases. When the oxygen consumption is 1.4mol, the content of each phase remains constant. At this time, V
2O
5 is 0.2 mol, Fe(VO
3)
2 is 0.3 mol, SiO
2 is 1.5 mol, and Fe
2O
3 is 1.6 mol.
It can be seen from
Figure 7b that V
2O
5 first consumes 0.2 mol of Na
2CO
3 to form NaVO
3, while Fe
2O
3 and SiO
2, which are reaction pairs of reaction substances, also react with Na
2CO
3 to form NaFeSi
2O
6. When Na
2CO
3 consumption exceeded 0.2 mol, Fe(VO
3)
2 also began to participate in the reaction with Na
2CO
3 to form NaVO
3 and FeO. When Na
2CO
3 consumption was 0.5 mol, all V in V
2O
5 and Fe(VO
3)
2 were transferred to V of NaVO
3, and the environment of V atoms was changed. Later, with the continuous increase of consumption of Na
2CO
3, NaVO
3 combined with Na
2CO
3 to form Na
3VO
4 and Na
4V
2O
7. As an intermediate product, NaFeSi
2O
6 shows a tendency to increase first and then decrease. This is due to the combination of Na
2CO
3 and NaFeSi
2O
6 to form more stable Na
2SiO
3 and Fe
2O
3, at the same time, the formation of NaFeSi
2O
6 also proves that when vanadium slag is roasted at 790 °C, 20% Na
2CO
3 is appropriate. In the phase region of NaFeSi
2O
6, the main soluble sodium vanadate salts formed are NaVO
3 and Na
4V
2O
7, which are consistent with the experimental results.
It can be seen that Fe
2SiO
4 in vanadium slag is transformed into insoluble substances such as NaFeSi
2O
6 (acmite) in the case of consumption of sodium salt. due to the limited content of sodium carbonate, it is difficult for conopyroxene to be retained in roasting slag. when leaching experiments are carried out, acmite is insoluble, so the leaching rate of silicon is low, which achieves the purpose of separation of silicon and vanadium. At the same time, from the effect of the addition of sodium carbonate on the leaching rate of silicon, it can be seen that the increase of sodium carbonate is beneficial to the leaching of silicon, which is consistent with the thermodynamic analysis in
Figure 7b. When excessive sodium carbonate is added, the silicon-containing phase changes from conopyroxene sodium silicate, while sodium silicate is easily soluble in water, which increases the leaching rate of silicon. Therefore, in the case of excessive sodium carbonate, the migration mode of silicon in the whole process is as follows:
3.4. Precipitation of Vanadium by Calcification
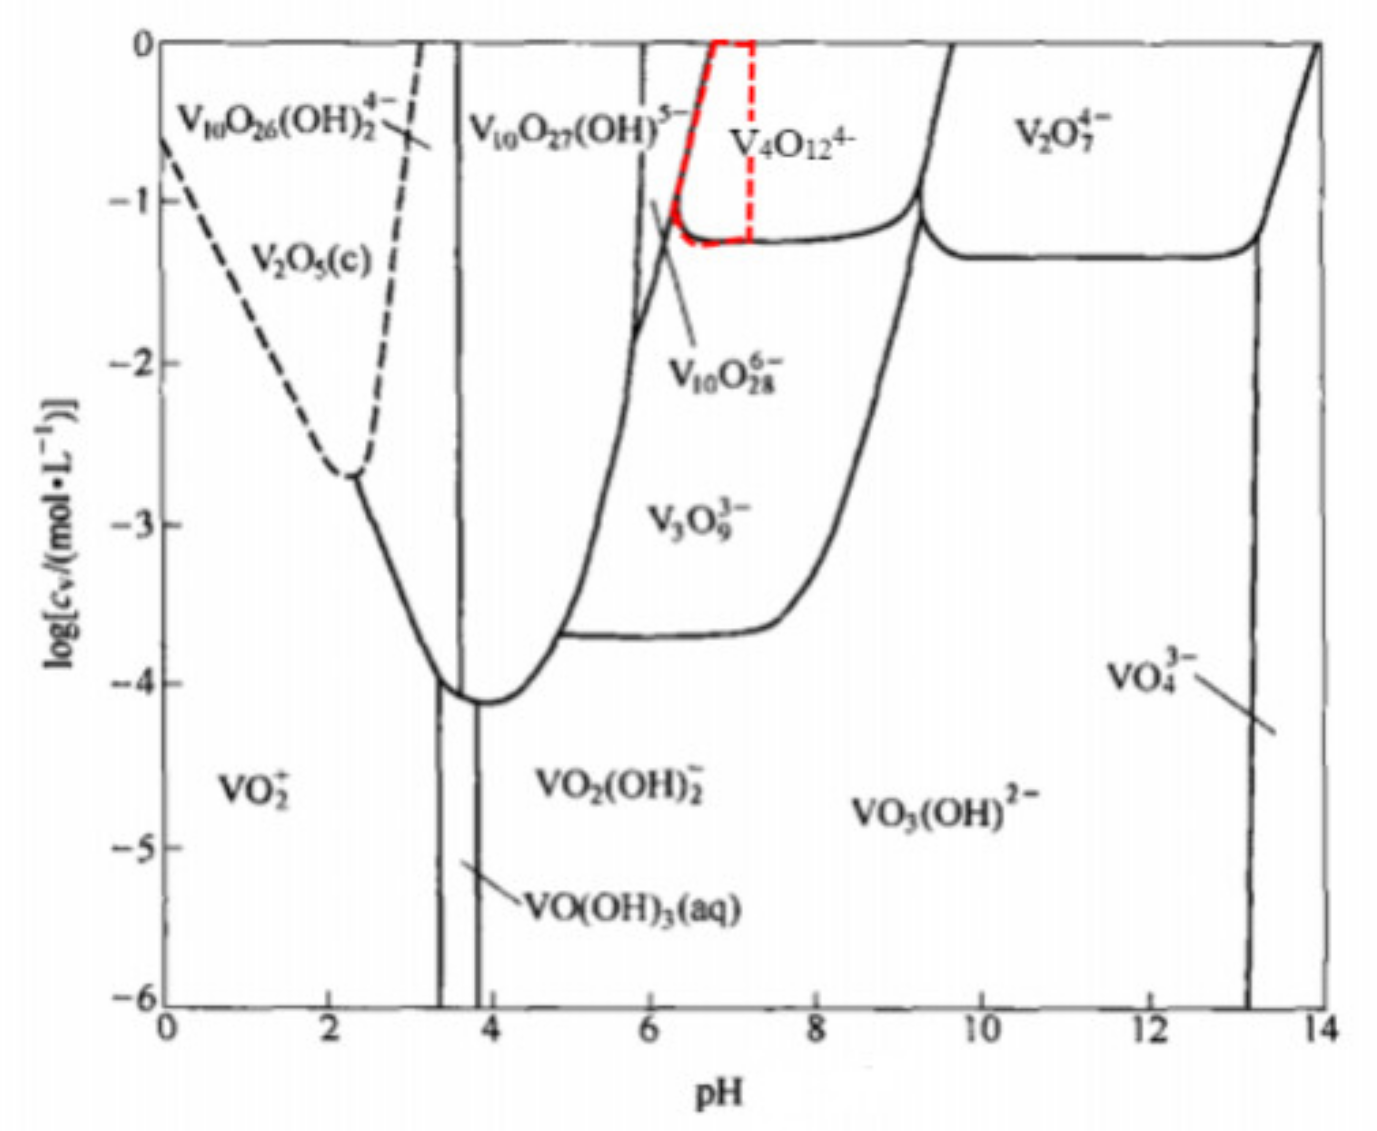
To prepare CaV
2O
6 and ensure the precipitation of vanadium under weak acid conditions, the reaction system must be within the range of the red dotted line in
Figure 8 [
18], so the pH of the precipitation of vanadium is 6.7 ± 0.1.
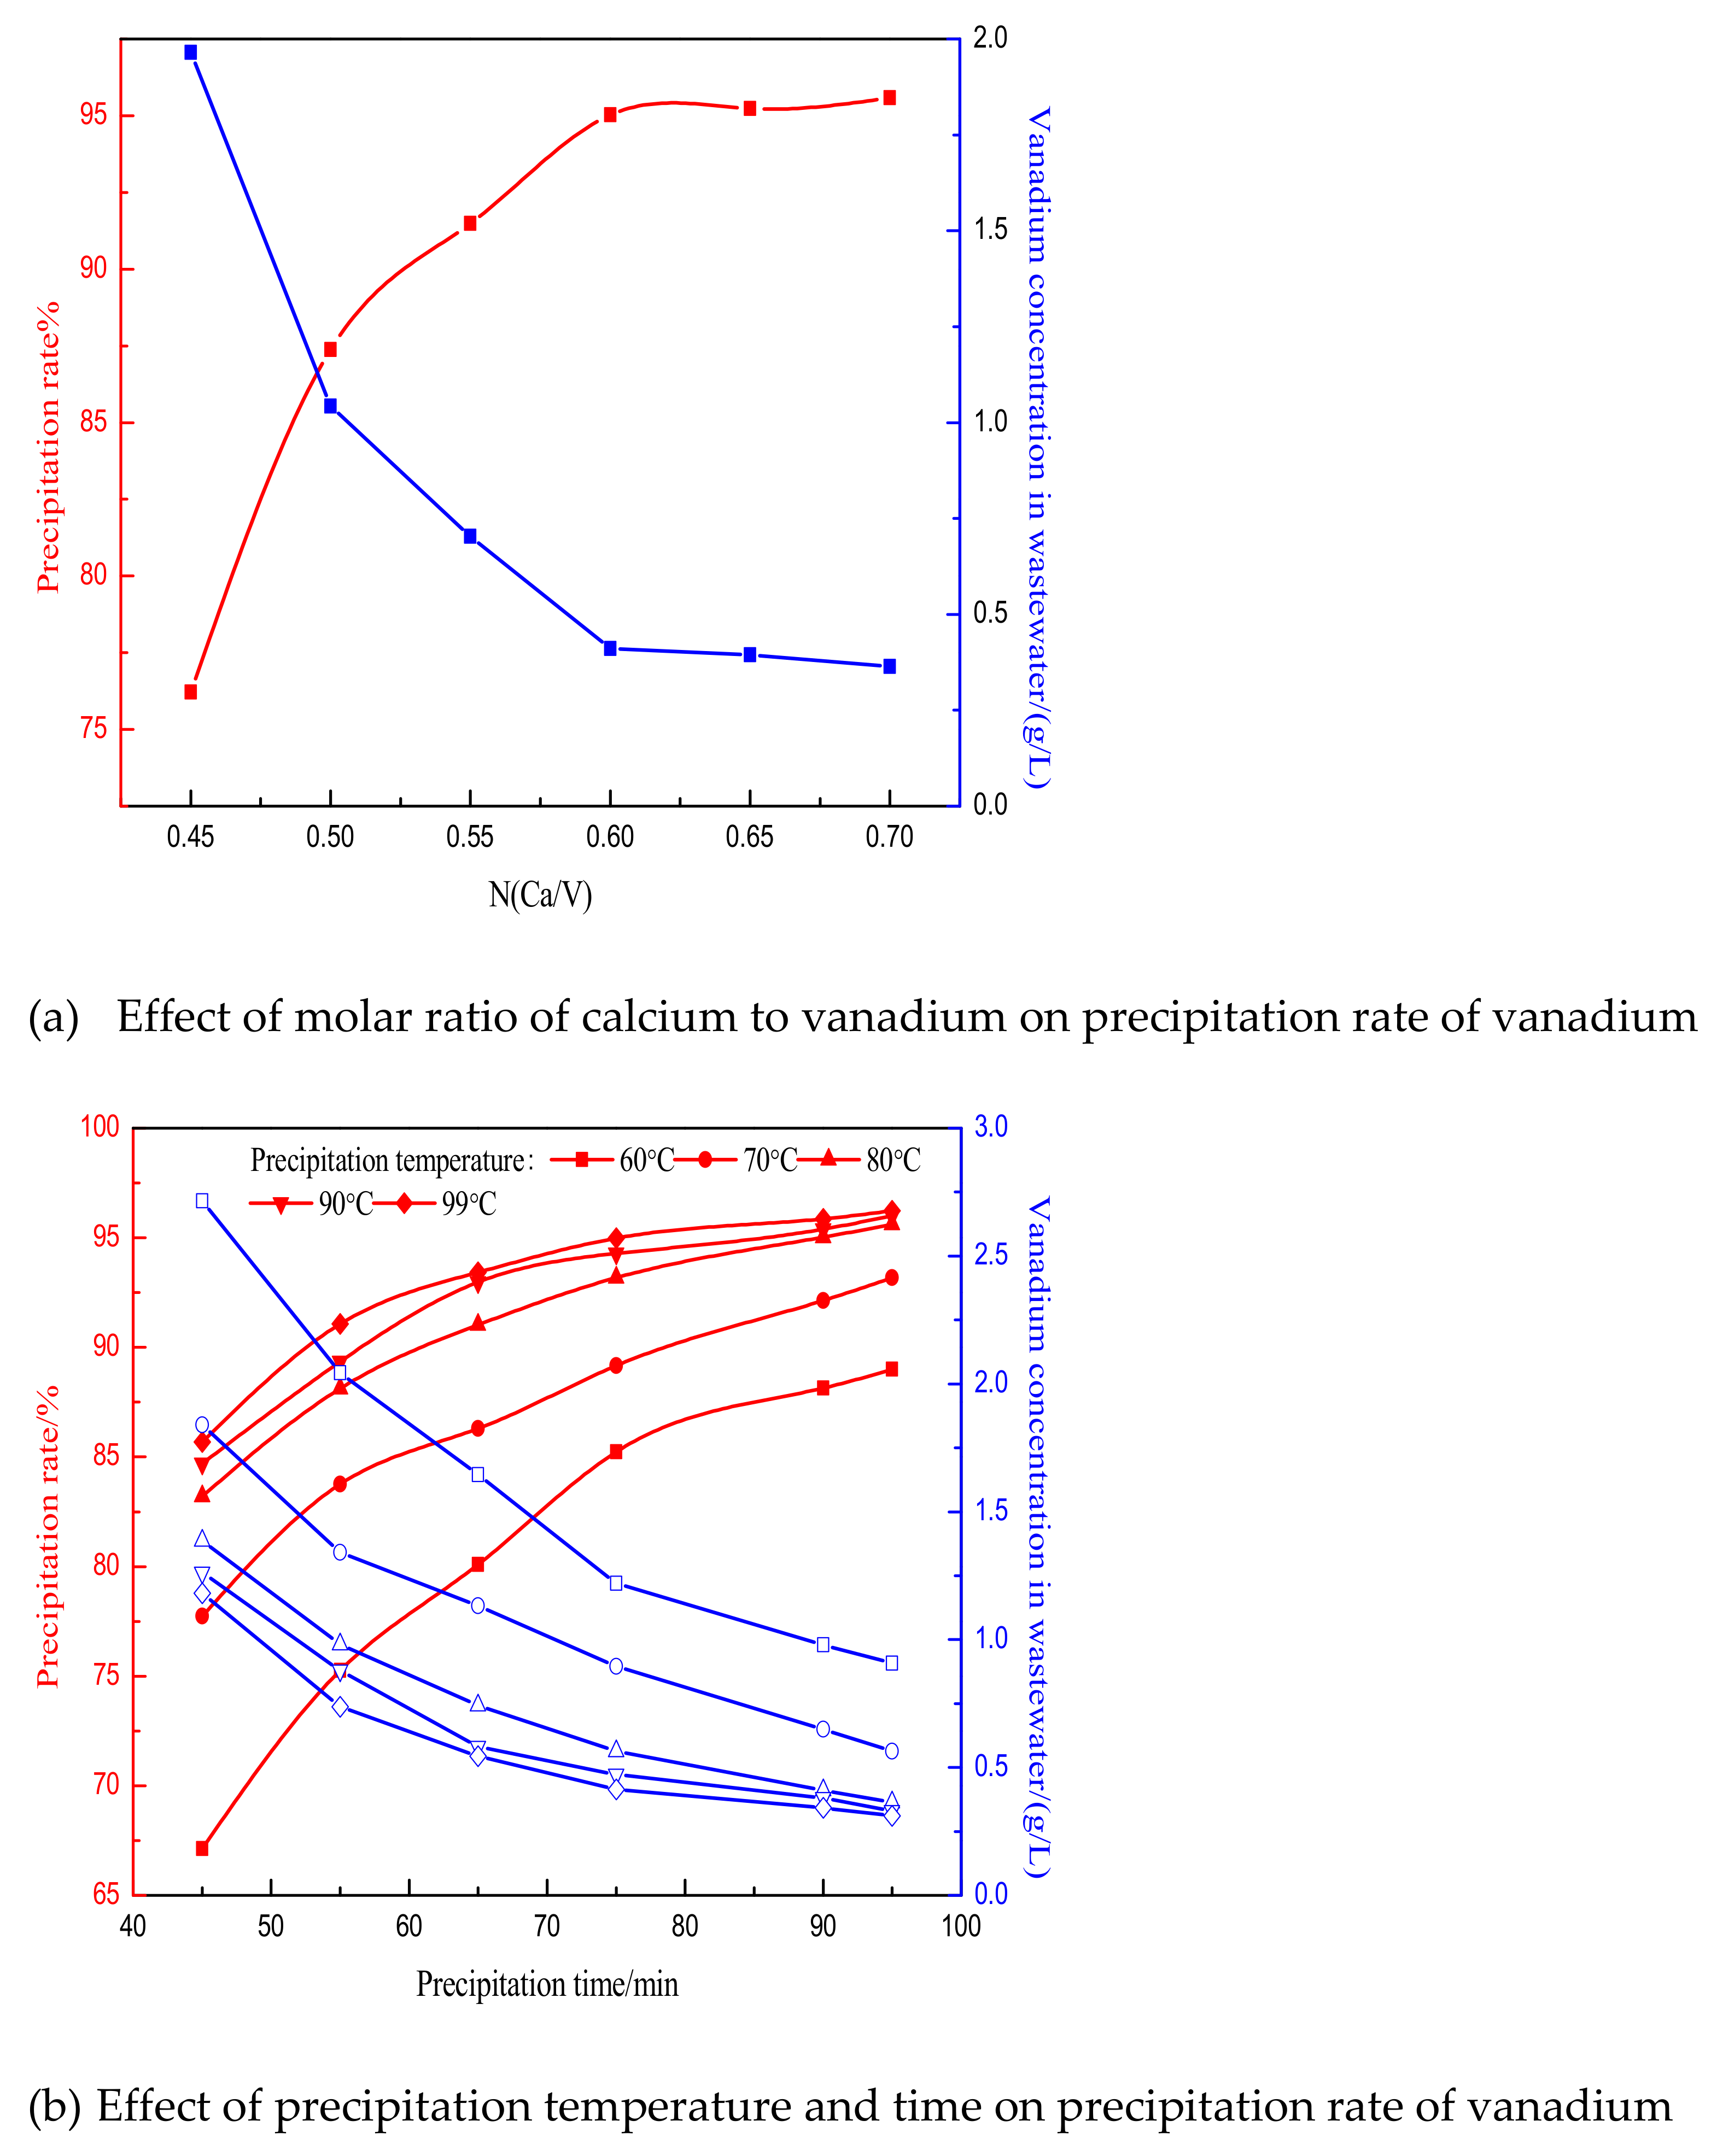
The molar ratio of calcium to vanadium N refers to the effect of n (Ca) / n (V), on the precipitation rate of vanadium under the conditions of vanadium precipitation temperature 90 °C, vanadium precipitation time 90 min and vanadium precipitation pH 6.7 ± 0.1. the effect of calcium-vanadium molar ratio N on vanadium precipitation ratio was investigated. The results are shown in
Figure 9. It can be seen from the figure that with the increase of N, the precipitation rate of vanadium increases gradually. When the ratio of calcium to vanadium is 0.45, the precipitation ratio of vanadium is only 76.21%. When the molar ratio of calcium to vanadium N increases to 0.6, the precipitation ratio of vanadium reaches 95.03%. With the continuous increase of N, the precipitation ratio of vanadium increases very slowly. In the process of calcium precipitation of vanadium, the increase of the molar ratio of calcium to vanadate greatly promoted the positive precipitation of calcium vanadate. at the same time, under the acidic condition, it greatly inhibited the hydrolysis of CaO and increased the concentration of effective Ca in the solution system. Compared with precipitation at alkaline conditions of vanadium, the concentration of available calcium in the solution is lower, the reaction is slow and there are more impurities. Therefore, the suitable molar ratio of calcium to vanadium is 0.6, and the vanadium concentration of the supernatant of precipitated vanadium under this condition is 0.41 g/L.
It can be seen from the diagram that temperature and reaction time have a significant effect on the vanadium precipitation rate. Increasing vanadium precipitation temperature and reaction time can effectively increase the vanadium precipitation rate. When precipitation temperature is the same, increasing vanadium precipitation time can increase the vanadium precipitation rate. When precipitation time is the same, the higher the vanadium precipitation temperature is, the higher the vanadium precipitation rate is.
The precipitation rate of vanadium at 80 °C, 90 °C, and 99 °C is much higher than that at 60 °C and 70 °C, because the calcification reaction is endothermic, the reaction is positive, which is beneficial to the formation of vanadium precipitation. When the vanadium precipitation temperature is 60 °C and the vanadium precipitation time is 45 min, the vanadium precipitation ratio is only 67.13%, and the residual V concentration in the solution is 2.71 g 90 min. When the vanadium precipitation time is 90 min, the vanadium precipitation ratio increases to 88.14%, while the residual vanadium concentration in the solution decreases to 0.97 g/L. When the vanadium precipitation temperature is 90 °C and the vanadium precipitation time is 45min, the vanadium precipitation ratio is 84.71%, the concentration of residual vanadium in the supernatant of vanadium precipitation is 1.26 g/L when the vanadium precipitation time is 90min, the vanadium precipitation ratio is 95.03%, and the residual vanadium concentration in the vanadium precipitation supernatant is 0.41 g/L; when the vanadium precipitation temperature is 99 °C, the increase of vanadium precipitation rate will become very small.
Through this comparative analysis, it can be seen that time has a great influence on the vanadium precipitation rate when the vanadium is precipitated at low temperatures, and the effect of time on the vanadium precipitation rate will be greatly reduced when the temperature is beyond 80 °C. Therefore, the suitable temperature and time for depositing vanadium is 90 °C and 90 min.
3.5. Kinetic Analysis of Vanadium Precipitation
The process of calcium precipitation of vanadium is a process of isothermal crystallization, so the isothermal crystallization kinetics of vanadium precipitation can be described with Avrami kinetic model [
19,
20,
21], the equation is as follows:
Among them, φ is the volume fraction of calcium vanadate crystallized at t time (%), is the volume fraction of grains in the total sample for an infinitely long time) (%), k is the crystallization rate constant (min-n), n is the Avrami index, which is related to the nucleation mechanism and growth mode. Avrami model assumes that the nuclei are irregularly distributed and each nucleus forms a grain.
Use
η to represent relative crystallinity, that is,
, then (6) can be rewritten as:
Taking the logarithm of both sides of (4) we get:
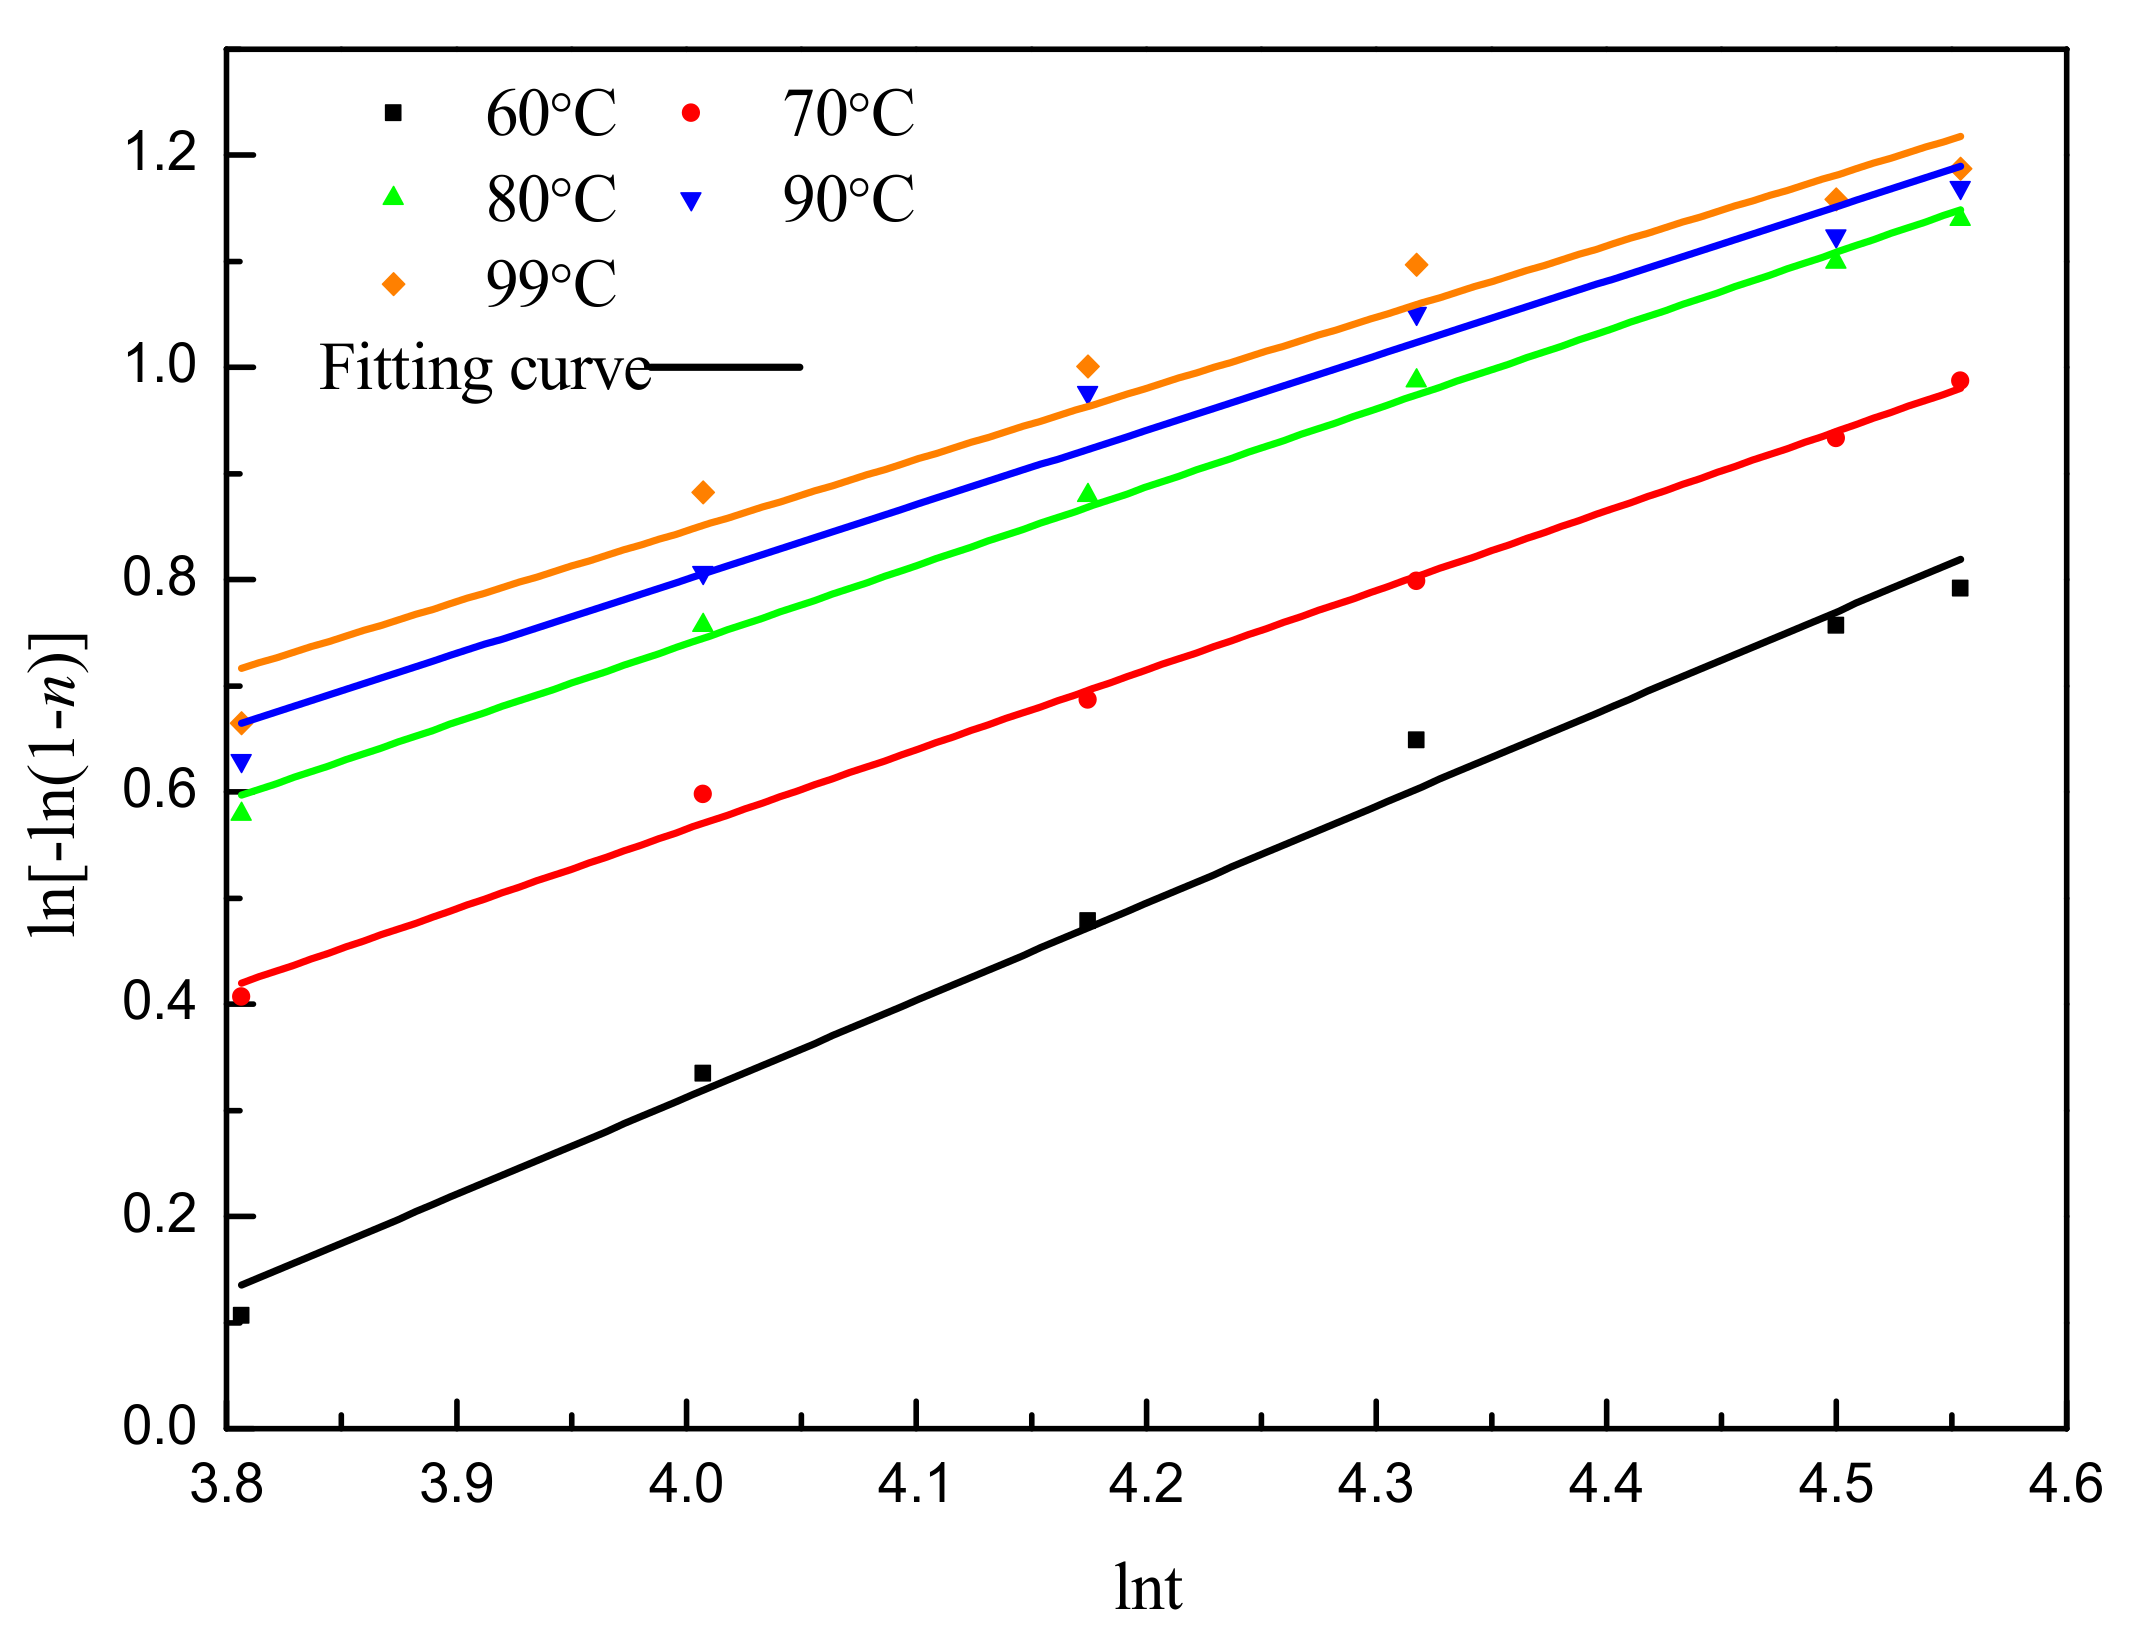
Using ln [−ln (1 − η)] as the y-axis and lnt as the x-axis, draw the graph. According to the slope and intercept of the straight line obtained, the Avrami index n and the reaction kinetic rate constant k can be obtained.
The Avrami index n is theoretically an integer 1, 2, 3, etc., n is 1, 2, 3 representing needle-shaped crystals, disc-shaped crystals, and spherical crystals, respectively. Practice has shown that most of the reaction crystallization processes are complex, will not form a single crystal grain, and the way of nucleation is not a single, so the Avrami index is generally a decimal number, usually not an integer.
The Avrami kinetic equation was used to fit the precipitation rate of vanadium at different temperatures and times in
Figure 10. The relative crystallinity is the precipitation rate of vanadium. From
Figure 10, it can be seen that the growth process of calcium vanadate crystals can be determined by Avrami at 60~80 °C. The equation is well described, and the reaction kinetic parameters can be solved from the intercept and slope of each curve. It can be seen from
Table 3 that as the temperature increases from 60 °C to 99 °C, the crystallization rate constant increases from 0.035 to 0.16, and the crystallization index decreases from 0.915 to 0.671. When the temperature is 60 °C, the crystallization index is close to 1.0, and the crystal grows in one dimension and is a needle-like crystal. As the temperature increases, the crystallization will become complicated, and the crystallization index will gradually decrease. Under these temperature gradients, the crystallization index is low (less than 1), which may be a result of the combined effect of experimental deviation, temperature factors, and the complexity of the crystallization process, but it can be seen that the crystallization rate constant is more affected by temperature. Obviously, the higher the temperature, the higher the crystallization rate constant, which also proves that the calcification reaction is endothermic.
According to the Arrhenius formula, the linear relationship between the reaction rate constant
K and temperature is as follows:
Plot ln
K and
T−1 to get
Figure 11, whose fitting equation is:
By comparing Equations (9) and (10), we can get:
Pre-referential factor A = 1.35 × 10⁵, apparent activation energy Ea = 41.81 kJ/mol.
The phase and surface morphology of the calcium vanadate product under the conditions of a reaction time of 90 min, a reaction temperature of 90 °C, and a calcium-vanadium molar ratio of 0.6 are shown in
Figure 12 and
Figure 13.
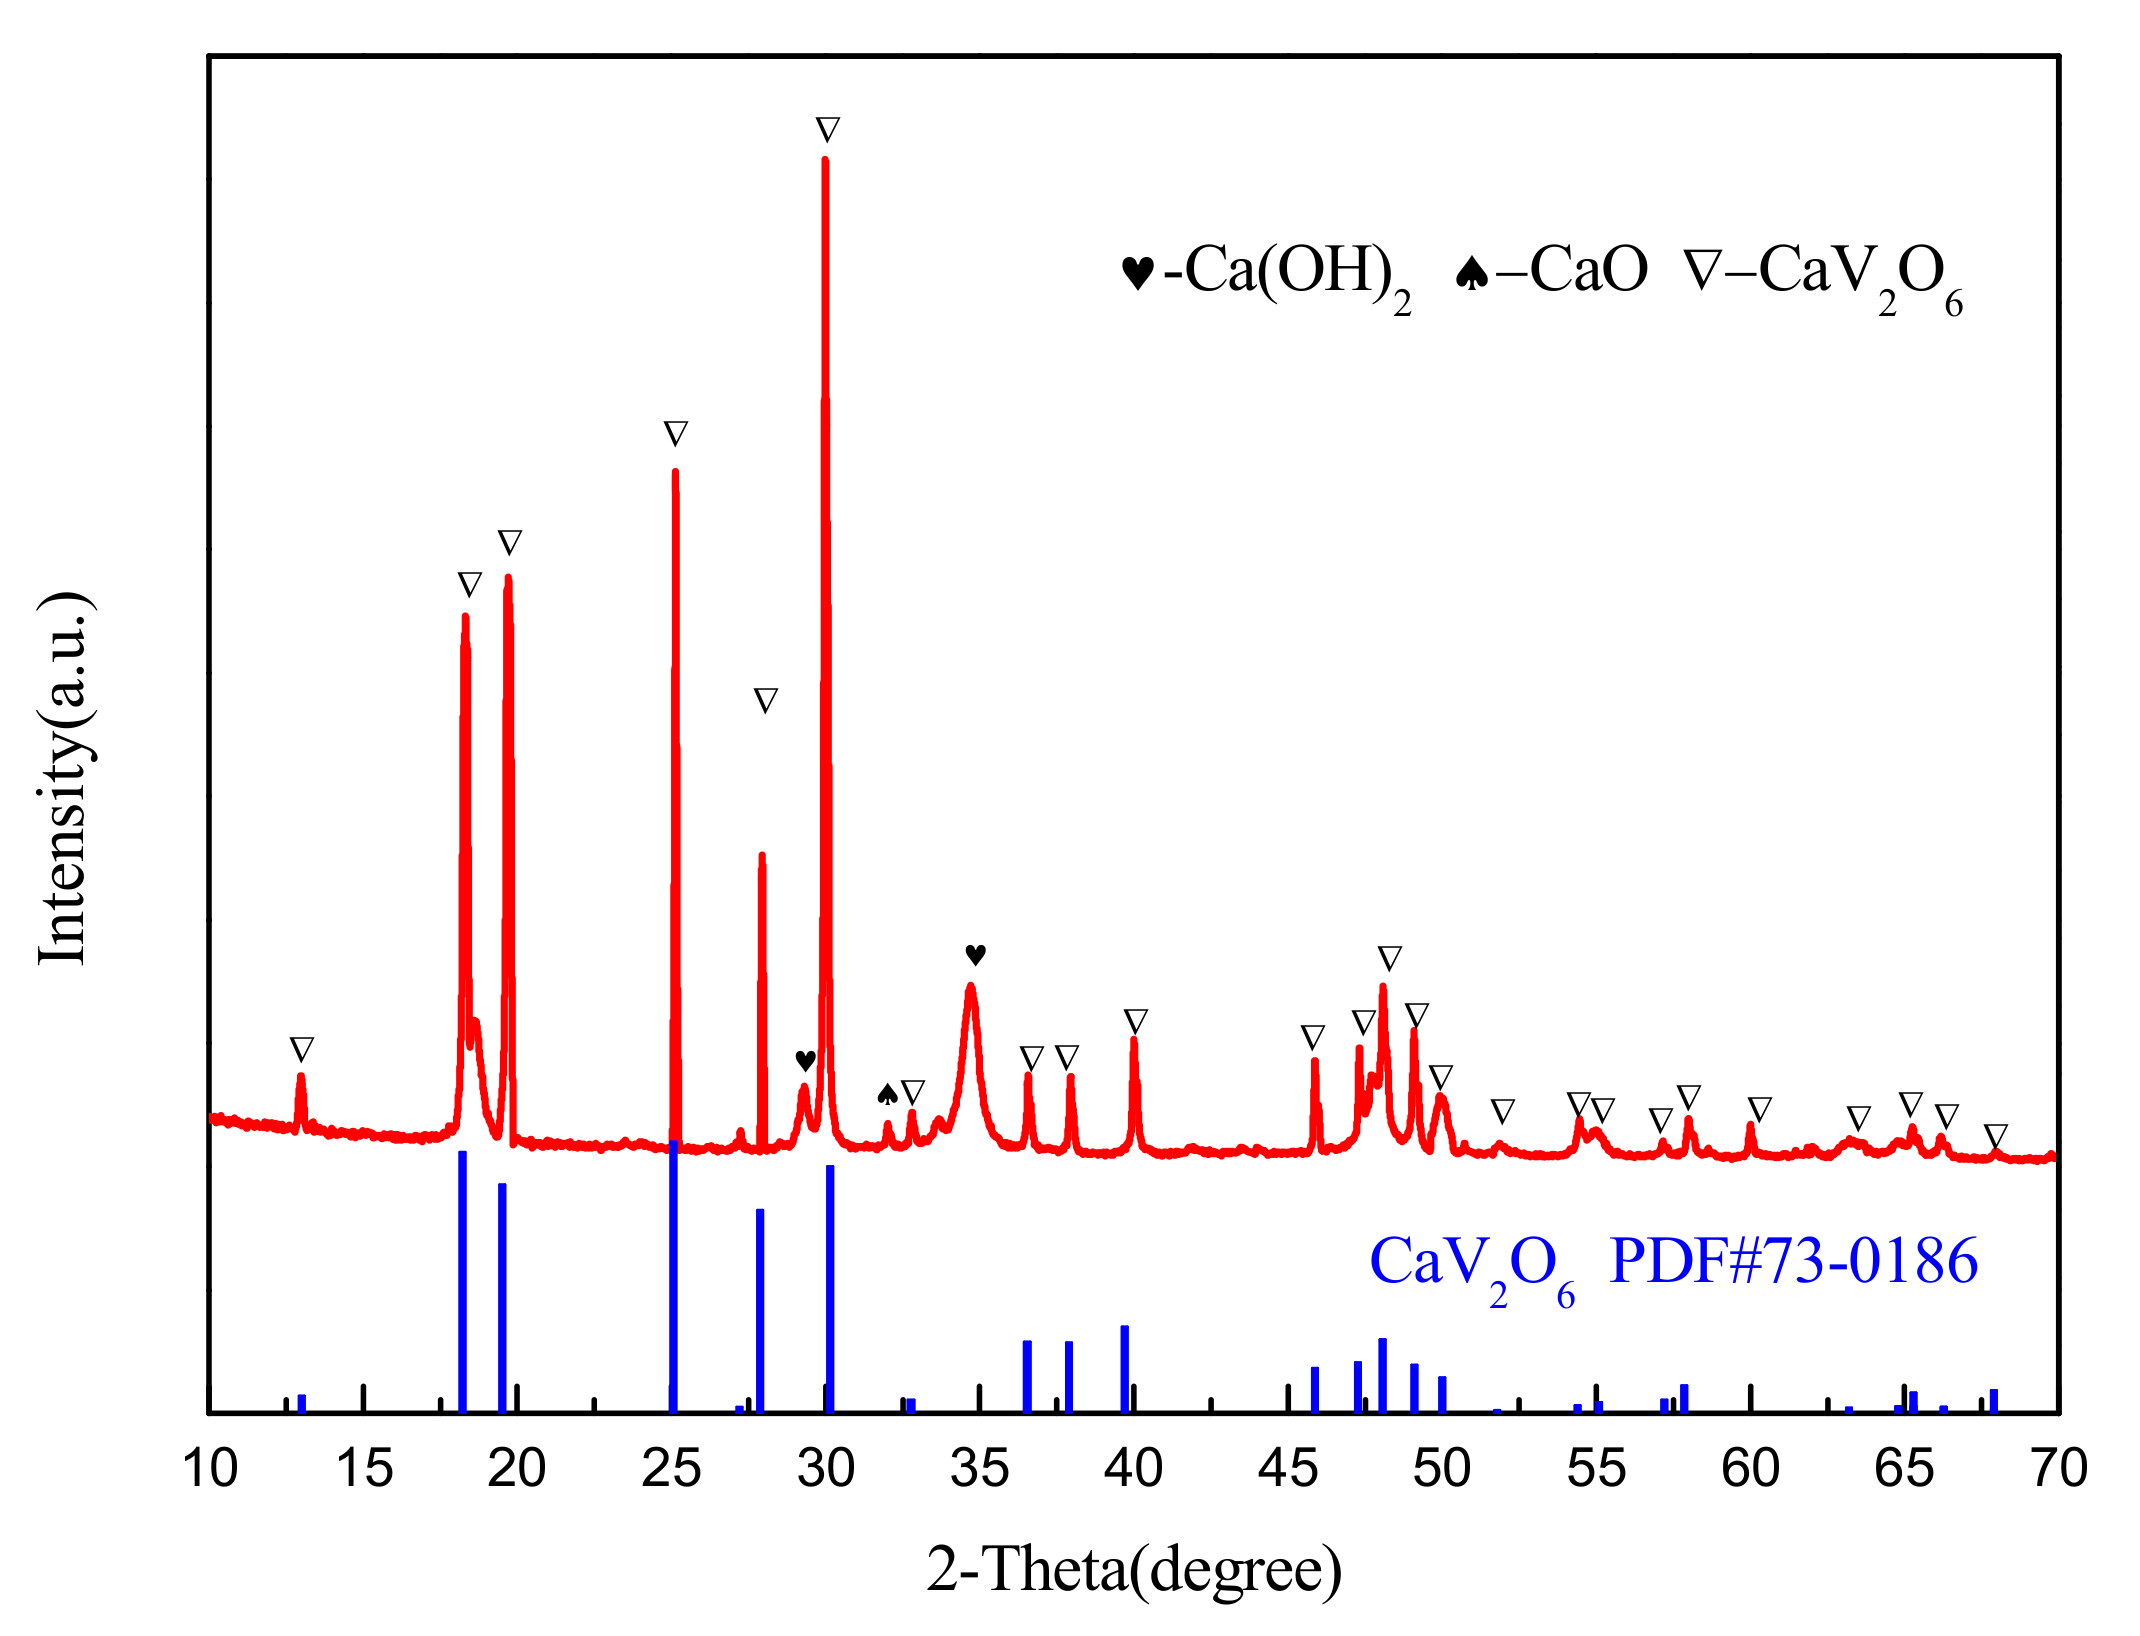
It can be seen from
Figure 12 that the precipitation products are mainly CaV
2O
6 and a small amount of CaO and Ca(OH)
2. From
Table 4, it is calculated that CaV
2O
6 in the calcium method product accounts for about 95.69%, and the molar ratio of calcium to vanadium is 0.58, which is greater than that of CaV
2O
6.
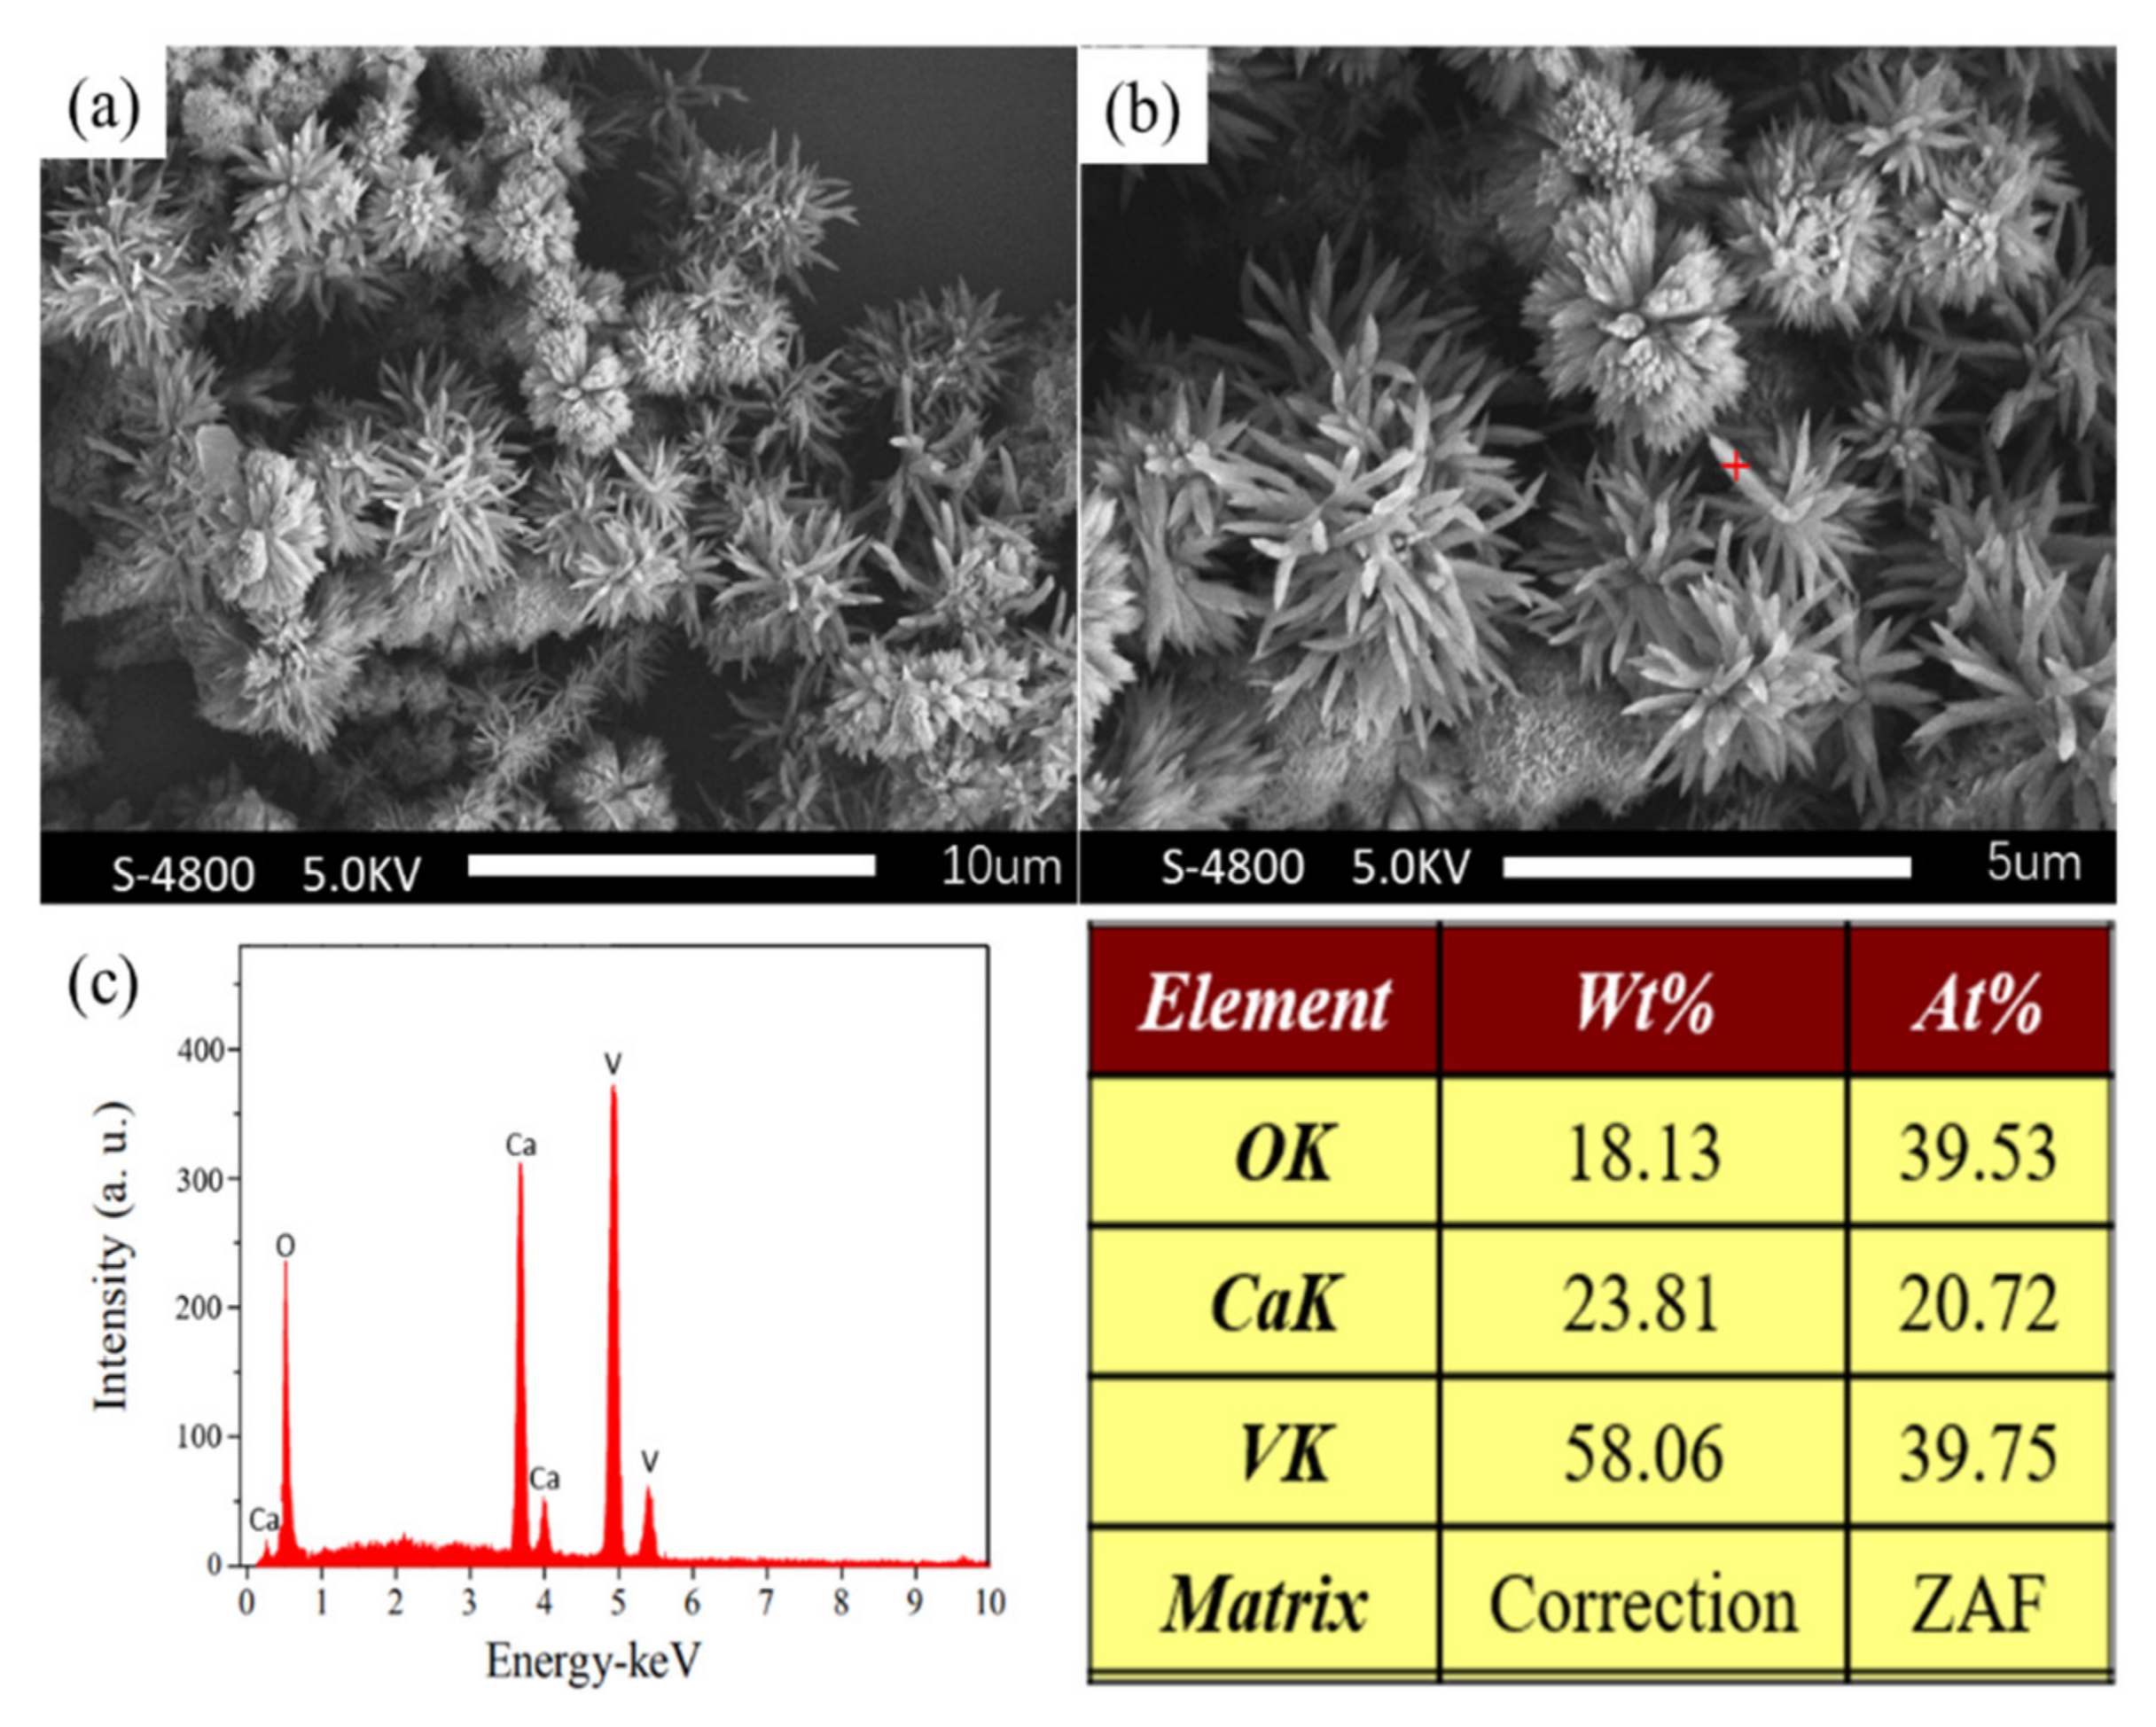
Figure 13 shows the microscopic morphology of the precipitated product. It can be seen from
Figure 13 that the synthesized CaV
2O
6 crystals are dendritic needle-like crystals. Combined with thermodynamic and kinetic analysis, it can be seen that the formation of calcium vanadate is dependent on other impurity points. The nucleus grows up, and this non-uniform nucleation point should be calcium oxide or calcium hydroxide. At the beginning of the reaction, even under acidic conditions, calcium oxide combines with water to form a large amount of Ca(OH)
2. Calcium provides nucleation sites for the formation of calcium vanadate. As the reaction time increases, the action of calcium hydroxide and hydrochloric acid in the solution is “eroded”, and as the outer Ca
2+ is “eroded”, the internal Ca
2+ gradually Migrate to the surface of the formed calcium vanadate, and further contact with the Vanadate ion in the solution, the calcium vanadate crystals will continue to grow. Because the reaction of preparing calcium vanadate by calcium precipitation of vanadium is an endothermic reaction, it tends to grow higher. As shown in
Figure 13, the morphological structure of calcium vanadate is needle-like, and it is attached to the nucleation site to expand in three dimensions. The energy-dispersive X-ray spectroscopy (EDS) matched with the scanning electron microscope measured the elemental composition of the sample. The Ca, V and O element signal peaks appeared in the spectrum. The calculated average Ca/V ratio was 0.521, which is close to the atomic ratio of calcium to vanadium in CaV
2O
6. The theoretical stoichiometric value of the chemical formula.


