Article

Biochar-Supported BiOx for Effective Electrosynthesis of Formic Acid from Carbon Dioxide Reduction

by
Juqin Zeng
1,*,†,
Pravin Jagdale
1,†,
Mirtha A. O. Lourenço
1,
M. Amin Farkhondehfal
1,
Daniele Sassone
1,2,
Mattia Bartoli
2 and
Candido Fabrizio Pirri
1,2
1
Center for Sustainable Future Technologies @POLITO, Istituto Italiano di Tecnologia, Via Livorno 60, 10144 Turin, Italy
2
Department of Applied Science and Technology, Politecnico di Torino, C.so Duca degli Abruzzi 24, 10129 Turin, Italy
*
Author to whom correspondence should be addressed.
These authors contributed equally.
Submission received: 16 March 2021 / Revised: 25 March 2021 / Accepted: 26 March 2021 / Published: 30 March 2021
(This article belongs to the Special Issue Crystalline Electrocatalysts for Carbon Dioxide Reduction Reaction)

Abstract

:
The electrochemical reduction of carbon dioxide (CO2) to value-added chemicals and fuels has attracted worldwide interest for its potential to address various contemporary global issues such as CO2-related climate change, the earth’s carbon deficit and the energy crisis. In the development of this technology, many efforts have been focused on the design of inexpensive, eco-friendly and effective catalysts. In this work, a bismuth (Bi)-based material was simply synthesized via a scalable method and fully characterized by physical, chemical and electrochemical techniques. The catalyst material consisted of Bi/Bi2O3 nanoparticles and a biochar prevenient from the pyrolysis of brewed coffee waste. It was observed that the surface of the biochar was thoroughly decorated with nanoparticles. Due to its uniform surface, the biochar–BiOx electrode demonstrated good selectivity for CO2 reduction, showing a faradaic efficiency of more than 90% for CO and HCOOH formation in a wide potential range. Particularly, the selectivity for HCOOH reached more than 80% from −0.9 V to −1.3 V vs the reversible hydrogen electrode and peaks at 87%. Besides the selectivity, the production rate of HCOOH also achieved significant values with a maximum of 59.6 mg cm−2 h−1, implying a good application potential for biochar–BiOx material in the conversion of CO2 to HCOOH.

Graphical Abstract

1. Introduction

Carbon dioxide (CO2) is a well-known greenhouse gas, and its accumulation in the atmosphere can trap infrared radiation, thereby disturbing the energy balance on the earth’s surface. In the last decade, CO2 emissions and atmospheric CO2 concentrations have become the most important topics in politics and scientific debate because unprecedented wildfires and superstorms have made global warming impossible to ignore. Using CO2 as feedstock to produce value-added chemicals and fuels is considered to be a promising approach for reducing atmospheric CO2 and consequently mitigating climate change. Many technologies have been exploited for CO2 valorization, including thermocatalysis, photocatalysis, electrocatalysis and bio-synthesis [1,2,3]. Among these methods, the electrochemical conversion of CO2 is closest to commercialization with start-ups and well-established companies such as Carbon Recycling International, Mitsui Chemicals, Dioxide Materials, Carbon Electrocatalytic Recycling Toronto and Opus-12 [4]. Electrochemical conversion presents several advantages: (1) possible use of green electrolytes and electricity without contributing to new CO2 emissions [5]; (2) Tunable products and production rates by using different catalysts and test conditions [6]; and (3) development of electrolyzers and processes for CO2 conversion based on existing technology such as water electrolyzers, polymer electrolyte membrane fuel cells and solid-oxide fuel cells [7,8,9]. Despite the above-mentioned merits, the electrochemical CO2 reduction reaction (CO2RR) involves several proton-assisted, multiple electron-transfer processes with similar standard potentials [10,11]. Moreover, a H2 evolution reaction (HER) occurs in aqueous solutions. While it is a challenge to control the selectivity of the CO2RR thermodynamically, it is even more challenging to form chemical bonds for the complex and energetic molecule products kinetically due to the high energy barrier for the intermediate formation [12,13]. Consequently, very high overpotentials are usually needed to drive the CO2RR. In order to reduce the overpotential, a well-designed catalyst is of vital importance to enable the activation of the CO2 molecules, the formation of the intermediates and the production of a specific product.
Among many products, formic acid (HCOOH) is an important raw material for industries such as leather, rubber, medicine and fiber. It can also be used as a fuel in direct formic acid fuel cells and as an excellent carrier of H2 storage [14,15]. According to a techno-economic analysis by Verma et al., HCOOH is the most economically viable and atom-economic target besides carbon monoxide (CO) [16]. Many metals such as Pb, Hg, In, Sn and Cd are selective for HCOOH formation according to the pioneer work of Hori et al. [17]. Among them, Sn-based catalysts have become the most interesting due to the high selectivity and non-noble, eco-friendly and low-cost characteristics [18,19,20,21,22]. In recent years, many studies also explored other types of catalysts for the CO2RR to HCOOH. Pd appears to be an appealing catalyst for HCOOH formation with high activity and good stability at extremely low overpotentials [23]. Copper sulfide (CuxS) is also intensively studied and it can selectively convert CO2 to HCOOH with good performance [24,25,26,27]. Bismuth (Bi)-based materials have also been studied [28,29,30,31,32,33,34] and shown to be highly selective and active for HCOOH production. Because of their low cost and low toxicity, Bi-based materials are becoming as important as Sn-based ones and are used in HCOOH production at high rates [35].
In this work, we present a biochar-supported BiOx and applied it to a CO2RR for the first time. The biochar was produced by the valorization of brewed coffee waste by pyrolysis [36,37]. This biochar has numerous channels and pores and consequently a high specific surface area, making it an interesting carbon support for bismuth-based nanoparticles. The composite was simply synthesized using a scalable route through a solid-state reaction method. The resultant material was thoroughly characterized by FESEM–EDS and XRD analyses to study its surface and structural properties and by operando TGA-IR to study the physicochemical properties. Finally, the performance of the biochar–BiOx catalyst for CO2RR to HCOOH was studied by different electrochemical techniques.

2. Experimental Section

2.1. Materials

Bismuth(III) nitrate pentahydrate (Bi(NO3)3·5H2O, 99%), Potassium bicarbonate (KHCO3, 99.7%), Nafion® 117 solution (5 wt.%) and isopropanol were purchased from Sigma–Aldrich (Merck). All chemicals were used as received.

2.2. Synthesis

The coffee waste was collected from Bar Katia (Turin, Italy) supplied by Vergnano. First, the coffee waste was dried at 105 °C for 72 h to eliminate any moisture. Then, 100 g of the dried waste was pyrolyzed using a tubular furnace (Carbolite TZF 12/65/550) under a nitrogen flow (40 mL min−1). The heating rate was 15° min−1 until a temperature of 800 °C was reached. The sample was kept at 800 °C for 30 min and cooled down to room temperature. The obtained biochar was collected.
The Bi(NO3)3·5H2O was used as precursor salt and used biochar as support. In a typical synthesis procedure, 3.5 g of Bi(NO3)3·5H2O salt was initially added slowly to 35 mL (1.5 M) of a nitric acid (HNO3) solution with continuous stirring (2500 rpm) till the solution became clear. Then 1.0 g of pyrolyzed biochar was added slowly and continuously into the solution with constant stirring for more than 30 min. To achieve homogeneity in the composite solution, the mixture was sonicated for 20 min (amplitude 40%, Sonic Vibracel sonicator). The composite mixture was then heated in a furnace at 150 °C for 2 h to completely evaporate the water content. The obtained solid composite material was then calcinated at 400 °C in a N2 atmosphere for 2 h. After calcination, the sample was allowed to cool naturally inside the furnace. The final free flowing catalyst was then ready for the fabrication of the electrodes.

2.3. Physical and Chemical Characterizations

The morphology and elemental composition of the composite powder was investigated by field-emission scanning electron microscopy (FE-SEM, ZEISS-MERLIN) equipped with high-resolution energy-dispersive (ENERGY 450) X-ray spectroscopy (EDS, OXFORD INCA). For FESEM–EDS analysis, the composite sample was coated with a 5 nm thin layer of platinum to avoid the charging effect.
The crystalline phases of the catalysts were examined by X-ray diffraction (XRD). Measurements were performed using a PANalytical X’Pert Pro instrument (Cu-Kα radiation, 40 kV and 30 mA) equipped with an X’Celerator detector.
Operando TGA–IR was made on a Thermogravimetric Analyzer (TGA) NETZSCH TG209 F1Libra instrument coupling line to a Fourier transform infrared (FTIR) Bruker Tensor II spectrophotometer equipped with DTGS detector and a Bruker heated gas chamber analysis accessory. Approximately 3 mg of sample in alumina pans were heated from 30 to 900 °C, using a heating ramp of 20 °C min−1, under air (flow rate = 20 mL min−1). Nitrogen flow was used as protection gas (flow rate = 20 mL min−1). The FTIR analysis was collected in the absorbance mode in the 650–4400 cm−1 range. The gas development kinetics were followed at the adsorption maximum for different molecules: CO, 2179 cm−1 [38]; CO2, 2349 cm−1 [39]; and H2O, 3735 cm−1 [40].

2.4. Preparation of the Electrodes

Electrodes were made by preparing a slurry containing 3.45 mg of the synthesized catalyst, 30 µL of a Nafion® 117 solution, and 90 µL of isopropanol through sonication for 30 min. The obtained suspension coated a carbon paper (GDL; SIGRACET 28BC, SGL Technologies) by the drop-casting method. The solvents were evaporated overnight at room temperature. The catalyst mass loading was about 2.3 mg cm−2.

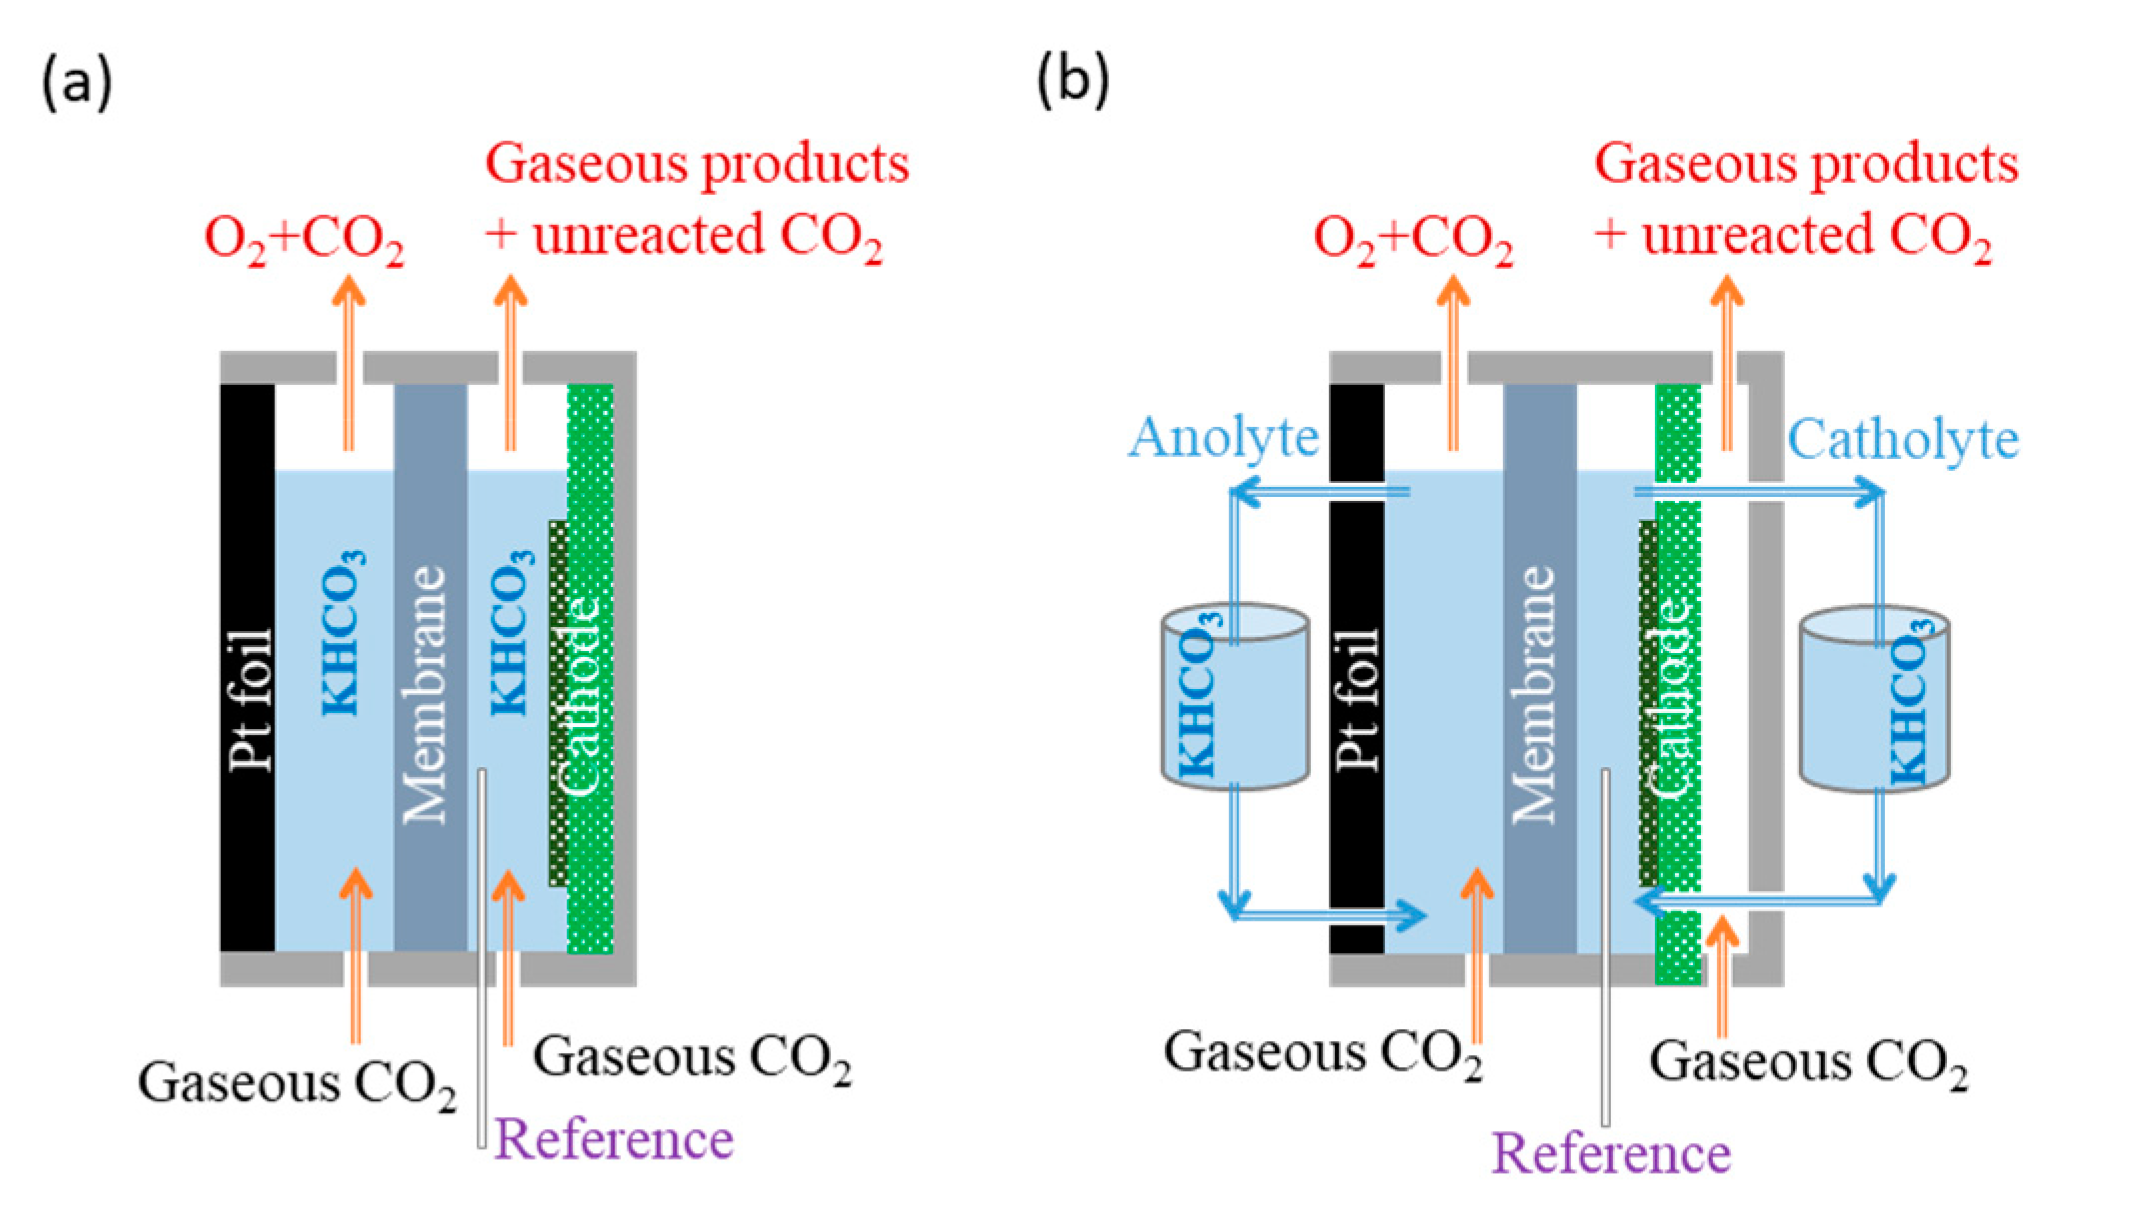
2.5. Electrochemical Characterizations for the CO2RR and Product Analysis

Cyclic voltammetry (CV) was performed in a three-electrode cell at room temperature with a CHI760D electrochemical workstation. The working electrode was a catalyst-coated carbon paper with a geometric area of 0.1 cm2. A Pt wire was used as the counter electrode and an Ag/AgCl (3 M NaCl) was used as the reference. To study the electrocatalytic performance of the electrode, CV measurements were performed from +0.2 V to −1.3 V vs. the reversible hydrogen electrode (RHE) at a scan rate of 10 mV s−1 in N2- and CO2-saturated 2.0 M KHCO3 aqueous solution. Hereafter, the potentials refer to the RHE unless otherwise specified.
CO2 electrolysis was carried out in controlled potential mode by applying chronoamperometric (CA) technique with a potentiostat(CHI760D). The potential was corrected by compensating the ohmic potential drop, of which 85% by the iR-compensation method of the instrument and 15% by manual shifting after calculation.
The CO2RR performance of the bare biochar and biochar–BiOx electrodes was compared in a two-compartment, three-electrode batch cell as shown in Scheme 1a. A proton exchange membrane (Nafion™ Membrane N117, Ion Power) was used as the separator for the anodic and cathodic sides. The reference electrode was a mini Ag/AgCl (1 mm, leak-free LF-1) inserted into the catholyte. A Pt foil (3.3 × 3.3 cm2) was used as the anode and inserted into the anolyte. The working electrode was carbon paper coated with the synthesized catalyst (geometric area: 1.5 cm2). The electrolyte was 0.1 M KHCO3 aqueous solution (pH 6.8). During the CA tests, a constant CO2 flow of 15 mL min−1 was purged through both sides in order to supply CO2 at the cathode and to maintain a constant pH at the anode.
Then, CA tests were conducted at the biochar–BiOx electrode in a customized three-compartment, three-electrode semi-flow cell, as shown in Scheme 1b. In the flow cell configuration, the cathodic side was composed of two compartments, one with the catholyte flow and the other with the CO2 gas flow. During the CA tests, both the catholyte and anolyte were 25 mL of 2.0 M KHCO3 aqueous solution (pH 8.3) and were circuited at 2 mL min−1 The CO2 gas was purged through the anolyte at a constant flow rate of 5 mL min−1 in order to maintain a constant pH. A CO2 flow of 25 mL min−1 was maintained at the gas compartment of the cathodic side to supply the CO2 reactant and bring out the products.
During the CO2 electrolysis, the gaseous products were analyzed on-line with a micro gas chromatograph (µGC, Fusion®, INFICON). The µGC was equipped with two channels: one, a Rt-Molsieve 5A column (10 m) and the other, a Rt-Q-Bond column (8 m). A microthermal conductivity detector (micro-TCD) was used for both channels. At the end of each test, the catholyte was collected and analyzed by a high-performance liquid chromatograph (Thermo Scientific Ultimate3000 HPLC) to determine the liquid products. The HPLC was equipped with a UV–Vis detector (210 nm) and a ReproGel (300 × 8 mm2) column. A solution of 9.0 mM H2SO4 at a flow rate of 1.0 mL min−1 was used as the mobile phase.
Faradaic efficiency (FE) was the key parameter for determining the selectivity toward a specific product. The FE for a product can be calculated by dividing the charge consumed to produce a determined amount of this product by the total charge passed through the cathode as in Equation (1),
FE = n N F Q
where Q is the total charge consumed at the cathode (coulombs, C); n is the mole of electrons required to obtain 1 mole of this product (n = 2 for CO, HCOOH and H2 production); N is the mole of an identified product (mol); and F is the Faraday constant (96,485 C mol−1).
The partial current density for HCOOH formation jHCOOH can be obtained using Equation (2),
j HCOOH = j t o t a l F E HCOOH
where jtotal is the total geometric current density at the cathode, and FEHCOOH is the faradaic efficiency for HCOOH production.
The production rate of HCOOH (mg h−1 cm−2) can be calculated by applying Equation (3),
P r o d u c t i o n   r a t e HCOOH = j HCOOH t M 2 F
where F is the Faraday constant (96,485 C mol−1); t is the seconds in one hour (3600); jHCOOH is the partial current density for HCOOH formation (mA cm−2); and M is the molar mass of HCOOH (g mol−1).

3. Results and Discussion

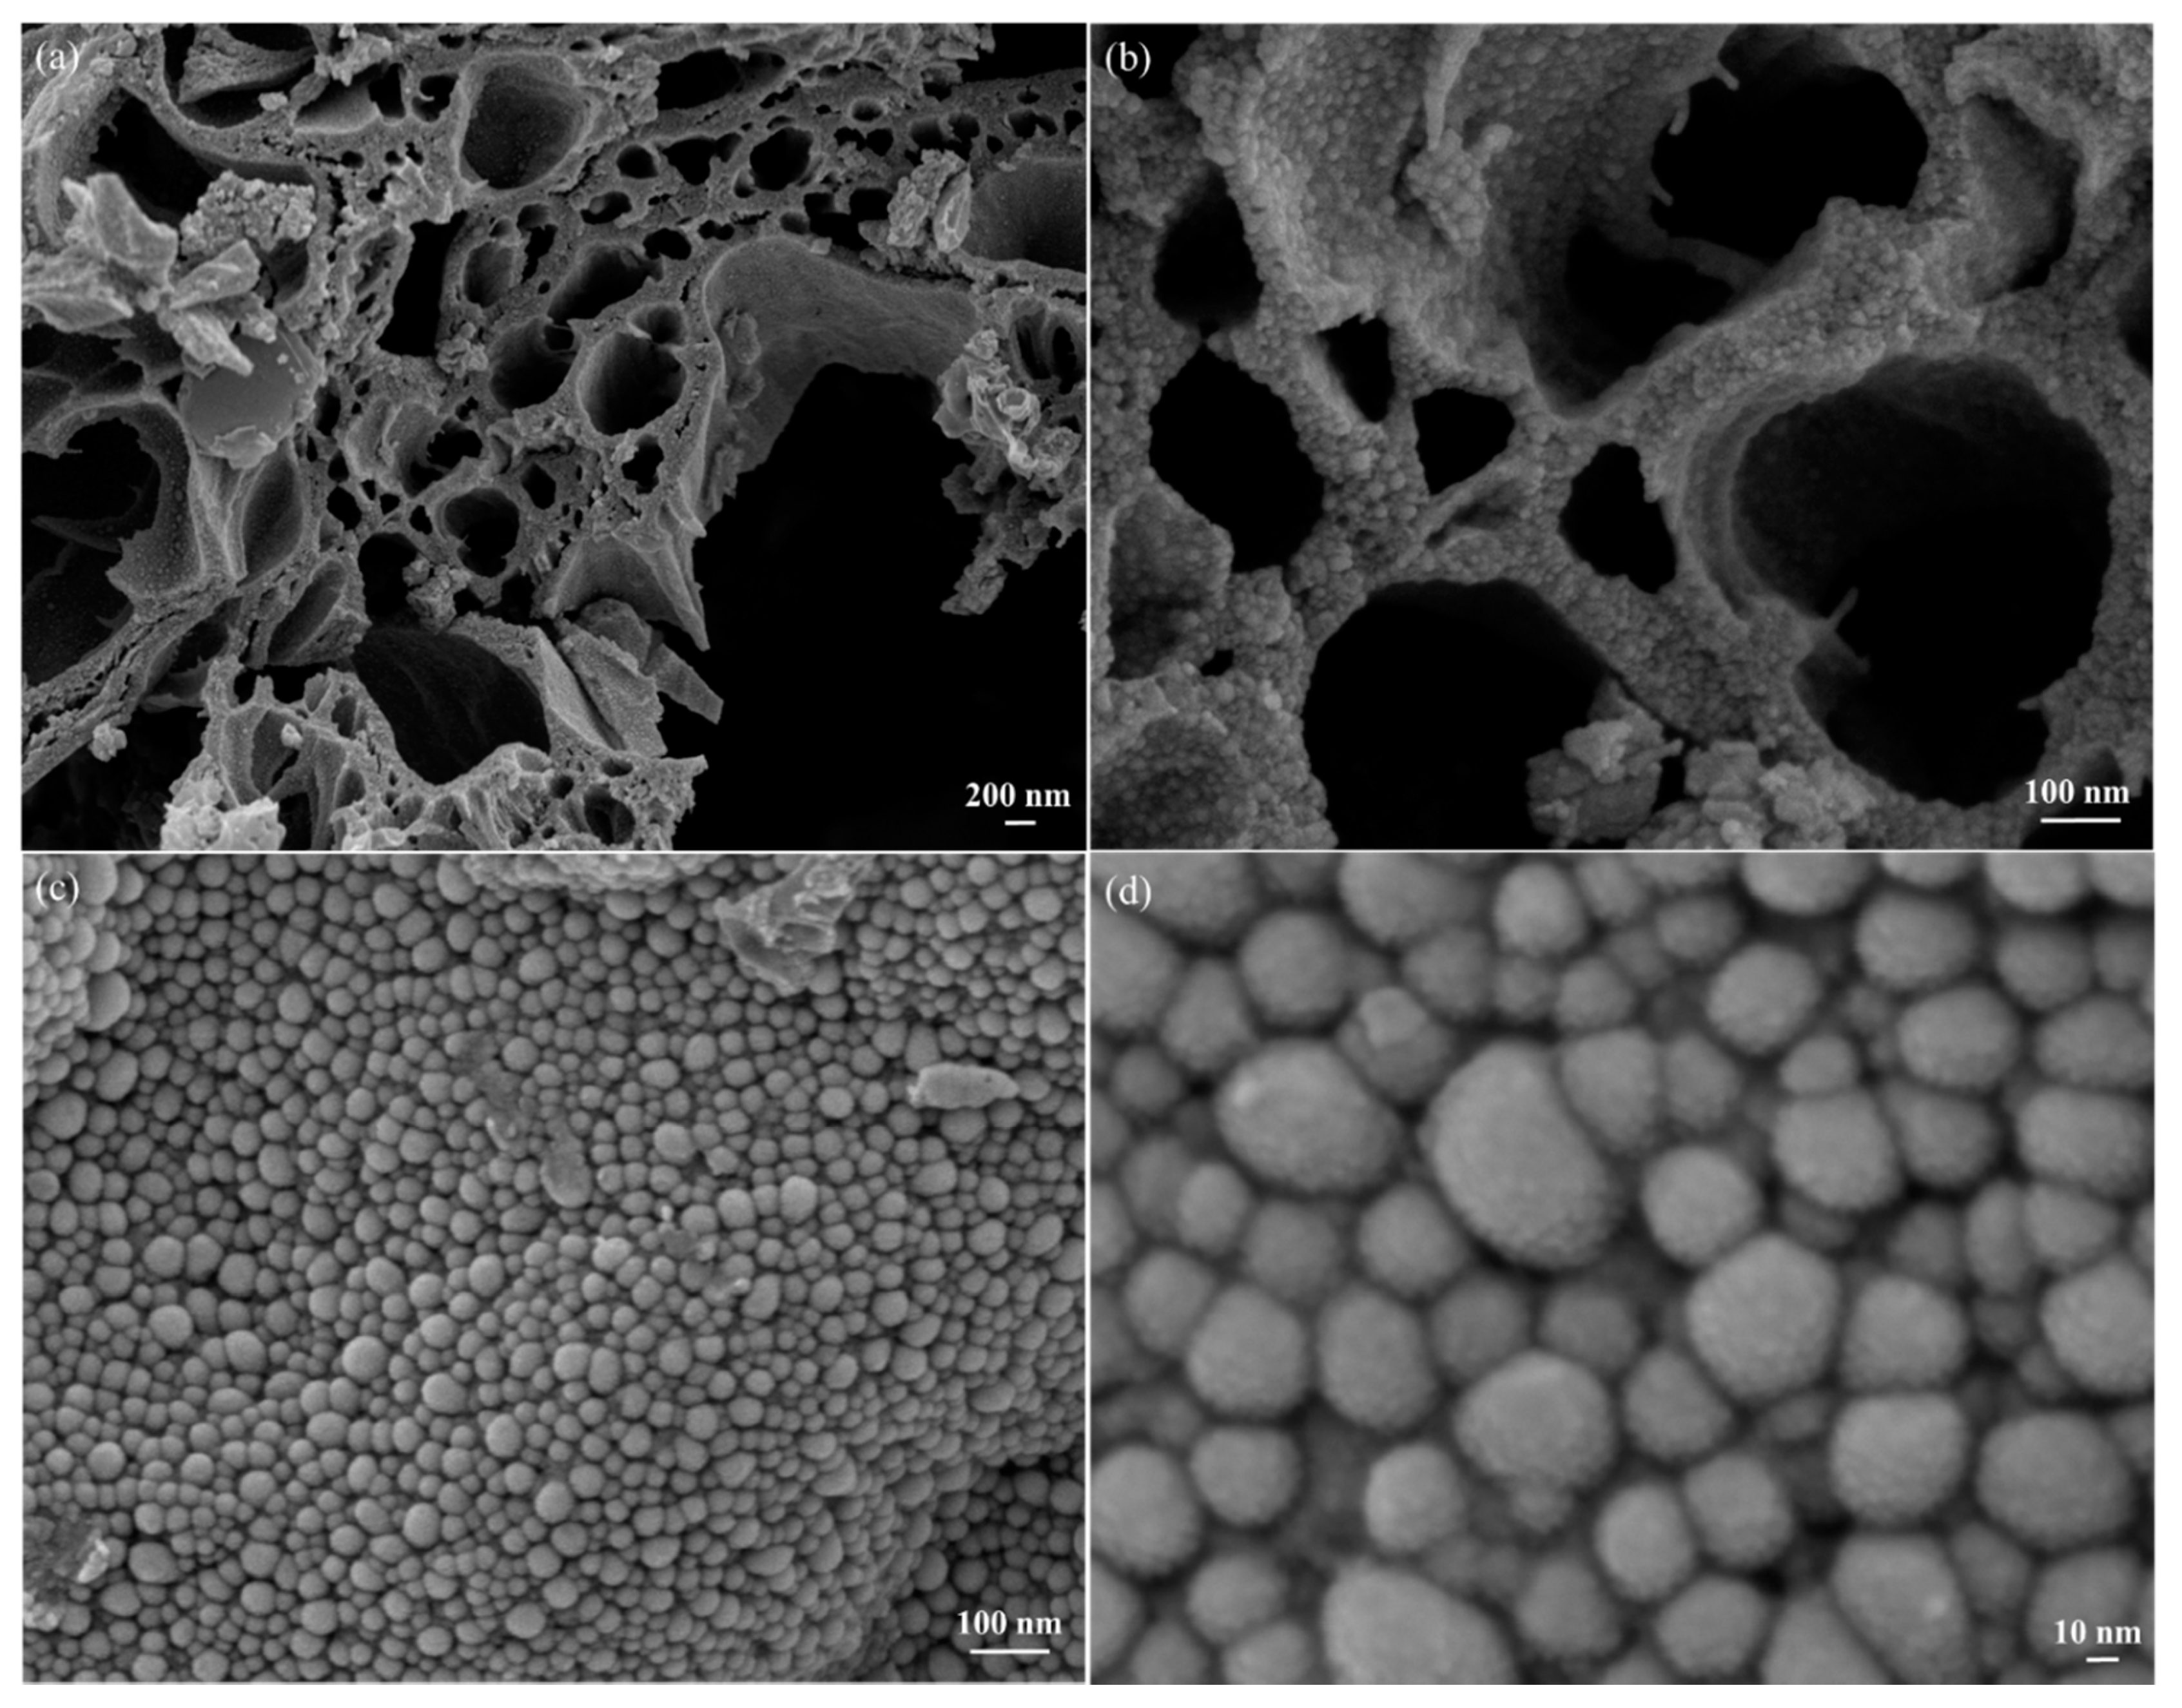
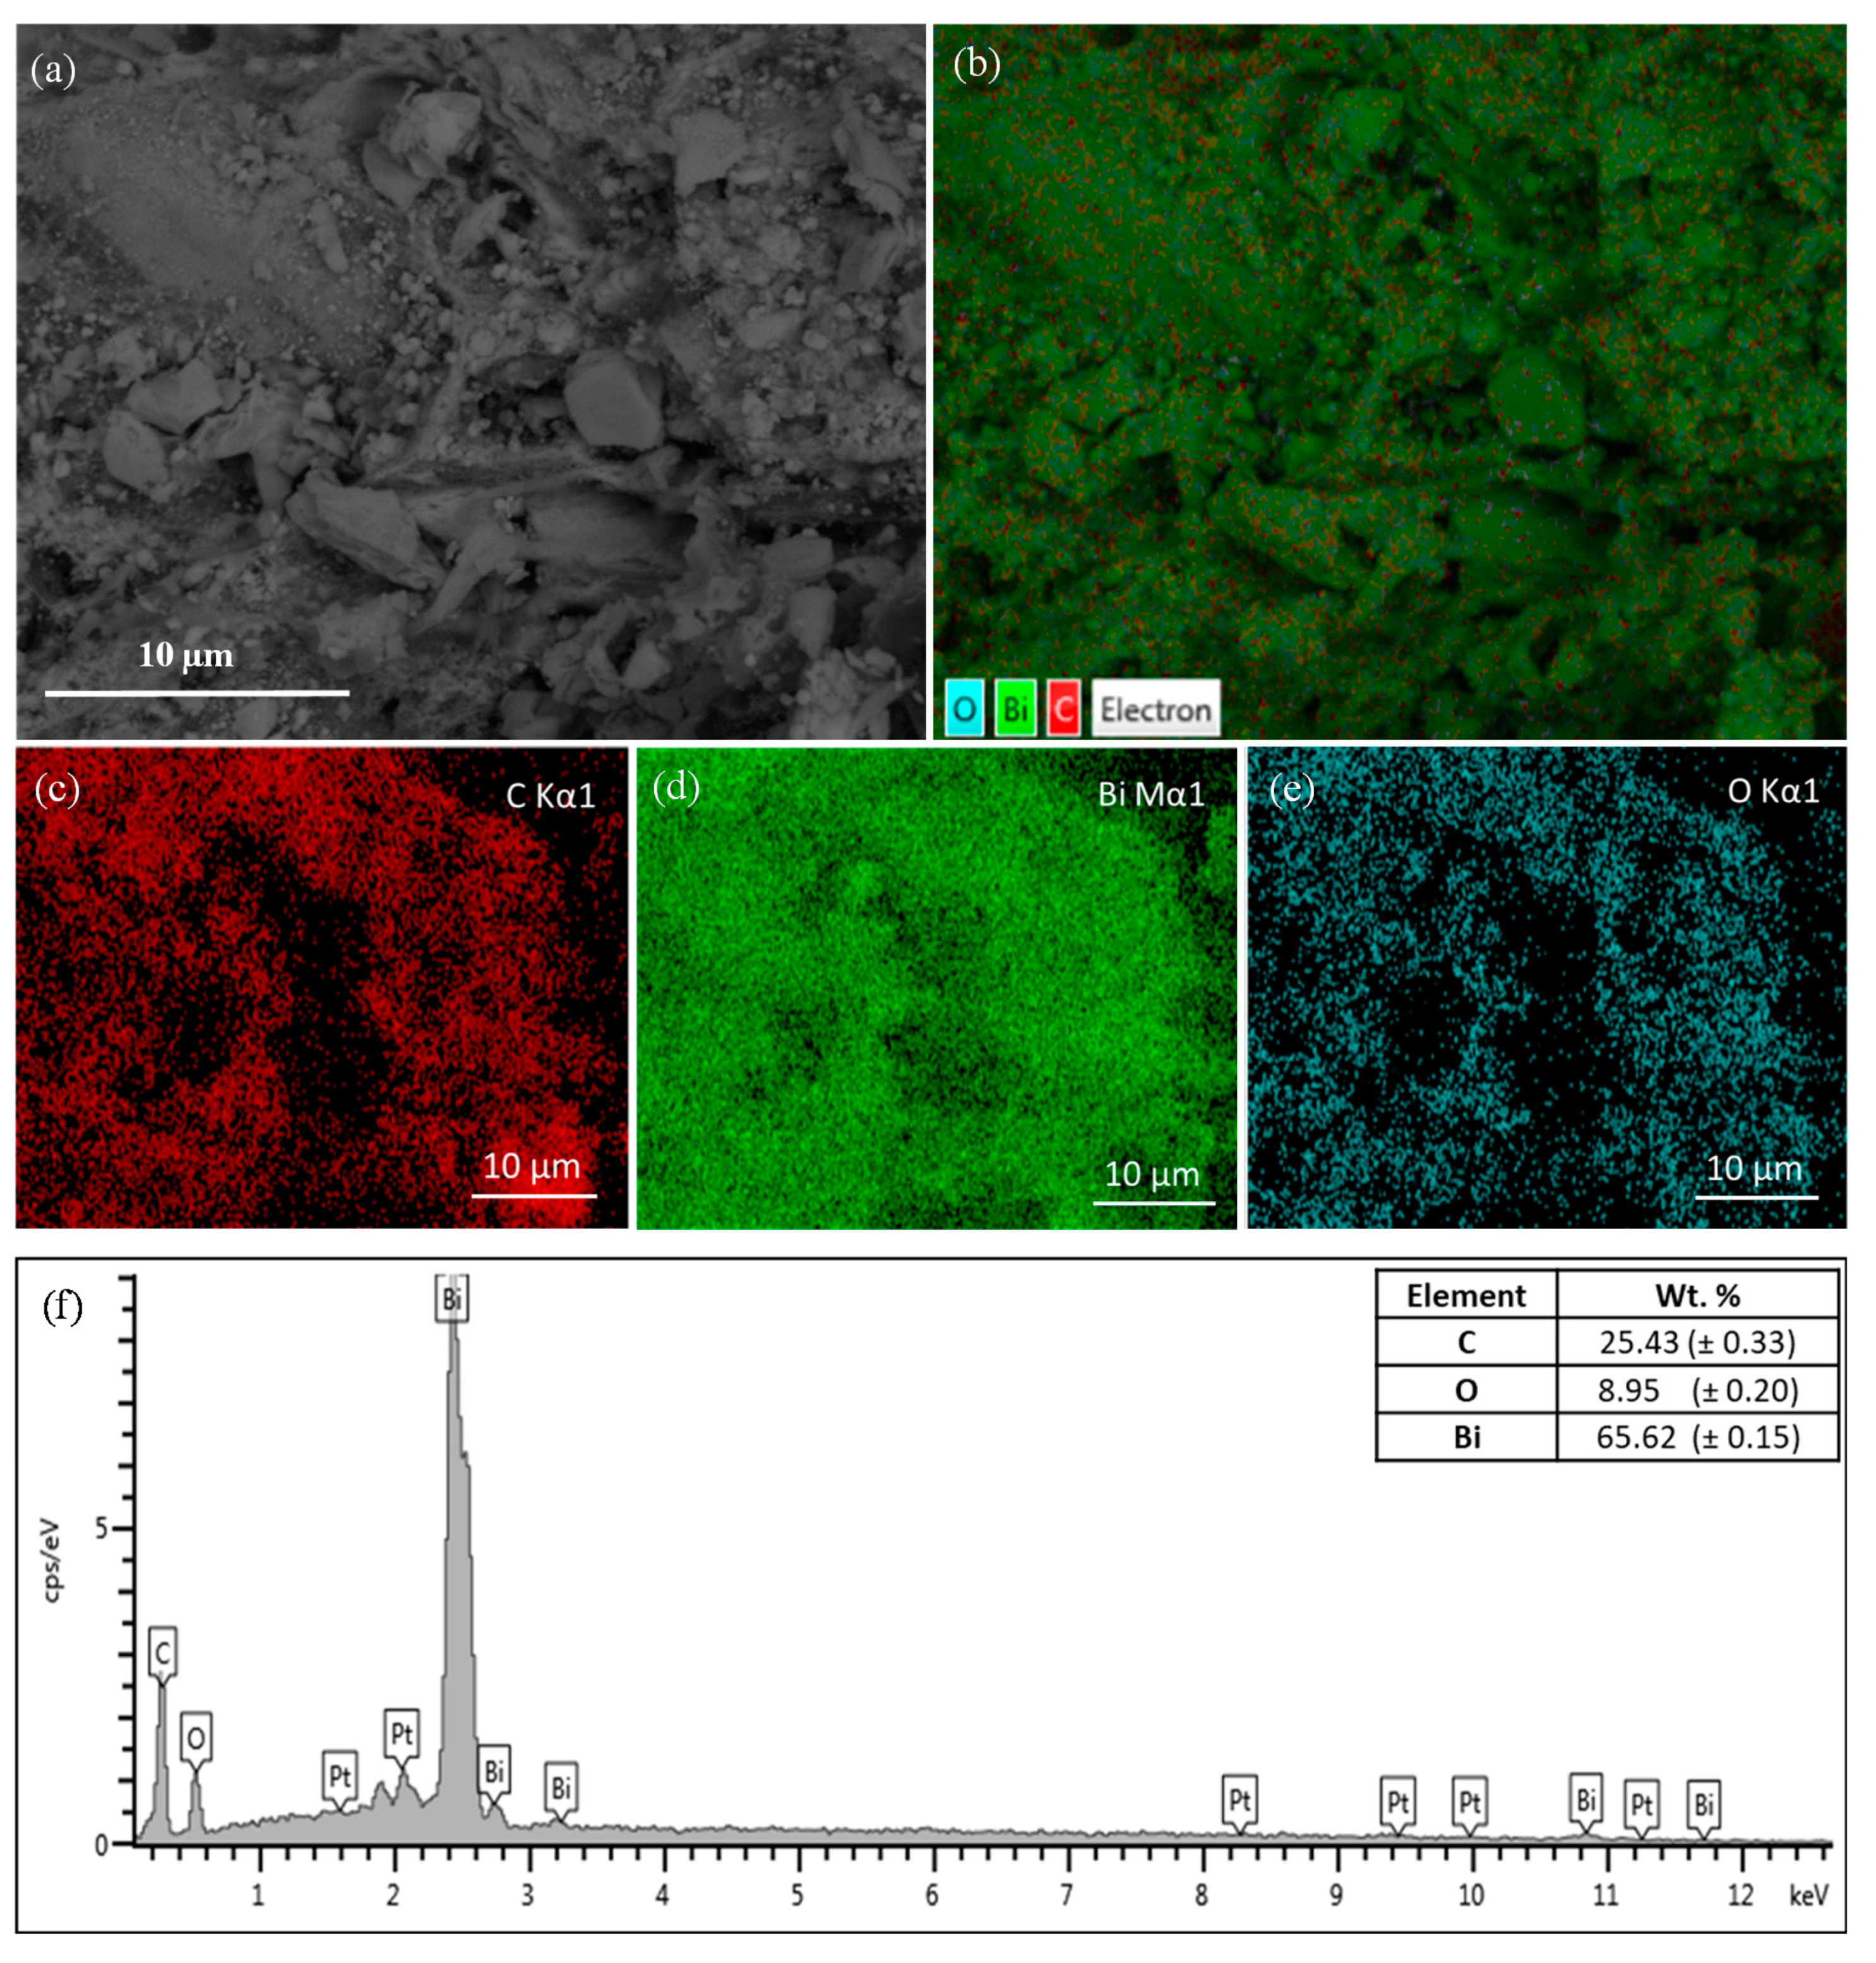
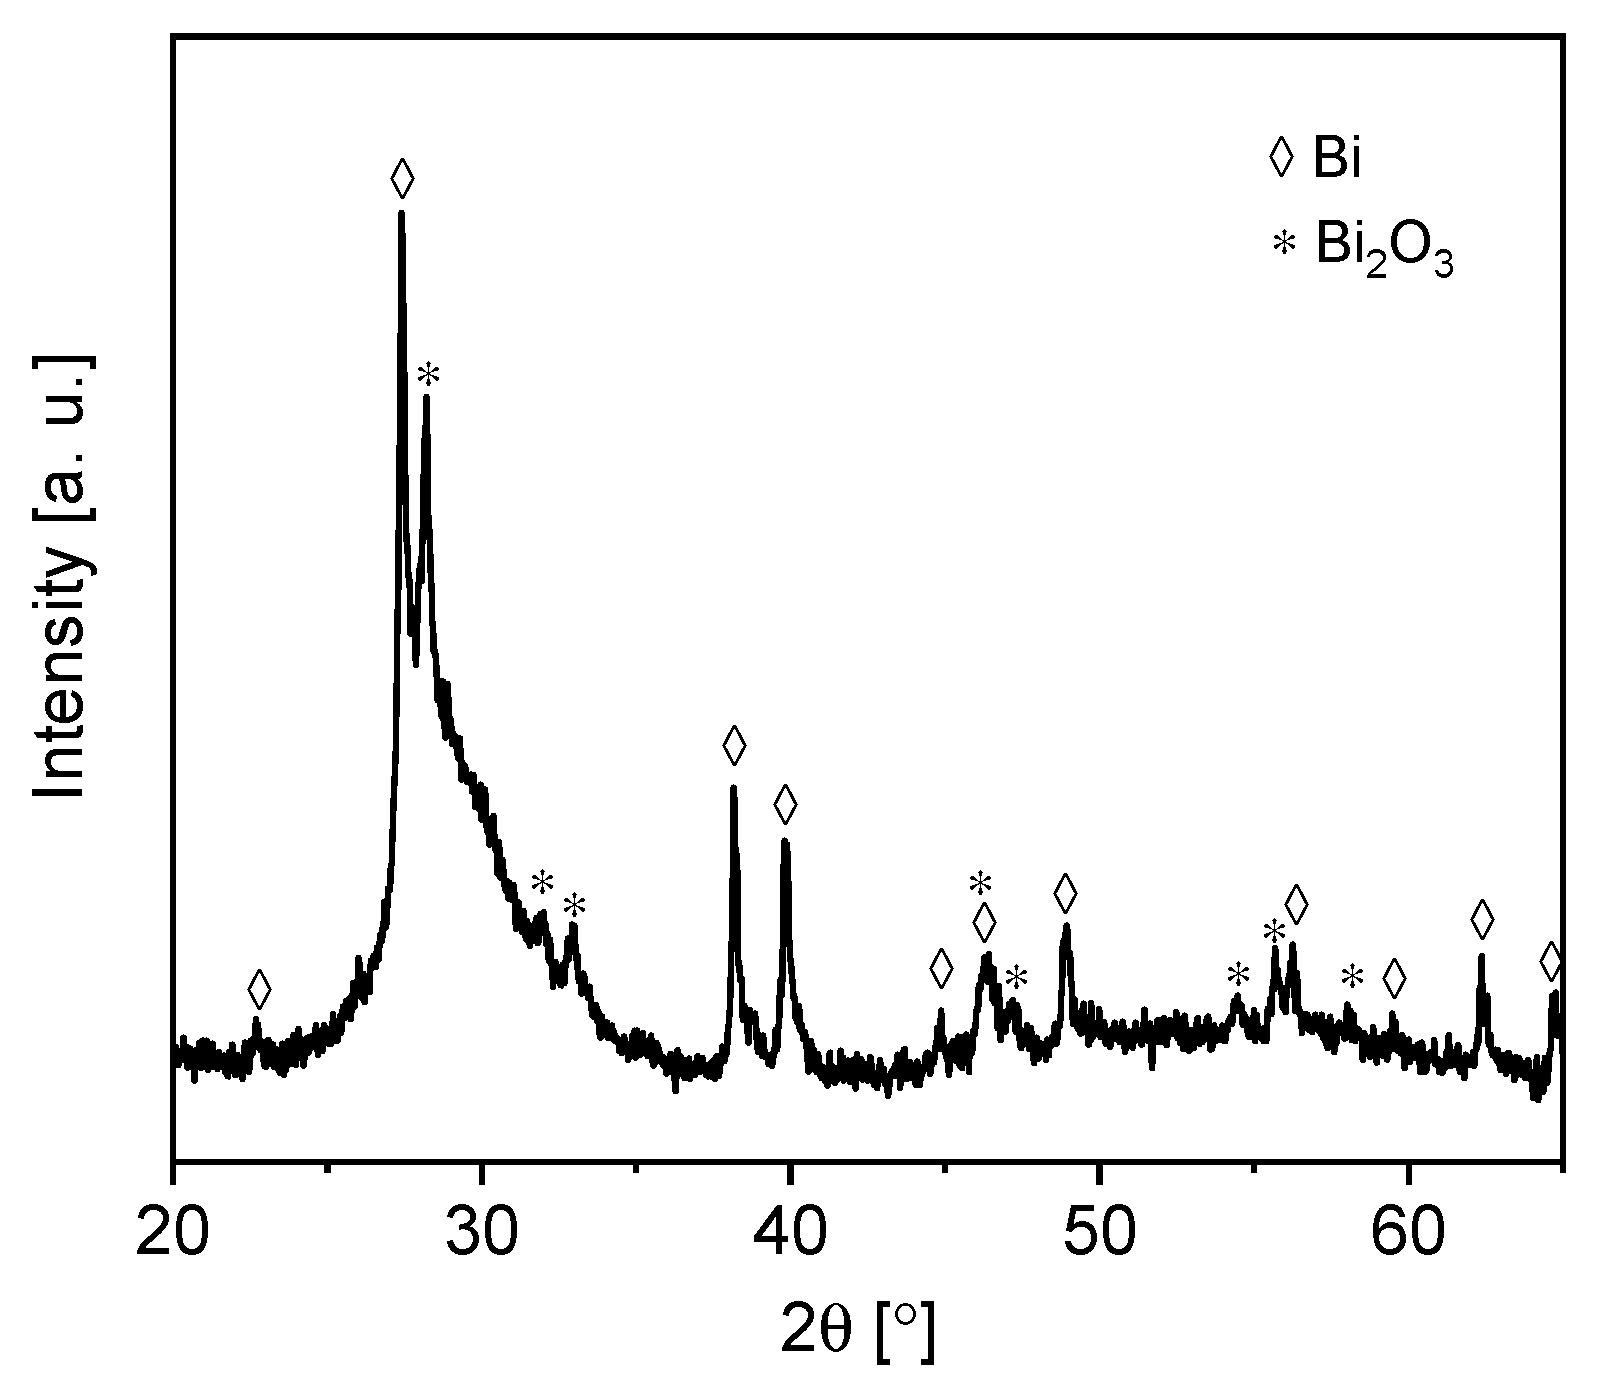
3.1. Physical and Chemical Characterizations of the Synthesized Catalysts

FESEM–EDS analysis was performed on the biochar–BiOx composite sample. Figure 1a shows the porous nature of the biochar with a pore size distribution of 100 to 1000 nm. Biochar wall thickness and length ranged from few nanometers to a micrometer. This microporous structure of biochar provided plenty of surface on which to decorate BiOx nanoparticles (Figure 1b). The uniform layer of the granular-sized BiOx nanoparticles on the biochar surface was observed. It is likely that all available biochar surface was completely covered by the BiOx nanoparticles layer (Figure 1c). It confirmed that the goal of achieving uniform decoration over a biochar surface was satisfactory. The diameter of granular BiOx nanoparticles was in nano-scale varying from 10 to 50 nm (Figure 1d), which gave them the added advantage of providing a highly catalytic surface.
A quantitative elemental analysis of biochar–BiOx composite was performed by EDS (Figure 2). Elemental mapping and scanning was performed on the targeted surface of the composite (Figure 2a). The mapping of the surface confirmed the presence of three elements, bismuth (Bi) in green, carbon (C) in red, and oxygen (O) in blue (Figure 2b–e). The mapping also confirmed the uniform distribution of the BiOx layer over the carbon surface. To quantify the elemental compositions, EDS surface scanning was performed (Figure 2f). Bismuth showed the maximum amount of 65.6 wt.% in the composite, followed by oxygen (8.9 wt.%) and carbon (25.4 wt.%).
XRD analysis was performed on the biochar–BiOx sample. As shown in Figure 3, metallic Bi and Bi2O3 were the main crystalline phases. The peaks at 2θ = 22.6°, 27.3°, 38.1°, 39.7°, 44.8°, 46.1°, 48.9°, 56.2°, 59.6°, 62.5°and 64.7° corresponded to the reflections related to the (003), (012), (104), (110), (115), (113)/(006), (202), (024), (107), (116) and (122) planes of crystalline Bi (JCPDS 01-085-1331), while the peaks at 2θ = 28.0°, 31.7°, 32.7°, 46.2°, 46.9°, 54.2°, 55.6° and 57.8° were associated with the (201), (002), (220), (222), (400), (203), (421)/(213) and (402) planes of the crystalline Bi2O3 (JCPDS 01-078-1793). The broad peak centered at about 2θ = 28.5° was related to the graphitic carbon in the biochar.
Figure 4 displays the thermal degradation in air of the biochar–BiOx up to 900 °C. The TGA (Figure 4a) shows a slight weight loss of 0.3% below 100 °C, which was related to the desorption of some physisorbed gases. Then, a weight increase of ~2.5% associated with the oxidation of the bismuth was detected until 315 °C. This was followed by thermal degradation of the biochar–BiOx sample, which occurred completely below 400 °C. The maximum degradation of the biochar–BiOx sample was observed at 349 °C, and the IR spectrum acquired at this temperature is shown in Figure 4b. The gases developed were mainly CO2 (2359 cm−1) and water (3750 and 1543 cm−1), being obtained by the degradation of the biochar and the release of some OH surface groups from BiOx, respectively. CO (2180 cm−1) was also observed but in a small amount (Figure 4b inset). The residue of the biochar–BiOx degradation at 900 °C was 89.6%, which was related to the Bi2O3 derived from BiOx in air at high temperature [41,42] and the residue of biochar. Figure 4c shows the TGA of the bare biochar and 12.6% of residue was found. Table 1 listed the calculated weight percentage of BiOx in the composite sample and compared it with the nominal one. The calculated value was higher than the nominal percentage, probably due to the loss of a part of the biochar during the decoration of BiOx.

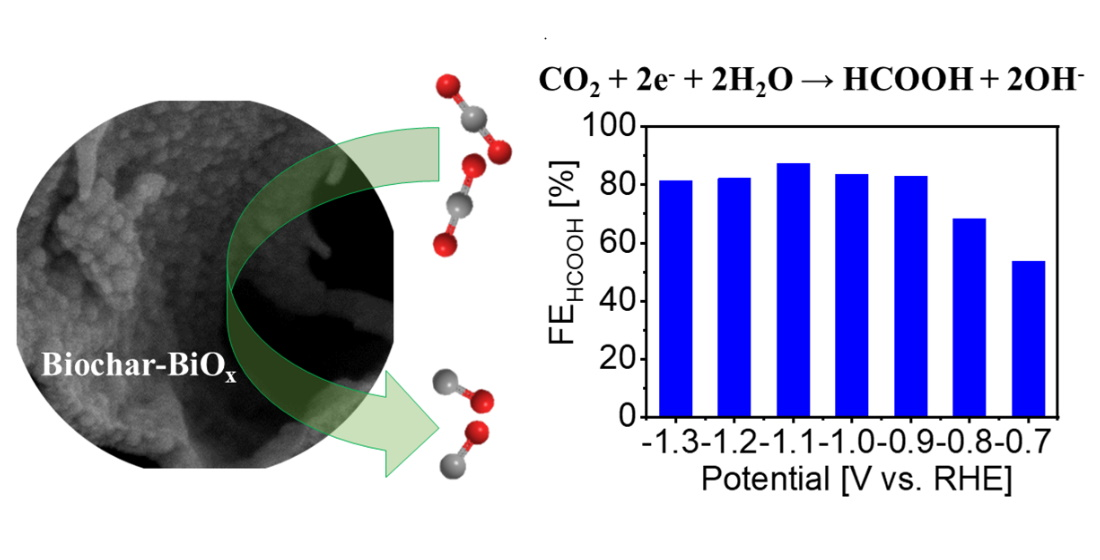
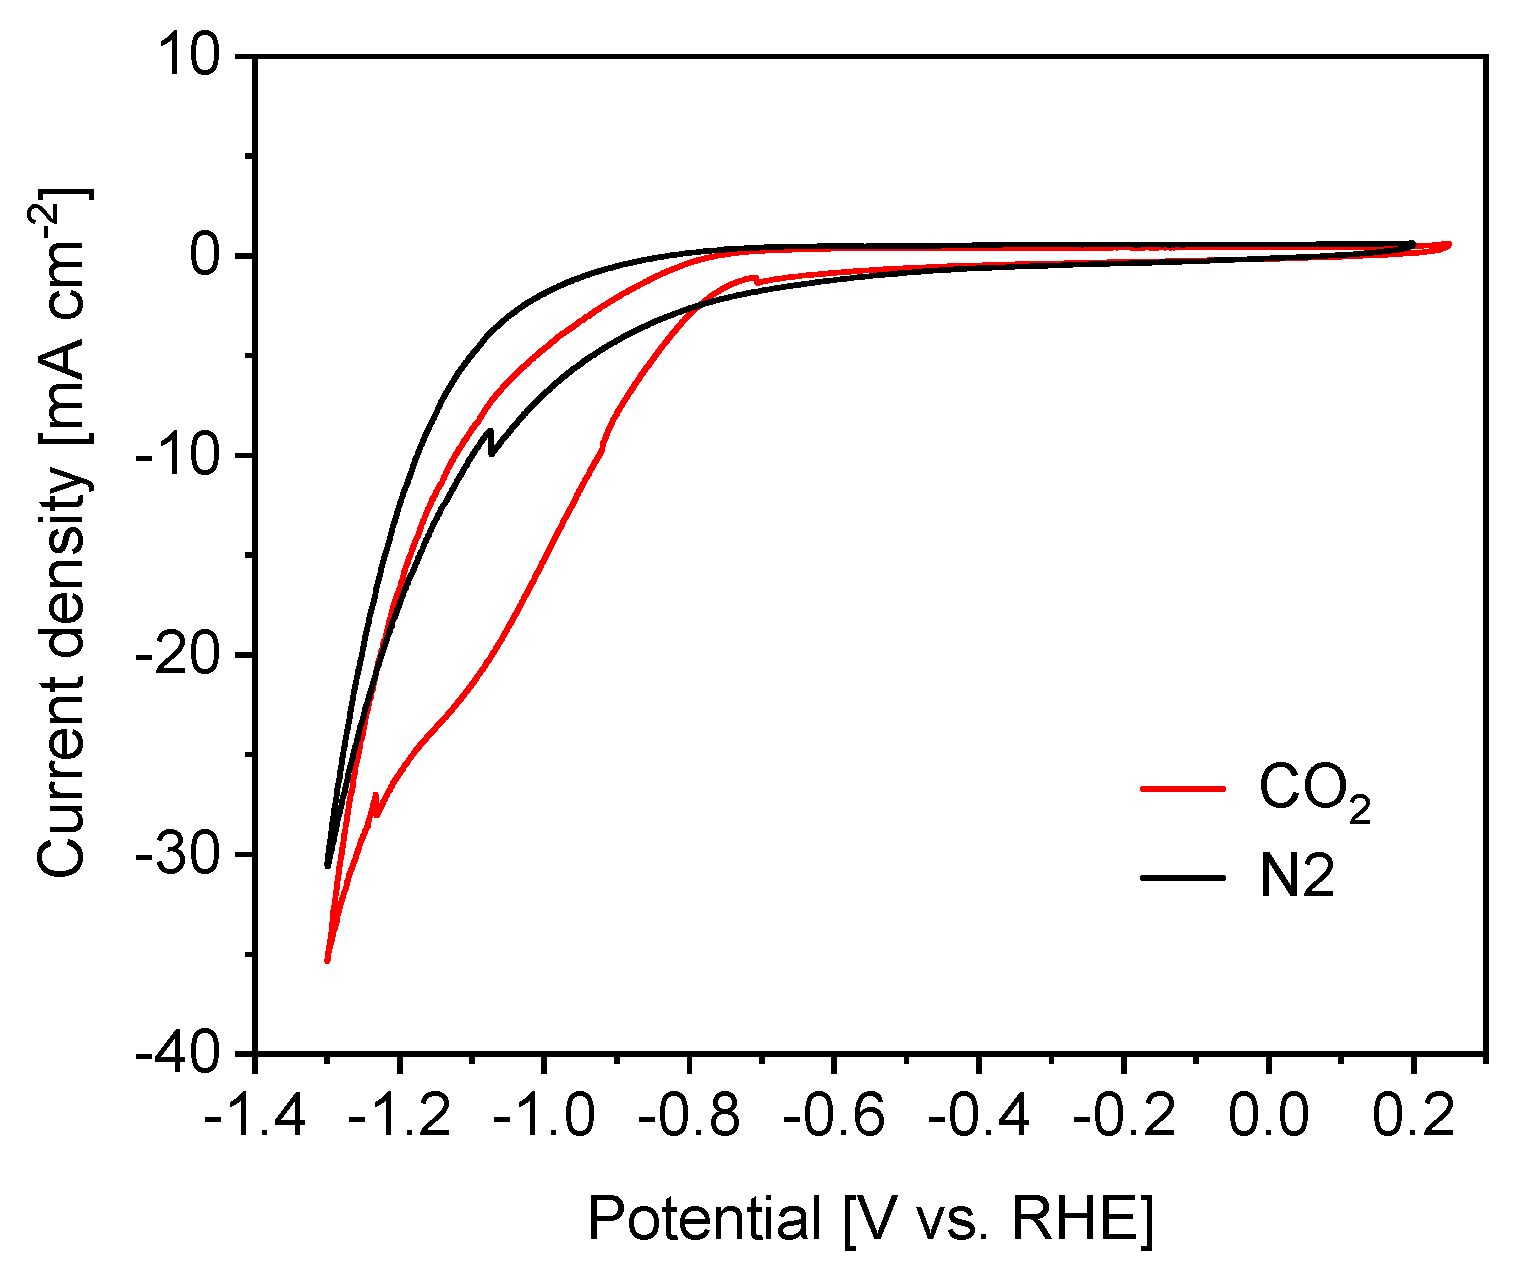
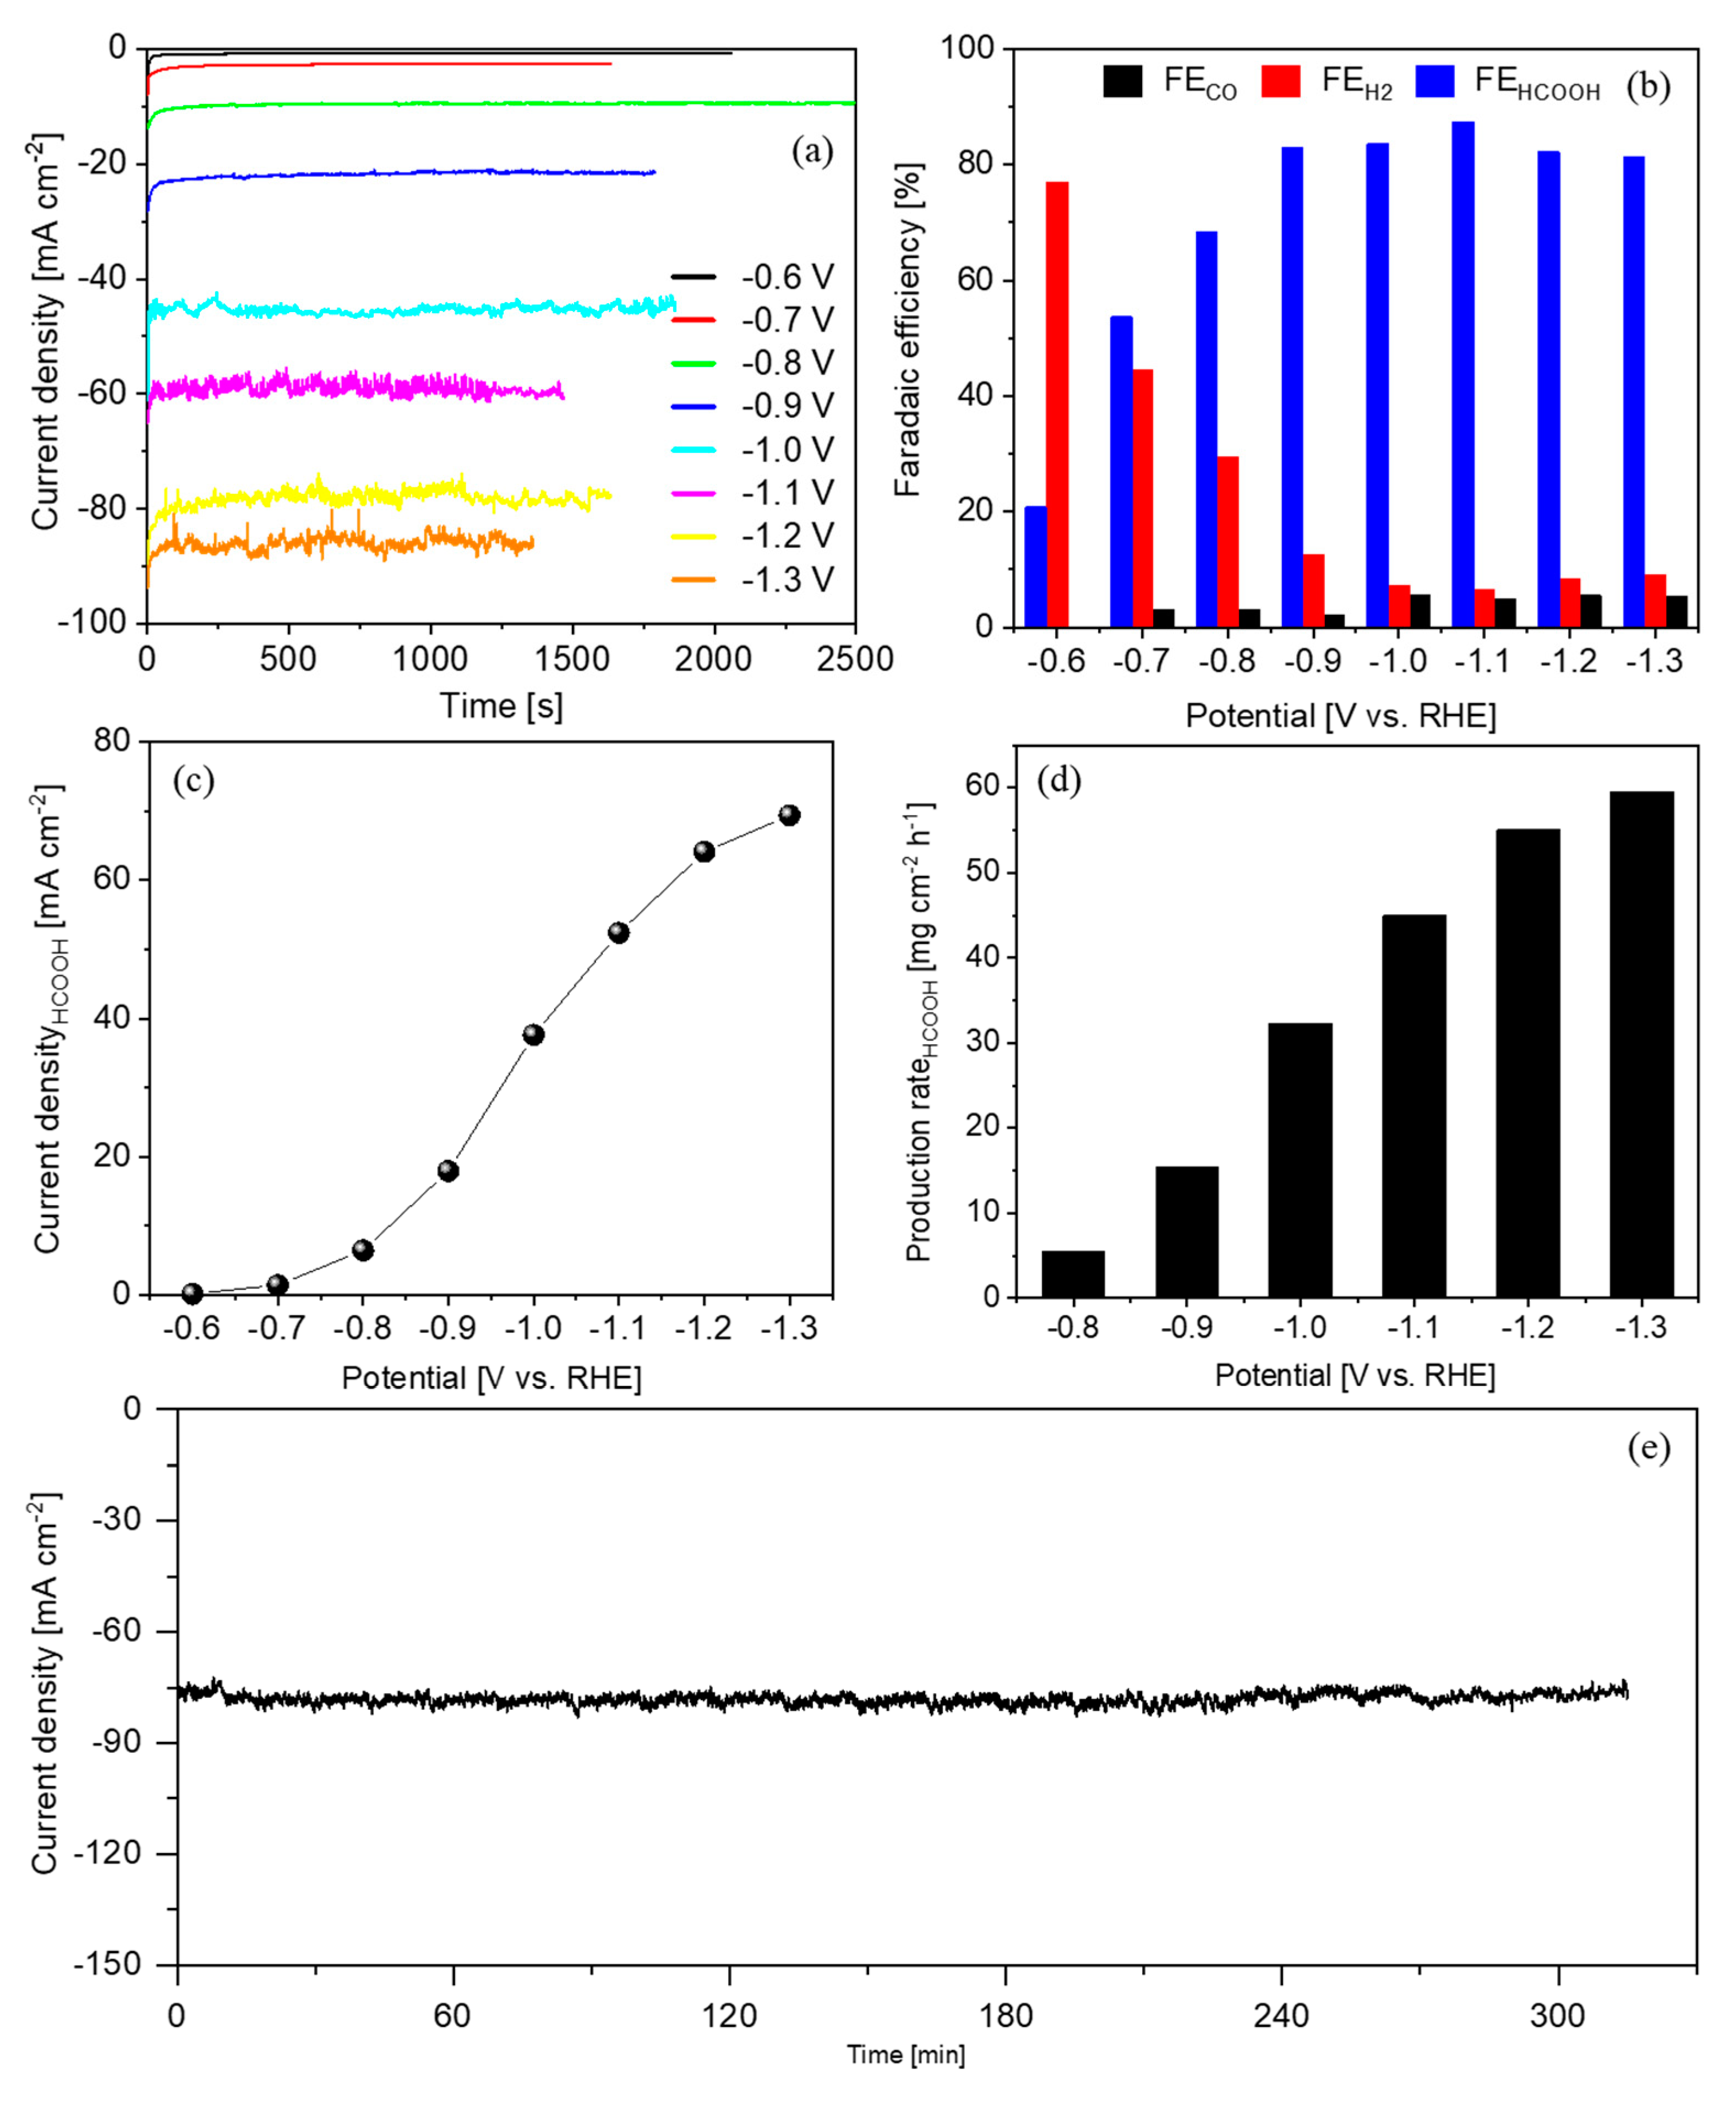
3.2. Electrochemical Properties of the Biochar–BiOx Electrode toward the CO2RR

In order to study the electrocatalytic performance of the biochar–BiOx electrode toward the CO2RR, CV was carried out in a N2-purged or CO2-saturated 2.0 M KHCO3 aqueous solution. N2 or CO2 gas was bubbled through the electrolyte for 30 min before the measurements and the same gas flux was maintained during the measurements. Only the HER occurred in the N2 atmosphere at negative potentials, while both the HER and CO2RR happened in the CO2 atmosphere. Hence, it is widely believed that the comparison of the geometric current densities in N2 and CO2 electrolytes could be suggestive for electrode selectivity between the HER and CO2RR [11,43,44]. An electrode that generates a higher geometric current density in the CO2 electrolyte than in the N2 one is usually more selective for the CO2RR with respect to the HER at the corresponding potential. As shown in Figure 5, the current density in the CO2 electrolyte was significantly higher than that in the N2 one at potentials more negative than -0.7 V. This outcome indicated that the biochar–BiOx electrode could have high activity and good selectivity for the CO2RR at negative potentials (<−0.7 V).
To verify the performance of the biochar–Bi2O3 electrode, CA tests were firstly carried out in 0.1 M KHCO3 electrolyte at different potentials in a customized three-electrode, two-compartment batch cell. An electrode composed of bare biochar was also tested for comparison. As shown in Figure 6a, the biochar showed no selectivity toward the CO2RR, since the faradaic efficiency for the H2 formation was almost 100%. In contrast, the biochar-Bi2O3 electrode showed significant selectivity for the CO and HCOOH formation, especially at higher overpotentials (Figure 6b). However, the current density for HCOOH formation was rather low, probably due to the high resistance of the diluted buffer electrolyte.
Hence, CA tests were further performed on the biochar–Bi2O3 electrode in a customized flow cell at potentials ranging from −0.6 V to −1.3 V in more concentrated electrolyte (2.0 M KHCO3). The i-t curves at different potentials are shown in Figure 7a. The current density increased as the overpotential increased, which is in agreement with the CV result in the same electrolyte. The major products and their FE values are shown in Figure 7b. H2 was the main product at −0.6 V and its production dramatically reduced at −0.7 V. As the electrode was polarized at more negative potentials, H2 became a minor product and HCOOH became the predominant product, while the FECO remained less than 6% in all the investigated potential range. The selectivity for the CO2RR significantly outcompeted that for the HER at potentials more negatively than −0.7 V, which is consistent with the CV result. It is worth noting that the FE for CO and HCOOH production occupied more than 90% from −1.0 V to −1.3 V. As the main product, HCOOH reached good FE values (>80%) in a wide potential range from −0.9 V to −1.3 V, with a maximum of 87% at −1.1 V.
The partial current density for HCOOH formation as a function of potential is displayed in Figure 7c. The HCOOH production rate became significant at −0.8 V, which was 5.5 mg cm−2 h−1. It increased progressively with enhancing the driving force and ended with 59.6 mg cm−2 h−1 at −1.3 V (Figure 7d). The biochar–BiOx electrode also showed good stability during a 5-h test at a current density of 77.5 mA cm−2 (Figure 7e). Concisely, the biochar–Bi2O3 electrode showed good performance for the CO2RR to HCOOH for both selectivity and production rate, which was in line with the best results reported on the HCOOH-selective materials as listed in Table 2.

4. Conclusions

A new material composed of BiOx and biochar was synthesized through an easy and scalable route. The Bi species were metallic Bi and Bi2O3, which comprised about 87.1 wt.% of the composite. The BiOx particles were on the nanoscale and uniformly decorated on the surface of the biochar. By careful electrochemical characterizations and product analyses, the biochar–BiOx material is demonstrated to be a promising candidate for converting CO2 to HCOOH, showing a maximum faradaic efficiency of 87% and the highest current density of 70 mA cm−2 for HCOOH production. In addition to its low price and eco-friendly nature, this proposed BiOx-biochar catalyst could be produced on a mass scale via the simple route and be used in the electrosynthesis of HCOOH from CO2 on an industrial scale.

Author Contributions

J.Z., P.J. and C.F.P. contributed to the conceptualization. C.F.P. contributed to the resources. P.J. and M.B. contributed to the synthesis of the material. M.A.O.L. contributed to the TGA–IR analysis and the fabrication of electrodes. J.Z. contributed to the XRD measurement and the CO2 electrolysis experiments. M.A.F. contributed to the HPLC analysis. D.S. contributed the cyclic voltammetry experiment. All authors contributed to the manuscript composition. All authors have read and agreed to the published version of the manuscript.

Funding

This research did not receive any specific grant from funding agencies in the public, commercial or not-for-profit sectors.

Institutional Review Board Statement

Not applicable.

Informed Consent Statement

Not applicable.

Data Availability Statement

Data is contained within the article.

Acknowledgments

Mauro Raimondo is acknowledged for FESEM–EDX analyses.

Conflicts of Interest

The authors declare no conflict of interest.

References

  1. Guzmán, H.; Salomone, F.; Batuecas, E.; Tommasi, T.; Russo, N.; Bensaid, S.; Hernández, S. How to make sustainable CO2 conversion to Methanol: Thermocatalytic versus electrocatalytic technology. Chem. Eng. J. 2020, in press. [Google Scholar] [CrossRef]
  2. François, J.M.; Lachaux, C.; Morin, N. Synthetic Biology Applied to Carbon Conservative and Carbon Dioxide Recycling Pathways. Front. Bioeng. Biotechnol. 2020, 7. [Google Scholar] [CrossRef]
  3. Bushuyev, O.S.; De Luna, P.; Dinh, C.T.; Tao, L.; Saur, G.; van de Lagemaat, J.; Kelley, S.O.; Sargent, E.H. What Should We Make with CO2 and How Can We Make It? Joule 2018, 2, 825–832. [Google Scholar] [CrossRef] [Green Version]
  4. Zeng, J.; Rino, T.; Bejtka, K.; Castellino, M.; Sacco, A.; Farkhondehfal, M.A.; Chiodoni, A.; Drago, F.; Pirri, C.F. Coupled Copper–Zinc Catalysts for Electrochemical Reduction of Carbon Dioxide. ChemSusChem 2020, 13, 4128–4139. [Google Scholar] [CrossRef]
  5. Qiao, J.; Liu, Y.; Hong, F.; Zhang, J. A review of catalysts for the electroreduction of carbon dioxide to produce low-carbon fuels. Chem. Soc. Rev. 2014, 43, 631–675. [Google Scholar] [CrossRef] [PubMed]
  6. Zeng, J.; Bejtka, K.; Di Martino, G.; Sacco, A.; Castellino, M.; Fiorentin, M.R.; Risplendi, F.; Farkhondehfal, M.A.; Hernández, S.; Cicero, G.; et al. Microwave-Assisted Synthesis of Copper-Based Electrocatalysts for Converting Carbon Dioxide to Tunable Syngas. ChemElectroChem 2020, 7, 229–238. [Google Scholar] [CrossRef] [Green Version]
  7. Liu, K.; Smith, W.A.; Burdyny, T. Introductory Guide to Assembling and Operating Gas Diffusion Electrodes for Electrochemical CO2 Reduction. ACS Energy Lett. 2019, 4, 639–643. [Google Scholar] [CrossRef] [Green Version]
  8. Burdyny, T.; Smith, W.A. CO2 reduction on gas-diffusion electrodes and why catalytic performance must be assessed at commercially-relevant conditions. Energy Environ. Sci. 2019, 12, 1442–1453. [Google Scholar] [CrossRef] [Green Version]
  9. Zeng, J.; Francia, C.; Dumitrescu, M.A.; Videla, A.H.A.M.; Ijeri, V.S.; Specchia, S.; Spinelli, P. Electrochemical Performance of Pt-Based Catalysts Supported on Different Ordered Mesoporous Carbons (Pt/OMCs) for Oxygen Reduction Reaction. Ind. Eng. Chem. Res. 2012, 51, 7500–7509. [Google Scholar] [CrossRef]
  10. Guzmán, H.; Farkhondehfal, M.A.; Tolod, K.R.; Hernández, S.; Russo, N. Photo/electrocatalytic hydrogen exploitation for CO2 reduction toward solar fuels production. Solar Hydrog. Prod. 2019, 365–418. [Google Scholar] [CrossRef]
  11. Zeng, J.; Bejtka, K.; Ju, W.; Castellino, M.; Chiodoni, A.; Sacco, A.; Farkhondehfal, M.A.; Hernández, S.; Rentsch, D.; Battaglia, C.; et al. Advanced Cu-Sn foam for selectively converting CO2 to CO in aqueous solution. Appl. Catal. B: Environ. 2018, 236, 475–482. [Google Scholar] [CrossRef]
  12. Zhao, G.-X.; Huang, X.; Wang, X.; Wang, X.-K. Progress in catalyst exploration for heterogeneous CO2 reduction and utilization: A critical review. J. Mater. Chem. A 2017, 5, 21625–21649. [Google Scholar] [CrossRef]
  13. Xie, H.; Wang, T.; Liang, J.; Li, Q.; Sun, S. Cu-based nanocatalysts for electrochemical reduction of CO2. Nano Today 2018, 21, 41–54. [Google Scholar] [CrossRef]
  14. Yu, X.; Pickup, P.G. Recent advances in direct formic acid fuel cells (DFAFC). J. Power Sources 2008, 182, 124–132. [Google Scholar] [CrossRef]
  15. Eppinger, J.; Huang, K.-W. Formic Acid as a Hydrogen Energy Carrier. ACS Energy Lett. 2017, 2, 188–195. [Google Scholar] [CrossRef] [Green Version]
  16. Verma, S.; Kim, B.; Jhong, H.-R.M.; Ma, S.; Kenis, P.J.A. A Gross-Margin Model for Defining Technoeconomic Benchmarks in the Electroreduction of CO2. ChemSusChem 2016, 9, 1972–1979. [Google Scholar] [CrossRef]
  17. Hori, Y.; Wakebe, H.; Tsukamoto, T.; Koga, O. Electrocatalytic process of CO selectivity in electrochemical reduction of CO2 at metal electrodes in aqueous media. Electrochimica Acta 1994, 39, 1833–1839. [Google Scholar] [CrossRef]
  18. Zhao, S.; Li, S.; Guo, T.; Zhang, S.; Wang, J.; Wu, Y.; Chen, Y. Advances in Sn-Based Catalysts for Electrochemical CO2 Reduction. Nano-Micro Lett. 2019, 11, 62. [Google Scholar] [CrossRef] [Green Version]
  19. Zhang, S.; Kang, P.; Meyer, T.J. Nanostructured Tin Catalysts for Selective Electrochemical Reduction of Carbon Dioxide to Formate. J. Am. Chem. Soc. 2014, 136, 1734–1737. [Google Scholar] [CrossRef]
  20. Bejtka, K.; Zeng, J.; Sacco, A.; Castellino, M.; Hernández, S.; Farkhondehfal, M.A.; Savino, U.; Ansaloni, S.; Pirri, C.F.; Chiodoni, A. Chainlike Mesoporous SnO2 as a Well-Performing Catalyst for Electrochemical CO2 Reduction. ACS Appl. Energy Mater. 2019, 2, 3081–3091. [Google Scholar] [CrossRef] [Green Version]
  21. Li, F.; Chen, L.; Xue, M.; Williams, T.; Zhang, Y.; MacFarlane, D.R.; Zhang, J. Towards a better Sn: Efficient electrocatalytic reduction of CO2 to formate by Sn/SnS2 derived from SnS2 nanosheets. Nano Energy 2017, 31, 270–277. [Google Scholar] [CrossRef]
  22. Choi, S.Y.; Jeong, S.K.; Kim, H.J.; Baek, I.-H.; Park, K.T. Electrochemical Reduction of Carbon Dioxide to Formate on Tin–Lead Alloys. ACS Sustain. Chem. Eng. 2016, 4, 1311–1318. [Google Scholar] [CrossRef]
  23. Min, X.; Kanan, M.W. Pd-Catalyzed Electrohydrogenation of Carbon Dioxide to Formate: High Mass Activity at Low Overpotential and Identification of the Deactivation Pathway. J. Am. Chem. Soc. 2015, 137, 4701–4708. [Google Scholar] [CrossRef]
  24. He, W.; Liberman, I.; Rozenberg, I.; Ifraemov, R.; Hod, I. Electrochemically Driven Cation Exchange Enables the Rational Design of Active CO2 Reduction Electrocatalysts. Angew. Chem. Int. Ed. 2020, 59, 8262–8269. [Google Scholar] [CrossRef]
  25. Deng, Y.; Huang, Y.; Ren, D.; Handoko, A.D.; Seh, Z.W.; Hirunsit, P.; Yeo, B.S. On the Role of Sulfur for the Selective Electrochemical Reduction of CO2 to Formate on CuSx Catalysts. ACS Appl. Mater. Interfaces 2018, 10, 28572–28581. [Google Scholar] [CrossRef]
  26. Gattrell, M.; Gupta, N.; Co, A. Electrochemical reduction of CO2 to hydrocarbons to store renewable electrical energy and upgrade biogas. Energy Convers. Manag. 2007, 48, 1255–1265. [Google Scholar] [CrossRef]
  27. Shinagawa, T.; Larrazábal, G.O.; Martín, A.J.; Krumeich, F.; Pérez-Ramírez, J. Sulfur-Modified Copper Catalysts for the Electrochemical Reduction of Carbon Dioxide to Formate. ACS Catal. 2018, 8, 837–844. [Google Scholar] [CrossRef] [Green Version]
  28. De Arquer, F.P.G.; Bushuyev, O.S.; De Luna, P.; Dinh, C.-T.; Seifitokaldani, A.; Saidaminov, M.I.; Tan, C.-S.; Na Quan, L.; Proppe, A.; Kibria, G.; et al. 2D Metal Oxyhalide-Derived Catalysts for Efficient CO2 Electroreduction. Adv. Mater. 2018, 30, e1802858. [Google Scholar] [CrossRef] [PubMed]
  29. He, S.; Ni, F.; Ji, Y.; Wang, L.; Wen, Y.; Bai, H.; Liu, G.; Zhang, Y.; Li, Y.; Zhang, B.; et al. The p-Orbital Delocalization of Main-Group Metals to Boost CO2 Electroreduction. Angew. Chem. Int. Ed. 2018, 57, 16114–16119. [Google Scholar] [CrossRef]
  30. Yang, X.; Deng, P.; Liu, D.; Zhao, S.; Li, D.; Wu, H.; Ma, Y.; Xia, B.Y.; Li, M.; Xiao, C.; et al. Partial sulfuration-induced defect and interface tailoring on bismuth oxide for promoting electrocatalytic CO2 reduction. J. Mater. Chem. A 2020, 8, 2472–2480. [Google Scholar] [CrossRef]
  31. Koh, J.H.; Won, D.H.; Eom, T.; Kim, N.-K.; Jung, K.D.; Kim, H.; Hwang, Y.J.; Min, B.K. Facile CO2 Electro-Reduction to Formate via Oxygen Bidentate Intermediate Stabilized by High-Index Planes of Bi Dendrite Catalyst. ACS Catal. 2017, 7, 5071–5077. [Google Scholar] [CrossRef]
  32. Miao, C.-C.; Yuan, G.-Q. Morphology-Controlled Bi2O3 Nanoparticles as Catalysts for Selective Electrochemical Reduction of CO2 to Formate. ChemElectroChem 2018, 5, 3741–3747. [Google Scholar] [CrossRef]
  33. Liu, S.; Lu, X.F.; Xiao, J.; Wang, X.; Lou, X.W. Bi2O3 Nanosheets Grown on Multi-Channel Carbon Matrix to Catalyze Efficient CO2 Electroreduction to HCOOH. Angew. Chem. Int. Ed. 2019, 58, 13828–13833. [Google Scholar] [CrossRef] [PubMed]
  34. Deng, P.; Wang, H.; Qi, R.; Zhu, J.; Chen, S.; Yang, F.; Zhou, L.; Qi, K.; Liu, H.; Xia, B.Y. Bismuth Oxides with Enhanced Bismuth–Oxygen Structure for Efficient Electrochemical Reduction of Carbon Dioxide to Formate. ACS Catal. 2019, 10, 743–750. [Google Scholar] [CrossRef]
  35. Díaz-Sainz, G.; Alvarez-Guerra, M.; Solla-Gullón, J.; García-Cruz, L.; Montiel, V.; Irabien, A. CO2 electroreduction to formate: Continuous single-pass operation in a filter-press reactor at high current densities using Bi gas diffusion electrodes. J. CO2 Util. 2019, 34, 12–19. [Google Scholar] [CrossRef]
  36. Jagdale, P.; Ziegler, D.; Rovere, M.; Tulliani, J.M.; Tagliaferro, A.A. Waste Coffee Ground Biochar: A Material for Humidity Sensors. Sensors 2019, 19, 801. [Google Scholar] [CrossRef] [Green Version]
  37. Arrigo, R.; Jagdale, P.; Bartoli, M.; Tagliaferro, A.; Malucelli, G. Structure–Property Relationships in Polyethylene-Based Composites Filled with Biochar Derived from Waste Coffee Grounds. Polymers 2019, 11, 1336. [Google Scholar] [CrossRef] [PubMed] [Green Version]
  38. Carbon Monoxide Infrared Spectrum, (n.d.). Available online: https://spectrabase.com/spectrum/Big2BLmUPf2 (accessed on 16 March 2021).
  39. Carbon Dioxide Infrared Spectrum, (n.d.). Available online: https://spectrabase.com/spectrum/G4CBuKNSKtQ (accessed on 16 March 2021).
  40. Water Infrared Spectrum, (n.d.). Available online: https://spectrabase.com/spectrum/BnpcCEB1yUv (accessed on 16 March 2021).
  41. Gadhi, T.A.; Hernández, S.; Castellino, M.; Jagdale, P.; Husak, T.; Hernández-Gordillo, A.; Tagliaferro, A.; Russo, N. Insights on the role of β-Bi2O3/Bi5O7NO3 heterostructures synthesized by a scalable solid-state method for the sunlight-driven photocatalytic degradation of dyes. Catal. Today 2019, 321–322, 135–145. [Google Scholar] [CrossRef]
  42. Roumanille, P.; Baco-Carles, V.; Bonningue, C.; Gougeon, M.; Duployer, B.; Monfraix, P.; Le Trong, H.; Tailhades, P. Bi2(C2O4)3·7H2O and Bi(C2O4)OH Oxalates Thermal Decomposition Revisited. Formation of Nanoparticles with a Lower Melting Point than Bulk Bismuth. Inorg. Chem. 2017, 56, 9486–9496. [Google Scholar] [CrossRef] [PubMed] [Green Version]
  43. Su, X.; Sun, Y.; Jin, L.; Zhang, L.; Yang, Y.; Kerns, P.; Liu, B.; Li, S.; He, J. Hierarchically porous Cu/Zn bimetallic catalysts for highly selective CO2 electroreduction to liquid C2 products. Appl. Catal. B Environ. 2020, 269, 118800. [Google Scholar] [CrossRef]
  44. Ju, W.; Bagger, A.; Hao, G.-P.; Varela, A.S.; Sinev, I.; Bon, V.; Cuenya, B.R.; Kaskel, S.; Rossmeisl, J.; Strasser, P. Understanding activity and selectivity of metal-nitrogen-doped carbon catalysts for electrochemical reduction of CO2. Nat. Commun. 2017, 8, 944. [Google Scholar] [CrossRef] [PubMed]
  45. Luc, W.; Collins, C.; Wang, S.; Xin, H.; He, K.; Kang, Y.; Jiao, F. Ag–Sn Bimetallic Catalyst with a Core–Shell Structure for CO2 Reduction. J. Am. Chem. Soc. 2017, 139, 1885–1893. [Google Scholar] [CrossRef] [PubMed]
  46. Tao, Z.; Wu, Z.; Yuan, X.; Wu, Y.; Wang, H. Copper–Gold Interactions Enhancing Formate Production from Electrochemical CO2 Reduction. ACS Catal. 2019, 9, 10894–10898. [Google Scholar] [CrossRef]
Scheme 1. Scheme of the electrochemical cells (a) batch cell and (b) semi-flow cell.
Crystals 11 00363 sch001
Figure 1. FESEM images of the biochar–BiOx sample: (a) at low magnification, (b) pore channels at high magnification, (c) pore walls at high magnification and (d) surface at high magnification.
Crystals 11 00363 g001
Figure 2. Biochar–BiOx composite elemental analysis by EDS (a) targeted surface, (be) mapping and (f) scanning.
Crystals 11 00363 g002
Figure 3. XRD pattern of biochar–BiOx.
Crystals 11 00363 g003
Figure 4. TGA-IR data of biochar–BiOx. (a) TGA and first derivative, (b) IR spectra of developed gases at 349 °C and (c) TGA of bare biochar.
Crystals 11 00363 g004
Figure 5. Cyclic voltammograms of the biochar-Bi2O3 electrode in CO2- and N2-saturated 2.0 M KHCO3 electrolyte.
Crystals 11 00363 g005
Figure 6. CO2RR on the electrodes in 0.1 M KHCO3 electrolyte in a batch cell: (a) faradaic efficiency of the main product on the bare biochar electrode and (b) faradaic efficiency of the main products and partial current density for HCOOH formation on the biochar-Bi2O3 electrode.
Crystals 11 00363 g006
Figure 7. CO2RR on the biochar–Bi2O3 electrode in 2.0 M KHCO3 electrolyte: (a) chronoamperometric tests at various potentials, (b) faradaic efficiency of the main products, (c) partial current density for HCOOH formation, (d) the production rate of HCOOH and (e) long-term test at −1.2 V.
Crystals 11 00363 g007
Table 1. Weigh loss percentages for biochar and biochar–BiOx samples.
MaterialsWeight Loss (%) aBiOx (wt.%) bBiochar (wt.%) cBiOx (wt.%) d
biochar87.4-100-
biochar–BiOx10.485.314.760.1–67%
a Weight loss (wt.loss) determined from TGA. b BiOx weight percentage and c biochar weight percentage in the biochar–BiOx sample determined from the equation: (a) wt.loss BiOx × wt.% BiOx + 2.5% × (wt.% BiOx + wt.% biochar) + wt.loss biochar × wt.% biochar = wt.loss (biochar–BiOx) × (wt.% BiOx + wt.% biochar) and (b) wt.% BiOx + wt.% biochar = 100%. The weight loss of BiOx was considered 0% and the 2.5% × (wt.% BiOx + wt.% biochar) was due to the weight increase attributed to BiOx oxidation. d BiOx weight percentage calculated from the precursors. If x = 0 in BiOx and the Bi specie is metallic, the percentage of BiOx is 60.1%; if x = 1.5 in BiOx and the Bi specie is Bi2O3, the percentage of BiOx is 67%.
Table 2. Comparison of different HCOOH-selective electrocatalysts in liquid-phase CO2 electrolysis.
ElectrocatalystElectrolytePotential
(V vs. RHE)
Current Density (-mA/cm2)FE (%)Reference
Biochar–BiOx2.0 M KHCO3−0.9018.0 83This work
Biochar–BiOx2.0 M KHCO3−1.1052.487This work
Bi Dendrite0.5 M KHCO3−0.742.789[31]
Bi Dendrite0.5 M KHCO3−1.1441.038[31]
Bi2O3 Nanoparticles0.5 M NaHCO3−1.00-82[32]
Bi2O3 Nanoparticles0.5 M NaHCO3−1.2020.091[32]
Bi2O3 Nanosheets0.1 M KHCO3−0.861.965[33]
Bi2O3 Nanosheets0.1 M KHCO3−1.067.897[33]
Bi2O30.5 M KHCO3−0.908.091[34]
Bi2O30.5 M KHCO3−1.10-72[34]
nano-SnO2/C0.1 M NaHCO3−1.16 6.286[19]
SnO20.1 M KHCO3−1.0611.082[20]
Cu2S0.1 M KHCO3−0.9019.087[24]
CuSx0.1 M KHCO3−0.8511.975[25]
Cu1.81S0.5 M KHCO3−0.673.882[26]
S-modified Cu0.1 M KHCO3−0.8020.080[27]
SnS2/RGO0.5 M NaHCO3−1.40 (vs. Ag/AgCl)13.984[21]
Bi2S3–Bi2O3@rGO0.1 M KHCO3−0.903.890[30]
Sn56.3Pb43.70.5 M KHCO3−2.00 (vs. Ag/AgCl)45.780[22]
AgSn/SnOx0.5 M NaHCO3−0.8016.080[45]
Cu-Au0.5M KHCO3−0.6010.281[46]
Publisher’s Note: MDPI stays neutral with regard to jurisdictional claims in published maps and institutional affiliations.

