
Study on Mechanism of Glass Molding Process for Fingerprint Lock Glass Plates
by
 ,
,
Wuyi Ming
1,*, 
Haojie Jia
1,
Heyuan Huang
2,
Guojun Zhang
3,
Kun Liu
1,
Ya Lu
2,3,* and
Chen Cao
1 1
Department of Electromechanical Science and Engineering, Zhengzhou University of Light Industry, Zhengzhou 450002, China
2
Guangdong Provincial Key Laboratory of Manufacturing Equipment Digitization, Guangdong HUST Industrial Technology Research Institute, Dongguan 523808, China
3
State Key Lab of Digital Manufacturing Equipment Technology, School of Mechanical Science and Engineering, Huazhong University of Science Technology, Wuhan 430074, China
*
Authors to whom correspondence should be addressed.
Crystals 2021, 11(4), 394; https://0-doi-org.brum.beds.ac.uk/10.3390/cryst11040394
Submission received: 9 March 2021
/
Revised: 26 March 2021
/
Accepted: 31 March 2021
/
Published: 8 April 2021
(This article belongs to the Special Issue Non-traditional Machining of Crystal Materials)
Abstract
:Curved glass is widely used in 3C industry, and the market demand is increasing gradually. Glass molding process (GMP) is a high-precision, high-efficiency 3D glass touch panel processing technology. In this study, the processing parameters of fingerprint lock glass panels were deeply analyzed. This paper first introduces the molding process of the glass panel, discusses the glass forming device, and explains the heat conduction principle of the glass. Firstly, it introduces the forming process of the glass panel, discusses the glass forming device, and explains the heat conduction principle of the glass. Secondly, the simulation model of a fingerprint lock glass plate was simulated by MSC. Marc software. The stress relaxation model and structure relaxation model are used in the model, and the heat transfer characteristics of glass mold are combined to accurately predict the forming process of glass components. The effects of molding temperature, heating rate, holding time, molding pressure, cooling rate and other process parameters on product quality characteristics (residual stress and shape deviation) were analyzed through simulation experiments. The results show that, in a certain range, the residual stress is inversely proportional to the bending temperature and heating rate, and is directly proportional to the cooling rate, while the shape deviation decreases with the increase of temperature and heating rate. When the cooling rate decreases, the shape deviation first decreases and then increases. Furthermore, a verification experiment is designed to verify the reliability of the simulation results by measuring and calculating the surface roughness of the formed products.
1. Introduction
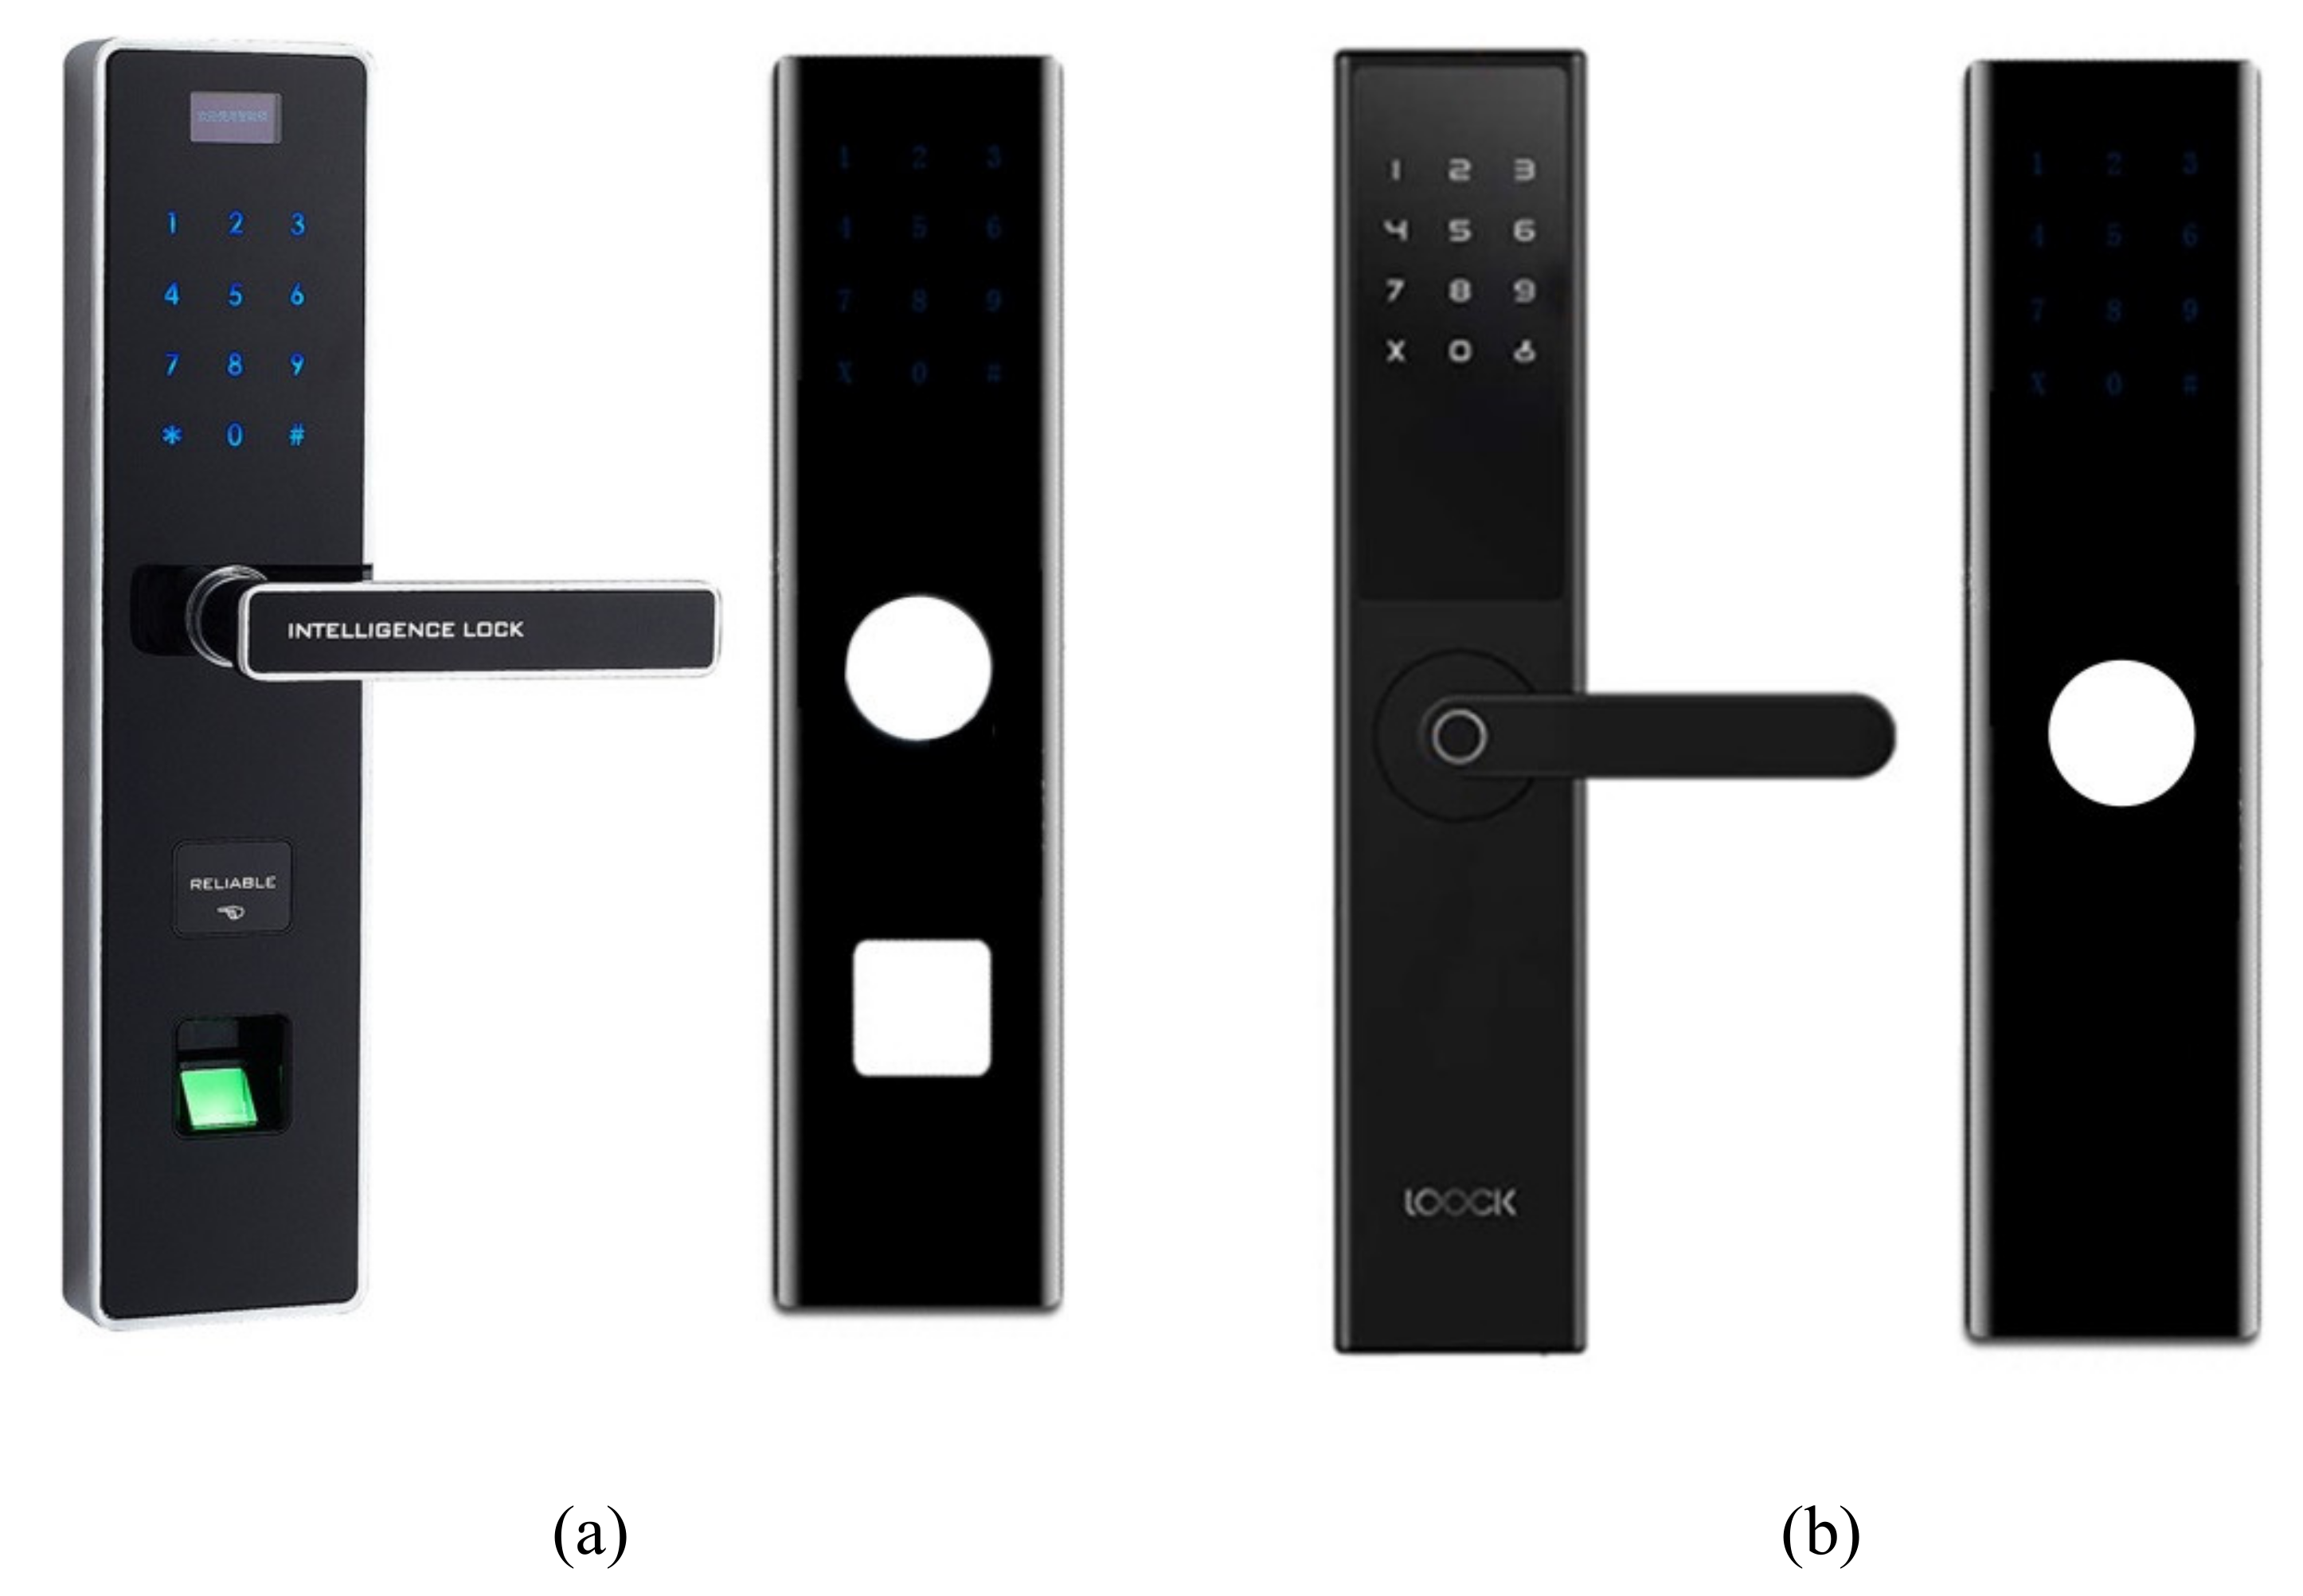
In recent years, the consumption of 3C products has increased significantly. With the development of the Internet of Things and the advent of 5G, the combination of 3C products and the Internet of Things industry promotes the birth of a smart home. A smart home is widely accepted by the public because of its practical convenience, safety, reliability and powerful functions, such as intelligent security series, intelligent switch series and intelligent lighting series. According to the development and trends of the intelligent door lock market, intelligent security is the most rigid demand product in a stylish home, and as the first security line of every place, an intelligent door lock has become the focus of public attention, from the earliest mechanical lock, to the advanced electronic lock and intelligent lock, and then to the new generation of intelligent lock represented by fingerprint identification, namely the fingerprint lock. The development of science and technology and its industrialization permeate also triggered the development of the lock industry. Appearance innovation will also become an important factor in market competition. Due to high transparency, good touch and extraordinary success rate of fingerprint identification, the glass fingerprint touch plate is widely used in the manufacture of intelligent door locks. Most intelligent door locks are equipped with a 3D glass fingerprint touch plate, as showed in Figure 1. In addition, fingerprint locks also face the problems of inconsistent fingerprint inspection standards, fingerprint forgery and reliability of theory and technology [1].
The traditional manufacturing technology of optical components includes magneto-optical polishing, ion beam polishing and single point diamond turning [2]. Due to the high-precision and high quality requirements of modern fingerprint locks for touch plate glass, the traditional manufacturing technology has proved difficult to adapt to the current market demand. The glass molding process (GMP) is considered to be a novel method and technology different from traditional processing. It can produce optical microstructure of glass by copying the shape of the mold onto the heated glass preform without further processing. This method has attracted extensive attention of many scholars because of its scientific, efficiency and environmental protection [3,4,5]. In the GMP, the glass preform is pressed and deformed by a high-precision mold with predetermined design shape under appropriate temperature and load, to quickly obtain glass products with the final product shape and optical function.
The GMP includes three stages: heating and soaking, forming and annealing and cooling. In the heating and soaking stage, inert gas, such as nitrogen (N2), is first introduced into the mold cavity to purify the air in the mold cavity by flowing. Then the glass preform is given to the lower mold and heated to the molding temperature in a high-temperature furnace. After soaking for a certain period time, the thermal balance between the mold and the glass is achieved. In the pressing stage, a specified load is applied to the upper surface of the upper die to make the upper die move down slowly to obtain the desired glass shape. In the annealing and cooling stage, the mold and glass parts are annealed slowly, while maintaining a slight pressure load to release the internal stress. Finally, mold and glass components are rapidly cooled to room temperature, and the glass products are obtained after demolding [6,7,8].
Glass is just an amorphous material, and its thermal expansion coefficient, viscoelasticity and structural relaxation change nonlinearly with temperature and time. Therefore, it is sometimes difficult to control the geometric accuracy of glass components at high temperatures [9,10]. Jain et al. [11] measured the temperature dependence of elastic modulus of two glasses by Brillouin light scattering technique. The results demonstrate that the elastic modulus decreases with the increase of temperature, but it increases obviously near the transition temperature. Ming et al. [12] carried out electrochemical hybrid machining of glass crystal, which combined the advantages of electrochemical machining and EDM (Electrical Discharge Machining), and the experimental results effectively improved the machining accuracy of glass. Yan et al. [13] proposed a two-step hot pressing process based on the nonlinear thermal expansion characteristics of glass and the dependence of specific heat and thermal conductivity of glass on temperature, and established the heat transfer model of glass. The modified Newtonian fluid model is used to simulate the high temperature material flow of glass, and load change during the pressing process is accurately predicted. Foreign scholars Anya et al. [14] have proved the relationship between structural relaxation and temperature change of glass materials through experiments. Tao et al. [15] studied the effect of thermal expansion coefficient and heat capacity on residual stress of BK7 molded glass lens, and forecast their influence on residual stress by using three thermal expansion coefficients and two heat capacity methods. The results demonstrate that the influence of residual stress on the coefficient of thermal expansion and heat capacity is quite different. The maximum radial tensile stress is different, and in the radial stress, the heat capacity changing with temperature is 20% larger than the constant heat capacity. With the glass fingerprint touch plate becoming the mainstream of the display industry, the size shrinkage of glass after hot processing in the production process has become the main technical obstacle faced by glass fingerprint touch plate manufacturers. Kim et al. [16] developed a numerical method based on the structural relaxation model of the glass fingerprint touch plate to analyze the shrinkage changes during annealing and subsequent deposition. It is found that higher annealing temperature and longer annealing time can reduce the shrinkage during the deposition process, and decrease the difference between the virtual temperature and the deposition temperature at the end of annealing. Besides, the higher the deposition temperature is, the greater the shrinkage of the deposition process is and the faster the structural relaxation rate is.
To sum up, the GMP has obviously caused the research upsurge of domestic and foreign scholars, but most of its research results focus on the optimization of process parameters and the numerical analysis of glass material models in the process of product processing. The processing mechanism of glass product molding is rarely mentioned. In addition, in order to improve the production efficiency, glass multi-station bending machining technology (as shown in Figure 2) is adopted, including 4 heating stations, 3 molding stations and 4 annealing cooling stations. Therefore, this paper analyzes the processing mechanism of intelligent fingerprint lock glass fingerprint touch plates, and gives attention to the surface quality (residual stress, shape deviation) of glass products and the heat transfer characteristics in the direction of glass thickness in GMP. The processing performances include surface flatness, residual stress and heating. Firstly, MSC. Marc software is used to simulate the heat transfer characteristics along the thickness direction of the glass, as well as residual stress and surface shape deviation of the glass surface. Secondly, the processing mechanism is analyzed. Finally, the experiment of the glass multi-stations bending machine is compared and verified.
2. Basic Theory of Optical Glass Molding
2.1. Creep and Viscoelastic Properties of Glass Materials
The properties of glass will change significantly with the change of temperature. When the glass temperature is less than the transition temperature Tg, the glass is hard and brittle. At this time, the glass can be regarded as trustworthy, showing the characteristics of rigid plastic material. However, when the transition temperature is above Tg and the softening temperature is below softening point (SP), the glass shows significant viscoelastic characteristics [17,18]. Creep is a mechanical behavior in which the strain of viscoelastic materials increases gradually with time when submitted to a constant load. Its strain response shows the dual properties of the Newtonian fluid and solid viscoelastic property [19].
2.1.1. Viscoelastic Model and Stress Relaxation of Optical Glass
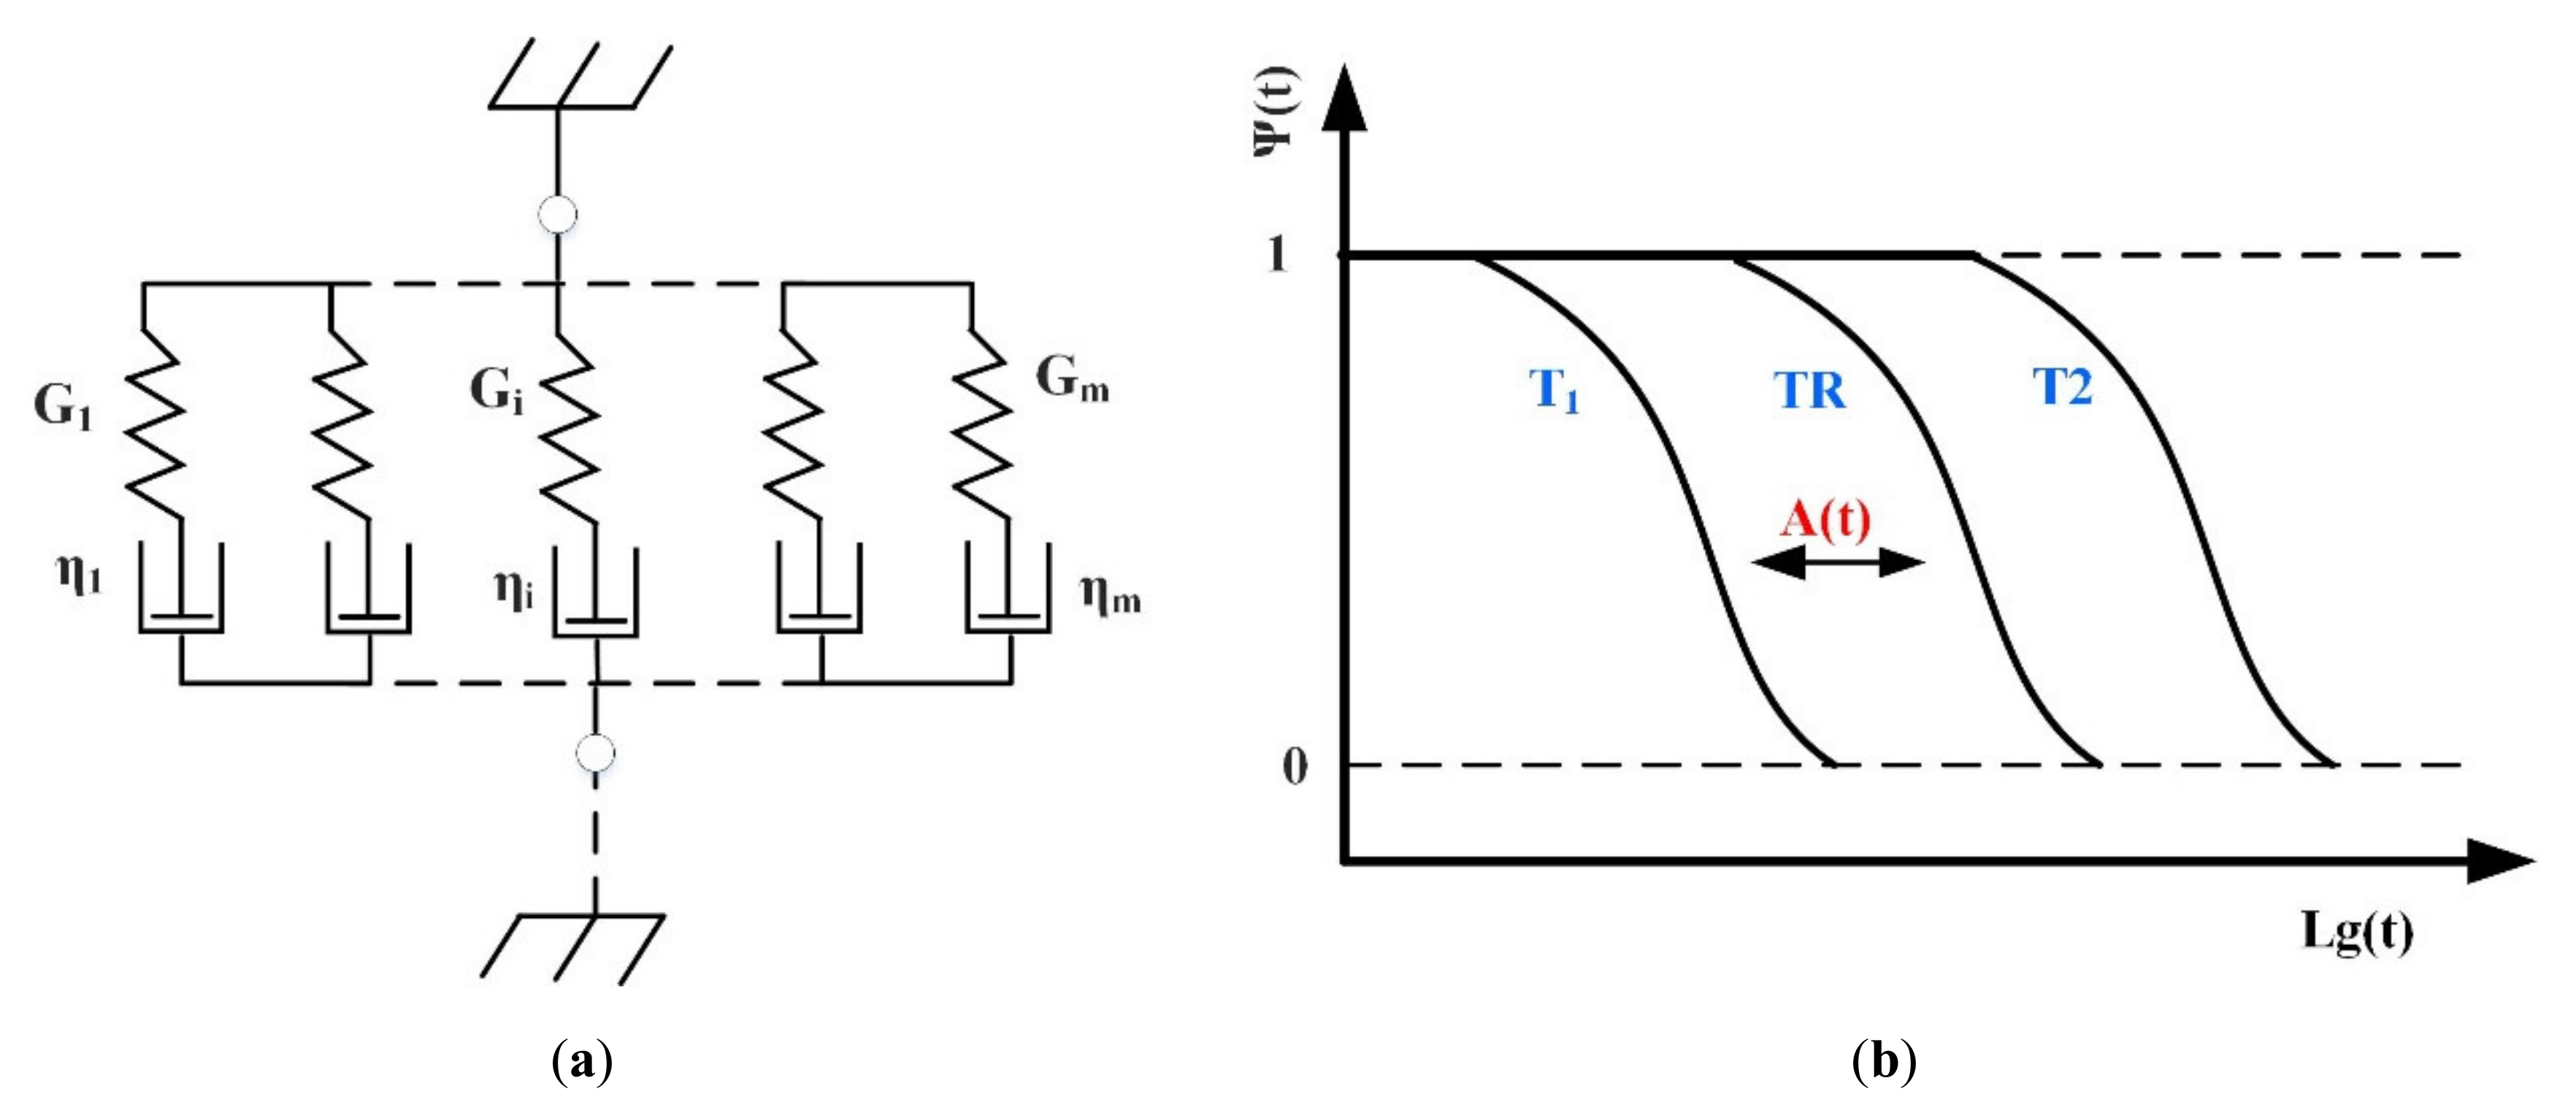
Viscoelastic models tend to describe the creep behavior of glass in engineering. Common viscoelastic models include the Maxwell model, Kelvin model, Boggs model and their corresponding generalized models. Zhou et al. [20,21] compared these models and found that the generalized Maxwell model may be the best model to describe the viscoelastic deformation and stress relaxation of glass at high temperature, and established five pairs of generalized Maxwell models to describe the deformation of glass in the pressing stage, and successfully simulated the pressing and annealing processes of GMP under different conditions. Yan [13] studied these models and considered that the generalized Maxwell model can fully express the viscous strain of glass fluid in softening state and elastic strain in caring state. The simple Maxwell model is a binary model composed of linear spring elements and linear viscous damper elements in series, while the generalized Maxwell model is comprised of n simple Maxwell models in parallel. The model uses multiple relaxation times to describe the viscoelastic characteristics of materials, which is closer to the ideal relaxation time curve of polymer viscoelasticity, as shown in Figure 3a [22], where is the viscosity of the damper and is the shear modulus of the spring. The constitutive equation of a viscoelastic body can be expressed by Equation (1) [23].
where and is stress and strain respectively, and is the elastic modulus of stress relaxation.
When the glass is heated in the transition temperature range, it is easy to produce deformation under the action of a constant load. This deformation is comprised of instantaneous deformation (elastic effect) and continuous deformation (viscous effect) which changes with time. However, the load will decay with the time of glass deformation. This phenomenon is known as called stress relaxation. The relaxation modulus with time can be expressed by Equation (2) [24].
where G is the instantaneous elastic shear modulus, is the weight coefficient of the relaxation function, and is the relaxation time.
2.1.2. Heat Flow Characteristics
The change of relaxation modulus of glass is closely linked to temperature. At low temperatures, the relaxation of glass is very slow. With the increase of temperature, the relaxation modulus of glass becomes very fast. The change of glass relaxation modulus with temperature in the same coordinate system at different temperatures is shown in Figure 4 [25,26,27]. The abscissa is time t, the ordinate is the ratio of stress relaxation modulus ψ (T), T1 and T2 are different stress relaxation temperatures and TR is the reference temperature. It can be observed in the figure that the stress relaxation curves at different temperatures move horizontally on the logarithmic time axis and the shape remains unchanged. This property of glass materials is called thermorheological simplicity (TRS). Generally, the stress relaxation modulus at other temperatures has to be calculated with the help of stress relaxation at the reference temperature. Therefore, it is necessary to introduce the transfer factor A(T), which is expressed as follows [28]:
where is the relaxation time at a certain reference temperature T, while the relaxation time at other temperatures can be obtained by . The temperature effect of transfer factor A(T) can be described by William-Landel-Ferry (WLF) equation as follows [29];
where C1 and C2 are constants of WLF equation, which are determined by the type of glass.
2.2. Structural Relaxation
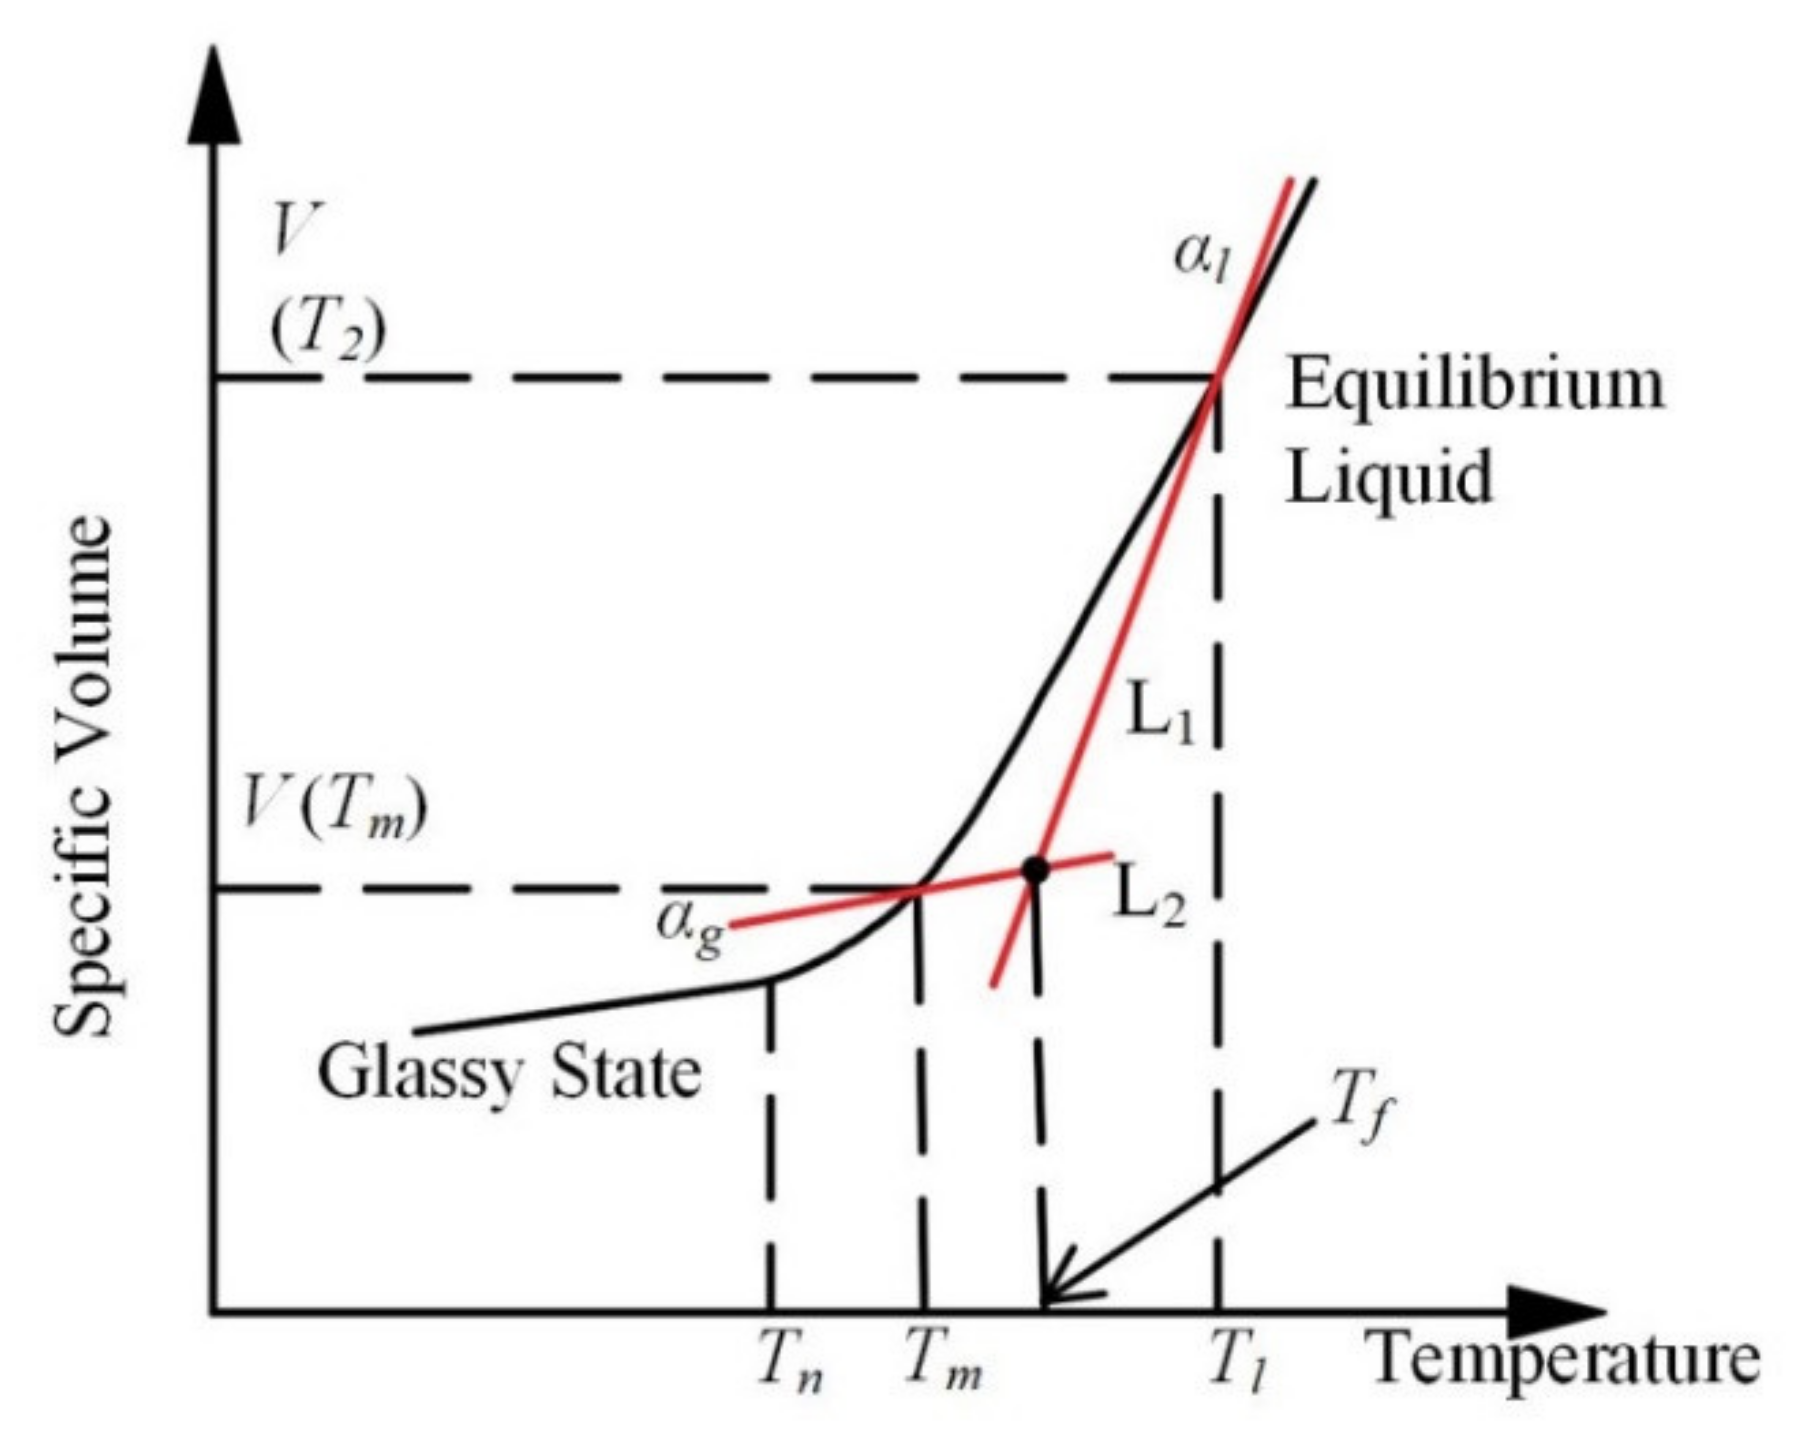
During the annealing and cooling process of GMP, the temperature applied to the glass decreases from above the transition temperature to room temperature, and the volume of the glass changes with time due to the sudden change of temperature. This phenomenon is called structural relaxation, as showed in Figure 4 [30,31].
When the glass temperature changes from T1 to T2, the response function of volume with time can be described by Equation (5) [22].
where is the reduction time of the material, 0 and ∞ are the transient and steady-state characteristics of the glass, and is the temperature at time t. According to Equation (5), Narayanaswamy et al. proposed a structural relaxation model based on the formula, which is expressed as follows [17]:
It can be deduced from the above formula that the volume change of glass at temperature T is as follows:
2.3. Heat Transfer Model
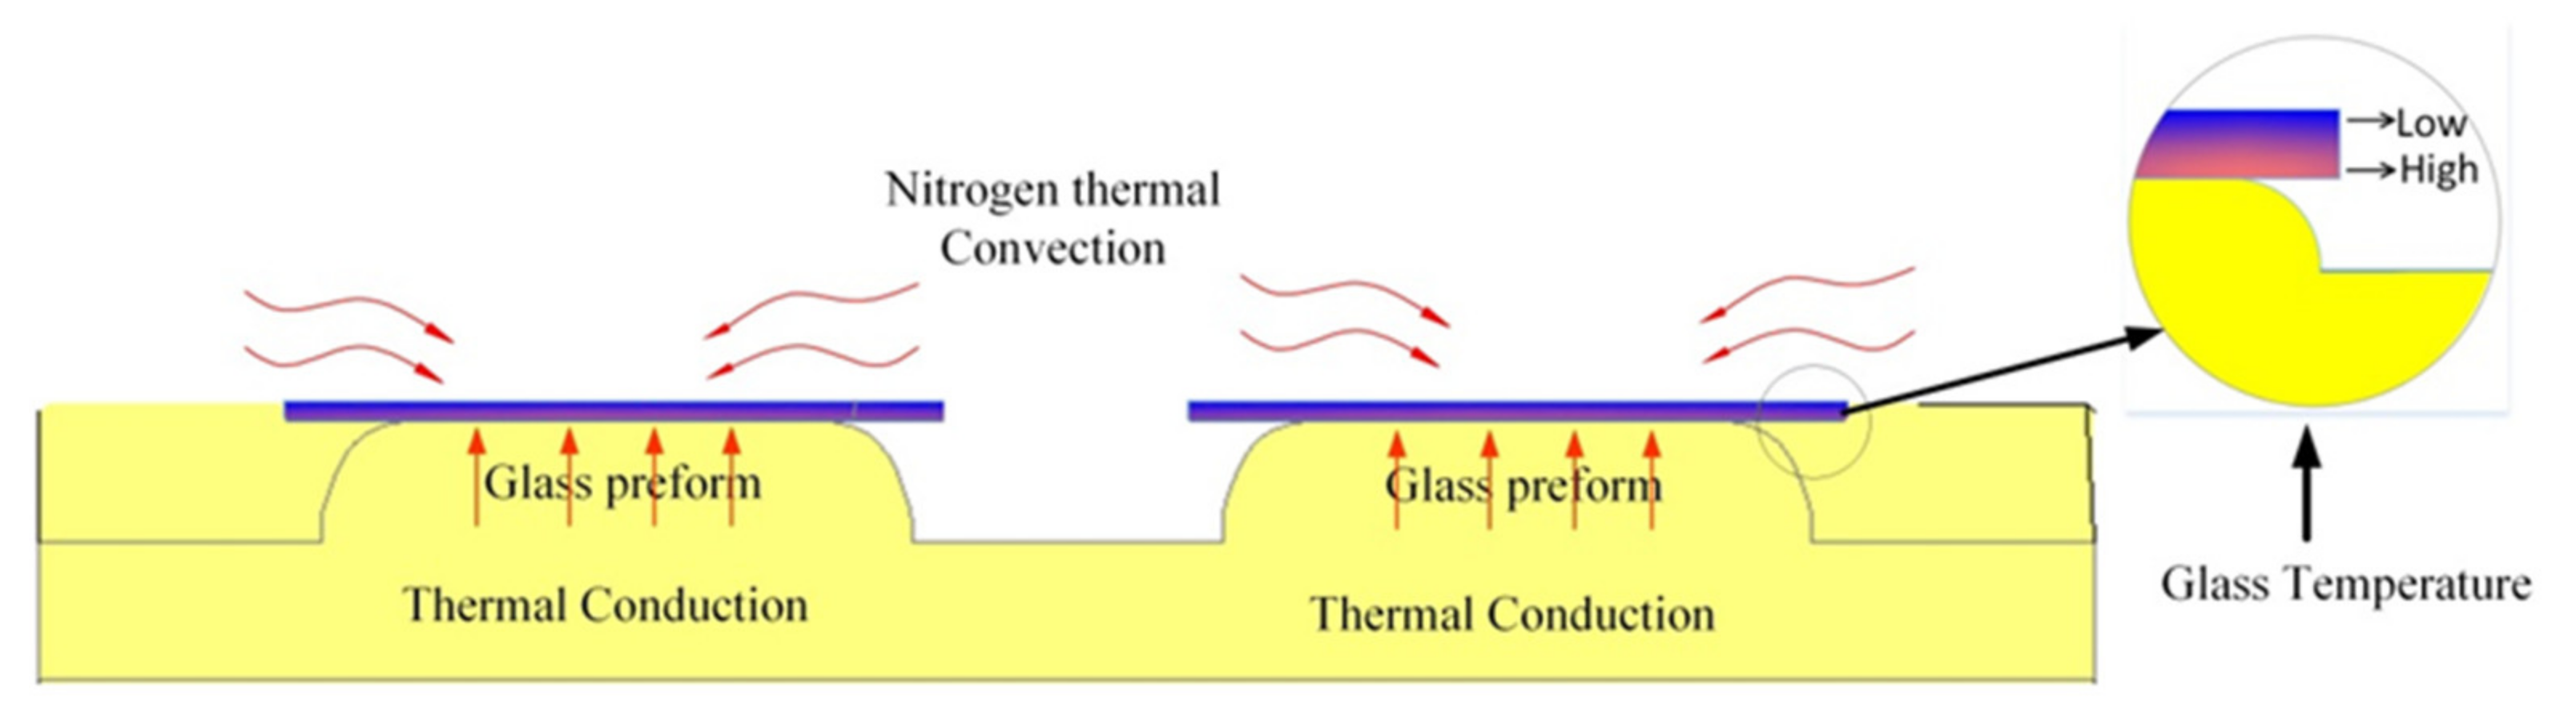
The forming process of glass belongs to the problem of thermo-mechanical coupling, so there is not just heat transfer, but also mechanical force. As shown in Figure 5, the heat of glass during processing mainly comes from contact heat transfer of the mold and convection of nitrogen and thermal radiation, among which the influence of thermal radiation is small and can be ignored [33]. The thermal bending process of glass is based on the isothermal forming method; that is, the glass preform is pressed at the same temperature as the mold. However, due to the delay of temperature rise inside the glass preform and the difficulty in detecting the temperature change of glass, it is of great significance to establish a GMP heat transfer model for realizing heat balance [13].
To establish the heat transfer model, the heat conduction relationship inside the glass material should be considered first, which can be deduced from Equation (10):
Where ρ is the density of the material and t is the heating time of the glass. and K denote the specific heat capacity and thermal conductivity of glass respectively, and these two parameters are closely related to the change of temperature [34].
In the heating and soaking stage of glass, the heat transfer of mold and the heat convection of nitrogen are the main reasons for the temperature rising of glass. The heat transfer equation can be calculated by Equations (11) and (12):
where is the interfacial thermal conductivity of glass and mold, is the heat transfer coefficient of nitrogen and glass, and T, , are the temperatures of glass, mold and nitrogen respectively. Generally, the value of is 2800 W/(m2k), and the value of is 20 W/(m2k) [35].
3. Experimental Setup
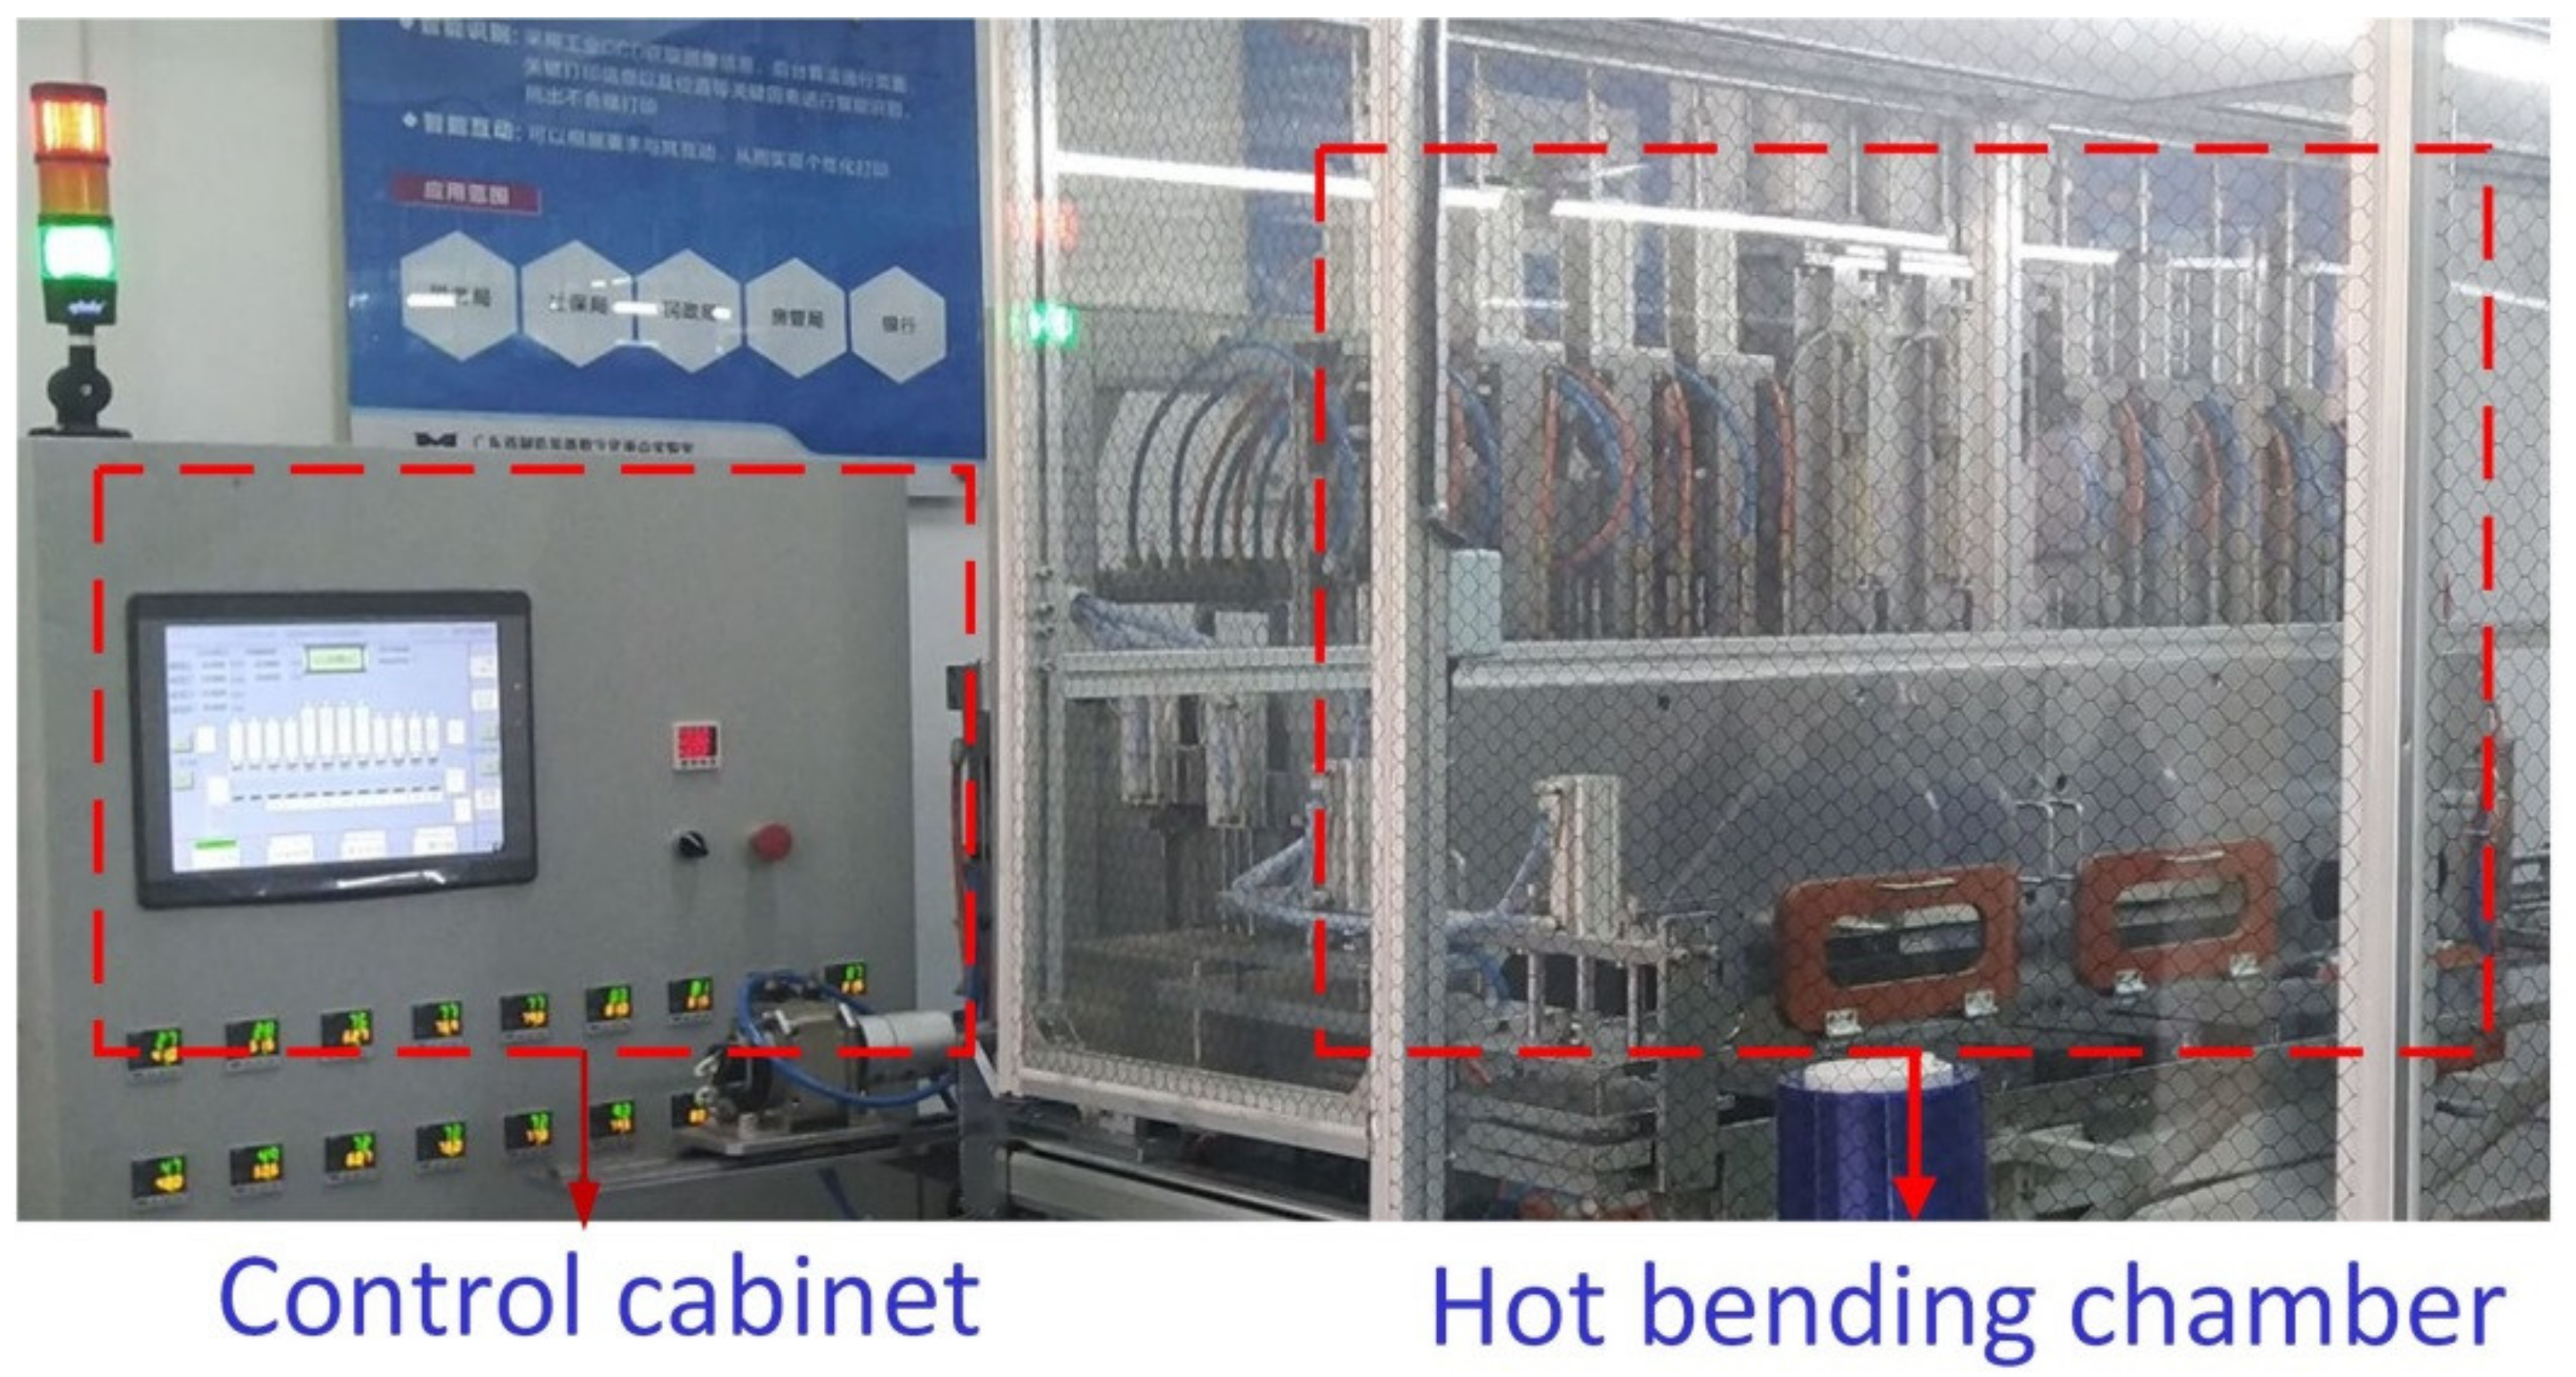
In this study, the glass multi-stations bending machine (as shown in Figure 6) is used for glass molding experiment, and PLC automatic control system is adopted for multi-stations bending machine. The highest molding speed of glass parts can reach 60 pcs/h. The production efficiency can be effectively improved by multi station assembly line operation. The machine is designed and built by Guangdong intelligent robot research institute. The schematic diagram of glass-multi station bending machine is shown in Figure 7. The machine is mainly composed of a control cabinet, heating station (4), molding station (3), annealing cooling station (4), box, import and export mechanism, etc. The experimental process is divided into the heating stage, molding stage, annealing stage and cooling stage, a total of 11 stations. In the heating station and molding station, one station can be divided into a heat shield, heating plate (with built-in heating pipe), heat conducting plate, mold, glass preform, etc. In the annealing station and cooling station, heating pipe is replaced by the cooling pipe.
During the production cycle, glass preforms and molds enter a furnace full of nitrogen. After 4 heating stations, the temperature of glass preform and mold rises from room temperature to bend temperature. Then, the glass preform and mold enter three molding workstations. The glass is committed under the pressure of the upper die, while the temperature of the glass remains unchanged. Finally, after four annealing and cooling stations, the glass assembly and mold temperature are cooled to room temperature.
4. Simulation Modeling of GMP
The main size of the intelligent fingerprint lock glass fingerprint touch plate is relatively large, and the surface accuracy of the glass fingerprint touch plate is required to be high, and the heat transfer in the thickness direction can’t be ignored, which makes the glass processing process difficult to control. In order to reasonably analyze the processing mechanism, this paper establishes the finite element model of the glass fingerprint touch plate based on the commercial non-linear software MSC. Marc.
4.1. Material Selection for Mold and Glass Preform
The glass optical element studied in this paper is a glass fingerprint contact plate. Graphite is a kind of mold material which is often used in mold manufacturing because of its good physical and chemical stability and thermal stability over 1000 °C. The thermomechanical coupling parameters of mold and glass material are shown in Table 1 [36]. According to the theoretical model of glass material in 2.1 and 2.2, the parameters of stress relaxation and structural relaxation of the glass are shown in Table 2 [37]. In addition, the WLF model of MSC. Marc was used to simulate the viscosity curve of the glass material during the heating period, and Narayanswamy model was used to simulate the structural relaxation with temperature during the annealing cooling stages.
4.2. Boundary Conditions
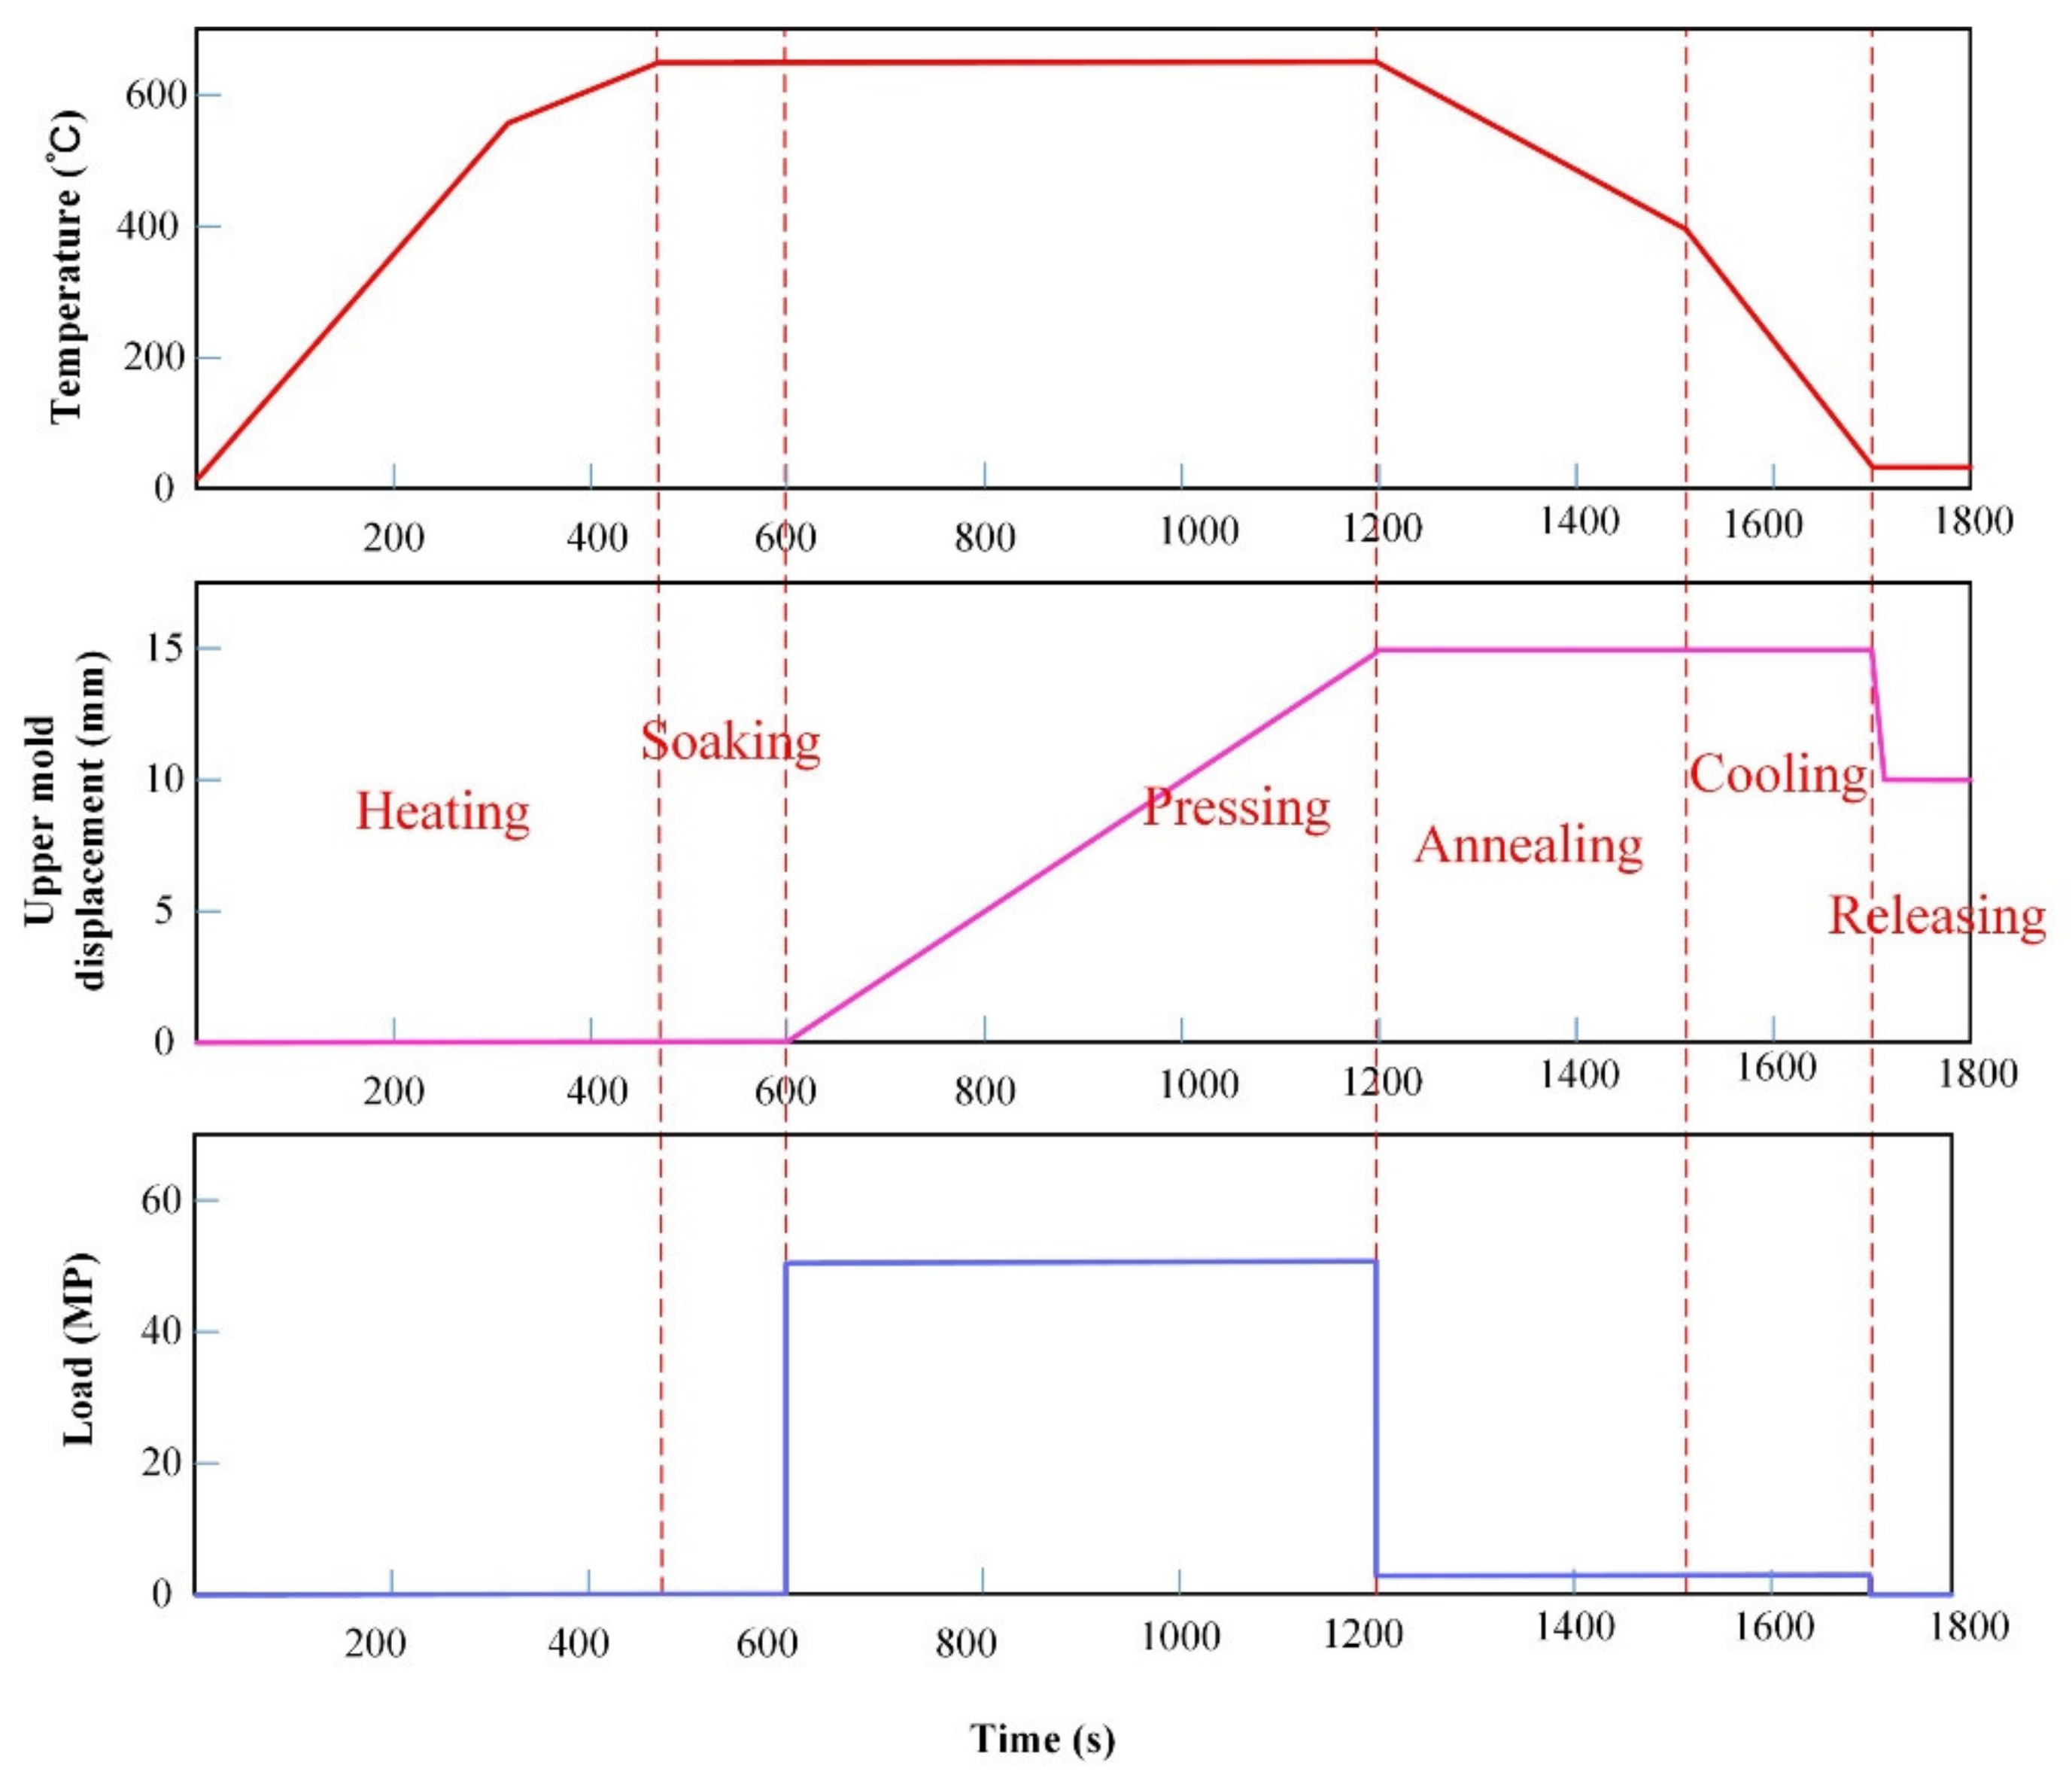
In the GMP, the initial temperature of the whole simulation model is 25 °C, and the whole process is divided into three stages: heating and soaking, pressing, annealing and cooling. In the heating and soaking stage, the glass preform and mold are heated from room temperature to about 640 °C in 480 s, which is slightly higher than the glass transition temperature, and then soaked for a period of time to make the temperature of the glass body and mold evenly distributed. The whole heating and soaking process takes about 600 s. During the pressing process, the upper die moves 15 mm for about 600 s at a constant pressure of about 50 MPa in the negative direction of z-axis, and then maintains a pressure of 500 N in the upper die to obtain the required glass shape. The annealing stage takes about 500 s, and the temperature of glass and die at the end of annealing is reduced to 300 °C. In the process of annealing and cooling, firstly, the internal stress of the glass is released slowly, and then nitrogen is introduced into the system to absorb the heat of the glass and the mold, so that it can be quickly cooled to room temperature. The specific boundary conditions are shown in Figure 7. In addition, a simplified shear stress friction model was used to simulate the interface friction between glass and mold. The friction coefficient is 0.65, and the contact model is selected MSC. Marc This model can well simulate the friction changes caused by stick slip friction [7].
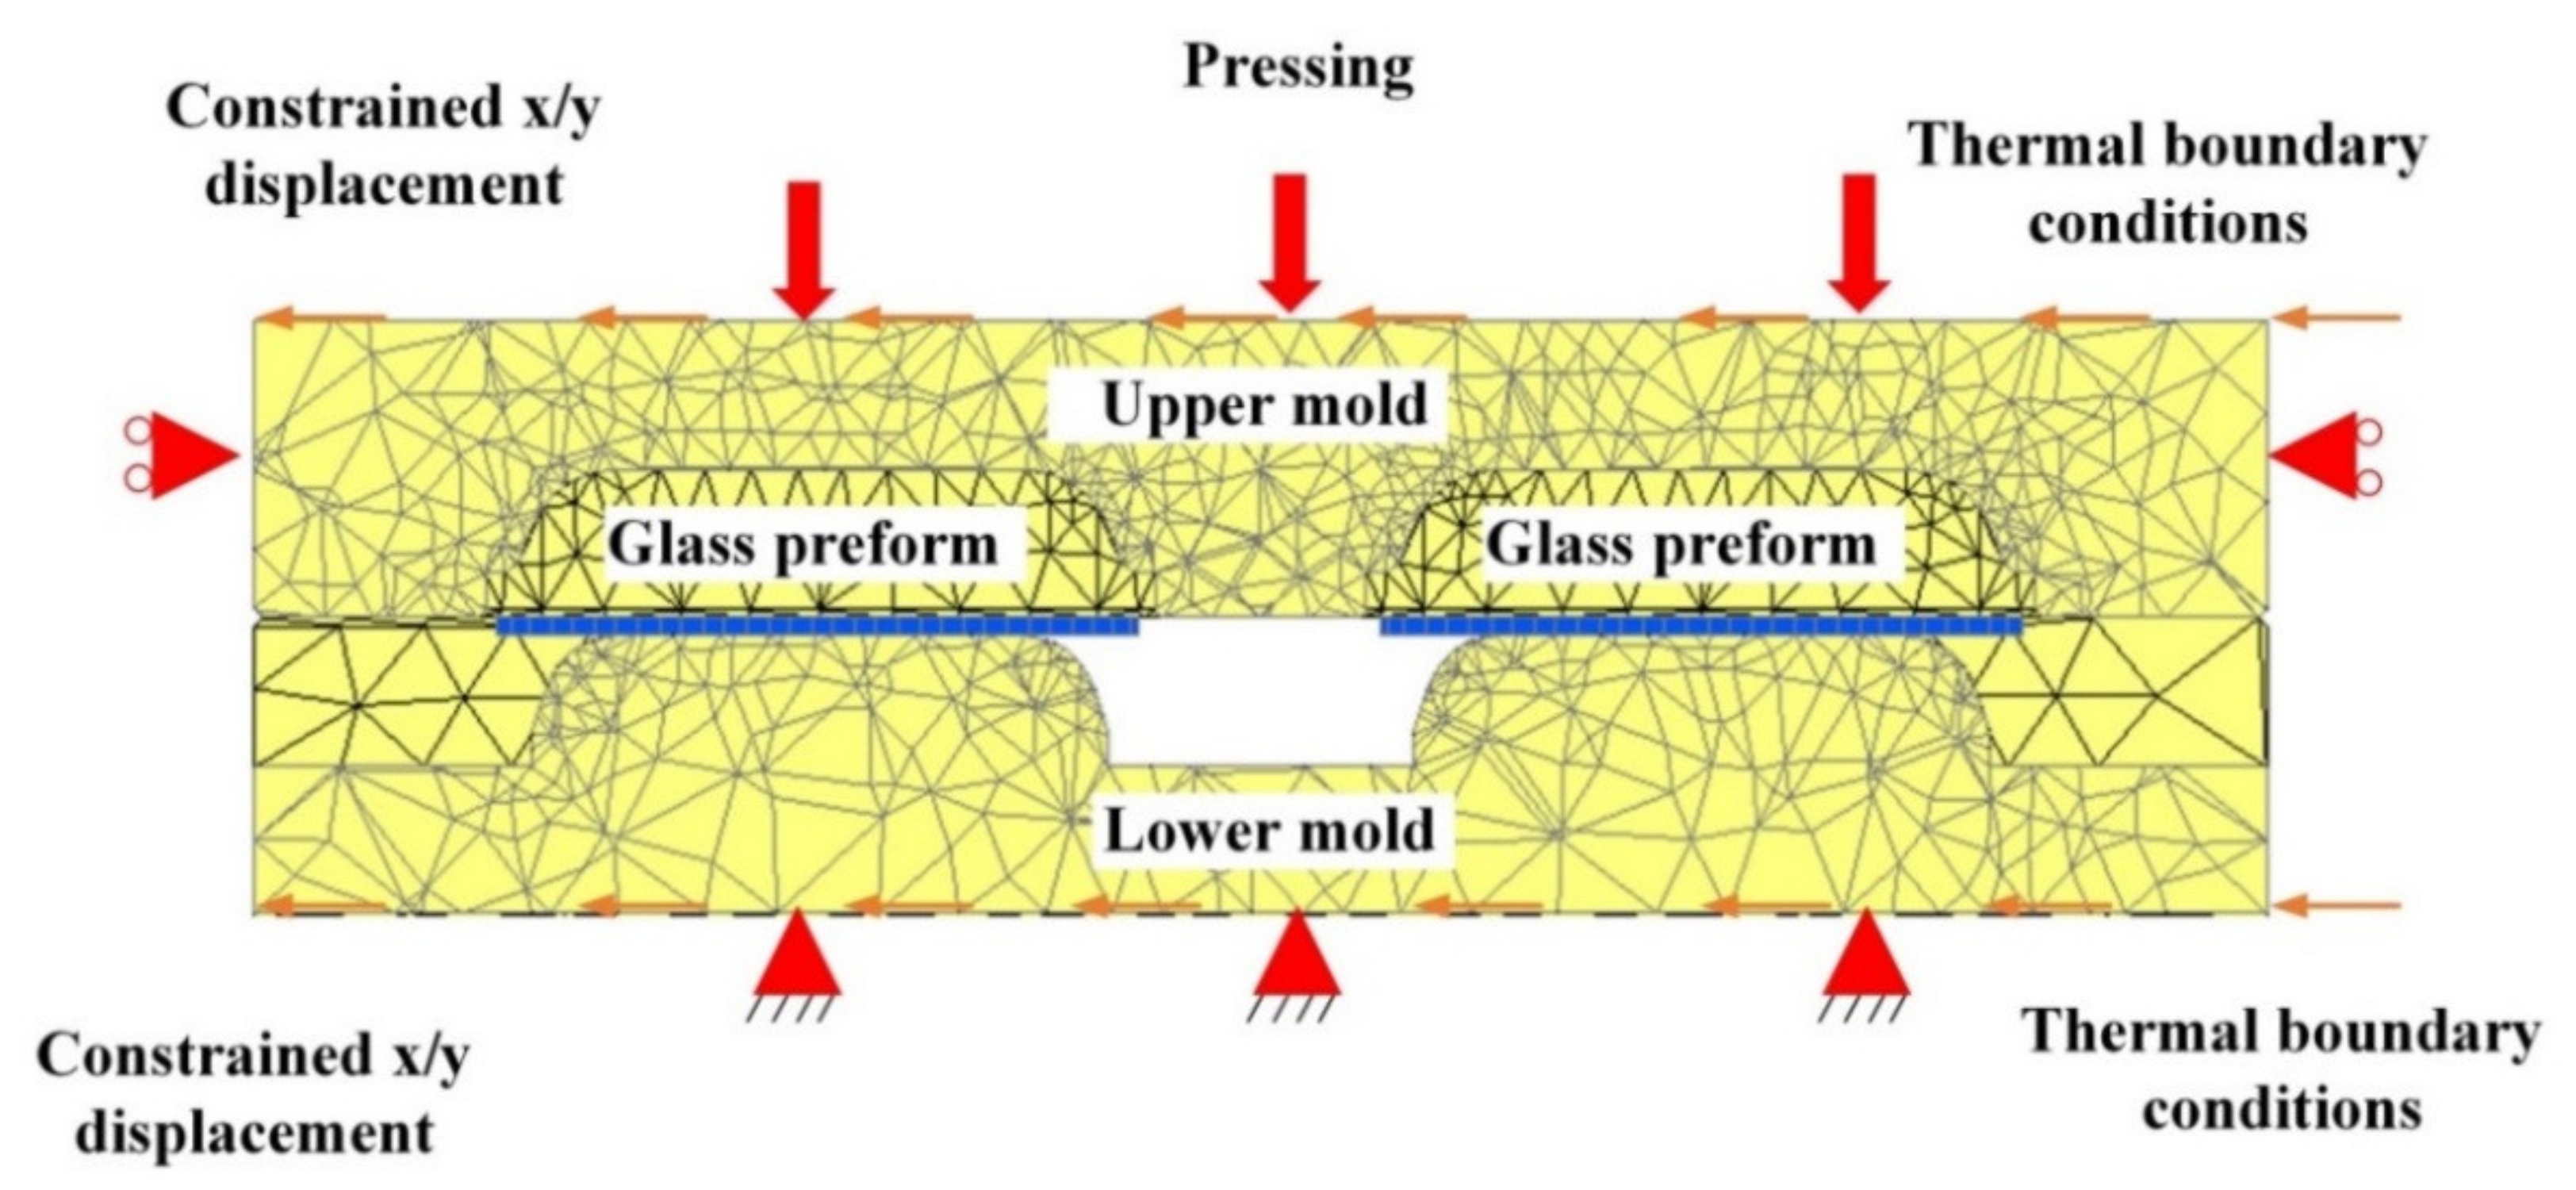
Figure 8 shows the simulation model of GMP. The dimensions of glass plate preform are 348 mm, 66.6 mm and 2 mm. The mold mesh is generated by solid tetrahedral element. The glass preform mesh is obtained by extending the plane quadrilateral element, and the forming area of the glass preform and the mold is refined. The experimental results show that if the mesh size of the model is increased by 2 times, the calculation results is not changed significantly. Finally, the mesh number of the mold and the glass preform is 262,616 and 20,712 respectively.
5. Results and Discussion
5.1. Effect of Molding Temperature on Forming Quality
GMP is a complex multi input and multi output thermomechanical coupling forming process. Due to the viscoelastic properties of glass, different bending temperatures have obvious influence on the final forming quality of glass. In order to study the influence of bending temperature on the forming of glass plate, three groups of simulation experiments were carried out.
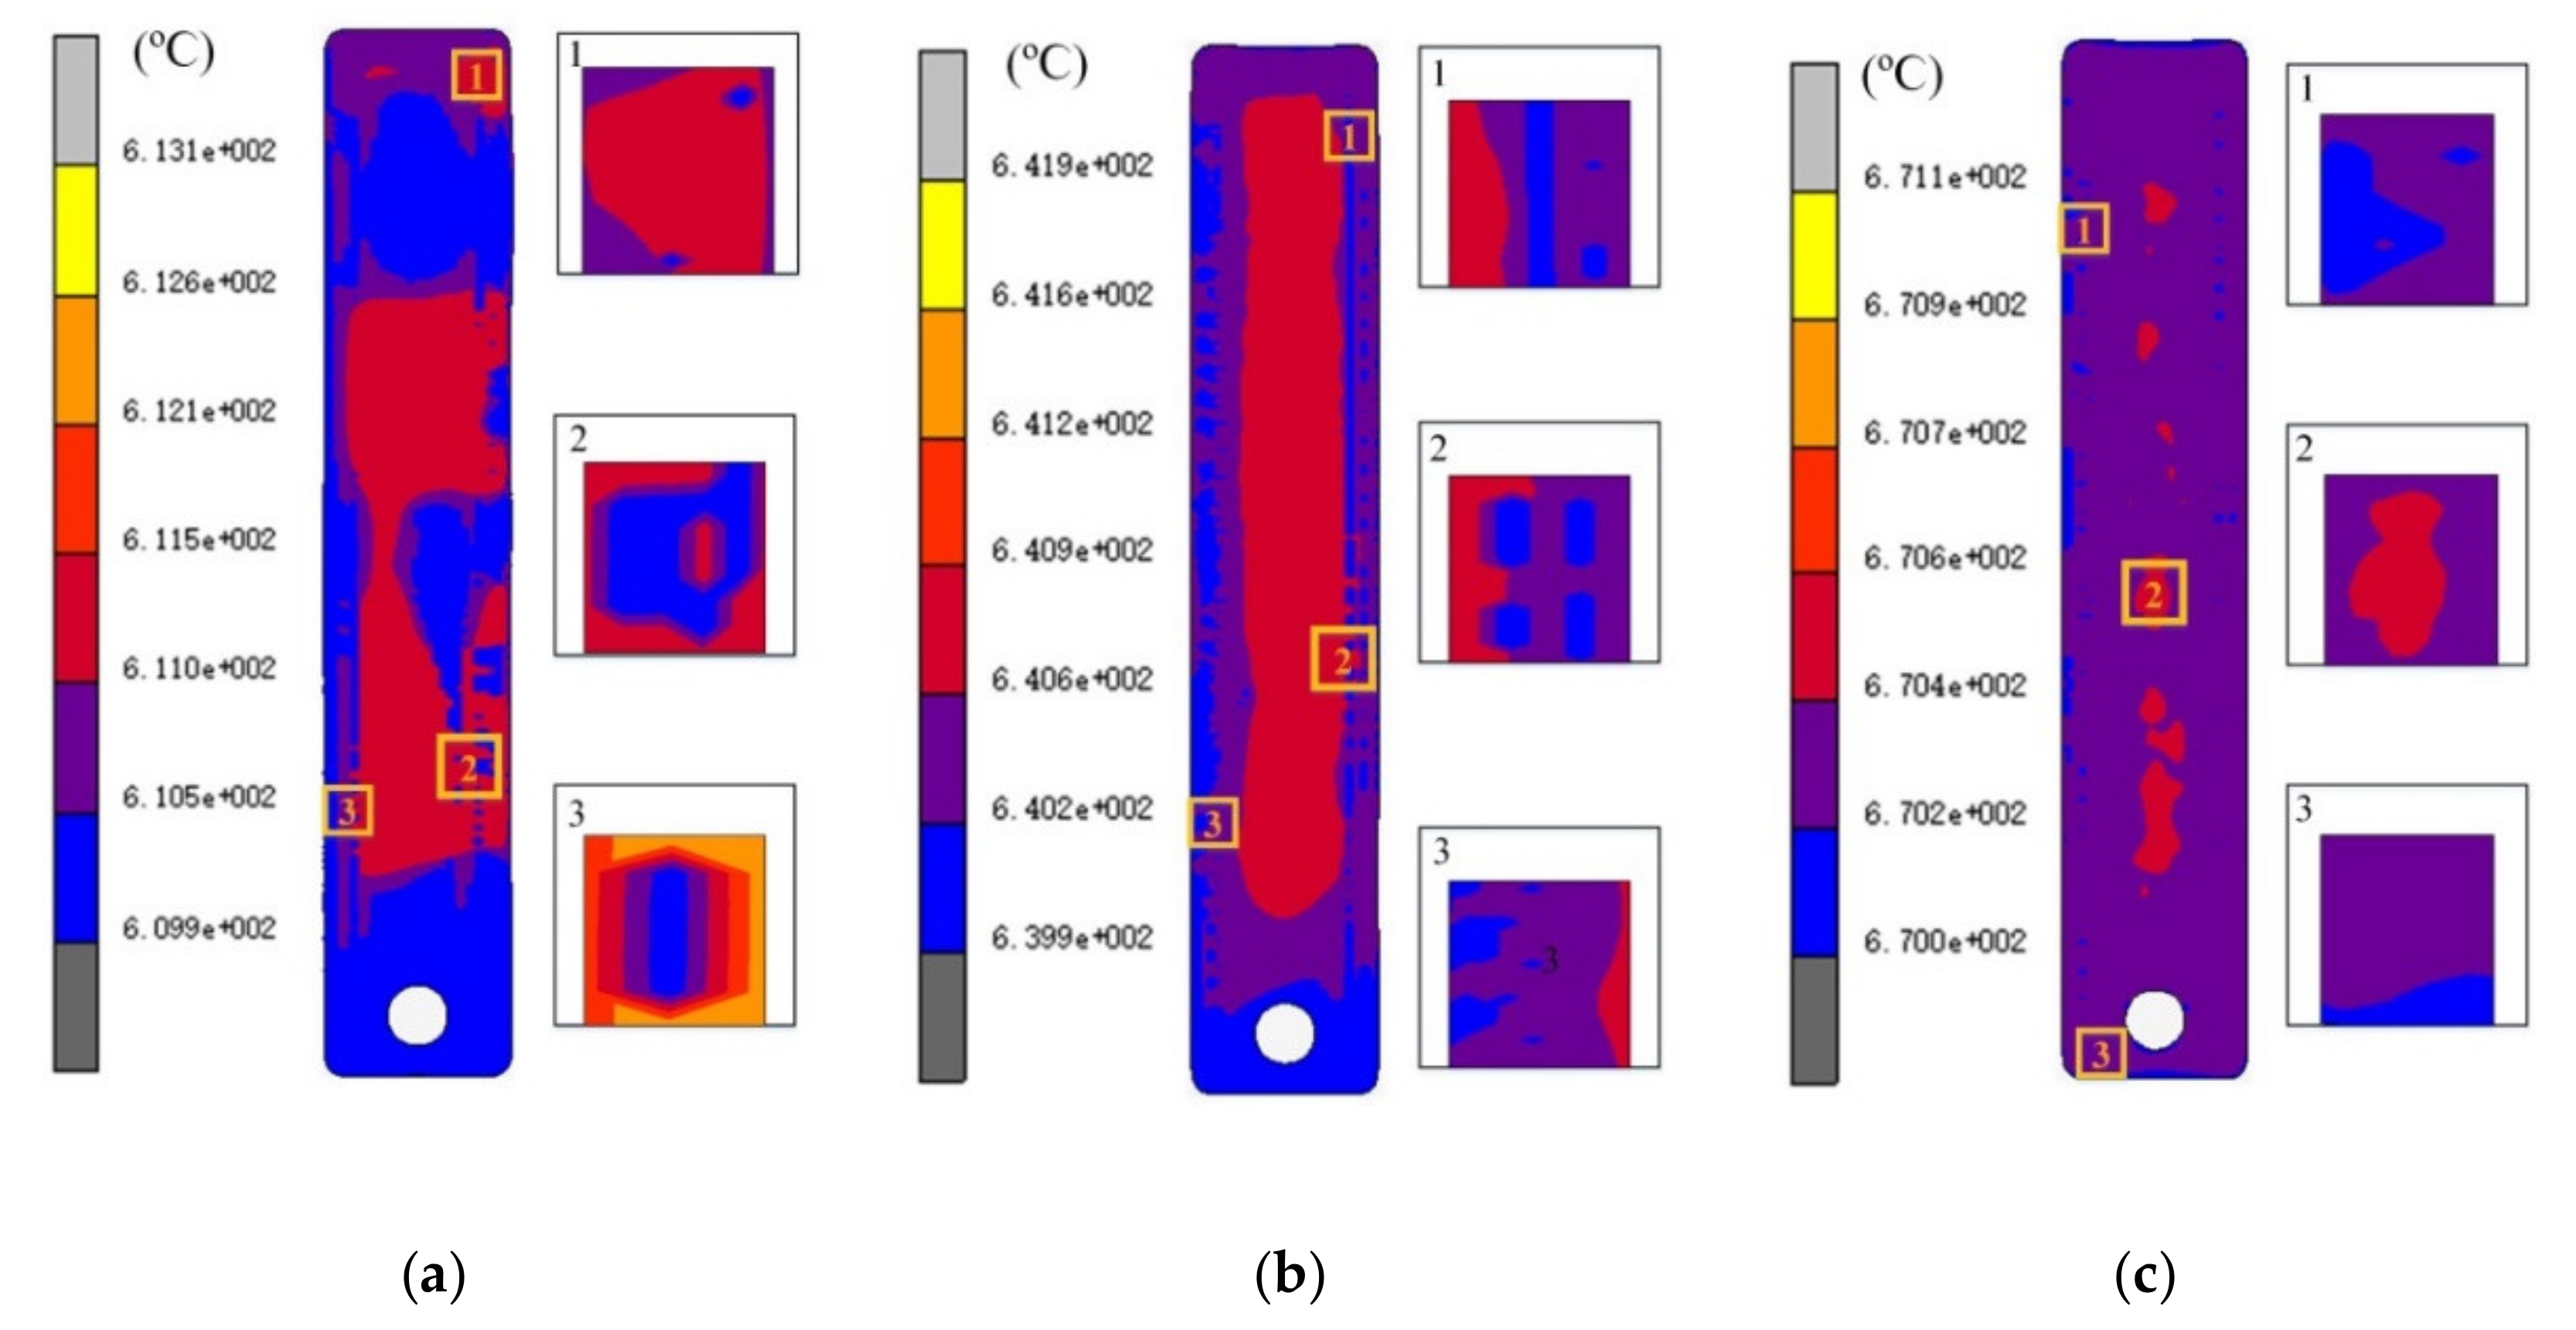
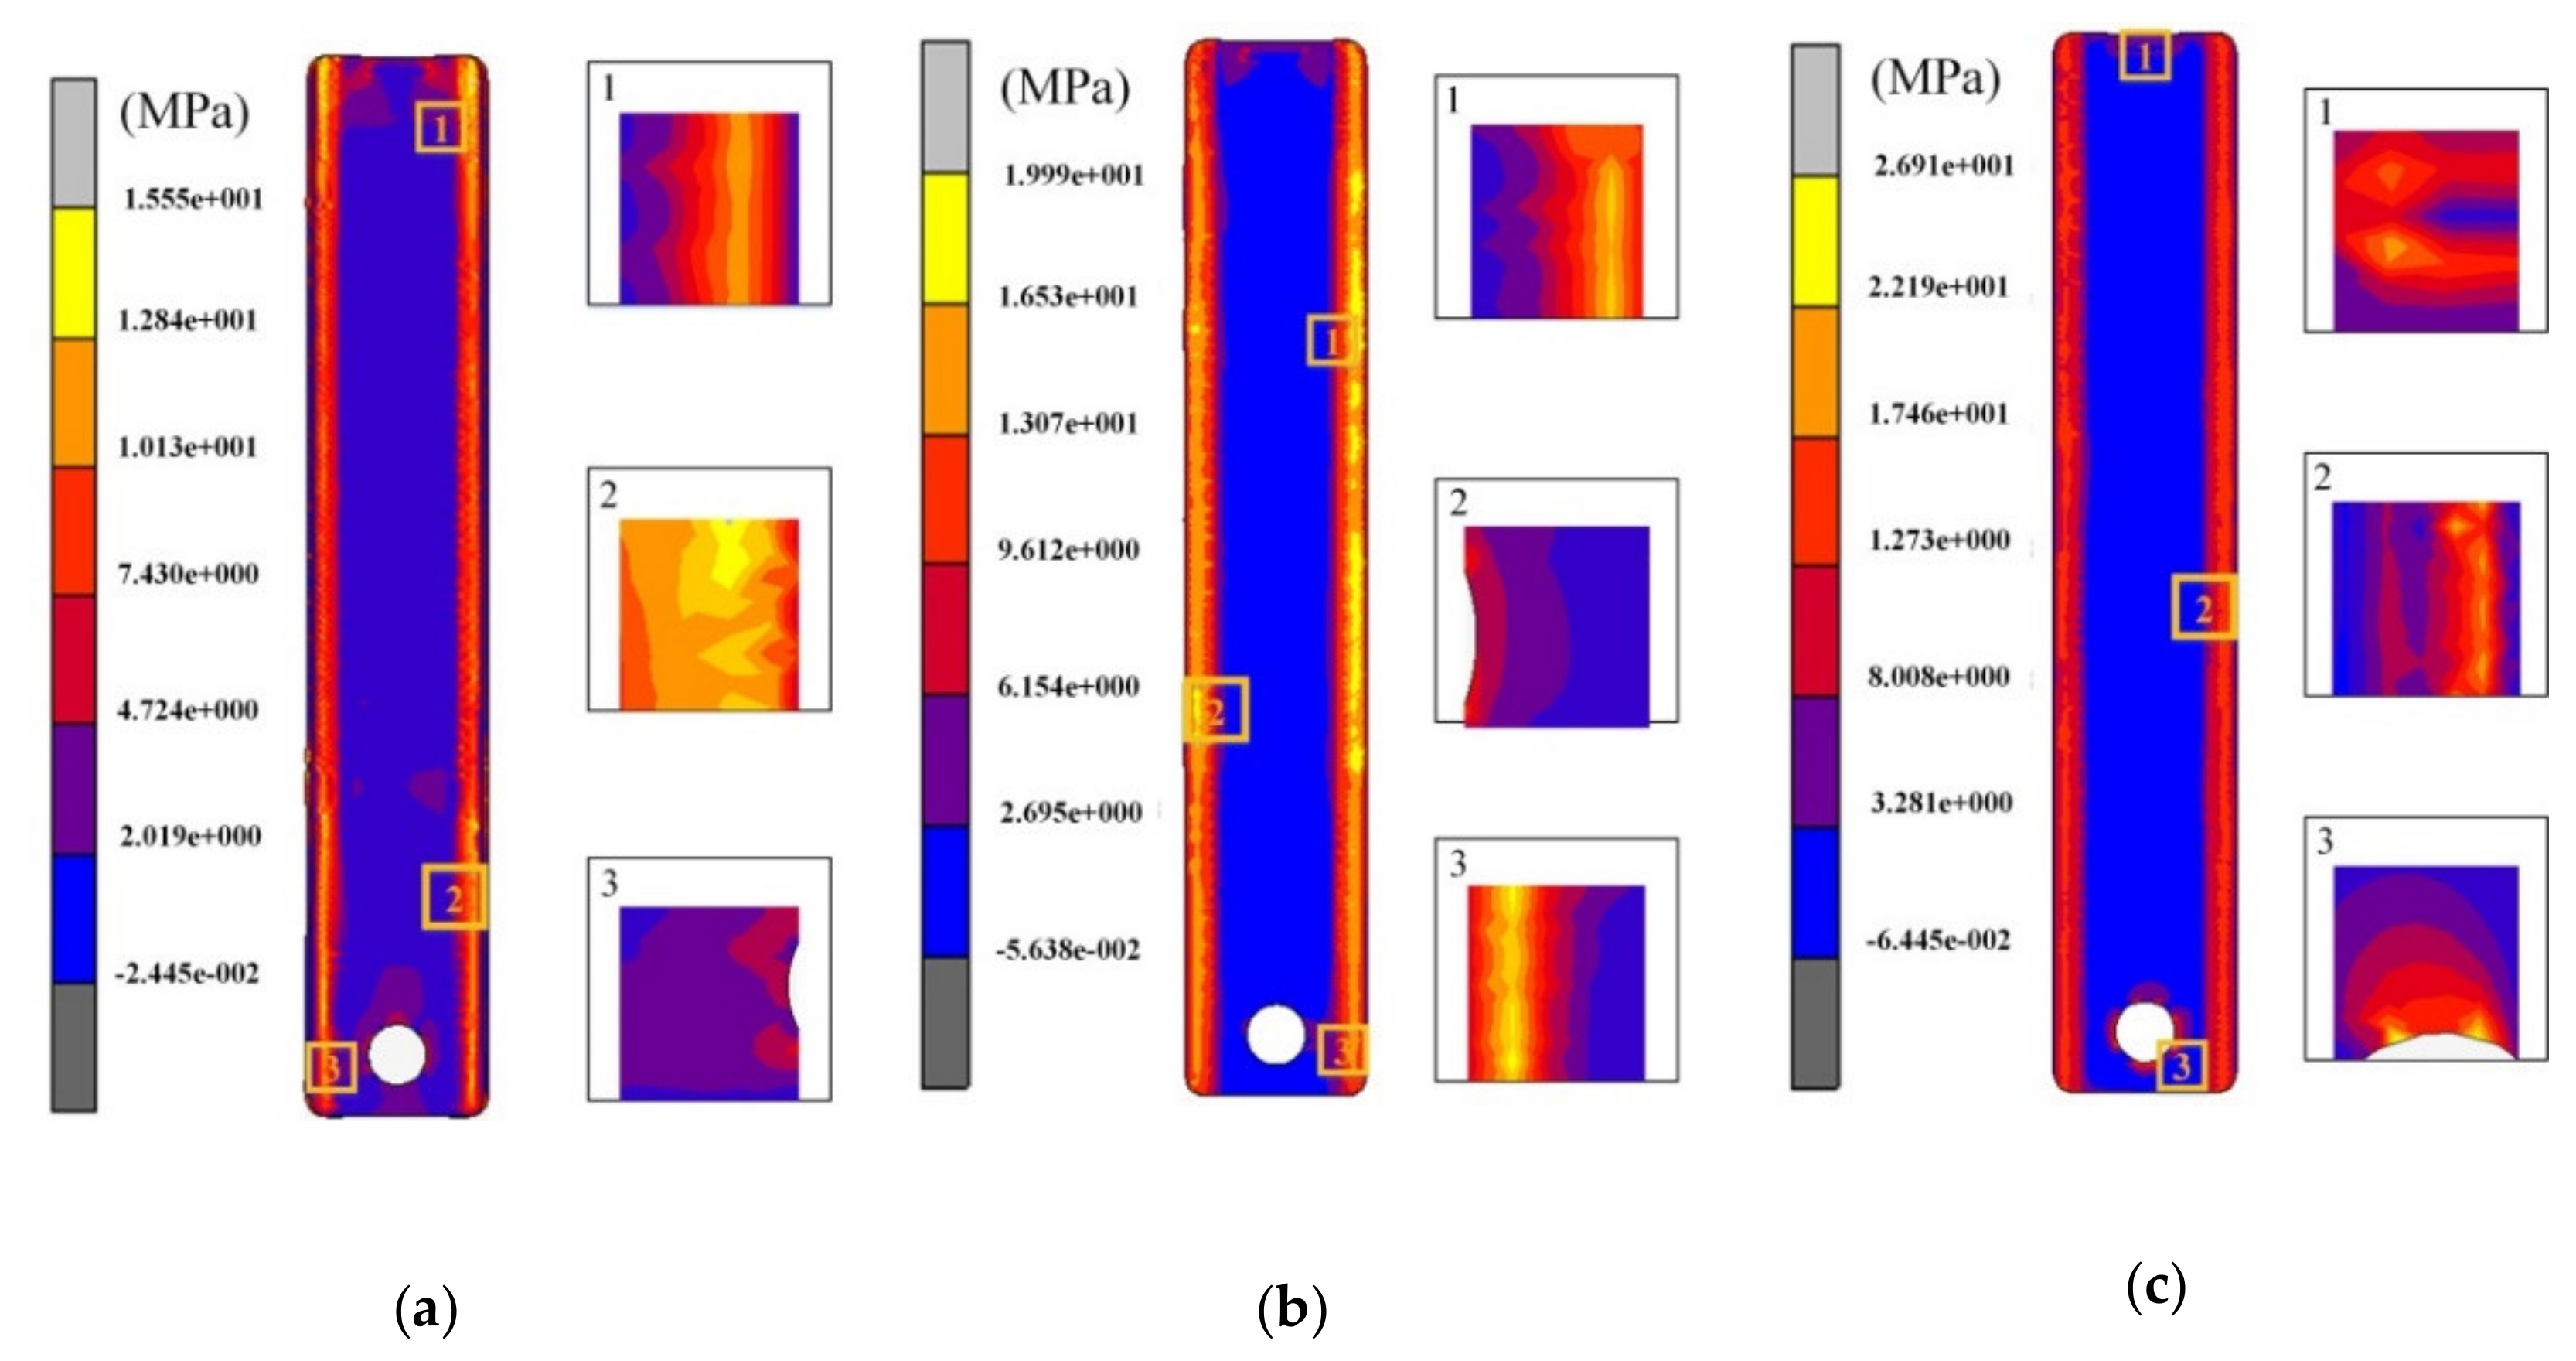
The simulation results of the experiment are shown in Figure 9 and Figure 10. It can be seen from Figure 9 that when the bending temperature is 610 °C, the maximum temperature difference of the glass plate is 2.3 °C (Figure 9a). With the bending temperature increasing to 670 °C, the maximum temperature difference drops to 0.6 °C (Figure 9c). Generally, the temperature difference of the three groups of glasses is within 3 °C, and the temperature distribution is more uniform. In the GMP, the glass preform is bent under the action of bending stress, and the internal reaction force is produced. Due to the characteristics of glass material, after annealing, the force will continue to exist in the form of residual stress inside the glass plate. As shown in Figure 10, the maximum residual stress of the glass plate in Experiment 1 is 15.5 MPa, which is mainly located in the hole and bending position of the glass plate. Similarly, the maximum residual stress of Experiment 2 and Experiment 3 were 19.9 MPa (Figure 10b) and 26.9 MPa (Figure 10c), respectively.
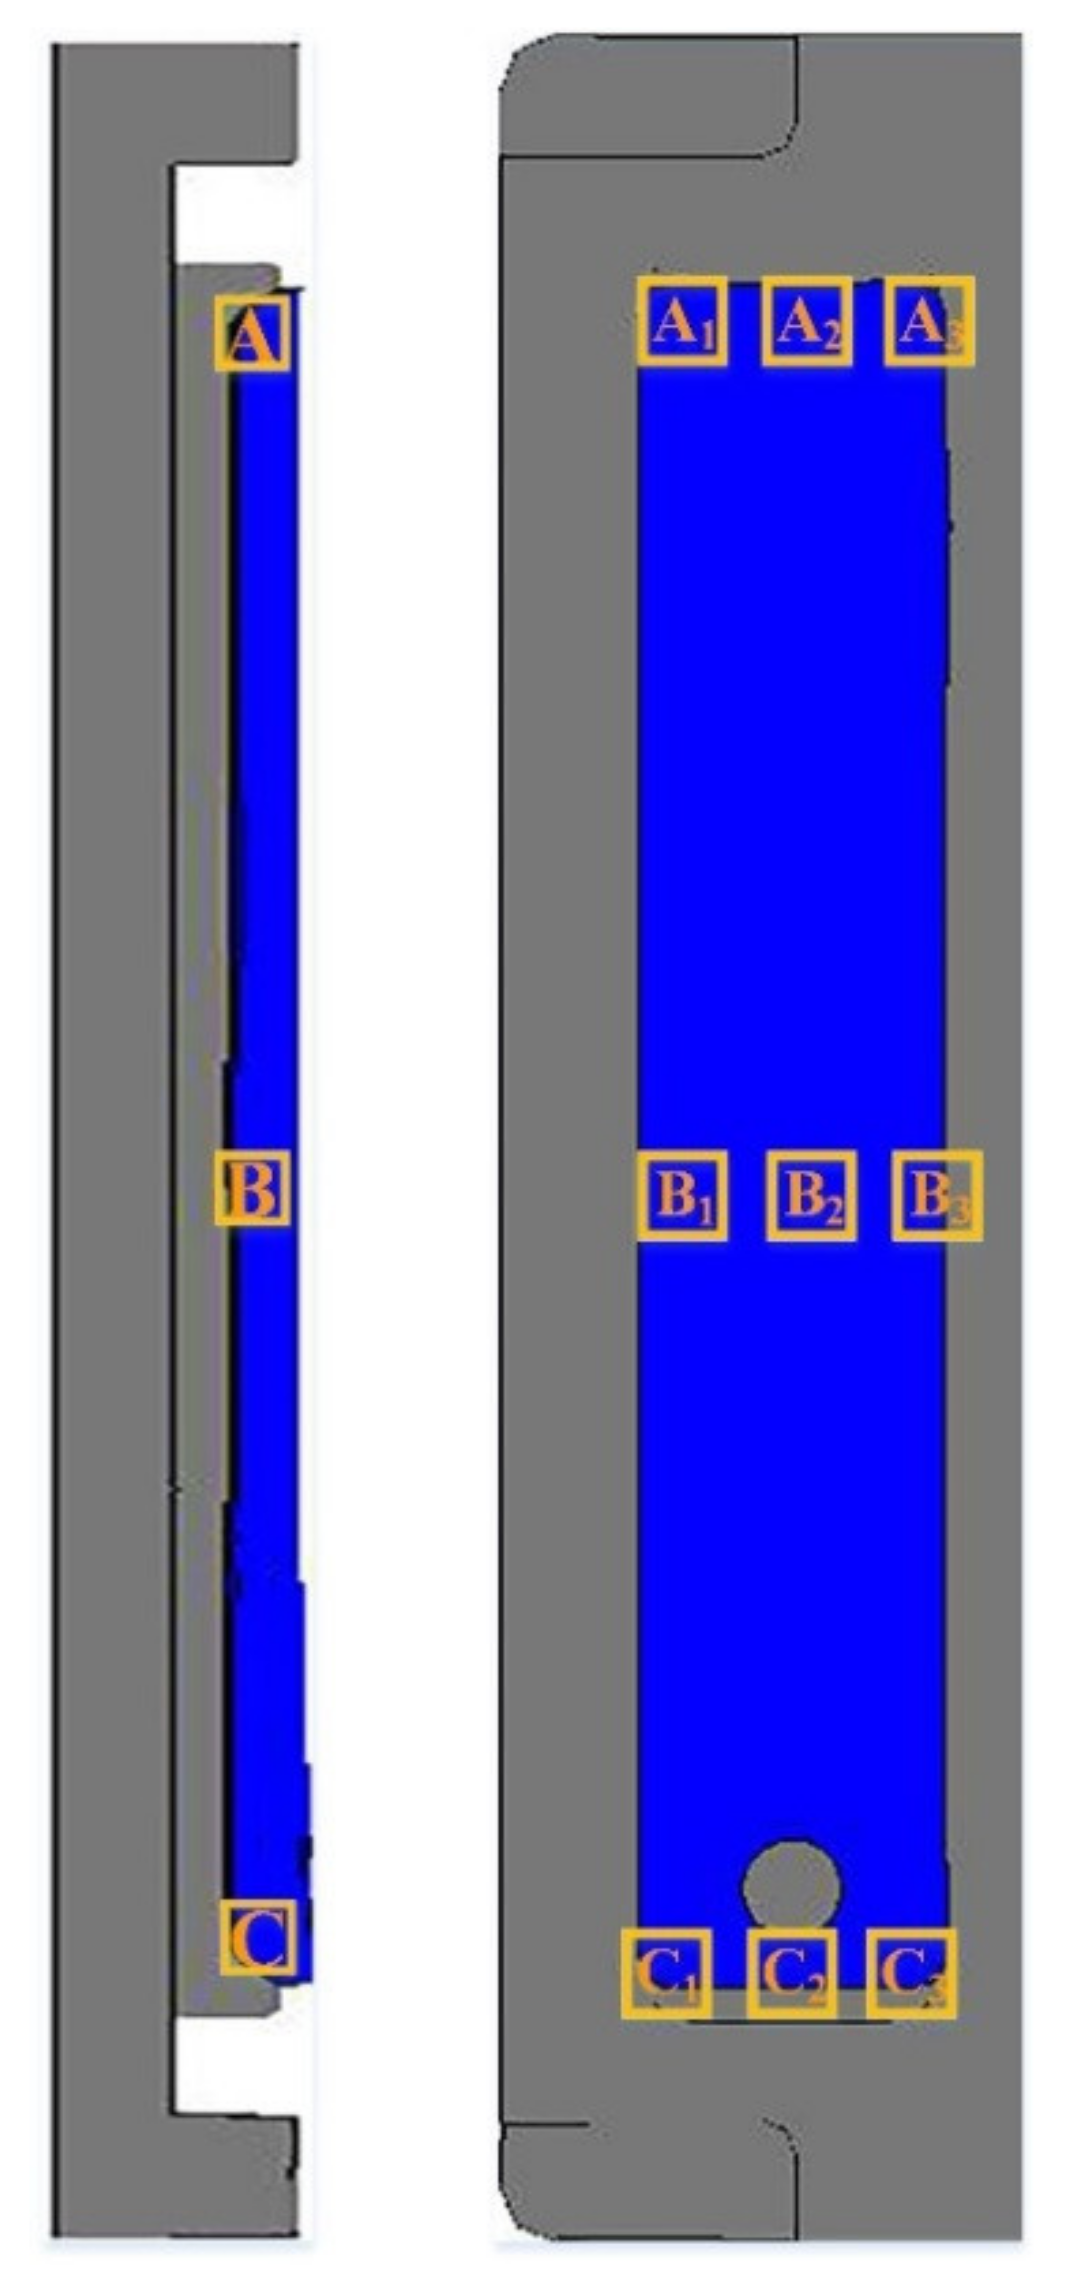
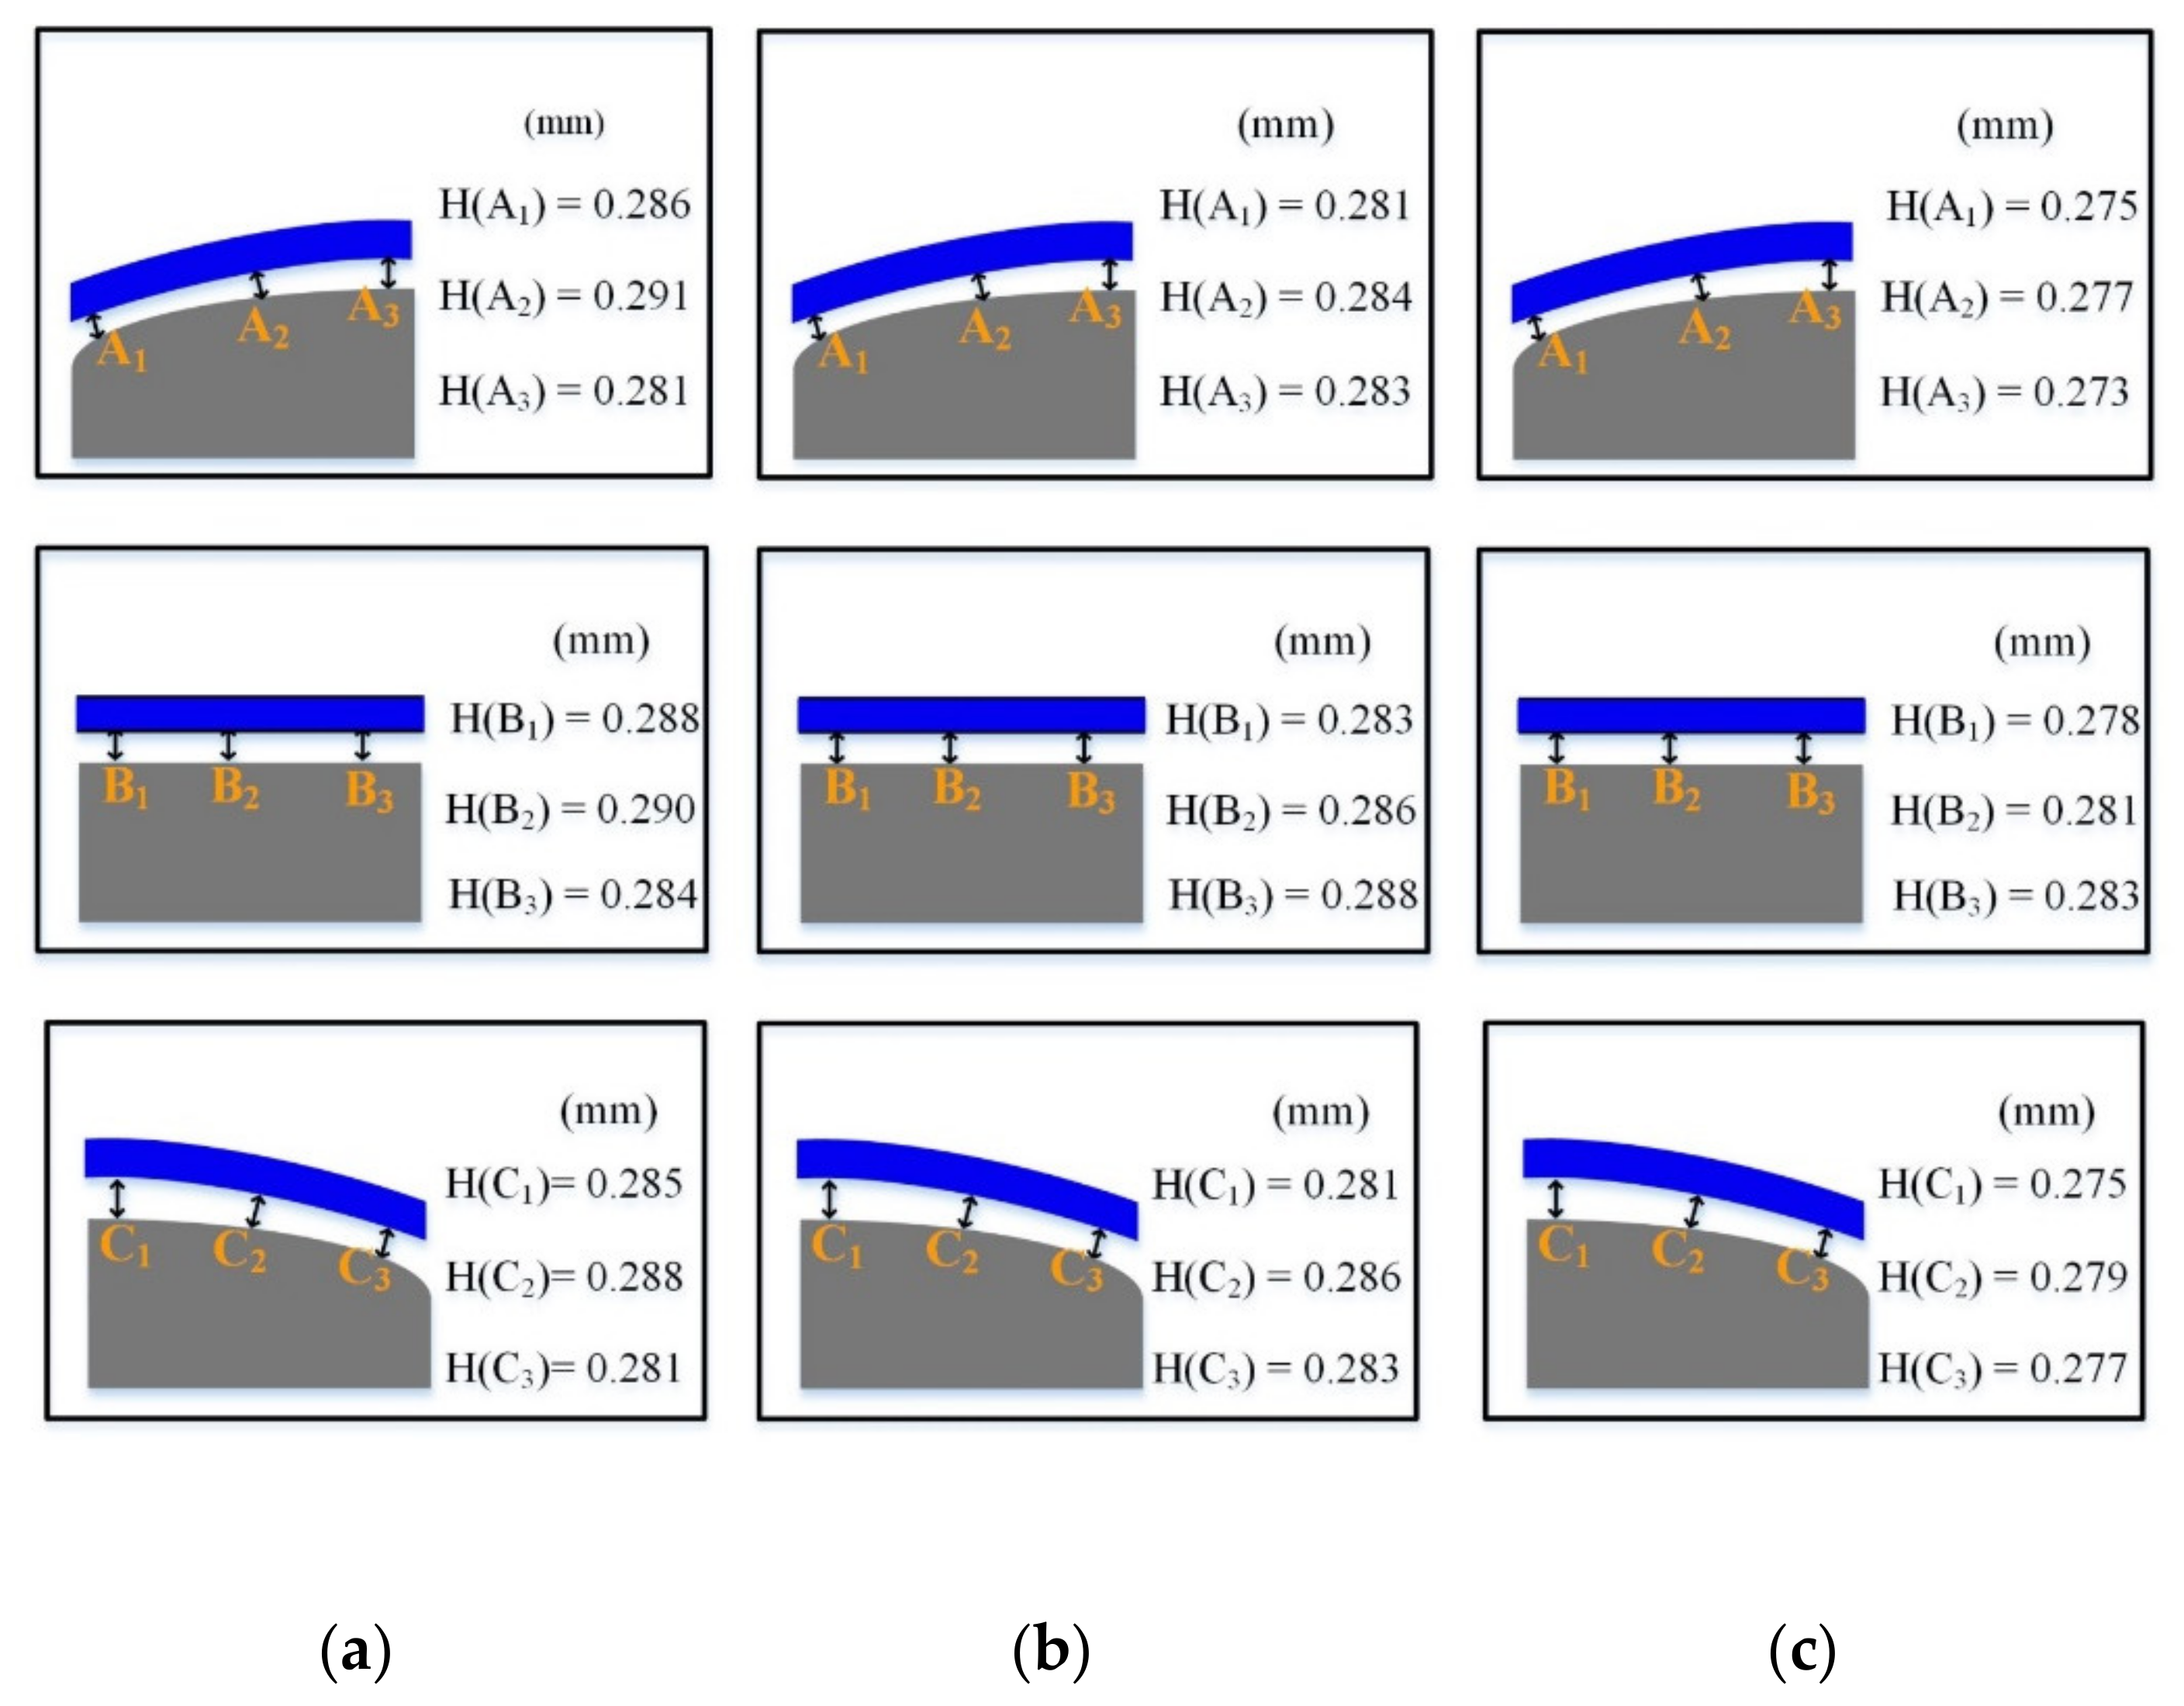
In GMP, the shape deviation of glass components at the end of the cooling stage is also an important factor to measure the final forming quality of glass. In this study, the average bonding gap between the mold and glass (9 positions, as showed in Figure 11) is taken to represent the shape deviation of the final glass fingerprint contact plate. Figure 12 compares the shape deviation of the glass fingerprint contact plate under different bending temperatures. It can be seen from the figure that the shape deviation of the final glass component in Experiment 1 is 0.2860 mm, and the maximum fitting error of the glass plate and the lower die appears in the middle, which is because in the cooling stage, the edge of the die contacts with nitrogen first and then cools down first. Because of the change of mold material with temperature, the cooling shrinkage of the middle position is slower than that of the edge, so the edge fitting degree of the glass plate is higher than that of the middle position. Similarly, the shape deviations of the glass plates in Experiment 2 and Experiment 3 were 0.2839 mm and 0.2776 mm, respectively (as shown in Figure 12b–c). From the above three groups of experiments, it can be seen that in a certain range, when the temperature increases, the residual stress of the glass plate gradually increases, and the shape deviation gradually decreases.
5.2. Effect of Heating Rate on Forming Quality
The surface quality and dimensional accuracy of molded products is an important index for the final evaluation of fingerprint lock glass fingerprint touch plate. Due to the different processing conditions and process parameters, there is a certain degree of micro-geometric dimension deviation, residual stress and surface defects on the surface or inside of the parts after molding. Excessive residual stress may lead to a cracking phenomenon in the annealing process of molding glass devices. The uneven distribution of residual stress and large shape deviation will affect the optical quality of glass devices [38]. The experimental results show that the heating rate and cooling rate have significant effects on the residual stress and shape deviation of glass devices. Therefore, it is of profound significance to predict the quality of glass in the molding process by establishing a simulation model. In order to study the influence of heating rate on the closing forming quality of products, three groups of process experiments were carried out, and the parameter settings are shown in Table 3.
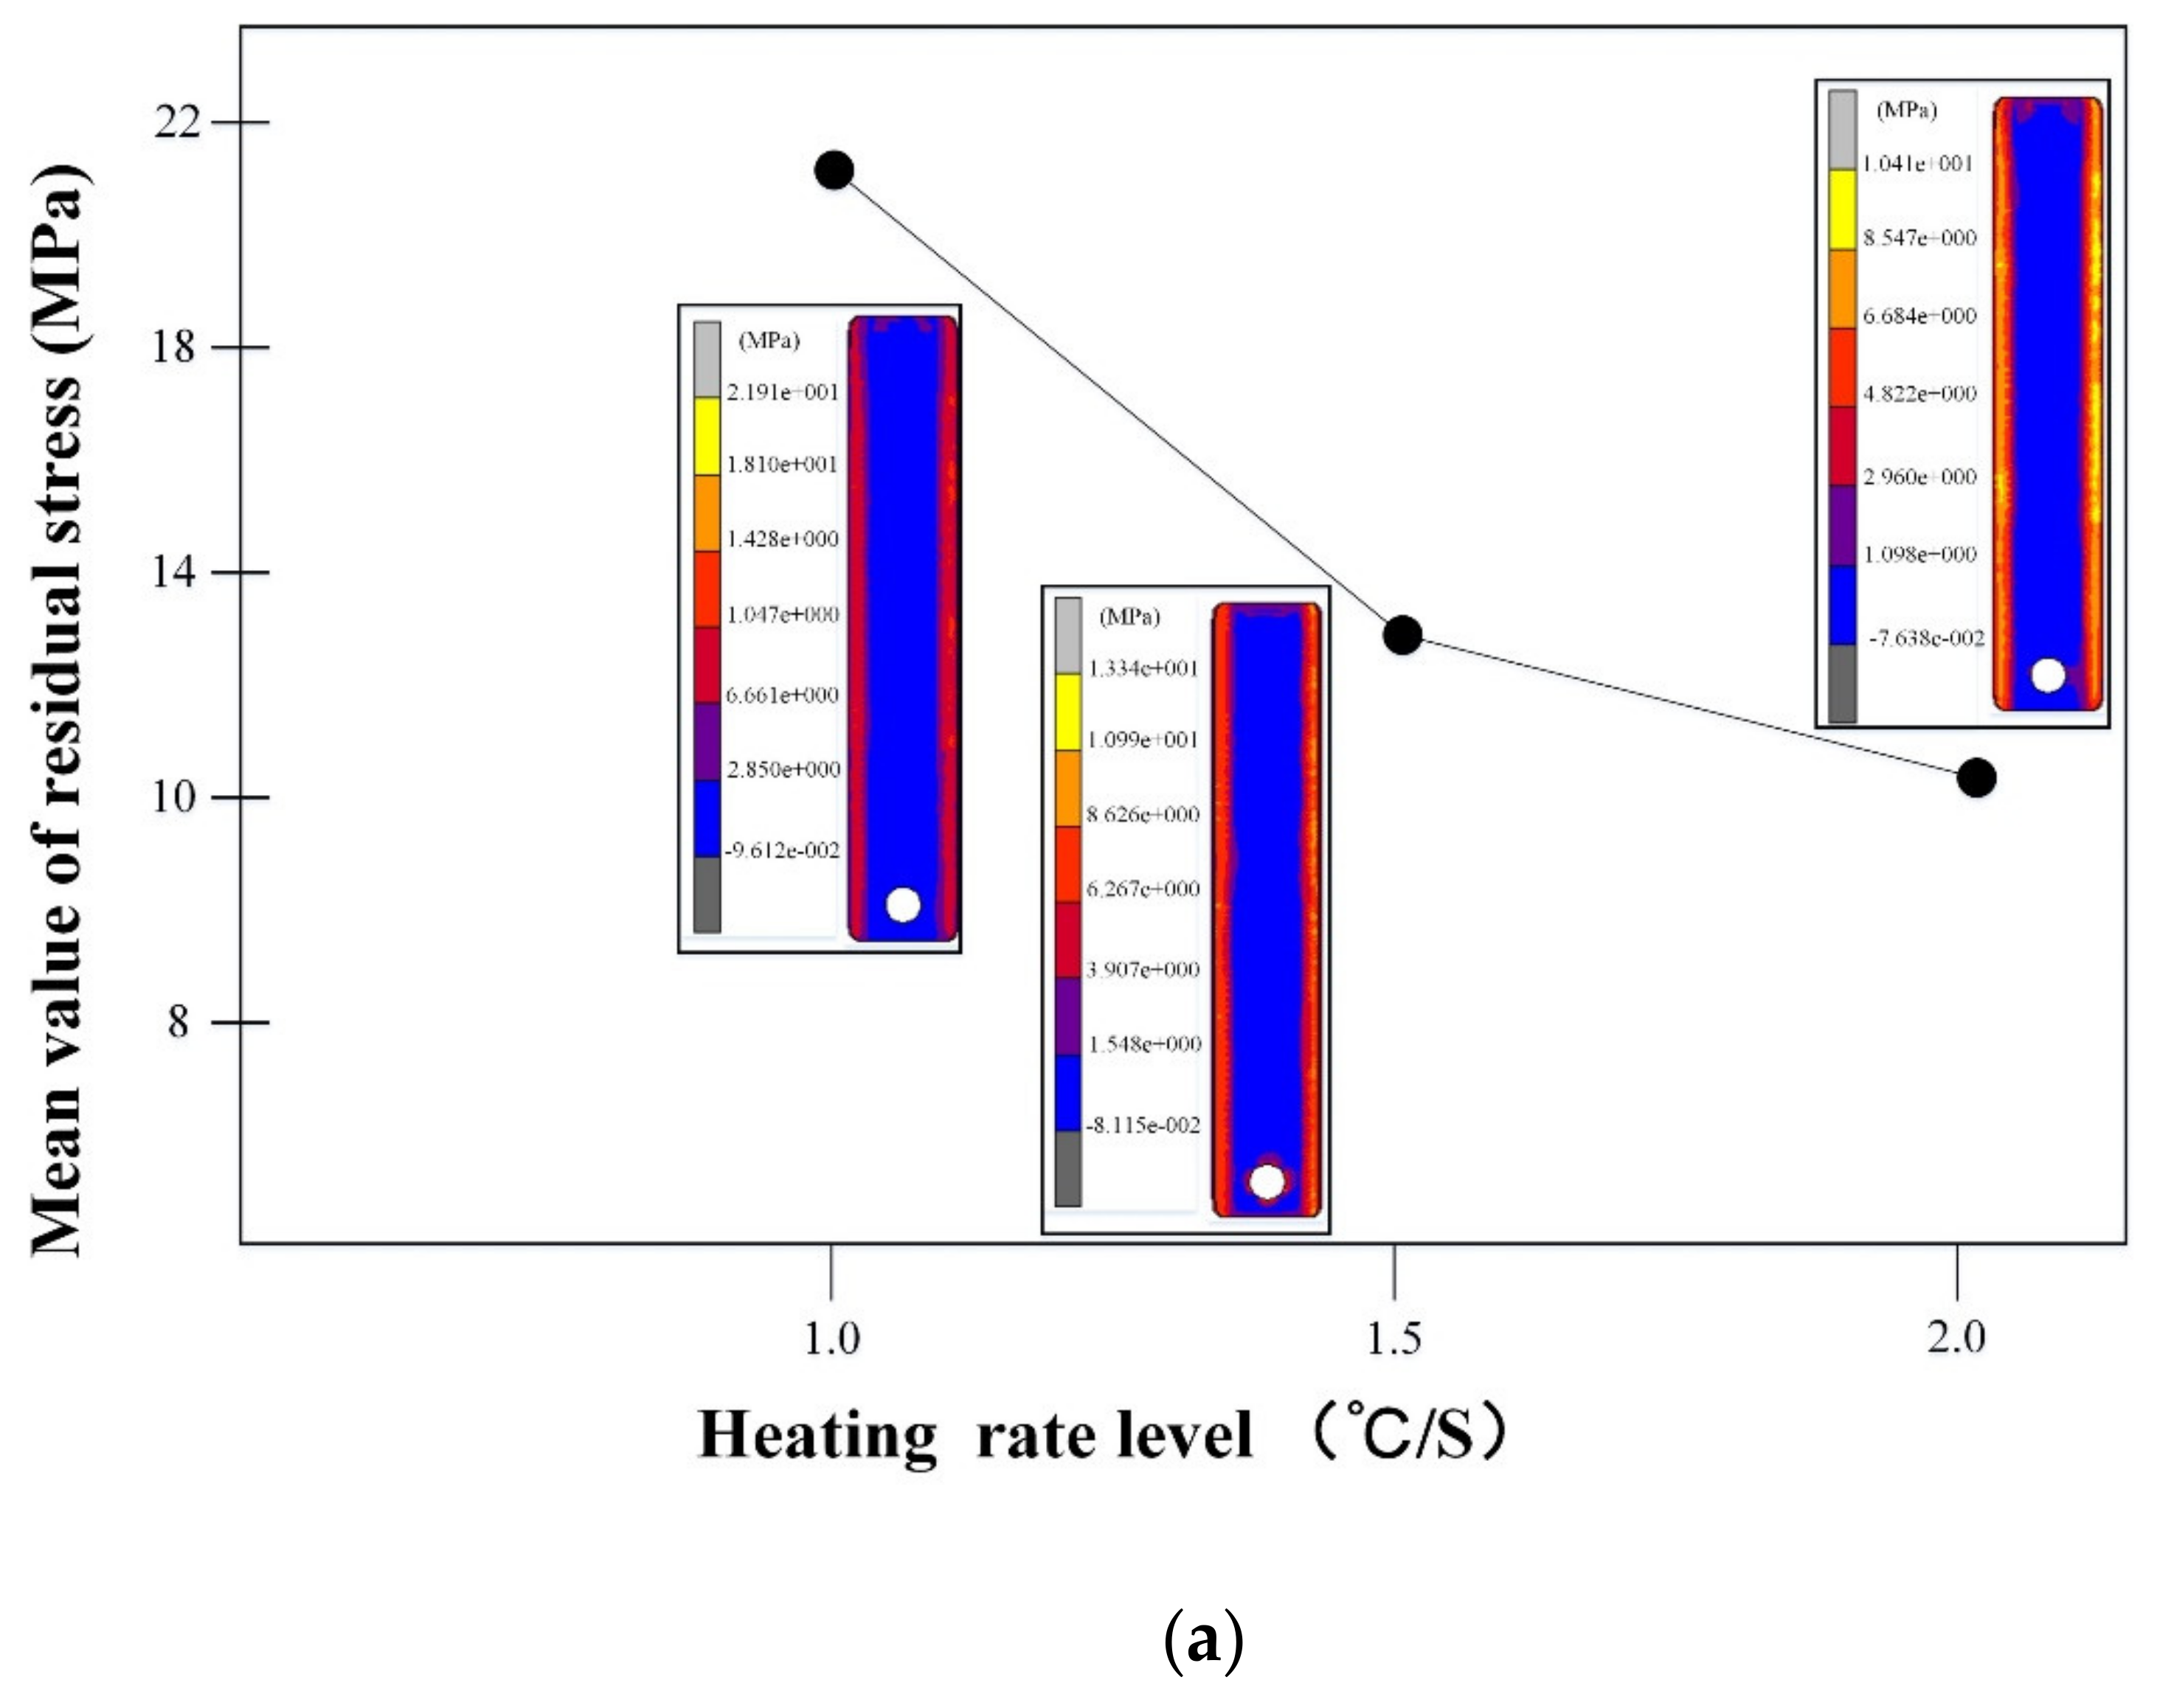
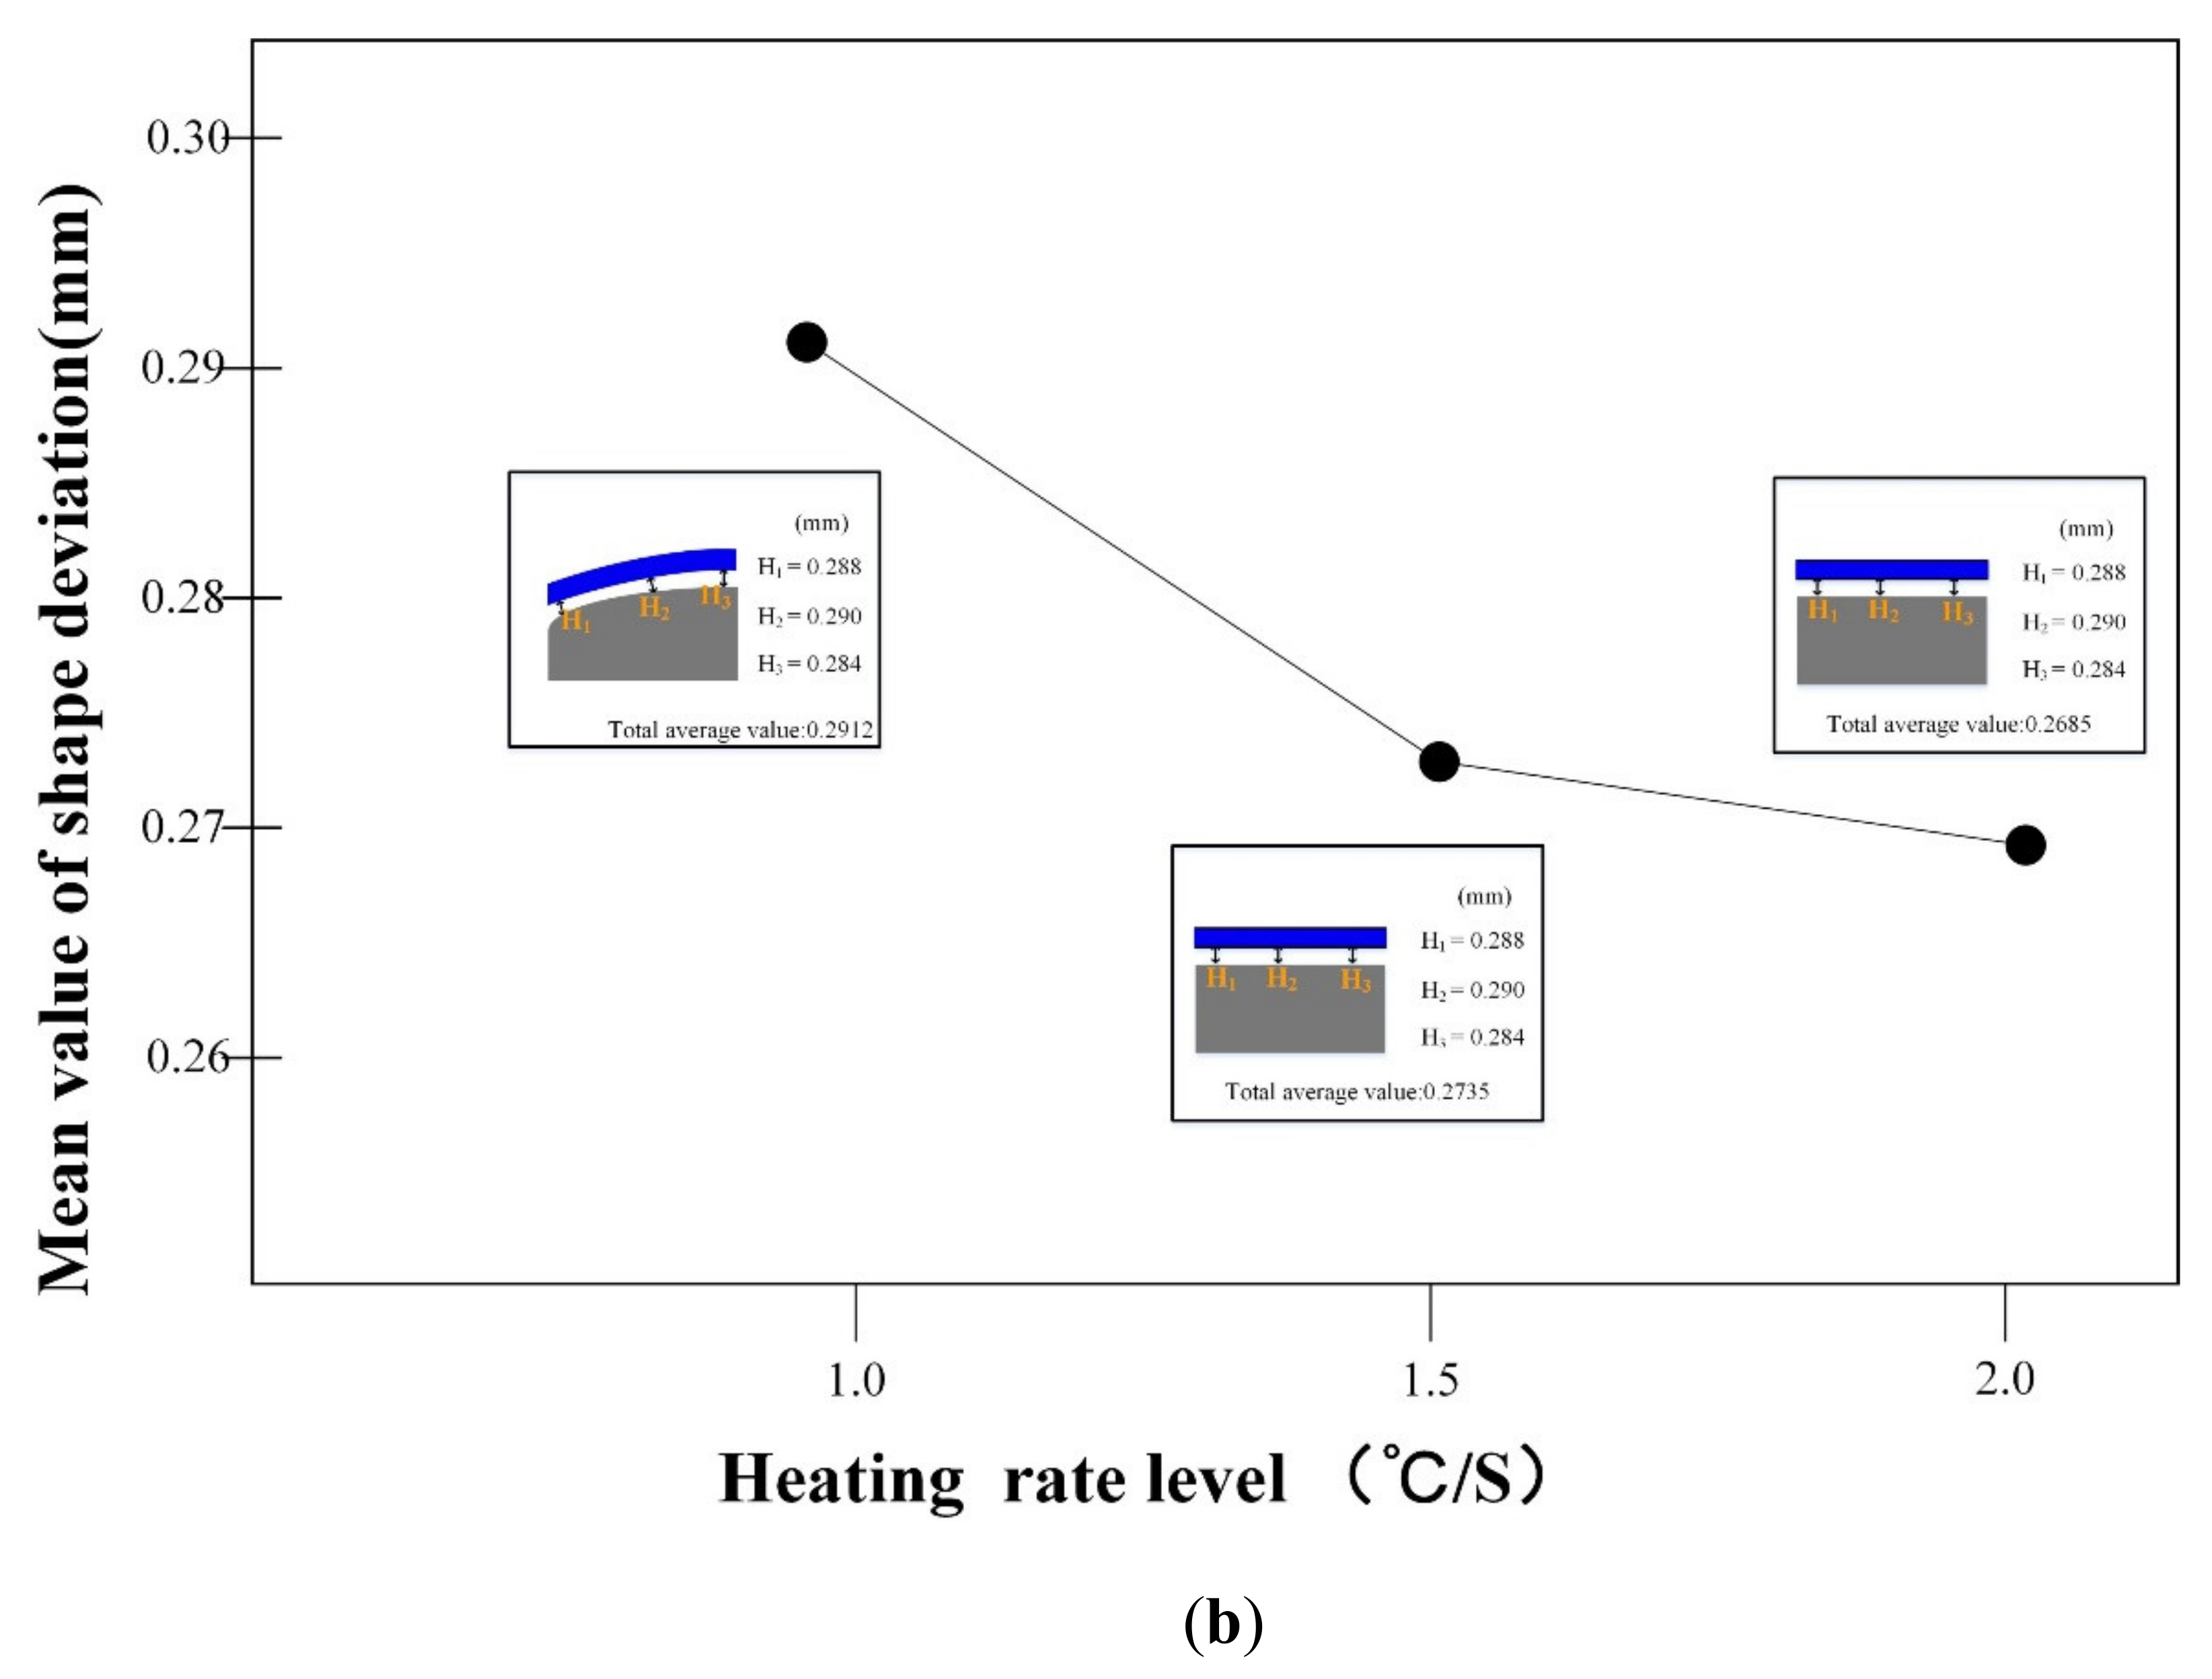
As shown in Figure 13a, with the increase of heating rate, the residual stress in the glass panel decreases significantly. When the molding temperature is 640 °C and the heating rate is 1 °C/s, the maximum residual stress is 21.91 MPa. When the heating rate rose to 2 °C/s the maximum residual stress decreased to 10.41 MPa.
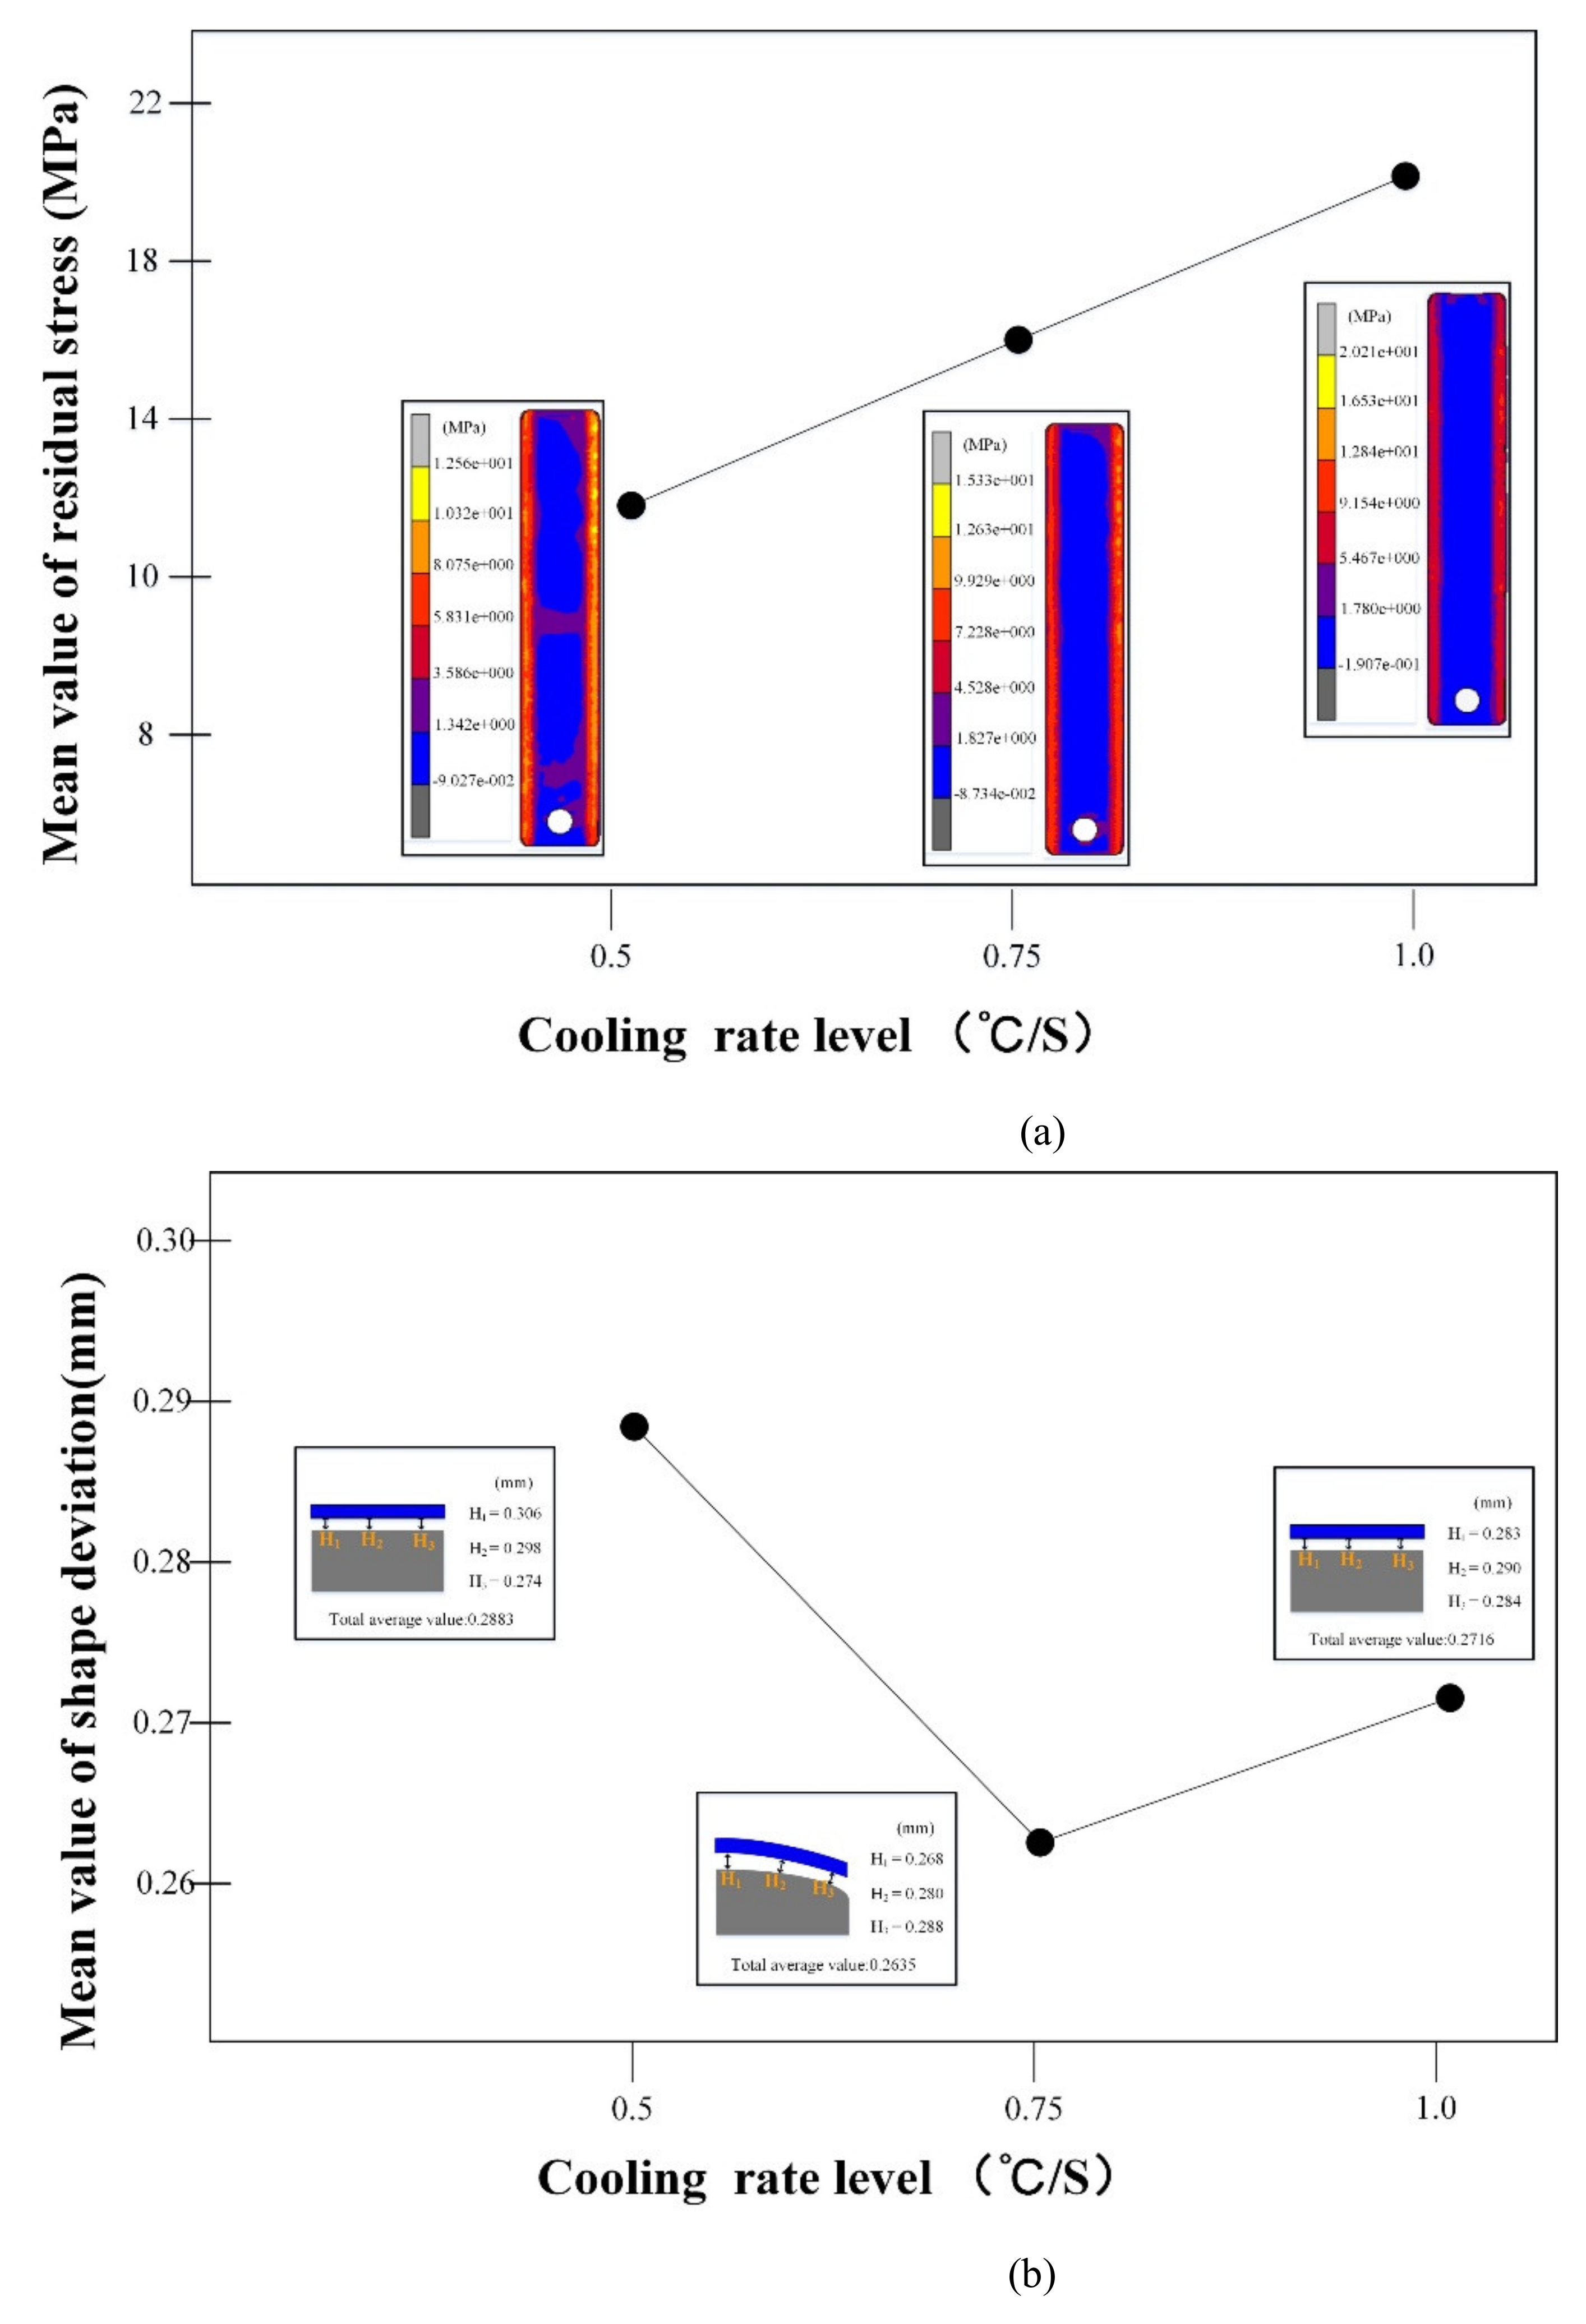
It can be seen from Figure 13b that the maximum residual stress of the glass is 12.56 MPa when the cooling rate is 0.5 °C/s. When the cooling rate increases to 1 °C/s, the maximum residual stress inside the glass plate increases to 20.21 MPa, showing an obvious linear relationship. This is because with the increase of cooling rate, the temperature difference of glass plate increases correspondingly, and the increase of temperature difference leads to larger residual stress. In addition, the increase of cooling rate leads to the decrease of annealing time, and the internal stress of glass plate is not completely eliminated.
5.3. Effect of Cooling Rate on Forming Quality
In the GMP experiment, it is divided into the heating soaking stage, molding stage and annealing cooling stage. To reduce the internal residual stress of the glass fingerprint touch plate at the end of pressing, annealing and cooling experiments are needed. This paper uses MSC. Marc finite element simulation software was used to simulate the annealing cooling experiment. In the annealing cooling experiment, the cooling rate has a significant influence on the experimental results. In order to study the influence of the cooling rate on the forming quality in the glass molding process, three groups of process experiments were carried out, and the parameter settings are shown in Table 4.
It can be seen from Figure 14a that the maximum residual stress of the glass is 12.56 MPa when the cooling rate is 0.5 °C/s. When the cooling rate increases to 1 °C/s, the maximum residual stress increases to 20.21 MPa. Within a certain temperature range, the residual stress increases with the increase of the cooling rate. On the one hand, the increase of cooling rate will lead to the corresponding increase of temperature change in the glass plate, and the change of temperature difference will also lead to the corresponding increase of residual stress. In addition, with the increase of cooling rate, the annealing time decreases and the internal stress of glass plate is less eliminated.
Figure 14b shows the effect of cooling rate on the ultimate shape deviation of the product during annealing. With the increase of the cooling rate from 0.5 °C/s to 1 °C/s, the shape deviation of the glass element first decreases and then increases. The turning point is at 0.75 °C/s, which is due to the decrease of annealing time with the increase of the cooling rate. According to the structural relaxation characteristics of the glass, the internal structure of the glass is not balanced, the deformation of the glass is reduced, and the shape deviation is correspondingly less. When the cooling rate is already too high, the mold will deform and the shape deviation of glass element will increase.
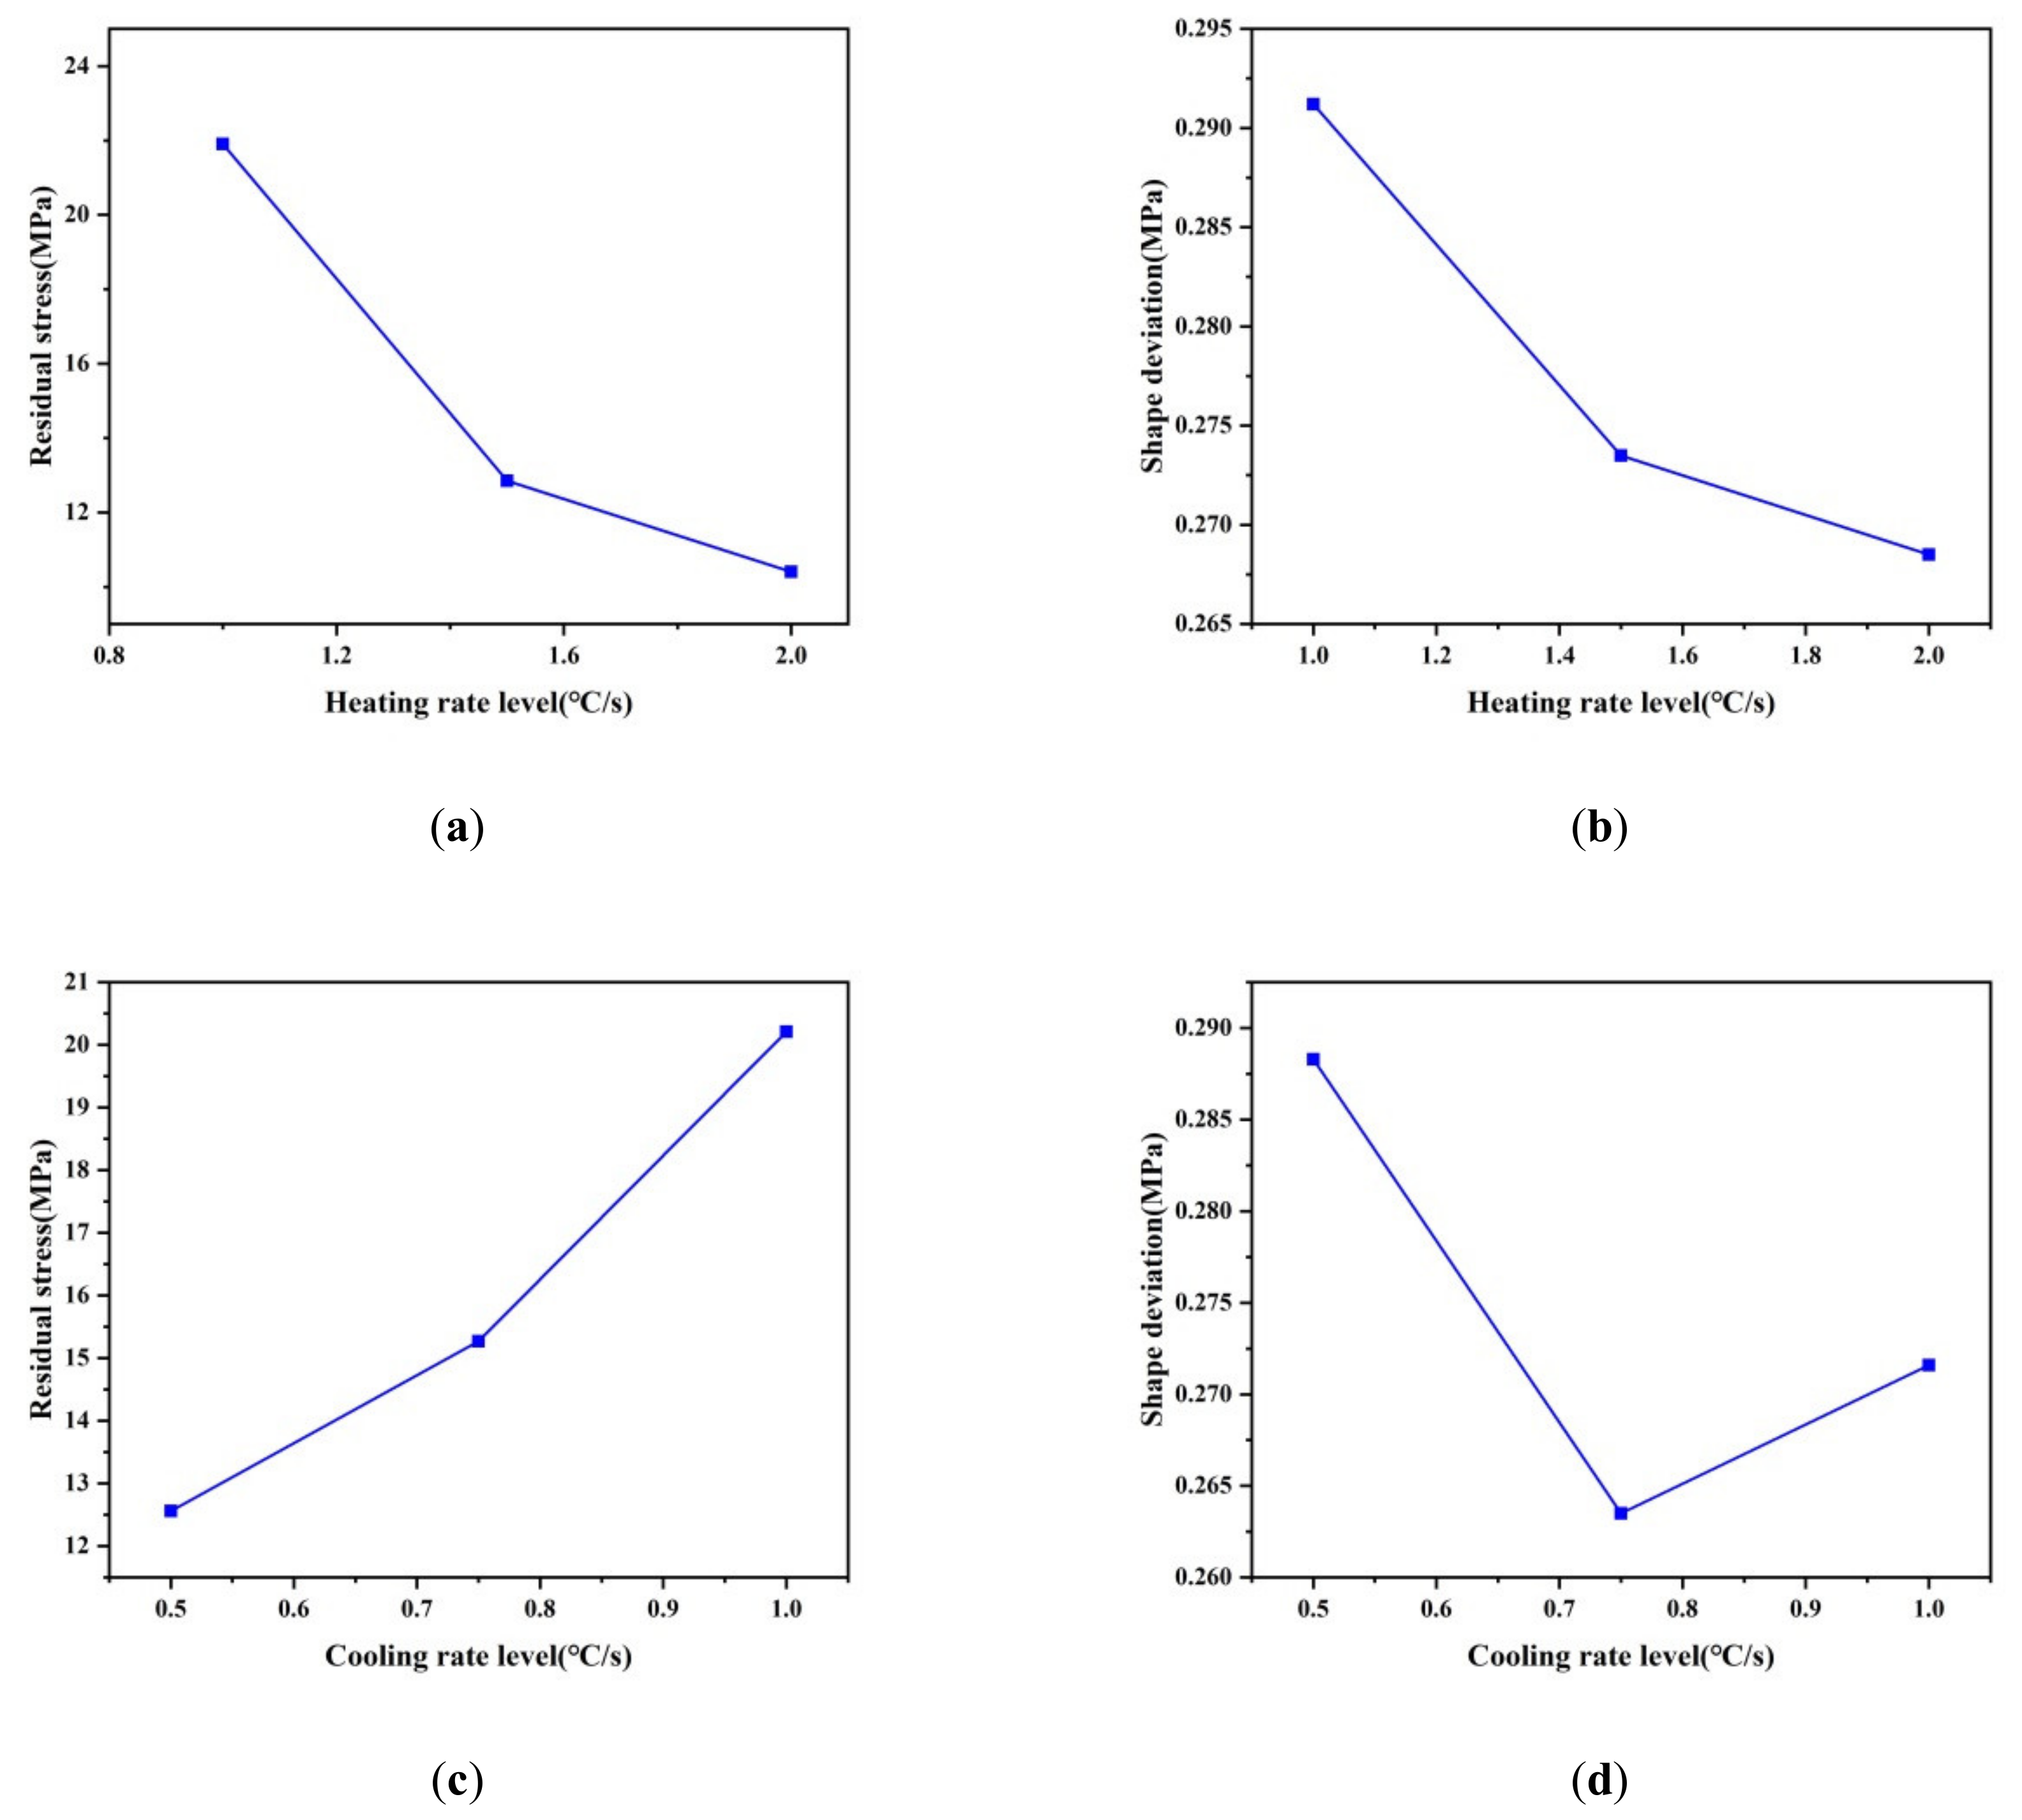
Figure 13 and Figure 14 show the effect of heating rate and cooling rate on the final molding quality of the glass fingerprint touch plate. The overall influence relationship can be showed in Figure 15. It can be seen from the figure that when the heating rate is 2.0 °C/s and the cooling rate is 0.75 °C/s, the forming quality of the glass fingerprint touch plate reaches the best.
5.4. Verification Experiment
In order to further verify that there is a certain degree of micro -geometric dimension deviation on the surface or inside of the formed product, this experiment uses a 3D high-precision tracking measurement scanner to carry out laser scanning measurement on the finished glass fingerprint touch plate. Because the measuring instrument is scanned by the principle of laser reflection, it is necessary to spray a thin layer of water paint on the surface of the glass fingerprint touch plate before measurement. First of all, the experiment is designed. The glass touch plate is divided into three areas; A, B and C, and each area is divided into three positions, which are represented by numbers 1–9 (as shown in Figure 16). A series of coordinates are obtained by scanning the glass fingerprint touch plate with a scanner, and the flatness of position 1–3 is recorded as A1–3. The flatness of position 4–6 is recorded as A4–6, and that of position 7–9 is recorded as A7–9. Area B and C are just like area A. The flatness is measured by the maximum height difference of this position. It should be pointed out that three glass fingerprint touch plates are selected for measurement in this experiment to ensure accurate analysis of product indexes in the forming process. The results are showed in Table 5.
It can be seen from the data in the above table that in the multi station molding process, the maximum error of the surface of the fingerprint lock glass fingerprint touch plate appears in the middle part. This is because the edge of the product is close to both sides of the mold during the annealing cooling process, and the shrinkage of the middle part is greater than that of the edge, which leads to the large surface error of the middle part of the product, but the maximum error is less than 0.05 mm. On the whole, the surface error of position C is slightly higher than that of positions A and B, which is caused by the shrinkage of fingerprint holes in the molding process.
6. Conclusions
In this paper, the whole process of GMP of fingerprint lock glass fingerprint touch plate is studied by combining numerical simulation and experiment. Through the analysis of molding temperature, heating rate, cooling rate and other process parameters, combined with finite element simulation and verification experiment, the following main conclusions are obtained.
(1) Molding temperature, heating rate and cooling rate have an extremely important impact on the residual stress and shape deviation of products. Setting heating rate 1.5 °C/s and cooling rate 1.0 °C/s, three groups of experiments were carried out with molding temperatures of 610 °C, 640 °C and 670 °C. The results show that the residual stress is small when the molding temperature is 610 °C, and the maximum temperature difference is small when the molding temperature is 670 °C. Considering the results of residual stress and temperature difference distribution, when the molding temperature is 640 °C, the heating rate is 2.0 °C/s and the cooling rate is 0.5 °C/s, the residual stress is small. When the heating rate is 2.0 °C/s and the cooling rate is 0.75 °C/s, the shape deviation is small.
(2) In this study, the stress relaxation and structural relaxation models of glass materials are used in the simulation numerical model. The heat transfer characteristics of the molding system are simulated, and the residual stress and shape deviation of the glass components are accurately predicted. The results demonstrate that the high stress (more than 10 MPa) is mainly distributed in the holes and bending regions of the glass components, and the maximum shape deviation occurs in the middle of the glass components.
(3) The temperature distribution, shape change and residual stress of the glass panel in the forming process are predicted through the simulation of multi position molding process parameters. As the verification experiment is designed, the glass plate is divided into three regions A, B and C, and each region has nine target points. The laser scanning of the glass plate is carried out by using the scanner. The experimental results show that the closer the fingerprint hole is, the higher the surface error is, and the error is 0.317 mm, which is consistent with the simulation results.
Author Contributions
Conceptualization, W.M.; methodology, W.M.; software, H.J.; validation, H.J. and K.L.; analysis, H.H.; investigation, H.H.; resources, Y.L.; data curation, H.J. and C.C.; writing—original draft preparation, H.J.; writing—original draft preparation, G.Z. and K.L.; funding acquisition, Y.L. All authors have read and agreed to the published version of the manuscript.
Funding
National Natural Science Foundation of China (NSFC) under Grant No.51975228, Natural Science Foundation of Guangdong Province under Grant No.2020A1515010638 & 2018A030313679, Local Innovative and Research Team Project of Guangdong Pearl River Talents Program under Grant No.2017BT01G167.
Data Availability Statement
Data is contained within the article.
Conflicts of Interest
The authors declare no conflict of interest.
References
- Li, J. On the New challenges of fingerprint identification technology. J. Liaoning Police Acad. 2012, 1, 76–79. [Google Scholar]
- Xin, Q. Manufacturing Technology of Optical Plastic Aspheric Surface; National Defence Industrial Press: Beijing, China, 2005; pp. 25–33. [Google Scholar]
- Wang, Y. Development and application of optical glass. J. Appl. Opt. 2005, 26, 61–66. [Google Scholar]
- Chen, M. Research on ultra-precision aspheric grinding technology; Harbin Inst: Harbin, China, 2011. [Google Scholar]
- Liu, W.; Shen, P.; Jin, N. Viscoelastic properties of chalcogenide glasses and the simulation of their molding processes. Phys. Procedia 2011, 19, 422–425. [Google Scholar] [CrossRef] [Green Version]
- Zhao, Y.; Yi, H. Glass Technology; Chemical IndustryPress: Beijing, China, 2006; pp. 95–116. [Google Scholar]
- Wang, Y. Numerical Simulation of Ultra-Precision Molding of Aspheric Optical Glass Lens; Hunan University: Hunan, China, 2011. [Google Scholar]
- Huo, J. Numerical Simulation and Simulation of Stress State and Molding Shape of Aspheric Glass Lens; Hunan University: Hunan, China, 2011. [Google Scholar]
- Xie, W. Numerical Simulation Analysis of Die Forming Of Microstructure Optical Element; Hunan University: Hunan, China, 2016. [Google Scholar]
- Yin, S.; Huo, J.; Zhou, T. Simulation of Heating and Pressure Parameters in Molding of Small Aperture Aspheric Lens; Hunan University: Hunan, China, 2011; Volume 38, pp. 35–39. [Google Scholar]
- Jain, A.; Yi, A.; Xie, X. Finite element modelling of stress relaxation in glass lens moulding using measured, temperature-dependent elastic modulus and viscosity data of glass. Model. Simul. Mater. Sci. Eng. 2006, 14, 465. [Google Scholar] [CrossRef]
- Ming, W.; Jia, H.; Zhang, H. A comprehensive review of electric discharge machining of advanced ceramics. Ceram. Int. 2020, 46, 21813–21838. [Google Scholar] [CrossRef]
- Yan, J.; Zhou, T.; Masuda, J. Modeling high-temperature glass molding process by coupling heat transfer and viscous deformation analysis. Precis. Eng. 2009, 33, 150–159. [Google Scholar] [CrossRef]
- Curan, A.; Gocalinska, A.; Pescaglini, A. Structural and Electronic Properties of Polycrystalline InAs Thin Films Deposited on Silicon Dioxide and Glass at Temperatures below 500 °C. Crystals 2021, 11, 160. [Google Scholar] [CrossRef]
- Tao, B.; Yuan, Y. FEM simulation of the effect of coefficient of thermal expansion and heat capacity on prediction of residual stresses of compression molded glass lenses. In Proceedings of the 2017 4th International Conference on Advanced Materials, Mechanics and Structural Engineering (4th AMMSE 2017), Tianjin, China, 22–24 September 2017. [Google Scholar]
- Kim, J.H.; Kong, J.; Chung, K. Analysis of annealing processes of glass sheets based on structural relaxation model. Int. J. Mech. Sci. 2013, 66, 249–259. [Google Scholar] [CrossRef]
- Blair, G.; Clarence, C. Method for Molding Glass Lens. U.S. Patent 3833347, 3 September 1974. [Google Scholar]
- Xiao, T. Rediscovery and Re-Expansion: Research on Glass Fusing and Slumping Process. Decorative 2015, 2, 81–83. [Google Scholar]
- Hong, J. Finite Element Analysis of Optical Glass (Micro) Hot Pressing(Ⅱ); National Chiao Tung University: Hsinchu, Taiwan, 2005. [Google Scholar]
- Zhou, S. Molding Simulation and Experimental Study of Small Aperture Aspheric Glass Lens; Hunan University: Hunan, China, 2016. [Google Scholar]
- Zhou, J.; Shi, T.; Hu, Y. Numerical simulation in compression molding of glass lens. In Proceedings of the 2013 IEEE International Conference on Automation Science and Engineering (CASE), Madison, WI, USA, 17–20 August 2013. [Google Scholar]
- Kordonsky, I.; Prokhorov, I.V.; Gieb, L.K. New high-precision magnetorheological instrument-based method of polishing optic. Osa T Workshop Dig. 1992, 24, 134–136. [Google Scholar]
- Xiaobing, Z.; Center, E.T. Review on manufacture and measurement method of aspheric surface optical part. Ordnance Mater. Sci. Eng. 2014, 37, 106–111. [Google Scholar]
- Yi, A.Y.; Jain, A. Compression Molding of Aspherical Glass Lenses–A Combined Experimental and Numerical Analysis. J. Am. Ceram. Soc. 2005, 88, 579–586. [Google Scholar] [CrossRef]
- Cha, D.H.; Park, H.S.; Hwang, Y. Experimental study of glass molding process and transcription characteristics of mold surface in molding of aspheric glass lense. Opt. Rev. 2011, 18, 241–246. [Google Scholar] [CrossRef]
- Zheng, C. Study on chalcogenide infrared glass for precision molding; Xi’an Technological University: Xi’an, China, 2009. [Google Scholar]
- Ma, T.; Yu, J.; Wang, S. Precision molding manufacturing of small aperture thin glass lens. Infrared and laser engineering. Infrared Laser Eng. 2011, 40, 87–90. [Google Scholar]
- Zhao, W.; Chen, Y.; Shen, L.; Allen, Y.Y. Investigation of the refractive index distribution in precision compression glass molding by use of 3D tomography. Meas. Sci. Technol. 2009, 20, 055109. [Google Scholar] [CrossRef]
- Masahiro, A.; Yuusuke, K. Characterization of the Thermo-Viscoelastic Property of Glass and Numerical Simulation of the Press Molding of Glass Lens. J. Therm. Stresses 2009, 32, 1235–1255. [Google Scholar]
- Zhu, K. Numerical Simulation and Experimental Study on Molding of Optical Glass Lens; Hunan University: Hunan, China, 2013. [Google Scholar]
- Zhao, W.; Chen, Y.; Shen, L.; Allen, Y.Y. Refractive index and dispersion variation in precision optical glass molding by computed tomography. Appl. Opt. 2009, 48, 3588–3595. [Google Scholar] [CrossRef] [PubMed]
- Aronen, A.; Karvinen, R. Effect of glass temperature before cooling and cooling rate on residual stresses in tempering. Glass Struct. Eng. 2018, 3, 3–15. [Google Scholar] [CrossRef]
- Jain, A.; Yi, A.Y. Numerical modeling of viscoelastic stress relaxation during glass lens forming process. J. Am. Ceram. Soc. 2010, 88, 530–535. [Google Scholar] [CrossRef]
- Ohmori, H. Electrolytic In-process Dressing (ELID) grinding method for ultra-precision mirror surface grinding. Int. J. Jpn. Soc. Precis. Eng. 1993, 59, 1451–1454. [Google Scholar] [CrossRef] [Green Version]
- Tain, Y.; Kawata, K. Development of High-Efficiency Fine Finishing Process Using Magnetic Fluid. Ann. Cirp 1984, 33, 217–220. [Google Scholar] [CrossRef]
- Nieto, D.; Flores-Arias, M.T.; O’ Connor, G.; Gomez-Reino, C. Laser direct-write technique for fabricating microlens arrays on soda-lime glass with a Nd: YVO4 laser. Appl. Opt. 2010, 49, 4979–4983. [Google Scholar] [CrossRef] [Green Version]
- Yin, S.; Wang, Y.; Zhu, K. Numerical simulation of ultra-precision molding of micro aspheric glass lens. Acta Photonica Sin. 2010, 39, 2020–2024. [Google Scholar]
- He, W.; Chen, Z.; Ming, W. Multi-objective optimization of glass multi-station bending machining. J. Braz. Soc. Mech. Sci. Eng. 2019, 41, 476. [Google Scholar] [CrossRef]
Figure 1.
Glass fingerprint touch plate of different smart locks; (a) 3D fingerprint lock glass touch plate; (b) 3D code lock glass touch plate.
Figure 1.
Glass fingerprint touch plate of different smart locks; (a) 3D fingerprint lock glass touch plate; (b) 3D code lock glass touch plate.

Figure 2.
Schematic diagram of multi station bending process (heating stations, molding stations and annealing and cooling stations).
Figure 2.
Schematic diagram of multi station bending process (heating stations, molding stations and annealing and cooling stations).

Figure 3.
Theoretical model of glass materials. (a) Generalized Maxwell model; (b) Simple thermos-rheological phenomena.
Figure 3.
Theoretical model of glass materials. (a) Generalized Maxwell model; (b) Simple thermos-rheological phenomena.

Figure 4.
Structural relaxation phenomenon of viscoelastic glass material [28].
Figure 4.
Structural relaxation phenomenon of viscoelastic glass material [28].

Figure 5.
Schematic diagram of glass heat source.

Figure 6.
Intelligent fingerprint lock glass fingerprint touch plate bending machine.

Figure 7.
Boundary conditions of three stages.

Figure 8.
Finite element model and mold of fingerprint lock glass touch plate.

Figure 9.
Temperature difference distribution results (molding temperature 610 °C, 640 °C, 670 °C; heating rate 1.5 °C/s, cooling rate 1 °C/s). (a) The maximum temperature difference is 2.3 °C; (b) The maximum temperature difference is 1.0 °C; (c) The maximum temperature difference is 0.6 °C.
Figure 9.
Temperature difference distribution results (molding temperature 610 °C, 640 °C, 670 °C; heating rate 1.5 °C/s, cooling rate 1 °C/s). (a) The maximum temperature difference is 2.3 °C; (b) The maximum temperature difference is 1.0 °C; (c) The maximum temperature difference is 0.6 °C.

Figure 10.
Residual stress results (molding temperature 610 °C, 640 °C, 670 °C; heating rate 1.5 °C/s, cooling rate 1 °C/s). (a) The maximum residual stress is 15.5 MPa; (b) The maximum residual stress is 19.9 MPa; (c) The maximum residual stress is 26.9 MPa.
Figure 10.
Residual stress results (molding temperature 610 °C, 640 °C, 670 °C; heating rate 1.5 °C/s, cooling rate 1 °C/s). (a) The maximum residual stress is 15.5 MPa; (b) The maximum residual stress is 19.9 MPa; (c) The maximum residual stress is 26.9 MPa.

Figure 11.
Shape deviation of a final glass device.

Figure 12.
Shape deviation of final glass device; (a) the bending temperature is 610 °C and the average gap is 0.2860 mm; (b) the bending temperature is 640 °C and the average gap is 0.2839 mm; (c) the bending temperature is 670 °C and the average gap is 0.2776 mm.
Figure 12.
Shape deviation of final glass device; (a) the bending temperature is 610 °C and the average gap is 0.2860 mm; (b) the bending temperature is 640 °C and the average gap is 0.2839 mm; (c) the bending temperature is 670 °C and the average gap is 0.2776 mm.

Figure 13.
Effect of heating rate on residual stress. (a) Effect of heating rate on residual stress; (b) Effect of heating rate on shape deviation.
Figure 13.
Effect of heating rate on residual stress. (a) Effect of heating rate on residual stress; (b) Effect of heating rate on shape deviation.


Figure 14.
Effect of cooling rate on residual stress. (a)Effect of cooling rate on residual stress; (b) Effect of cooling rate on shape deviation.
Figure 14.
Effect of cooling rate on residual stress. (a)Effect of cooling rate on residual stress; (b) Effect of cooling rate on shape deviation.

Figure 15.
Relationship between process parameters and forming quality; (a) Effect of heating rate on residual stress; (b) Effect of heating rate on shape deviation; (c) Effect of heating rate on residual stress; (d) Effect of heating rate on shape deviation.
Figure 15.
Relationship between process parameters and forming quality; (a) Effect of heating rate on residual stress; (b) Effect of heating rate on shape deviation; (c) Effect of heating rate on residual stress; (d) Effect of heating rate on shape deviation.

Figure 16.
Flatness measurement of glass fingerprint touch plate.


Table 1.
Mechanical Properties of glass and graphite.
| Properties | Glass | Graphite |
|---|---|---|
| Young’s modulus E(GPa) | 72.6 | 10.2 |
| Poisson rate ν | 0.206 | 0.25 |
| Density ρ(g/cm3) | 2.51 | 1.78 |
| Thermal conductivity K(W/m °C) | 1.1 | 151 |
| Specific heat Cp(J/Kg °C) | 858 | 720 |
| Thermal expansion coefficient (°C) | Liquid 3.43 × 10⁻⁵ Solid 1.143 × 10⁻⁵ | 4.8 × 10⁻⁶ |
Table 2.
Relaxation model parameters of G-11 glass.
| Properties | Time(s) | Value |
|---|---|---|
| Stress relaxation (Shear modulus(MPa)) | 0.0689 | 12566 |
| 0.0065 | 12615 | |
| 0.0001 | 4582 | |
| Structural relaxation (Weights) | 3.0 | 0.108 |
| 0.671 | 0.443 | |
| 0.247 | 0.166 | |
| 0.091 | 0.161 | |
| 0.033 | 0.046 | |
| 0.008 | 0.077 |
Table 3.
Parameter setting of heating rate.
| Number | Heating Rate A(s) | Holding Time B(°C) | Bending Temperature C(°C) | Bending Pressure D(MPa) | Cooling Rate E(°C/s) |
|---|---|---|---|---|---|
| 1 | 1 | 120 | 640 | 50 | 1.0 |
| 2 | 1.5 | 120 | 640 | 50 | 1.0 |
| 3 | 2.0 | 120 | 640 | 50 | 1.0 |
Table 4.
Parameter setting of cooling rate.
| Number | Cooling Rate A(°C/s) | Heating Rate B (s) | Holding Time C(°C) | Bending Temperature D(°C) | Bending Pressure E(MPa) |
|---|---|---|---|---|---|
| 1 | 0.5 | 1.5 | 120 | 640 | 50 |
| 2 | 0.75 | 1.5 | 120 | 640 | 50 |
| 3 | 1.0 | 1.5 | 120 | 640 | 50 |
Table 5.
Flatness of glass fingerprint touch plate.
| Region | Planeness(mm) | Region | Planeness(mm) | Region | Planeness(mm) |
|---|---|---|---|---|---|
| A1–3 | 0.02 | B1–3 | 0.03 | C1–3 | 0.035 |
| A4–6 | 0.033 | B4–6 | 0.034 | C4–6 | 0.045 |
| A7–9 | 0.01 | B7–9 | 0.023 | C7–9 | 0.015 |
| A | small | B | medium | C | large |
Publisher’s Note: MDPI stays neutral with regard to jurisdictional claims in published maps and institutional affiliations. |
© 2021 by the authors. Licensee MDPI, Basel, Switzerland. This article is an open access article distributed under the terms and conditions of the Creative Commons Attribution (CC BY) license (https://creativecommons.org/licenses/by/4.0/).
Share and Cite
MDPI and ACS Style
Ming, W.; Jia, H.; Huang, H.; Zhang, G.; Liu, K.; Lu, Y.; Cao, C. Study on Mechanism of Glass Molding Process for Fingerprint Lock Glass Plates. Crystals 2021, 11, 394. https://0-doi-org.brum.beds.ac.uk/10.3390/cryst11040394
AMA Style
Ming W, Jia H, Huang H, Zhang G, Liu K, Lu Y, Cao C. Study on Mechanism of Glass Molding Process for Fingerprint Lock Glass Plates. Crystals. 2021; 11(4):394. https://0-doi-org.brum.beds.ac.uk/10.3390/cryst11040394
Chicago/Turabian StyleMing, Wuyi, Haojie Jia, Heyuan Huang, Guojun Zhang, Kun Liu, Ya Lu, and Chen Cao. 2021. "Study on Mechanism of Glass Molding Process for Fingerprint Lock Glass Plates" Crystals 11, no. 4: 394. https://0-doi-org.brum.beds.ac.uk/10.3390/cryst11040394
Note that from the first issue of 2016, this journal uses article numbers instead of page numbers. See further details here.