Review

Boron Influence on Defect Structure and Properties of Lithium Niobate Crystals

by
Nikolay V. Sidorov
*,
Natalia A. Teplyakova
,
Olga V. Makarova
,
Mikhail N. Palatnikov
,
Roman A. Titov
,
Diana V. Manukovskaya
and
Irina V. Birukova
Tananaev Institute of Chemistry–Subdivision of the Federal Research Centre, Kola Science Centre of the Russian Academy of Sciences, 26 a, Akademgorodok, 184209 Apatity, Murmansk region, Russia
*
Author to whom correspondence should be addressed.
Submission received: 26 March 2021 / Revised: 16 April 2021 / Accepted: 19 April 2021 / Published: 21 April 2021
(This article belongs to the Special Issue Raman Spectroscopy of Crystals Volume II)

Abstract

:
Defect structure of nominally pure lithium niobate crystals grown from a boron doped charge have been studied by Raman and optical spectroscopy, laser conoscopy, and photoinduced light scattering. An influence of boron dopant on optical uniformity, photoelectrical fields values, and band gap have been also studied by these methods in LiNbO3 crystals. Despite a high concentration of boron in the charge (up to 2 mol%), content in the crystal does not exceed 10−4 wt%. We have calculated that boron incorporates only into tetrahedral voids of crystal structure as a part of groups [BO3]3−, which changes O–O bonds lengths in O6 octahedra. At this oxygen–metal clusters MeO6 (Me: Li, Nb) change their polarizability. The clusters determine optically nonlinear and ferroelectric properties of a crystal. Chemical interactions in the system Li2O–Nb2O5–B2O3 have been considered. Boron, being an active element, structures lithium niobate melt, which significantly influences defect structure and physical properties of a crystal grown from such a melt. At the same time, amount of defects NbLi and concentration of OH groups in LiNbO3:B is close to that in stoichiometric crystals; photorefractive effect, optical, and compositional uniformity on the contrary is higher.

1. Introduction

Lithium niobate (LN, LiNbO3) attracts attention due to its possible applications in integral and nonlinear optics, pure optics (generation of optical harmonics, lasing parametric generation, electro-optics, optical amplification, and conversion of optical radiation), acoustoelectronics (bandpass filters and SAW delay lines), quantum electronics, and solid state physics [1,2,3,4]. The equipment associated with modern optoelectronic and telecommunication technologies often includes LN crystals. Such applications claim LN crystals with high optical uniformity and optical damage resistance. Thus, a study of their defect structure and optical characteristics in dependence on obtaining conditions are highly relevant.
A LiNbO3 crystal is a non-stoichiometric oxygen octahedral ferroelectric with high Curie temperature (1420 K), spontaneous polarization (PS = 5 × 10⁻⁵ C/cm2) and a wide homogeneity region on the phase diagram (44.5–50.5 mol % Li2O at 1460 K). LN should be considered as a solid solution LiNbO3:Nb [5,6]. Doping by a wide spectrum of metal elements is possible due to an octahedral coordination of metal ions in the LN structure. At this a significant however preserving symmetry distortion of MeO6 (Me: Li+, Nb5+, dopant) octahedra can occur [1,2,7]. All these factors provide a possibility to control physical characteristics of the material. Being a phase of a variable composition, LN crystal has a highly developed defect structure. Optical damage (photorefractive effect) is determined by defects with localized electrons; such defects form photoelectric fields. LN is in general characterized by high values of photoelectric fields and photorefraction effect. The latter can be varied in a very wide range [1,2,8].
Optical damage resistance can be increased in congruent LN (CLN, R = Li/Nb = 0.946) crystals by their doping with non-photorefractive (Me: Zn, Mg, In, etc.) cations [2]. Unlike multiply charged photorefractive cations, they do not change their charge state in the crystal (they are not electron donors) under the action of optical radiation. The influence of such dopants on crystal properties is caused by their ability to change the amount of point defects and linked molecular complexes in the crystal cation sublattice. The molecular complexes in question can be caused by OH groups in the crystal structure [1,2,9,10,11]. Point defects NbLi are Nb5+ cations in the Li+ sites of a perfect stoichiometric (SLN, R = 1) LN composition. They, along with transition metal impurities (for example, Fe), are deep electron traps and influence photorefractive effect the most [1,2]. Moreover, a LN structure contains a lot of shallow electron traps besides NbLi that influence photorefractive effect [12]. The complexity of LN doping task increases provided that significant concentrations of metal dopants inevitably lead to a disorder in optical and structural uniformity of a single crystal [1,2,9,10,11,13].
Moreover, LN crystal grown at air always contain 1016–1018 cm−3 protons bonded with oxygen by a hydrogen bond. Hydrogen atoms form such complex defects as VLi-OH, NbLi-OH, etc., [7,14,15]. OH-groups play important role in formation of a secondary defect structure and physical characteristic of the material: it increases low-temperature conductivity, decreases photorefractive effect and coercive field value [7,14,15].
LN doping by metals is intensely studied [16]. At the same time, an influence of non-metal dopants on crystallization, structure, and optical characteristics of LN has not been paid enough attention. It has only been shown before [17,18,19], that significant changes in LN crystals properties occur while doped by much smaller amounts of a non-metal, than a metal.
Non-metals influence mechanisms on melt-crystal system physical properties are different from those of metals. Non-metals are unable of incorporation into O6 octahedra of LN crystal structure. This is why studies of non-metal cations influence on LN structure are scarce. However, it has been determined before [19,20] that addition of B2O3 flux to LN charge leads to an increase in the crystal Curie temperature (TC) by ~47K and melting temperature by ~10K, compared to properties of a nominally pure CLN crystal. At this photorefractive effect significantly decreased even at excitation by a powerful (200 mW) laser radiation [2]. The data show that addition of boron into the charge change melt and thus LN structure. The charge contains relatively high B2O3 concentration (up to ~2.0 mol%), however, the final concentration of boron in a LiNbO3:B crystal is only ≈4 × 10⁻⁵ through ≈4 × 10⁻⁴ mol% B2O3, which is comparable with a basic concentrations of traces of many uncontrolled metal impurities [21,22,23,24,25].
Today, growing nominally pure LN crystals from under a B2O3 flux is a new and weakly studied area. Only few papers have been published on this topic yet [21,22,23,24,25]. Literature contains even fewer works on a secondary structure of such crystals. At the same time, it is a well-known fact that secondary structure strongly influences physical properties of oxygen octahedral phases of a variable composition, such as LN crystals. In particular, secondary structure influences photorefractive effect, coercive field strength, and concentration thresholds [2,26,27]. Addition of certain concentrations of B2O3 flux to the charge allows one to grow LN crystals with a high compositional uniformity close to that of CLN crystals. At the same time, cation sublattice units order of LiNbO3:B nears that of SLN crystals, but with much smaller photorefractive effect [21,22,23,24,25].
SLN and NSLN (near stoichiometric lithium niobate) crystals have low coercive field strength. It is ~3 kV/mm in SLN and ~22.3 kV/mm in CLN. Thus, SLN and NSLN crystals are perspective materials for laser radiation conversion on periodically polarized micron and submicron domain structures [28]. However, SLN crystals grown from Nb2O5–Li2O melt with 58.6 mol% Li2O have a smaller uniformity of refractive index along the polar axis and greater optical damage than CLN crystals [2]. This flaw makes SLN crystals inapplicable for optical elements manufacturing. An increase in optical uniformity and optical damage resistance of SLN and NSLN crystals is achieved by two methods. The first one is HTTSSG (High Temperature Top Seeded Solution Growth) with addition ~6 wt% of K2O flux (LN:K2O crystals) [29]. Recent papers [21,22,23,24,25] report the other know way: NSLN crystals with a high optical quality can be obtained from a congruent charge with a B2O3 flux (LiNbO3:B crystals). Doping LN with boron allows us to combine approaching stoichiometric composition and NbLi defects concentration decrease. As long as it is important to know technological details of obtaining of different types of highly useful LN crystals, it also is important to learn how different concentration of B exactly influence LN melt and thus structure and other properties.
In this work we bring together data from optical and atomic force microscopy, optical spectroscopy, Raman spectroscopy, laser conoscopy, photoinduced light scattering (PILS), IR-spectroscopy in the region of stretching vibrations of OH groups and computer simulation of the defect structure. Methods have been applied to nominally pure NSLN crystals grown by different technologies from a charge doped by boron (0.55–1.24 mol% B2O3 in a charge). As long as grown crystals have approximately the same traces amount of boron in their structure, we consider that the designation in mol% means the B2O3 content in the charge. We also present a review of chemical interactions taking place in systems Li2O–Nb2O5 and Li2O–Nb2O5–B2O3. Such interactions determine fine features of the melt, crystallization, and crystals. Results for LiNbO3:B (0.55–1.24 mol%) crystals were compared with those of SLN and CLN crystals obtained due to a traditional technologies.
IR adsorption and Raman spectra are highly sensitive to changes in a crystal structure, thus, defectivity. Sites occupied by hydrogen in LN structure are the most sensitive ones to crystal field changes. The fundamental absorption edge position and features are sensitive towards the structural uniformity of the crystal [14,18,23,24,29,30]. These two methods also allow one to evaluate Li/Nb ratio, concentration of point defects NbLi and VLi, type of complex defects that include OH-groups. PILS speckle-structure can be used to calculate photoelectric fields (photovoltaic Epv and diffuse ED) using approach offered in [31].

2. Materials and Methods

2.1. Specific Features of Obtaining Nominally Pure LN Crystals from a Boron Doped Charge and the Method of Their Experimental Studies

Studied nominally pure CLN and LiNbO3:B (0.55–1.24 mol%) crystals were grown from a congruent melt [16]. Doping was carried out both by homogeneous doping of Nb2O5 precursor [32] and direct solid-phase doping of LN charge [20,33]. Direct doping is a solid-phase synthesis of niobium pentoxide, lithium carbonate and boric acid with the subsequent production of a granular charge during annealing at pre-melting temperatures at 1240–1250 °C. This method was used to grow LiNbO3:B (0.55–0.83 mol%) crystals. Nevertheless, the method itself has several disadvantages: LN crystals have articulated secondary structure and a number of macro-defects [33,34] (Appendix A, Figure A1, Figure A2, Figure A3, Figure A4, Figure A5, Figure A6, Figure A7, Figure A8, Figure A9, Figure A10, Figure A11 and Figure A12).
Macro- and microdomain structure of doped LN crystals was studied by an image processing system «Thixomet». The system includes optical microscope Axio Observer D1m (Carl Zeiss, Oberkochen, Germany) connected through digital video camera PixeLink PL-B774U (Pixelink, Ottawa, Canada) with a computer equipped with the program ThixometPRO (Thixomet, Saint Petersburg, Russia). Studies were carried out in bright field and differential interference contrast. Fine crystal plates of Z– and X–orientation were pre-ground, polished and selectively etched at room temperature for 18 h in the HF:HNO3 = 1:3 mixture. Nanostructures of doped crystals were studied by atomic force microscopes CMM-2000 (Zavod “Proton” MIET, Moscow, Russia) and Nano-R (Pacific Nano Technology, Santa Clara, CA, USA).
Earlier we have shown [19,20] that LN crystals with a high optical quality and a low photorefractive effect can be grown from a charge containing no more than ~0.1 to 0.12 wt%. For example, LiNbO3:B crystals grown from melts with ~0.12 to 0.25 wt% B2O3 contained microstructure defects absent in other LN crystals types.
The melt viscosity greatly increases at high boron content: a high complexing ability of boron leads to formation of an anti-seeding viscous film on the melt surface. This results in growth of LiNbO3:B crystals with numerous macro- and micro-defects irremovable by after-growth annealing. Thus, growing LN from boron-containing melts required the development of new approaches and solutions to adapt the commonly used technology. Changes affected technological parameters of growth, intrinsic equipment of a growth camera and synthesis of initial charge methods [19,20,25]. Papers [19,20] have revealed not only changes in the growth parameters, but also specific macrodefects, which were found only in LiNbO3:B crystals: “channels” and deviation of optical density (optical inhomogeneity of crystals). “Channels” are almost cylindrical long curved holes inside a LiNbO3:B boule with a diameter ~1 to 200 μm. We have calculated the average density of such defects per 1 mm2 of the investigated area, ~0 to 7 mm−2, Figure 1. The crystals under consideration are a LiNbO3:B series with an increase content of boron in the melt ~0.12 to 0.25 wt%. The amount of “channels” decreases up to the total absence with a decrease in the boron concentration in the melt to ~0.1 wt%, as paper [20] claims. Deviation of optical density due to deviations in the melt viscosity was discovered when examining polished LiNbO3:B plates by optical microscopy in the differential interference contrast (DIC) mode. DIC mode is actively used to study unpainted transparent objects. The resulting image is conventionally colored since it is the result of the polarized light beam interference on structural objects with different optical density. They look like colored spots of various sizes and are usually observed together with “channels”, Figure 2. The latter is especially relevant for strongly doped melts. A colored with various pseudocolors structure without sharp boundaries is typical for all LiNbO3:B crystals that underwent only post-growth thermal annealing. Crystals turned to a single-domain state loose this type of a macrostructure, samples have uniform and monochrome image in a DIC mode, Figure 2e,f [19,20,25].
We have noted that using growth parameters suitable for obtaining of pure LN, LN:Zn or Mg at obtaining of LiNbO3:B leads to cellular growth in the boule bottom, Figure 3a. Such conditions also make the crystallization front more sensitive towards smallest thermal conditions violations: the hardly notable change in water pressure in the cooling circuit of the growth unit leads to a change in the LiNbO3:B boule diameter, Figure 3b. These macro- and micro-defects decrease the useful volume of the crystal, suitable for manufacturing of optical devices units.
Homogeneous doping essence is obtaining of Nb2O5:B precursor. Boric acid is added to a niobium strip product solution. The latter is obtained during extraction purification of niobium hydroxide [27,33]. Doped niobium pentoxide Nb2O5:B is used as a precursor during LN charge synthesis. A crystal LiNbO3:B (1.24 mol%) was grown from such a charge. Homogeneous doping allows us to grow crystals without growth stripes and other macro- and microdefects as those characteristic of direct doping [27]. Due to mass spectrometry, concentration of boron in crystals grown by both methods is close to traces (~10−3 to 10−5 wt%). Impurities concentrations were: Pb, Ni, Cr, Co, V, Ti, Fe, and Al less than 2 × 10⁻⁴, Ca, Si less than 1 × 10⁻³, F less than 1 × 10⁻³ wt%.

2.2. The Growing and Characterization Methods of the LN Crystals

An SLN crystal was grown from a melt with 58.6 mol% Li2O. Growing of stoichiometric LN crystals is a complex technical task due to a crystal’s wide homogeneity area on a phase diagram [4,7,35]. A great difference between the melt and crystal compositions require a decrease in growth velocity V several orders of magnitude. This suppresses concentration over-cooling that can lead to changes in the crystal composition at different stages of the growth. Thus, even at a very small growth velocity (much less than V = 0.1 mm/h), one can obtain a crystal 10 mm in diameter and 4 mm long from 200 g of melt. Its optical uniformity Δn (where n is a refractive index) is compared with that of CLN crystals of the same diameter grown at a velocity V = 3–5 mm/h [36]. Traditional technology provides very little possibility to obtain SLN single crystals of a big enough diameter to create optical elements suitable in optical instrumentation, quantum electronics, etc.
Nominally pure CLN was grown using original ICT KSC RAS charge that allows us to obtain water white crystals [37]. All crystals were grown by Czochralski on Crystal-2 (Zavod Kristall Ltd, Saint Petersburg, Russian Federation) with automatic control of a crystal diameter.
Crystals were turned to a single-domain state by a high temperature electro-diffuse annealing: constant current was applied to crystals during their cooling in a temperature interval 1240–880 °C with a speed 20 grad/h. The grade of single domain state was determined by analysis of the frequency dependence of electrical impedance and by determining the value of the static piezomodulus (d333st).
Samples for optical experiments were cut from grown boules in the shape of parallelepipeds so that edges coincided with crystallographic axes X, Y, and Z (the polar axis) and in the shape of Z-oriented plane-parallel plates ~1 mm thick. Parallelepiped samples had sizes ~7 × 6 × 5 mm3. Faces of all studied samples were thoroughly polished.
Raman spectra were excited with a 514.5 nm line of laser 2018-RM (SpectraPhysics, Milpitas, CA, USA) and detected by a spectrograph T64000 (Horiba Jobin Yvon, Palaiseau, France) equipped with a confocal microscope. Low excitation power (not higher than 3 mW under the microscope) decreased an influence of photorefractive effect on Raman spectrum. Spectra resolution was 1 cm−1. Spectra were treated using Horiba LabSpec 5.0 and Origin 8.1 programs. Instrumental error in determination of frequency (ν), width (S) and intensity (I) of Raman bands was ±1.0, ±3.0 cm−1 and 5%, respectively.
PILS and laser conoscopy methods are described in detail in papers [11,13,38]. Conoscopic patterns and PILS patterns were excited by laser Nd:YAG (MLL-100, Changchun New Industries Optoelectronics Tech. Co. Ltd, Changchun, China), wavelength λ0 = 532 nm and power p = 1 and 90 mW. The studied sample was located on a movable two-coordinate plate, which allowed us to obtain several conoscopic patterns from different areas of a crystal. Conoscopic pattern formed on a translucent screen and was registered by a digital photo camera.
Photoelectric fields studies were carried out using PILS patterns excited by argon laser 2018-RM (SpectraPhysics, Mountain View, CA, USA) lines 476.5 nm (p = 216 mW); 488.0 nm (p = 98 mW); 514.5 nm (p = 282 mW); 530.9 nm (p = 160 mW). Laser beam diameter was 1.8 mm. Scattered radiation fell on a translucent screen and was registered by a digital photo camera. PILS in both cases was registered in ee-type geometry: laser radiation that fells on the crystal and scattered radiation have the same polarization, at the same time E vector is oriented parallel to the crystals polar axis Z.
PILS indicatrix parameters of studied crystals provided values of strengths of photovoltaic and diffusion electric fields. The error of our experiment calculations was 1.5–2%. The calculation of photovoltaic and diffusion field strengths was carried out in Mathcad 15.0 using approach from [31]. Refractive indexes of ordinary and extraordinary rays were determined from empirical equations from [39]. PILS indicatrix angle was calculated due to a formula θ = arctg(a/b), where a is the indicatrix size in the positive direction of the polar axis, b is the distance between the crystal and the screen.
Optical absorption spectra of LN crystals were determined using spectrophotometer Varian Cary 2300 (Varian Inc., Palo Alto, CA, USA), SF-256 UVI (Granat, Saint Petersburg, Russian Federation) and monochromator MDR-41 (OKB Spectr, Saint Petersburg, Russian Federation). A deuterium lamp was used as a radiation source. Band gap was determined using crystal transmission spectrum. An invert spectrum was obtained from the latter—an absorption spectrum. The obtained absorption spectrum in the decreasing linear part of the graph was approximated by a straight line until it crossed the abscissa axis. The point of intersection of this straight line and the abscissa axis is the wavelength corresponding to the absorption edge of the crystal. A bandgap was determined due to a formula E = hc/λ, where λ is a wavelength of absorption edge, h—Planck’s constant, c—light speed in vacuum. The band gap determination error was ±1.0 nm.
IR-absorption spectra were determined in vacuum by spectrometer IFS 66 v/s (Bruker, Leipzig, Germany). IR spectra treatment was carried out in programs Bomem Grammes V. 2.03, LabSpec 5.5, Origin 8.1.
Differential thermal analysis (DTA) was carried out on an installation with a thermal block made of ruby single crystal, which provides a gradient-free zone, and high sensitivity and resolution [40]. Error in thermal effects temperature determination was ±0.5 °C. The detailed description of the method is available from [40].
Computer simulation of B3+ ion localization and electrostatic interaction of point charges in LiNbO3:B crystals was carried out by a calculation of sum energy of Coulomb interaction of point charges (U, eV) in an oxygen-octahedral cluster of a LN structure (Li+, Nb5+, O2−) with B3+ element.
The chemical analysis was carried out by atomic emission spectrometry (spectrometer ICPS-9000 by Shimadzu), with an error ~1%.

3. Results

3.1. Study of LiNbO3:B Crystals Defective Structure by Raman Spectroscopy

Raman spectra of LiNbO3:B (0.55–1.24 mol%) crystals were previously studied in papers [21,22,41,42]. The papers focus on an influence of a disorder in cation sublattice on A1(TO) symmetry type phonons in Y(ZZ)Ȳ scattering geometry and on photorefractive effect manifestation in Raman spectra. 
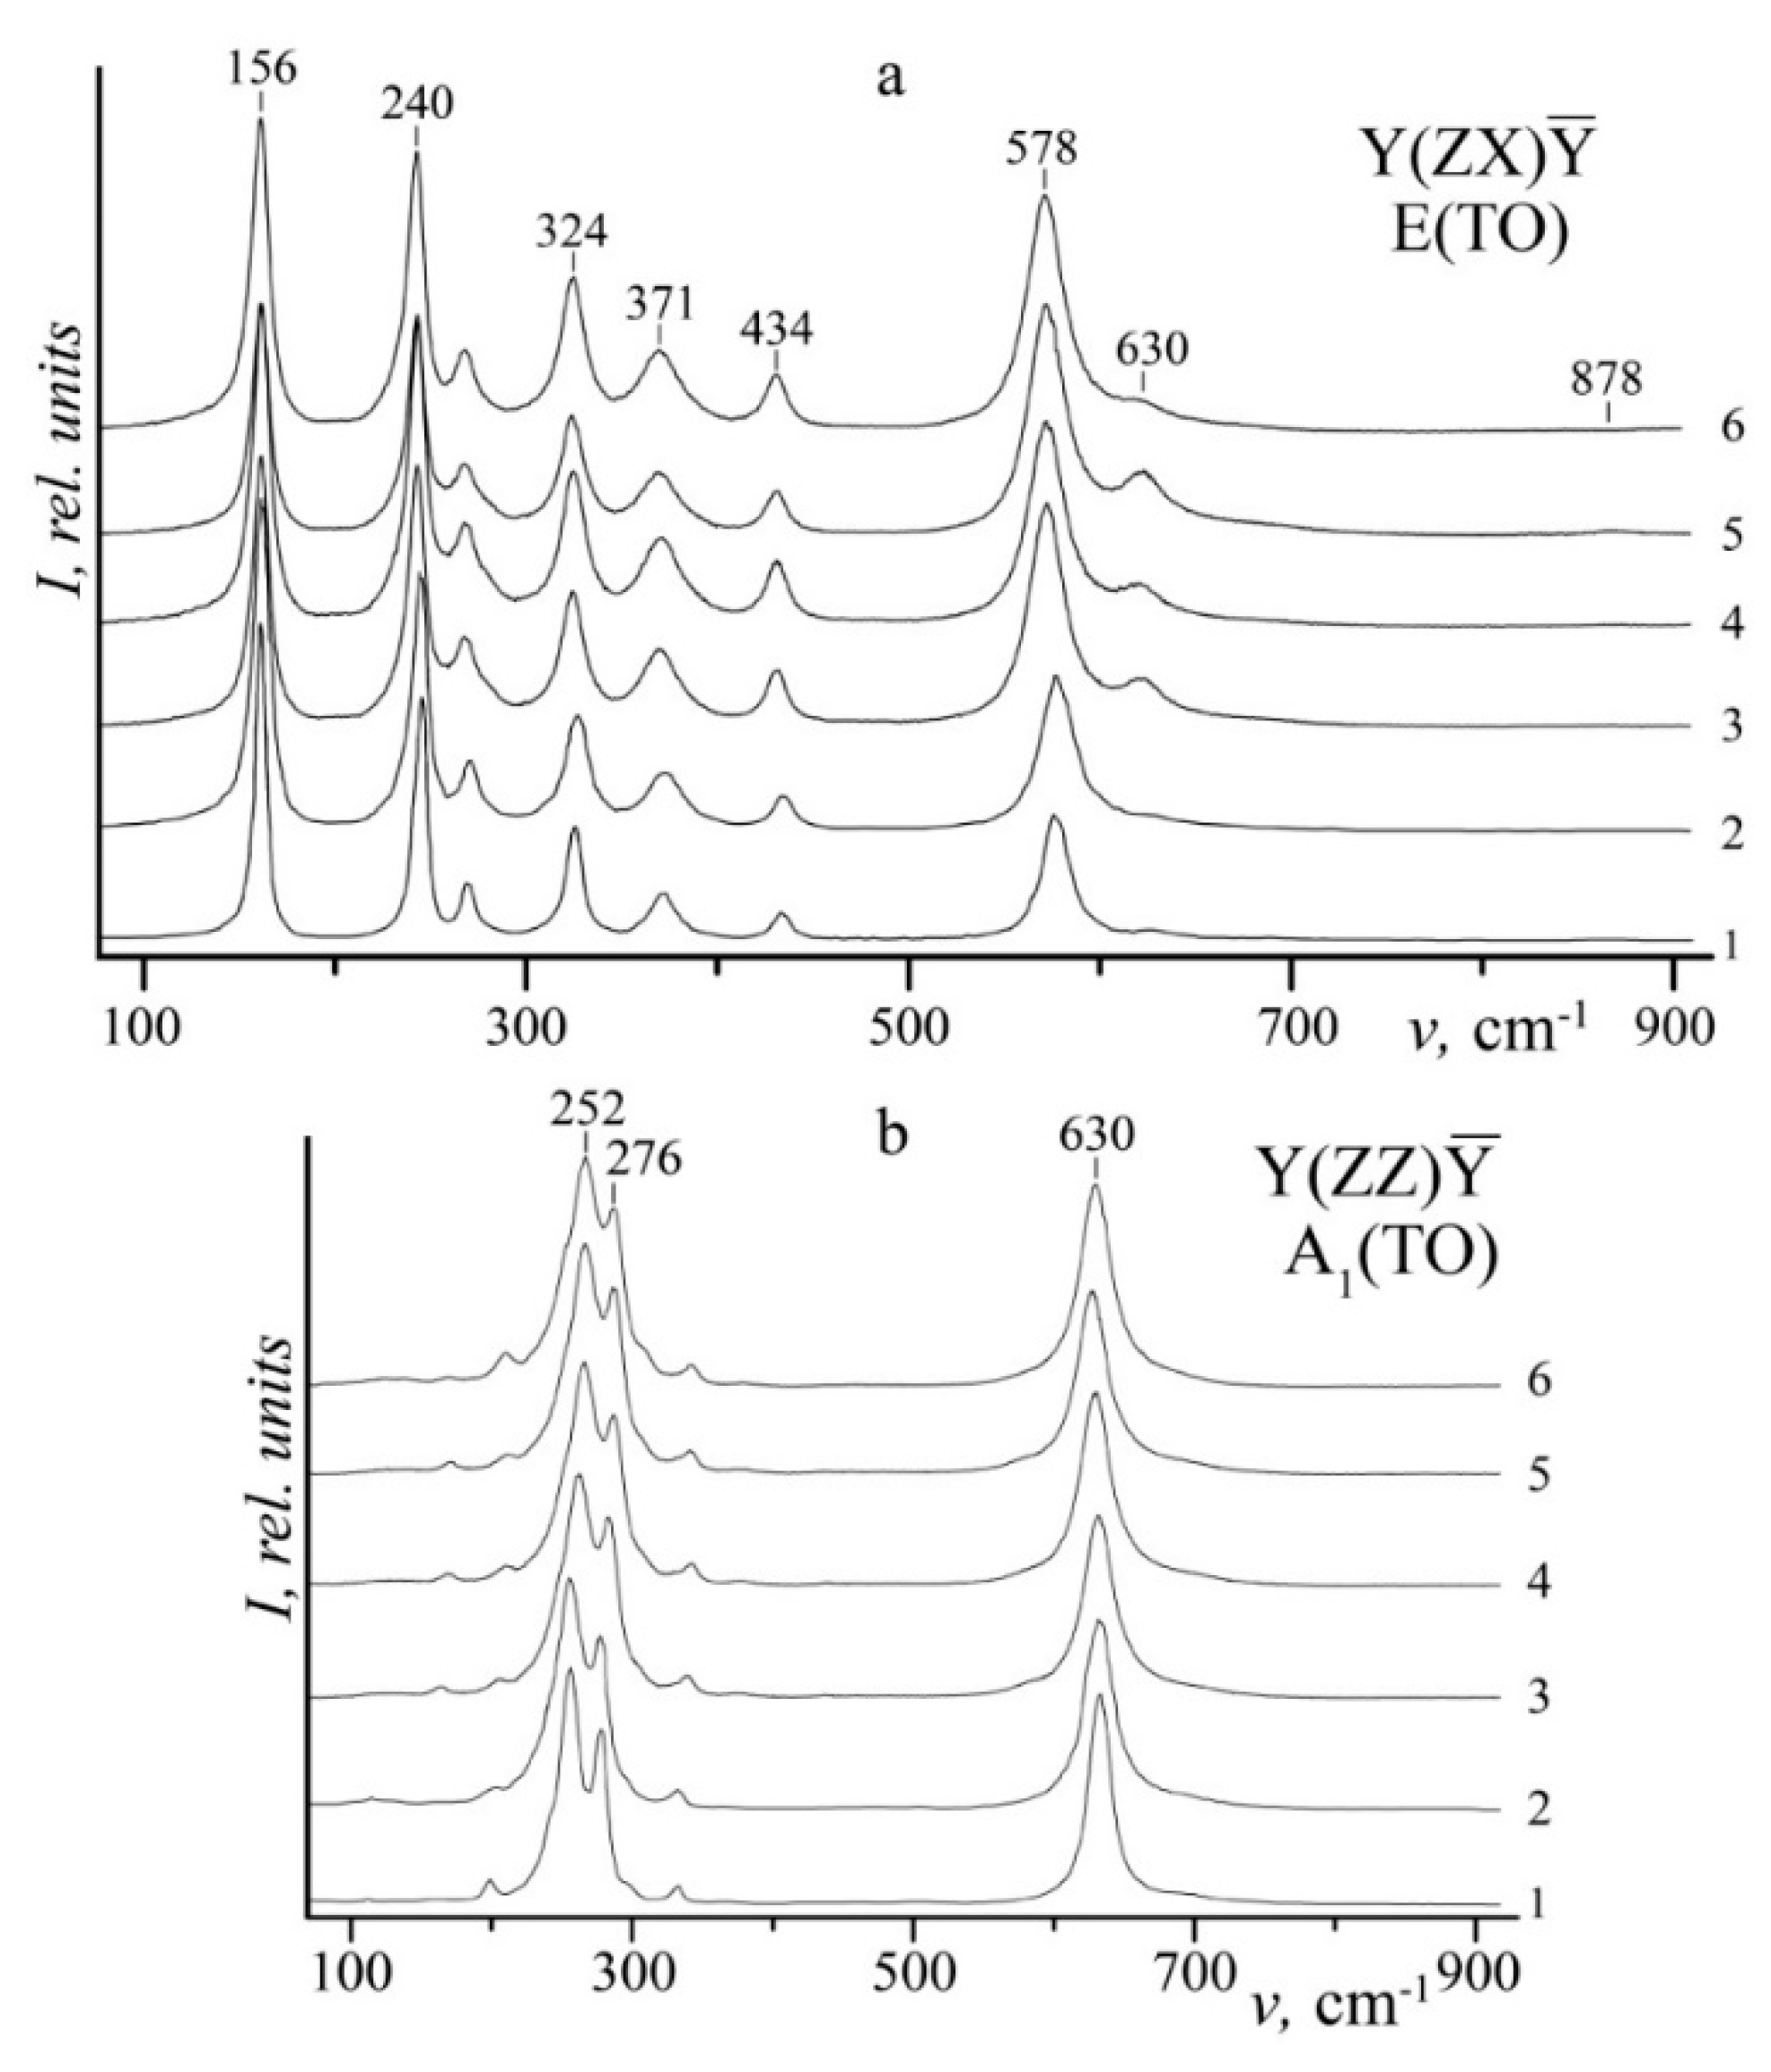
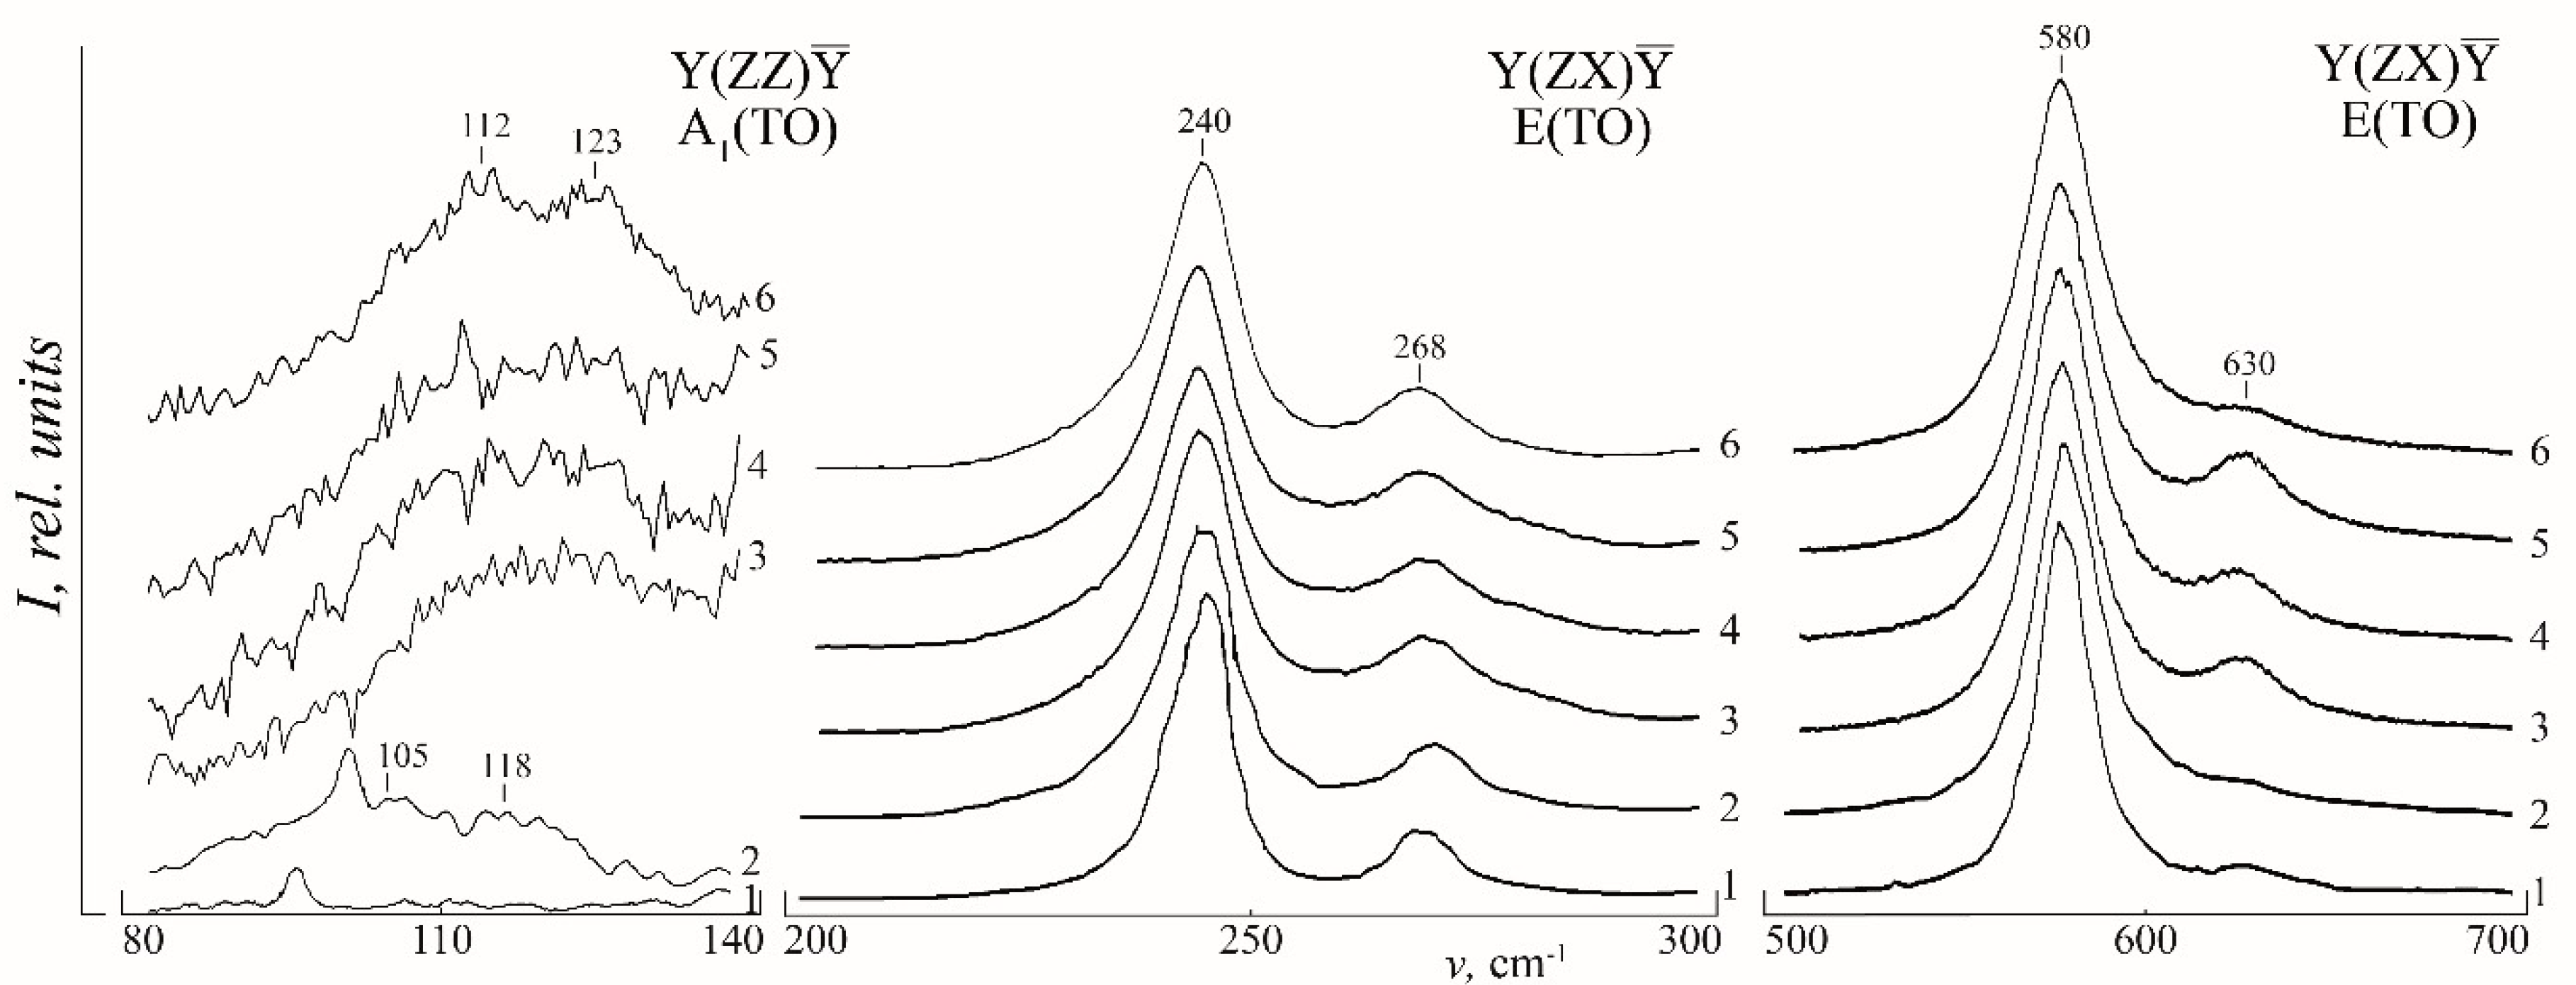
Figure 4 demonstrates Raman spectra of SLN, CLN and LiNbO3:B (0.55–1.24 mol%) in Y(ZX)Ȳ and Y(ZZ)Ȳ scattering geometries. These geometries correspond to fundamental vibration of the lattice of E(TO) and A1(TO) symmetry types. Spectra fragments with the most articulated changes at a crystal composition variation are given on Figure 5. Table 1 demonstrates main parameters (ν—frequency, S—band width, I—band intensity) of bands appearing in studied crystals. 
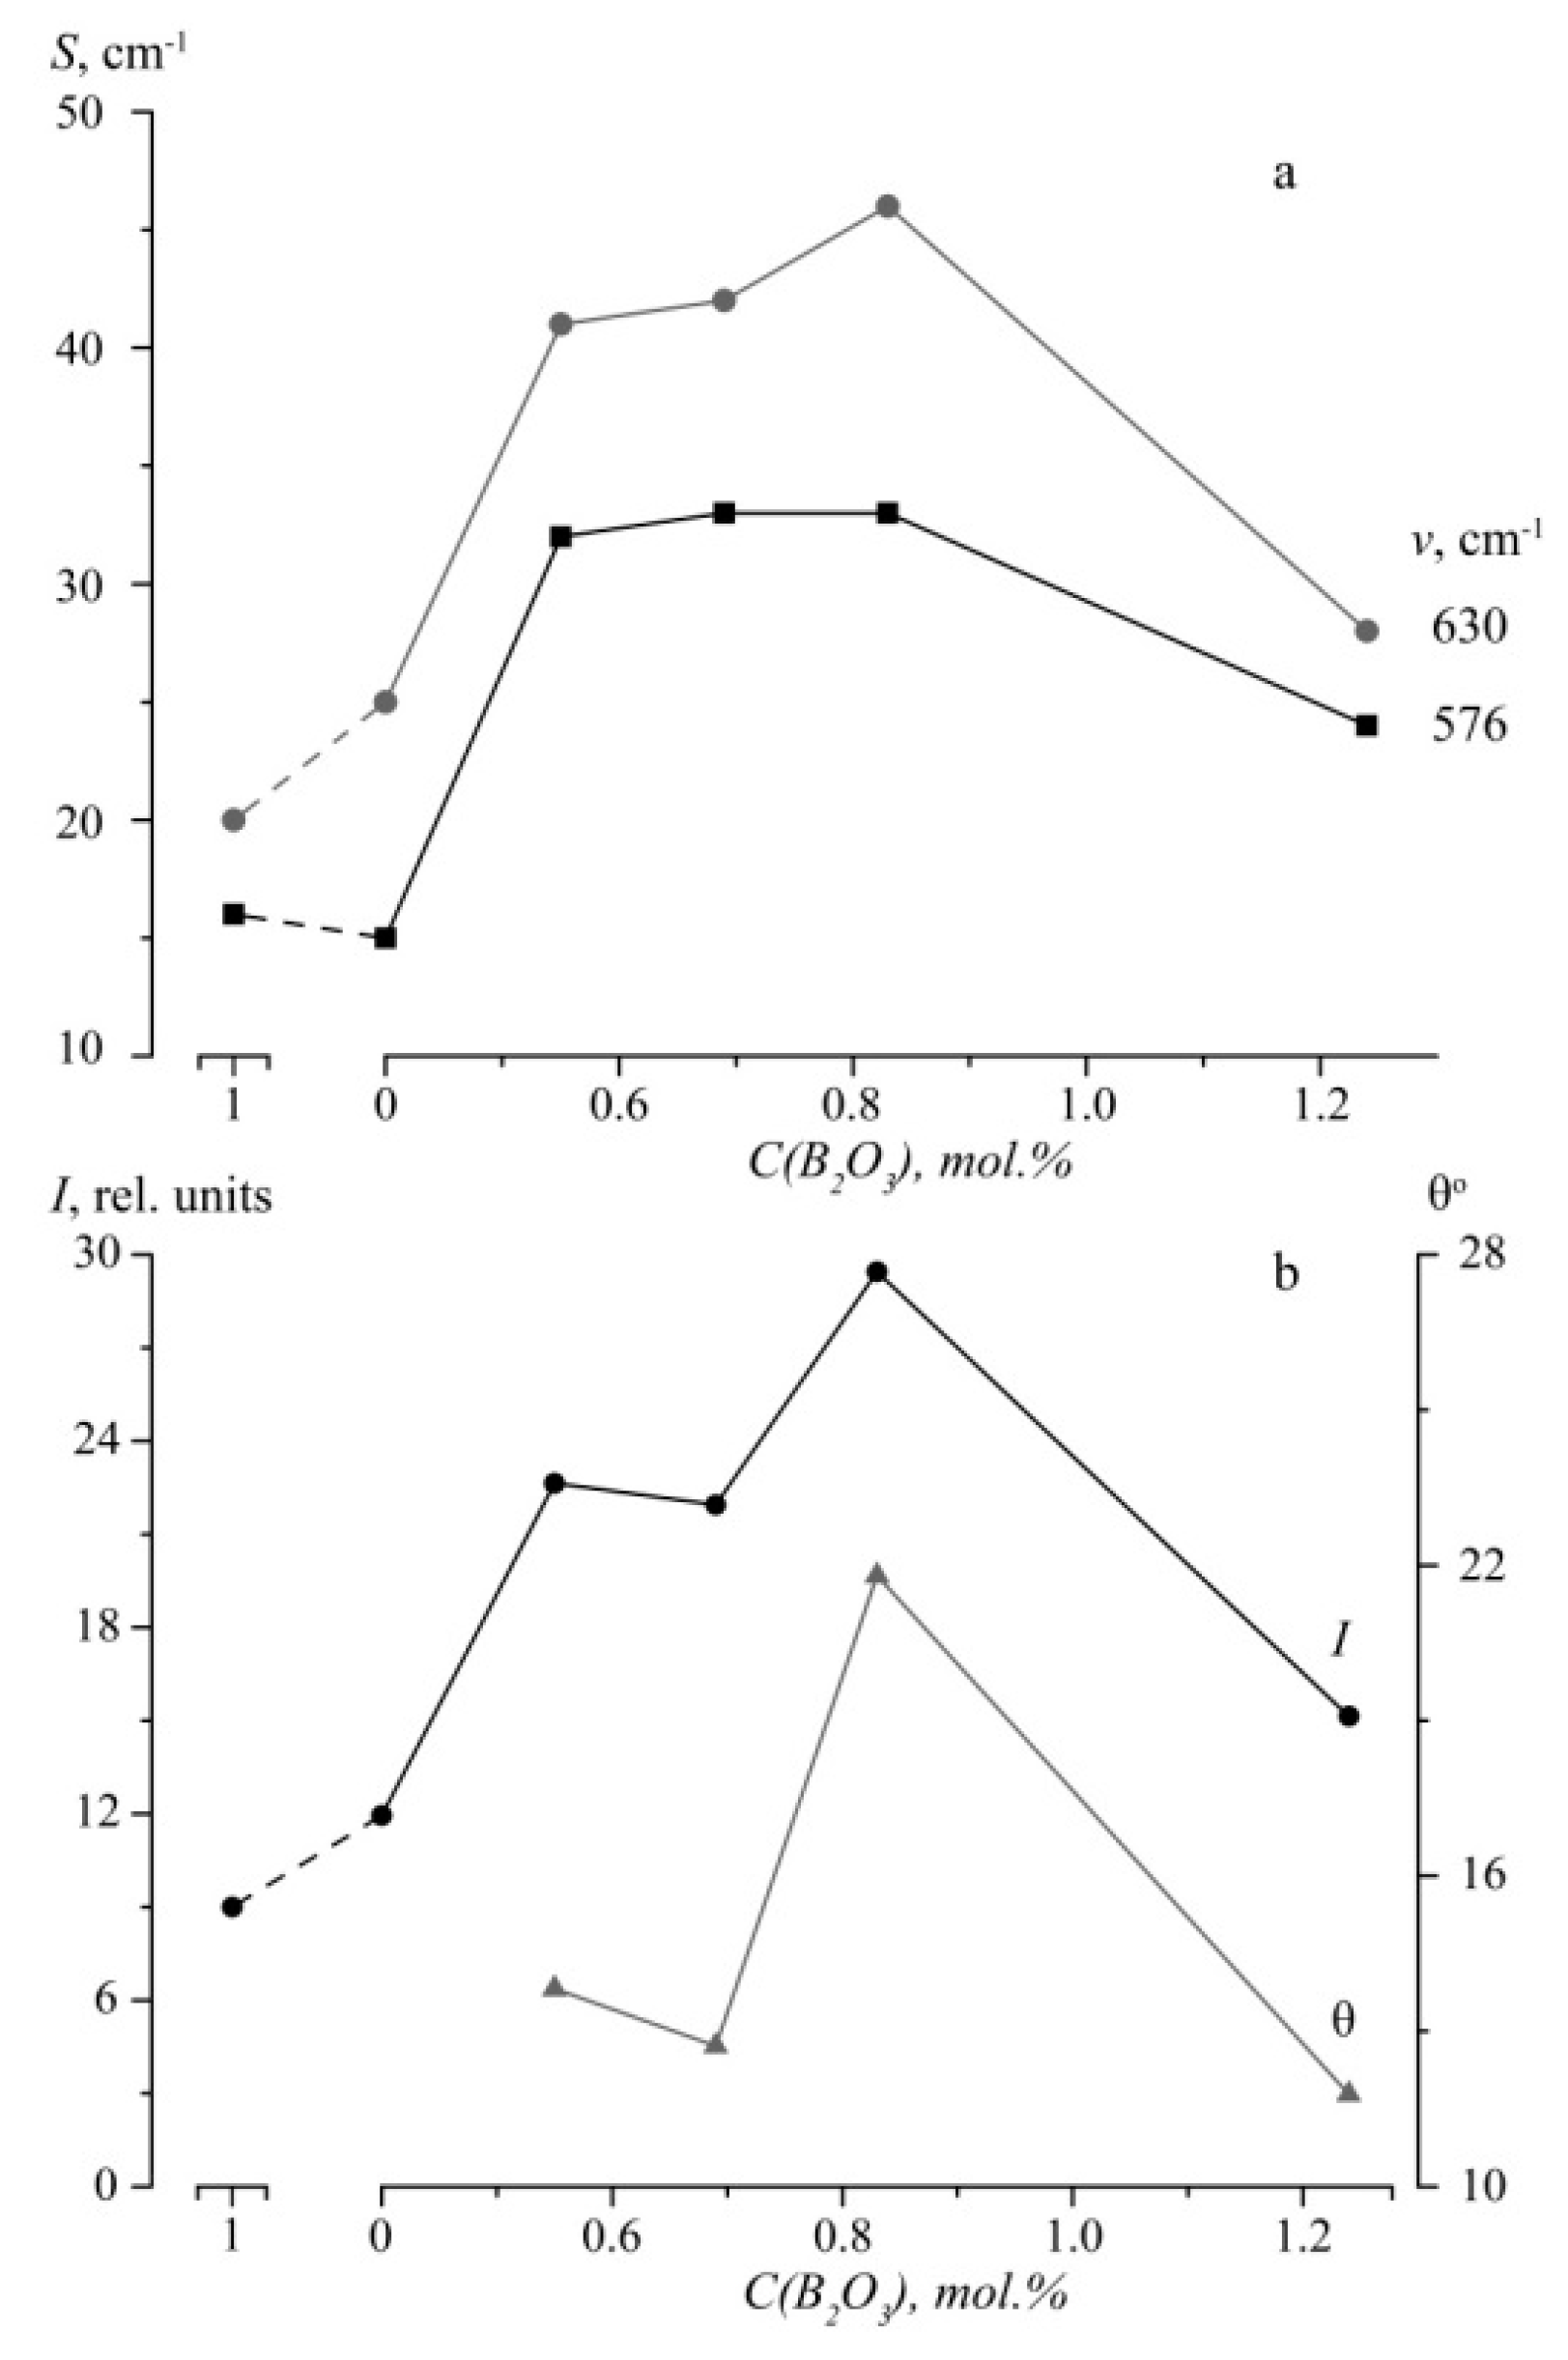
Figure 6 demonstrates changes in half-widths and intensities of 576 and 630 cm−1 Raman bands and in PILS speckle-structure indicatrix opening angle θ. SLN Raman spectrum contains all nine bands corresponding to E(TO) symmetry type phonons permitted by selection rules in Y(ZX)Ȳ scattering geometry, Figure 4, Table 1. Low-intense bands 179 and 611 cm−1 are clearly observed in SLN Raman spectrum. However, they dissolve by disordering effects in spectra of CLN and LiNbO3:B (0.55–1.24 mol%). Frequencies of all bands stay the same within error, Figure 4 and Figure 5, Table 1. This indicates that secondary structure changes (they appear at changes in Li/Nb ratio and B3+ cation concentration) affect very little quasi-elastic lattice constants in studied LN crystals. At the same time, Figure 4, Figure 5 and Figure 6 and Table 1 reveal that width and intensities of LiNbO3:B Raman bands change significantly in all Raman spectra areas: two-particle states of acoustic phonons (100–150 cm−1); vibration of cations located in oxygen octahedra BO6 (B: Nb, Li, dopant) (200–300 cm−1); vibrations of oxygen octahedra atoms (500–900 cm−1). Table 1 shows that LiNbO3:B Raman bands in the area 150–300 cm−1 are narrower than those of CLN; 152 and 240 cm−1 widths of LiNbO3:B Raman bands coincide with those of SLN. The 578 cm−1 band corresponds to doubly degenerate E(TO) vibrations of oxygen atoms in O6 octahedra. It is much wider in spectra of LiNbO3:B (0.55–1.24 mol%) than in SLN and CLN, Table 1, Figure 6. Obtained data show that even very a faint change in boron concentration in the charge and melt (0.55–1.24 mol% B2O3) leads to a significant ordering of cation sublattice along the polar axis at both doping methods. At the same time, oxygen octahedra O6 are distorted. New bands in the area of Raman spectra corresponding to oxygen octahedra vibrations would mean a change in their geometry. However, the area contains no new bands.
Due to selection rules [2,43], fundamental vibrations of E(TO) symmetry type should manifest in Y(ZX)Ȳ scattering geometry, A1(TO) symmetry type—in Y(ZZ)Ȳ. A1(TO) symmetry type vibrations are forbidden in Y(ZX)Ȳ scattering geometry [2]. However, due to photorefractive effect, they manifest in this scattering geometry. The bands corresponding to A1(TO) symmetry type vibrations have intensities proportional to photorefractive effect value. Papers [2,44] have shown that the 630 cm−1 band is the most suitable for photorefractive effect evaluation. The band corresponds to A1(TO) vibrations of oxygen atoms in O6 octahedra.
The E(TO) 580 cm−1 band does not change with changes in photorefractive effect value, at least in crystals with a low photorefractive effect. Thus, photorefractive effect can be evaluated due to the formula Irel = (I630/I580) × 100% [11,13,44,45]. Structure disorder contributes the most to LN Raman bands widening during dopant concentration increase at a constant temperature [2,43]. Structure disorder and photorefractive effect contribute the most to LN Raman bands intensity changes [2,43]. Figure 6b shows that the least relative intensity of the 630 cm−1 band is observed in CLN and SLN crystals spectra, the greatest—in LiNbO3:B (0.55–0.83 mol%) crystals. In LiNbO3:B spectra the 630 cm−1 band’s intensity first increases, than decreases with an increase in B3+ concentration, Figure 6b. In addition, concentration behavior of 630 cm−1 band intensity and widths of 630 cm−1 (A1(TO)) and 576 cm−1 (E(TO)) bands in the Y(ZX)Ȳ Raman spectra of LiNbO3:B well coincide with the behavior of PILS opening angle θ, Figure 6. Thus, oxygen octahedra distortions that occur due to a change in cation sublattice order and photorefractive effect depend on boron concentration in the charge in studied LiNbO3:B crystals.
Obtained data allow us to conclude that boron structures the melt, which actually means that a congruent LN crystal is growth from a boron-doped charge. Such a crystal has noticeable differences in fine structural features and physical characteristics from a nominally pure CLN crystal, grown from a congruent charge. Obtained results can have the following explanation.
We believe that boron structures the melt so that crystals grown from it have a decreased amount of NbLi. Raman spectra confirm this conclusion. Raman spectra of both nominally pure and doped CLN crystals contain a low-intense band 120 cm−1 (A1(TO)), Figure 5. The band corresponds to two-particle states of acoustic phonons with a total wave vector equal to zero [2]. Due to [46], it cannot correspond to a pseudoscalar mode A2 forbidden in a point group C3v by the selection rules. This band is split in two, 105 and 118 cm−1 bands, in a spectrum of a CLN crystal, Figure 5. This happens due to a refinement of the selection rules in the wave vector of two-particle states of A1(TO) acoustic phonons [2,47,48]. It is a well-known fact [2,47,48], that spectrum of a perfect SLN crystal is free of the 120 cm−1 band, Figure 5. In addition, SLN crystals are characterized by the perfect order in a cation sublattice, it is free of NbLi defects. Intensity of this band first decreases, than increases in LiNbO3:B with an increase in a dopant concentration, Figure 5. The band is split in two components 112 and 123 cm−1 in a spectrum of a crystal LiNbO3:B (1.24 mol%), Figure 5. This indicates a high structure perfection of the crystal. A decrease in the 120 cm−1 band intensity also indicates a decrease in NbLi defects amount at its doping by B3+ ions. Cation sublattice orders (Raman bands in the area 150–300 cm−1 narrow, Table 1) simultaneously with a decrease in resonant anharmonic interaction between the lowest-frequency fundamental A1(TO) vibrations 254, 274 cm−1 and two-particle A1(TO) acoustic excitations. The latter is discussed in detail in [49]. A degree of mixing between A1(TO) single-phonon and multi-phonon states depends on the value of this interaction, which also influences the spectrum in the 120 cm−1 area. Thus, LN crystals doping can effectively govern interaction between single-phonon and two-phonon states. Paper [50] has revealed that 120 cm−1 band intensity is connected with an acoustic Q-factor of LN crystal. The higher Q-factor is, the smaller the band intensity is, due to a decrease in the amount of NbLi defects. Thus, our data prove a higher structure perfection of nominally pure LN crystals grown from boron doped charge compared to that of a CLN crystal. The crystal LiNbO3:B (1.24 mol%) is the most structurally perfect one.

3.2. Study of LiNbO3:B Crystal Structure by IR Spectroscopy in the Area of OH-Groups Vibration

LN single crystals obtained at air atmosphere always contain OH groups incorporated into the structure during growth [14]. Localization of hydrogen atoms in LN structure greatly influences charge distribution and polarizability of oxygen octahedra clusters MeO6 (Me: Li, Nb, dopant). Hydrogen atoms bond with oxygen of LN structure by hydrogen bonds. OH groups increase LN crystal conductivity and decrease optical damage and coercive field value [10,29]. Doping of LN crystal leads to a total restructure of the whole hydrogen bonds system.
Stretching and deformation vibrations of OH groups are supposed to manifest in Raman and IR absorption spectra of LN crystals in the areas 1600–1800 and 3450–3550 cm−1, respectively. The amount of bands in these areas and their basic parameters depend on localization of hydrogen atoms in the crystal structure. The localization in its turn depends on stoichiometry, doping particularities and growth details of a single crystal [14]. A perfect strictly stoichiometric LN crystal has no site for a hydrogen atom [51]. IR spectrum of a real NSLN crystal contains only one narrow (S = 3 cm−1) 3466 cm−1 band [26,52]. A slight shift of stoichiometry leads to widening and splitting of this band in IR absorption spectrum into 3466 and 3480 cm−1 bands. This is caused by a formation of complex defects NbLi–OH, VLi, etc., in a structure of a non-stoichiometric LN crystal [51]. CLN crystal IR spectrum contains three components of the band: and intense 3466 cm−1 band, an average intense 3481 cm-1 band and a low-intense 3489 cm−1 band [53]. Papers [29,52] have demonstrated that as LN structure approaches stoichiometric composition, width of the 3466 cm−1 band and intensity of 3481 and 3489 cm−1 bands decrease. Note that SLN crystal has a ratio Li/Nb = 1, point defects, such as the same cations in the neighbor sites are absent. Thus, studies of parameters of IR absorption bands in the OH-groups vibrations area contains important information about the nature of defects and their localization in the structure; the structural rearrangements that occur in LN crystals with a change in composition; and the peculiarities of a single crystal growth. Such information is also important at refinements of technologies of growing optically and structurally perfect LN single crystals.
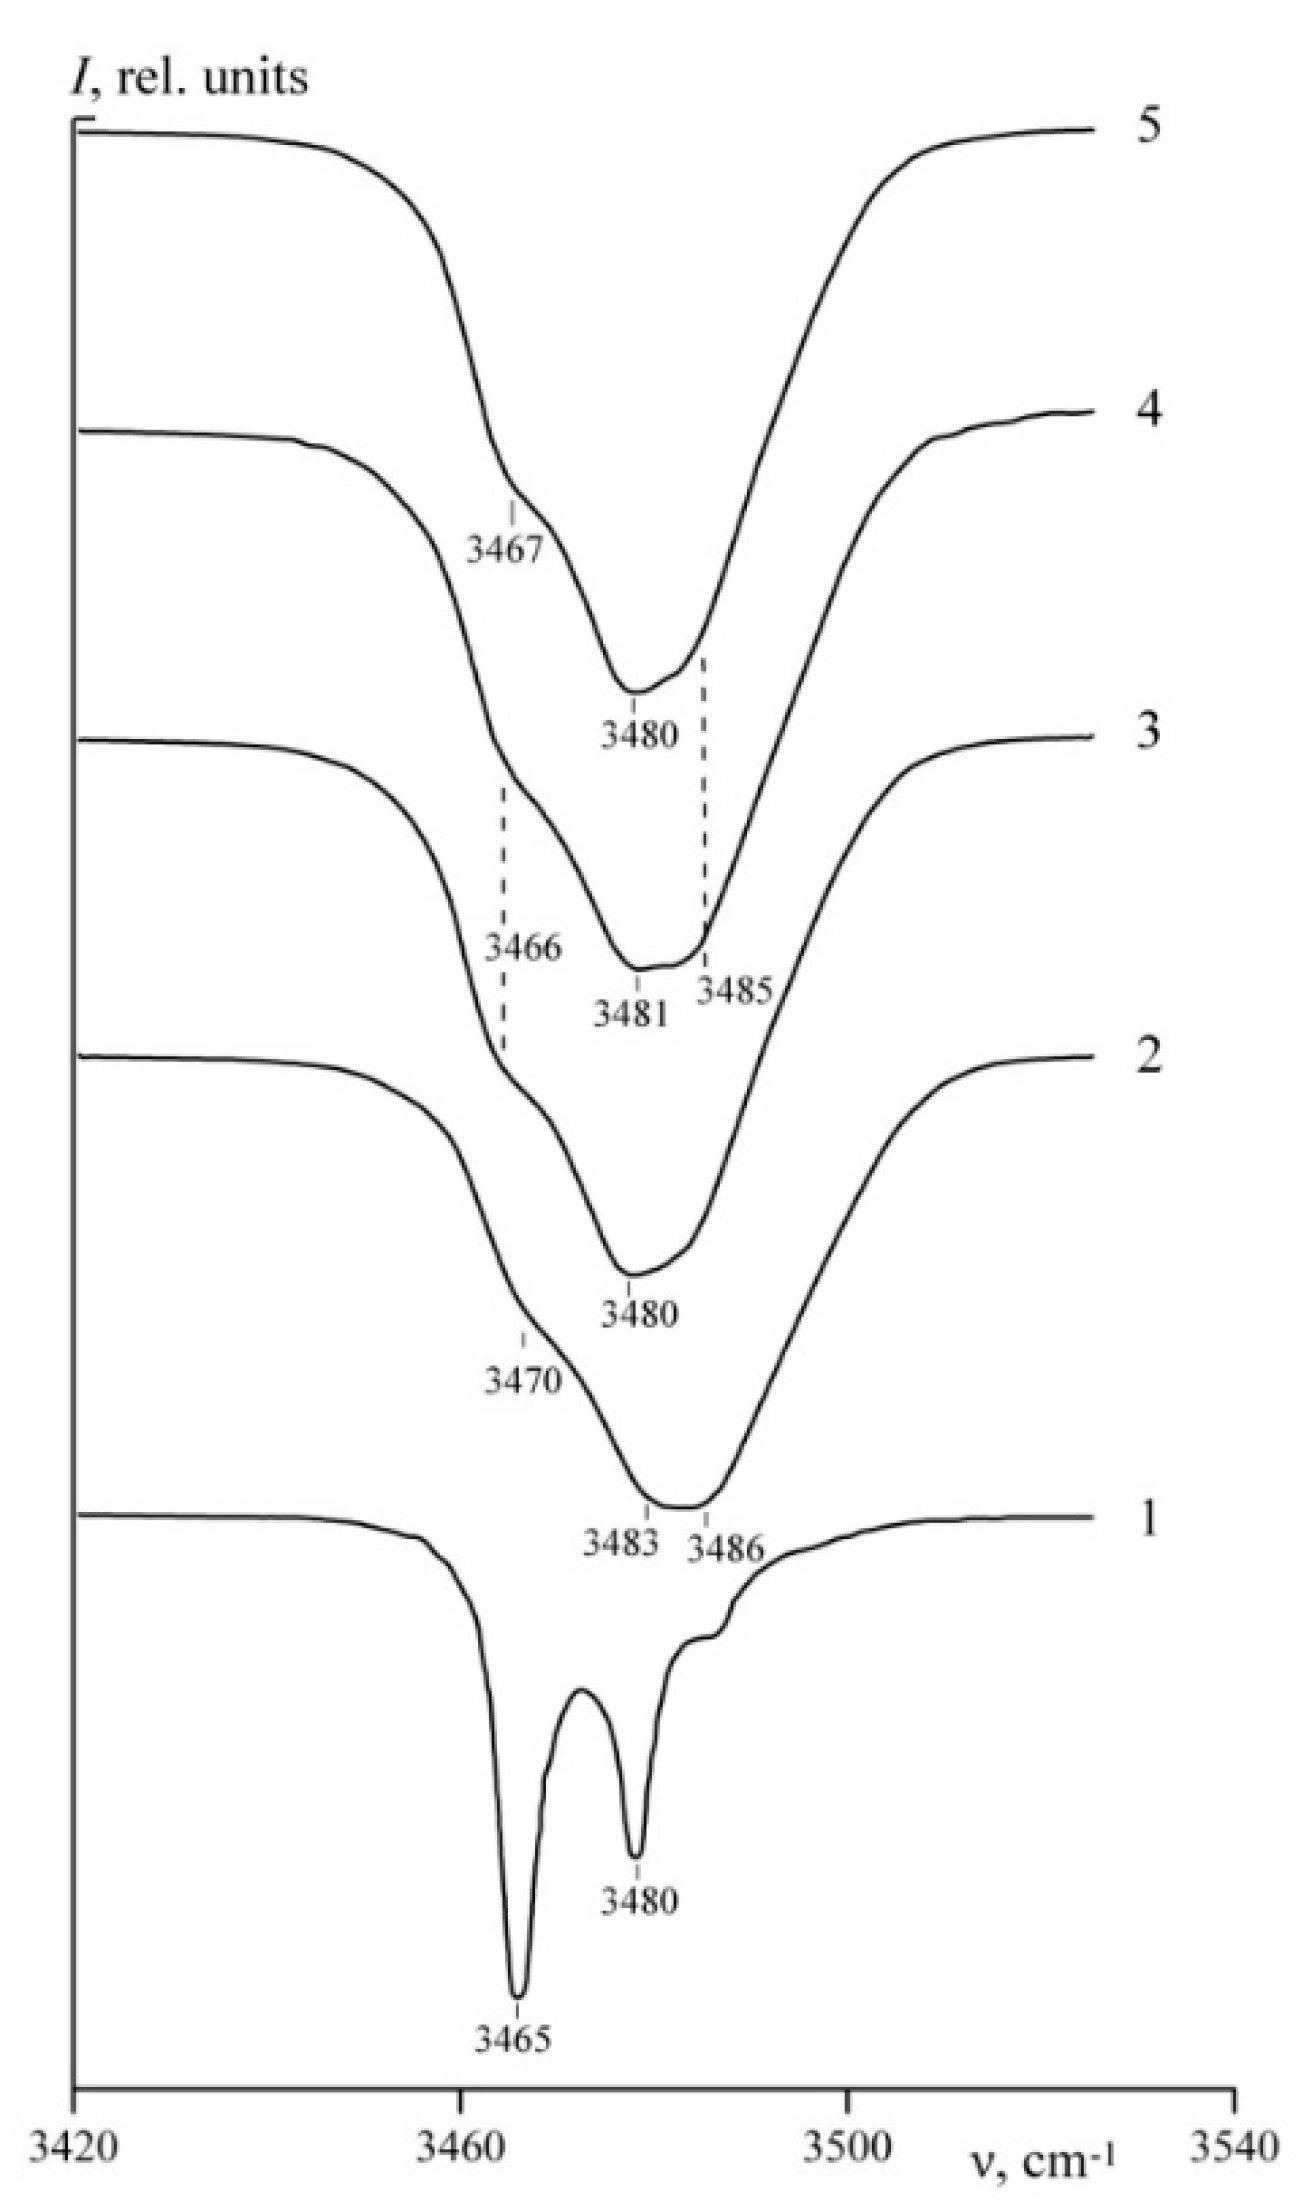
Figure 7 demonstrates IR absorption spectra of studied LN crystals in the area 3420–3550 cm−1. This area contains stretching vibrations of OH groups. Table 2 demonstrates parameters of spectral bands. It is obvious that spectra of all studied crystals are different. An SLN crystal spectrum contains three bands with frequencies 3465, 3480, and 3488 cm−1, Figure 7. The bands in an SLN spectrum are much narrower than in other crystals, Table 2. It is believed that a band in the frequency range 3465–3466 cm−1 is characteristic of a highly perfects SLN crystals with only one hydrogen atom position, [29,52]. Figure 7 clearly shows that a CLN spectrum is different from the one of an SLN crystal. IR spectra of a CLN is a blurred wide absorption band consisting of several components with the same polarization with frequencies 3467 (ν1), 3483 (ν2), and 3486 (ν3) cm−1 and a weak band with a frequency ~3490 cm−14). A 3480–3485 cm−1 band is considered characteristic of a CLN crystal and is attributed to stretching vibrations of a VLi–OH complex [54]. VLi defects are absent from SLN crystal structure. This means that IR spectrum should not contain bands with frequencies 3480–3485 cm−1, which is confirmed experimentally [29,52]. IR spectra of LiNbO3:B (0.55–0.83 mol%) is similar to those of CLN: an OH-groups absorption band is split in three components of the same polarization ~3470, ~3483, and ~3486 cm−1. Thus, hydrogen bonds in CLN and LiNbO3:B crystals structure should be similar. Three components of CLN crystal are considered to be connected with stretching vibrations of OH groups located near NbLi4+–VLi defects [53,55]. However, intensities of all three components are higher in LiNbO3:B than in CLN spectrum, Table 2. At the same time widths of two bands are narrower than in CLN spectrum, widths of the band 3485 cm−1 is not narrower, Table 2. This indicates ordering of OH groups distribution in LiNbO3:B crystals structure.
A computer simulation has been carried out in a paper [56]. The paper considers possible sites of hydrogen atom in SLN crystals. The paper has shown that all hypothetical hydrogen sites on O–O bonds located near VLi defects are unstable and should be excluded from further consideration. Moreover, the hydrogen atom site on C axis has not been confirmed. Analysis of possible hydrogen atoms trajectories in LN crystal structure shows that it can be associated in SLN structure only with one oxygen ion in the upper oxygen triangle of NbO6 octahedron. Dipole moment orientation of OH-group is slightly different from a direction of a short O–O bond. Thus, creation of a hydrogen bond leads not only to a cardinal change in the wave functions of the outer electron orbitals of the oxygen ion and the parameters of its electronic polarizability, but also to a strong distortion of the entire NbO6 octahedron [56]. Such changes in a crystal structure should manifest in 850–900 cm−1 area of Raman spectra. Bonds in this area correspond to stretching bridge vibrations B–O–B (B: Nb or dopant) of oxygen in NbO6 octahedra along the polar axis [2].
Table 1 shows that spectra of LiNbO3:B and nominally pure SLN, CLN crystals contain only one band in the area 850–900 cm−1. The width of this band depends on the Li/Nb value. This band width is minimal in SLN and maximal in CLN crystal spectrum, Table 1. An 850 cm−1 Raman band width has an intermediate value in LiNbO3:B (0.55–0.83 mol%) crystals, Table 1. The character of the Me1-O-Me2 bridge bond is determined not only by the Me-O bridges strength in octahedra. Widening of bands in the 850–900 cm−1 area is determined by the fact that Nb cations are located in different sites in octahedra, their concentration is quite high and they interact weakly between each other [2]. Changes in LN crystals Raman spectra in the area of stretching bridge vibrations correlate with changes observed in IR spectra, Figure 7. This result confirms conclusions of a theoretical work [56] and experimental data [29,52].
Papers [57,58] have clearly indicated that the ratio Irel = I3480/I3465 between intensities of 3480 and 3465 cm−1 IR bands almost linearly decreases with an increase in R = Li/Nb ratio. Note that Irel = 0 if the 3480 cm−1 band is absent from the spectrum. Evaluation of Irel allows one to determine R with higher precision (0.01 mol% Li2O) than other methods [57,58]. For example, determination of Li2O concentration due to Curie temperature has an error 0.1 mol% Li2O. A ratio Irel = I3480/I3465 = 0.78 for an SLN crystal studied in our research. This means that R = Li/Nb = 0.98. This result is different from data obtained by Raman spectroscopy: at R = 1 a low-intense 120 cm−1 band should be absent from SLN spectrum, Figure 5. Changes can be explained by the following: 120 cm−1 Raman band is sensitive only towards the R = Li/Nb ratio (which automatically include all point and complex defects); 3466 cm−1 IR band is sensitive only towards NbLi–OH complex defects. This is why R determined due to IR spectra is smaller, than that determined due to Raman spectra.
A Li/Nb ratio can also be calculated with a high precision (up to 0.01 mol%) from a fundamental absorption edge [59]. However, this kind of experiment should be carried out at fine plates (0.5–1.0 mm) of LN crystals. Moreover, studied samples must not have additional absorption bands in the fundamental absorption edge, as it is in crystals doped by multiply charged cations Fe, Cu, etc. Empirical formulae for Li/Nb evaluation in nominally pure LN crystals were suggested in [59]. The formulae apply data on fundamental absorption edge:
L i / N b = 1 ( ( λ 20 301.5 ) / 81.29 ) 2
where λ 20 —fundamental optical absorption edge corresponding to a wavelength at an absorption coefficient α = 20 cm−1.
Knowing Li/Nb value, one can calculate concentration of point defects in LN crystal. Due to a Li-vacancies compensation model [2], concentration of NbLi4+ and VLi point defects in mol% in a crystal lattice of nominally pure LN crystals can be calculated due to a formula [59]:
C ( V L i ) = ( ( 4 4 × Li / Nb ) / ( 5 + Li / Nb ) ) × 100
C ( N b L i ) = C ( V L i ) / 4
Paper [59] offers a model for determination of Li/Nb ratio in crystals that have absorption bands directly in the region of the fundamental absorption edge. Ratio of the integrated intensity of the band with a maximum at 3466 cm−1 ( A i n t ,   I I ) to the total integrated intensity of the IR absorption spectrum ( A i n t ,   I ) ( A i n t ,   I I / A i n t ,   I = α 1 ( ν ) d v / α ( ν ) d v ) was determined for each crystal’s spectrum. In the formula α(ν)—absorption coefficient in dependence on wavelength in cm−1.
A Li/Nb ratio can be determined in crystals doped by photochrome or photorefractive cations absorbing in visible or UV spectral area due to the obtained A i n t ,   I I / A i n t ,   I value and Li/Nb ratio [59]. This method can obviously be applied for other cases; for example, for LN crystal samples with a width >1 mm, when fundamental optical absorption edge λ 20 is impossible to determine. In this paper we have used samples with a width Z = 4 mm. Our calculations concerning Li/Nb and NbLi4+ and VLi point defects concentration obtained due to the abovementioned formulae are demonstrated in Table 2.
A Klauer [60] method can be applied to calculate concentration of OH-groups:
C ( O H ) = A i n t ,   I / ( ( ln 10 ) · a O H )
where C(OH)—concentration of OH defects in a sample, (cm−3), A i n t ,   I —a total integral intensity of IR spectrum in the OH stretching vibrations area ( A i n t ,   I = α ( ν ) d v , α ( ν ) —absorption coefficient in dependence on wavelength in cm−1), a O H —intensity if ion absorption = (9.125 ± 1.369) × 10−18 cm [60,61].
Calculation results are demonstrated in Table 2. Concentration of OH-groups is minimal in SLN and maximal in LiNbO3:B (0.55 and 0.83 mol%) crystal, Table 2. CLN and LiNbO3:B(0.69 mol%) crystals have an intermediate value of OH groups, Table 2. A decrease in the amount of bonded OH groups apparently leads to an increase in free protons in LN crystals, which can influence electrical conductivity of the crystals and decrease photorefractive effect.

3.3. Study of LiNbO3:B Crystals Optical Uniformity by PILS and Laser Conoscopy

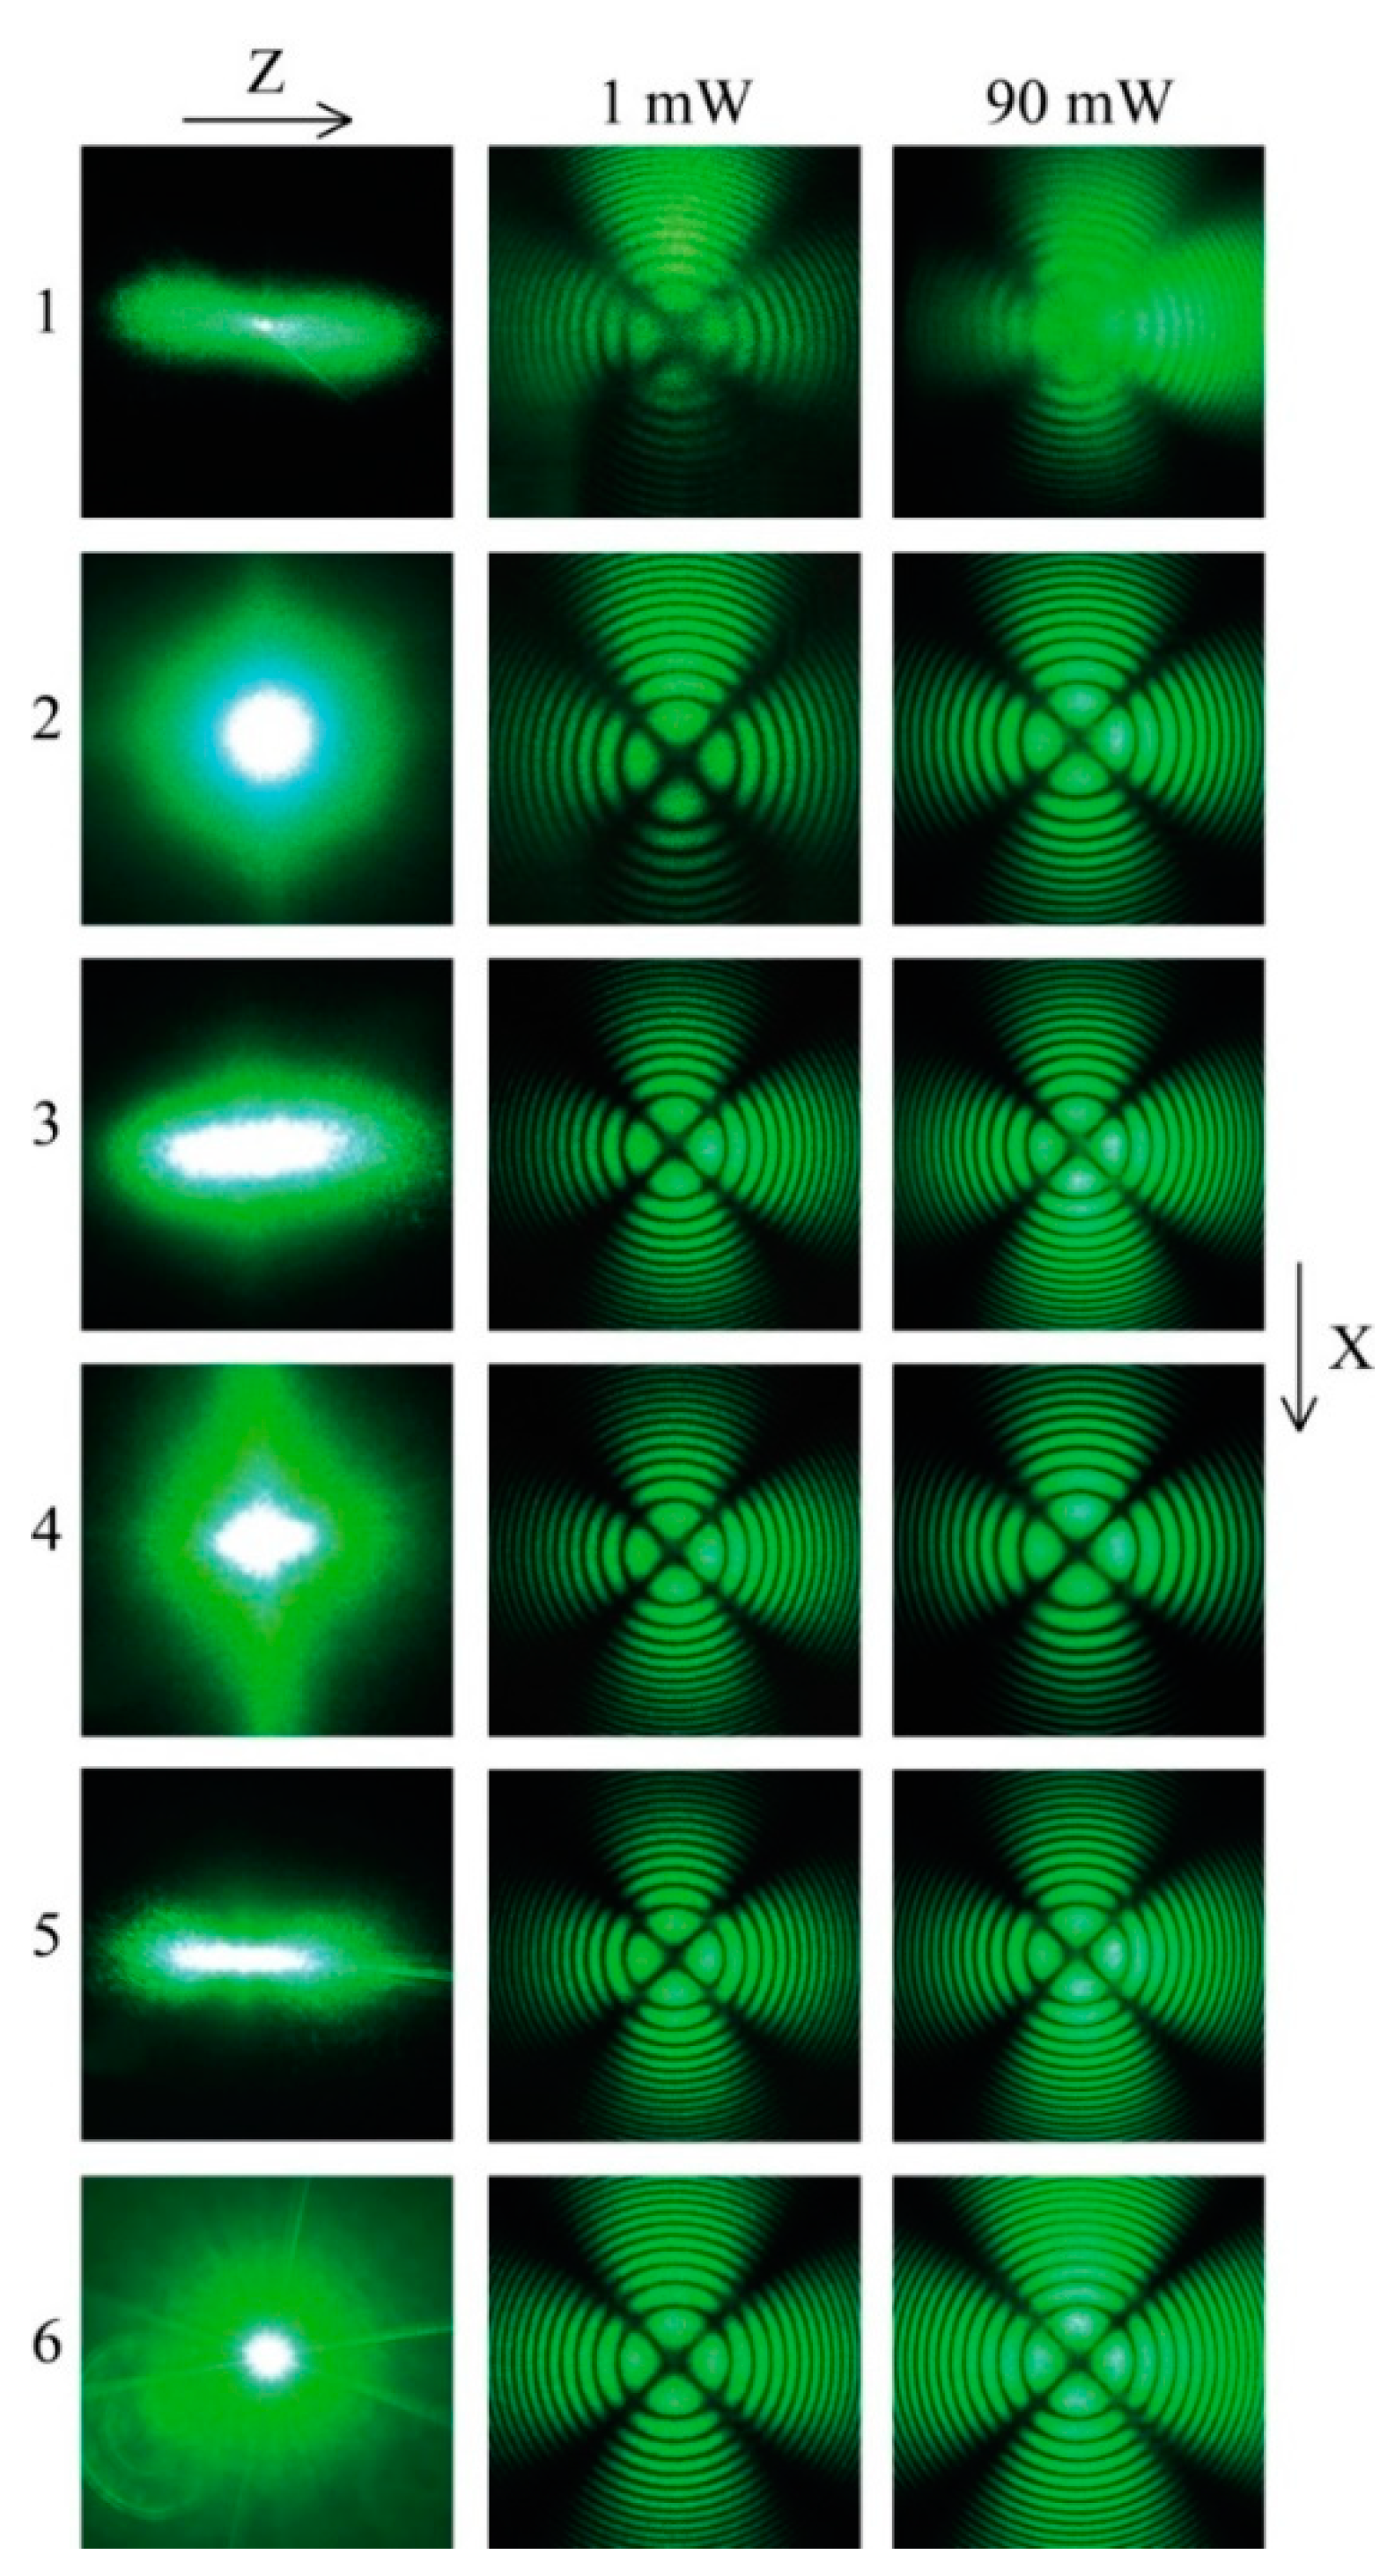
We have studied optical uniformity of crystals by laser conoscopy at laser radiation (λ0 = 532 nm) power p = 1 and 90 mW, Figure 8. When conoscopic patterns of LN crystals at low power differ from pattern of a perfect crystal, it means that changes are caused by defects, mechanical stresses, or compositional heterogeneity. Conoscopic pattern distortions at high-power radiation are caused by laser-induced static and fluctuating defects. Laser conoscopy and PILS method are unable to provide direct information about crystals intrinsic structure and defects type. However, they detect information on the optical homogeneity and photorefractive properties of crystals.
Figure 8 shows that conoscopic patterns of studied LiNbO3:B crystals at both exciting radiation powers correspond to a pattern of a perfect single axis LN. Thus, conoscopic patterns confirm optical single axis in LiNbO3:B (0.55–1.24 mol%) crystals, Figure 8. Slight signs of anomalous optical biaxiality are observed only on a 90 mW conoscopic pattern of a LiNbO3:B (0.83 mol%) crystal, Figure 8. A “Maltese cross” is deformed in the center, fragments are shifted from its center; angle between branches is not 90°; isochromes are slightly oval, however their geometry is not distorted. Appearance of anomalous biaxiality can be caused by the existence of local micro-regions and clusters with birefringence in the crystal. In addition, observed distortion in LiNbO3:B (0.83 mol%) crystal conoscopic patterns can be associated with an increase in the effect of photorefraction, Figure 8.
PILS is a direct consequence of the photorefractive effect. It arises in a ferroelectric crystal on defects induced by exciting radiation with fluctuating refractive index, dielectric constant, and other physical parameters [62,63]. Laser radiation scattered by such defects interferes with pumping, forming a complex pattern of minima and maxima of the scattered light intensity (speckle structure), Figure 8. It causes strong laser beam destruction in the crystal; it is an interfering factor for the radiation generation and conversion [4]. The shape and features of the PILS indicatrix speckle structure depend on the crystal structure, the state of its defectiveness, as well as on the radiation polarization and the experiment geometry [62,64]. The time and opening angle of the PILS indicatrix determine the response speed of the electro-optical modulators and gates. PILS parameters are determined by the depth of traps, the mobility of electrons responsible for the magnitude of the photorefractive effect, as well as the interaction of laser radiation with a defective crystal [62]. Figure 8 demonstrates PILS patterns of studied crystals. The time of full PILS indicatrix speckle structure opening for the above crystals is 60 s. According to PILS data, a crystal LiNbO3:B (1.24 mol%) possesses the highest optical damage resistance. PILS speckle structure indicatrix of this crystal does not open even at a high excitation radiation power 160 mW, despite other crystals, Figure 8. Conoscopic and PILS patterns show that structure uniformity of LiNbO3:B is similar to that of a CLN crystal and is much higher than that in a SLN crystal, Figure 8. Note that photorefractive effect is much higher in SLN than in CLN and LiNbO3:B (0.55–1.24 mol%) crystals. An SLN crystal PILS opening angle θ is 56°; it does not exceed 22° in LiNbO3:B (0.55–1.24 mol%) crystals, Figure 6, Table 3.
It is a known fact that SLN crystals have non-uniform refractive index along the growth axis, while in CLN crystals it is stable. Photorefractive effect manifests itself much stronger in SLN crystals, than in CLN crystals [2,65]. A change in the structure and properties of a melt, as well as crystal doping, adds levels in the band gap and thereby changes the photorefractive properties and electrical conductivity of the crystal. The crystal LiNbO3:B (0.83 mol%, direct doping) is photorefractive, has a pronounced PILS and is characterized by a uniform refractive index along the growth axis, as evidenced by a clear conoscopic pattern, Figure 8. At the same time, the crystal LiNbO3:B (1.24 mol%, homogeneous doping) has a reduced effect of photorefraction; a more blurred conoscopic pattern indicates the presence of fluctuations in the refractive index along the polar axis. A similar, but much more diffuse conoscopic pattern is observed for SLN crystal, Figure 8. At the same time, a discontinuous structure of the laser beam is observed when it propagates along the polar axis in SLN, (Figure 21 in [66]). This indicates a much higher inhomogeneity of the refractive index in SLN in comparison with the LiNbO3:B (1.24 mol%, homogeneous doping) crystal. For other crystals under study, a discontinuous structure of the laser beam has not been observed yet.
A decrease in the photorefractive effect can be due to a change in the band structure and electro-optical properties of the crystal due to the structuring of the melt with boron. A low photorefractive effect value in the LiNbO3:B (1.24 mol%, homogeneous doping) crystal can be explained by a change in the electro-optical properties of the crystal. Due to works [67,68], a change in electro-optical coefficients in nominally pure LN crystals at a change in Li/Nb ratio leads to a change in ionic contribution to the magnitude of the electro-optical effect. We assume that boron influence leads to such a structuring of a melt that crystals grown from the melt have a more strict crystal structure compared to CLN crystals, in which MeO6 octahedra have less ability to deform.

3.4. Investigation of Photovoltaic Fields and Bandgap in LiNbO3:B Crystals by PILS and Optical Spectroscopy

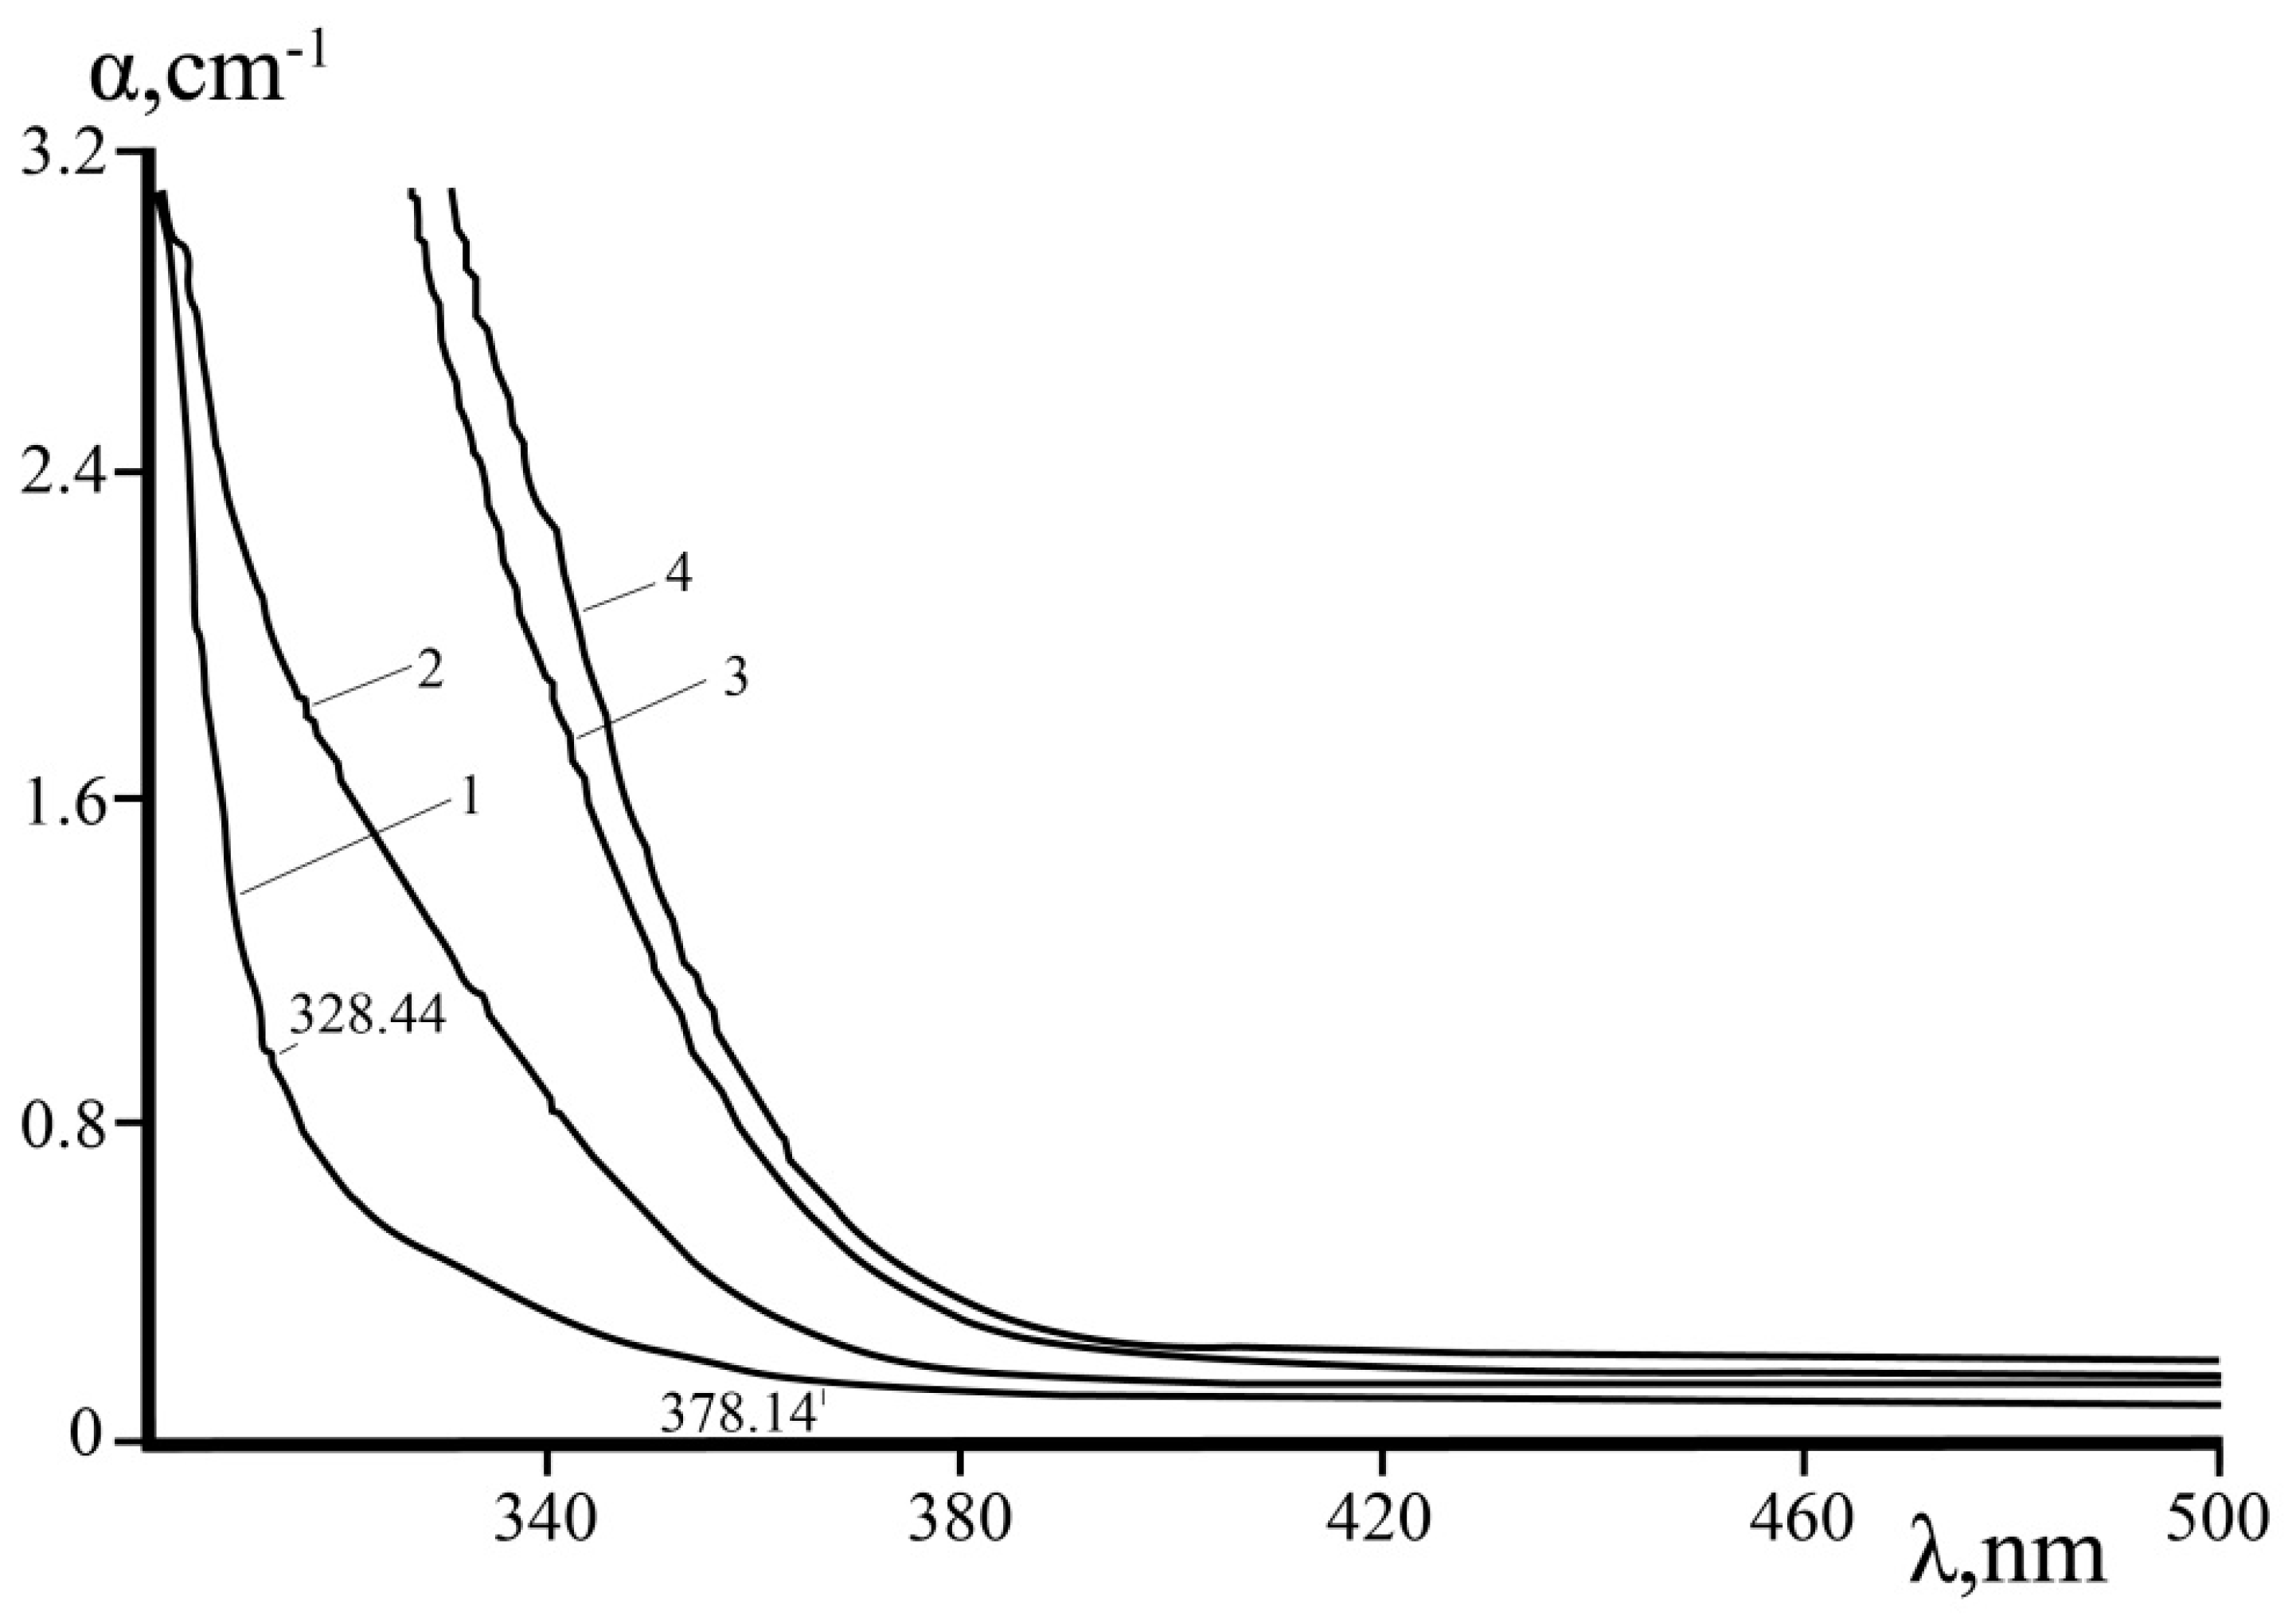
Figure 9 demonstrates optical absorption spectra of SLN, CLN, and LiNbO3:B (0.55, 0.83 mol%) crystals. The absorption edge of LiNbO3:B crystals is shifted to longer wavelengths compared to the absorption edge of SLN, CLN crystals. At this, absorption spectra of LiNbO3:B crystals has a steeper rise in comparison with SLN. This indicates a higher optical uniformity of crystals grown from a boron-doped charge. It is believed that NbLi defects bring the main contribution to the change in the position of the fundamental absorption edge in nominally pure CLN crystals [2,59]. Thus, we can draw conclusions about the mechanism of non-photorefractive impurities incorporation into the crystal lattice.
Coincidence of the concentration dependences of NbLi defects and the Urbach parameter on the Li/Nb ratio in the crystal has been spotted in a paper [59]. This agrees with the conclusions of [69] that the Urbach absorption occurs in the LN crystal as a result of the transition of electrons from the filled states “2p” of oxygen to the empty states “4d” of niobium. A decrease in the concentration of NbLi defects as the Li/Nb ratio approaches unity leads to a fundamental absorption edge shift toward longer wavelengths as a result of a decrease in the density of local states associated with NbLi defects near the bottom of the conduction band. The transition of electrons from the valence band to these states is possible in LN under the light. Figure 9 demonstrates that CLN absorption edge is maximally shifted to short-wavelength region. Table 2 shows that for CLN Li/Nb = 0.942, C(VLi) = 3.90 mol% and C(NbLi) = 0.98 mol%. It is a known fact that CLN crystals have Li deficiency near 6 mol% (Li/Nb = 0.946) [2]. According to the compensation of Li-vacancies model, the crystal lattice of a CLN crystal contains ~1 mol% NbLi4+ point defects and ~4 mol% VLi point defects [54,70]. At the same time, NbLi4+ is completely absent from a perfect SLN crystal structure. LiNbO3:B (0.55 and 0.83 mol%) crystals have ordering of structural units of the cation sublattice and the content of NbLi and VLi point defects between SLN and CLN [24]. Approximation to stoichiometry in LiNbO3:B crystals is possible by binding excess niobium in a congruent melt due to the complexing ability of boron compounds [24]. Obviously, the position of the fundamental absorption edge is determined not only by the concentration of NbLi and VLi point defects. The number of shallow electron traps depends significantly on the Li/Nb ratio [2,7,12,71]. Under laser radiation a spatial charge separation occurs and an internal electric field arises, leading to a photoinduced change in refractive indices in LN crystal as a result of photoexcitation processes (photovoltaic and diffusion current) [7,12,63,71]. Photovoltaic Epv and diffusion ED fields presented in Table 3 were calculated due to formulae [31]:
E p v = λ ( Γ c + Γ + c ) 2 π [ n e 3 r 33 cos θ s i n cos ( θ s i n 2 ) + n e n 0 2 r 51 tan θ s i n sin θ s i n sin ( θ s i n 2 ) ]
E D = λ ( Γ c Γ + c ) 2 π [ n e 3 r 33 cos θ s i n cos ( θ s i n 2 ) + n e n 0 2 r 51 tan θ s i n sin θ s i n sin ( θ s i n 2 ) ]
where Epv—photovoltaic field, ED—diffusion field, λ —wavelength, θ s i n —scattered radiation angle, Γ c and Γ + c —amplification factors (indices “−” and “+” indicate the direction of the scattered radiation against and along the direction of the crystal polar axis, respectively), n e and n o —refractive indices of the extraordinary and ordinary rays, respectively, r 33 and r 51 —LN electro-optical coefficients.
An amplification factor Γ ( θ s i n ) can be calculated in dependence on PILS opening angle due to a formula [31]:
Γ ( θ s i n ) = 1 l e f f ( θ s i n )   ln I s ( θ s i n ) I s o Ω ( θ s i n )
where I s —scattered radiation intensity, I s o Ω —primary scattering intensity (incident beam), l e f f —The effective interaction interval, which is calculated depending on the scattering angle, according to the following formulas [31]:
l e f f = d cos θ s i n ,   for   θ s i n < arctan ( w p 2 d )
l e f f = w p 2 sin θ s i n ,   for   θ s i n arctan ( w p 2 d )
where d —crystal thickness, w p —laser beam diameter.
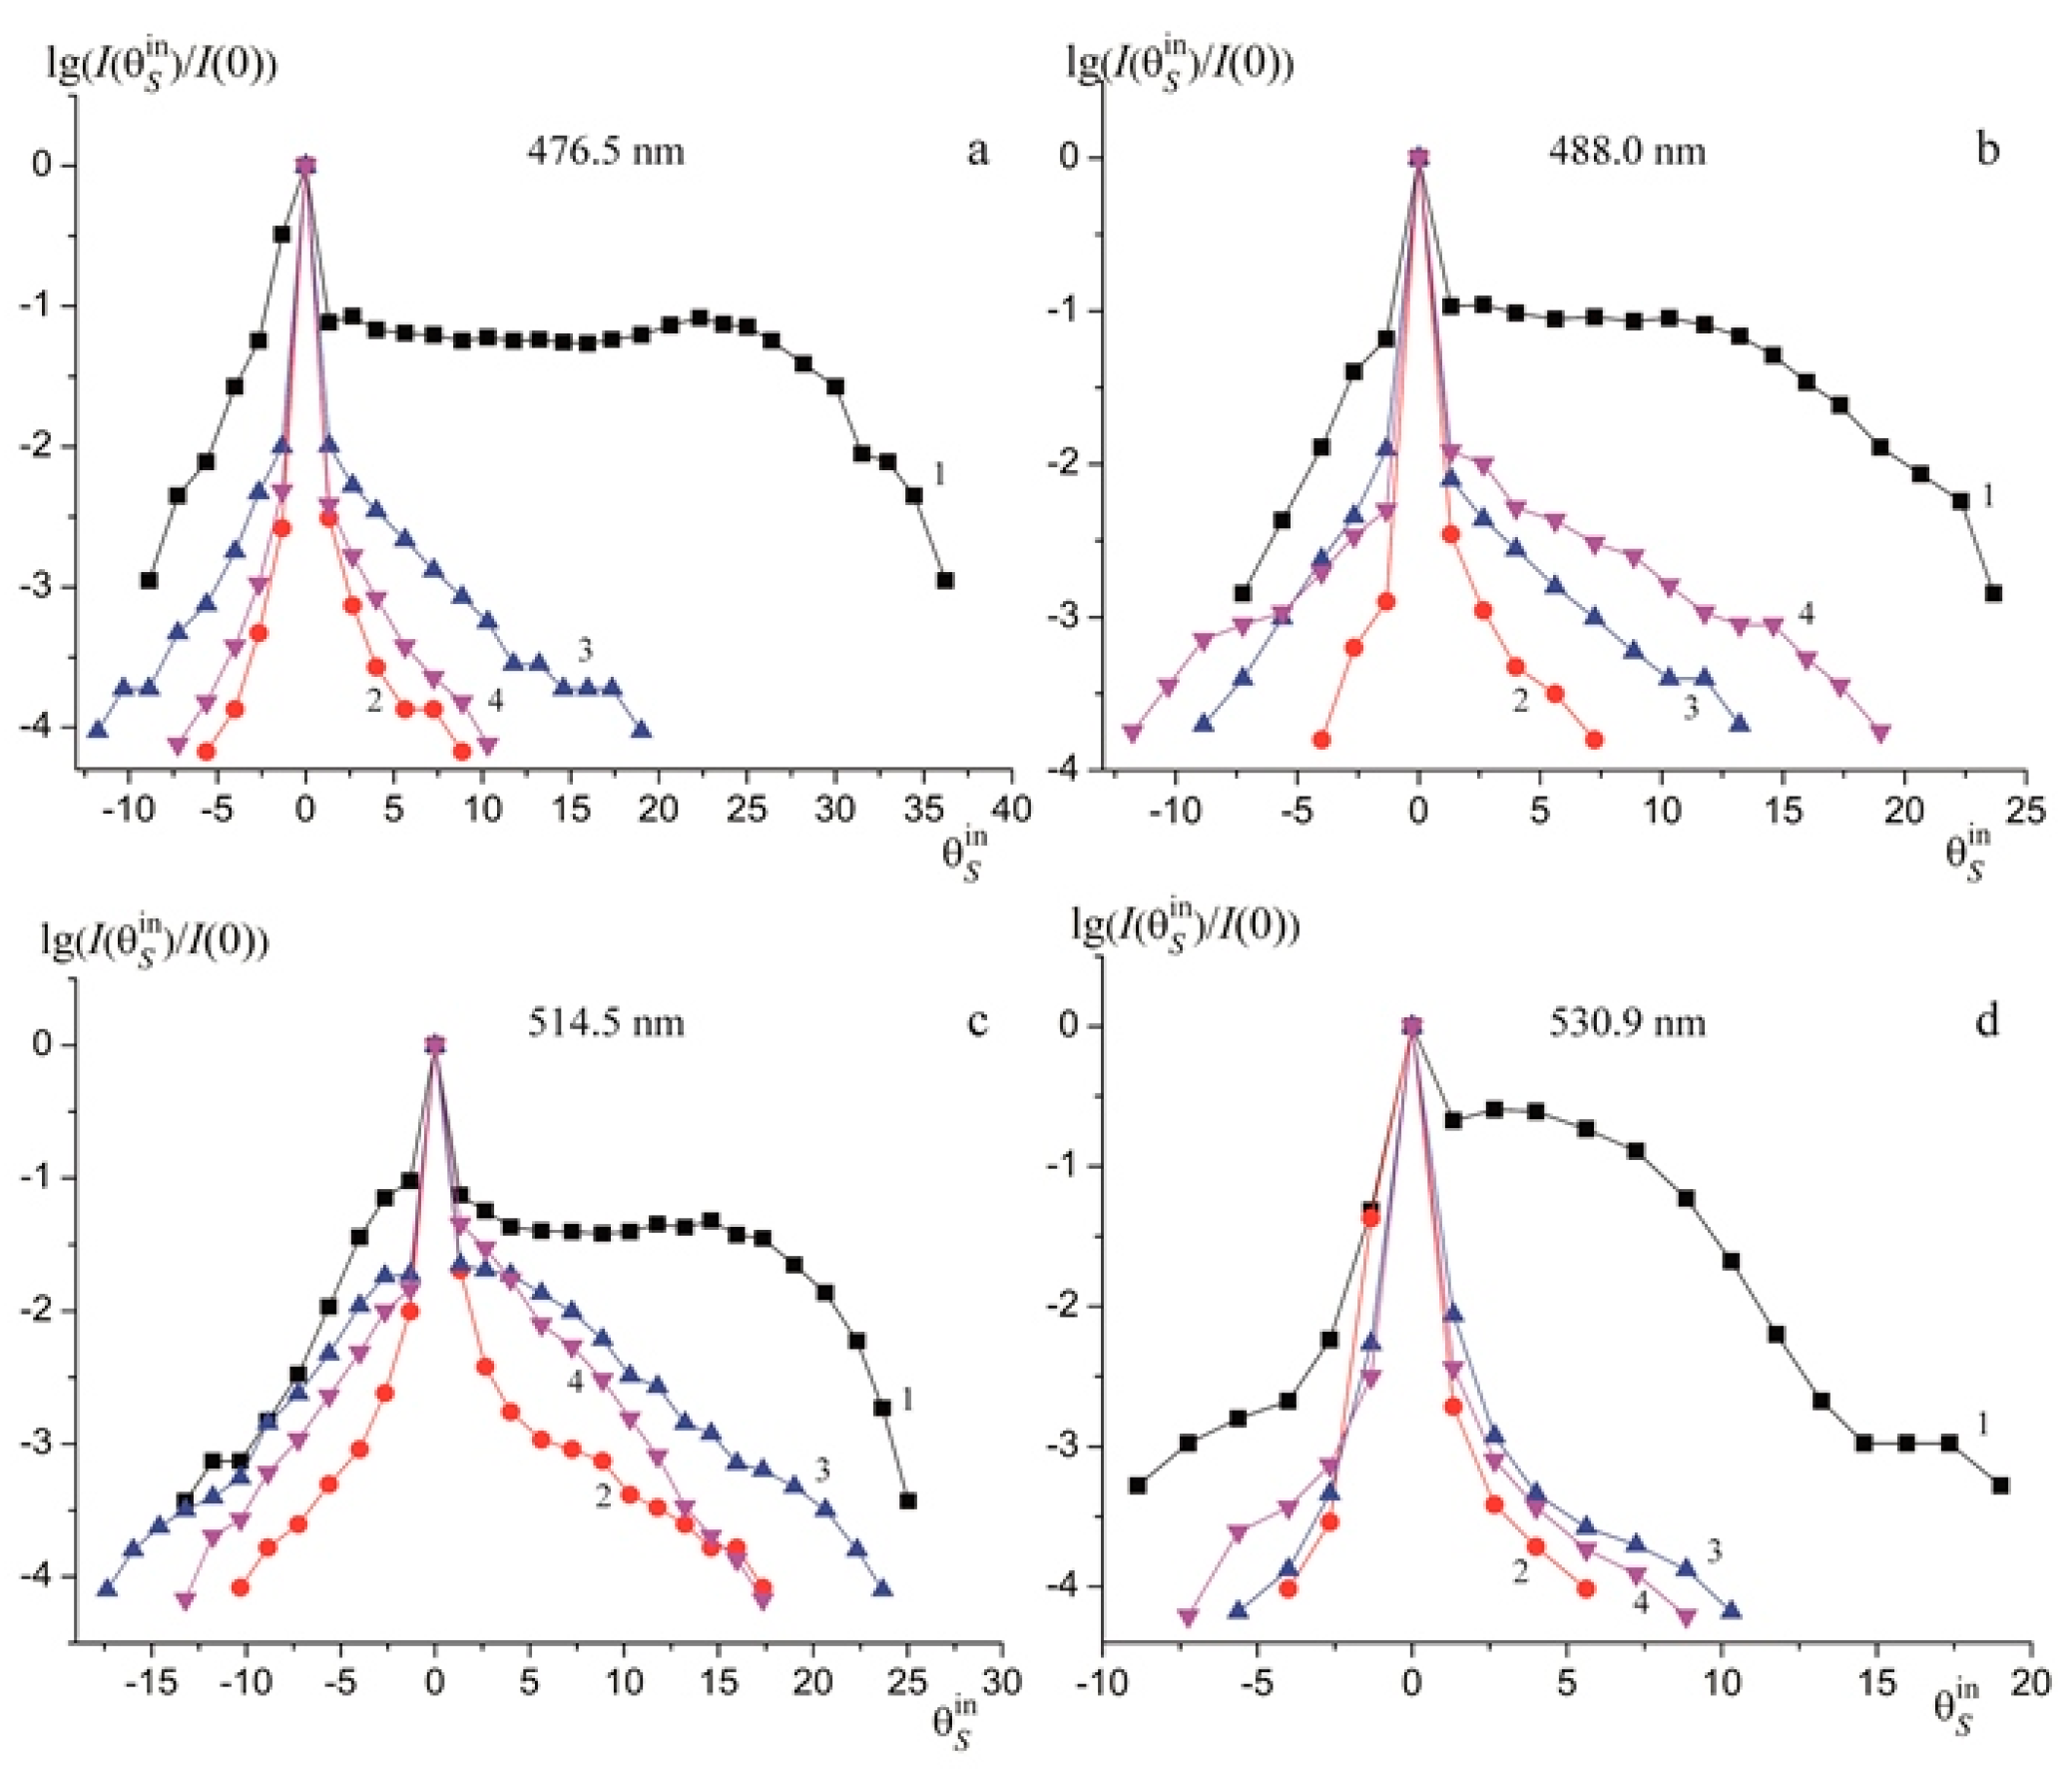
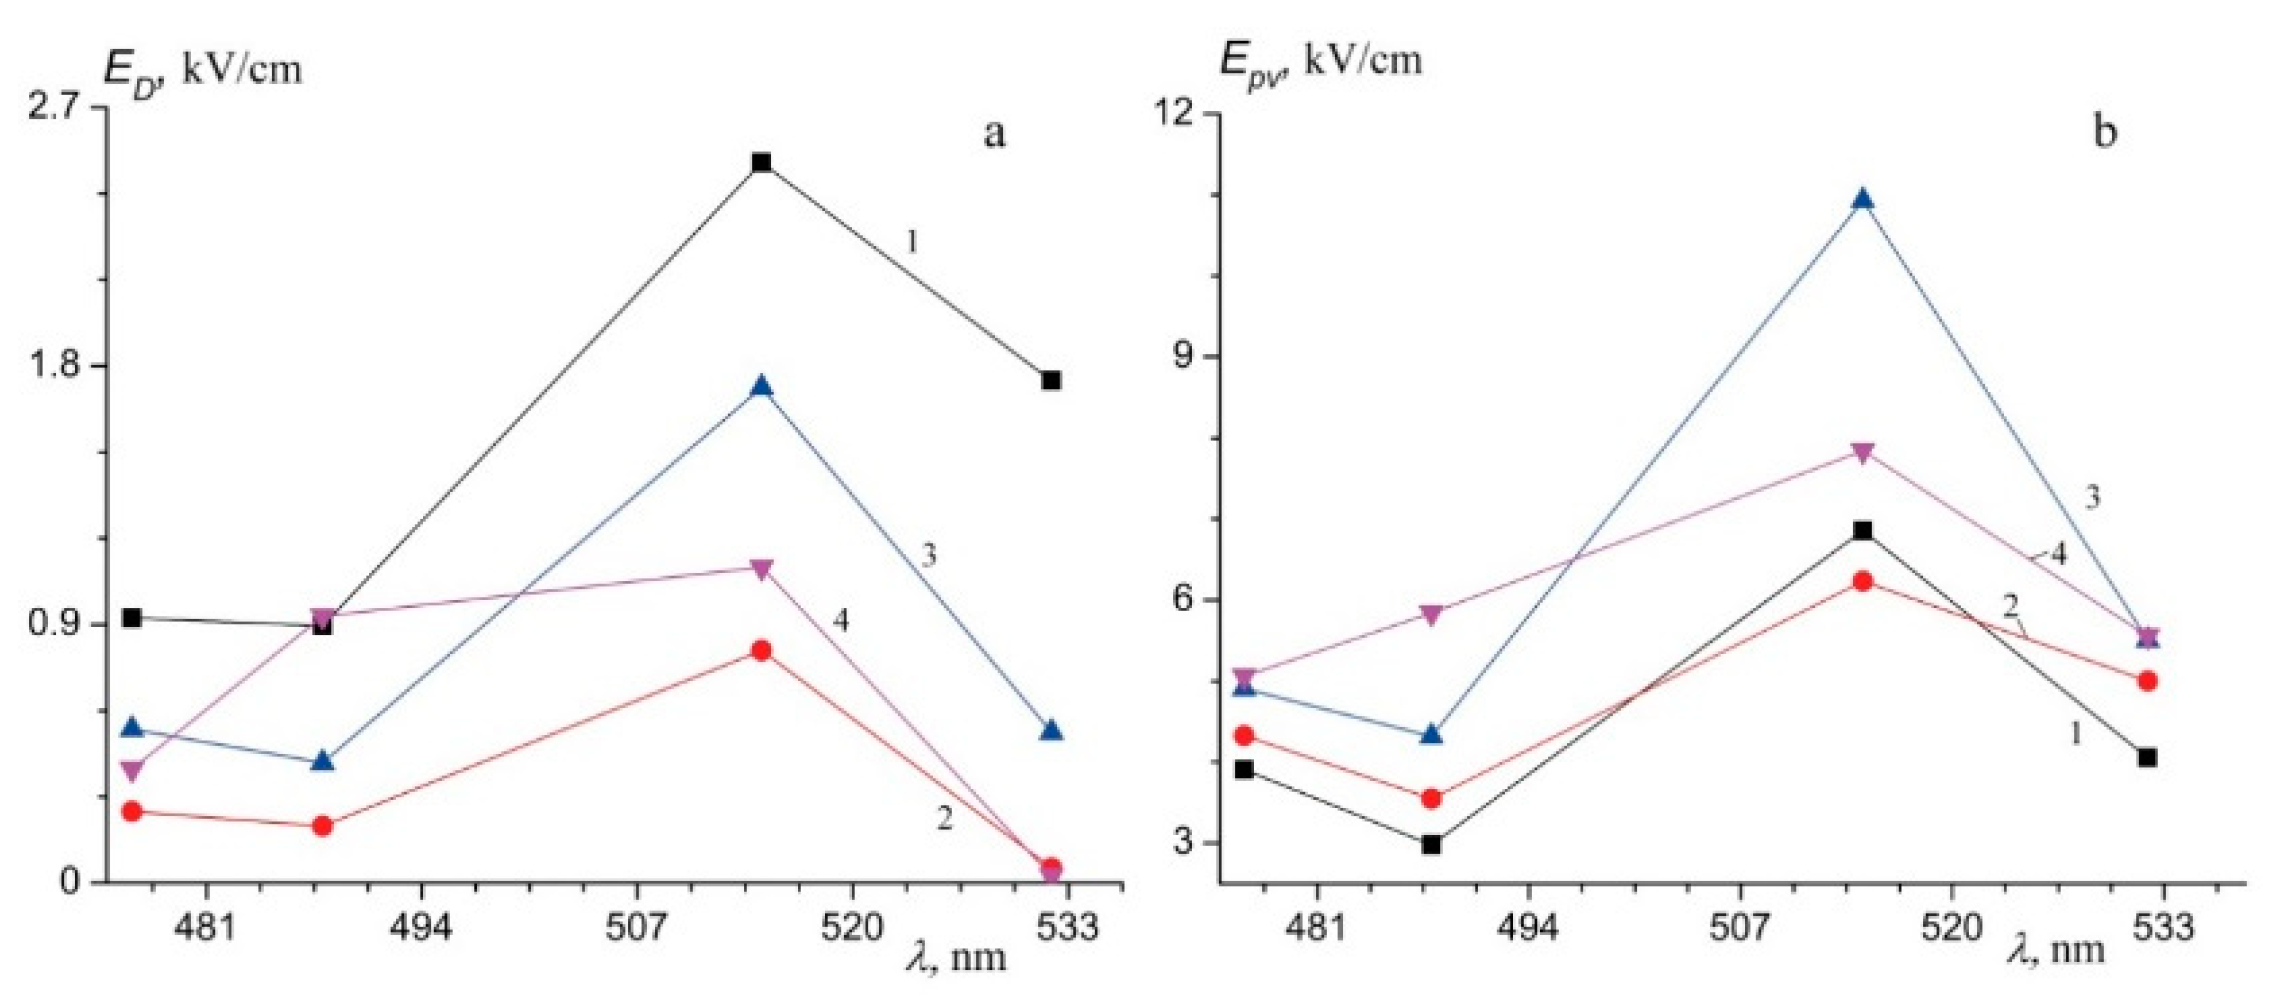
Figure 10 and Figure 11 demonstrate angular distribution of the scattered radiation intensity at different wavelengths and dependences ED (a) and Epv (b) on the wavelengths in studied LN crystals. The band gap for the studied crystals is in the range 3.37–3.78 eV, Table 3. The least band gap was observed in LiNbO3:B and SLN, Table 3, the greatest—in CLN (3.78 eV). Due to [72], a pure CLN crystal band gap is 3.72 eV, which is close to the value characteristic of wide-gap semiconductors.
A predominant photorefraction mechanism in a LN crystal is photovoltaic, which means that the value of the photovoltaic field (Epv) is much greater than that of the diffusion field (ED) [71]. Table 3, Figure 10 and Figure 11 show: an increase in photovoltaic field in a LN crystal is accompanied with an increase in PILS scattering angle θ and an asymmetry of its indicatrix. The photovoltaic field Epv determines the magnitude of the induced birefringence (the effect of photorefraction). SLN has the least Epv at 476.5, 488.0, 514.5, and 530.9 nm excitation. Thus, a diffusion charge transport mechanism is manifested in SLN stronger than in other crystals. This picture is characteristic of crystals with a large number of shallow electron traps.
A dependence of Epv has a maximum at excitation by 514.5 nm for all studied crystals, but LiNbO3:B (0.55 mol%), Figure 11. At the same time, Epv values of LiNbO3:B (0.55 and 0.83 mol%) crystals are close: 5458 and 5554 V/cm, respectively. Curious that ED of a LiNbO3:B (0.83 mol%) crystal is close to that of a CLN. This may indicate an almost equal number of shallow electron traps in these crystals. ED value of a LiNbO3:B (0.55 mol%) crystal is larger than that of CLN and LiNbO3:B (0.83 mol%) crystals; at the same time, its PILS indicatrix opening angle is minimal, Table 3.

3.5. Chemical Interactions in Systems Li2O–Nb2O5, Li2O–B2O3–Nb2O5; Particularities of LN Crystallization from Melts with Non-Metal Dopants

Solid-phase chemical reactions with the formation of various borates occur in the process of high-temperature synthesis of the charge in the Li2O–B2O3–Nb2O5 system. To evaluate the melt–crystal system, it is advisable to use the distribution coefficients KD and the ∆C parameter. KD is the ratio of the impurity concentration in the crystal at the initial moment of growth and the impurity concentration in the melt, ∆C characterizes the compositional uniformity of the crystal; it is defined as the difference between the dopant concentration at the cone and the end of the crystal. A crucial particularity of boron is its ability to change LiNbO3:B melt and crystal structure without incorporation to the crystal. Its effective distribution coefficient (KD) is only ~3 × 10⁻⁴ [19,20,25]. Such small values of the boron distribution coefficient in the Li2O–Nb2O5–B2O3 system are due to the fact [
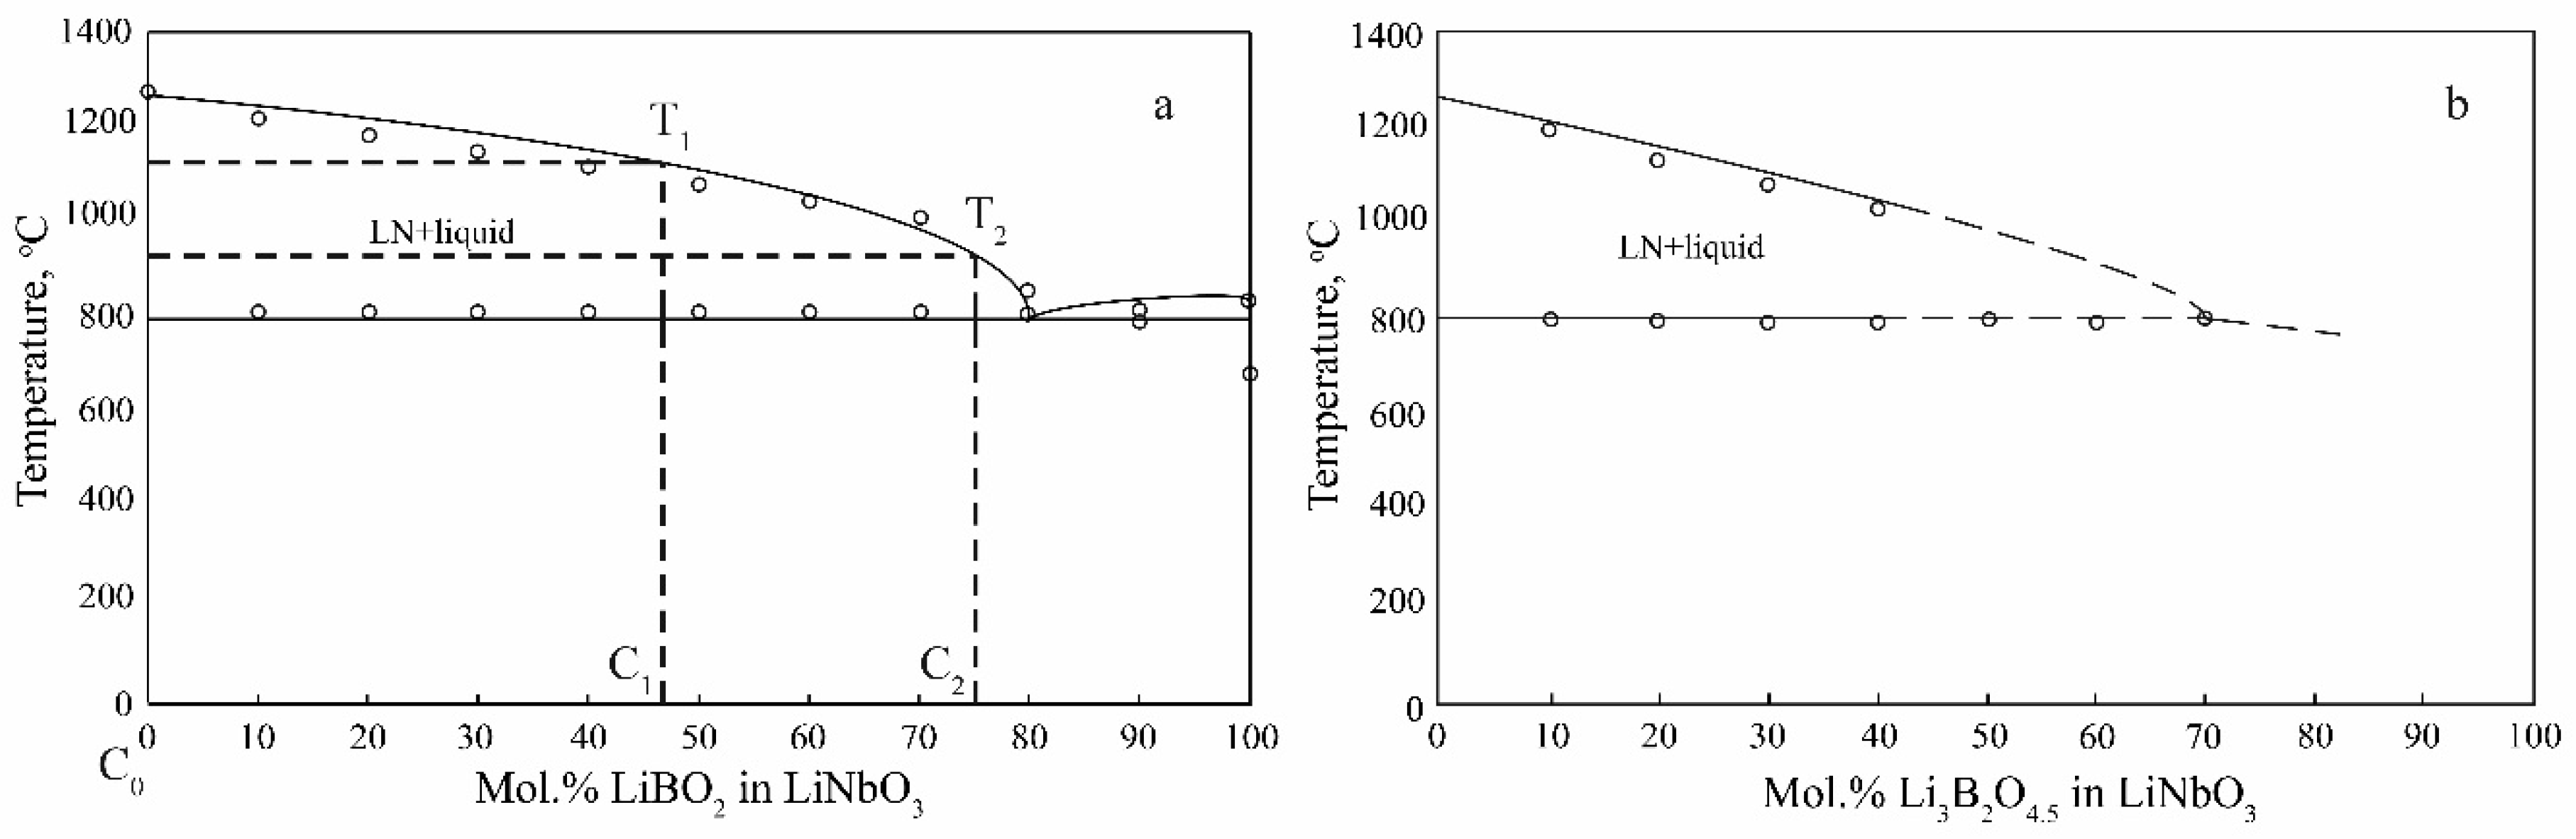
73] that boron should not incorporate into the LiNbO3:B crystal, since the LN phase has no region of boron solubility in the solid state, Figure 12. The small amount of boron that does incorporate into the LN structure can be either be mechanically captured or incorporate into the tetrahedral voids of the crystal structure. Note that boron B3+ has a small ion radius. Quasi-double diagrams are polythermal sections of the general quasi-ternary diagram of the state of systems Li2O–Nb2O5–B2O3: LiNbO3–LiBO2, and LiNbO3–Li3B2O4.5. These cross sections have a simple form, since they contain only one two-phase eutectic transformation each and have no solubility regions, Figure 12, [73]. This type of phase diagram is generally favorable for the quality of the growing LiNbO3:B crystal since crystallization proceeds from the two-phase region and the only crystallizing phase is LN. If we disregard the radical change in the structure of the melt upon doping with boron, crystal grown from such a melt should chemically and structurally correspond to a CLN grown from an undoped melt. Wherein studied LiNbO3:B crystals have NbLi defects amount close to that of an SLN crystal. Moreover, the LiNbO3:B crystal has a more ordered structure than CLN [25]. Note that NbLi are the deepest electron traps responsible for the photorefractive effect. The reason for this is apparently an electronic structure of boron: it is a strong complexing element due to 1 electron at a p–orbital. The electron provides high ionization energies and electronegativity values at a small ionic radius, which leads to a significant change in the structure of the boron-containing melt.
Table 4 demonstrates ∆C and KD for exact B, Mg, Zn, and Ce dopants concentrations in the melt. The necessity to use KD and ∆C is substantiated in detail in the works [27,74]. The distribution coefficient KD for doped (B, Zn, Mg, and Ce) LN crystals is clearly a function of the electronic structure of the dopant; the ∆C case is not so obvious, Table 4. The ∆C parameter value is quite small for all studied dopants except Zn. In fact, the value is comparable to the error of the method for determining the dopant concentration, Table 4.
Table 4 data reveal high concentration uniformity in dopant distribution along the polar axis at a KD coefficient strongly different from the unity. This is especially characteristic of LiNbO3:B crystals, in which KD << 1 and ∆C ~ 10−6 wt%. The explanation of this fact can be the following. The initial LN charge composition ceases to be congruent with the addition of dopant, Figure 12. This, in particular, means that the spectrum of variations of ionic complexes in the melt in terms of structure and components greatly increases. The melt is trapped in a limited zone near the crystallization front, which has a constant temperature. Consequently, those ionic complexes for which this temperature is solidus (Tc1) will crystallize, naturally, taking into account some supercooling. As part of the volume of the melt is consumed, the concentration of the dopant (in our case, boron) in the remaining melt increases and the ratio of the concentrations of various ionic complexes changes. Accordingly, the fraction of ionic complexes for which the temperature Tc1 is the solidus temperature will also change, it will become noticeably less. This will continue until the system reaches a certain critical state, at which the concentration of complexes with solidus temperature Tc1 is insufficient for the growth of a crystal with a constant dopant concentration. This circumstance limits the fraction of the melt that can be crystallized to obtain a compositionally uniform LiNbO
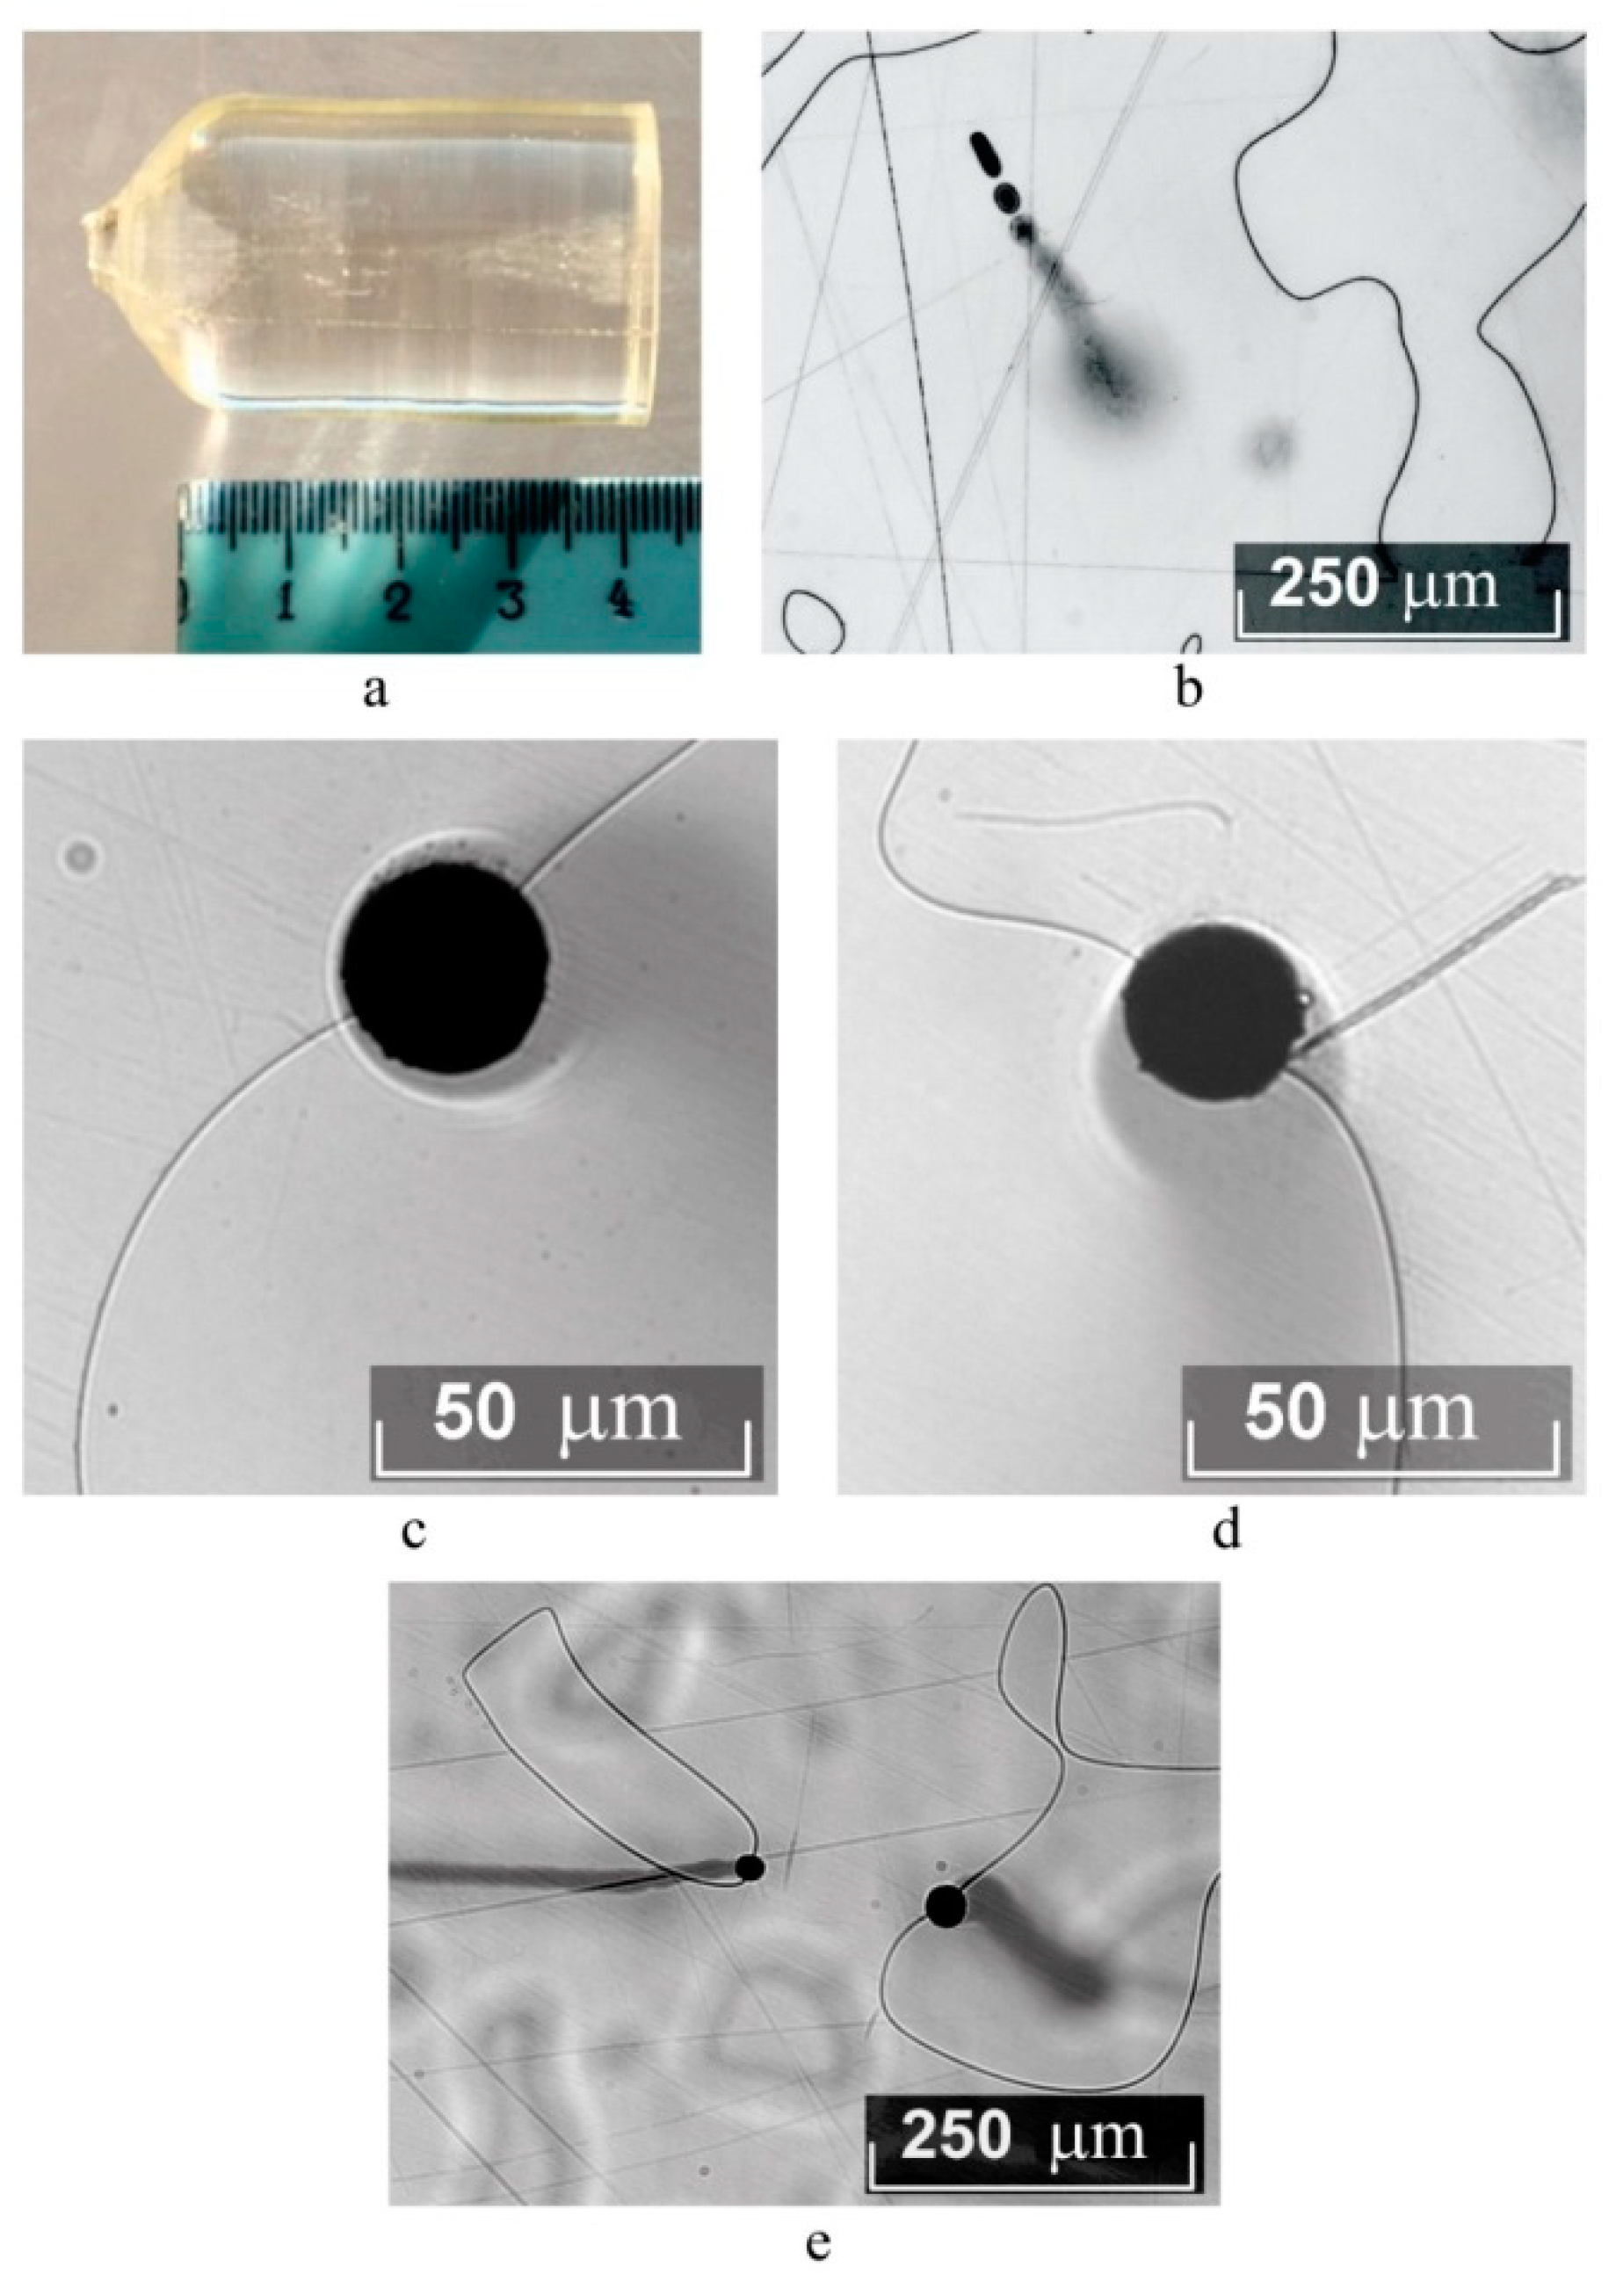
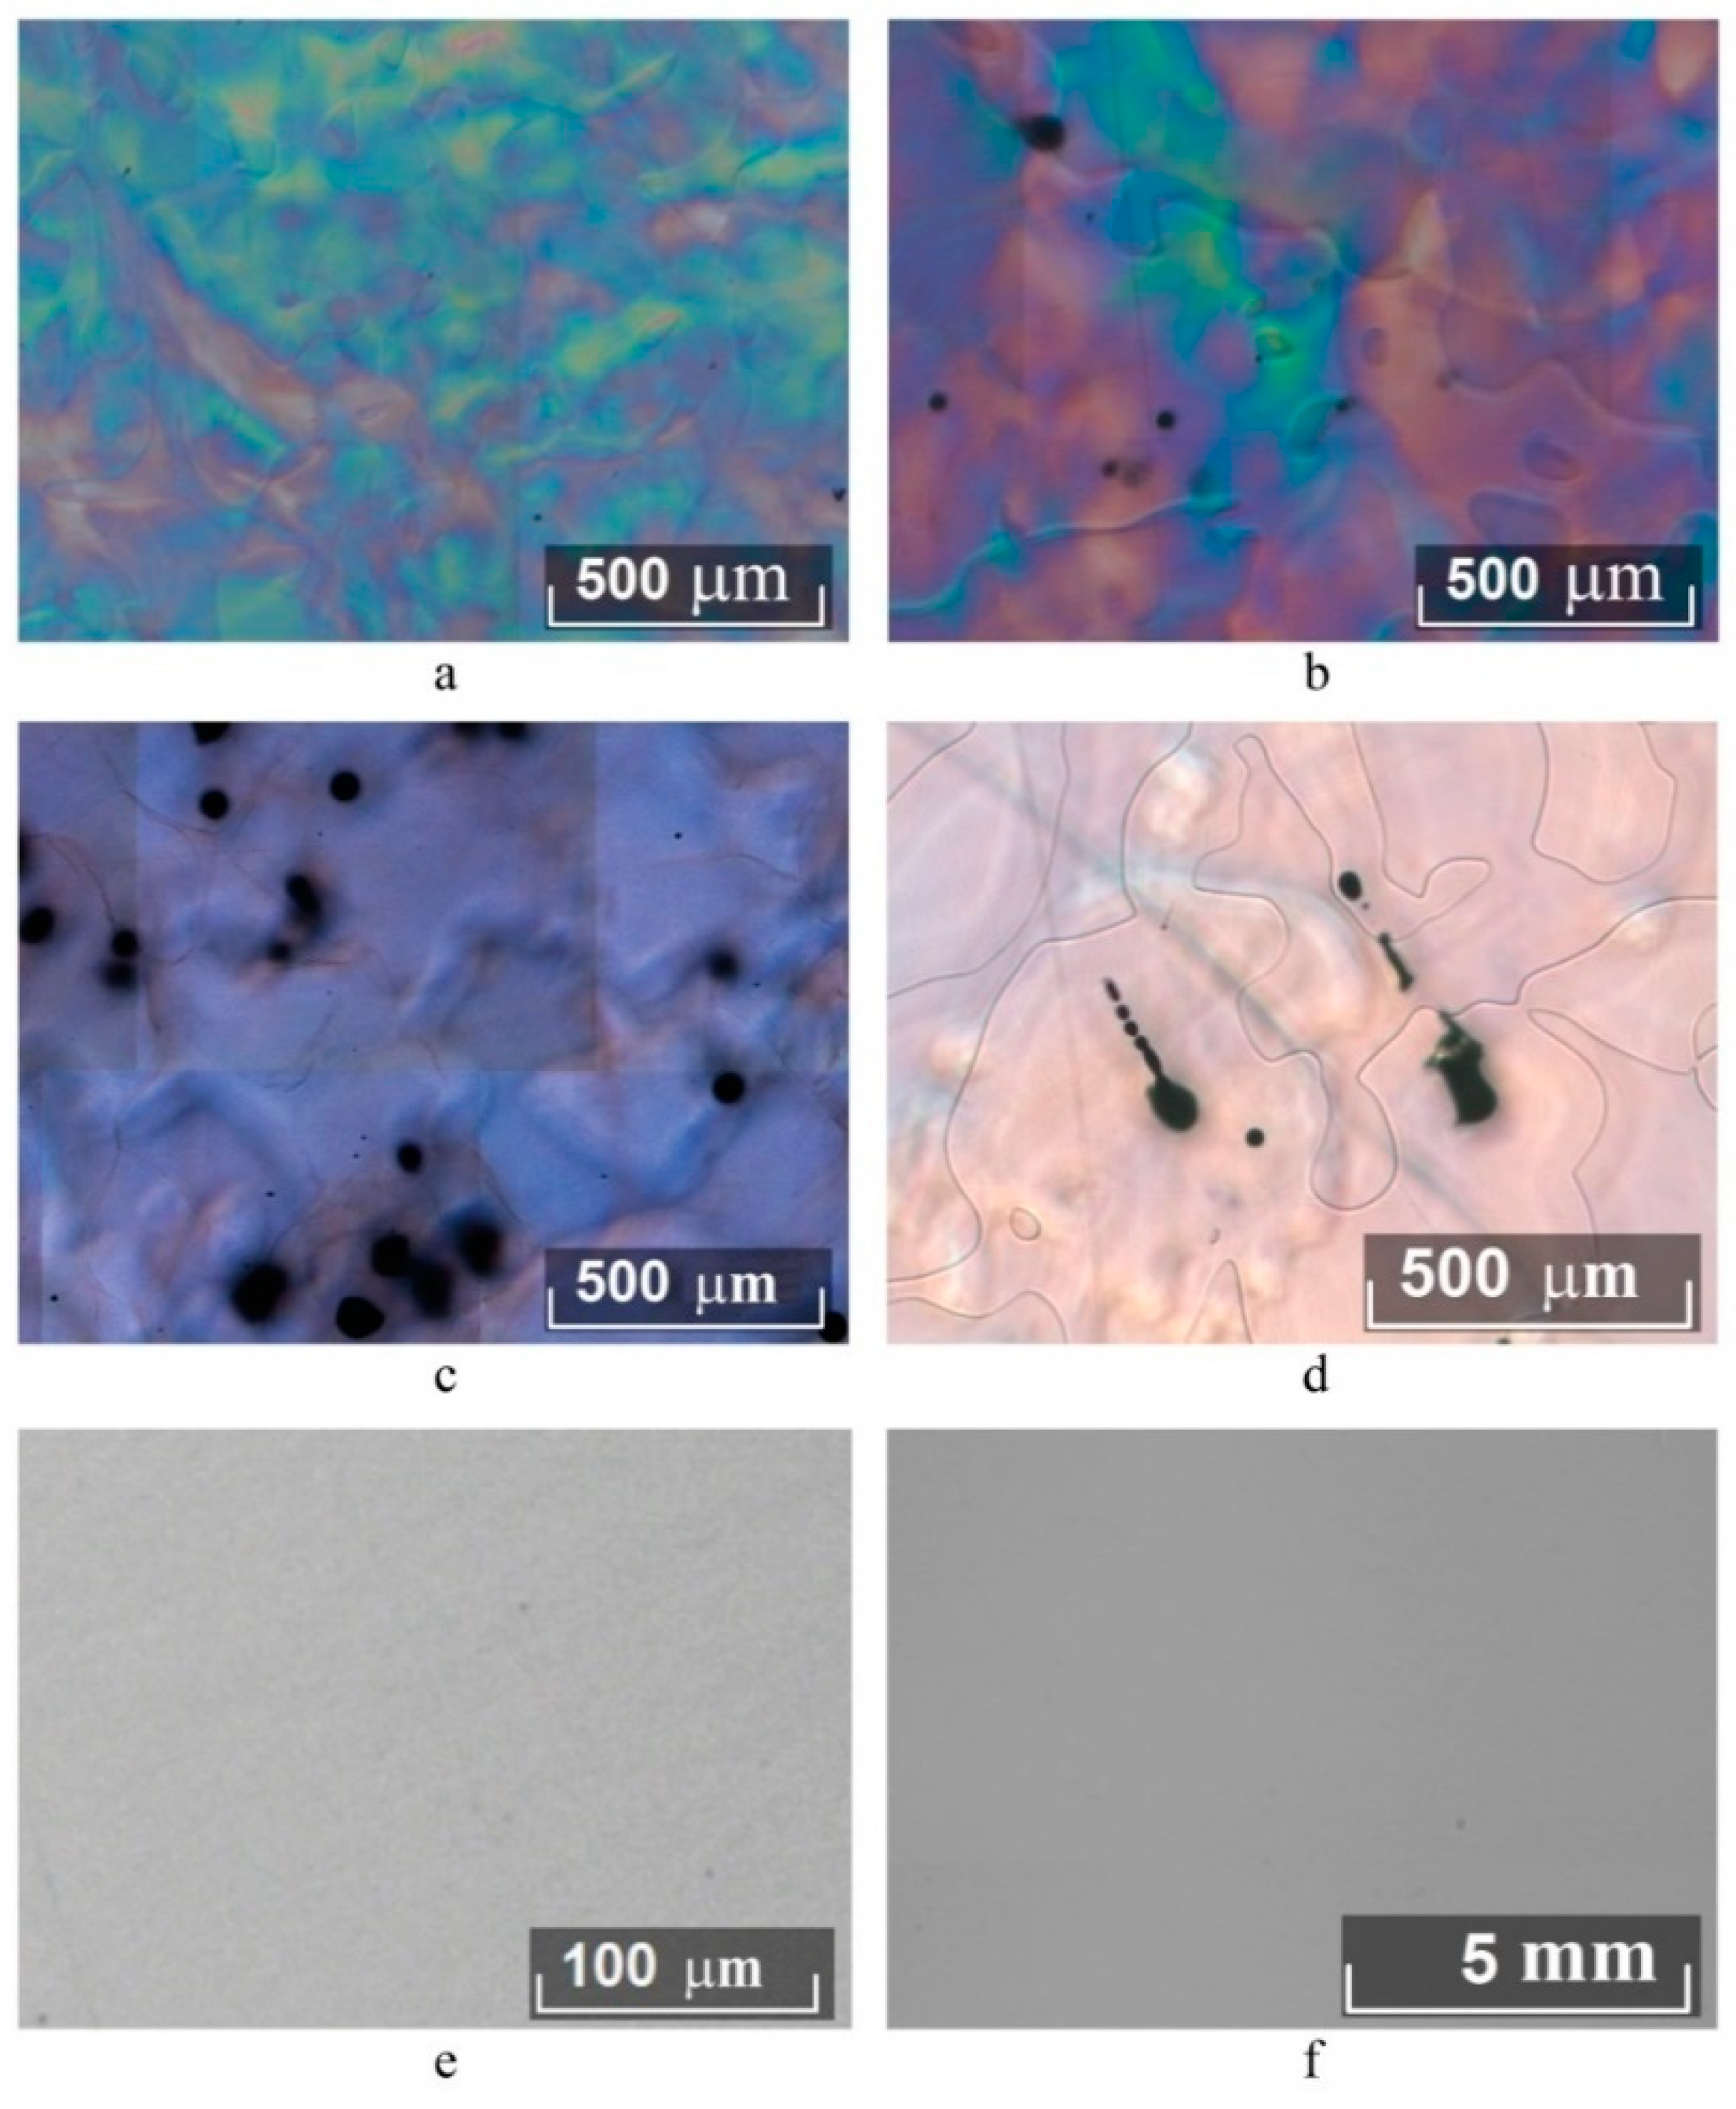
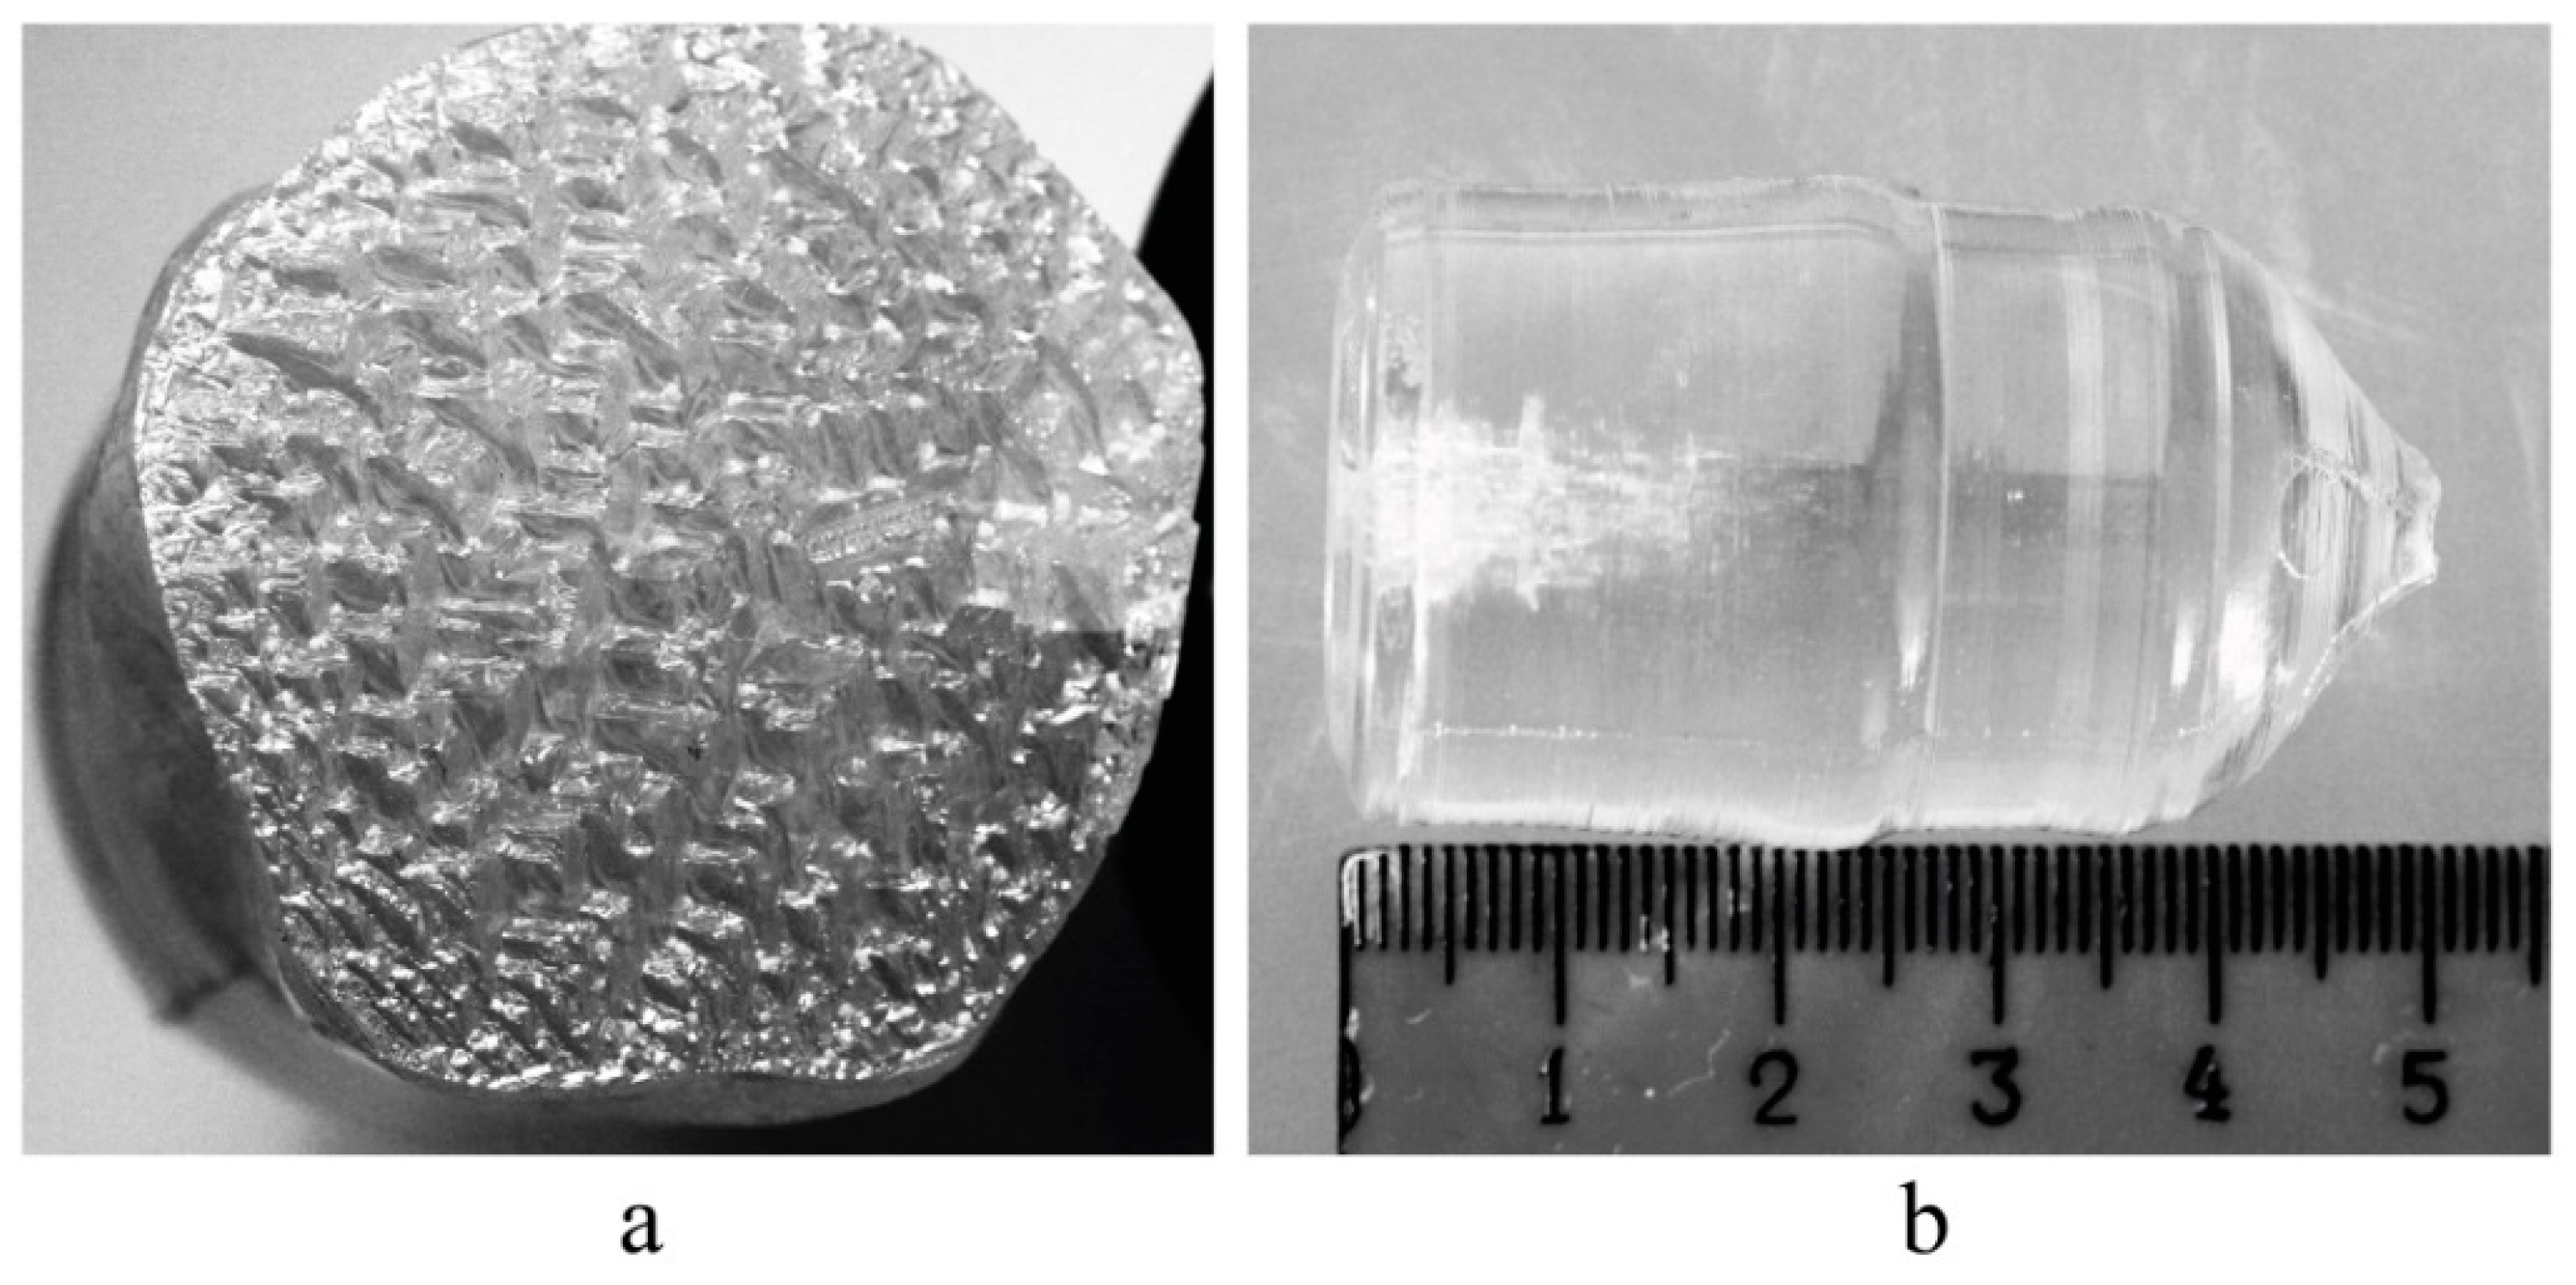
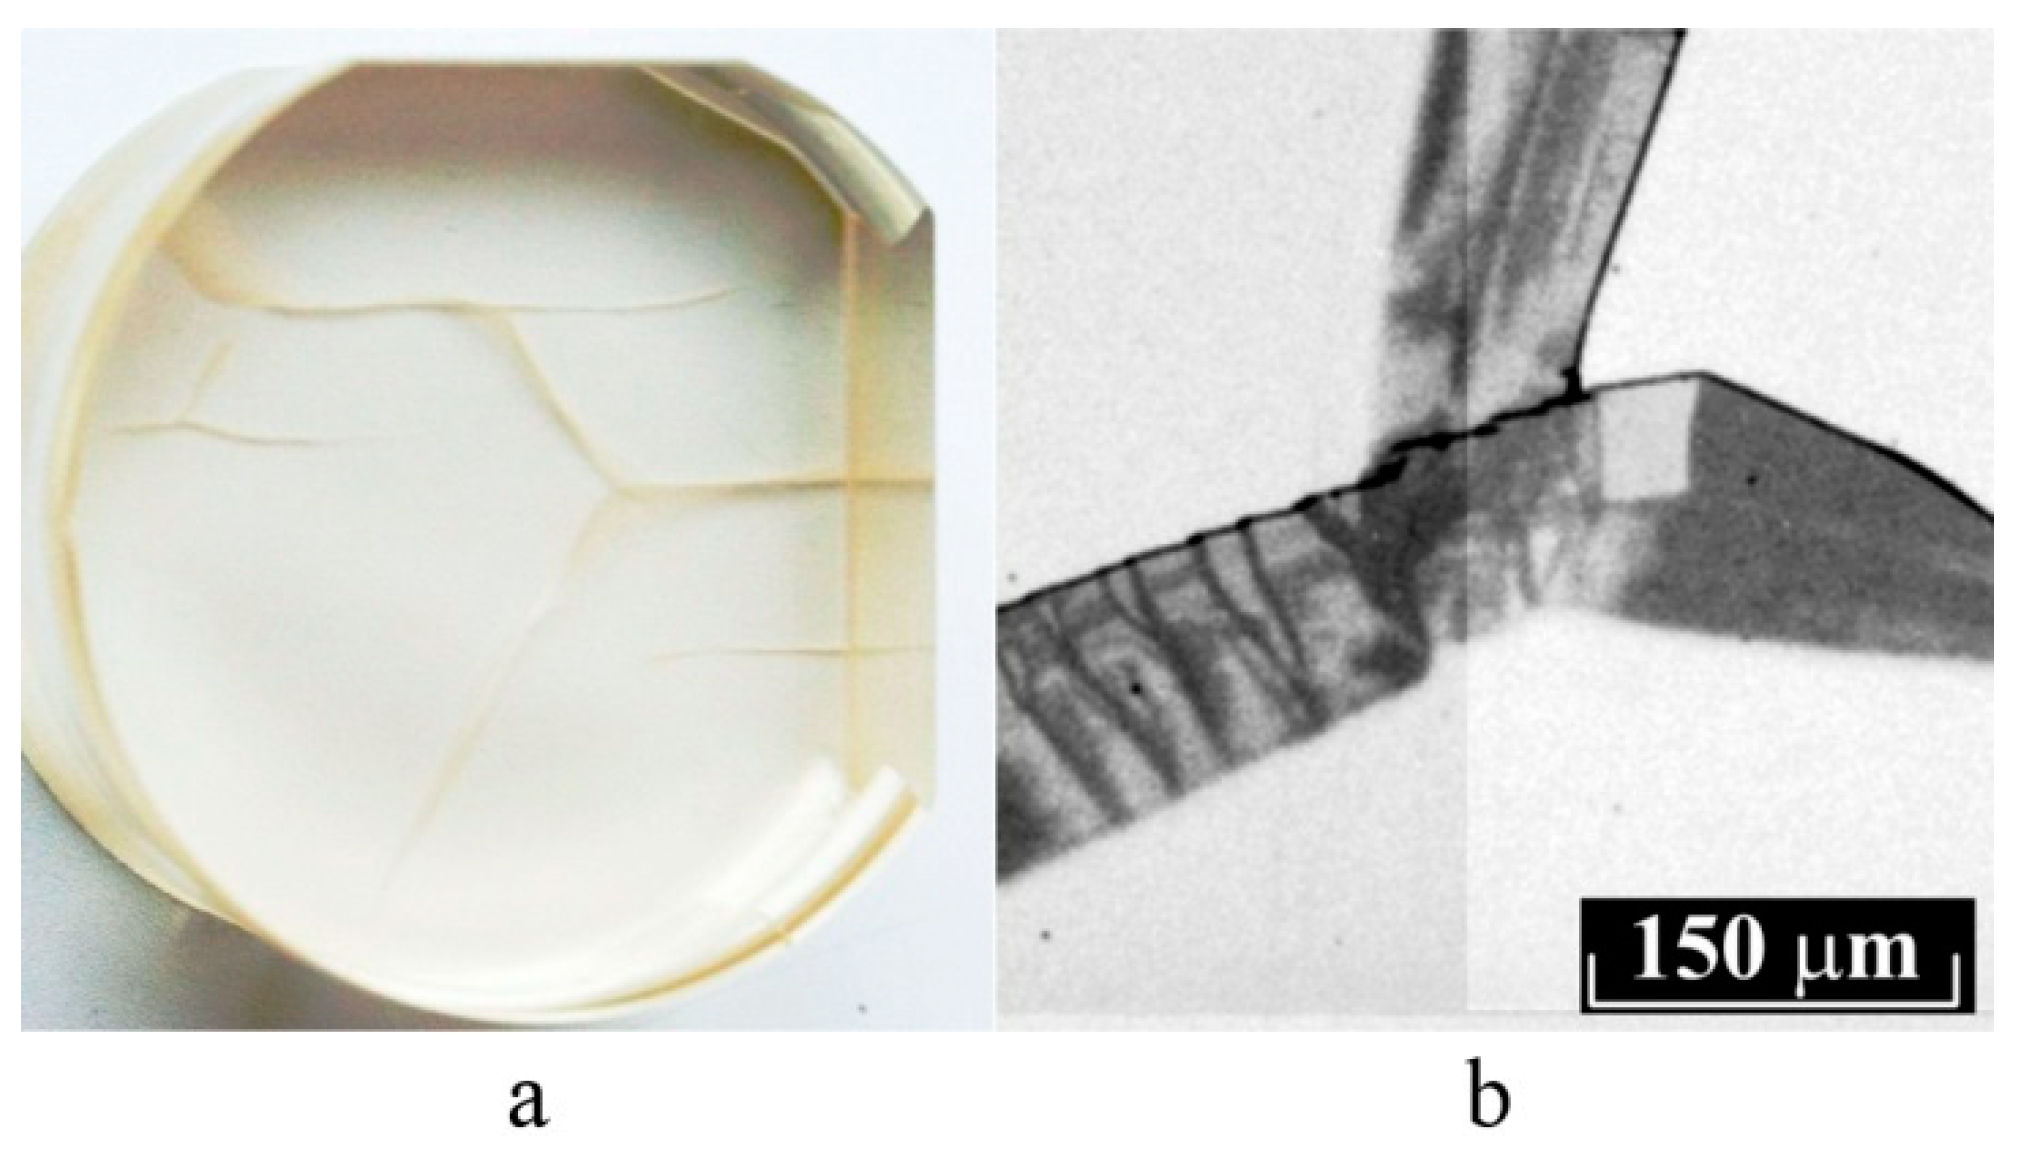
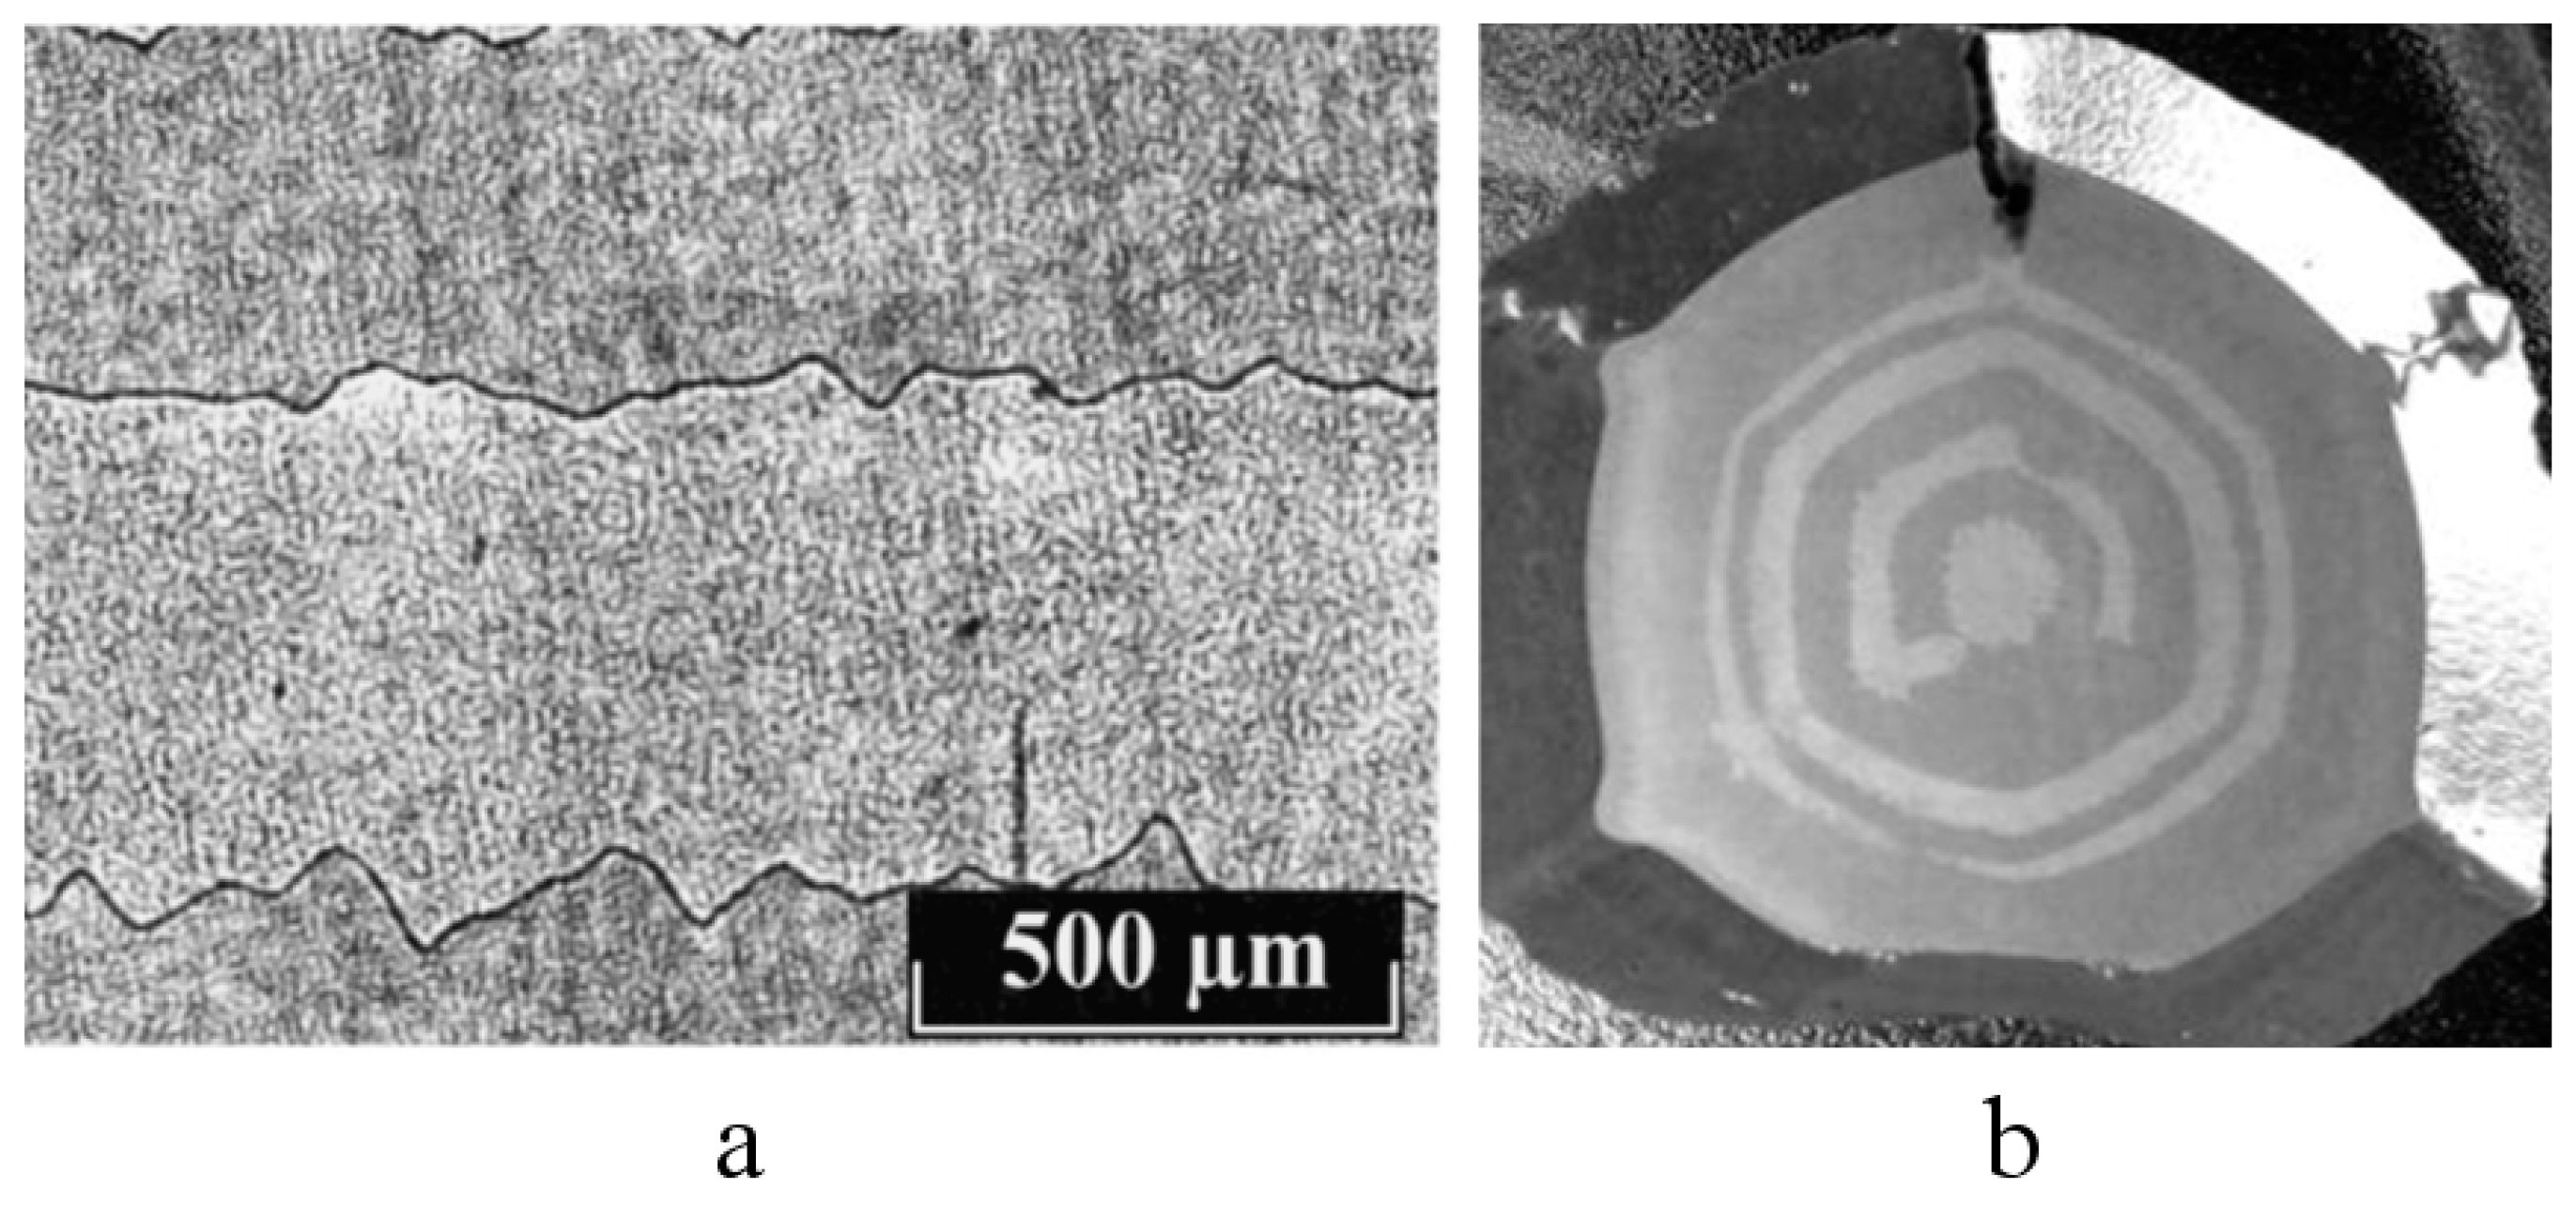
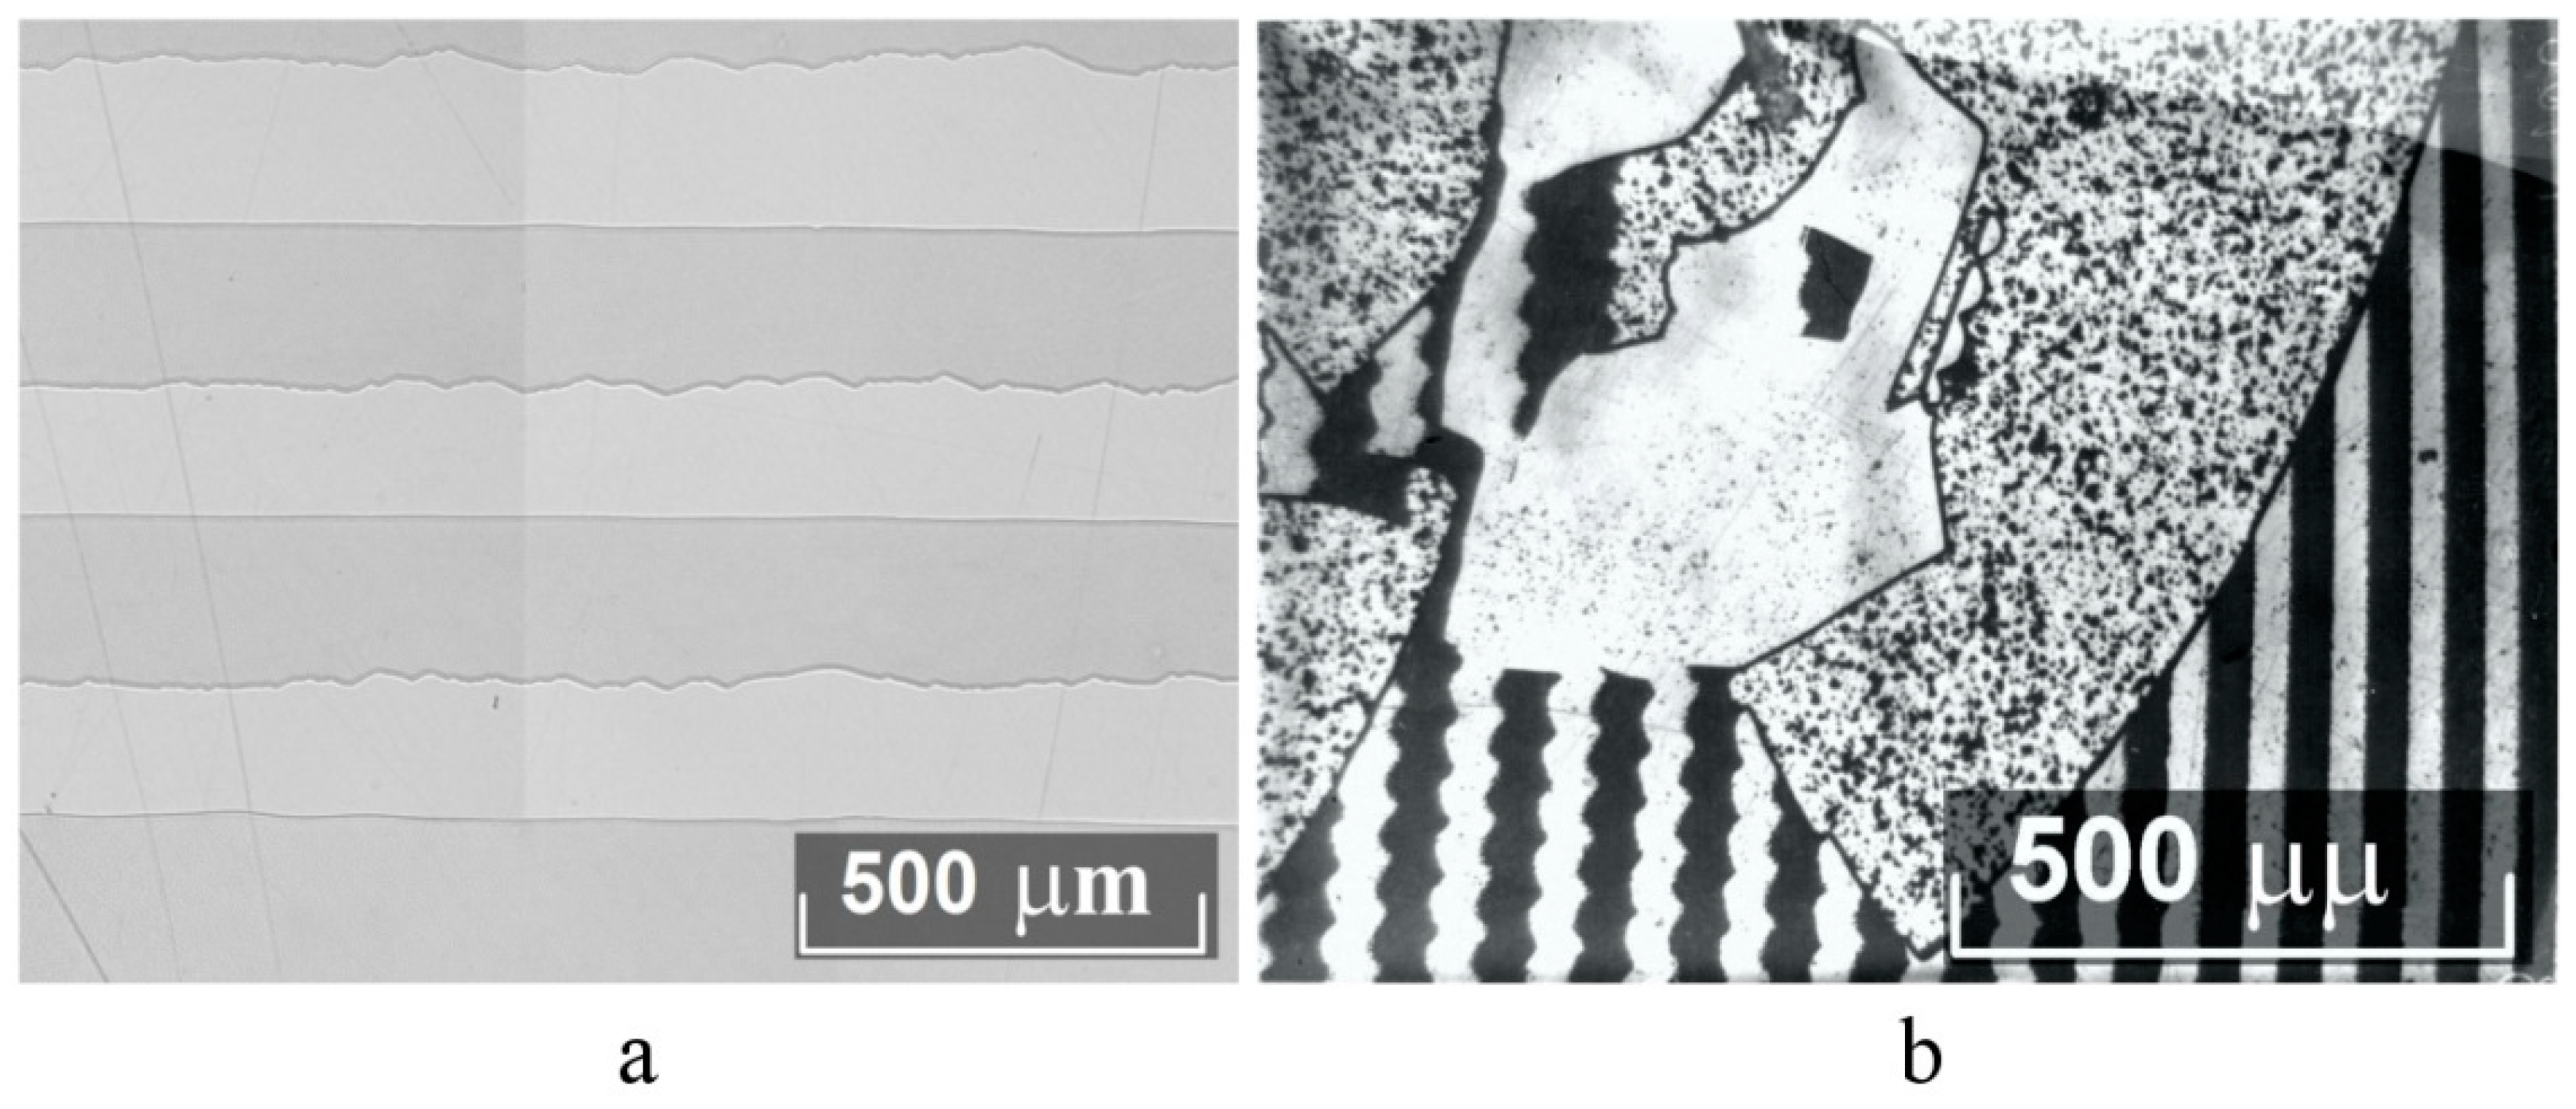
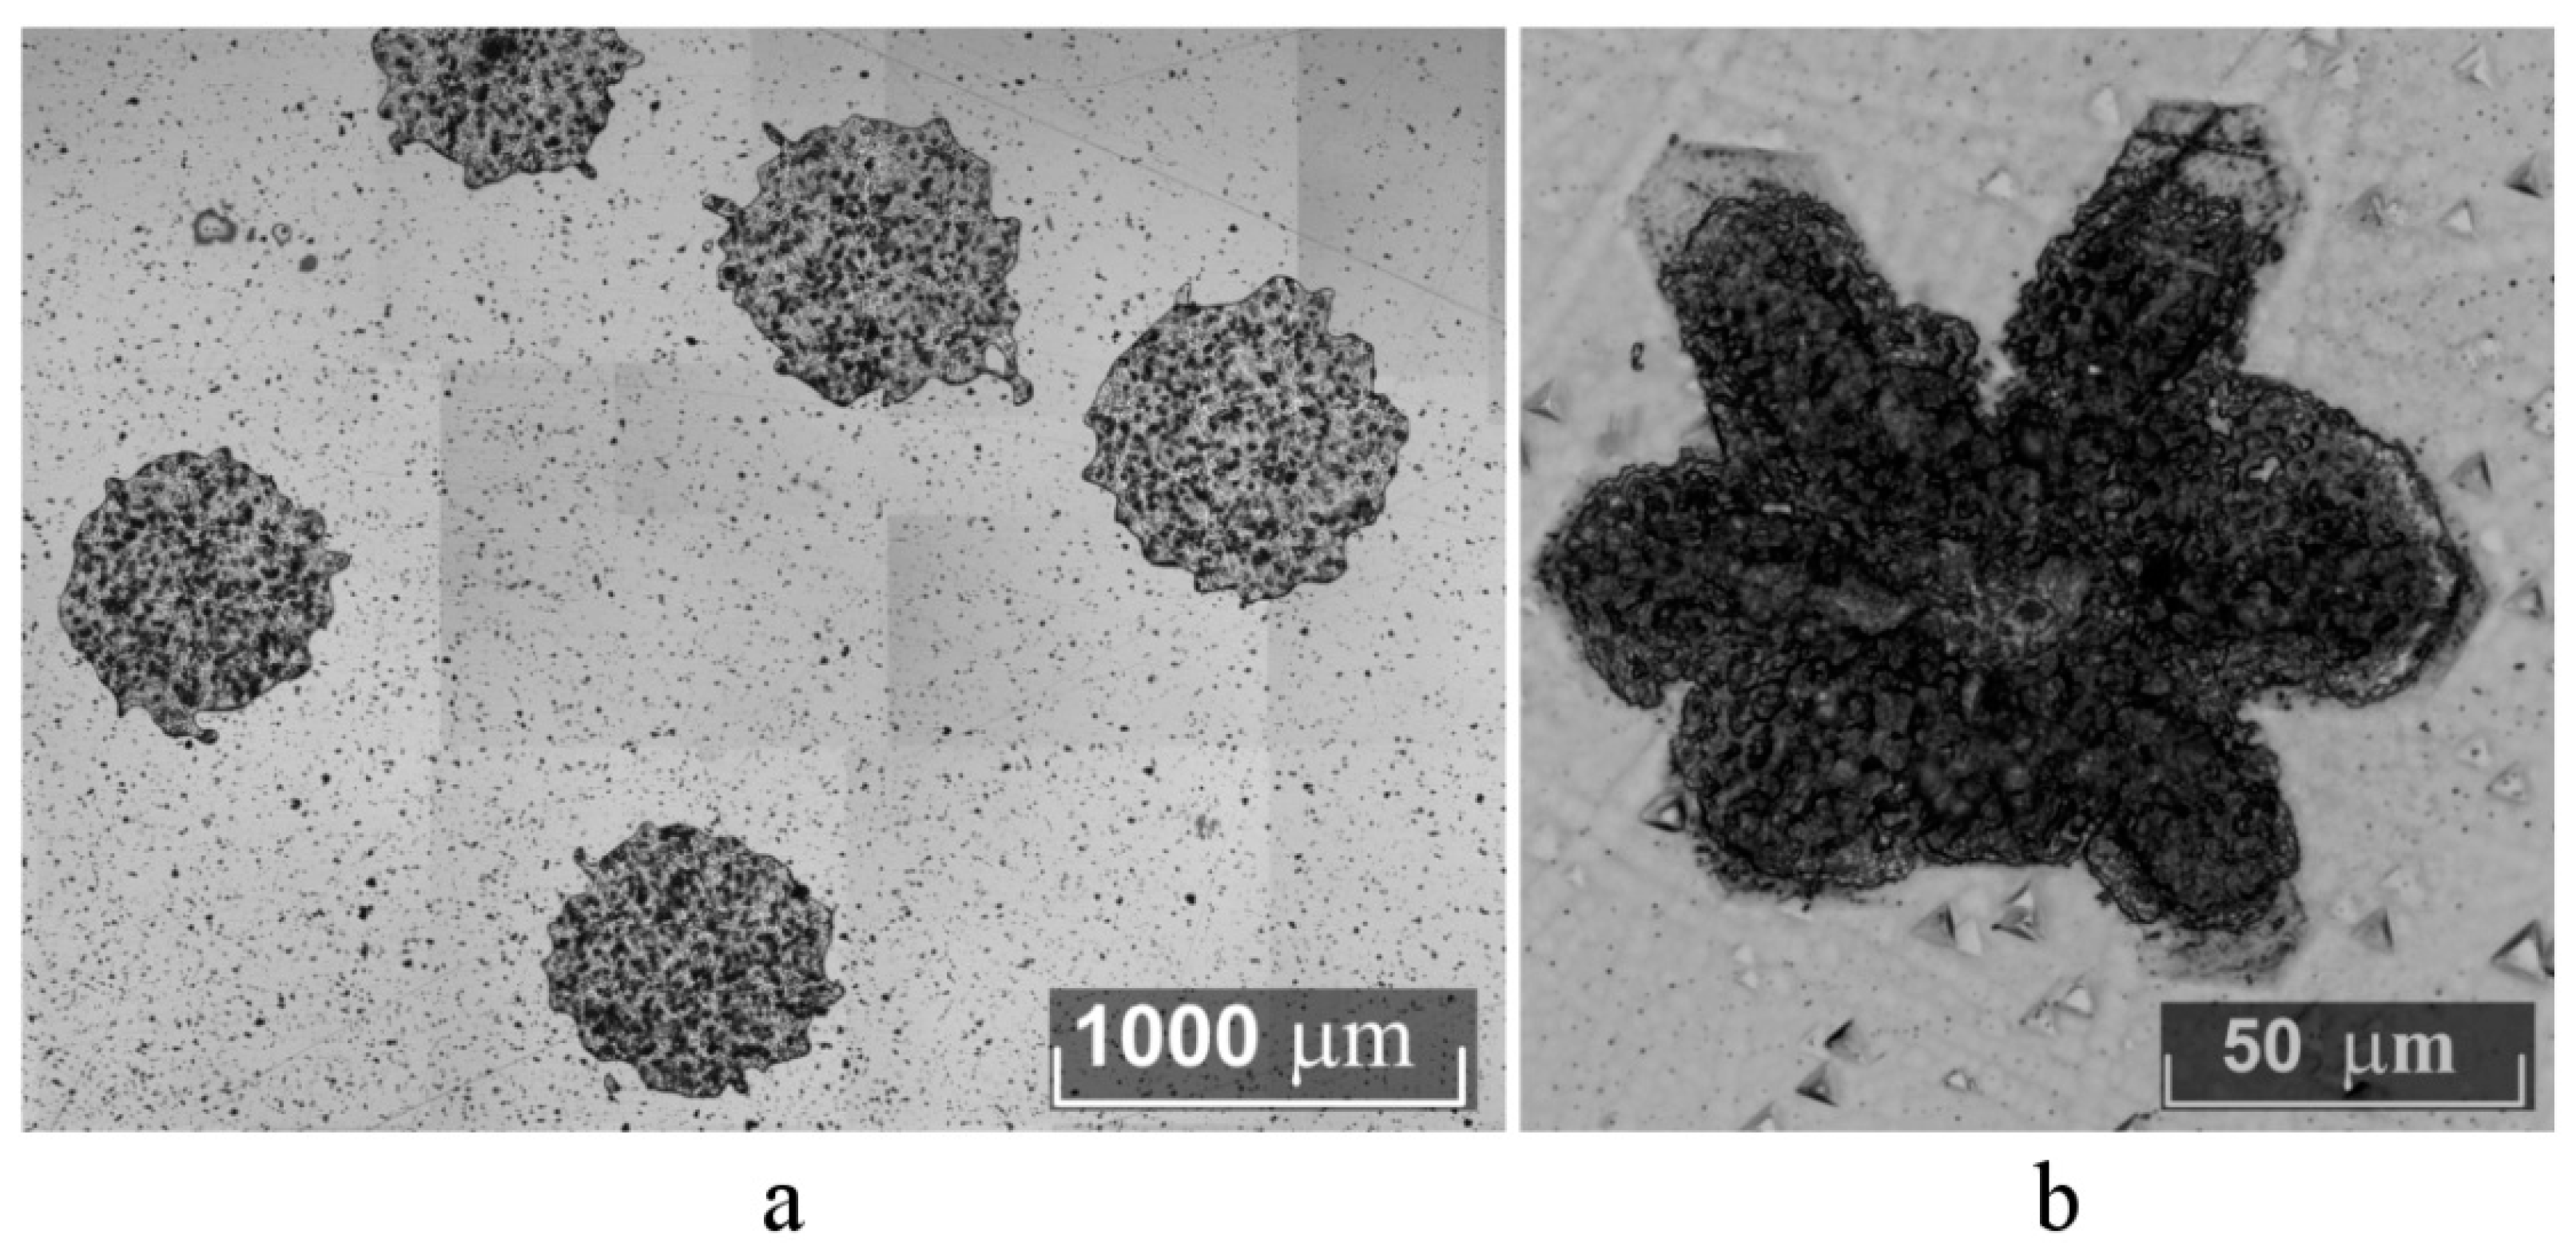
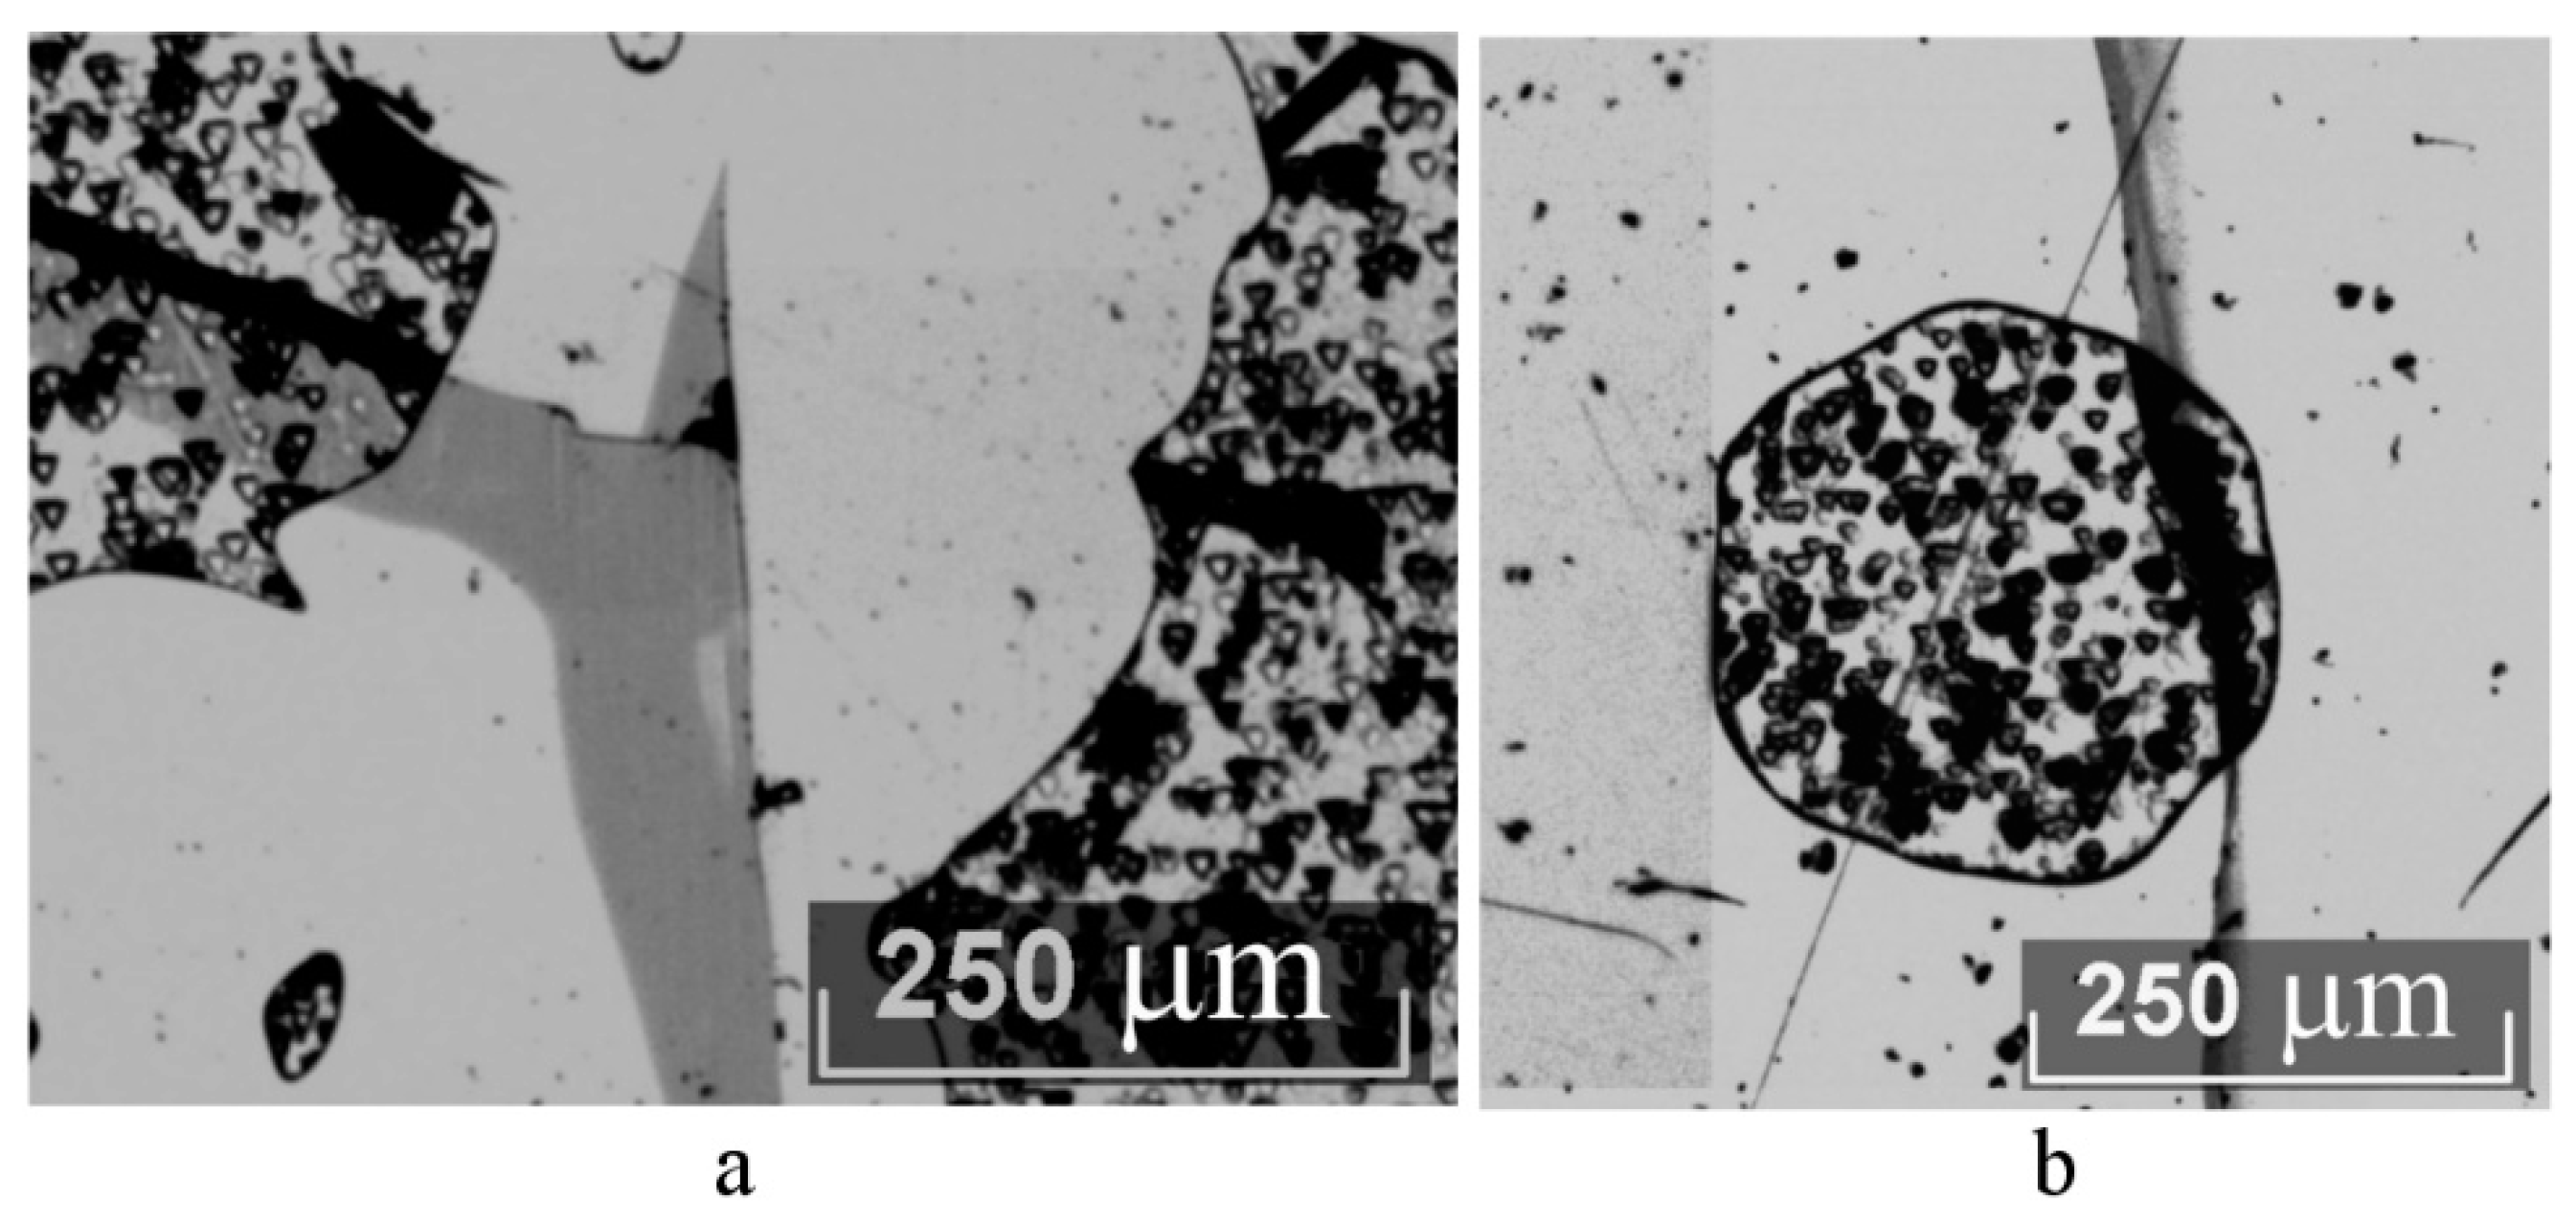
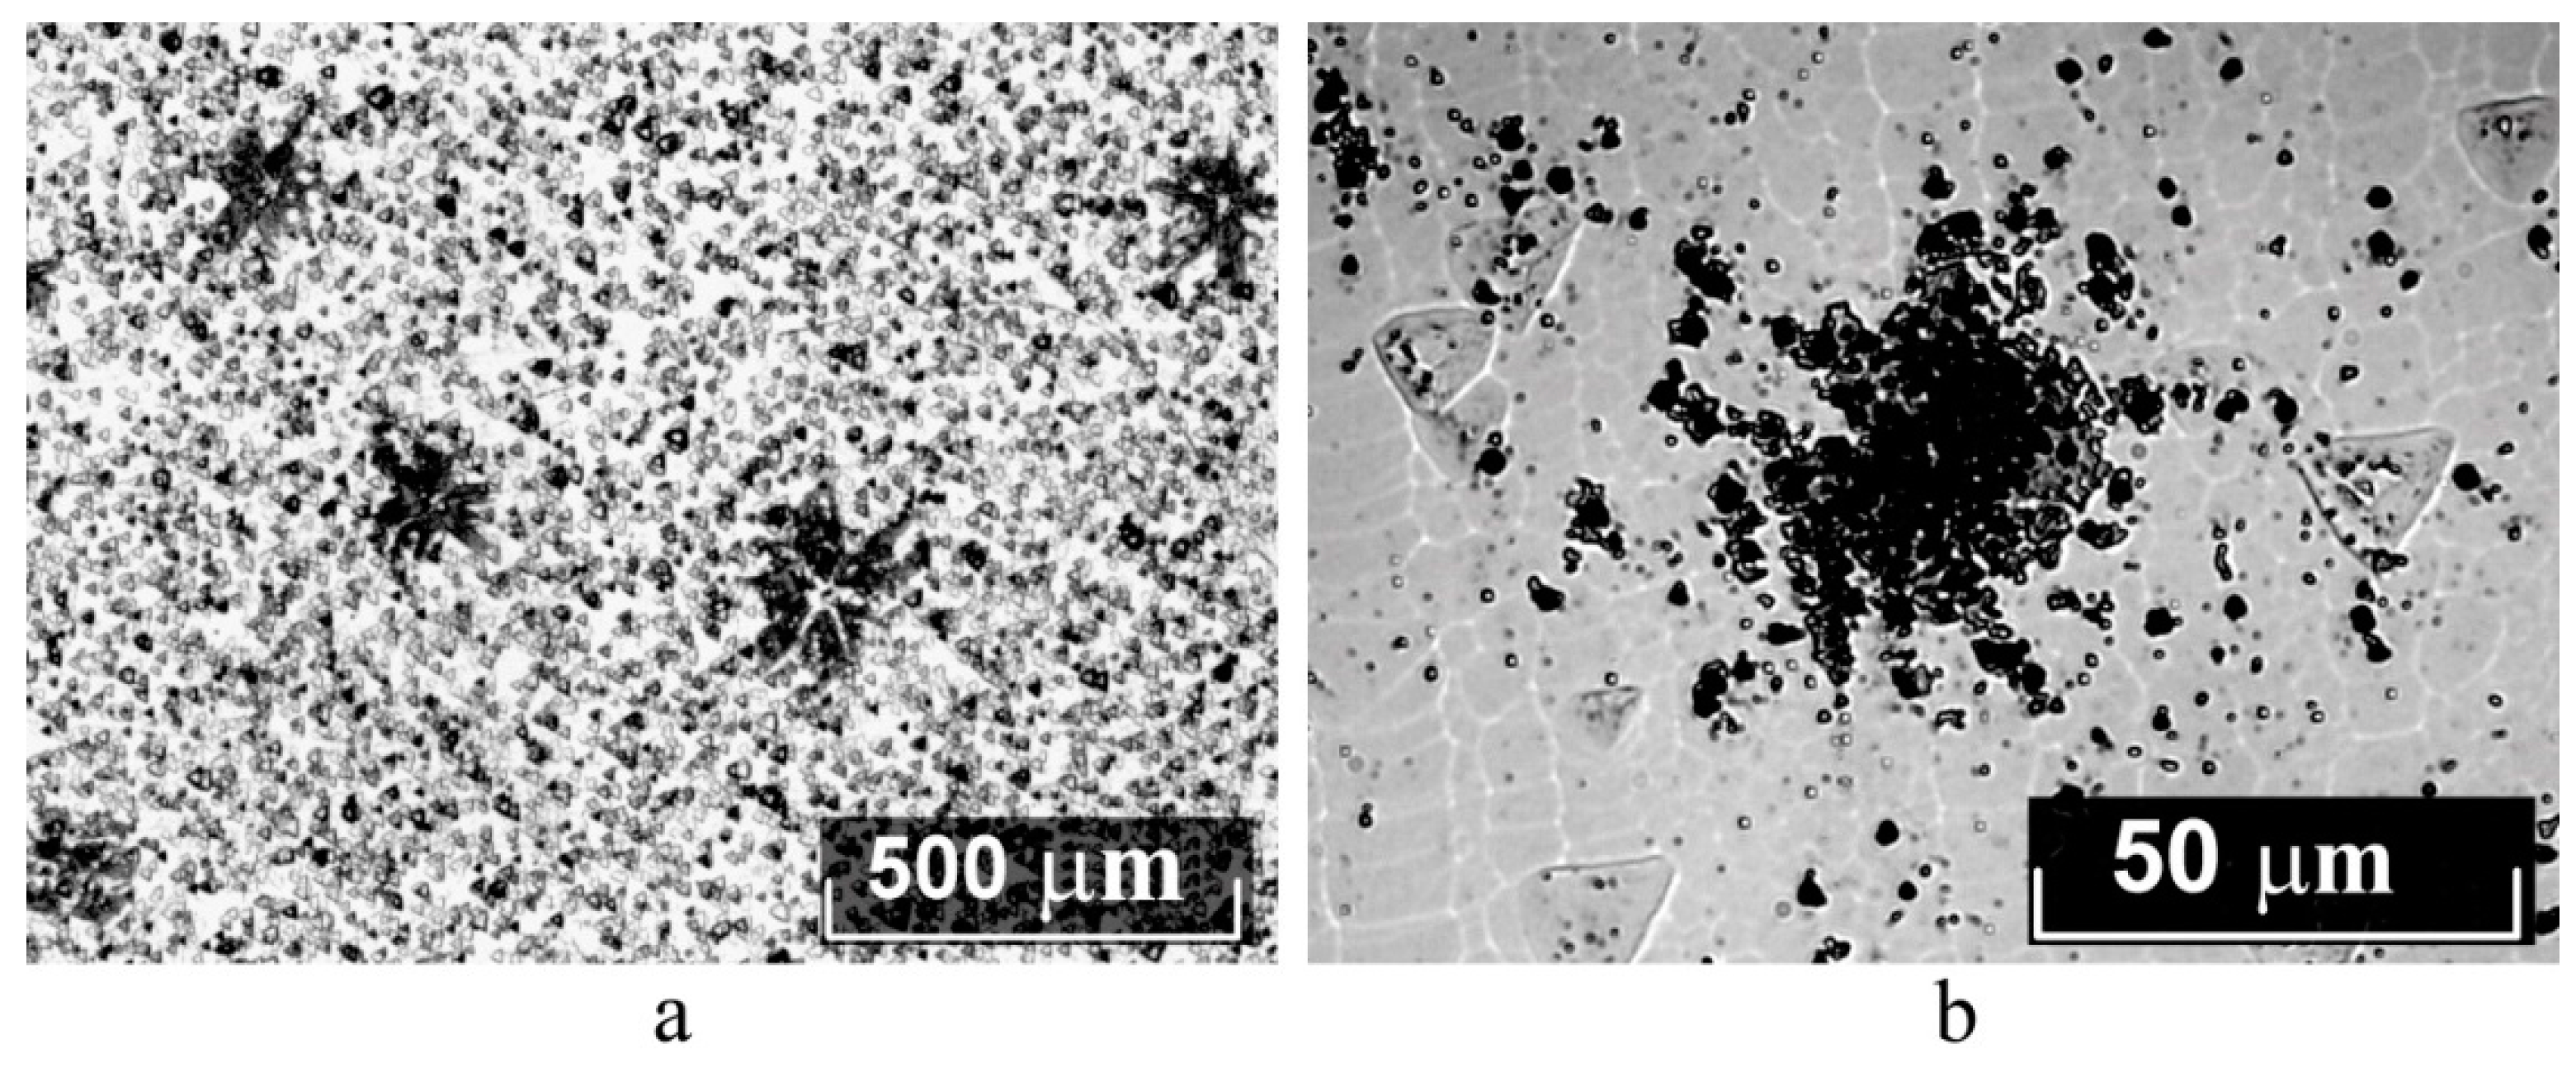
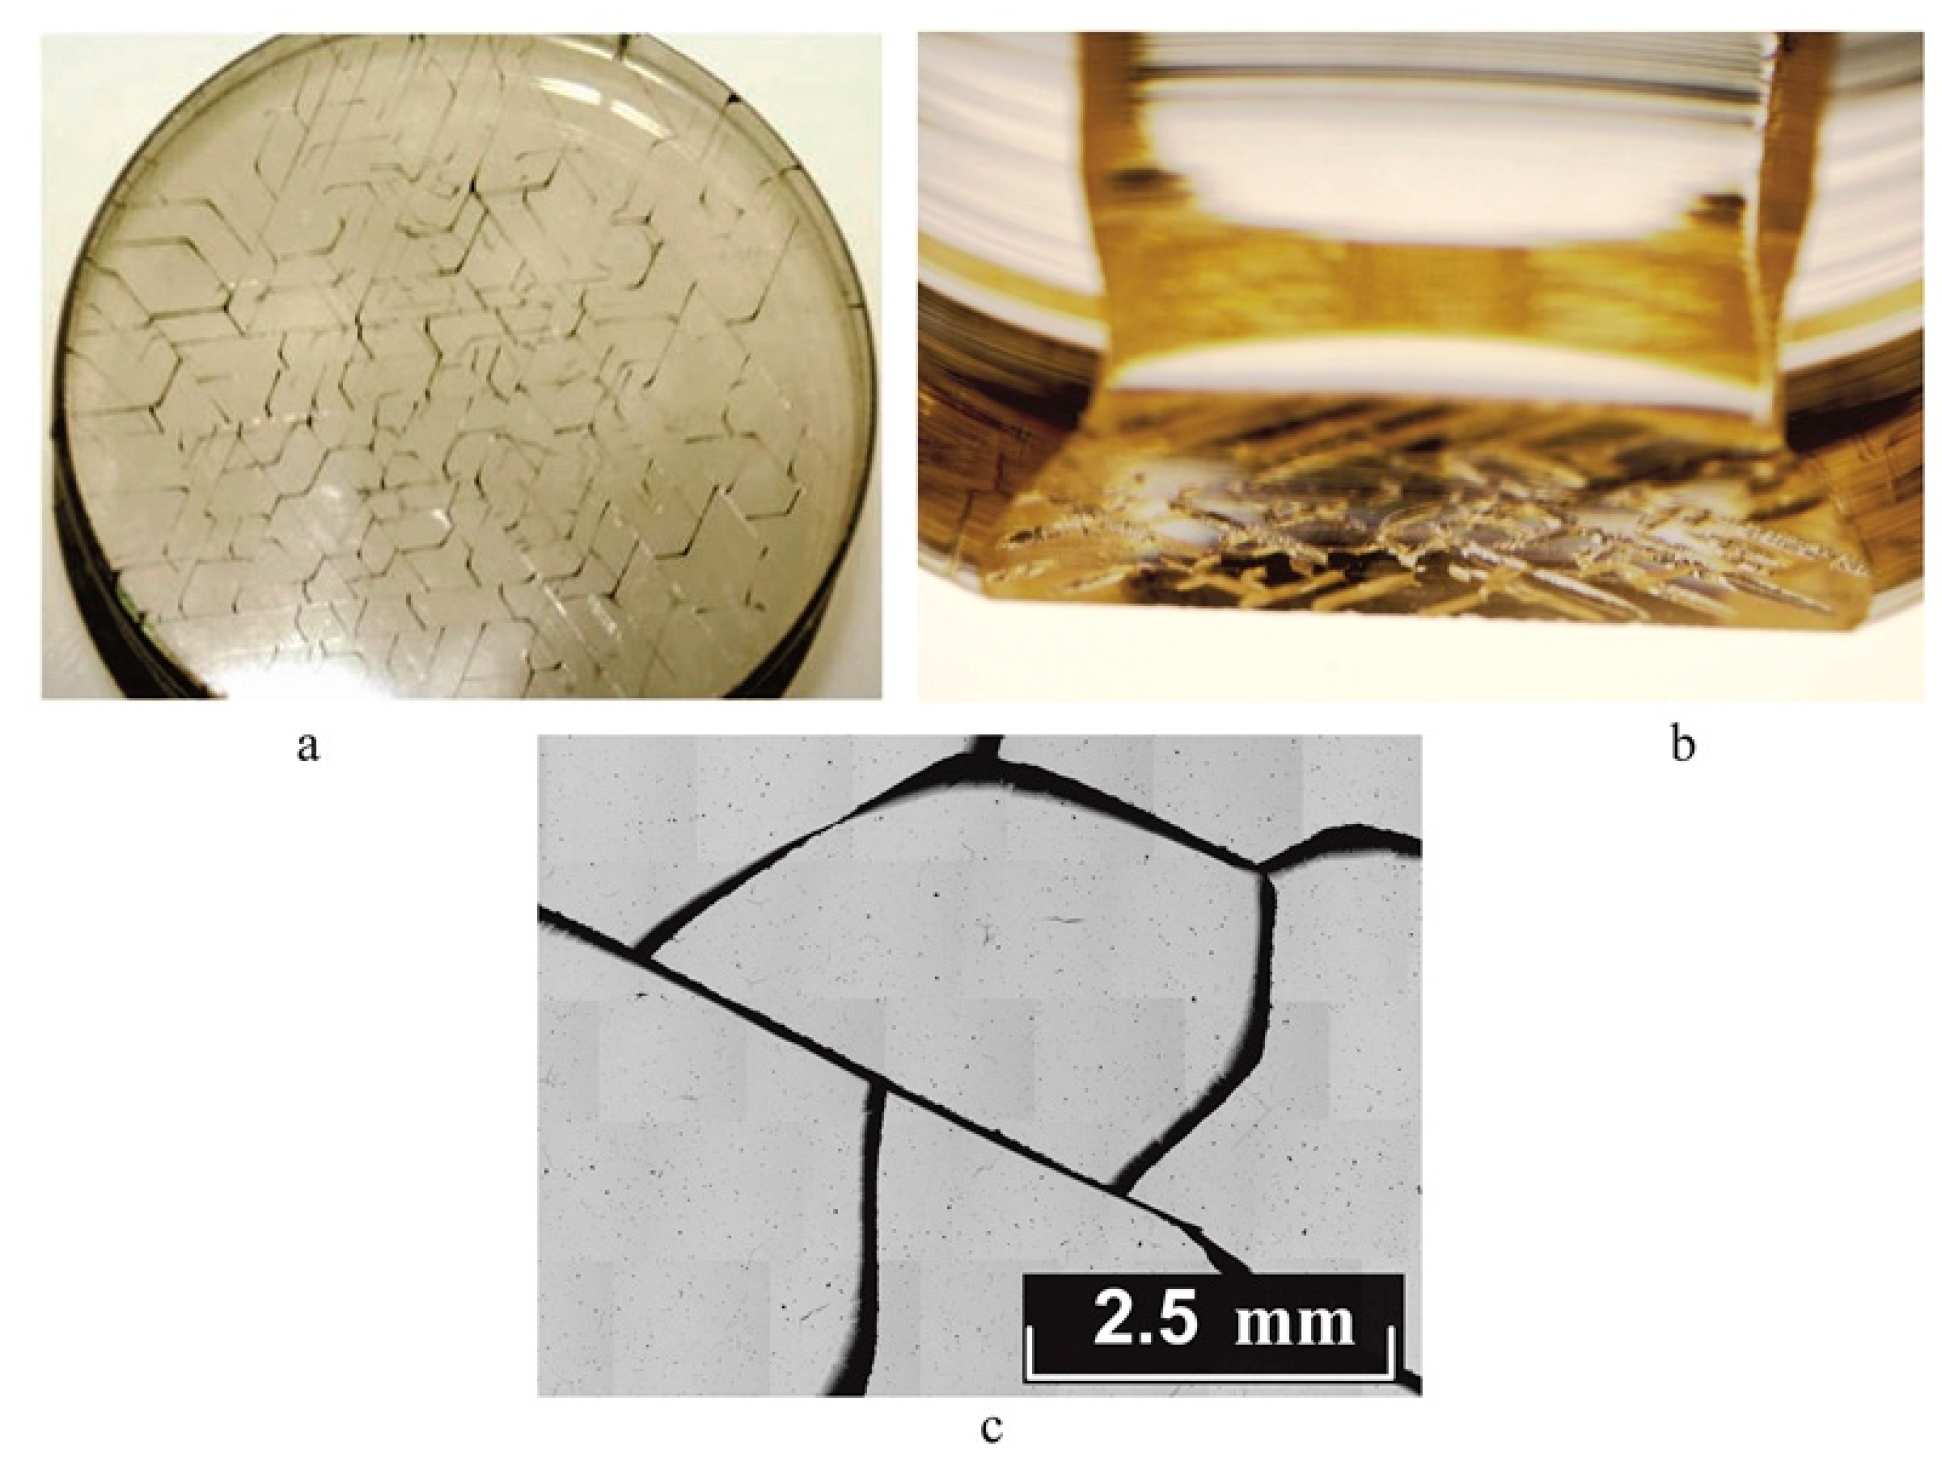
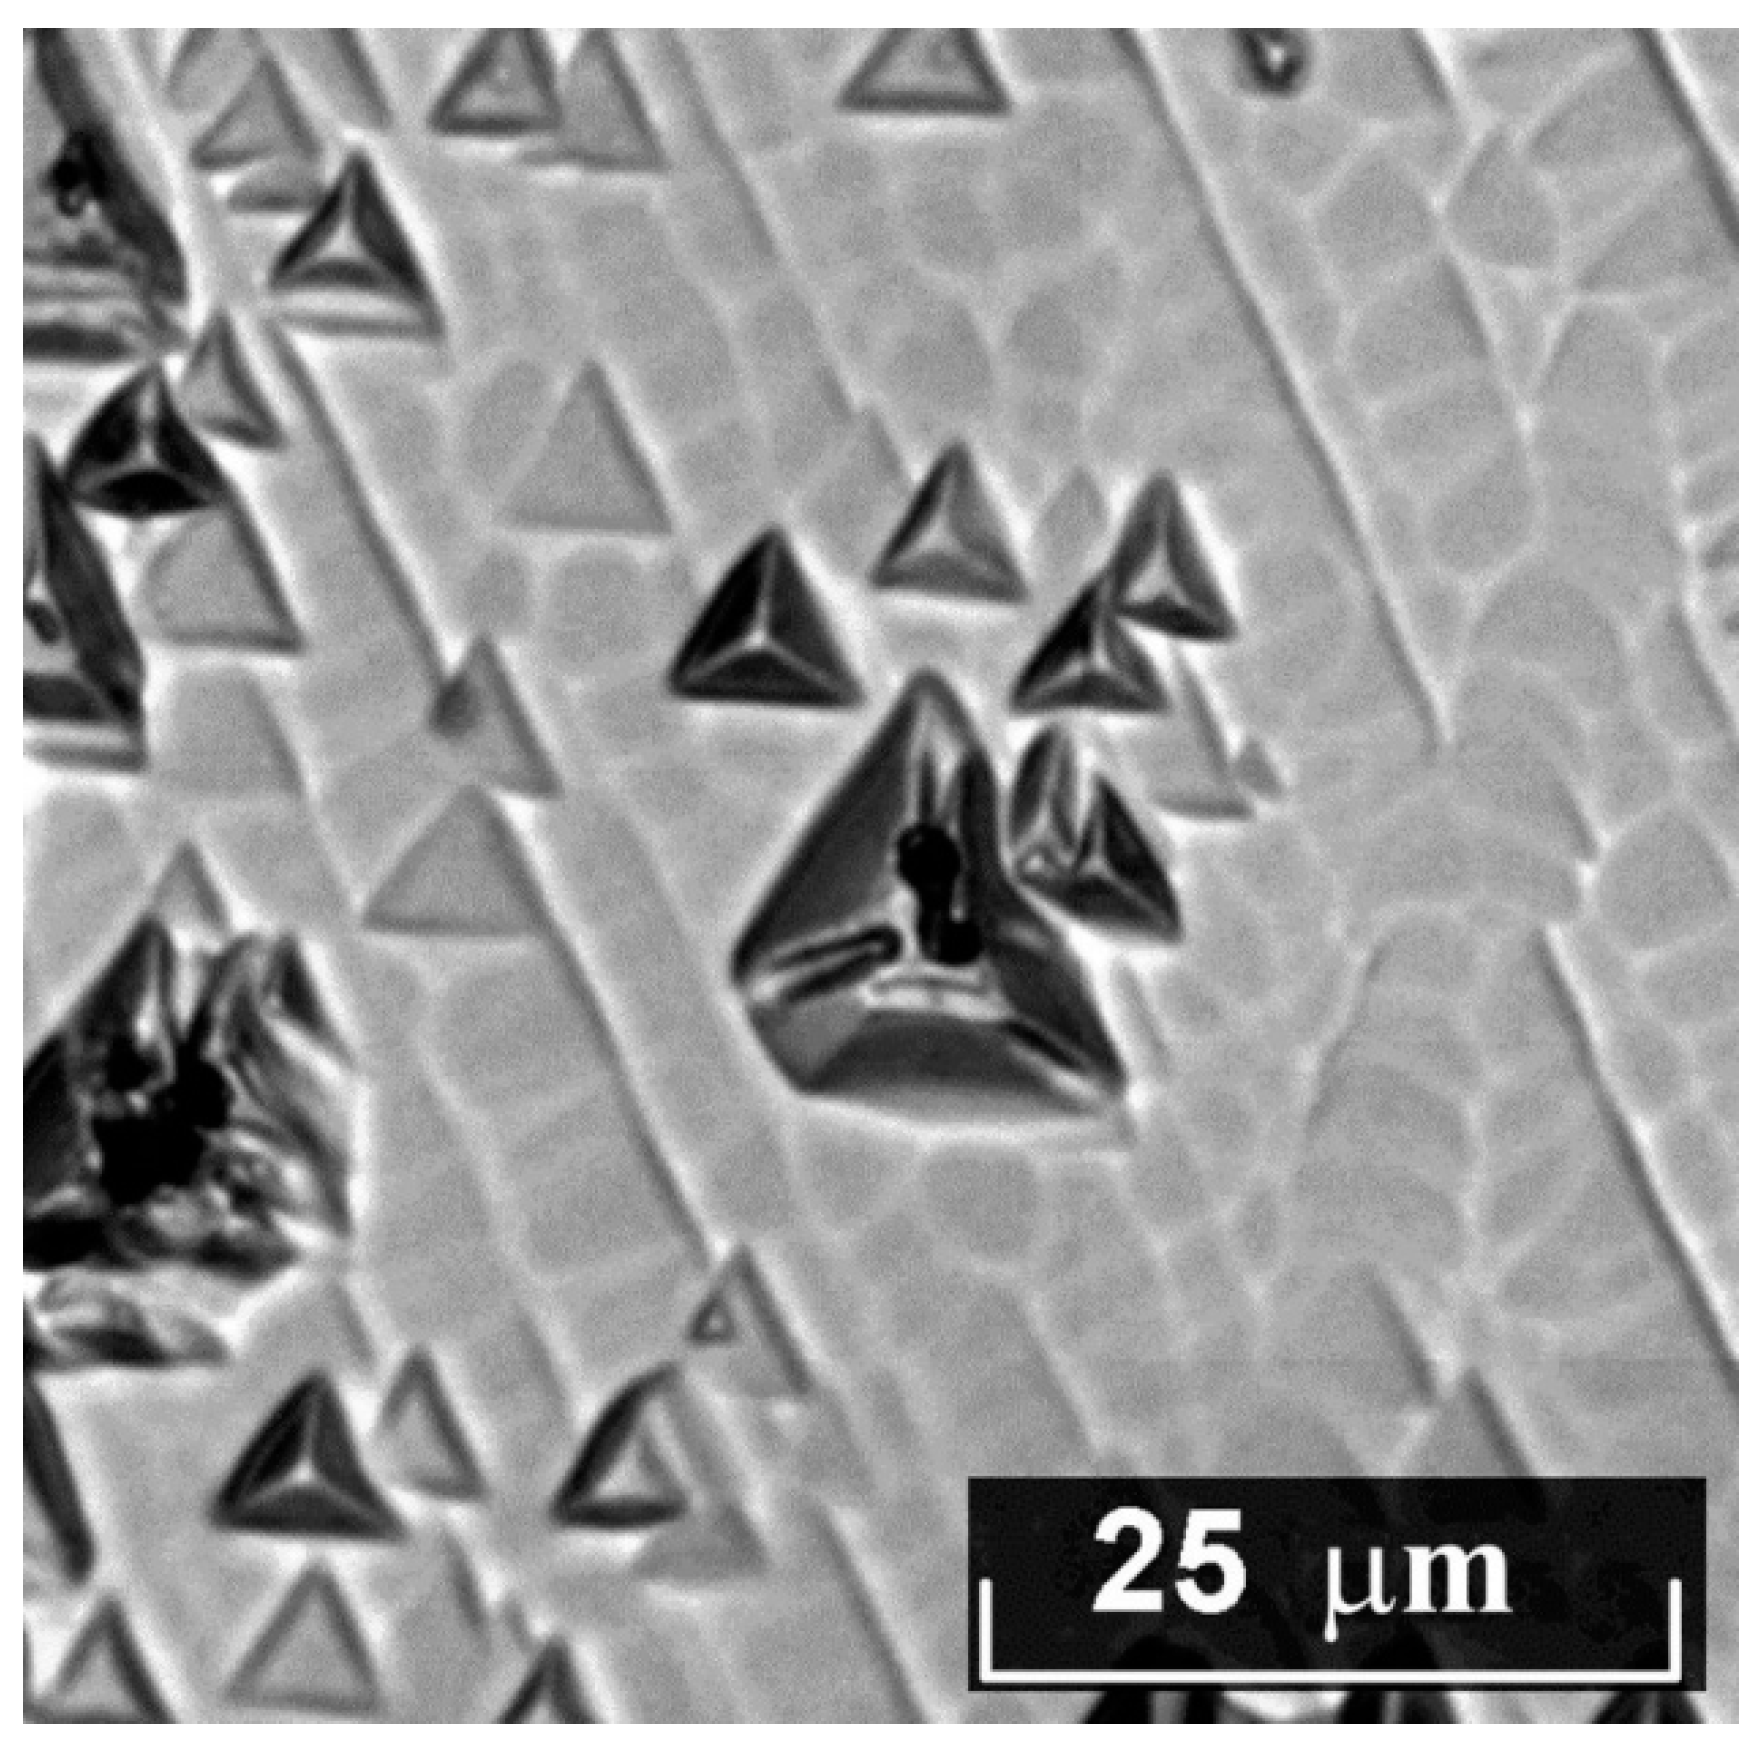
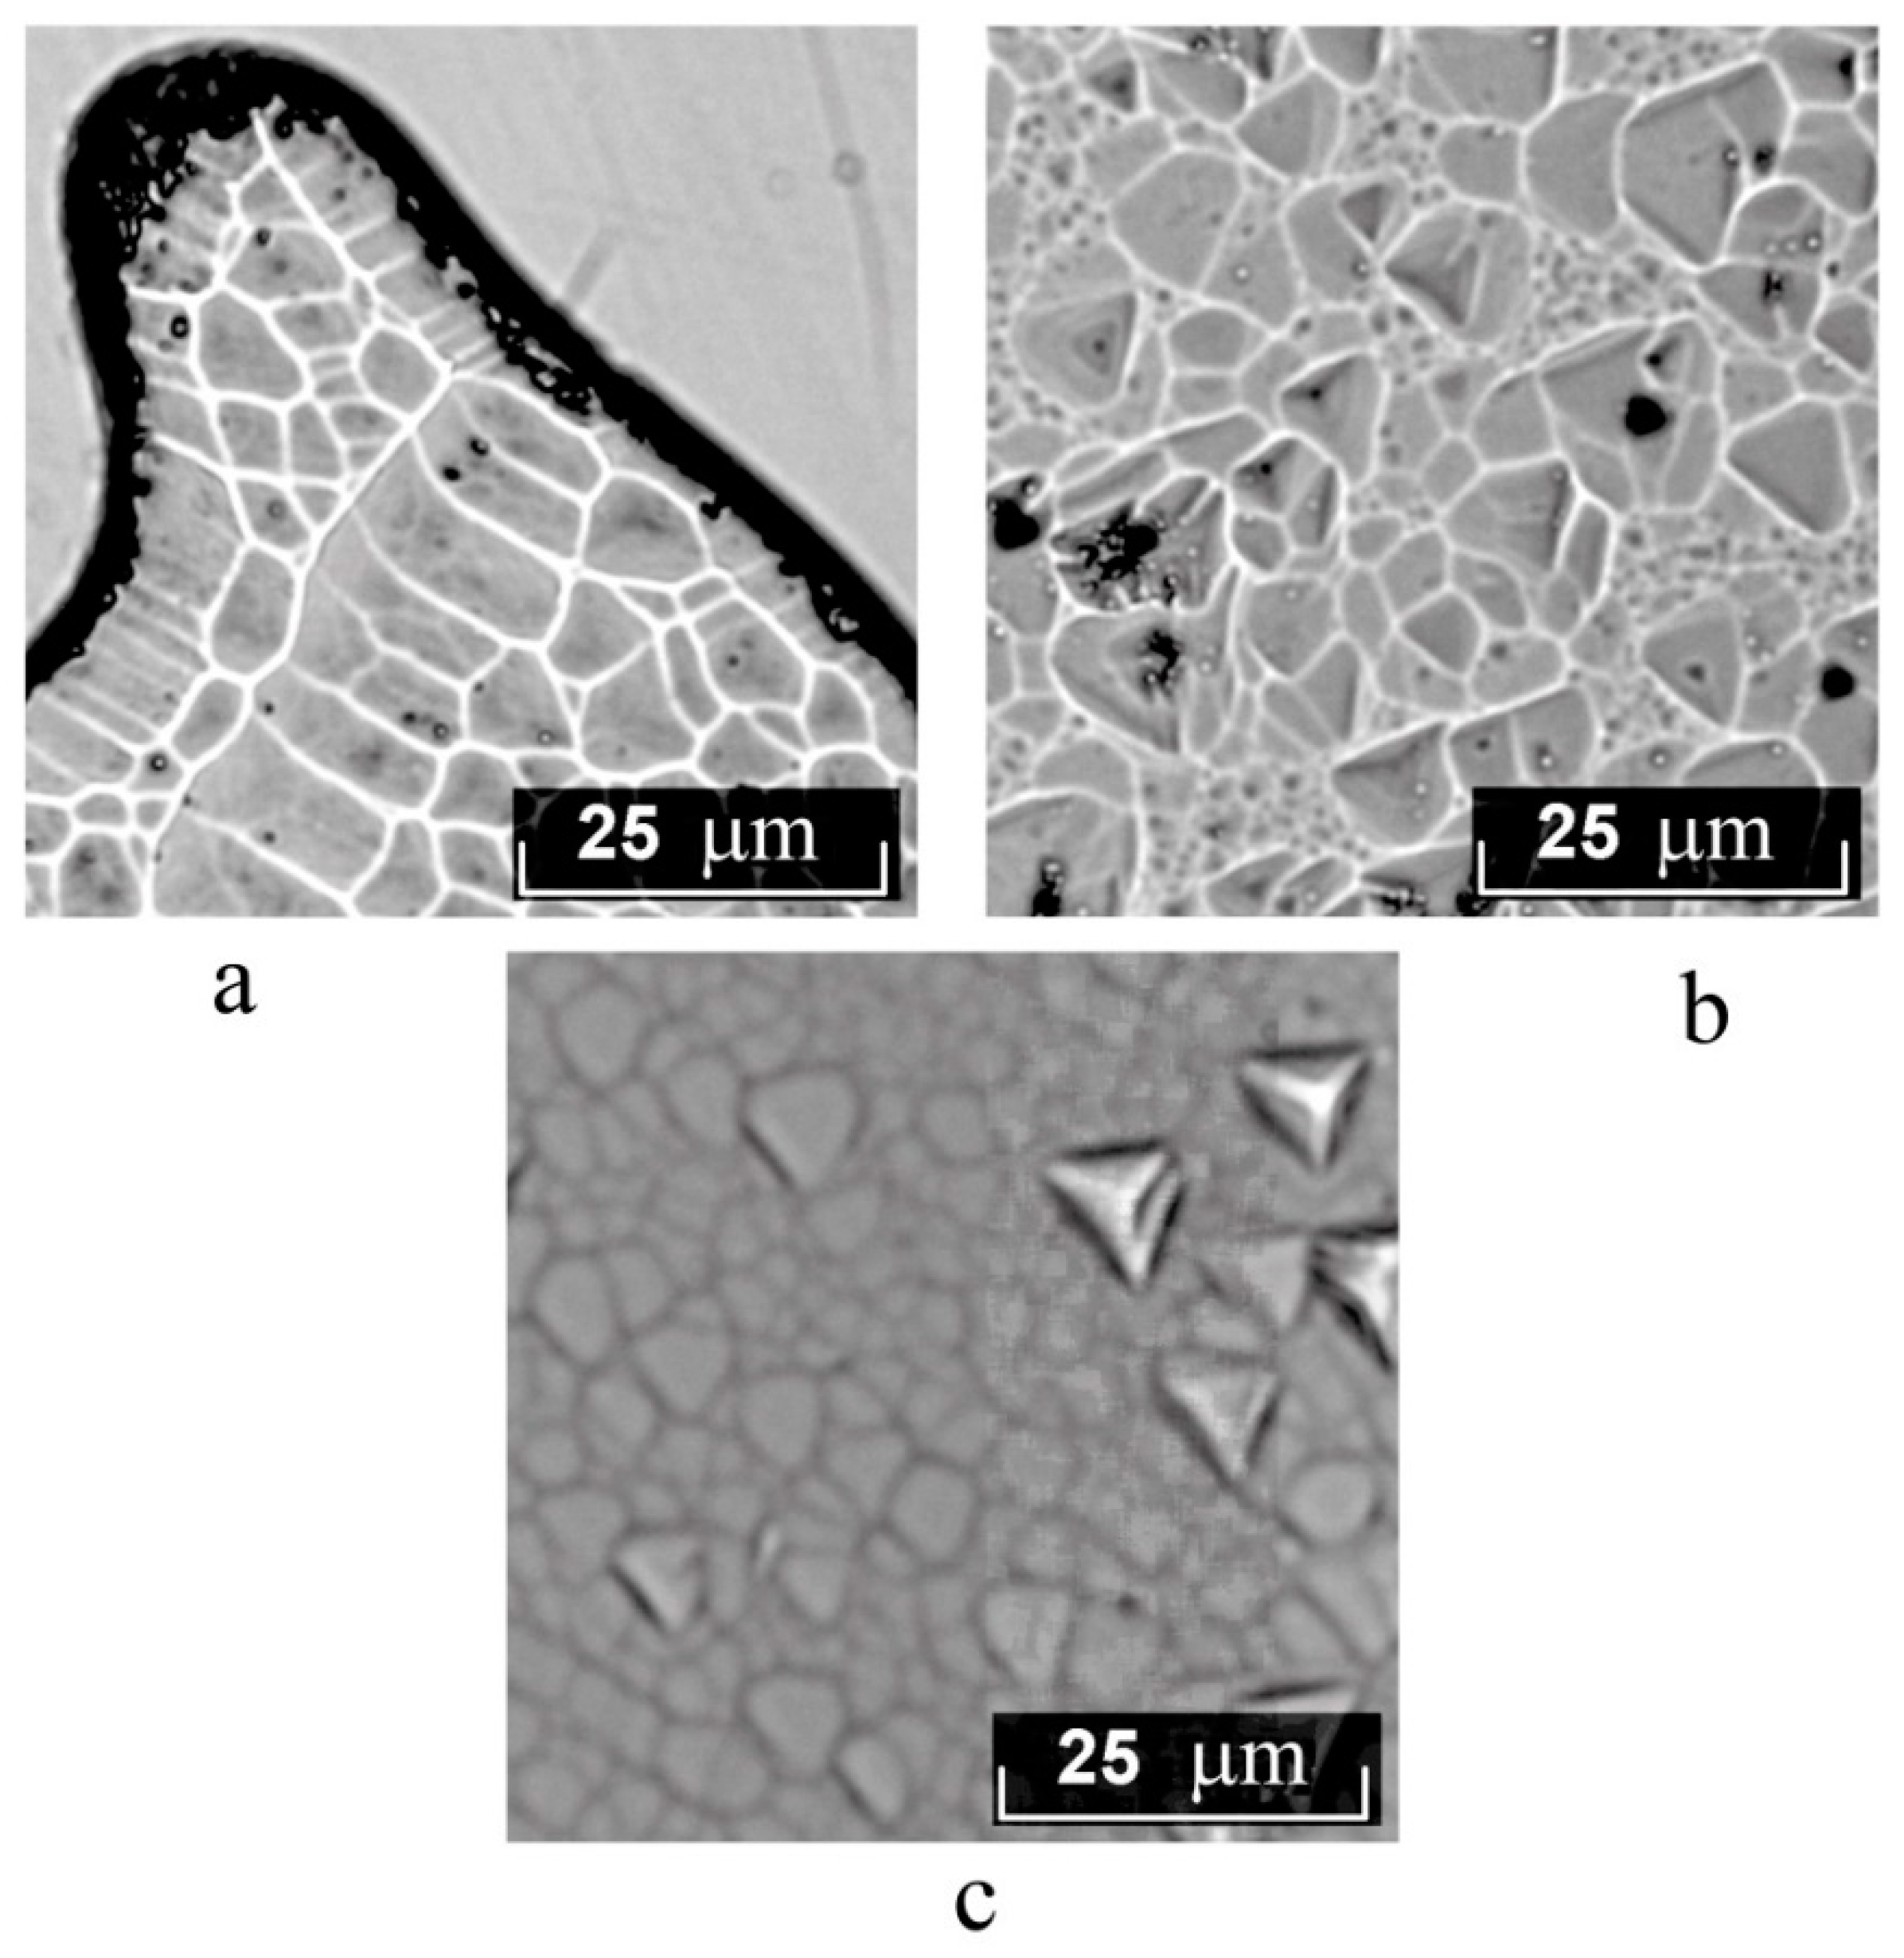
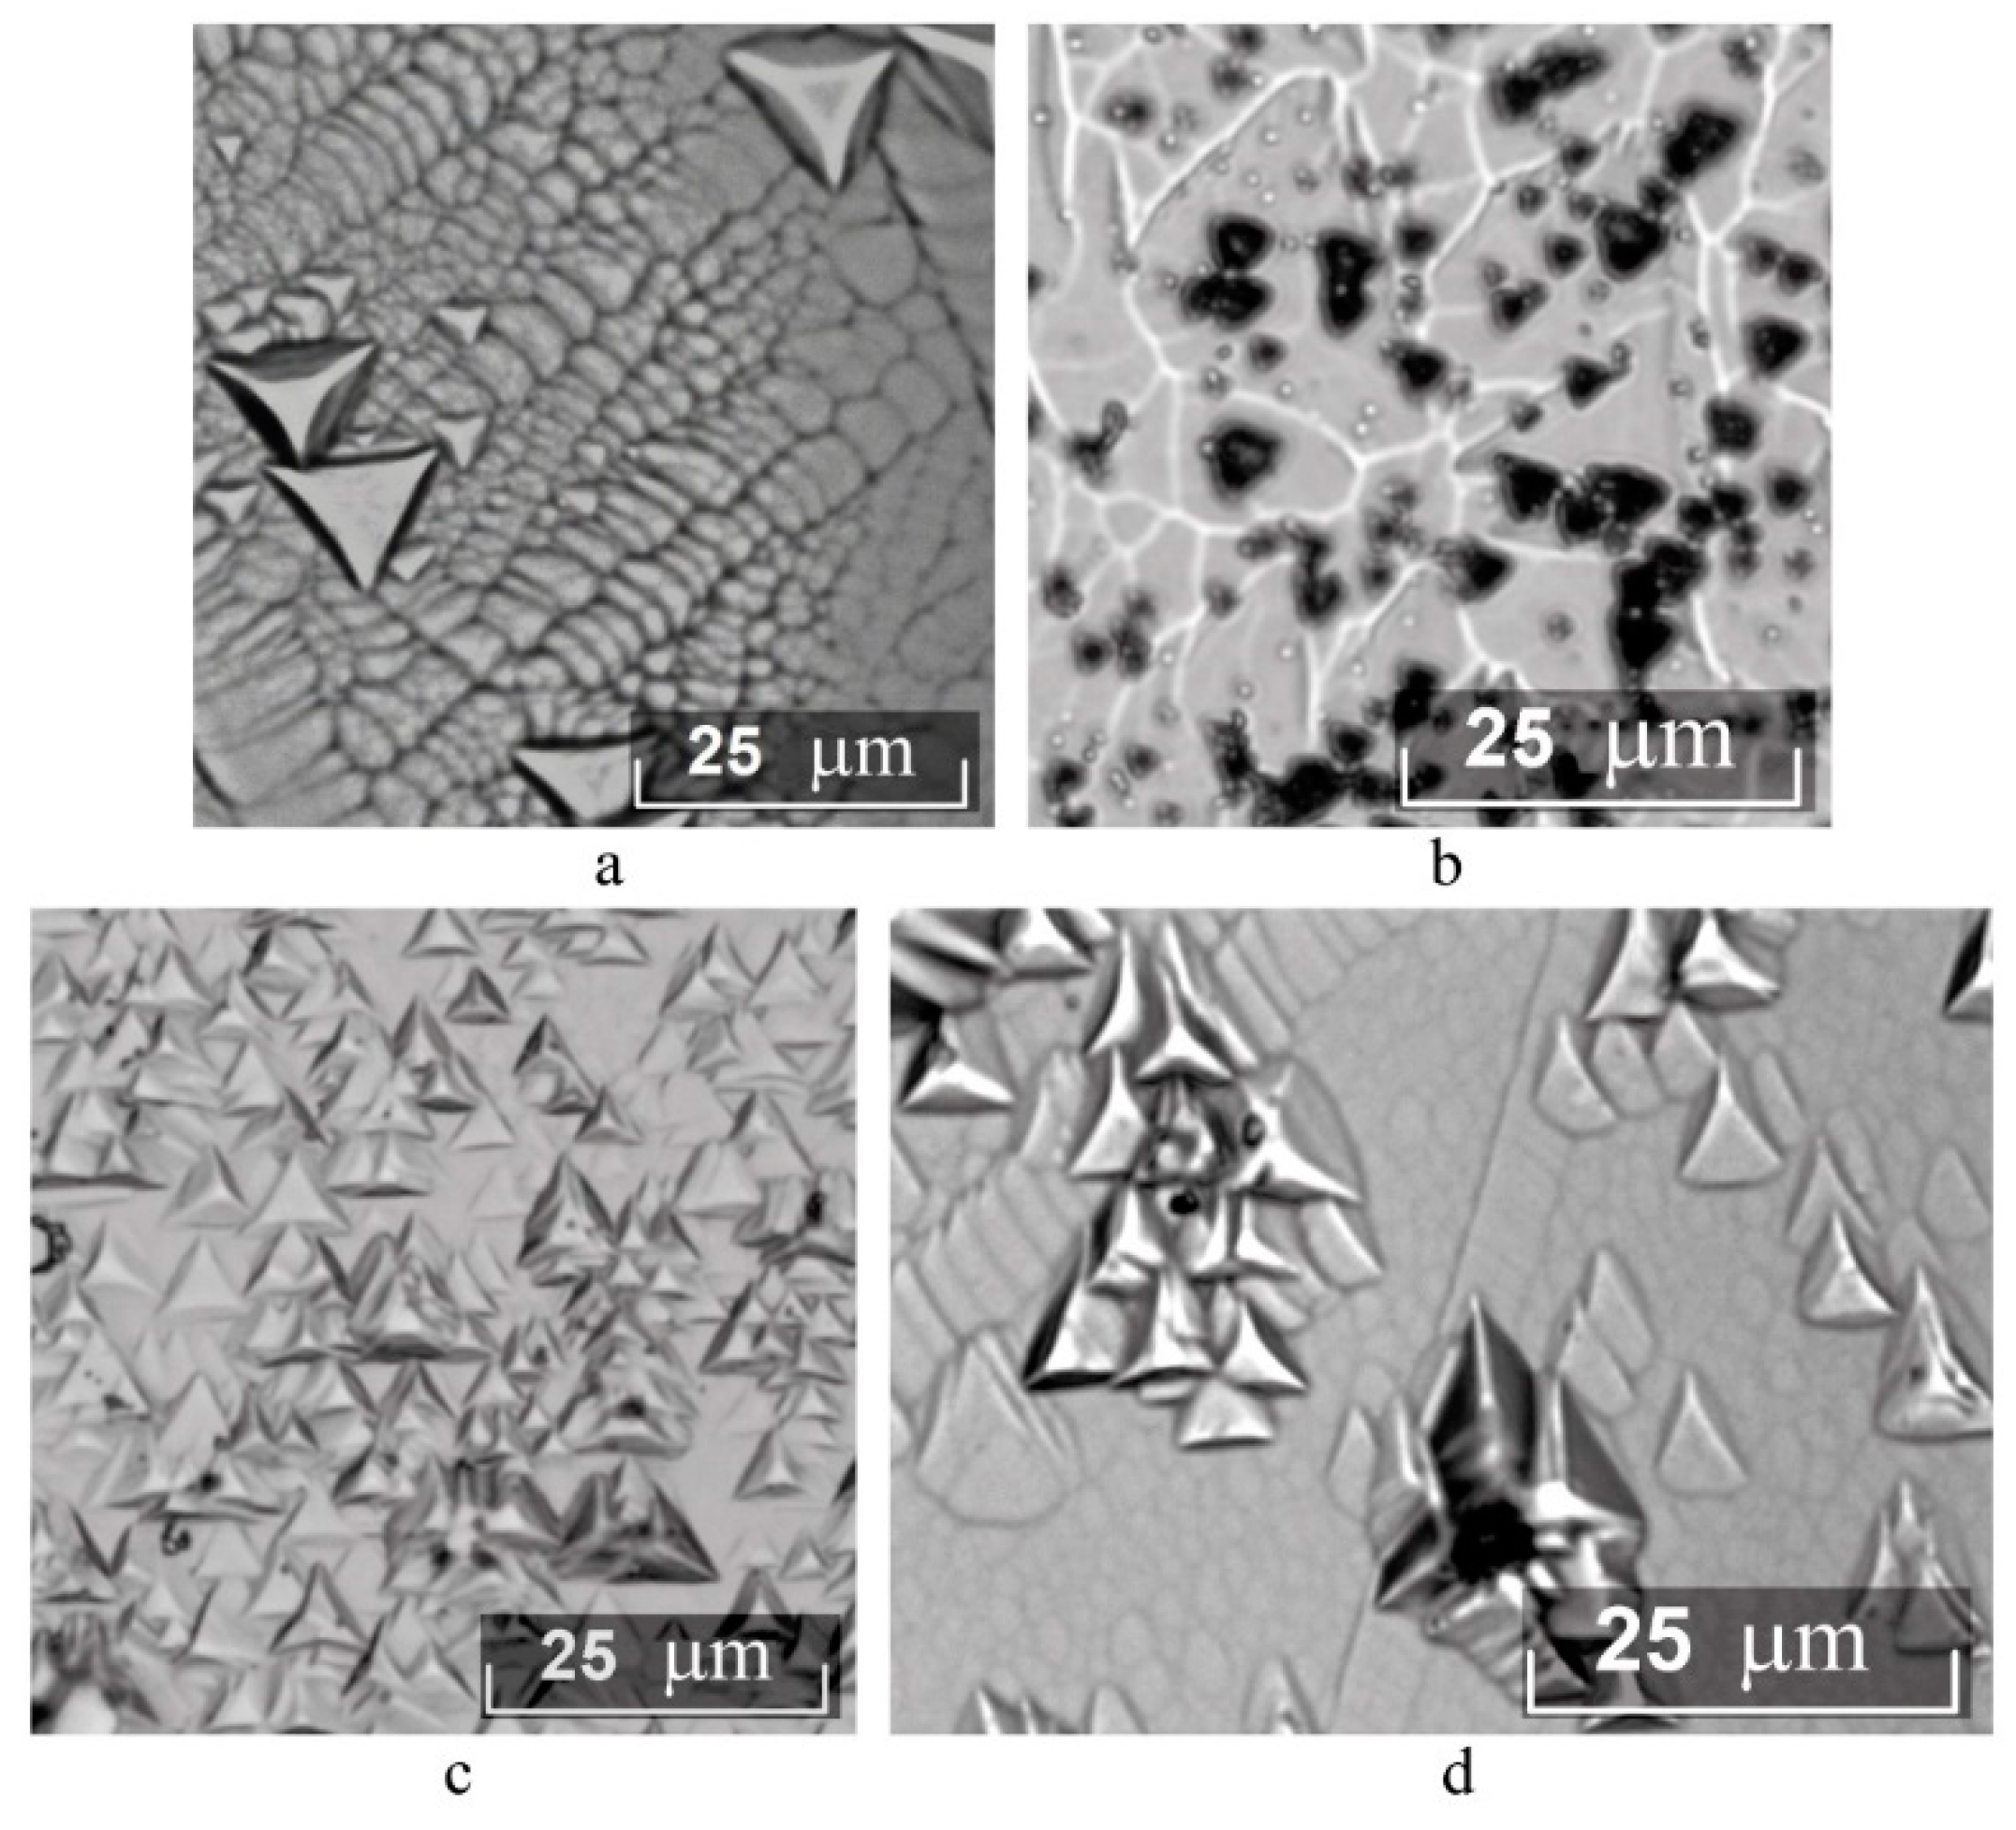
3:B crystal. Upon reaching the described critical state, the further behavior of the system can be different: from a significant change in the dopant concentration distribution along the growth axis to defects such as cellular growth and crystallization of a different composition phase, Figure 3 [19,27,74]. Many factors affect the conditions for reaching such a critical state, and hence the possible dimensions of a LiNbO3:B crystal of high optical quality with a constant dopant concentration distribution in the crystal boule volume. This is the composition of the melt, the thermodynamics of the initial components, the graphical expression of which is the phase diagram, the structure of the melt consisting of ionic complexes with different thermodynamic and kinetic characteristics, and even the technical capabilities (sensitivity and reaction time constant) of the control and monitoring system of the growth process.
An important conclusion follows from the above reasoning for the technology of doped lithium niobate crystals: LN crystals with a uniform distribution of dopant can be grown by Czochralski at KD that is noticeably different from unity during crystallization of only a well-defined part of the melt. Consequently, the length and diameter of such a LN crystal boule is limited. In different systems, the limiting sizes of such structurally and compositionally uniform crystals will differ markedly. Moreover, for different systems, there may be different physical and chemical reasons for this, expressed in the difference in the thermodynamic parameters of the systems, that is, in the form of phase diagrams. LN has no regions of homogeneity with either boron or its compounds in the boron-containing system Li2O–Nb2O5–B2O3. As the crystal grows, only the pure LN phase crystallizes, Figure 12. However, at the same time, there will be a significant increase in the boron content in the melt and, as a consequence, a decrease in the crystallization temperature and a rather radical increase in the melt viscosity, which limits convective flows, Figure 12. C0, C1 and C2—the composition of the melt or the concentration of boron in the melt, T1 and T2 are the crystallization temperature corresponding to the composition of the C1 and C2. All this, most likely, limits the maximum possible boron concentration in the melt to 0.12 wt%, since an increase in the boron concentration above this critical concentration in the melt leads to cellular growth and other irreparable defects (for example, defects in the form of “channels”) in LiNbO3:B crystals, Figure 1, Figure 2 and Figure 3, [19,25]. Our studies have shown that the fraction of the melt, the crystallization of which leads to the production of an optically uniform LiNbO3:B crystal, does not exceed 17–18% [19,25].
The above reasoning is valid for evaluating the technological growth parameters when doping lithium niobate with any dopants. For example, the phase diagram of the Li2O–Nb2O5–MgO system is less complex than that of the system Li2O–Nb2O5–ZnO [75,76]. The Zn diagram has a greater number of phases and they are less stable; the concentration regions of existence of different phases and mixtures of phases are less extended [75]. These physical and chemical particularities of a Zn system explain a greater number of concentration thresholds at LN doping with Zn rather than Mg. The particularities also explain LiNbO3:Zn crystals tend to cracking and separation of impurity phases during growth [27]. Phase stresses in LiNbO3:Zn crystals are also a consequence of Zn system particularities. The stresses are the reason why these crystals claim special modes of after-growth treatment and turning them to a single domain state [27]. Thus, a volume of a structurally and chemically uniform boule and the fraction of the crystallized melt for LiNbO3:Zn will be less than for LiNbO3:Mg crystals. The fraction of crystallized melt in the case of Li2O–Nb2O5–ZnO system is ≤~20%, Li2O–Nb2O5–MgO system ≤~30% [16,27,74]. The fraction in the case of Li2O–Nb2O5–CeO2 system strongly depends on the initial dopant concentration in the melt; the crystallized melt fraction is significantly lower than in systems with magnesium and zinc. These facts are caused by significantly lower distribution coefficients KD, Table 4. This leads to a fast increase in the dopant concentration in the melt and achieving of the critical state at which the complexes concentration with solidus temperature Tc1 is insufficient for crystal growth with a constant dopant concentration. This is why only ≤~12% fraction of the melt should crystallize to turn into a structurally and chemically uniform LiNbO3:Ce crystal [76].
Results obtained in [77] based on the analysis of the dopant electronic structure are important for predicting the technological conditions of growth and the quality control of doped LN crystals. At this, p-elements (non-metals, in our case, boron), which have a higher chemical activity due to the greater number of valence electrons than that of metals, make the melt more homogeneous at the level of ionic complexes. It is exactly this fact that allows us to grow LN crystals from a congruent melt with a defective structure close to one in SLN. Metals (s and d elements, Zn and Mg) have a similar effect on the LN melt and crystals properties. Nevertheless, Zn-doped crystals have an increased ununiformity of dopant incorporation to the crystals, tend to cracking due to phase stresses; they also are characterized by additional claims towards growth conditions and after-growth electrothermal treatment of boules. The f-element metals, due to their electronic structure, form the structure of the melt in such a way that only a relatively small fraction of the melt can be crystallized to obtain a compositionally uniform crystals, for example, LiNbO3:Ce.
LN is characterized by a high melting temperature (~1526 K) and a high chemical activity of the melt, which requires platinum crucibles. This is the reason for the extremely small number of works devoted to the study of the structure of even nominally pure LN melts. In recent years, the need has arisen to obtain optically highly perfect LN single crystals (nominally pure and doped). The existence in the melt of strongly bound groups of atoms or ions (clusters) of a certain structure was considered as the main concept in the literature [78]. In [79,80,81], high-temperature Raman spectroscopy was effectively used to study the crystallization from a melt. In the pre-crystallization temperature of a LN melt, the Raman spectra revealed a noticeable change in the structure of the melt and a mismatch between the structure of anionic motifs in the melt and crystal. The mismatch effect near the melting point creates serious obstacles to the nucleation of equilibrium structures [79,80,81]. Metastable phases have an advantage in crystallization under these conditions. The phases crystal lattice is very far from the structure of the short-range order of the melt. The mismatch in the anionic structure of the melt and crystal can also affect the growth of crystal faces or the formation of structural defects [79,80].
LN structure is a framework of oxygen octahedra O6, articulated by vertices and faces, with the densest hexagonal packing. Inside the octahedra there are intrinsic (Li+ and Nb5+) or doping cations. The bonds in the octahedra occupied by niobium are predominantly covalent [1]. At the same time, the lithium ion is bound to oxygen atoms only by electrostatic interaction. Due to the predominance of the covalent bond type, the niobium cation tends to form in the melt anionic motifs consisting of NbO4 tetrahedra. That is, when LN melts, anionic structure rearranges significantly: the coordination of niobium atoms changes from octahedral to tetrahedral, which is confirmed by Raman spectroscopy data [79,80,81]. Strong covalent bond implies the ability to preserve the structure of oxyanions in the molten state. Thus, the melt can contain not only isolated tetrahedral groups, but also complexes with a stable structure [79]. Raman studies of Li2O–Nb2O5 system melts have revealed not only bands corresponding to vibrations of terminal NbO3− and middle NbO2− groups (815–870 cm−1) but also bands corresponding to symmetric stretching bridge vibrations of Nb–O–Nb bonds (670–690 cm−1). Bridge bands are located at the junction of the tetrahedra [79,80]. Probably, octahedra NbO6 exist in the melt in the pre-crystallization temperature range along with NbO4 tetrahedra. Earlier paper [82] studied Raman spectra of Nb2O5, intended for charge synthesis and LN crystal growth. The study has revealed five bands 814, 845, 902, 965, and 995 cm−1 in the region of stretching bridge vibrations of oxygen atoms along the polar axis (800–1100 cm−1). This indicates a variety of island structures consisting of fragments of chains of octahedra and tetrahedra in niobium pentoxide.
Boron is a highly chemically active dopant. Its fundamental properties are change in crystallization temperature, viscosity, and surface tension of melts [83]. We [19] have qualitatively revealed an increase in melt viscosity, in the melting temperature by ~10 K, and the Curie temperature by ~50 K compared to nominally pure CLN crystal during growth of studied LiNbO3:B (0.55–1.24 mol%) crystals. The crystal chemistry of boron oxide compounds is extremely diverse: it is determined by the possibility of double hybridization of the boron atom, sp2– and sp3–, with the formation of [BO3]3− triangles and [BO4]5− tetrahedra, respectively [84]. Boron neutral atom radius is 0.88 Å; B3+–0.15 Å for B(III), 0.25 Å for B(IV). In the ground state, boron atoms have the 2s22p1 configuration with one unpaired electron and two vacant p-orbitals. Due to the presence of a free orbital in a small boron atom, boron is one of the strongest acceptors of unshared electron pairs. The use of this orbital in the donor-acceptor interaction allows the coordination number of the boron atom to increase to four. The atoms and atomic groups surrounding the boron atom are located at three corners of the tetrahedron, the fourth corner of which remains free, and a positive electric field of significant intensity is created in this corner. This circumstance explains the pronounced ability of boron compounds to provide stable molecular complexes. Boron triangles and tetrahedra can be present in isolation or polymerize among themselves through a common oxygen atom [84]. The tendency towards formation of bulky polyanions explains the high viscosity of melts [85]. It is well known that alkali metal oxides are modifiers of the boron-oxygen network of the melt and transfer the boron atom to a four-coordinated state, i.e., [BO4] tetrahedra are formed [85]. When boron-oxygen triangles and tetrahedra are combined, the absolute values of specific negative charges for complex anions decrease monotonically in the series of ortho-, pyro-, meta-, and polyborates. This ensures sufficient stability of numerous condensed compounds with monovalent as well as large divalent elements. In [80], temperature changes in lithium metaborate melts were investigated from the Raman spectra. The work has shown the presence of a chain boron-oxygen anion in the melt. All these crystal-chemical laws predetermine the reaction potential of melts containing borates.
The triple system Li2O–B2O3–Nb2O5 has also been studied in [73,86]. The authors analyzed over 30 different molar ratios of the components. Paper [73] has revealed in the system six different lithium borates (LiB3O5, Li2B4O7, LiBO2, Li6B4O9, Li4B2O5 and Li3BO3), one niobium borate (Nb3BO9) and three different lithium niobates (LiNb3O8, LiNbO3 and Li3NbO4). According to this work, lithium borates exhibit remarkable solubility in LN at temperatures below 1100 °C, and thus are suitable for crystal growth as a flux. In addition, the concentration range of LN crystallization, determined by the spontaneous nucleation method, is rather wide in the Li2O–B2O3–Nb2O5 ternary system.
There is a known HTTSSG method of growing SLN single crystals with a reduced photorefractive effect from a congruent melt in the presence of K2O flux [36,87,88]. The absence of potassium in the crystal structure becomes evident from a comparison of the ionic radii of Li+ and K+ (0.68 Å and 1.38 Å, respectively). Isomorphic substitution of related elements of the alkaline group (lithium with potassium) in the cationic sublattice of the crystal seems unlikely with such a significant difference in ionic radii. Thus, potassium, like boron, does not incorporate in the crystal structure [89,90,91].
We assume that boron-containing polyanions, forming stable covalent bonds in the melt with niobium-containing polyanions, thereby bind the excess of niobium and increase the Li/Nb ratio in the melt. As a result, the grown crystal approaches a stoichiometric composition in terms of the cation sublattice ordering degree, in the same way as when using a K2O flux. Such a crystal is characterized by a reduced content of NbLi defects and lithium vacancies (VLi) in comparison with a CLN crystal, Table 2. This is confirmed by an increase in Curie temperature (TC) by ~47 K in comparison with a CLN crystal [19]. For a comparable in magnitude change in the TC of a LN crystal doped with metallic impurities (Mg, Zn, etc.), significantly higher impurity concentrations (~2 to 3 wt%) are required.
Paper [92] has shown that melts of inorganic polymers that form chain and ring structures with the inclusion of ions of a solute (B2O3, Na2B4O7, Li6B4O9, etc.), which tend to form glasses, are good solvents. For example, in [93], the formation of a high-temperature poorly soluble borate Al5BO9 is reported; a fair amount of Al2O3 is removed from the melt. It can be assumed that metal cations in the melt that incorporate into the crystal structure as uncontrolled impurities [87] will also be removed from the melt, as a result of which the LN crystal will be more perfect.
Due to Raman data (Table 1) oxygen octahedra are less deformed in the structure of a LiNbO3:B (homogeneous doping) than in LiNbO3:B (direct doping) crystal. This obviously happens due to an increase in the ordering of Li+ and Nb5+ cations and vacancies along the polar axis. We have concluded this because widths of 432 and 875 cm−1 bands in a LiNbO3:B (direct doping) crystal increase in the Raman spectrum. The bands correspond to deformation and stretching vibrations of oxygen atoms in the bridge Me–O–Me (Me: Li+, Nb5+). It is important to stress that 875 cm−1 band parameters are sensitive towards the magnitude of the dipole moment and, thus, the spontaneous polarization of the crystal [2].
LiNbO3:Mg crystals were studied in a paper [32]: the crystals were obtained by direct and homogeneous doping. Raman spectroscopy, optical study of macro- and microstructure have revealed higher ordering of homogeneously doped crystals compared to directly doped crystals. Magnesium incorporates directly to niobium pentoxide structure at a homogeneous doping. It has inter-polyhedra coordination with a uniform distribution in the melt volume. Clusters formed in a melt with different doping methods have different structures and sizes; therefore, melts, other things being equal, should crystallize in different ways [50,79,94]. Crystallization occurs through the attachment of the clusters to a growing crystal.
[BO4]5− tetrahedra can be both of correct and distorted form. Boron forms three covalent bonds with oxygen atoms, and the fourth bond in the tetrahedron is formed by the donor–acceptor mechanism. For this reason, the lengths of B–O bonds in the tetrahedron vary from 1.462 to 1.512 Å, the spread of angles <O–B–O>— 104–115° [84]. During homogeneous LN crystal doping, the boron-containing reagent is introduced directly into the niobium stripping solution. Only one type of borates (Nb3BO9) forms initially. Thus, B–O and Nb–O are less different in the length than at direct doping, when seven different borates form [73]. Obviously, due to this, tetrahedra, and then the octahedra formed in the precrystallization region, will be less distorted during homogeneous doping. Therefore, our Raman data confirmed that oxygen octahedra are less deformed in the structure of the LiNbO3:B (homogeneous doping) than in LiNbO3:B (direct doping) crystals, Table 1.

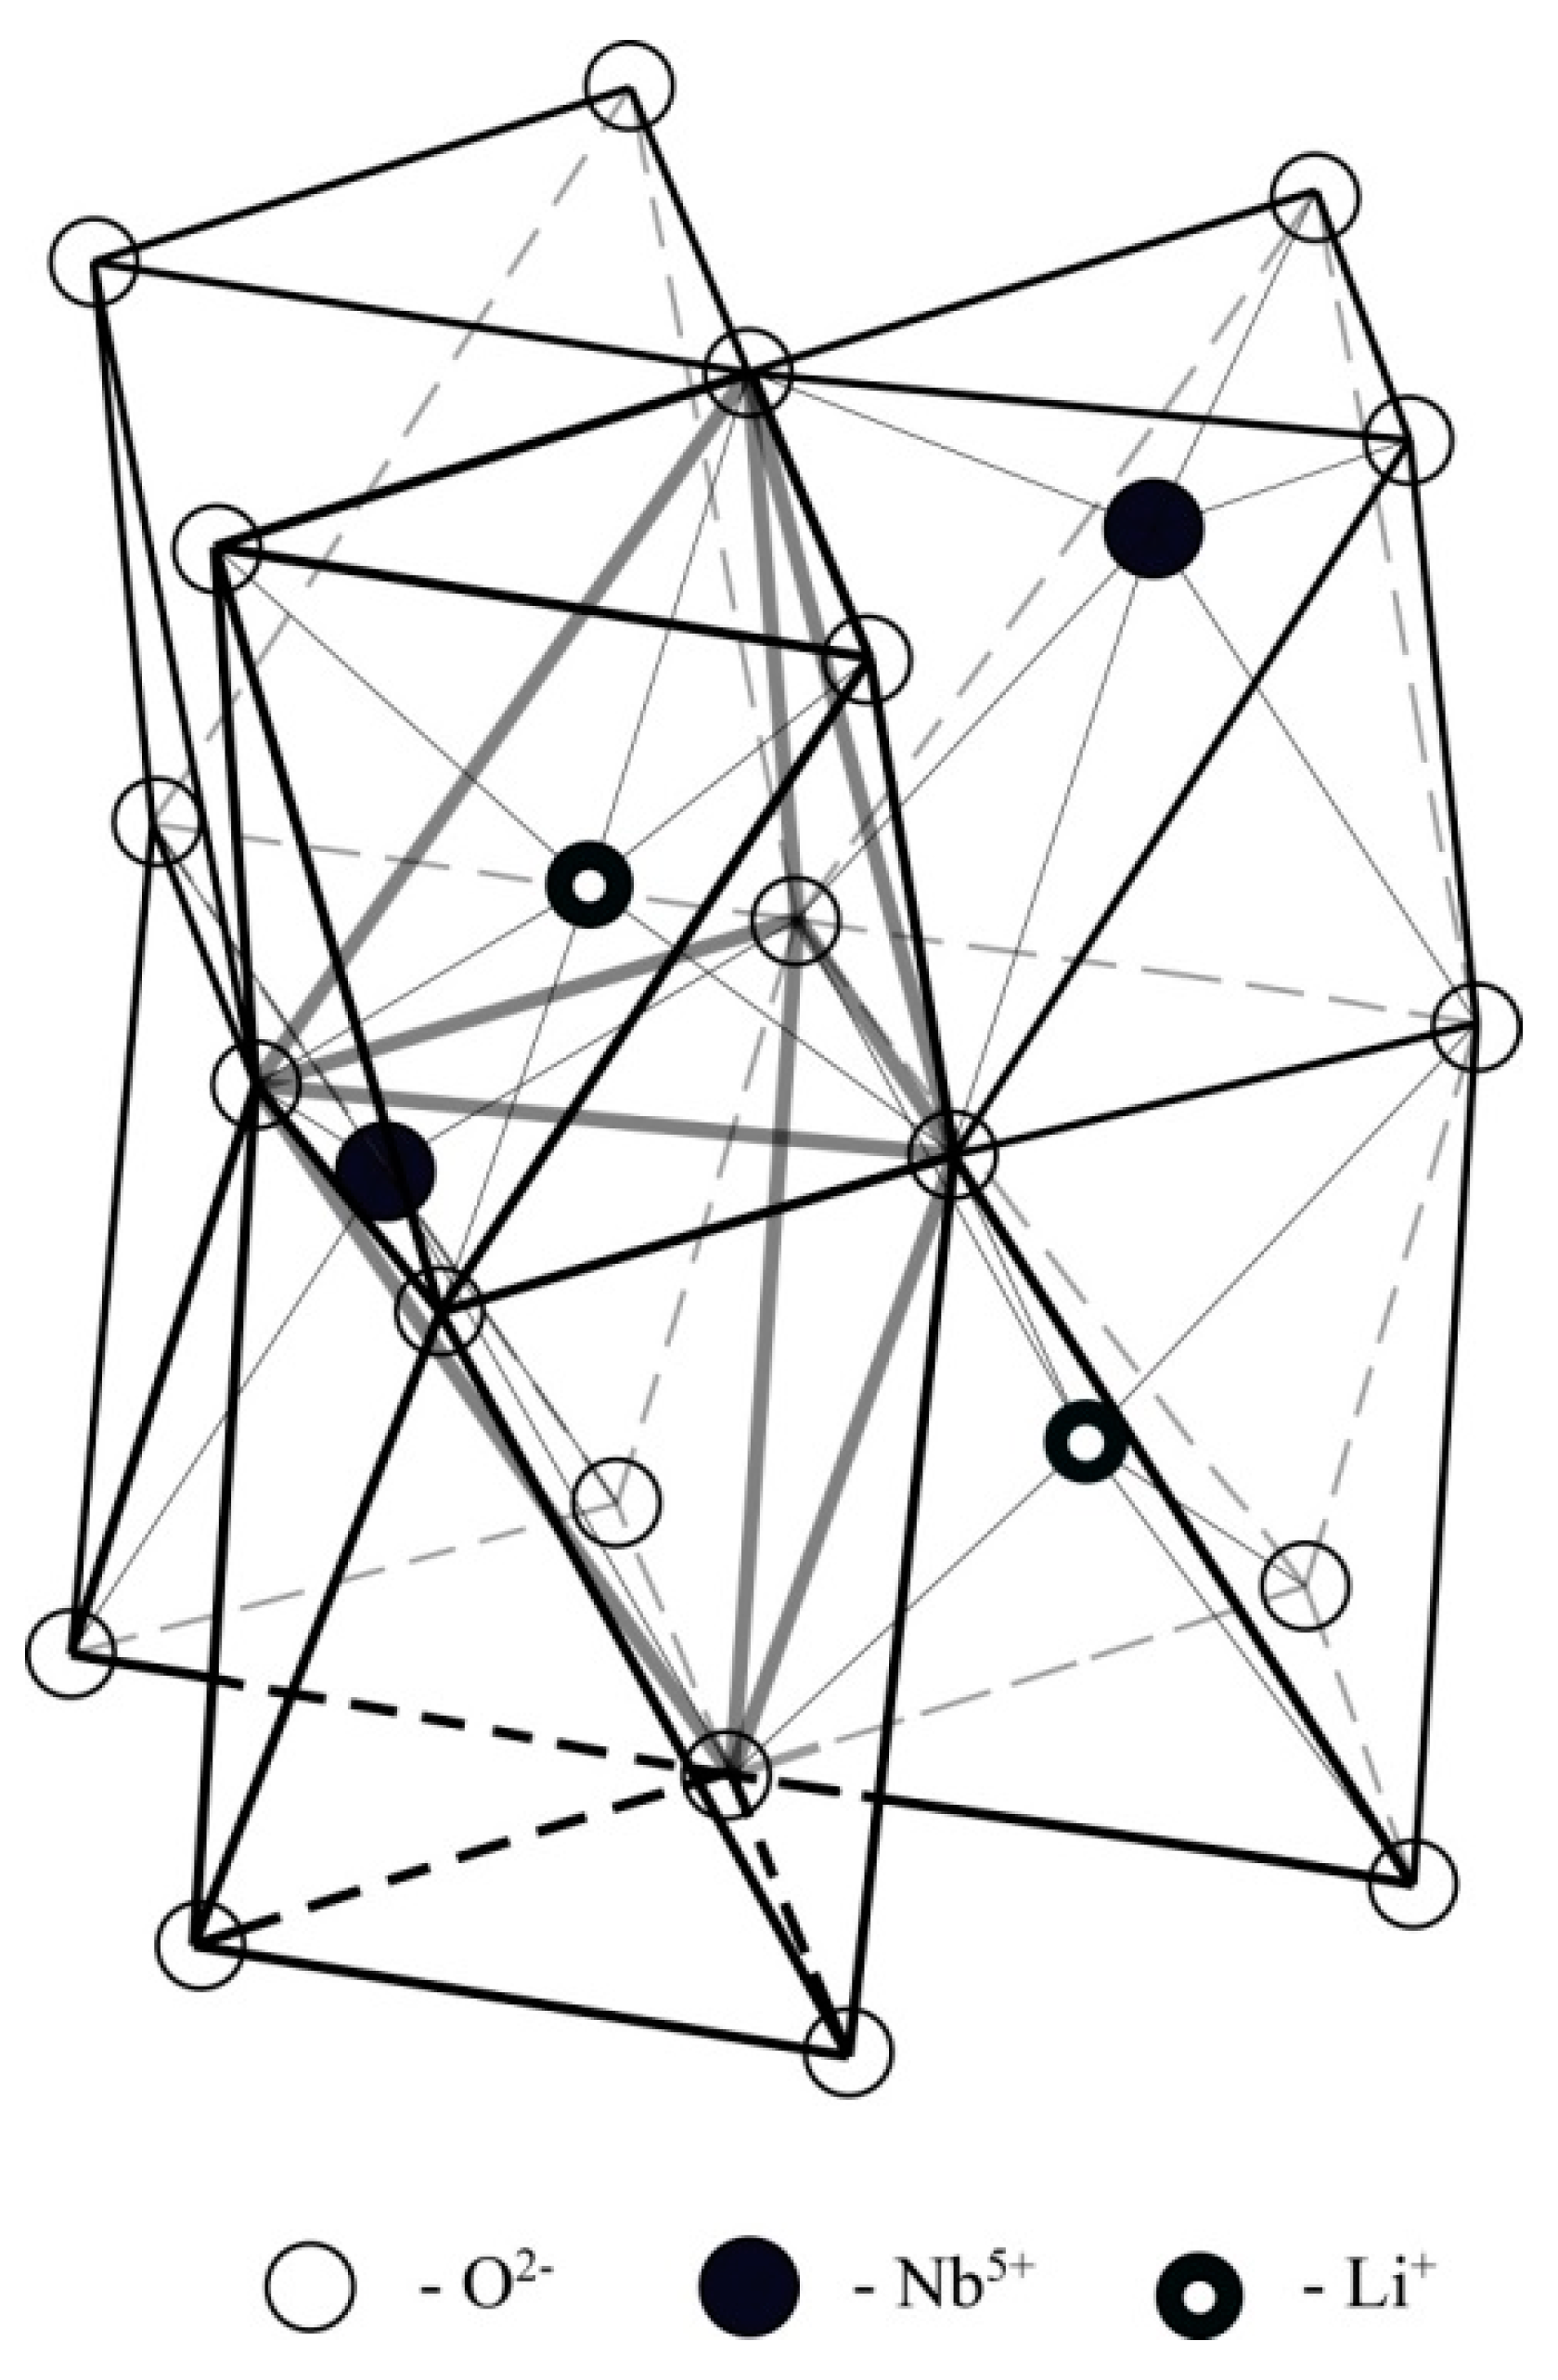
3.6. Computer Simulation of the B3+ Ion Localization in the LN Crystal Structure

Calculations of the total energy of the Coulomb interaction of point charges (U, eV) were carried out for the oxygen-octahedral lithium niobate cluster (Li+, Nb5+, O2−) with the B3+ ion considered in the sp2–hybrid state as part of the [BO3]3– plane triangles. Calculations were performed using the formula:
U = ( k · q 1 · q 2 ) / r 12
where q 1 and q 2 —charges in fractions of an electron, r 12 —distance between the centers of interacting charges [Å], k —constant expressed by the formula (eV·Å):
k = e 2 / ( 4 · π · ε 0 · 10 10 ) = 14.41971
where e —charge of an electron, ε 0 —dielectric constant.
The system (cluster) consists of two Li+ cations, two Nb5+ cations, one B3+ cation, and twenty O2− oxygen anions; it is not electrically neutral. We consider only a cluster consisting of six O6 oxygen octahedra, “torn out” from a large electrically neutral system, in order to study how the energy of the B3+ interaction with the surrounding fragment of the LN crystal structure depends on the B3+ position in tetrahedral voids. Taking a larger fragment of the structure is impractical, since the electrostatic interaction of point charges strongly decreases with distance. Li+ and Nb5+ cations sites correspond in our calculations to the structure of the ferroelectric LN phase: lithium is shifted to the lower oxygen plane, niobium—to the upper oxygen plane [2]. The calculations were based on the structural data of the CLN crystal [95]. The work simulates two processes. In the first case, the energy of the Coulomb interaction of the B3+ ion with a fragment of the CLN crystal structure (6 O6 octahedra) is calculated. In this case, we took coordinates of the cell basis with constant lattice parameters (a and c = 5.1489 and 13.8631 Å, respectively), though changing with increasing temperature [2]. In the second case, we took the same the LN structure fragment, but with different lattice parameters a and c. For this, the cell parameters were normalized to a temperature of 297 K [96]. Due to similar results obtained in the first and second cases, only experimental data with constant parameters a and c are discussed below.
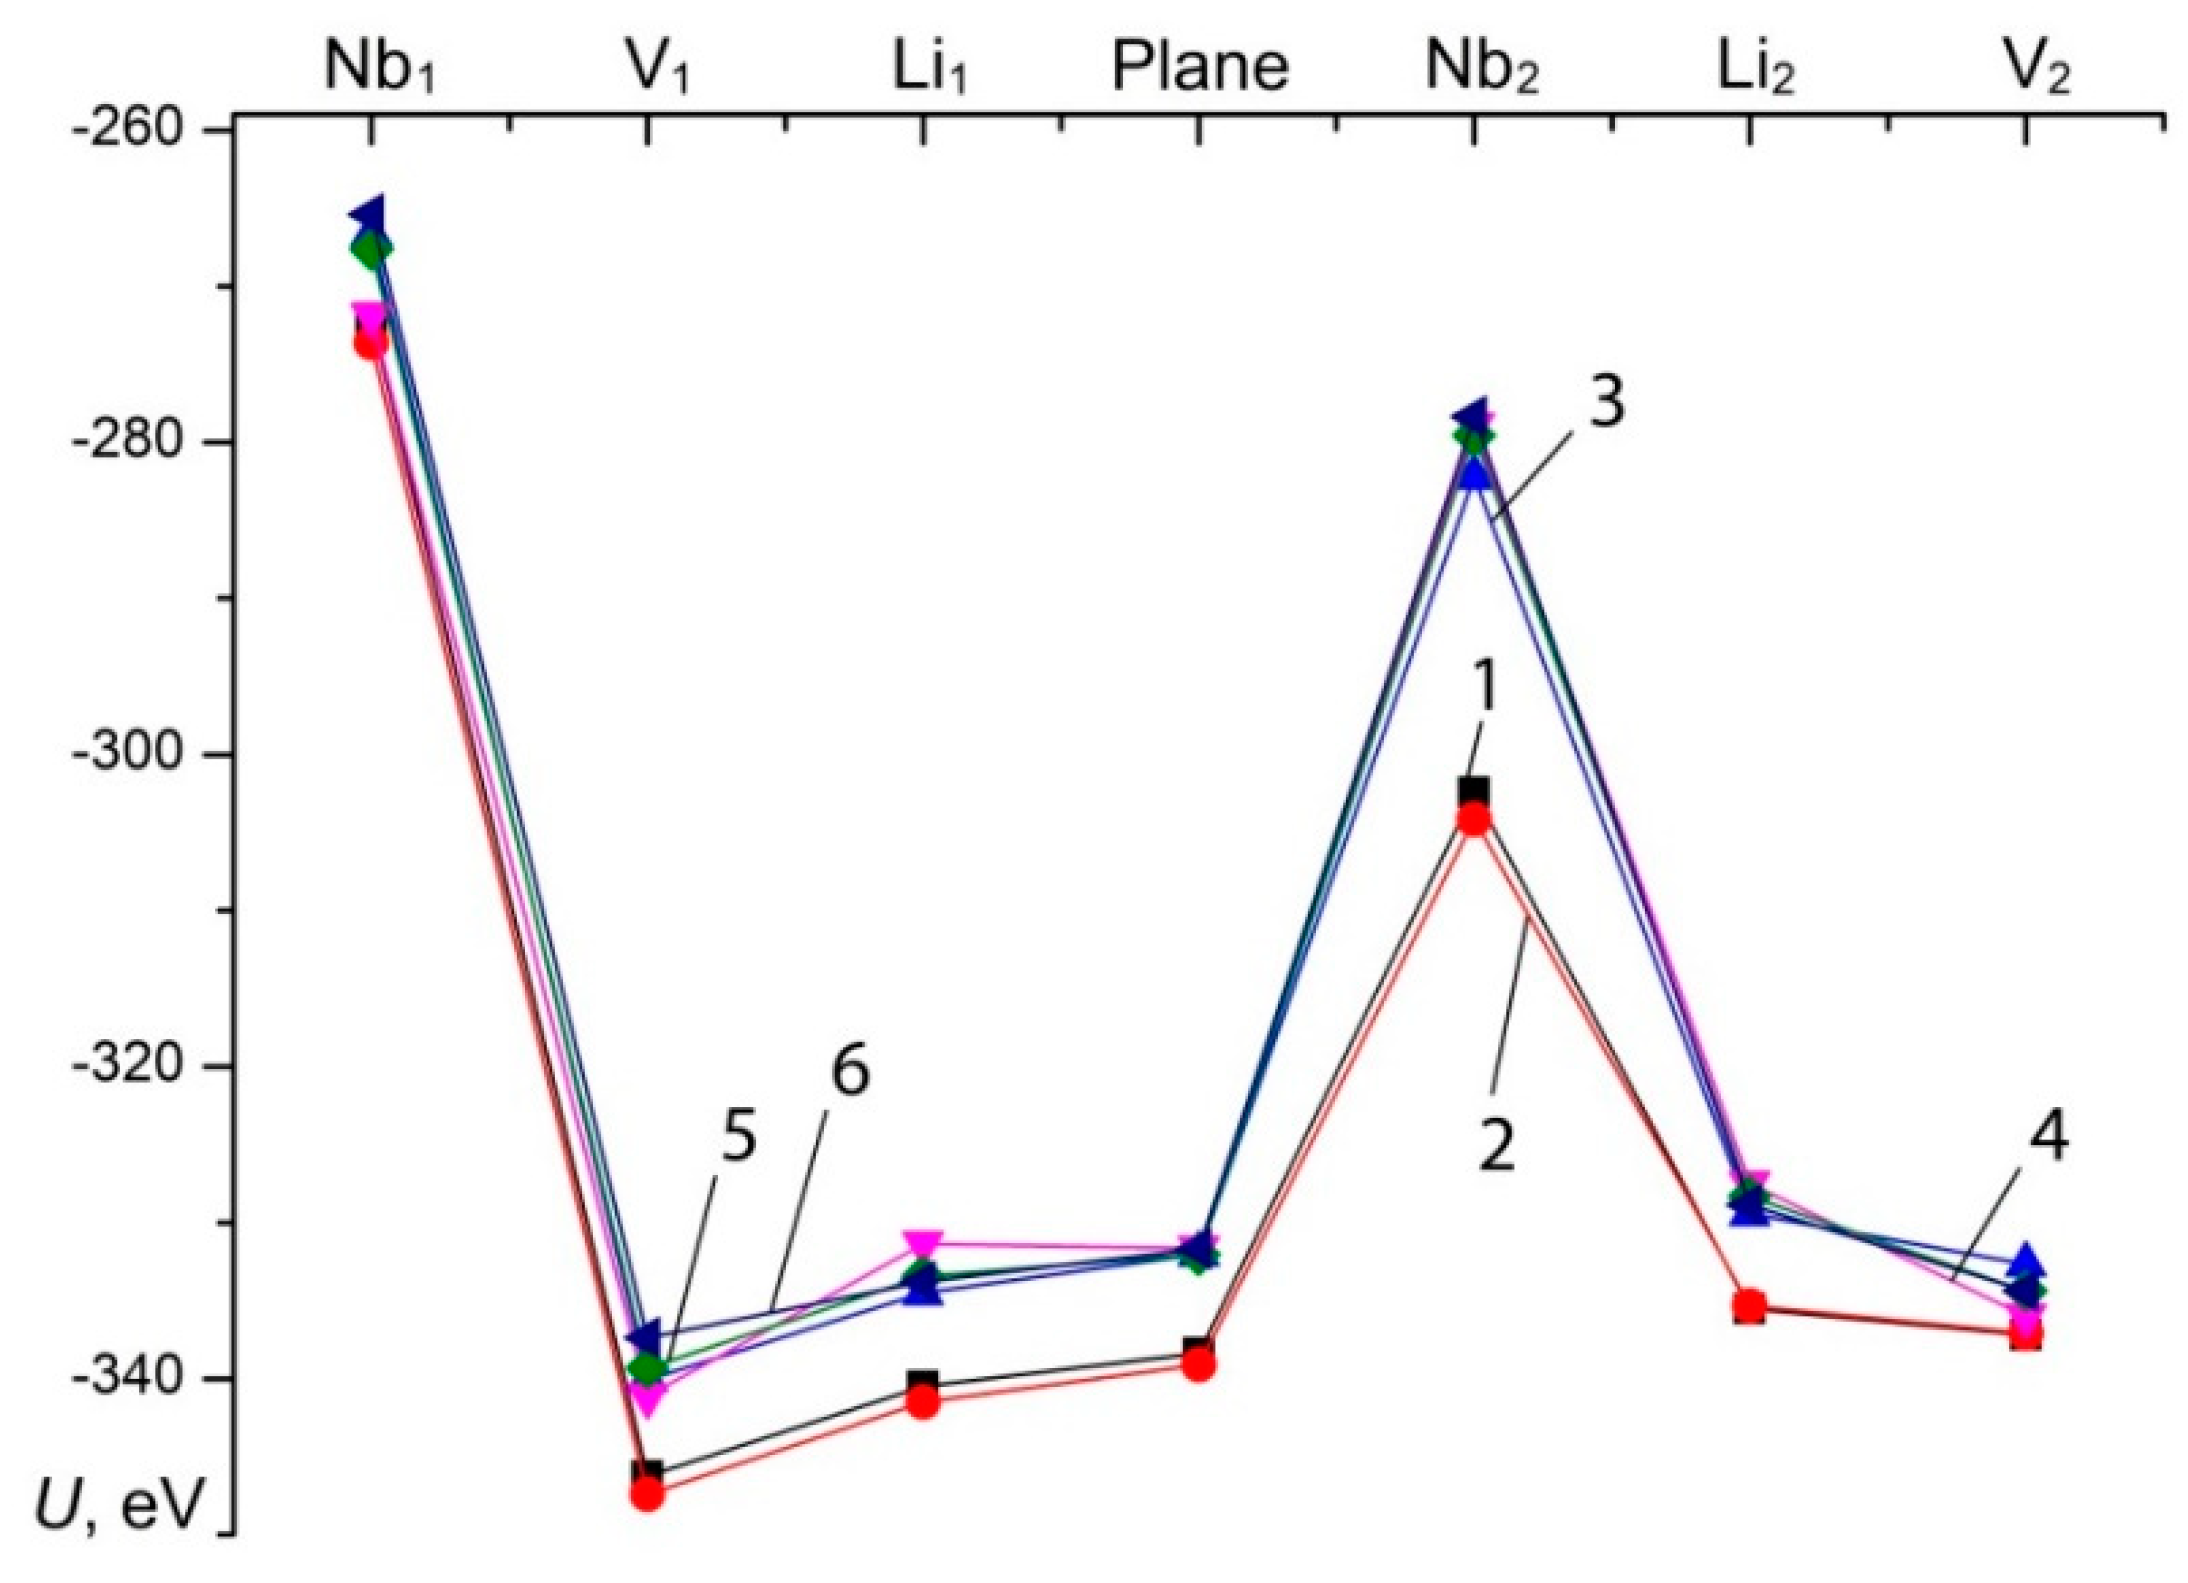
A fragment of the structure (six oxygen octahedra) taken for modeling is shown on Figure 13. We considered seven possible locations of the boron cation: at the centers of the tetrahedral faces of the first and second octahedral layers bordering the corresponding octahedra (lithium, niobium, and vacant), and also in the plane of the oxygen triplet separating the octahedral layers. In this case, the calculations did not take into account the replacement of lithium with niobium. The calculation results are shown on Figure 14. According to Figure 14, the maximum energy value for both cases corresponds to the presence of a boron cation in the [BO3]3– group bordering on niobium octahedra. For other possible arrangements of boron, the sum of the energy of the Coulomb interaction is much lower, which can be considered as a theoretically possible location of B3+ cations in the crystal structure.
We did not take into account the influence of boron in the tetrahedral face on point charges outside the system under consideration, since this influence significantly decreases with distance. It should be noted that the B3+ cation, embedding in the tetrahedral voids of the crystal structure during the growth process introduces an excess positive charge into the system. In this case, to achieve the minimum energy of the system, it will be advantageous for boron to occupy positions, first of all, in tetrahedral voids bordering lithium and vacant octahedra, or in the oxygen plane separating the oxygen-octahedral layers, Figure 14. The formation of NbLi point defects when boron is in the tetrahedral face is unlikely, since in this case it leads to an increase in the total energy due to the high localization of positive charges.
Thus, according to calculations, the presence of the B3+ ion in the crystal structure can prevent the formation of a deep electron trap NbLi, at least within the considered system. The results indicate that, in contrast to the metallic K2O flux, when the potassium element does not incorporate into the crystal structure, the nonmetallic B2O3 flux has a complex effect on the LN single crystals structure. It structures the melt, changes the microscopic crystallization mechanisms, thereby, aligns and brings KLi and KNb closer to unity (the distribution coefficients of lithium and niobium in the LiNbO3:B crystal). It reduces the formation of NbLi point defects by at least the number of B3+ cations incorporated into the tetrahedral voids of the structure, corresponding to the boron concentration in the LiNbO3:B crystal (~4 × 10⁻⁴ mol%). As shown above, in the Li2O–Nb2O5–B2O3 system, there are no regions of homogeneity of boron and its compounds with lithium niobate, and CLN should be the only crystallizing phase. However, due to the binding of an excess of niobium in the melt with boron, the fraction of lithium in the structure of the growing crystal increases, which increases the Li/Nb ratio and brings the structure of LiNbO3:B crystals closer to that of SLN. The increase in the lithium content is additionally confirmed by the calculation of the Li2O concentration in the crystals from the increase in the Curie temperature for CLN and LiNbO3:B (0.83 mol%) crystals—1145 and 1189 °C, respectively [97].
Thus, due to Raman spectroscopy, structural units of the cation sublattice are more ordered in LiNbO3:B crystals, Table 1. LN crystals doped with certain concentrations of metal cations also have an increased cation sublattice order [2,98]. Metal dopants do incorporate into the crystal structure. In the case of boron, such ordering is impossible—boron incorporates into crystal tetrahedral voids and due to our data (see paragraph 3.5.) changes O–O bonds length. This changes the O6 oxygen octahedra size and the distribution of Nb5+ and Li+ cations in octahedra. As a result, a more energetically favorable distribution of cations over octahedra is established in the crystal, the arrangement of cations along the polar axis orders. Indeed, the anionic sublattice of the LiNbO3:B crystal turns out to be less distorted than of CLN crystal, Table 1. At this, the polarizability of the oxygen-octahedral MeO6 clusters, which determines the nonlinear optical properties of the crystal, changes. This confidently manifests in the LiNbO3:B crystals Raman spectrum. 576 and 630 cm−1 bands correspond to doubly degenerate E(TO) and totally symmetric A1(TO) vibrations of oxygen atoms in O6 oxygen octahedra, respectively. They substantially widen ~2 times in LiNbO3:B spectrum in comparison with SLN and CLN, Table 1. Changes in O–O bonds length caused by trace amounts of boron localizing in tetrahedral voids can be achieved only by a much higher concentration of metal elements Zn2+, Mg2+ [2,25,26,98]. Bands corresponding to vibrations of oxygen atoms in oxygen octahedra widen smoothly in LiNbO3:Zn and LiNbO3:Mg Raman spectra and sharply—in LiNbO3:B spectrum. This can be explained by the following: tetrahedral voids of the LN crystal structure act as a kind of “buffer”, they compensate for the deformation of the oxygen framework of the structure [99]. They compensate for various influences on the anionic sublattice, including the distortion of oxygen octahedra due to the presence of metal cations Zn, Mg, etc., in them. In the case of LiNbO3:B crystals, some of the tetrahedra are already filled with B3+ cations, which negatively affects their “buffer” ability, which explains the sharp increase in the 576 and 630 cm−1 Raman bands widths.
Table 1 demonstrates that 880 cm−1 Raman band width occupies an intermediate value between the widths of this band in the spectrum of SLN and CLN crystals—25(26), 20 and 30 cm−1, respectively. The band corresponds to the oxygen atoms stretching bridge vibrations of the A1(LO) symmetry type along the polar axis in the Me–O–Me bridge (Me: Li+, Nb5+, dopant). A decrease in the 880 cm−1 band width in LiNbO3:B spectrum may be associated with an increase in the cation sublattice order of these crystals. Aligning k0 Li and Nb distribution coefficients during crystal growth explains the approach of the Li/Nb ratio to 1 in LiNbO3:B; boron in tetrahedral voids limits the NbLi structural defect formation.
Thus, the ordering of the cation sublattice of the crystal manifests itself in the Raman spectrum not only in the range 200–300 cm−1, corresponding to the vibrations of metal cations in oxygen octahedra along the polar axis, but is also indirectly traced by the parameters of the 880 cm−1 band. Due to this data, even traces amounts of B3+ cations incorporating to LN oxygen tetrahedra noticeably distort the anionic framework. This leads to a noticeable asymmetry of oxygen octahedra (compared with that in CLN crystals) and a change in their polarizability. The deformation and polarizability of oxygen-octahedral MeO6 clusters, in turn, determine the LN crystal electro-optical properties [1,2]. At this, the cationic sublattice of LiNbO3:B crystals, on the contrary, turns out to be more ordered in comparison with the that of the CLN crystal, which is also confirmed by Raman data, Table 1.

4. Conclusions

Optical microscopy, absorption spectroscopy, Raman spectroscopy, laser conoscopy, optical spectroscopy, optical and atomic force microscopy, photoinduced light scattering, and infrared spectroscopy in the field of stretching vibrations of OH groups and computer simulation were applied to study nominally pure CLN and SLN crystals and a series of LiNbO3:B crystals grown from a charge of various genesis, doped with a non-metallic element boron. A quantitative assessment of the strengths of the photovoltaic and diffusion fields has been carried out according to the PILS characteristics for all studied crystals. It was shown that the value of the diffusion field responsible for the diffusion mechanism of charge transfer in the LiNbO3:B crystal has an intermediate value between the values CLN and SLN; it depends on the boron concentration in the charge. The PILS indicatrix opening angle also depends on the boron concentration in the charge. The angle in LiNbO3:B crystal is smaller than that in SLN crystal. A LiNbO3:B band gap corresponds to the value for a SLN crystal. At the same time, LiNbO3:B crystals have greater optical uniformity compared to SLN crystals. Positions of OH groups is more ordered in LiNbO3:B crystal structure than in CLN crystal. Thus, growing nominally pure LN crystals from a melt structured with non-metal boron makes it possible to control the features of the secondary structure, optical uniformity, the magnitude of photoelectric fields and the width of the band gap in the crystal.
Macro- and micro-structure was studied in LiNbO3:B (0.55–1.24 mol%) crystal grown from a different charge. The charge contained different concentrations of boron and was prepared by solid phase synthesis-granulation and by homogeneous doping of Nb2O5:B precursor. Boron is a chemically active element; it is shown to have a strong effect on the melt structure, making it more homogeneous and viscous and changing the size and structure of clusters in the melt. This leads to a significant change in the secondary structure (defect sublattice) and properties of LiNbO3:B crystals, in comparison with nominally pure LN crystals. The melt temperature is slightly increased (1264 °C) compared to nominally pure CLN (1257 °C). Boron concentration should not exceed ~0.12 wt% in the melt for the successful growth of optically and structurally uniform LiNbO3:B crystals. At the same time, the boron concentration in the grown LiNbO3:B crystal is ~10−3 to 10−5 wt%, which corresponds to trace amounts of impurities. Calculations have revealed that boron can incorporate in trace amounts into the faces of oxygen tetrahedra of the LN crystal structure, bordering on the lithium or vacant oxygen octahedra, or into the oxygen plane separating the oxygen-octahedral layers. Trace amounts of boron in the LiNbO3:B structure, apparently obeys a certain mechanism of incorporation into oxygen tetrahedra, like the threshold mechanisms for doping metals. Boron introduces an additional positive charge into the system, thereby preventing the formation of NbLi point defects. On the other hand, incorporating into oxygen tetrahedra, boron noticeably distorts the anionic framework of the crystal structure, changing the O–O bond lengths and changing the polarizability of the oxygen-octahedral MeO6 clusters, which determines the nonlinear optical properties of the crystal. Moreover, when the O6 octahedra are distorted, the structural units of the cation sublattice are simultaneously ordered along the polar axis.
Thus, a new approach was formulated to the preparation of nominally pure LN single crystals. Composition and structure of such crystals approach SLN. Flux in trace amounts has a multi-stage and complex effect on the structural and optical properties of LN single crystals. The results obtained make it possible to expand the concept of “doping”. Doping usually means the introduction of a noticeable amount of dopants directly into the crystal structure in order to change the physical properties of the material. Despite the high content of boron in the charge (up to 2.0 mol%), its concentration in the crystal is at the level of trace amounts, i.e., orders of magnitude is lower than the concentration of doping metals. Moreover, the B3+ ion occupies the tetrahedral voids of the structure. However, boron oxide compounds, as strong complexing agents and solvents, have a noticeable effect on the structure and physical characteristics of the melt, and, consequently, on the structure of the grown crystal. Boron structures the melt in a certain way and decreases the amount of NbLi defects. Probably, it also reduces the content of uncontrolled impurities. Thus, boron reduces the effect of photorefraction in a LN single crystal, increases its structural and optical uniformity. This approach allows one to obtain nominally pure LN crystals by directed structuring of the melt. The crystals have the same properties as doped crystals, but the ordering of the structural units of the cation sublattice and NbLi defects approach the SLN crystal. At the same time, LiNbO3:B crystal has a significantly lower photorefractive effect than SLN crystals. In this case, the degree of the O6 octahedra distortion and the photorefractive properties of LiNbO3:B crystals can be varied using different methods of the charge doping.

Author Contributions

Conceptualization, N.V.S., N.A.T., and R.A.T.; methodology, N.A.T., O.V.M., R.A.T., and I.V.B.; software, O.V.M., R.A.T.; validation, O.V.M. and R.A.T.; investigation, O.V.M., R.A.T., and I.V.B.; data curation, R.A.T.; writing—original draft preparation, N.V.S., N.A.T., R.A.T., and D.V.M.; writing—review and editing, M.N.P. and D.V.M.; visualization, O.V.M., R.A.T., and D.V.M.; supervision, N.V.S. and M.N.P. All authors have read and agreed to the published version of the manuscript.

Funding

This research was supported by the Ministry of Science and Higher Education Russian Federation scientific topic No 0186-2021-0022 (registration AAAA-A21-118022190125-2) and by RFBR grant № 19-33-90025.

Data Availability Statement

Raw data of this paper will be available from corresponding author, N.V., on a reasonable request.

Acknowledgments

Authors would like to thank Vadim Efremov from Tananaev Institute of Chemistry—Subdivision of the Federal Research Centre «”Kola Science Centre of the Russian Academy of Sciences” (ICT RAS) for providing Figure A2 and Figure A12. Authors would like to thank Vyacheslav Voskresenskiy from ICT RAS for advice on computer modeling.

Conflicts of Interest

The authors declare no conflict of interest.

Appendix A

The appendix presents possible secondary structure elements in LN crystals: cracking if the dopant concentration is too high (Figure A1), after-growth thermal stresses (Figure A2), growth stripes (Figure A3 and Figure A4), separation of the second phase (Figure A5, Figure A6 and Figure A7), macro-cellular (Figure A8) and mosaic (Figure A9 and Figure A10) structure, appearance of micro- (Figure A11) and nanodefects (Figure A12). The crack on Figure A1 developed in accordance with the symmetry of the crystal at angles between the individual branches of ~120 degrees. Probably, the second phase on Figure A7a can be in a quasicrystalline state since the spatial regions of its separation contain 5th-order symmetry axes.
Figure A1. Cracking in heavily doped LiNbO3 crystals: (a)—LiNbO3:Mg ([MgO] ≈ 4 mol% in the crystal); (b)—LiNbO3:Zn (direct doping, [ZnO] ≈ 5.19 mol% in the crystal).
Crystals 11 00458 g0a1
Figure A2. (a)—AFM image of the region of mechanical stresses in the form of a fragment of the network of dislocations in the LiNbO3:Mg crystal ([MgO] ≈ 5.59 mol% in the melt); (b)—manifestation of the nanostructure in the LiNbO3:Zn crystal ([ZnO] = 5.84 mol% in the melt) at the boundary of the positive and negative macrodomains.
Crystals 11 00458 g0a2
Figure A3. Growth bands in heavily doped LiNbO3:Mg crystals (direct doping): (a)—X-cut; (b)—Z-cut.
Crystals 11 00458 g0a3
Figure A4. (a)—growth bands in a plane parallel to the growth axis of a LiNbO3:Mg crystal ([MgO] ≈ 5.3 mol% in the melt), X-cut; (b)—domain structure fixed by growth bands in a LiNbO3:Gd crystal (direct doping, [Gd2O3] ≈ 0.44 wt% in a crystal), Z-cut.
Crystals 11 00458 g0a4
Figure A5. Isolation of the interstitial phase with incoherent boundaries on Z-cuts of crystals: (a)—LiNbO3:Zn ([Zn] = 4.74 mol%); (b)—LiNbO3:Mg (joint solid-phase synthesis, [MgO] = 5.6 mol% in the melt).
Crystals 11 00458 g0a5
Figure A6. Crack (a,b) formed in the crystal LiNbO3:Zn ([ZnO] ≈ 3.95 mol% in the crystal), Z-cut, at the interface between the matrix and the second phase with incoherent boundaries.
Crystals 11 00458 g0a6
Figure A7. (a)—precipitation of the second phase with semi-coherent boundaries in the LiNbO3:Zn crystal (direct doping, [Zn] = 4.68 mol% in the crystal) Z-cut, after the high-temperature electrodiffusion annealing; (b)—separation of the second phase with partially coherent boundaries in the LiNbO3:Zn crystal ([ZnO] = 5.84 mol% in the melt), Z-cut.
Crystals 11 00458 g0a7
Figure A8. Macrodefect cellular structure in a heavily doped LiNbO3:Zn crystal (direct doping): (a)—At the bottom of a large boule, observation in a bright field; (b)—On the Z surface through the X surface, observation in a bright field; (c)—observation in the DIC mode.
Crystals 11 00458 g0a8
Figure A9. Accumulation of triangular domains against the background of an uneven mosaic structure in a LiNbO3:Mg crystal (joint solid-phase synthesis, [MgO] ≈ 4.7 mol% in the crystal), Z-cut.
Crystals 11 00458 g0a9
Figure A10. Mosaic structure: (a)—with cells of different sizes, located near the macrodomain wall in the LiNbO3:Zn crystal ([ZnO] ≈ 4.77 mol% In the crystal); (b)—In a LiNbO3: Mg crystal ([MgO] ≈ 4.7 mol% in a crystal); (c)—with equiaxed cells in the LiNbO3:Ce crystal (direct doping, [Ce] = 0.5 mol% in the crystal), Z-cut.
Crystals 11 00458 g0a10
Figure A11. Defective micro-structure in heavily doped crystals: (a)—A “network” of triangular microdomains in a LiNbO3:Zn crystal ([ZnO] = 6.5 mol% in the melt); (b)—An accumulation of triangular microdomains against the background of a mosaic “grid” in a LiNbO3:Zn crystal ([ZnO] = 4.69 mol% melt); (c)—An accumulation of triangular domains, a sign of inhomogeneity of the chemical composition, in the LiNbO3:Mg crystal ([MgO] ≈ 4.4 mol% in the crystal); (d)—Poorly formed mosaic structure in a LiNbO3:Mg crystal (direct doping, [MgO] ≈ 4.77 mol% in the crystal), Z-cut, with shapeless structural formations, probably crystallization centers of the second phase.
Crystals 11 00458 g0a11
Figure A12. NANO-R ATF image of a hexagonal microdomain in a LiNbO3:Mg crystal (joint solid-phase synthesis, [MgO] ≈ 5.59 mol% in the melt), after the high-temperature electrodiffusion annealing, Z-cut.
Crystals 11 00458 g0a12

References

  1. Kuzminov, Y.S. Electroptic and Nonlinear Optical Lithium Niobate Crystal; Nauka: Moscow, Russia, 1987; p. 262. (In Russian) [Google Scholar]
  2. Sidorov, N.V.; Volk, T.R.; Mavrin, B.N.; Kalinnikov, V.T. Lithium Niobate: Defects, Photorefraction, Vibrational Spectra, Polaritons; Nauka: Moscow, Russia, 2003; p. 255. (In Russian) [Google Scholar]
  3. Rauber, A. Chemistry and physics of lithium niobate. In Current Topic in Materials Science; Kaldis, E., Ed.; North-Holland Publ. Comp.: Amsterdam, The Nederland, 1978; pp. 481–601. [Google Scholar]
  4. Gunter, P.; Huidnard, J.-P. Photorefractive Materials and Their Applications 1; Springer: Berlin, Germany, 2007; p. 365. [Google Scholar]
  5. Abrahams, S.C. Properties of Lithium Niobate; Pergamon: New York, NY, USA, 1989; p. 234. [Google Scholar]
  6. Abrahams, S.C.; Reddy, J.M.; Bernstein, J.L. Ferroelectric Lithium Niobate. 3. Single crystal X-ray diffraction study at 24 °C. J. Phys. Chem. Solid 1966, 27, 997–1012. [Google Scholar] [CrossRef]
  7. Volk, T.; Wohlecke, M. Lithium Niobate. Defects, Photorefraction and Ferroelectric Switching; Springer: Berlin, Germany, 2008; p. 250. [Google Scholar]
  8. Aillerie, M.; Bourson, P.; Mostefa, M.; Abdi, F.; Fontana, M.D. Photorefractive Damage in congruent LiNbO3. Part I. Zinc doped Lithium Niobate Crystals. J. Phys. Conf. Ser. 2013, 416, 012001. [Google Scholar] [CrossRef] [Green Version]
  9. Sidorov, N.V.; Palatnikov, M.N.; Kalinnikov, V.T. Effect of secondary structure on the optical properties of ferroelectric crystals of lithium niobate with a low photorefraction effect. Proc. Kola Sci. Center RAS Chem. Mater. Sci. 2015, 9, 464–468. (In Russian) [Google Scholar]
  10. Fontana, M.D.; Bourson, P. Microstructure and defects probed by Raman spectroscopy in lithium niobate crystals and devices. Appl. Phys. Rew. 2015, 2, 040602. [Google Scholar] [CrossRef]
  11. Sidorov, N.V.; Pikoul, O.Y.; Kruk, A.A.; Teplyakova, N.A.; Yanichev, A.A.; Palatnikov, M.N. Complex investigations of structural and optical homogeneities of low-photorefractivity lithium niobate crystals by the conoscopy and photoinduced and Raman light scattering methods. Opt. Spectrosc. 2015, 118, 259–268. [Google Scholar] [CrossRef]
  12. Blistanov, A.A.; Lyubchenko, V.M.; Goryunova, A.N. Recombination processes in LiNbO3 crystals. Crystallography 1998, 43, 86–91. (in Russian). [Google Scholar]
  13. Sidorov, N.V.; Yanichev, A.A.; Palatnikov, M.N.; Gabain, A.A.; Pikoul, O.Y. Optical homogeneity, defects, and photorefractive properties of stoichiometric, congruent, and zinc-doped lithium niobate crystals. Opt. Spectrosc. 2014, 117, 72–81. [Google Scholar] [CrossRef]
  14. Cabrera, J.M.; Olivares, J.; Carrascosa, M.; Rams, J.; Müller, R.; Diéguez, E. Hydrogen in lithium niobate. Adv. Phys. 1996, 45, 349–392. [Google Scholar] [CrossRef]
  15. Kovacs, L.; Wöhlecke, M.; Jovanovic, A.; Polgar, K.; Kapphan, S. Infrared absorption study of the OH vibrational band in LiNbO3 crystals. J. Phys. Chem. Solid 1991, 52, 797. [Google Scholar] [CrossRef]
  16. Palatnikov, M.N.; Biryukova, I.V.; Masloboeva, S.M.; Makarova, O.V.; Manukovskaya, D.V.; Sidorov, N.V. The search of homogeneity of LiNbO3 crystals grown of charge with different genesis. J. Cryst. Growth 2014, 386, 113–118. [Google Scholar] [CrossRef]
  17. Palatnikov, M.N.; Biryukova, I.V.; Kravchenko, O.E.; Masloboeva, S.M.; Makarova, O.V.; Efremov, V.V. Synthesis of homogeneously Mg-doped lithium niobate batch and study of the effect of non-metal impurities on the properties of LiNbO3:Mg crystals. Rus. J. Inorg. Chem. 2016, 61, 18–23. [Google Scholar] [CrossRef]
  18. Makarova, O.V.; Sidorov, N.V.; Teplyakova, N.A.; Masloboeva, S.M.; Efremov, V.V. Effect of charge mixture preparation technology on the physicochemical and optical properties of LiNbO3:Mg crystals. Inorg. Mater. Appl. Res. 2016, 7, 691–697. [Google Scholar] [CrossRef]
  19. Makarova, O.V.; Palatnikov, M.N.; Biryukova, I.V.; Teplyakova, N.A.; Sidorov, N.V. Structure and properties of boron-doped LiNbO3 single crystals. Inorg. Mater. 2018, 54, 49–54. [Google Scholar] [CrossRef]
  20. Palatnikov, M.N.; Biryukova, I.V.; Makarova, O.V.; Efremov, V.V.; Kravchenko, O.E.; Kalinnikov, V.T. Obtaining and properties of lithium niobate crystals grown from the melt of congruent composition doped by boron. Proc. Kola Sci. Center RAS Chem. Mater. Sci. 2015, 31, 434–438. (In Russian) [Google Scholar]
  21. Sidorov, N.V.; Palatnikov, M.N.; Yanichev, A.A.; Titov, R.A.; Teplyakova, N.A. Structural disorder and optical properties of congruent lithium niobate crystals doped with zinc and boron. Opt. Spectrosc. 2016, 121, 36–44. [Google Scholar] [CrossRef]
  22. Sidorov, N.V.; Palatnikov, M.N.; Yanichev, A.A.; Titov, R.A.; Teplyakova, N.A. Structural disorder of LiNbO3:B crystals and its manifestation in Raman spectra. J. Appl. Spectrosc. 2016, 83, 707–714. [Google Scholar] [CrossRef]
  23. Sidorov, N.V.; Teplyakova, N.A.; Titov, R.A.; Palatnikov, M.N. Structure disorder and optical characteristics of congruent lithium niobate crystals grown from boron doped melts. Sib. Phys. J. 2018, 13, 70–79. (In Russian) [Google Scholar] [CrossRef]
  24. Sidorov, N.V.; Teplyakova, N.A.; Titov, R.A.; Palatnikov, M.N. Structural features, physicochemical, and optical characteristics of lithium niobate crystals grown from boron-doped melts. Tech. Phys. 2018, 63, 1758–1766. [Google Scholar] [CrossRef]
  25. Palatnikov, M.N.; Sidorov, N.V.; Titov, R.A.; Teplyakova, N.A.; Makarova, O.V. Physicochemical and optical characteristics of LiNbO3 single-crystals doped with boron. Inorg. Mater. Appl. Res. 2018, 9, 817–824. [Google Scholar] [CrossRef]
  26. Chernaya, T.S.; Volk, T.R.; Verin, I.A.; Simonov, V.I. Threshold concentrations in zinc-doped lithium niobate crystals and their structural conditionality. Cryst. Rep. 2008, 53, 573–578. [Google Scholar] [CrossRef]
  27. Palatnikov, M.N.; Sidorov, N.V.; Makarova, O.V.; Biryukova, I.V. Fundamental Aspects of the Technology of Heavily Doped Lithium Niobate Crystals; ICT KSC RAS Publ.: Apatity, Russia, 2017; p. 241. (In Russian) [Google Scholar]
  28. Shur, V.Y.; Akhmatkhanov, A.R.; Baturin, I.S. Micro- and nano-domain engineering in lithium niobate. Appl. Phys. Rew. 2015, 2, 040604. [Google Scholar] [CrossRef]
  29. Lengyel, K.; Peter, A.; Kovacs, L.; Corradi, G.; Palfavi, L.; Hebling, J.; Unferdorben, M.; Dravecz, G.; Hajdara, I.; Szaller, Z.; et al. Growth, defect structure, and THz application of stoichiometric lithium niobate. Appl. Phys. Rev. 2015, 2, 040601. [Google Scholar] [CrossRef] [Green Version]
  30. Sidorov, N.V.; Palatnikov, M.N.; Teplyakova, N.A.; Syuy, V.A. Structure and optical properties of LiNbO3:B crystals grown from charges of different origins. J. Appl. Spectrosc. 2018, 85, 717–723. [Google Scholar] [CrossRef]
  31. Goulkov, M.; Imlau, M.; Woike, T. Photorefractive parameters of lithium niobate crystals from photoindused light scattering. Phys. Rev. B Condens. Matter Mater. Phys. 2008, 77, 235110. [Google Scholar] [CrossRef]
  32. Palatnikov, M.N.; Biryukova, I.V.; Masloboeva, S.M.; Makarova, O.V.; Kravchenko, O.E.; Yanichev, A.A.; Sidorov, N.V. Structure and optical homogeneity of LiNbO3<Mg> crystals grown from different charges. Inorg. Mater. 2013, 49, 715–720. [Google Scholar] [CrossRef]
  33. Masloboeva, S.M.; Palatnikov, M.N.; Arutjunian, L.G.; Ivanenko, D.I. Methods for producing doped lithium niobate charge for growth of single crystals. Bull. St. Petersburg State Technol. Inst. (Tech. Univ.) 2017, 38, 34–43. (In Russian) [Google Scholar]
  34. Palatnikov, M.N.; Sidorov, N.V.; Kalinnikov, V.T. Technology of controlled synthesis of monocrystalline and ceramic materials based on niobates-tantalates of alkali metals. Russ. J. Non-Ferr. Met. 2000, 10, 54–60. (In Russian) [Google Scholar]
  35. Kuzminov, Y.S. Violation of stoichiometry during the growth of the lithium niobate crystals. Quantum Electron. Mater. 1997, 5, 55–59. (In Russian) [Google Scholar]
  36. Balasanyan, R.N.; Gabrielyan, V.T.; Kokanyan, E.P. Composition and uniformity of LiNbO3 crystals in their relationship with growing conditions. Crystallography 1990, 35, 1540–1544. (In Russian) [Google Scholar]
  37. Palatnikov, M.N.; Sidorov, N.V.; Biryukova, I.V.; Shcherbina, O.B.; Kalinnikov, V.T. Granulated charge for growth of lithium niobate single crystals. Perspect. Mater. 2011, 2, 93–97. (In Russian) [Google Scholar] [CrossRef]
  38. Pikoul, O.Y.; Sidorov, N.V. Laser Conoscopy of Crystals; ICT KSC RAS Publ.: Apatity, Russia, 2014; p. 161. (In Russian) [Google Scholar]
  39. Gurzadyan, G.G.; Dmitriev, V.G.; Nikogosyan, D.N. Nonlinear Optical Crystals. Properties and Applications in Quantum Electronics; Radio and Communication: Moscow, Russia, 1991; p. 160. (In Russian) [Google Scholar]
  40. Skiba, V.I.; Kolesnikov, V.N. High-temperature thermal installation for studying the state diagrams of salt systems. In Experimental Studies of the Process of Mineral Formation in Hypogenic Conditions; Kola Branch of the USSR Academy of Sciences Publ.: Apatity, Russia, 1980; pp. 51–56. (In Russian) [Google Scholar]
  41. Sidorov, N.V.; Serebryakov, Y.A. The structural ordering and photorefraction in lithium niobate admixed crystals. Ferroelectrics 1994, 160, 101–105. [Google Scholar] [CrossRef]
  42. Sidorov, N.V.; Palatnikov, M.N.; Teplyakova, N.A.; Yanichev, A.A.; Titov, R.A. Structure disorder and photorefractive properties of LiNbO3:B crystals. In Proceedings of the Asia-Pacific Conference on Fundamental Problems of Opto- and Microelectronics (SPIE 2016), Khabarovsk, Russia, 11–13 October 2016. [Google Scholar] [CrossRef]
  43. Sidorov, N.V.; Mavrin, B.N.; Chufyrev, P.G.; Palatnikov, M.N. Phonon Spectra of Lithium Niobate Single Crystals; Kalinnikov, V.T., Ed.; ICT KSC RAS Publ.: Apatity, Russia, 2012; p. 215. (In Russian) [Google Scholar]
  44. Kruk, A.A.; Sidorov, N.V.; Yanichev, A.A.; Palatnikov, M.N. Raman spectra of copper-doped lithium niobate crystals as a function of excitation wavelength. Appl. Phys. 2014, 81, 1–6. [Google Scholar] [CrossRef]
  45. Sidorov, N.V.; Kruk, A.A.; Pikoul, O.Y.; Palatnikov, M.N.; Teplyakova, N.A.; Yanichev, A.A.; Makarova, O.V. Integrated research of structural and optical homogeneities of the lithium niobate crystal with low photorefractive effect. Optik 2015, 126, 1081–1089. [Google Scholar] [CrossRef]
  46. Gorelik, V.S.; Sverbil, P.P. Raman scattering by longitudinal and transverse optical vibrations in lithium niobate single crystals. Inorg. Mater. 2015, 51, 1104–1110. [Google Scholar] [CrossRef]
  47. Anikiev, A.A.; Sidorov, N.V.; Serebryakov, Y.A. Structural ordering in lithium niobate crystals doped by Mg2+ and Gd3+ ions. J. Appl. Spectrosc. 1992, 56, 670–672. (In Russian) [Google Scholar]
  48. Sidorov, N.V.; Palatnikov, M.N.; Kalinnikov, V.T. Raman scattering spectra and structural features of lithium niobate crystals. Opt. Spectrosc. 1997, 82, 38–45. (In Russian) [Google Scholar]
  49. Anikjev, A.A. One- and two-phonon density of states in lithium niobate crystals. Eng. J. Sci. Innov. 2013, 7, 50–68. (In Russian) [Google Scholar]
  50. Umarov, M.; Gruzienko, V.; Vtyurin, A.; Khodzhabaev, A. Study of the low-frequency range of rose spectra of lithium niobate crystals. Compon. Technol. 2010, 6, 138–140. (In Russian) [Google Scholar]
  51. Gröne, A.; Kapphan, S. Sharp, temperature dependent OH/OD IR-absorption bands in nearly stoichiometric (VTE) LiNbO3. J. Phys. Chem. Solids 1995, 56, 687–701. [Google Scholar] [CrossRef]
  52. Polgar, K.; Peter, A.; Kovacs, L.; Corradi, G.; Szaller, Z. Growth of stoichiometric LiNbO3 single crystals by top seeded solution growth method. J. Cryst. Growth 1997, 177, 211–216. [Google Scholar] [CrossRef]
  53. Kong, Y.; Zhang, W.; Chen, X.; Xu, J.; Zhang, G. OH absorption spectra of pure lithium niobate crystals. J. Phys. Condens. Matter 1999, 11, 2139–2143. [Google Scholar] [CrossRef]
  54. Iyi, N.; Kitamura, K.; Izumi, F.; Yamamoto, I.K.; Hayashi, T.; Asano, H.; Kimura, S. Comparative study of defect structures in lithium niobate with different compositions. J. Solid State Chem. 1992, 101, 340–352. [Google Scholar] [CrossRef]
  55. Kong, Y.; Zhang, W.; Xu, J.; Yan, W.; Liu, H.; Xie, X.; Li, X.; Shi, L.; Zhang, G. The OH absorption spectra of low doped lithium niobate crystals. Infrared Phys. Technol. 2004, 45, 281–289. [Google Scholar] [CrossRef]
  56. Yevdokimov, S.V.; Yatsenko, A.V. Investigation of the localization of H+ ions in stoichiometric LiNbO3. Cryst. Rep. 2003, 48, 542–546. [Google Scholar] [CrossRef]
  57. Dravecz, G.; Kovács, L. Determination of the crystal composition from the OH vibrational spectrum in lithium niobate. Appl. Phys. B 2007, 88, 305–307. [Google Scholar] [CrossRef]
  58. Dravecz, G.; Kovács, L.; Peter, A.; Polgar, K.; Bourson, P. Raman and infrared spectroscopic characterization of LiNbO3 crystals grown from alkali metal oxide solvents. Phys. Stat. Solid 2007, 4, 1313–1316. [Google Scholar] [CrossRef]
  59. Salloum, M.Y.; Grunsky, O.S.; Man’shina, A.A.; Tver’yanovich, A.S.; Tver’yanovich, Y.S. Investigation of lithium niobate composition by optical spectroscopy methods. Russ. Chem. Bull. 2009, 58, 2228–2232. [Google Scholar] [CrossRef]
  60. Klauer, S.; Wöhlecke, M.; Kapphan, S. Influence of H-D isotopic substitution on the protonic conductivity of LiNbO3. Phys. Rev. B 1992, 45, 2786–2799. [Google Scholar] [CrossRef] [PubMed]
  61. Watanabe, Y.; Sota, T.; Suzuki, K.; Iyi, N.; Kimura, S.; Kimura, S. Defects structures in LiNbO3. J. Phys. Cond. Matter 1995, 7, 3627–3635. [Google Scholar] [CrossRef]
  62. Maksimenko, V.A.; Syuy, A.V.; Karpets, Y.M. Photo-Induced Processes in Lithium Niobate Crystals; Fizmatlit: Moscow, Russia, 2008; p. 96. (In Russian) [Google Scholar]
  63. Obukhovsky, V.V. Photorefractive Light Scattering Processes in Crystals. Ph.D. Thesis, Taras Shevchenko National University, Kiev, Ukraine, 1989. [Google Scholar]
  64. Syuy, A.V.; Sidorov, N.V.; Antonycheva, E.A. Photorefractive Properties and Structural Features of a Nonlinear Optical Lithium Niobate Crystal; FESTU Publ.: Khabarovsk, Russia, 2011; p. 108. (In Russian) [Google Scholar]
  65. Sidorov, N.V.; Palatnikov, M.N.; Antonycheva, E.A.; Syuy, A.V. Photorefractive properties of stoichiometric lithium niobate single crystals. Crystallogr. Rep. 2010, 55, 1019–1024. [Google Scholar] [CrossRef]
  66. Sidorov, N.V.; Palatnikov, M.N.; Kadetova, A.V. Raman scattering in non-stoichiometric lithium niobate crystals with a low photorefractive effect. Crystals 2019, 9, 535. [Google Scholar] [CrossRef] [Green Version]
  67. Fontana, M.D.; Laabidi, K.; Jannot, B.; Maglione, M.; Jullien, P. Relationship between electro-optic, vibrational and dielectric properties in BaTiO3. Solid State Commun. 1994, 92, 827–830. [Google Scholar] [CrossRef]
  68. Abdi, F.; Aillerie, M.; Fontana, M.; Bourson, P.; Volk, T.; Maximov, B.; Sulyanov, S.; Rubinina, N.; Wöhlecke, M. Influence of Zn doping on electrooptical properties and structure parameters of lithium niobate crystals. Appl. Phys. B 1999, 68, 795–799. [Google Scholar] [CrossRef]
  69. Nahm, H.H.; Park, C.H. First-principles study of microscopic properties of the Nb antisite in LiNbO3: Comparison to phenomenological polaron theory. Phys. Rev. B 2008, 78, 184108. [Google Scholar] [CrossRef]
  70. Blümel, J.; Born, E.; Metzger, T. Solid state NMR study supporting the lithium vacancy defect model in congruent lithium niobate. J. Phys. Chem. Solids 1994, 55, 589–593. [Google Scholar] [CrossRef]
  71. Lines, M.E.; Glass, A.M. Principles and Application of Ferroelectrics and Related Materials; Clarendon Press: Oxford, UK, 1977; p. 680. [Google Scholar]
  72. Akhmadullin, I.S.; Golenishchev-Kutuzov, V.A.; Migachev, S.A.; Mironov, S.P. Low-temperature electrical conductivity of congruent lithium niobate crystals. Phys. Solid State 1998, 40, 1190–1192. [Google Scholar] [CrossRef]
  73. Can, H.; Shichao, W.; Ning, Y. Subsolidus phase relations and the crystallization region of LiNbO3 in the system Li2O–B2O3–Nb2O5. J. Alloys Compd. 2010, 502, 211–214. [Google Scholar] [CrossRef]
  74. Palatnikov, M.N.; Biryukova, I.V.; Makarova, O.V.; Efremov, V.V.; Kravchenko, O.E.; Skiba, V.I.; Sidorov, N.V.; Efremov, I.N. Growth of heavily doped LiNbO3:Zn crystals. Inorg. Mater. 2015, 51, 375–379. [Google Scholar] [CrossRef]
  75. Konovalova, V.V. Conducting Phases in Ternary Systems Li2O-MO-Nb2O5 (M = Zn, Mg). Ph.D. Thesis, Lomonosov Moscow State University of Fine Chemical Technologies, Moscow, Russia, 2009. [Google Scholar]
  76. Ferriol, M.; Dakki, A.; Cohen-Adad, M.T.; Foulon, G.; Brenier, A.; Boulon, G. Growth and characterization of MgO-doped single-crystal fibers of lithium niobate in relation to high temperature phase equilibria in the ternary system Li2O-Nb2O5-MgO. J. Cryst. Growth 1997, 178, 529–538. [Google Scholar] [CrossRef]
  77. Makarova, O.V.; Palatnikov, M.N.; Biryukova, I.V.; Sidorov, N.V. Impact of a dopant impurity electronic structure on physical properties, defect structure, and features of lithium niobate doping technology. Tech. Phys. 2019, 64, 1872–1878. [Google Scholar] [CrossRef]
  78. Uda, S.; Fukuda, T. Intrinsic LiNbO3 melt species partitioning at the congruent melt composition III. Choice of the growth parameters for the dynamic congruent-state growth. J. Cryst. Growth 1995, 155, 229–239. [Google Scholar] [CrossRef]
  79. Voronko, Y.K.; Gessen, C.B.; Kudriavtsev, A.B.; Sobol, A.A.; Sorokin, E.V.; Uszakov, S.N.; Tsymbal, K.B. Spectroscopy of Oxide Crystals for Quantum Electronics; Nauka: Moscow, Russia, 1991; p. 142. (In Russian) [Google Scholar]
  80. Sobol, A.A. High-Temperature Spectroscopy of Raman Scattering in Solid and Melted Dielectrics. Ph.D. Thesis, Prokhorov General Physics Institute of the Russian Academy of Sciences, Moscow, Russia, 2012. [Google Scholar]
  81. Voronko, Y.K.; Kudryavtsev, A.B.; Osiko, V.V.; Sobol, A.A.; Sorokin, E.V. Investigation of phase transformations in lithium niobate and tantalate using Raman scattering. Phys. Solid State 1987, 29, 1348–1355. (In Russian) [Google Scholar]
  82. Masloboeva, S.M.; Sidorov, N.V.; Palatnikov, M.N.; Arutyunyan, L.G.; Chufyrev, P.G. Niobium (V) oxide doped with Mg2+ and Gd3+ cations: Synthesis and structural studies. Russ. J. Inorg. Chem. 2011, 56, 1194–1198. [Google Scholar] [CrossRef]
  83. Bubnova, R.S. Crystallochemical design of borate materials with a special structure-physical properties. In ICS RAS—80 Years: Modern Problems of Inorganic Chemistry; Shevchenko, V.Y., Ed.; Art-Express: Saint-Petersburg, Russia, 2016; pp. 65–81. (In Russian) [Google Scholar]
  84. Bekker, T.B. Phase Formation and Growth of Crystals in a Quaternary Mutual System Na, Ba, B // O, F. Ph.D. Thesis, V.S. Sobolev Institute of Geology and Mineralogy of the Siberian Branch of the RAS, Novosibirsk, Russia, 2015. [Google Scholar]
  85. Leonjuk, N.I.; Leonjuk, L.I. Crystal Chemistry of Waterless Borates; MSU: Moscow, Russia, 1983; p. 215. (In Russian) [Google Scholar]
  86. Graça, M.P.F.; Ferreira da Silva, M.G.; Valente, M.A. Influence of thermal and thermoelectric treatments on structure and electric properties of B2O3–Li2O–Nb2O5 glasses. J. Non-Cryst. Solids 2008, 354, 901–908. [Google Scholar] [CrossRef]
  87. Palatnikov, M.N. Materials of Electron Technics Based on Ferroelectric Materials and Ceramics Solid Solutions of Niobates-Tantalates of Alkali Metals with Micro- and Nanostructures. Ph.D. Thesis, Tananaev Institute of Chemistry Kola Science Centre of the Russian Academy of Sciences, Apatity, Russia, 2010. [Google Scholar]
  88. Balasanjan, R.N.; Gabrieljan, V.T.; Kazarjan, L.M. Investigation of lithium niobate crystals grown from melt with the K2O impurity. Physics 2000, 100, 134–140. (In Russian) [Google Scholar]
  89. Schirmer, O.F.; Thiemann, O.; Wöhlecke, M. Defects in LiNbO3-I. Experimental aspects. J. Phys. Chem. Solid 1991, 52, 185–200. [Google Scholar] [CrossRef]
  90. Krol, D.M.; Blasse, G.; Powell, R.C. The influence of the Li/Nb ratio on the luminescence properties of LiNbO3. J. Chem. Phys. 1980, 73, 163–166. [Google Scholar] [CrossRef]
  91. Rebouta, L.; da Silva, M.F.; Soares, J.C.; Sanz-Garcia, J.A.; Dieguez, E.; Agullo-Lopez, F. Amorphization and recrystallization of Hf-implanted LiNbO3. Nucl. Instrum. Methods Phys. Res. B 1992, 65, 256–259. [Google Scholar] [CrossRef]
  92. Viting, L.M. High-Temperature Solutions-Melts; MSU: Moscow, Russia, 1991; p. 221. (In Russian) [Google Scholar]
  93. Leonjuk, N.I. Growth of new optical crystals from boron-containing fluxed melts. Crystallogr. Rep. 2008, 53, 511–518. [Google Scholar] [CrossRef]
  94. Voronko, Y.K.; Kudrjavtsev, A.B.; Osiko, V.V.; Sobol, A.A.; Sorokin, E.V. Raman spectroscopy of the Li2O-Nb2O5 melt. Bull. Lebedev Phys. Inst. 1987, 2, 34–36. [Google Scholar]
  95. Abrahams, S.C.; Levinstein, H.J.; Reddy, J.M. Ferroelectric lithium niobate. 5. Polycrystal x-ray diffraction study between 24o and 1200 °C. J. Phys. Chem. Solids 1966, 27, 1019–1026. [Google Scholar] [CrossRef]
  96. Lehnert, H.; Boysen, H.; Frey, F.; Hewat, A.; Radaelli, P. A neutron powder investigation of the high-temperature structure and phase transition in stoichiometric LiNbO3. Z. Kristallogr. Cryst. Mater. 1997, 212, 712–719. [Google Scholar] [CrossRef] [Green Version]
  97. Titov, R.A.; Voskresenskiy, V.M.; Sidorov, N.V.; Teplyakova, N.A.; Palatnikov, M.N. Simulation of crystal structure of LiNbO3 grown with using of B2O3 flux. Phys. Chem. Asp. Study Clust. NanoStruct. Nanomater. 2020, 12, 206–212. [Google Scholar] [CrossRef]
  98. Sidorov, N.V.; Serebryakov, Y.A. Investigation of structural peculiarities of impure lithium niobate crystals by Raman spectroscopy. Vibr. Spectrosc. 1994, 6, 215–223. [Google Scholar] [CrossRef]
  99. Xue, D.; Kitamura, K.; Wang, J. Atomic packing and octahedral linking model of lithium niobate single crystals. Opt. Mater. 2003, 23, 399–402. [Google Scholar] [CrossRef]
Figure 1. (a)—shape and accumulation of “channel” macrodefects at the bottom of the LiNbO3:B (~3.50 × 10⁻⁵ wt% in a crystal cone) crystalline boule; (b)—a separate macrodefect of the “channel” type in the LiNbO3:B (~6.20 × 10⁻⁵ wt% in a crystal cone) crystal; (c,d)—individual macrodefects of the “channel” type in the LiNbO3:B (~6.0 × 10⁻⁵ wt% in a crystal cone) crystal; (e)—macrodefects of the “channel” type in the LiNbO3:B (0.1 wt% in the charge) crystal.
Crystals 11 00458 g001
Figure 2. Optical deviations and macrodefects in the form of “channels” in crystals LiNbO3:B: (a)—(~6.20 × 10⁻⁵ wt% [B] in the crystal cone, density of “channels” ~1.7 pcs/mm2); (b)—(~6.20 × 10⁻⁵ wt% [B] in the cone of the crystal, the density of “channels” ~3.8 pcs/mm2); (c)—(~1.44 × 10⁻⁵ wt% [B] in the cone of the crystal, the density of “channels” ~5.6 pcs/mm2), (d)—(~6.20 × 10⁻⁵ wt% [B] in the cone of the crystal, the density of “channels” ~5.6 pcs/mm2), after heat treatment; (e)—(~6.20 × 10⁻⁵ wt% [B] in the cone of the crystal), after transformation into a single-domain state; (f)—(~1.1 × 10⁻⁴ wt% [B] in the cone of the crystal), after transformation into a single-domain state. All images are taken in DIC mode.
Crystals 11 00458 g002
Figure 3. (a)—cellular growth in the bottom of the LiNbO3:B boule grown using technological parameters typical for the growth of LiNbO3:Me (Me: Zn, Mg) crystals; (b)—change in the diameter of the LiNbO3:B crystalline boule due to changes in thermal conditions at the crystallization front.
Crystals 11 00458 g003
Figure 4. Raman spectra of SLN (1), CLN (2), and LiNbO3:B (0.55 (3), 0.69 (4), 0.83 (5), 1.24 (6) mol%) in the different scattering geometries - Y(ZX)Ȳ (a) and Y(ZZ)Ȳ (b). Figure is reproduced with the permission of Pleiades Publishing from the paper N. V. Sidorov et al., Opt. Spectrosc. 2016 V. 121 P. 36–44, DOI: https://0-doi-org.brum.beds.ac.uk/10.1134/S0030400X16070195 (accessed on 26 March 2021).
Crystals 11 00458 g004
Figure 5. Raman spectra fragments of the crystals SLN (1), CLN (2), and LiNbO3:B (0.55 (3), 0.69 (4), 0.83 (5), 1.24 (6) mol%) in the scattering geometries Y(ZX)Ȳ and Y(ZZ)Ȳ. Figure is reproduced with the permission of Pleiades Publishing from the paper N. V. Sidorov et al., Opt. Spectrosc. 2016 V. 121 P. 36–44, DOI: https://0-doi-org.brum.beds.ac.uk/10.1134/S0030400X16070195 (accessed on 26 March 2021).
Crystals 11 00458 g005
Figure 6. Concentration dependences of (a) width (S), (b) intensity (I), and PILS opening angle (θ) of 576 and 630 cm−1 bands of SLN, CLN and LiNbO3:B (0.55–1.24 mol%) crystals. Figure (a) is reproduced with the permission of Pleiades Publishing from the paper N. V. Sidorov et al., Techn. Phys. 2018 V. 63 P. 1758–1766, DOI: https://0-doi-org.brum.beds.ac.uk/10.1134/S1063784218120198 (accessed on 26 March 2021); Figure (b) is reproduced with the permission of Pleiades Publishing from the paper N. V. Sidorov et al., Opt. Spectrosc. 2016 V. 121 P. 36–44, DOI: https://0-doi-org.brum.beds.ac.uk/10.1134/S0030400X16070195 (accessed on 26 March 2021).
Crystals 11 00458 g006
Figure 7. IR absorption spectra of crystals SLN (1), CLN (2) and LiNbO3:B (0.55 (3), 0.69 (4), 0.83 (5), mol%). The figure is reproduced with the permission of Pleiades Publishing from the paper N. V. Sidorov et al., Techn. Phys. 2020 V. 65 P. 627–634, DOI: https://0-doi-org.brum.beds.ac.uk/10.1134/S1063784220040192 (accessed on 26 March 2021).
Crystals 11 00458 g007
Figure 8. PILS speckle-structure (p = 160 mW) after 60 s of irradiation and conoscopic patterns (p = 1 and 90 mW) of SLN (1), CLN (2) and LiNbO3:B (0.55 (3), 0.69 (4), 0.83 (5), 1.24 (6) mol%). The figure is reproduced with the permission of Pleiades Publishing from the paper N. V. Sidorov et al., Techn. Phys. 2018 V. 63 P. 1758–1766, DOI: https://0-doi-org.brum.beds.ac.uk/10.1134/S1063784218120198 (accessed on 26 March 2021).
Crystals 11 00458 g008
Figure 9. Absorption spectra of SLN (1), CLN (2) and LiNbO3:B (0.55 (3), 0.83 (4) mol%). The figure is reproduced with the permission of Pleiades Publishing from the paper N. V. Sidorov et al., Techn. Phys. 2020 V. 65 P. 627–634, DOI: https://0-doi-org.brum.beds.ac.uk/10.1134/S1063784220040192 (accessed on 26 March 2021).
Crystals 11 00458 g009
Figure 10. Angle distribution of scattered radiation intensity at excitation λ = 476.5 (a), 488.0 (b), 514.5 (c), 530.9 nm (d) for the crystals SLN (1), CLN (2) and LiNbO3:B (0.55 (3), 0.83 (4) mol%). The figure is reproduced with the permission of Pleiades Publishing from the paper N. V. Sidorov et al., Techn. Phys. 2020 V. 65 P. 627–634, DOI: https://0-doi-org.brum.beds.ac.uk/10.1134/S1063784220040192 (accessed on 26 March 2021).
Crystals 11 00458 g010
Figure 11. Dependence of ED (a) and Epv (b) on wavelength for the crystals SLN (1), CLN (2) and LiNbO3:B (0.55 (3), 0.83 (4) mol%). The figure is reproduced with the permission of Pleiades Publishing from the paper N. V. Sidorov et al., Techn. Phys. 2020 V. 65 P. 627–634, DOI: https://0-doi-org.brum.beds.ac.uk/10.1134/S1063784220040192 (accessed on 26 March 2021).
Crystals 11 00458 g011
Figure 12. Polythermal sections of the state diagram of a quasi-ternary system Li2O–Nb2O5–B2O3: LiNbO3–LiBO2 (a), LiNbO3–Li3B2O4.5 (b) [73].
Crystals 11 00458 g012
Figure 13. Two niobium (Nb1, Nb2), two lithium (Li1, Li2), and two vacant (V1, V2) oxygen octahedra forming two tetrahedral voids highlighted in grey. The figure is reproduced with the permission of Pleiades Publishing from the paper N.V. Sidorov et al., J. Struct. Chem. 2021 V. 62 № 2 P. 221–229, DOI: https://0-doi-org.brum.beds.ac.uk/10.1134/S0022476621020050 (accessed on 26 March 2021).
Crystals 11 00458 g013
Figure 14. The total energy of the Coulomb interaction of point charges in a cluster consisting of two Li+ cations, two Nb5+ cations, one B3+ cations, and twenty O2− anions. A Nb1–B3+ pair is located in tetrahedron face bordering with NbO6 of the first layer; a V1–B3+ pair is located in tetrahedron face bordering a vacant octahedra of the first layer, etc. T = 297 K (1), 523 (2), 773 (3), 1023 (4), 1273 (5), 1473 (6). The figure is reproduced with the permission of Pleiades Publishing from the paper R.A. Titov et al., Techn. Phys., 2021 V. 66 №1 P. 59–66, DOI: https://0-doi-org.brum.beds.ac.uk/10.1134/S1063784221010217 (accessed on 26 March 2021).
Crystals 11 00458 g014
Table 1. Basic parameters of E(TO) bands appearing in Raman spectra of crystals SLN, CLN, and LiNbO3:B (0.55–1.24 mol%) in the Y(ZX)Ȳ scattering geometry. Table is reproduced with the permission of Pleiades Publishing from the paper N. V. Sidorov et al., Techn. Phys. 2018 V. 63 P. 1758–1766, DOI: https://0-doi-org.brum.beds.ac.uk/10.1134/S1063784218120198 (accessed on 26 March 2021).
SLNCLNLiNbO3:B
(0.55 mol%)
LiNbO3:B
(0.69 mol%)
LiNbO3:B
(0.83 mol%)
LiNbO3:B
(1.24 mol%)
νSνSνSνSνSνS
15271521215271529152915210
179
240924011419241112401024011
268102681427013271122701327013
324103241332512324143241432316
371173712337124370243702637126
43410434144329432104321143214
578165761557532576335763357524
611
630 1206262562641628426264662628
876 1208763087525877258752687531
1 Note. 630 and 876 cm−1 bands correspond to A1(TO) and A1(LO) symmetry types phonons, respectively. The phonons are usually inactive in Y(ZX)Ȳ scattering geometry, in our case they appear due to the photorefractive effect. We do not show widths of low-intense 180 and 610 cm−1 bands due to a great error in their determination.
Table 2. Frequencies (ν, cm−1), widths (S, cm−1) and intensities (I, rel. un.) of IR bands; OH-groups concentration (C(OH), cm−3); concentration of NbLi4+ and VLi defects in crystals SLN, CLN, and LiNbO3:B (0.55–1.24 mol%). Table is reproduced with the permission of Pleiades Publishing from papers N. V. Sidorov et al., Techn. Phys. 2020 V. 65 P. 627–634, DOI: https://0-doi-org.brum.beds.ac.uk/10.1134/S1063784220040192 (accessed on 26 March 2021). and R.A. Titov et al., Techn. Phys., 2021 V. 66 №1 P. 59–66, DOI: https://0-doi-org.brum.beds.ac.uk/10.1134/S1063784221010217 (accessed on 26 March 2021).
CrystalIR Bands ParametersLi/NbC(NbLi), mol%C(VLi), mol%C(OH), cm−3
νIS
SLN34650.144.281001.6 × 1017
34800.115.37
34880.078.18
CLN34700.1216.400.9420.983.903.3 × 1017
34830.4924.80
34860.3327.10
LiNbO3:B
(0.55 mol%)
34660.1412.500.9670.552.216.4 × 1017
34800.0817.70
34850.3327.70
LiNbO3:B
(0.69 mol%)
34660.1016.200.9770.391.543.4 × 1017
34810.1320.10
34850.1022.60
LiNbO3:B
(0.83 mol%)
34670.1412.500.9700.502.016.3 × 1017
34800.1219.90
34850.2927.20
Table 3. Photoelectric PILS parameters and bandgap of LN crystals at T = 25 °C. Table is reproduced with the permission of Pleiades Publishing from papers N. V. Sidorov et al., Techn. Phys. 2020 V. 65 P. 627–634, DOI: https://0-doi-org.brum.beds.ac.uk/10.1134/S1063784220040192 (accessed on 26 March 2021).
Crystalθ, °λK, nm∆Eg, eVλ = 532.0 nm, I ~ 6.29 W/cm2
Epv, V/cmED, V/cm
SLN563673.3840551749
* CLN 3283.78500352
LiNbO3:B (0.55 mol%)143673.385458572
LiNbO3:B (0.83 mol%)223683.37555425
* PILS indicatrix does not open for CLN even at exciting radiation I ~ 6.29 W/cm2.
Table 4. Concentration characteristics of LN doped with dopants with different electronic configuration. Table is reproduced with the permission of Pleiades Publishing from the paper O.V. Makarova et al., Techn. Phys. 2019 V. 64 P. 1872–1878, DOI: https://0-doi-org.brum.beds.ac.uk/10.1134/S1063784219120168 (accessed on 26 March 2021).
ElementB, 0.12 wt% in the MeltMg, 0.93 wt% in the MeltZn, 3.04 wt% in the MeltCe, 1.1 wt% in the Melt
Electronic configuration[He] 2s22p1[Ne] 3s2[Ar] 3d104s2[Xe] 4f26s2
Ion radius, pm23 (+3e)66 (+2e)74 (+2e)103.4 (+3e)
Electronegativity2.011.21.601.2
First ionization potential, eV8.297.649.395.65
KD3 × 10−40.90.770.32
∆C, wt%1.2 × 10−60.010.0950
Publisher’s Note: MDPI stays neutral with regard to jurisdictional claims in published maps and institutional affiliations.

