Article

Influences of Process Parameters on the Microstructure and Mechanical Properties of CoCrFeNiTi Based High-Entropy Alloy in a Laser Powder Bed Fusion Process

1
Graduate School of Systems Engineering, Kindai University, 1 Takaya-Umenobe, Higashihiroshima, Hiroshima 739-2116, Japan
2
Fundamental Technology for Next Generation Research Institute, Kindai University, 1 Takaya-Umenobe, Higashihiroshima, Hiroshima 739-2116, Japan
3
Global Research and Innovative Technology Center GRIT, Hitachi Metals, Ltd. 5200 Mikajiri, Kumagaya, Saitama 360-8577, Japan
4
Additive Manufacturing Solution Center, Advanced Metal Division, Hitachi Metals, Ltd., 2-14-13 Tenjin, Chuo-ku, Fukuoka 810-0001, Japan
*
Author to whom correspondence should be addressed.
Submission received: 20 April 2021 / Revised: 13 May 2021 / Accepted: 13 May 2021 / Published: 14 May 2021

Abstract

:
Recently, high-entropy alloys (HEAs) have attracted much attention because of their superior properties, such as high strength and corrosion resistance. This study aimed to investigate the influences of process parameters on the microstructure and mechanical properties of CoCrFe NiTiMo HEAs using a laser-based powder bed fusion (LPBF) process. In terms of laser power and scan speed, a process map was constructed by evaluating the density and surface roughness of the as-built specimen to optimize the process parameters of the products. The mechanical properties of the as-built specimens fabricated at the optimum fabrication condition derived from the process map were evaluated. Consequently, the optimum laser power and scan speed could be obtained using the process map evaluated by density and surface roughness. The as-built specimen fabricated at the optimum fabrication condition presented a relative density of more than 99.8%. The microstructure of the as-built specimen exhibited anisotropy along the build direction. The tensile strength and elongation of the as-built specimen were around 1150 MPa and more than 20%, respectively.

1. Introduction

Additive manufacturing (AM), particularly powder bed fusion (PBF), is extensively applied to manufacture complex-shaped products that are difficult to obtain using other metal processes in the aerospace and medical fields [1,2,3,4]. Metallic materials such as stainless steel, titanium alloys, Ni-based superalloys, and aluminum alloys have been widely utilized in AM fields [5]. These materials fabricated using the AM process have high strength, which is equivalent to the wrought materials. Besides, the development of high strength, high heat resistance, and high corrosion resistance alloys are required. High-entropy alloys (HEAs) have recently gained attention as one candidate [6,7].
HEAs were proposed by Yeh et al. [8] and Cantor et al. [9] in 2004. HEAs are defined as alloys composed of five or more multiple principal elements with equiatomic or near equiatomic percentages [6,7]. Thus, various HEAs have been developed, and the material design and material characteristics of HEAs have been actively reported [7,10,11,12,13,14,15,16]. However, it is difficult to manufacture HEA products by conventional processes such as casting or machining. Recently, AM technology capable of manufacturing complex-shaped products has been recognized as a promising production process [17]. The microstructures, mechanical properties, and corrosion properties of the HEAs produced via powder bed fusion (PBF), directed energy deposition (DED), and binder jetting (BJT) have been reviewed [17,18,19,20,21].
Many HEAs have been developed based on the Cantor (CA) alloy, an equiatomic alloy composed of Fe, Cr, Mn, Ni, and Co proposed by Cantor et al. [9]. The CA alloy with FCC single-phase shows excellent mechanical properties and corrosion resistance compared to other alloys such as stainless steel and Ni-based superalloys [7]. Moreover, new HEAs have been developed using the AM process by adding Cu, Al, Ti, and other elements into the CA alloy [17,18]. Brif et al. [22] assessed the microstructures and tensile properties of the FeCoCrNi HEA fabricated by LPBF. Regarding the CA alloy, Johnson et al. [23] investigated the fabrication condition by creating a process map. The strengthening mechanism of microstructure and the effect of heat treatment on the microstructure and mechanical properties of the alloy were investigated [24,25,26,27,28,29,30,31,32,33]. Shiratori et al. [34] studied the relationship between microstructures and mechanical properties of the AlCoCrFeNi HEA formed by the electron beam powder bed fusion (EPBF) process. Kuwabara et al. [35] investigated the microstructure, mechanical properties, and corrosion resistance of the AlCoCrFeNi HEA fabricated by EPBF. Karlsson et al. [36] constructed AlCoCrFeNi alloy strengthened by a hierarchical microstructure with nano-sized precipitates using the BJT process and heat treatment. Sun et al. [37] explored the hot tearing mechanisms of CoCrFeNi HEA manufactured by LPBF. Ishimoto et al. [38] developed new TiNbTaZrMo HEA for bio-materials using the LPBF process.
Concerning the CoCrFeNiTi HEA treated in this work, Fujieda et al. [39] studied the microstructure, mechanical properties, and corrosion resistance of CoCrFeNiTi HEA fabricated by EPBF. In addition, Fujieda et al. [40] compared the mechanical properties and corrosion resistance of CoCrFeNiTi HEA fabricated by EPBF and LPBF. However, they did not investigate the influence of the process parameters on the microstructure or mechanical properties.
An investigation of the impacts of process parameters on density, microstructure, and mechanical properties is essential to assure the quality of the parts. Therefore, the relationship between the process parameters and the density, microstructure, and mechanical properties was vigorously investigated. The (volumetric) energy density, E, which is one of the important process parameters, affects the microstructure remarkably, for instance, grain size and grain growth. The increase in energy density results in grain growth direction aligned with build direction [41,42,43,44,45] and decreased porosity [44,46,47,48]. However, the energy density poorly predicts the melt pool behavior, as reported as a limitation of energy density as a process parameter, according to Bertoli et al. [49,50]. Therefore, practically, laser power and scan speed, which are the main process parameters, are applied to fabricate sound parts and are determined using a process map [47,48,51,52,53]. The authors reported on the creation of process maps in various alloys [47,48].
In this study, the influences of process parameters of LPBF on the density and microstructure of CoCrFeNiTiMo HEA were investigated experimentally, and the mechanical properties of the alloy fabricated at the optimum condition were evaluated.

2. Experimental Procedures

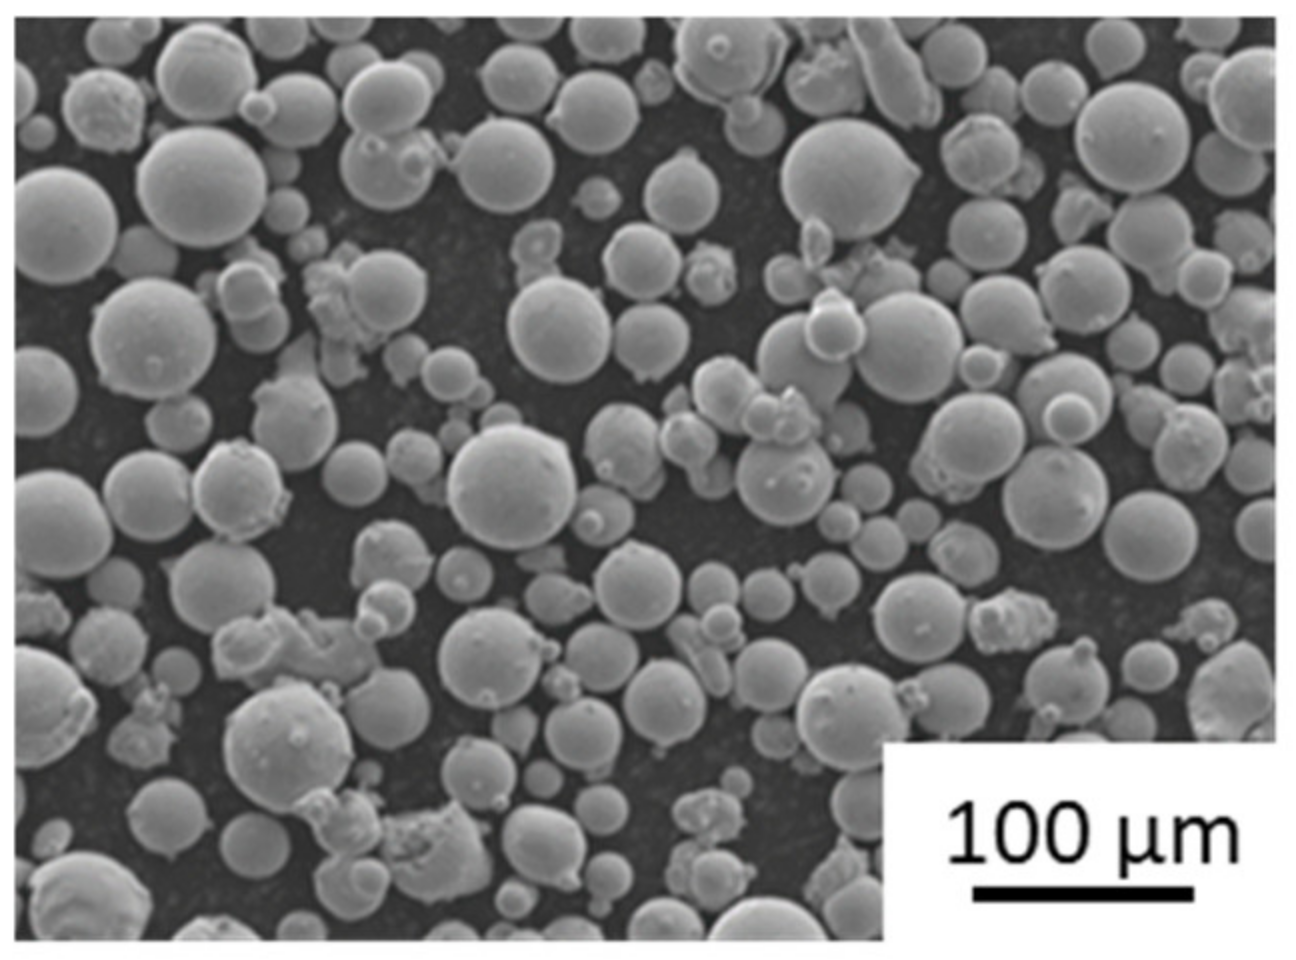
2.1. Machine and Powder

A LPBF machine equipped with a 1 kW single-mode fiber laser and gas-atomized CoCrFeNiTiMo HEA powder was employed. The LPBF machine was a prototype one. A scanning electron microscopy (SEM) image and the chemical composition of the HEA powder are shown in Figure 1 and Table 1, respectively. The D10, D50, and D90 values in the particle size distribution measured using laser diffraction particle size distribution were 19.4, 34.3, and 57.4 µm, respectively.

2.2. Fabrication Conditions

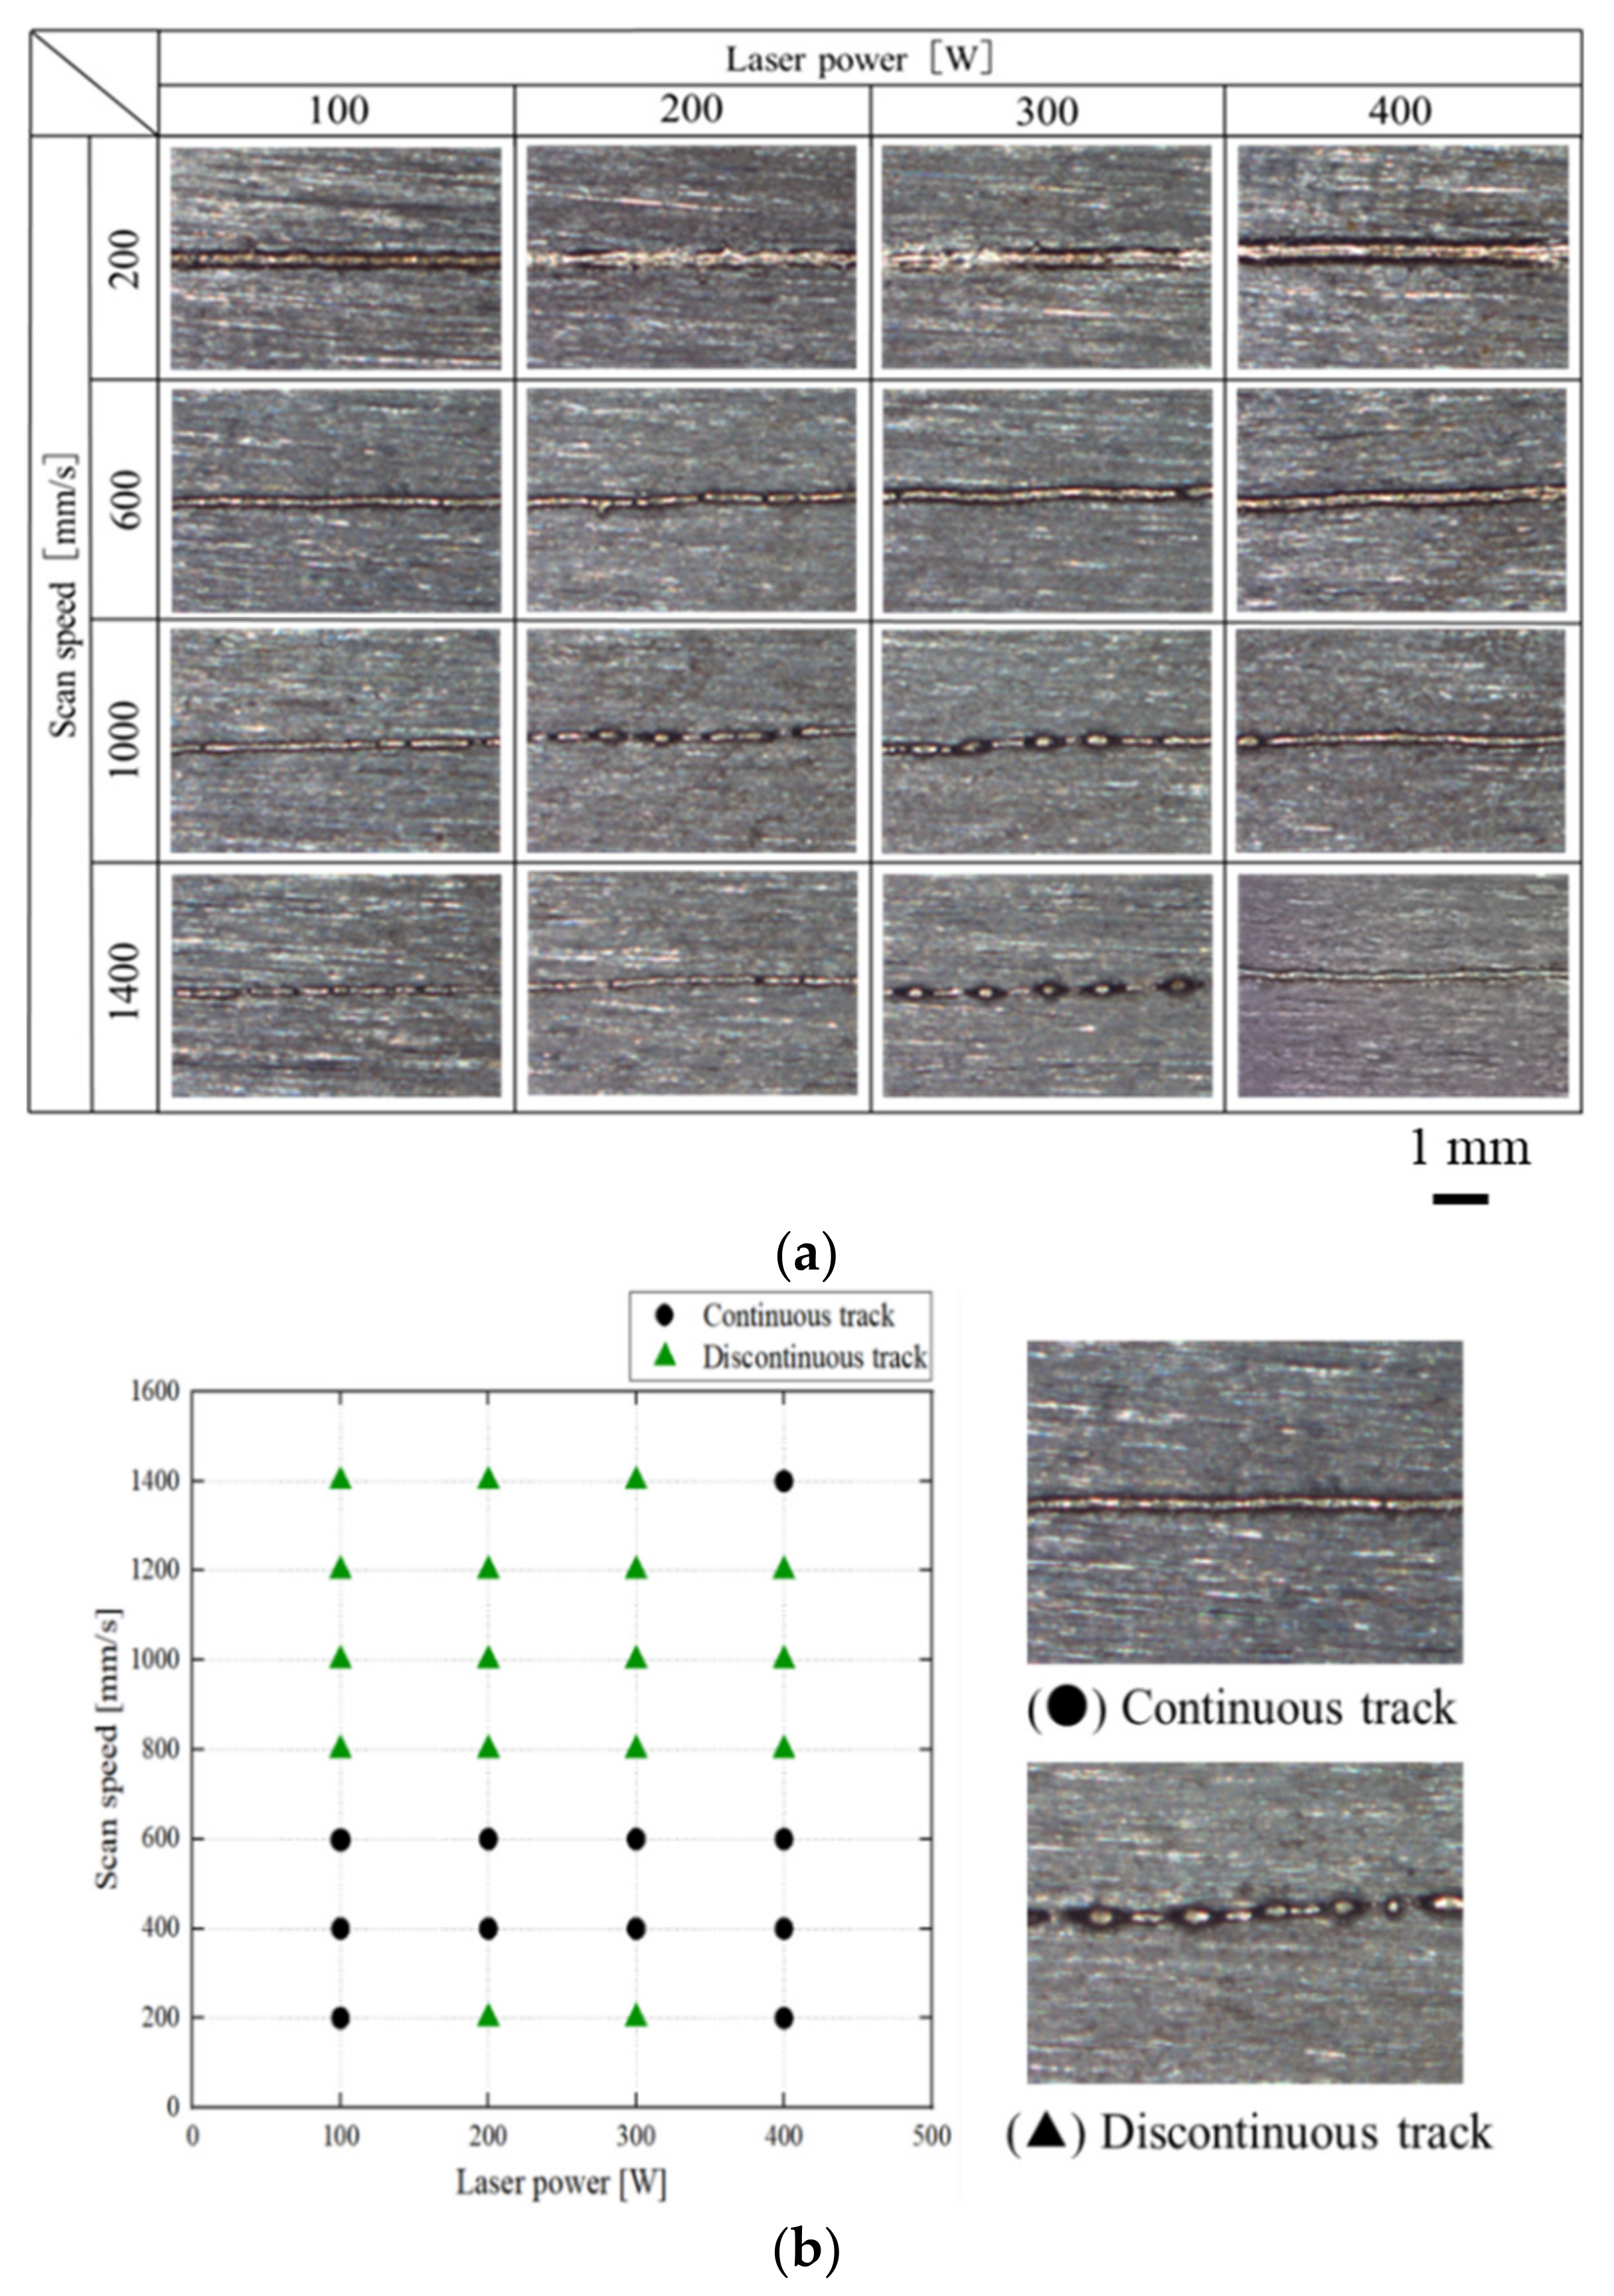
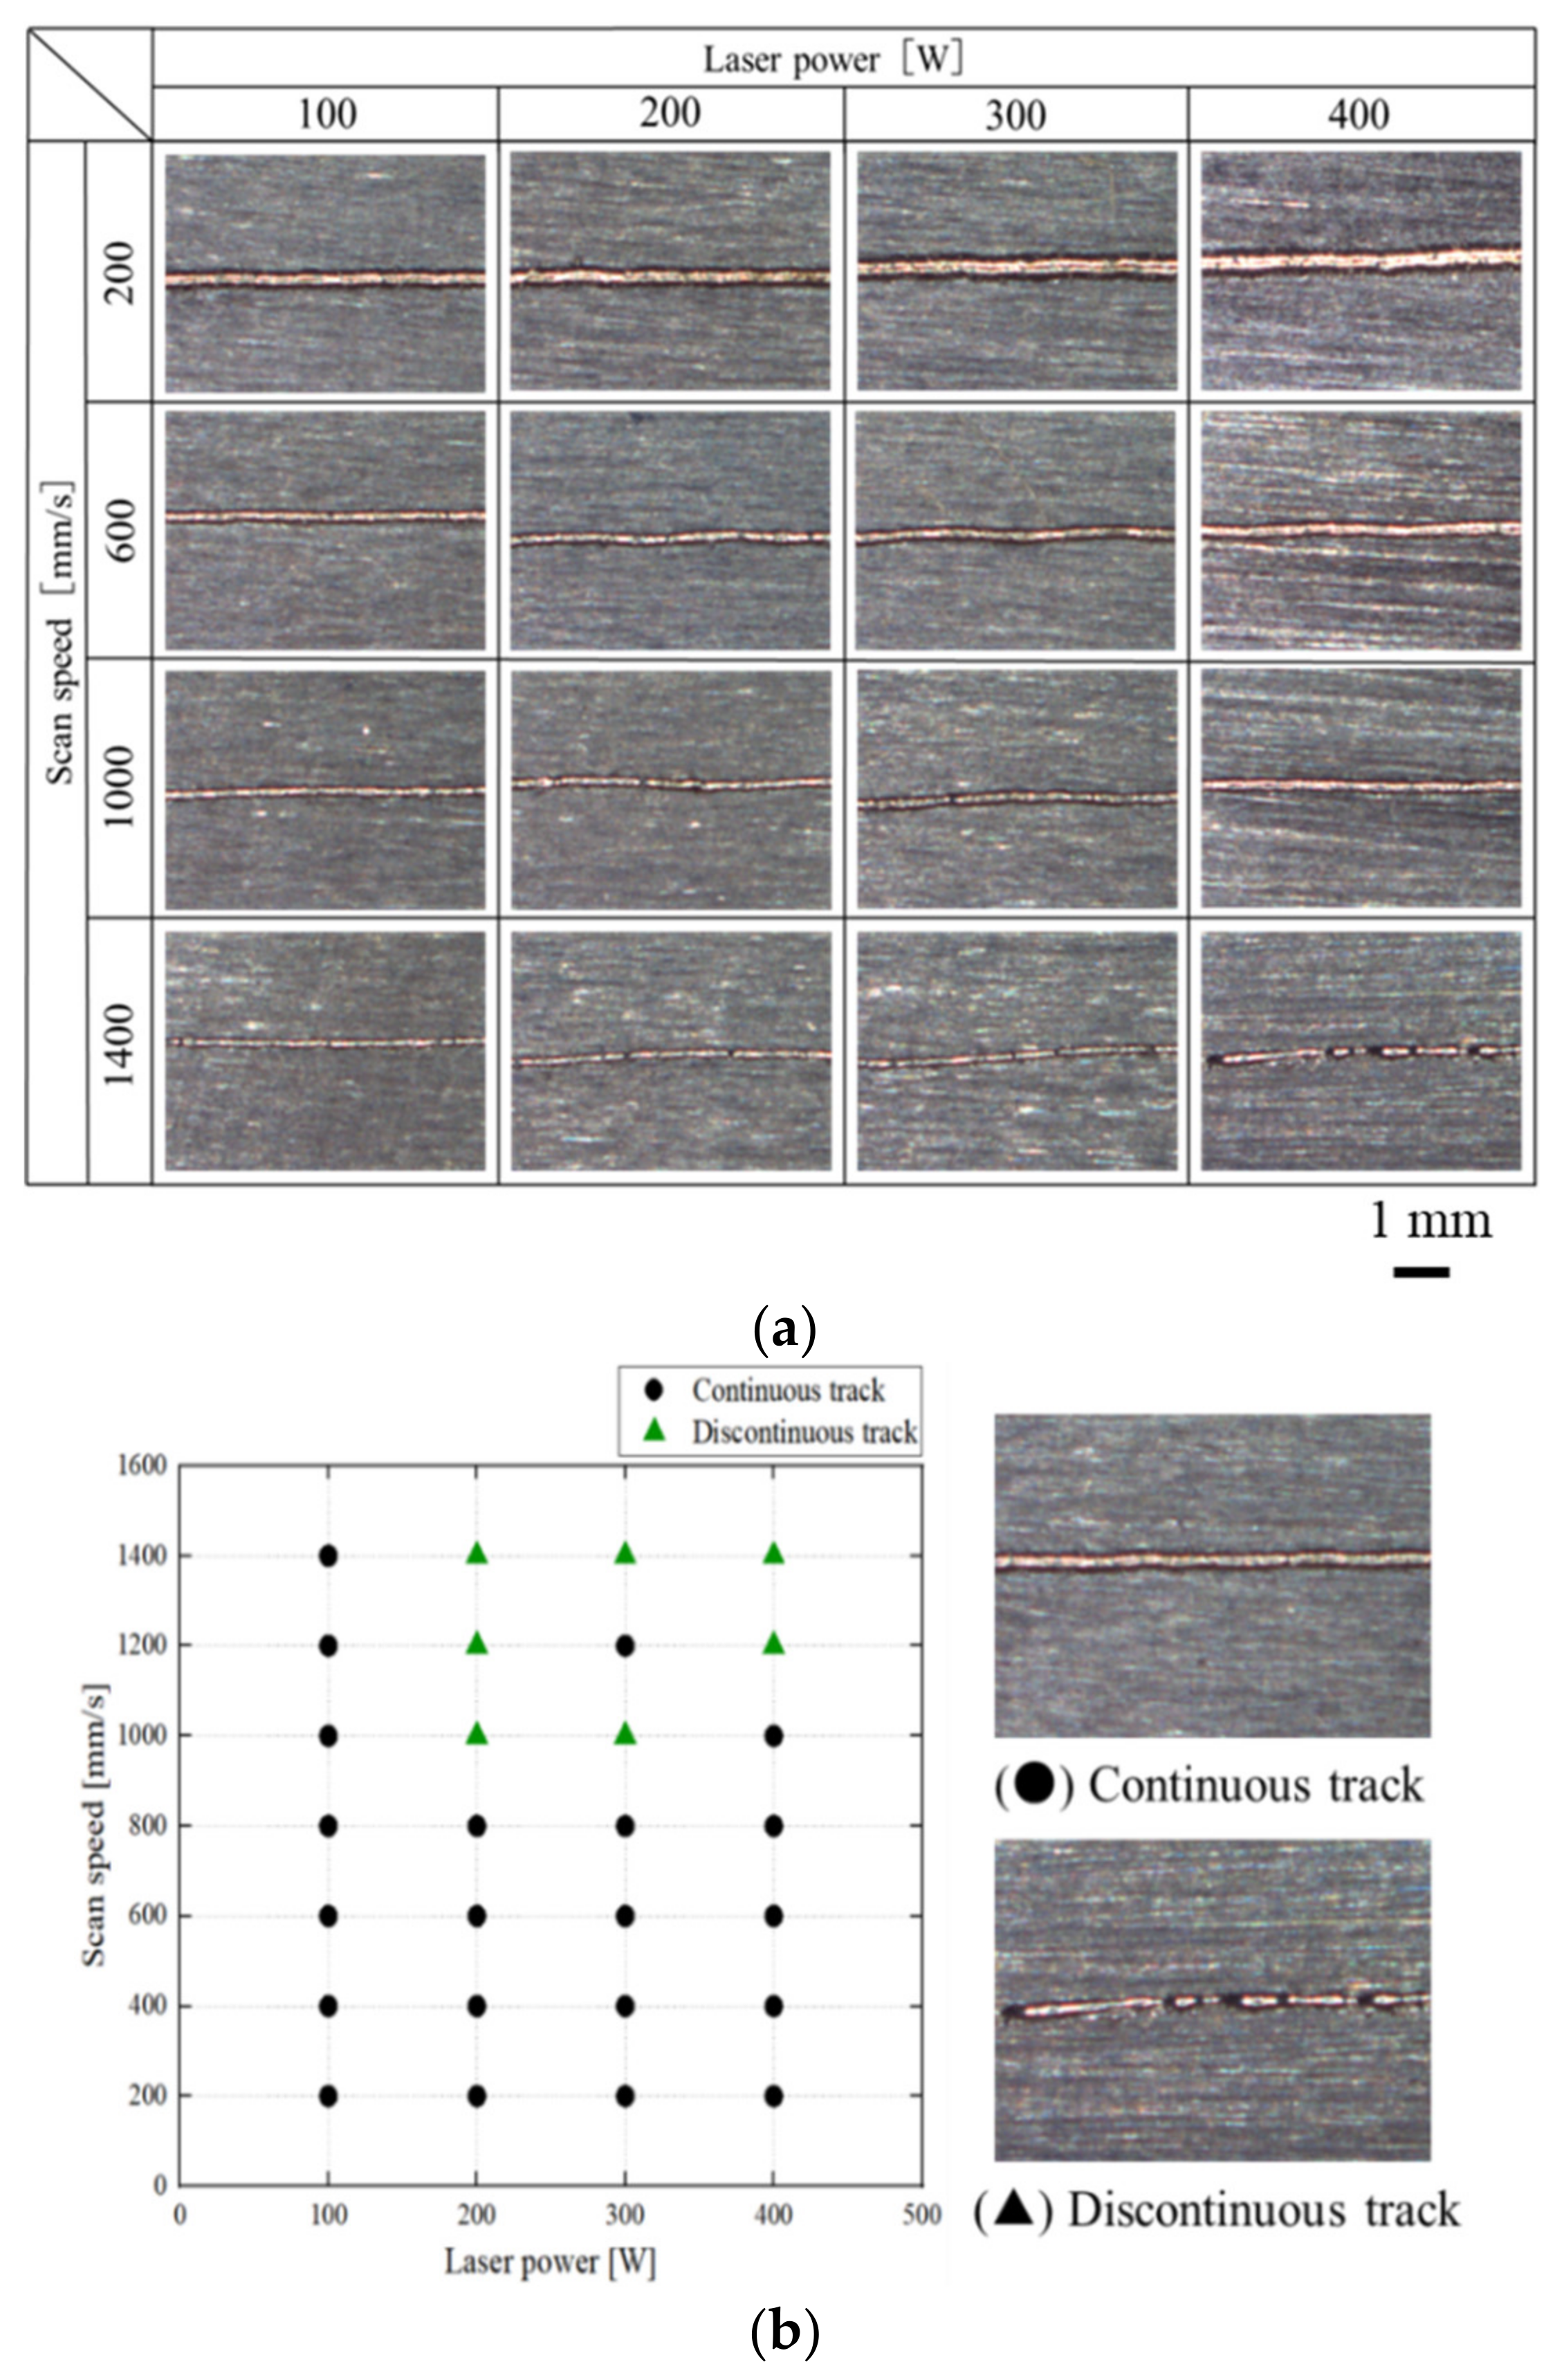
2.2.1. Single Track Formation

It is essential to reveal the optimum fabrication conditions to manufacture high-quality parts. At first, the effect of laser power and scan speed on the single track was examined using the morphology of a single track (length: 10 mm) constructed using conditions described in Table 2 to reveal a moderate fabrication condition. Besides, the effect of laser spot size was investigated. The energy density EL (J/mm2) was calculated by Equation (1):
EL = P/vd,
where P is the laser power (W), v is the scan speed (mm/s), and d is the laser spot diameter (mm).

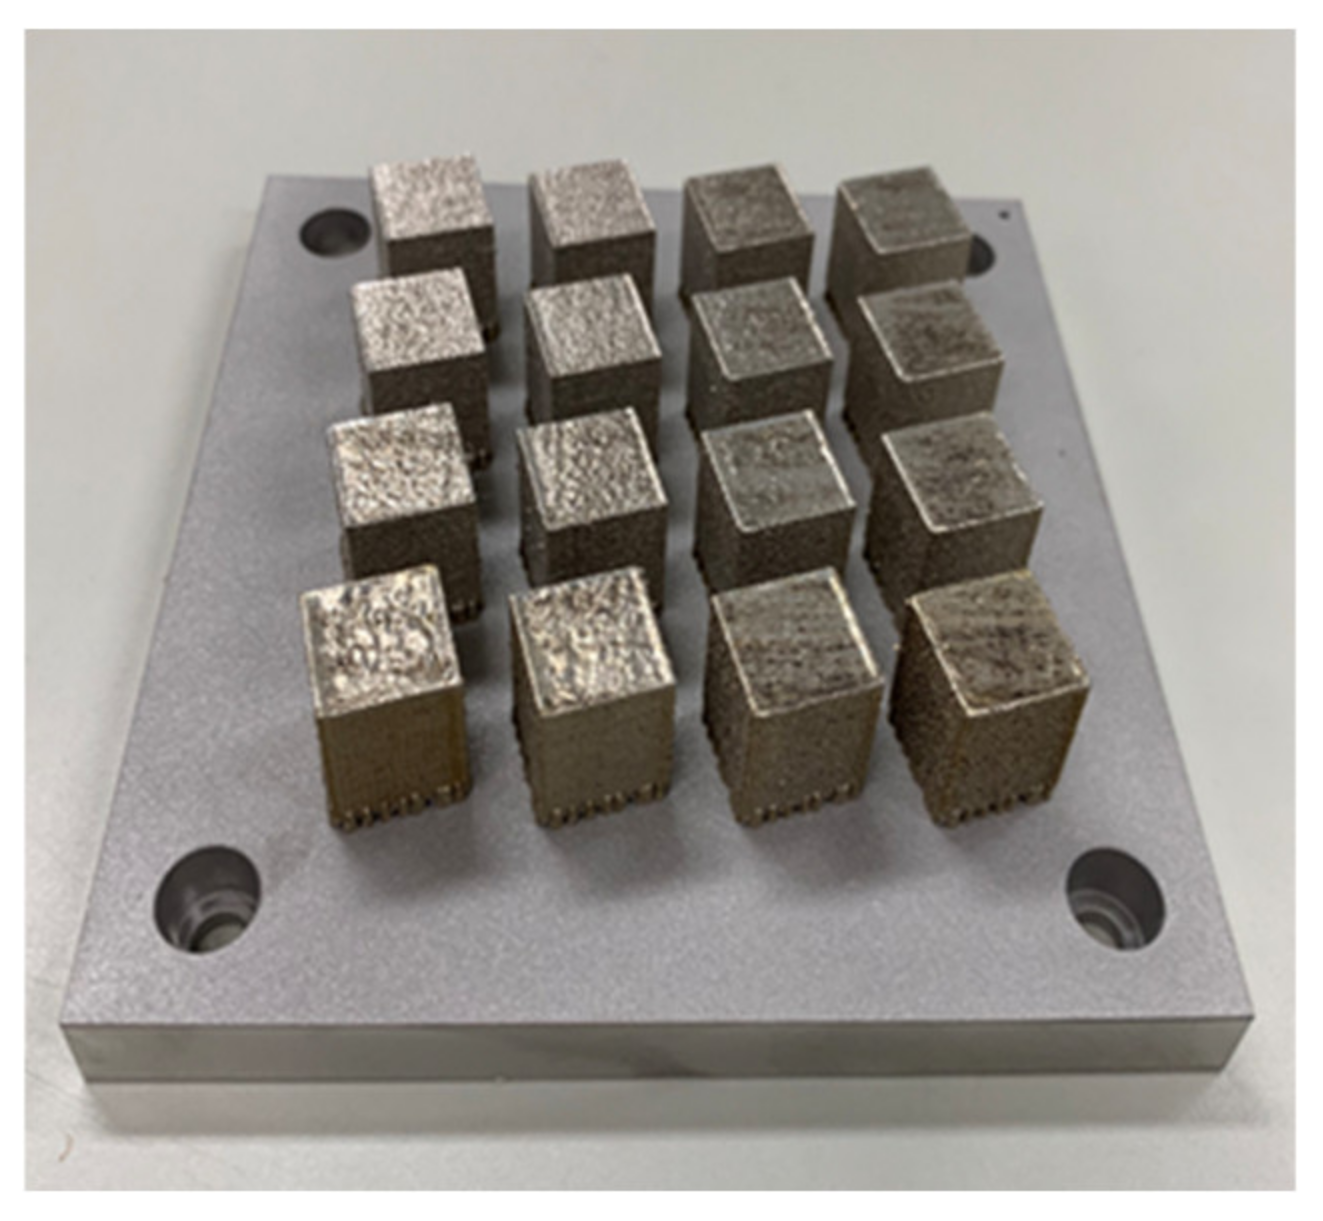
2.2.2. Fabrication of Cubic Specimens

The optimum fabrication condition was investigated using cubic specimens formed at the moderate conditions of laser power and scan speed obtained by the process map of single tracks. Cubic specimens with dimensions of 15 mm × 15 mm × 15 mm (Figure 2) were assembled using the conditions described in Table 3 to examine the density and microstructure. The (volumetric) energy density E (J/mm3) was calculated by Equation (2):
E = P/vht
where P is the laser power (W), v is the scan speed (mm/s), h is the hatch pitch (mm), and t is the layer thickness (mm).

2.3. Experimental Method

The density of the as-built specimens was measured with the Archimedes method. The relative density was calculated according to the reference density of 8.02 g/cm3. The microstructures of the as-built specimens were observed with an optical microscope (OM) after electrolytic etching in 10% oxalic acid solution. The surface texture was measured by coherence scanning interferometry (CSI) equipment (Zygo newview 9000). The surface texture of the printed final layer was measured without finishing. The microstructures of the specimens were observed with an SEM (JEOL JSM-7800F) equipped with energy-dispersive X-ray spectroscopy (EDS) and electron backscatter diffraction (EBSD) modules. In addition, an X-ray diffraction (XRD; Cu-Kα1 radiation) apparatus (Rigaku SmartLab_SE) was employed to analyze the phase of the microstructure. The tensile tests were conducted at room temperature.

3. Results and Discussion

3.1. Investigation of Process Parameters

3.1.1. Investigation of Process Parameters by Single Track Formation

The SEM images of single tracks and the process map in terms of laser power and scan speed evaluated using the morphology of single tracks fabricated by condition I (Laser spot diameter: 0.1 mm) are depicted in Figure 3. The black dot in the process map indicates a continuously stable track, while a black triangle indicates a discontinuously unstable track. The width of a single track became narrower with decreasing laser power and increasing scan speed. The discontinuous track was observed at lower energy density due to the balling effect.
The SEM images of single tracks and the process map in terms of laser power and scan speed evaluated using the morphology of single tracks fabricated by condition II (Laser spot diameter: 0.2 mm) are presented in Figure 4. The width of a single track became narrower with decreasing laser power and increasing scan speed. Compared to the single track fabricated using condition I, the continuously stable tracks were fabricated over a wide region of laser power and scan speed.
Johnson et al. [23] created a process map of CoCrFeMnNi HEA via a finite element thermal model and compared the experimental results obtained with a laser power of 50–200 W and a scan speed of 100–2000 mm/s. A meltpool formed in the conduction mode and solidified into the sound track around a laser power of 100 W and a scan speed of 1000 mm/s. However, the sound track could be fabricated under higher laser power conditions.
Consequently, it was found that the region in laser power and scan speed capable of fabricating a continuously stable track under condition II was wider than that of condition I, and the moderate laser power and scan speed were 100–400 W and 200–800 mm/s, respectively. Therefore, the cubic specimens were fabricated at a laser power of 100–400 W and a scan speed of 200–800 mm/s under the laser spot size of 0.2 mm to construct the process map.

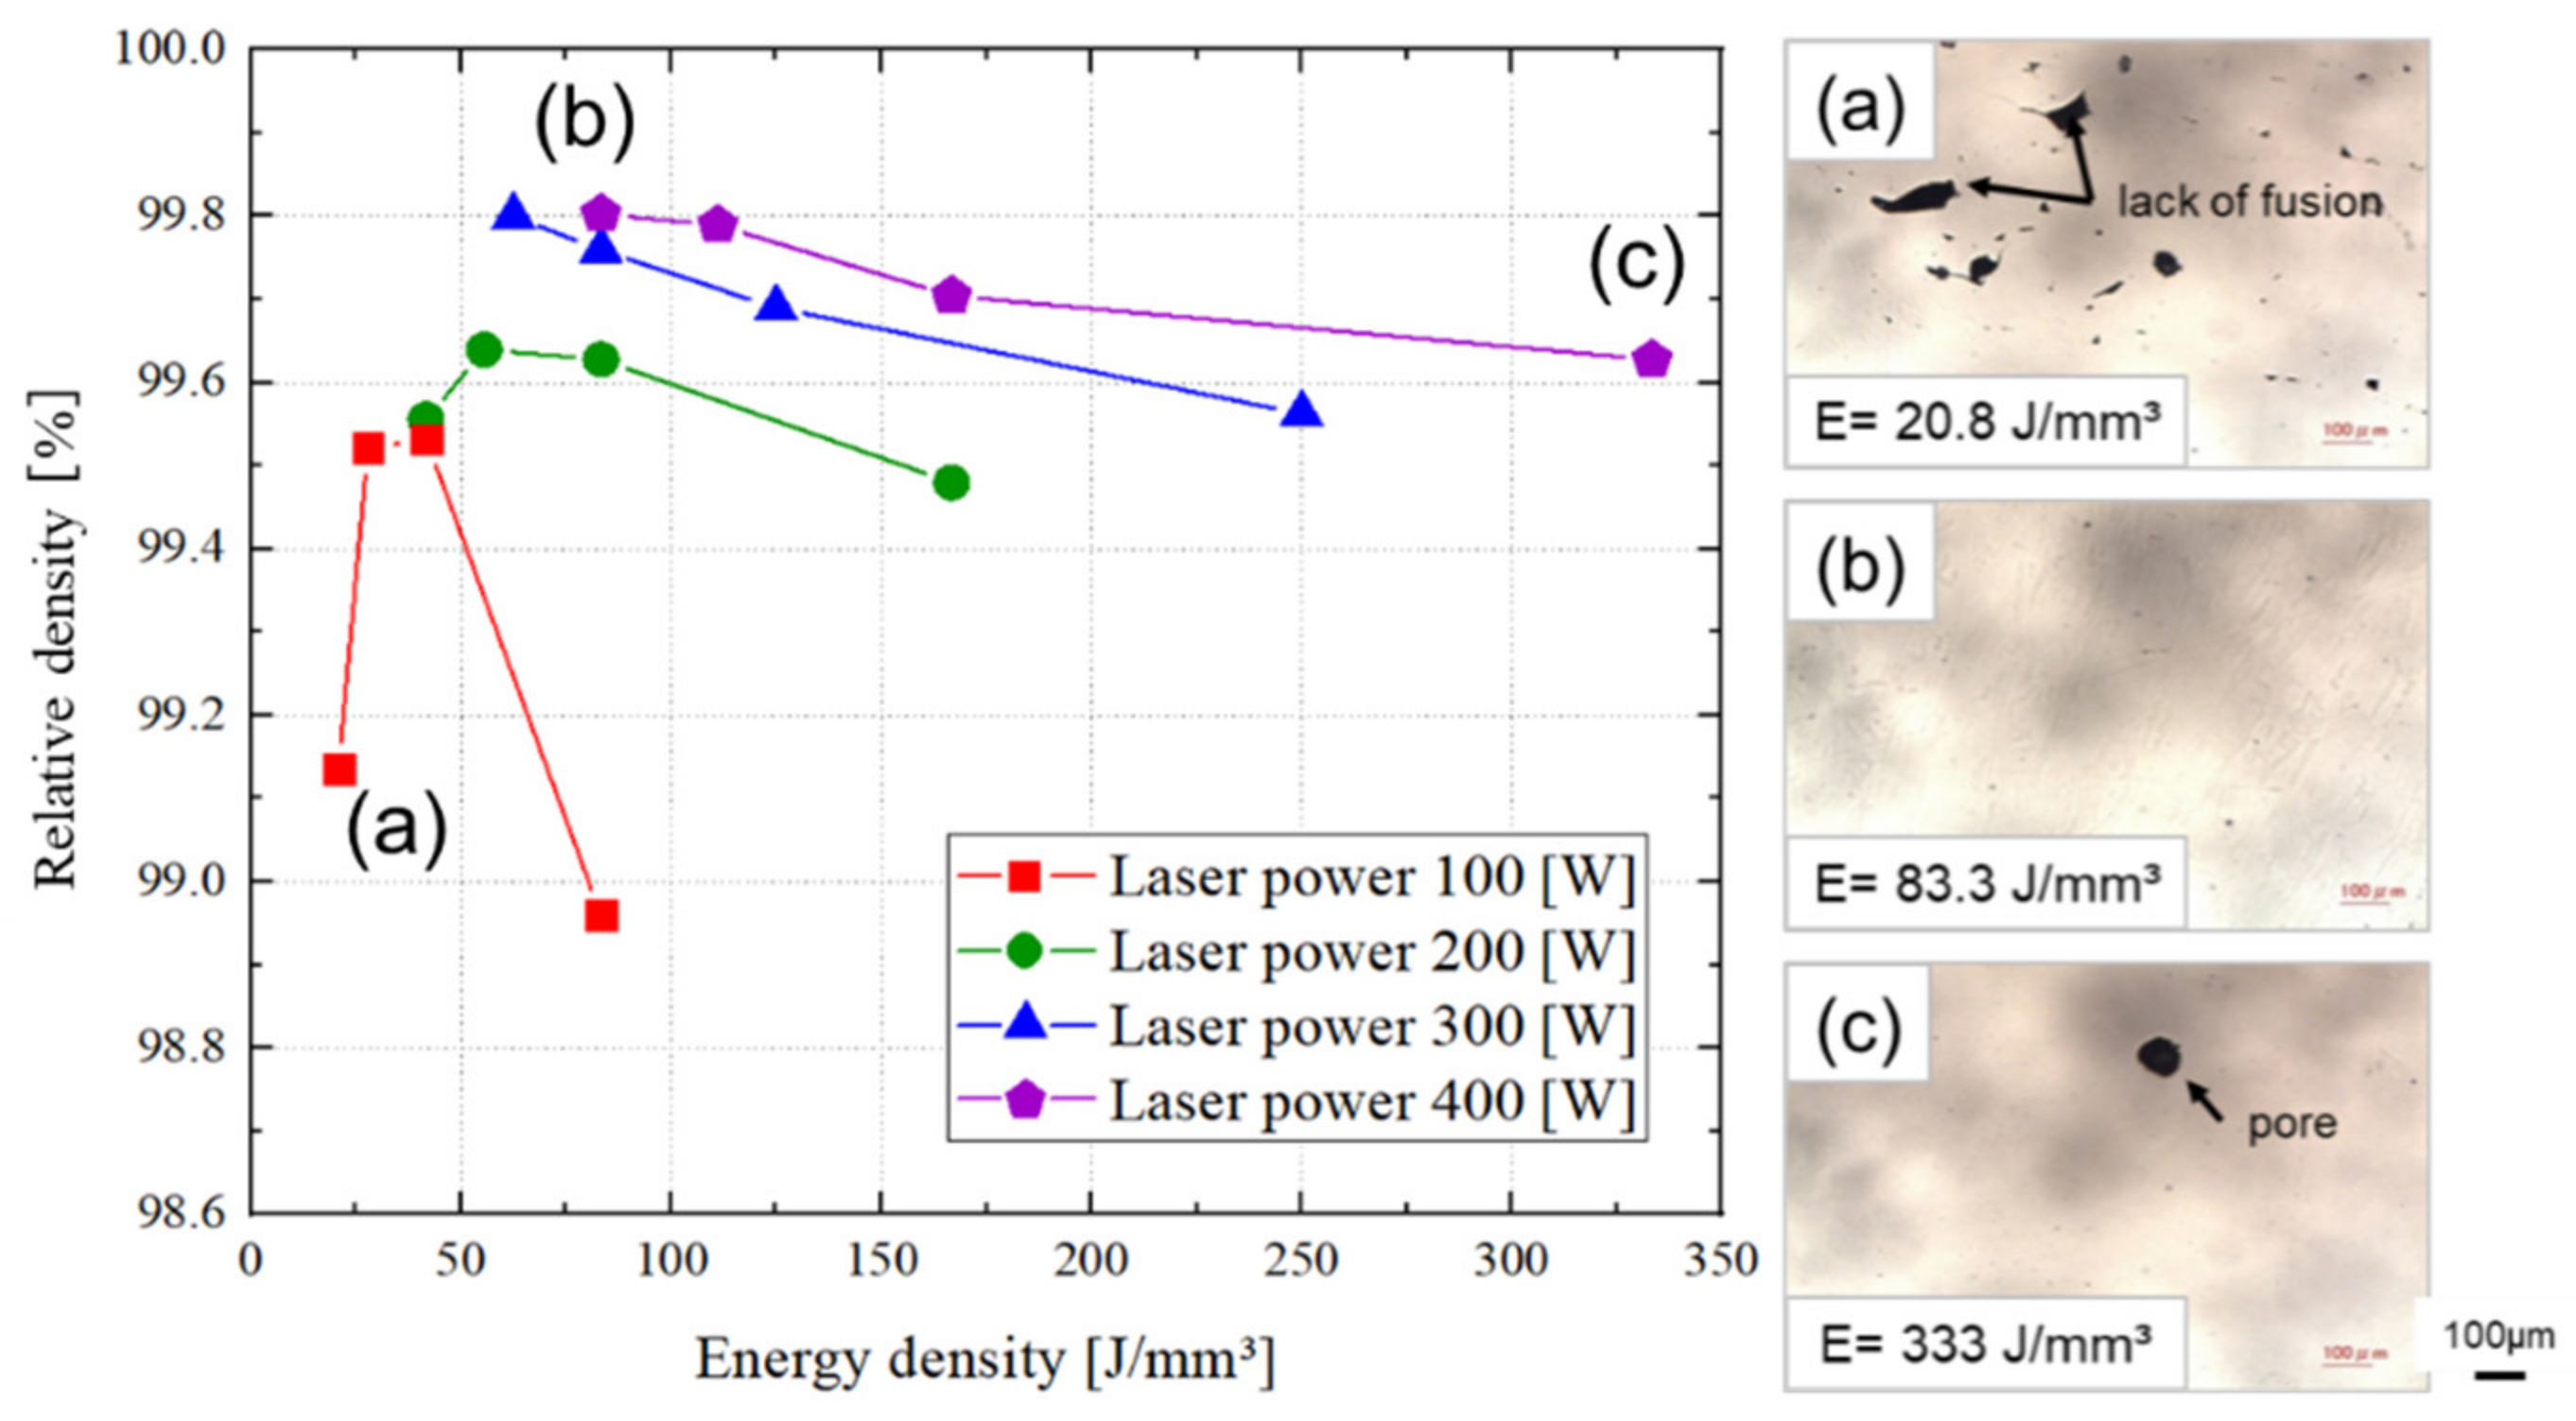
3.1.2. Investigation of Process Parameters by Fabrication of Cubic Specimens

The variation of relative density of the as-built specimens as a function of energy density and the representative optical micrographs are shown in Figure 5. The relative density increased with increasing laser power. The maximum relative density of the as-built specimen fabricated at 300 W and 400 W was 99.8% around an energy density of 60–80 J/mm3. The relative density of the specimen fabricated at 100 W and 200 W showed a peak at lower relative density, while that of the specimens fabricated at 300 W and 400 W decreased with increasing energy density after the maximum value. Many lack-of-fusion defects were observed in the microstructure of the specimen fabricated at E = 20.8 J/mm3 (a), whereas tiny pores were found at E = 83.3 J/mm3 (b). A large pore existed in the microstructure of the specimen fabricated at E = 333 J/mm3 (c). The effect of energy density on the density of specimens was investigated previously [44,46,47,48], and a similar tendency reported.

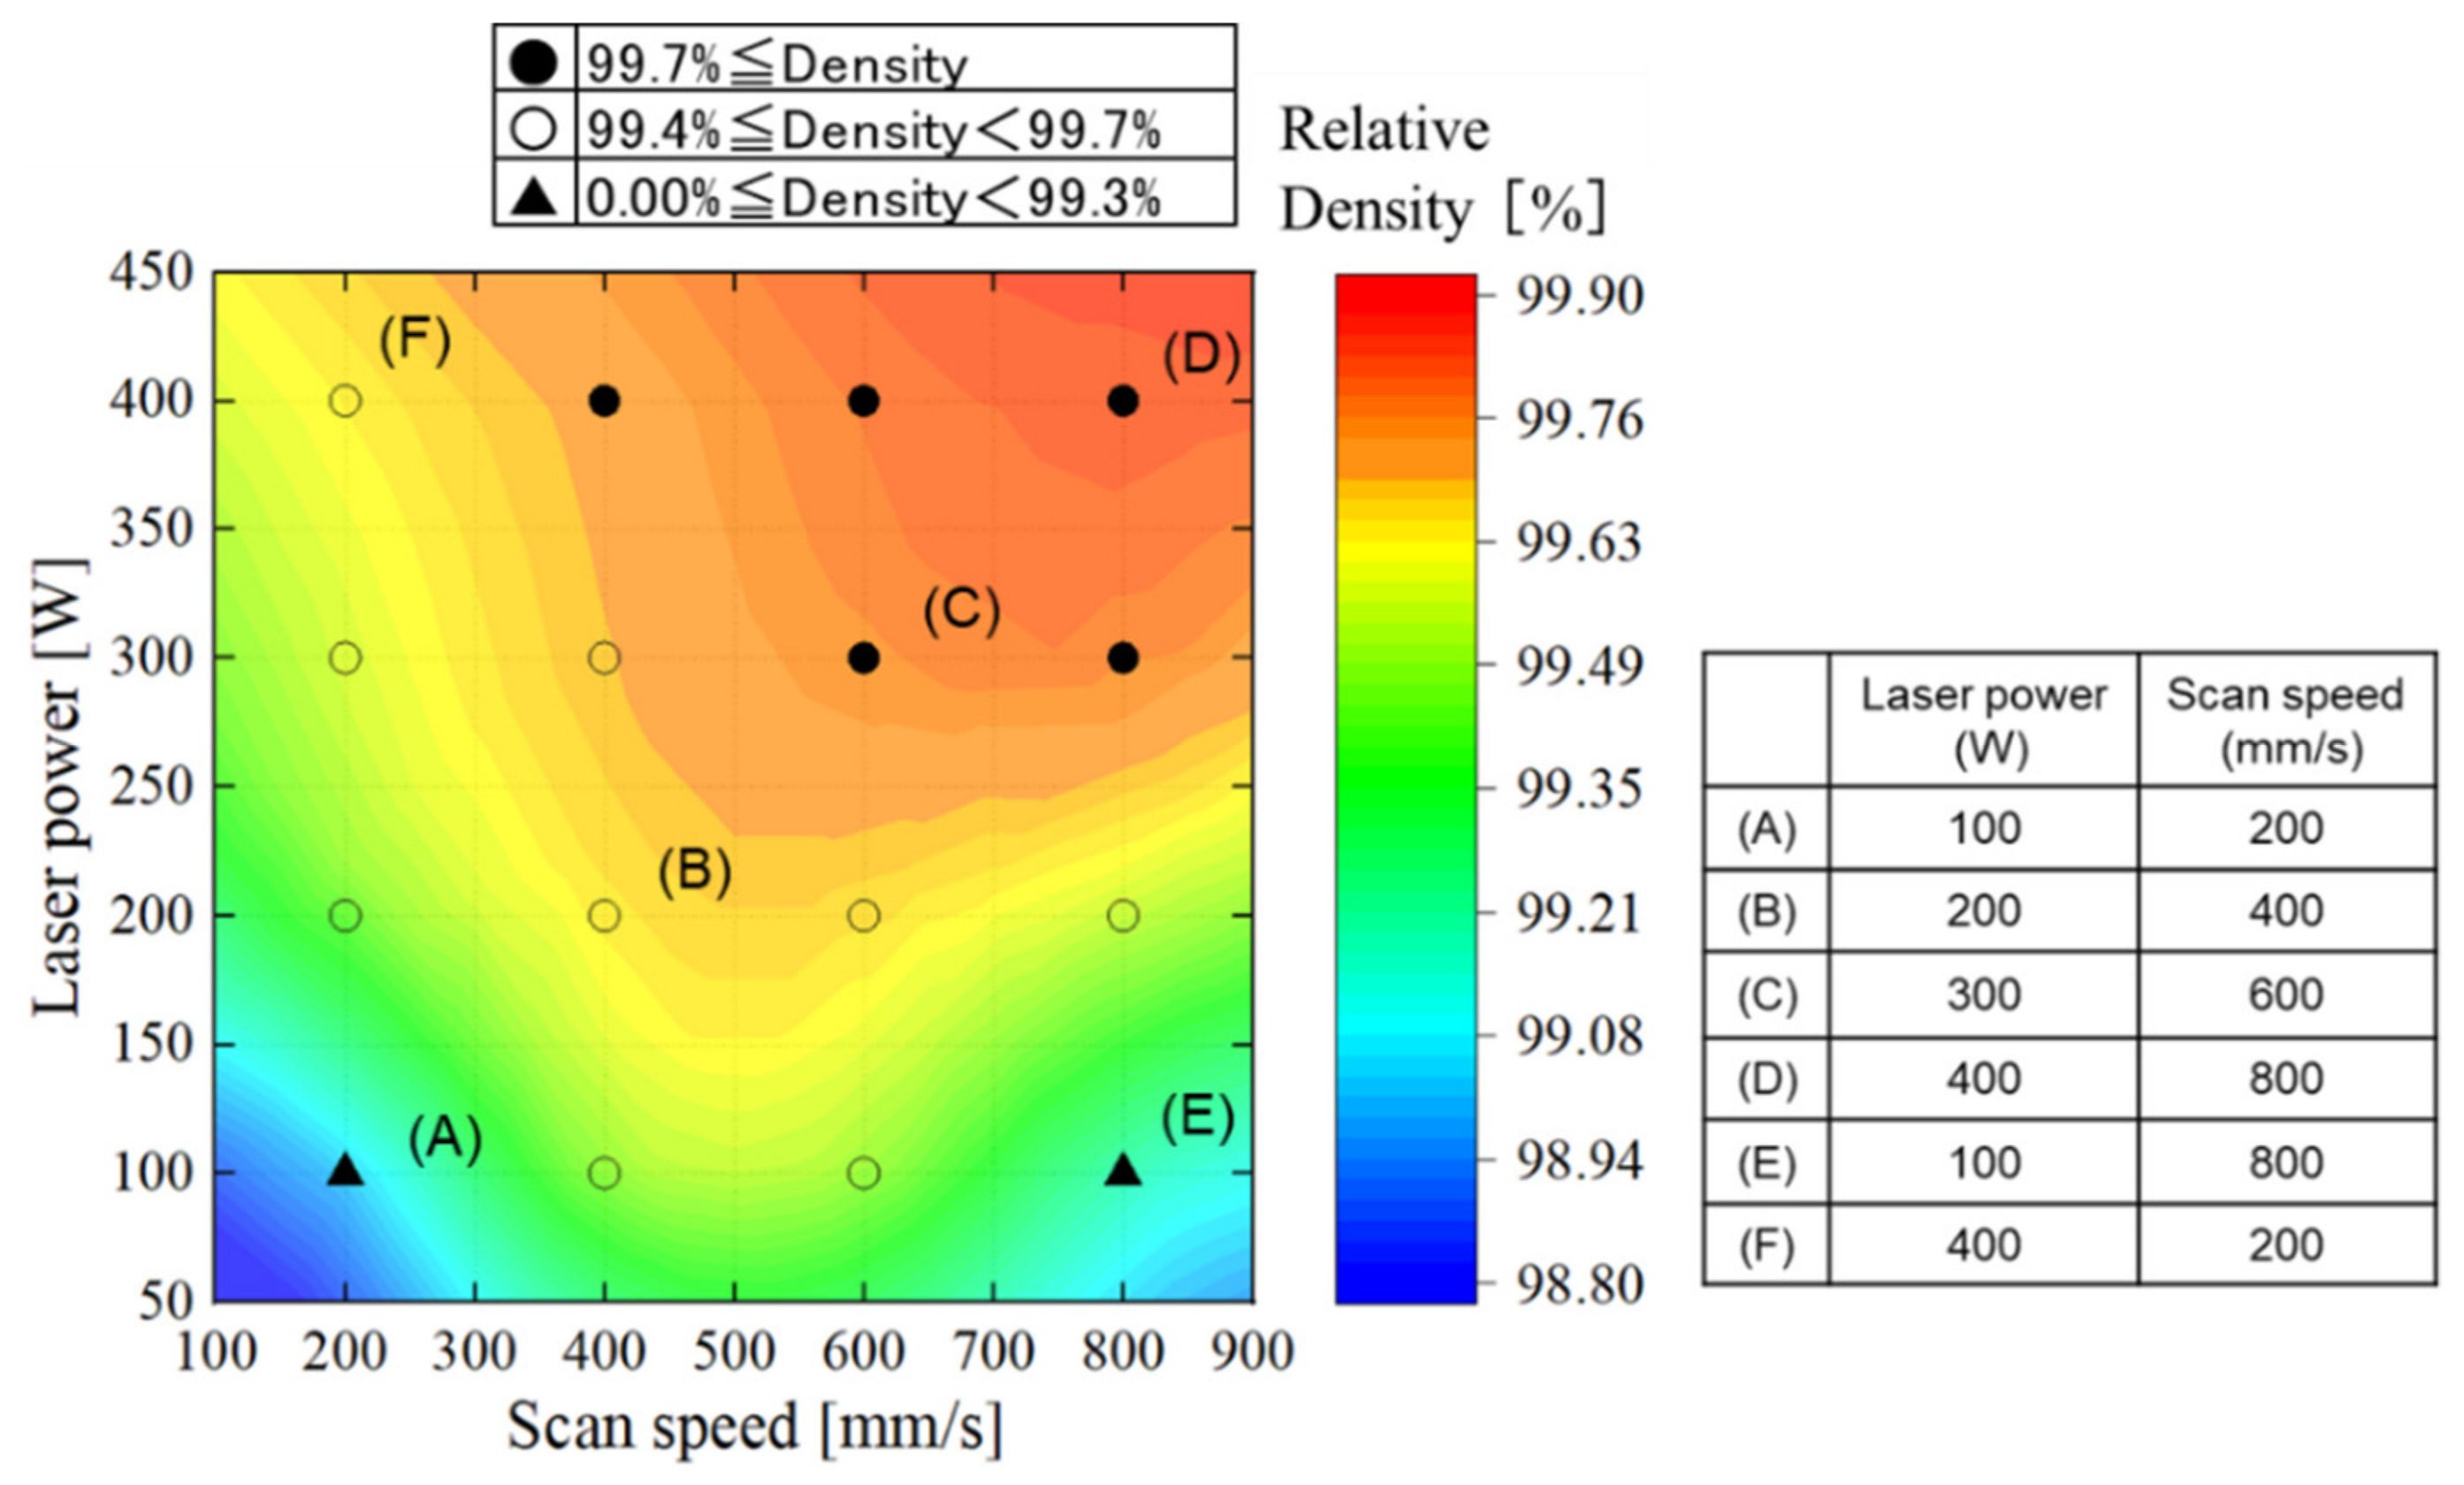
3.1.3. Density-Based Process Map in Terms of Laser Power and Scan Speed

The density-based process map in terms of laser power and scan speed using the cubic specimens fabricated at various conditions is depicted in Figure 6. The symbols (A)–(F) indicate the fabrication conditions of laser power and scan speed, as shown in Figure 6. The high-density (≧99.7%) area, the so-called process window (red and orange area), was at a laser power of 300–400 W and a scan speed of 600–800 mm/s. This result was similar to that of Inconel 718 obtained previously [47]. The relationship between fabrication condition and defects was reported using a process map in terms of laser power and scan speed [47,48,51,52,53]. The representative microstructure of (a), (b), and (c) presented in Figure 5 can be explained as follows. For lower laser power and higher scan speed, lack-of-fusion defects (a) were formed by the unstable meltpool due to the shortage of input energy. On the other hand, in the case of higher laser power and lower scan speed, keyhole pores remained by formation of keyhole due to excess energy and high laser power (c). Thus, the relative density and the morphology of defects strongly depend on laser power and scan speed.

3.2. Evaluation of the Surface Texture and Microstructure of the As-Built Specimen

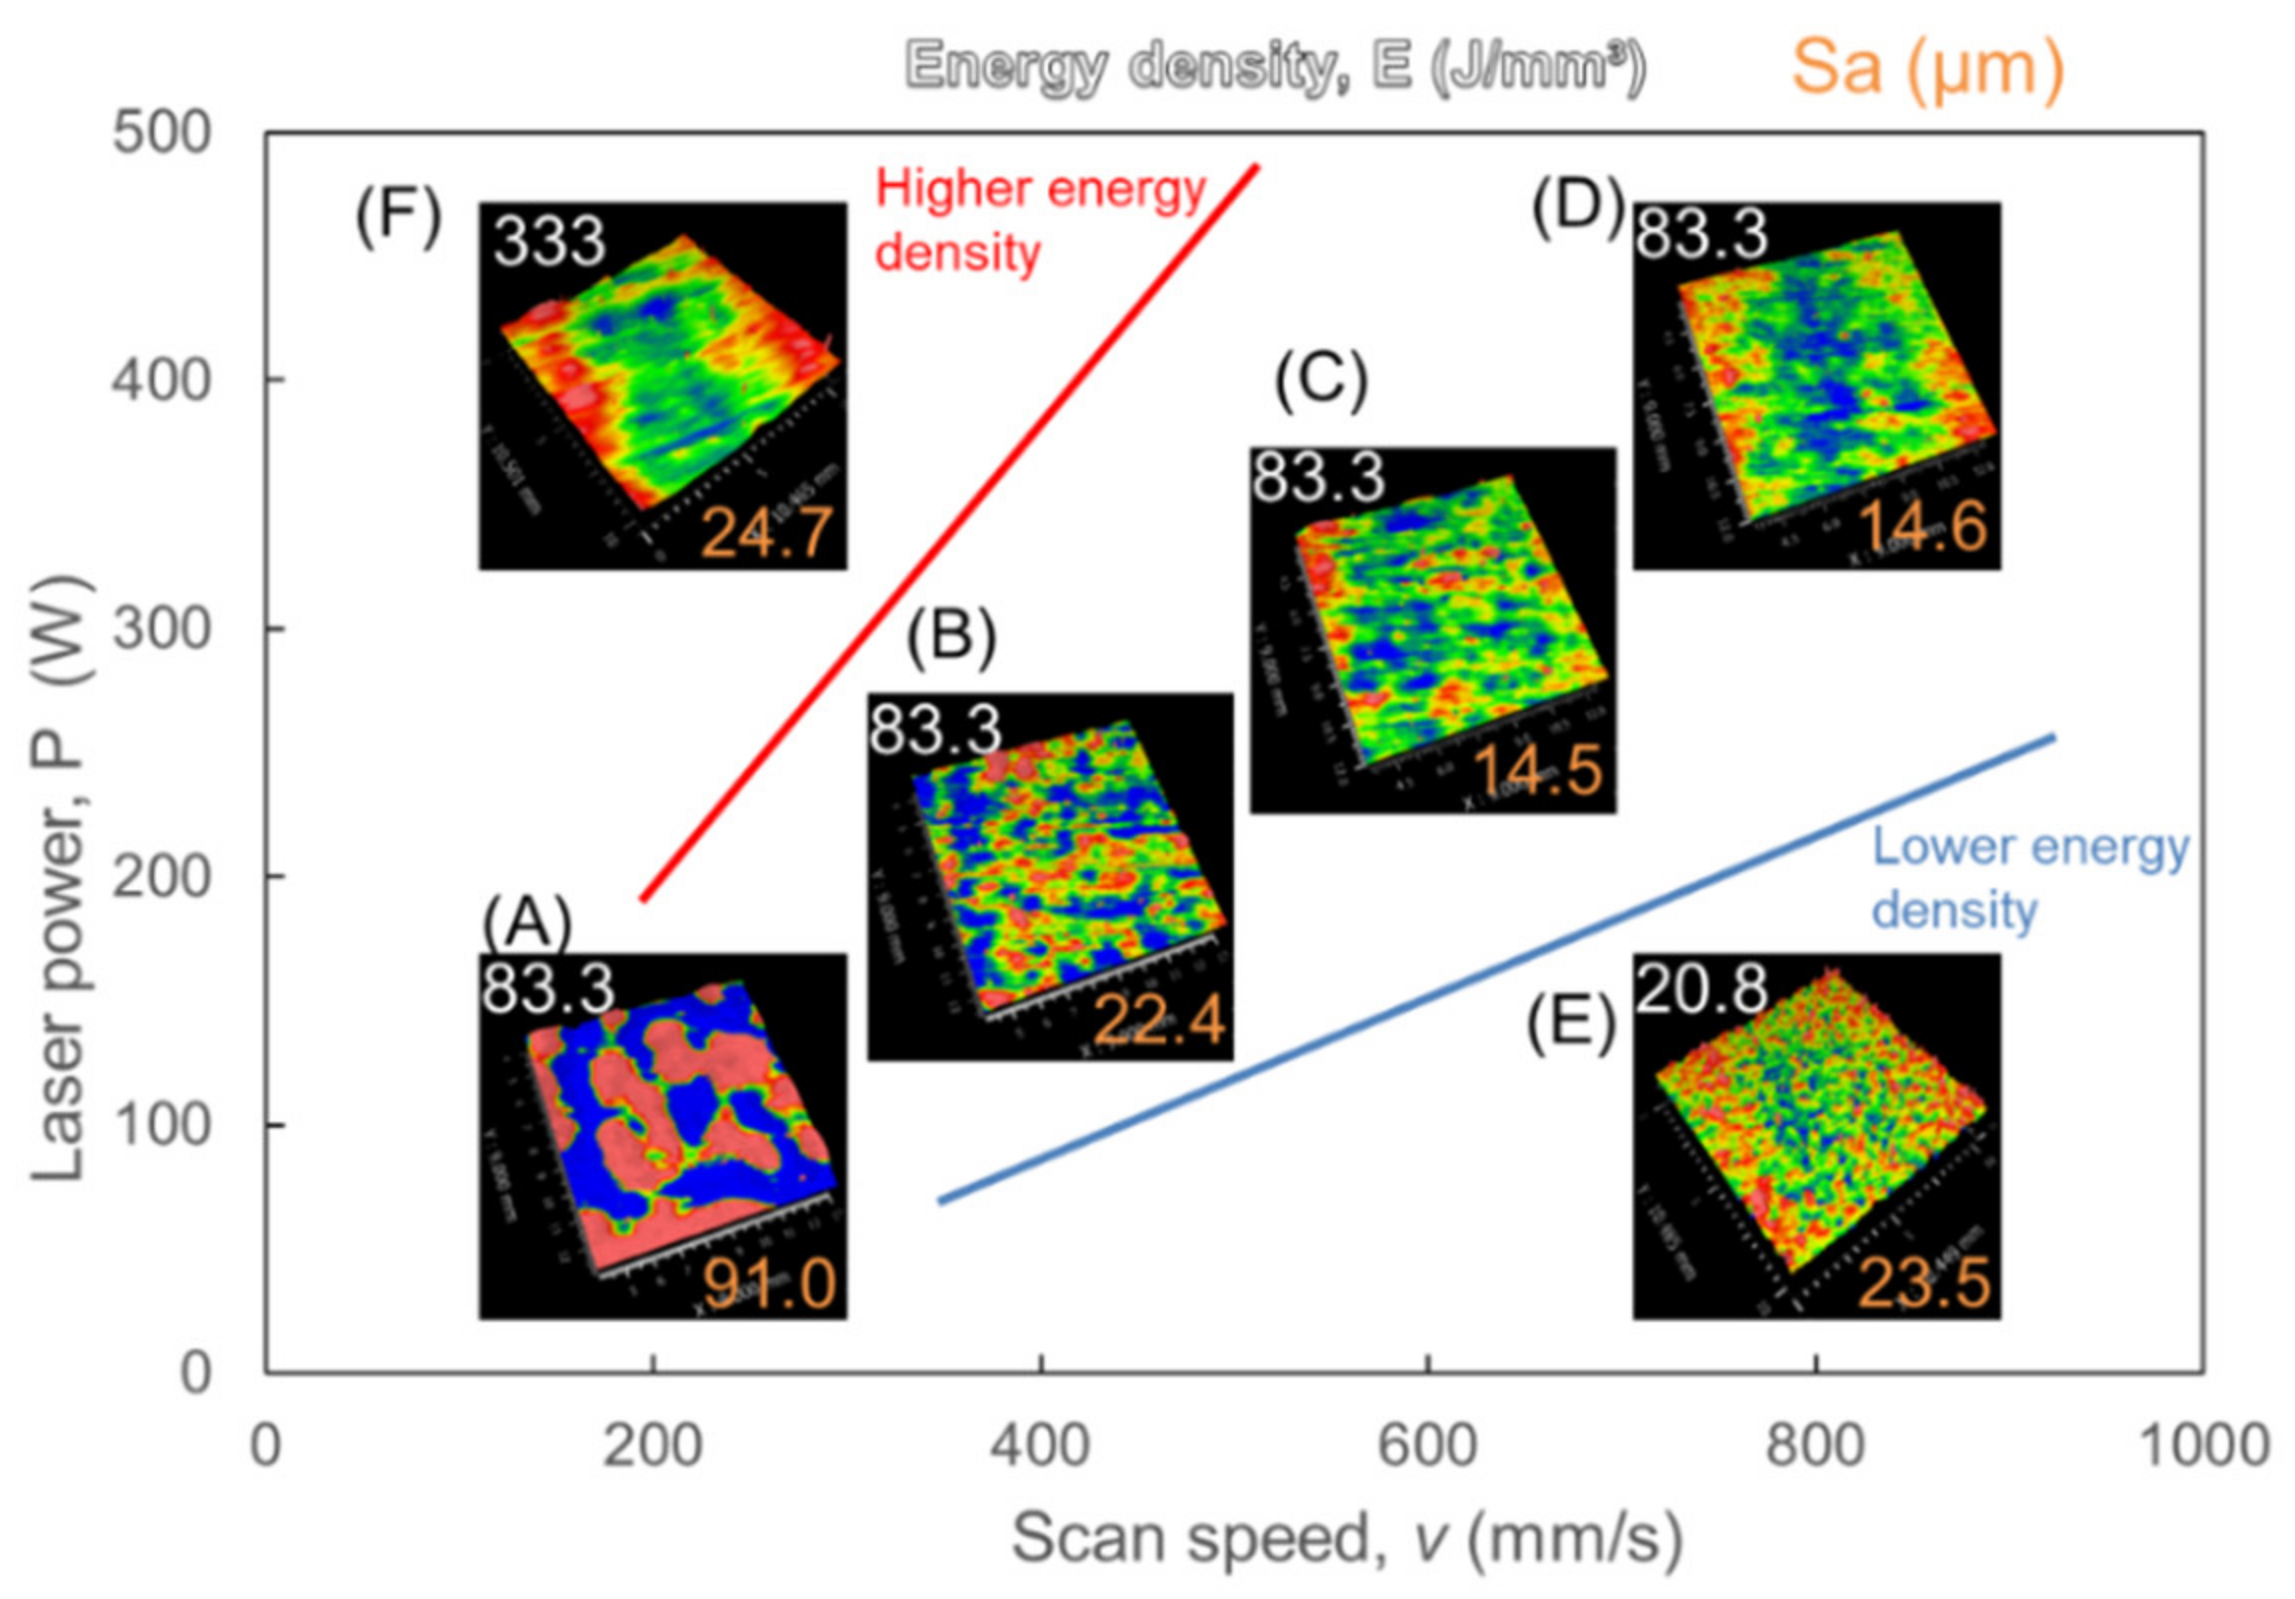
3.2.1. Surface Texture Parameter-Based Process Map in Terms of Laser Power and Scan Speed

The surface texture parameter (Sa)-based process map in terms of laser power and a scan speed of cubic specimens fabricated at various conditions is depicted in Figure 7. In the figure, three-dimensional surface images are demonstrated with the energy density value in the top-left corner and the arithmetical mean height (Sa) value in the bottom right corner. The Sa is one of the surface texture parameters defined in ISO 25178-6. The lower Sa values represent the even surface, and the higher values the uneven surface. The symbols of (A)–(F) in Figure 7 correspond to those in Figure 6.
According to the (A)–(D) series with the same energy density value, their Sa values decreased with laser power and scan speed; namely, the surface roughness was improved. With low laser power and slow scan speed (A), the surface texture showed unevenness. The meltpool seemed to be aggregated due to the slow scanning speed. With moderate laser power and scan speed (B)–(D), which were in the process window, the surface texture (B) presents as being less even than that of (C) and (D). The difference between (B) and (C) and (D) was considered due to the stability of the meltpool. The meltpool was in the conduction mode having a shallower depth at the lower laser power of (B), leading to spattering [51]. On the other hand, at higher laser power and higher scan speed, (C) and (D), the surface texture was more even because the meltpool was too deep to be pinned down to the substrate, which might be due to keyhole mode formation [51,52].
In the case of low laser power and high scan speed (E), the lowest energy density, the surface texture exhibited fine roughness due to lack of energy density, whereas in the case of high laser power and low scan speed (F), the highest energy density, the surface texture was uneven due to excess energy density. Thus, the surface texture also strongly depended on laser power and scan speed. A similar relationship was previously reported between the surface texture and the laser power and scan speed in the Inconel 718 superalloy (IN718) [47]. Moreover, the process window evaluation of Sa was almost consistent with that of the evaluation of relative density (Figure 6). The arithmetical mean height Sa of the specimen fabricated at 300 W and 600 mm/s was 14.5 µm which was almost equal to that of IN718 [47].
Thus, it was found that the high density and superior surface texture specimens could be fabricated at a laser power of 300–400 W and a scan speed of 600–800 mm/s and that the process window was indicated both by the density-based process map and by the surface texture parameter (Sa)-based one.

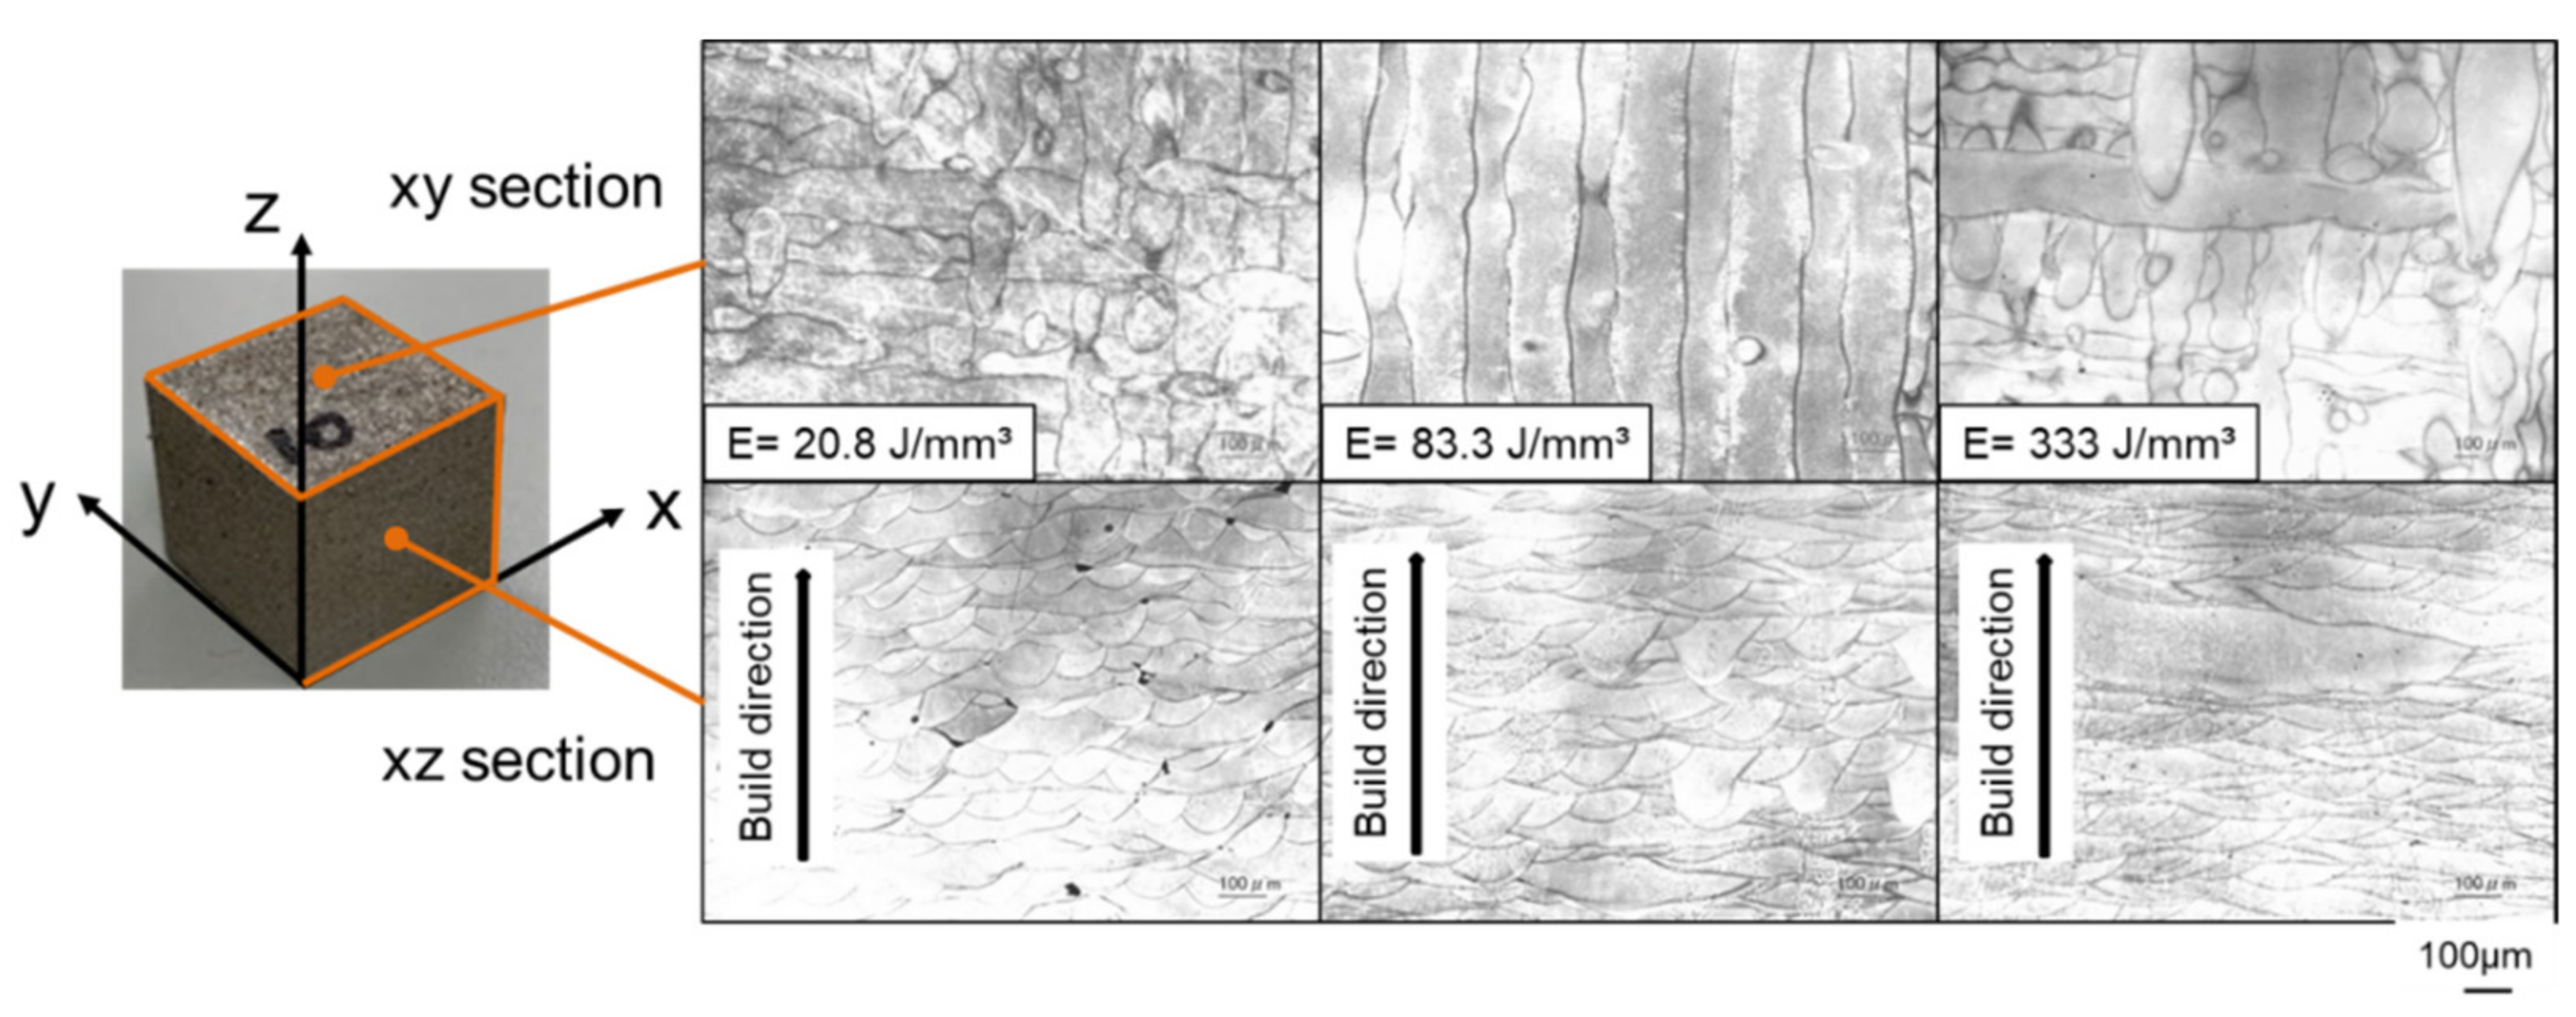
3.2.2. Effect of Process Parameters on the Microstructure of the Specimens

The effect of process parameters on the microstructure of the as-built cubic specimens was investigated. As described above, the relative density significantly depended on the energy density. The microstructures of the as-built specimens fabricated at the energy density of 20.8, 83.3, and 333 J/mm3 are presented in Figure 8. In the case of an energy density of 20.8 J/mm3 (i.e., a laser power of 100 W, scan speed of 800 mm/s, hatch pitch of 0.12 mm, and layer thickness of 0.05 mm), lack-of-fusion defects were observed between meltpool traces because the meltpool became unstable due to lower energy density. On the other hand, in the case of 83.3 J/mm3 (i.e., a laser power of 400 W, a scan speed of 800 mm/s, hatch pitch of 0.12 mm, and layer thickness of 0.05 mm), the meltpool traces presented a parabolic shape with a depth of about 100 µm and width of 100–200 µm, and few defects were observed. Furthermore, in the case of 333 J/mm3 (i.e., a laser power of 400 W, a scan speed of 200 mm/s, hatch pitch of 0.12 mm, and layer thickness of 0.05 mm), the meltpool traces showed a flatter shape with a depth of 100–200 µm and width of over 100 µm or partially over 400 µm. The excess energy density affected the width and depth of meltpools, as previously reported for high-speed tool steel, the H13 alloy, fabricated using 1 kW multi-mode fiber laser [48]. The meltpool traces here presented remarkably different aspect ratios with energy density.
Figure 9 depicts the EBSD results of the as-built cubic specimens fabricated at various energy densities of 20.8, 83.3, and 333 J/mm3 for the vertical section (xz) to the base plate. The microstructure of the vertical section (xz) was characterized by elongated grains along the build direction (z). Especially in the microstructures fabricated with 83.3 J/mm3 and 333 J/mm3, epitaxial grain growth occurred as presented in inverse pole figure (IPF) maps. The aspect ratio of the grains increased with the energy density. Fujieda et al. [40] investigated the difference between the microstructures of CoCrFeNiTi HEA fabricated by EPBF and LPBF and reported that the former showed higher anisotropy than the latter due to the solidification rate of EPBF being much slower than that of LPBF due to preheating at high temperatures. The microstructure of 83.3 J/mm3 in Figure 9b resembles their finding. In addition, the distributions of grain size of the specimens fabricated at various energy densities of 20.8, 83.3, and 333 J/mm3 are presented in Figure 9. The grain size increased with energy density; in particular, the grain size of the specimen fabricated at 333 J/mm3 was much larger than that of the specimens fabricated at 20.8 J/mm3 and 83.3 J/mm3. An extraordinary grain size (156 µm) could be observed at 333 J/mm3. Thus, the grain size and shape were significantly affected by the energy density.
According to Ghayoor et al. [41], at low energy density, the combined effect of the local change in the direction of heat flux due to defects and the Marangoni convection in the meltpool, led to a greater collision of grains, resulting in a fine grain size, whereas at high energy density, the heat flow combined with sufficient time to solidify led to the preferred orientation and larger columnar grains. In general, the orientation of the grain is essentially affected by the direction of the heat flow [41,42,43,44,45,46].
The XRD patterns of the as-built cubic specimens fabricated at various energy densities of 20.8, 83.3, and 333 J/mm3 for the horizontal section along the build direction are presented in Figure 10. These diffraction peaks correspond to the single-cubic (SC) and face-centered cubic (FCC) phases, as reported by Fujieda et al. [40]. The diffraction peaks of TiCo2 or MoFe2 intermetallic compounds were not detectable (Figure 10), unlike the observations of Fujieda et al. [40], for the LPBF specimens fabricated at 61.5 J/mm3. The patterns of 20.8 J/mm3 were almost equal to that of the powder. The (200) peak became higher with increasing energy density. The microstructure of the specimens of 333 J/mm3 showed a stronger orientation than that of the others. This result is consistent with the EBSD result, the <100> direction of the grains preferentially oriented along the build direction for the specimen formed with a larger energy density.
Thus, it was found that as the grain size increased, the grains were preferentially oriented in the <100> direction with increasing energy density.

3.3. Mechanical Properties

3.3.1. Results of Tensile Tests

The mechanical properties of the as-built specimens were investigated by tensile test. The round bars for tensile test specimens were fabricated at the optimum conditions obtained from the process window in the process map (Figure 6 and Figure 7), as shown in Table 4. The round bars (diameter: 14 mm, length: 100 mm) were fabricated in the direction of 0°, 45°, and 90° to the horizontal plane of the base plate (Figure 11). The round bar in the 0° direction lay horizontally or parallel to the base plate surface, and the round bar in the 90° direction stood vertically on the base plate. The round bars were machined to the tensile test specimens (diameter: 5 mm, gage length: 25 mm), following which. a tensile test was conducted using an Instron-type machine.
The stress–strain curves and the mechanical properties of the as-built specimens are demonstrated in Figure 12 and Table 5, respectively. The values of tensile strength of the specimens fabricated in the direction of 0°, 45°, and 90° were 1183 MPa, 1156 MPa, and 1165 MPa, respectively. The values of 0.2% proof strength, or yield strength, of the specimens fabricated in the direction of 0°, 45°, and 90° were 861 MPa, 817 MPa, and 744 MPa, respectively. The values of elongations of the specimens fabricated in the 0°, 45°, and 90° directions were 21%, 25%, and 26%, respectively. The tensile behavior of the specimens fabricated in the 0° direction was different, which may be because of the difference in the microstructure of the as-built specimen in the build direction. Thus, the tensile strength was over 1150 MPa, and the elongation over 20% in any direction. This result was similar to that reported by Fujieda et al. [40].

3.3.2. Relationship Between Microstructure and Tensile Properties

Figure 13 exhibits the IPF map and distribution of grain size of the xy section (vertical section along the axial loading direction) of tensile test specimens before the tensile test fabricated in the direction of 0°, 45°, and 90°. The microstructure of the 0° specimen showed smaller and more elongated grains (Figure 13a), while that of the 45° and 90° specimens presented more random crystallographic orientation with larger and less elongated grains (Figure 13b,c). Figure 14 demonstrates the fractured surfaces of the specimens fabricated in the direction of 0°, 45°, and 90°. The fractured surface of the 0° specimen showed a small elongated pattern (Figure 14a), while that of the 45° specimen presented a small dimple pattern (Figure 14b), and that of the 90° specimen presented a small dimple pattern as well as a small elongated pattern (Figure 14c). Thus, the fracture surfaces of the specimens corresponded well with the grain size and shape of the specimens.
The Kernel average misorientation (KAM) maps of the xy section of the tensile test specimens before the tensile test fabricated in the direction of 0°, 45°, and 90° are depicted in Figure 15. The KAM map, which proved the local misorientation in the specimens, was used to indicate local strain [46]. The local misorientation range was set between 0° and 5°. The local misorientation distributes not only at the grain boundaries but also in the whole area for the 0° specimen (Figure 15a) and locally along the grain boundaries for the 45° and 90° specimens. As shown in Figure 13, the grain size of the 0° specimen was smaller than that of the 45° and 90° specimens (Figure 15b,c). The local misorientation was extremely high at the fine-grain boundaries because the refined grains were hardly deformed. Dong et al. [54] reported that the fine grains of the minor BCC phase formed by remelting at the boundaries of the relatively large columnar grains of the dominant FCC phase of AlCoCrFeNi HEA led to an increasing amount of local misorientation. Additionally, because the 0° specimen bar lay along the base plate surface, the constraints by the base plate surface could cause thermal strain in the whole area of the cross-section in observing the microstructure (Figure 11). On the other hand, for the 45° and 90° specimens, although the formation of fine grains introduced the local misorientation at the grain boundaries, the thermal strain was smaller due to the lower constraint on the base plate (Figure 11).
Therefore, the tensile properties were different in the build direction because of the difference in strain distribution. As described above, the tensile strength of the 0° specimen was higher than the others. On the other hand, the elongation of the 0° specimen was lower than the others. In addition, the yield strength of the 0° specimen was higher than the others due to the smaller grain size, as Yoshida et al. [55] reported that the Hall–Petch relation could be applied in various HEA. As shown in Figure 13, the grain size of the specimens was, in the order, 90°, 45°, and 0°, namely, the yield strengths were considered to be, in the order, 0°, 45°, and 90° by Hall–Petch relation. Thus, the yield strength was supposed to be affected by the local strain around the grain boundaries and grain sizes.

4. Conclusions

In this study, the effects of process parameters of PBF-LB on the density and microstructure of the CoCrFeNiTiMo HEA were investigated experimentally. Moreover, the mechanical properties of the alloy fabricated at the optimum condition were evaluated. The results were as follows:
(1)
The density-based process map in terms of laser power and scan speed was created using the as-built cubic specimens fabricated at various conditions. The process window by evaluation of Sa was almost consistent with that by evaluation of relative density
(2)
The high density and superior surface texture specimens were fabricated at a 300–400 W laser power and a scan speed of 600–800 mm/s. The relative density and Sa of the specimen fabricated at 300 W, and 600 mm/s were 99.8% and 14.5 µm, respectively
(3)
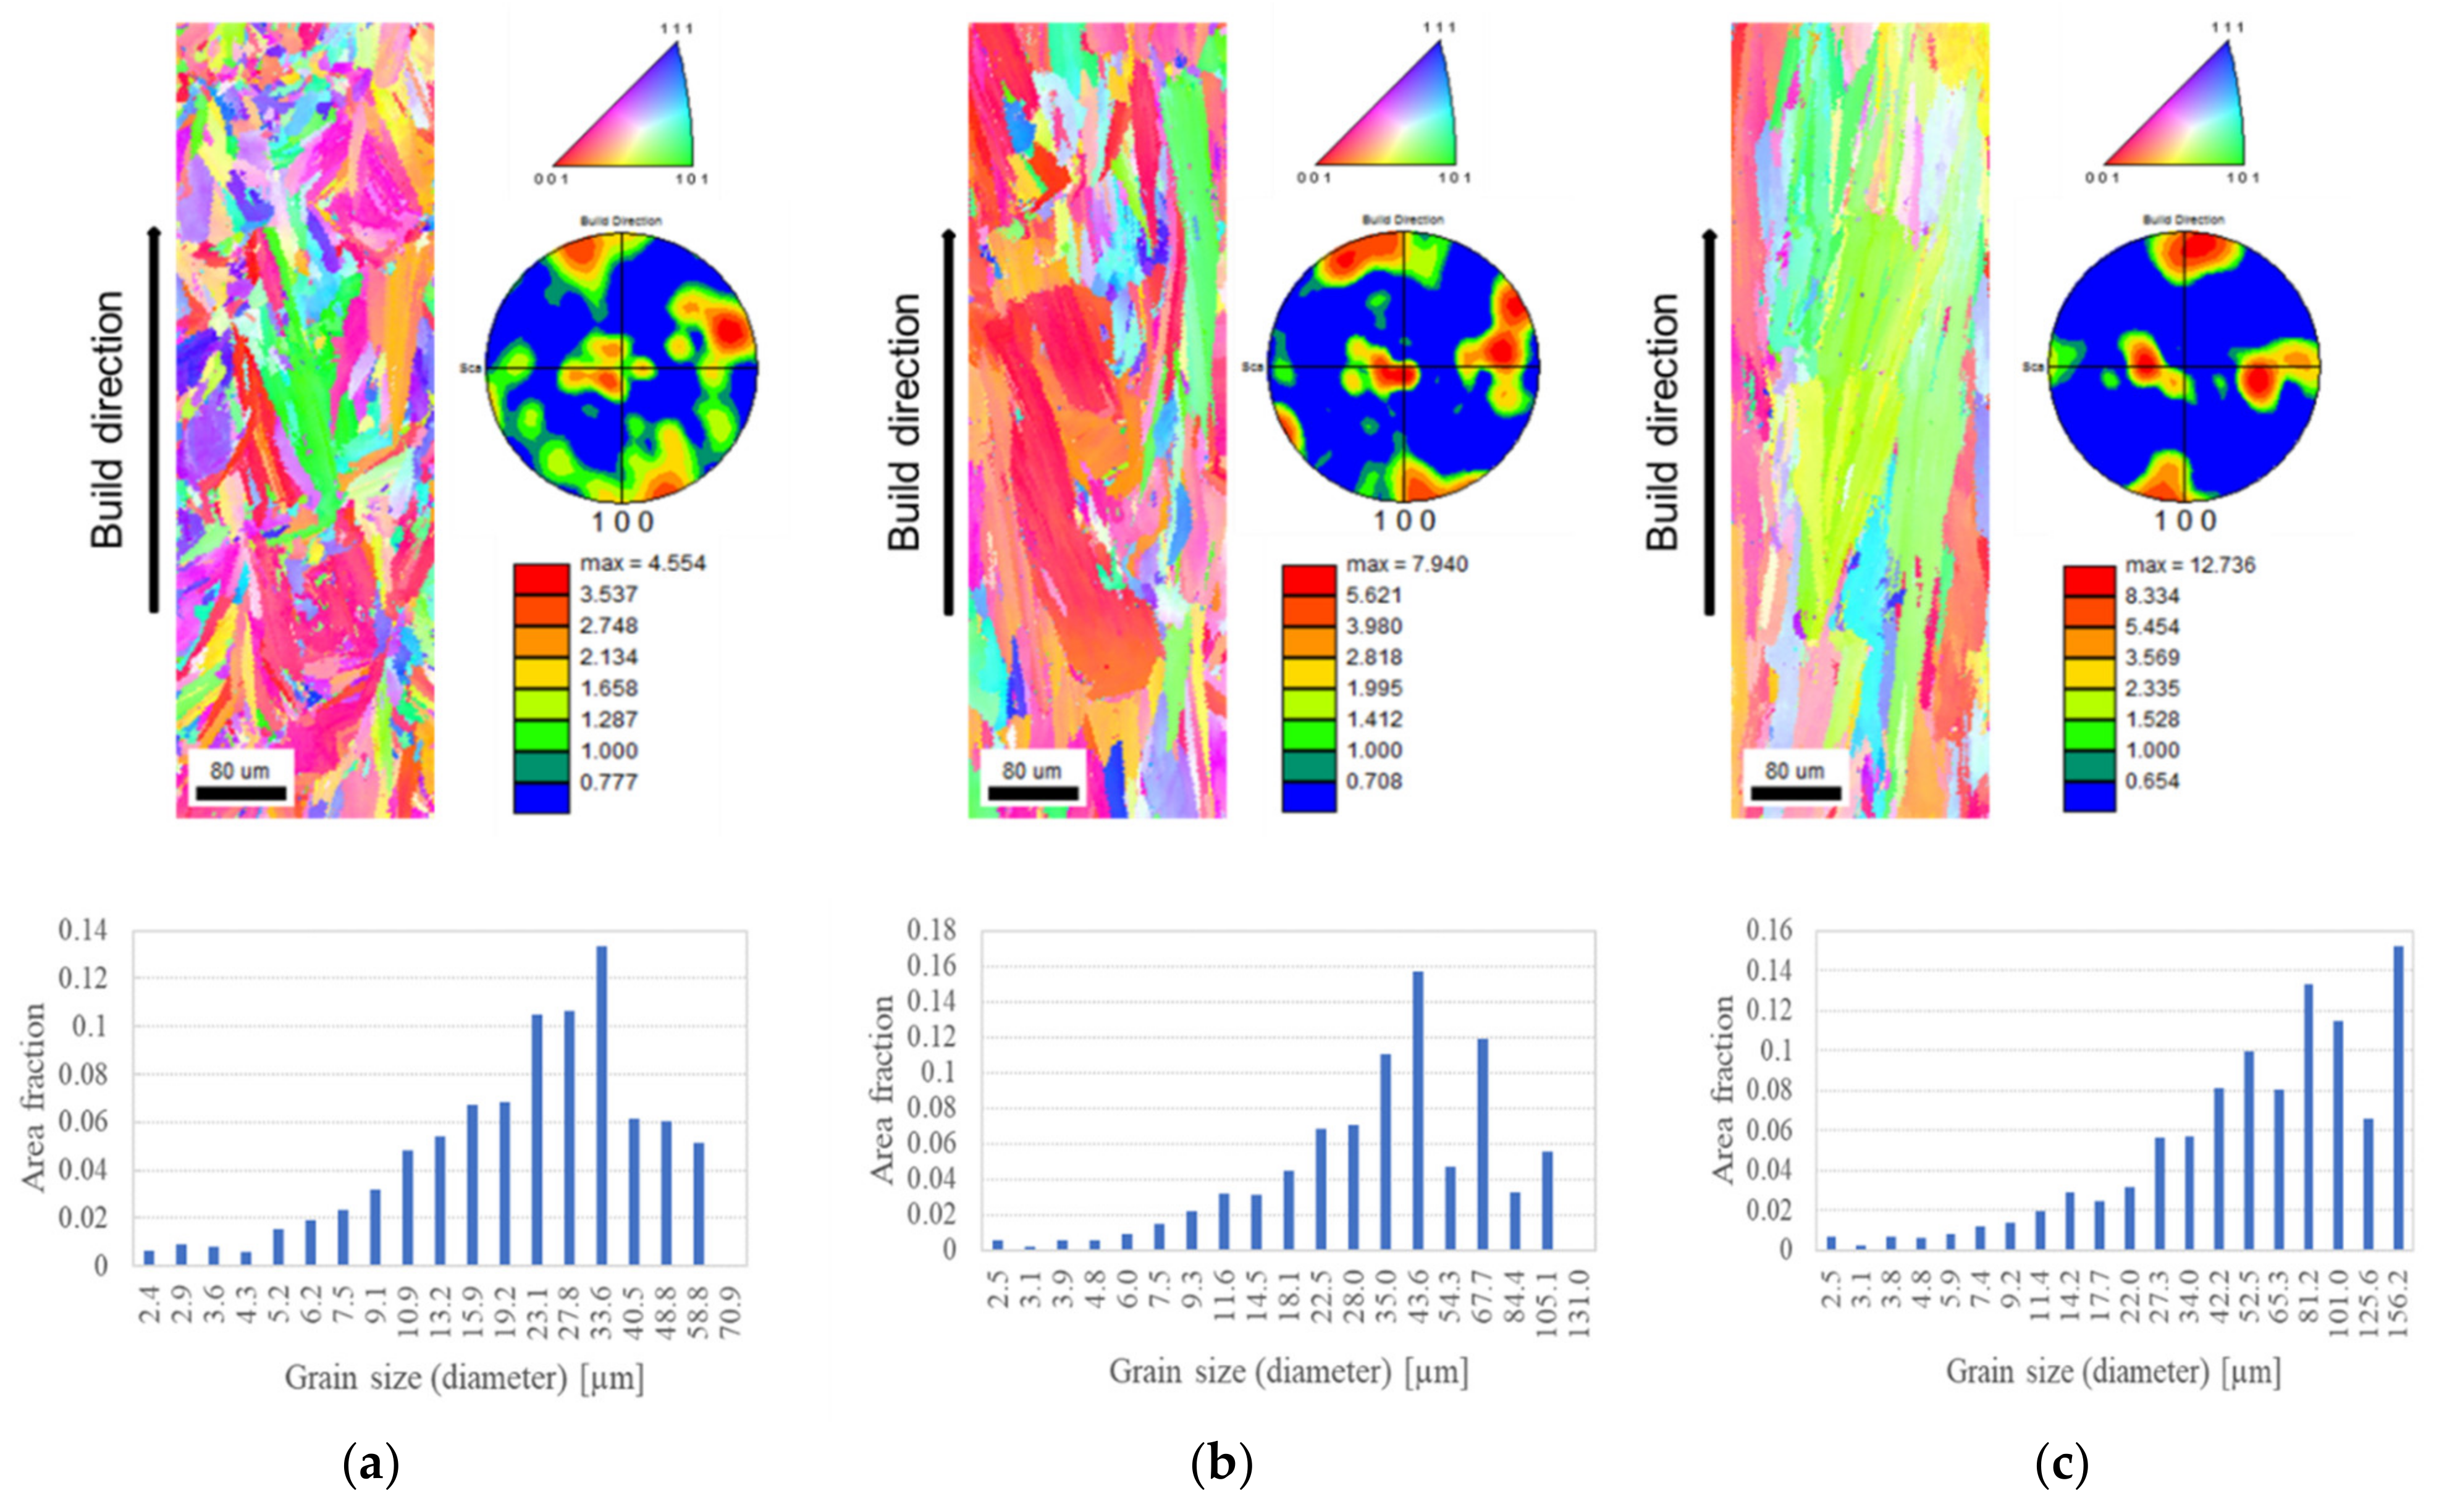
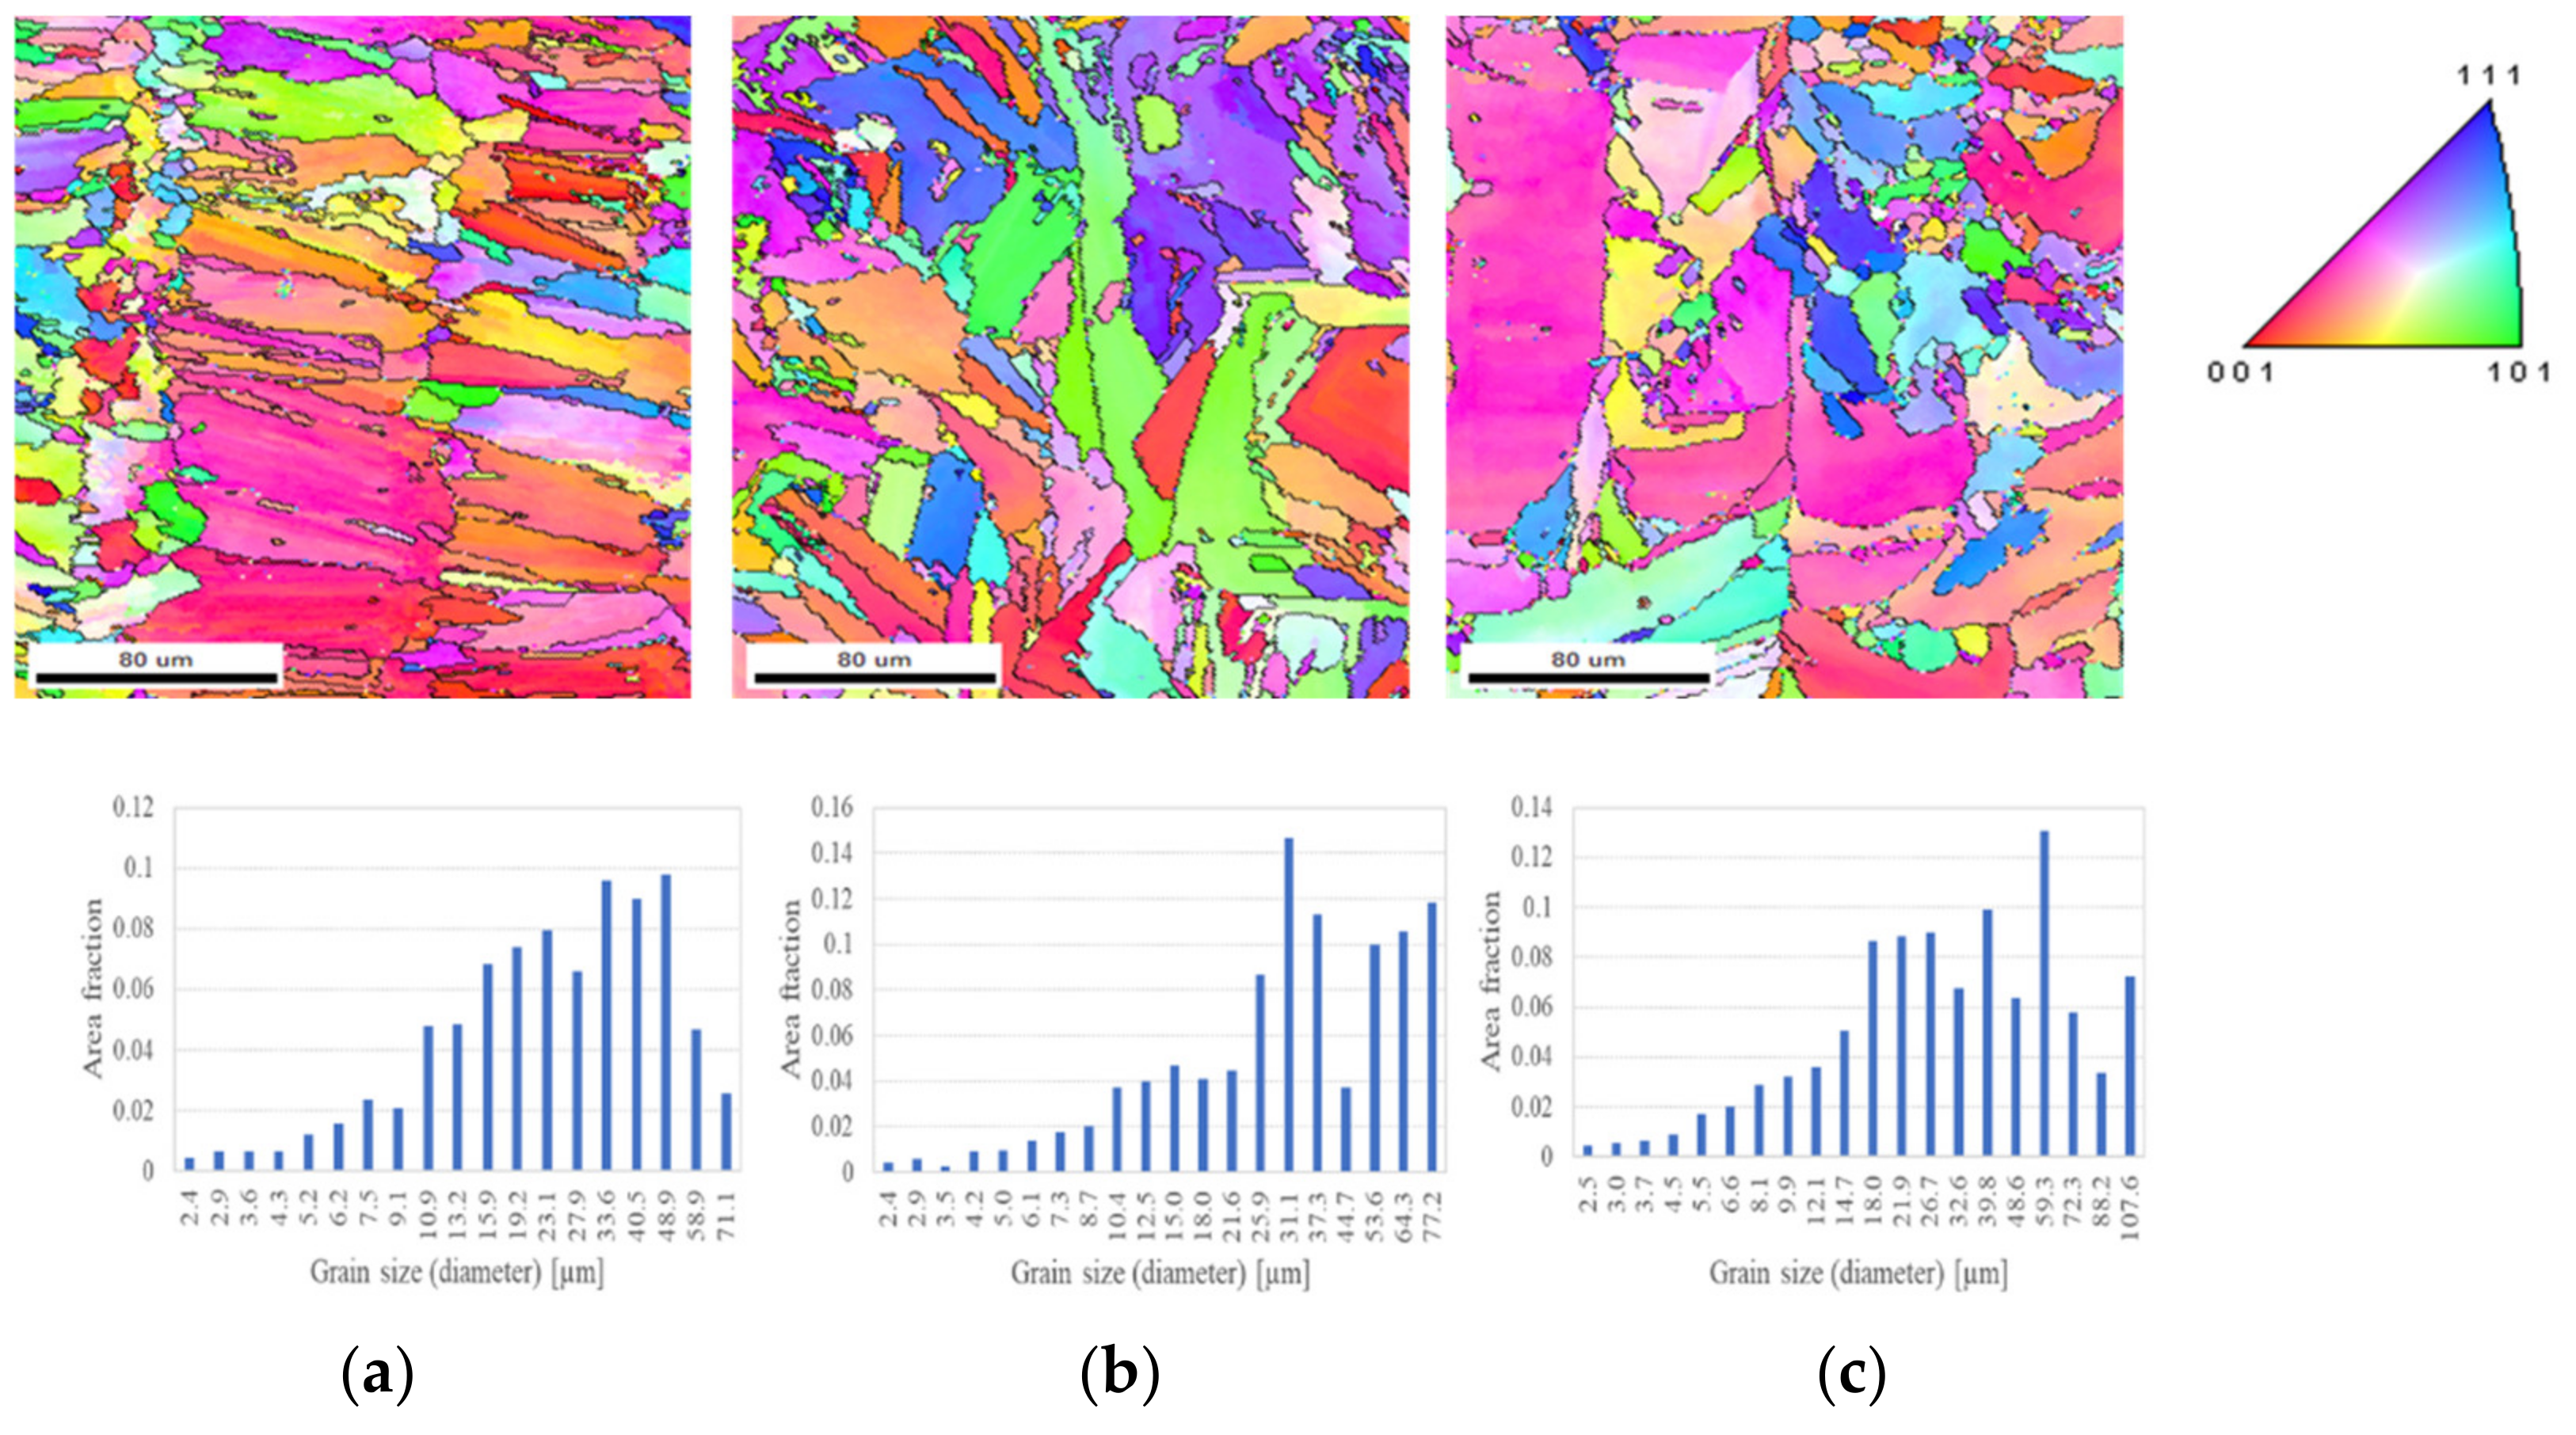
The grain size increased with energy density, and the grains grew preferentially oriented with their <100> direction along their build direction
(4)
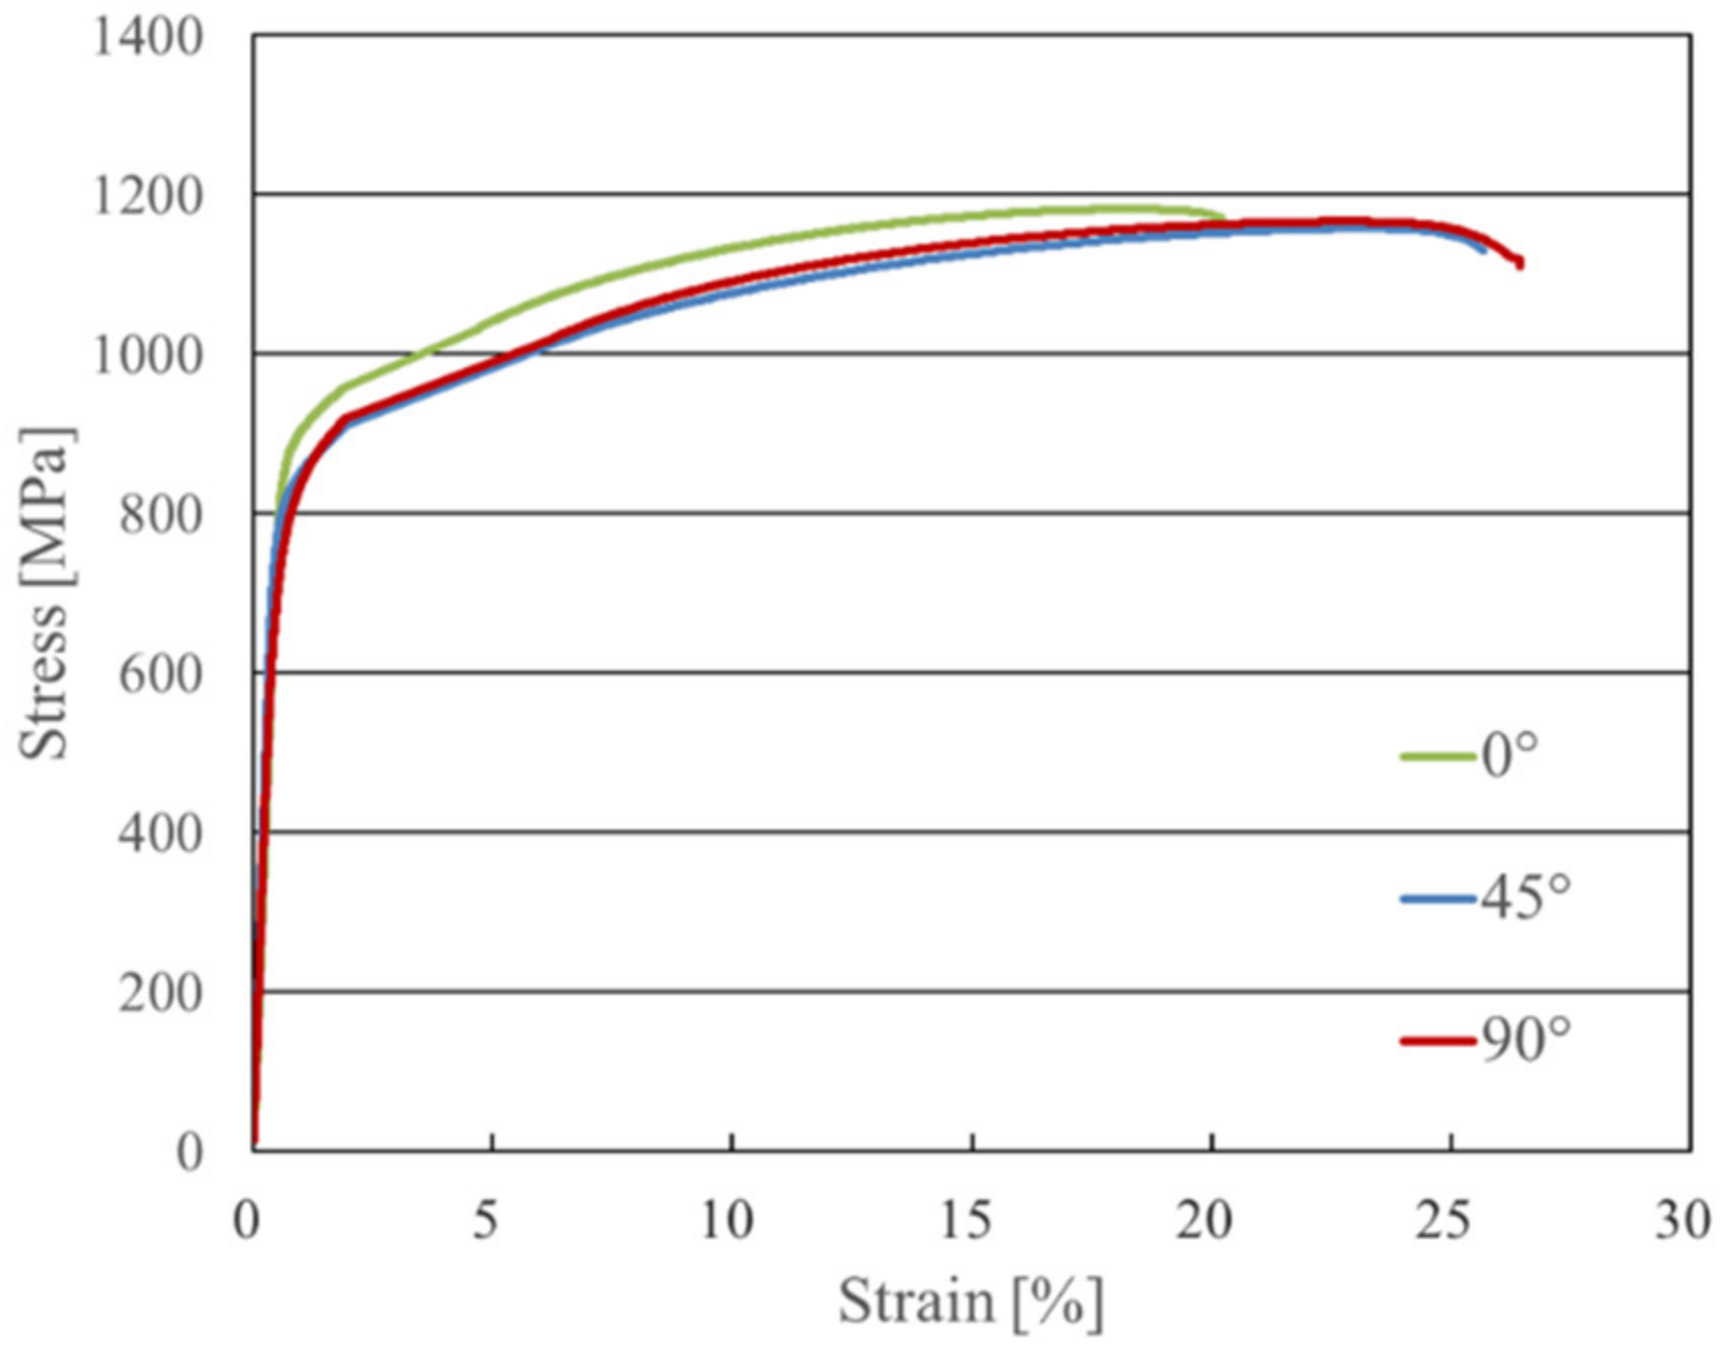
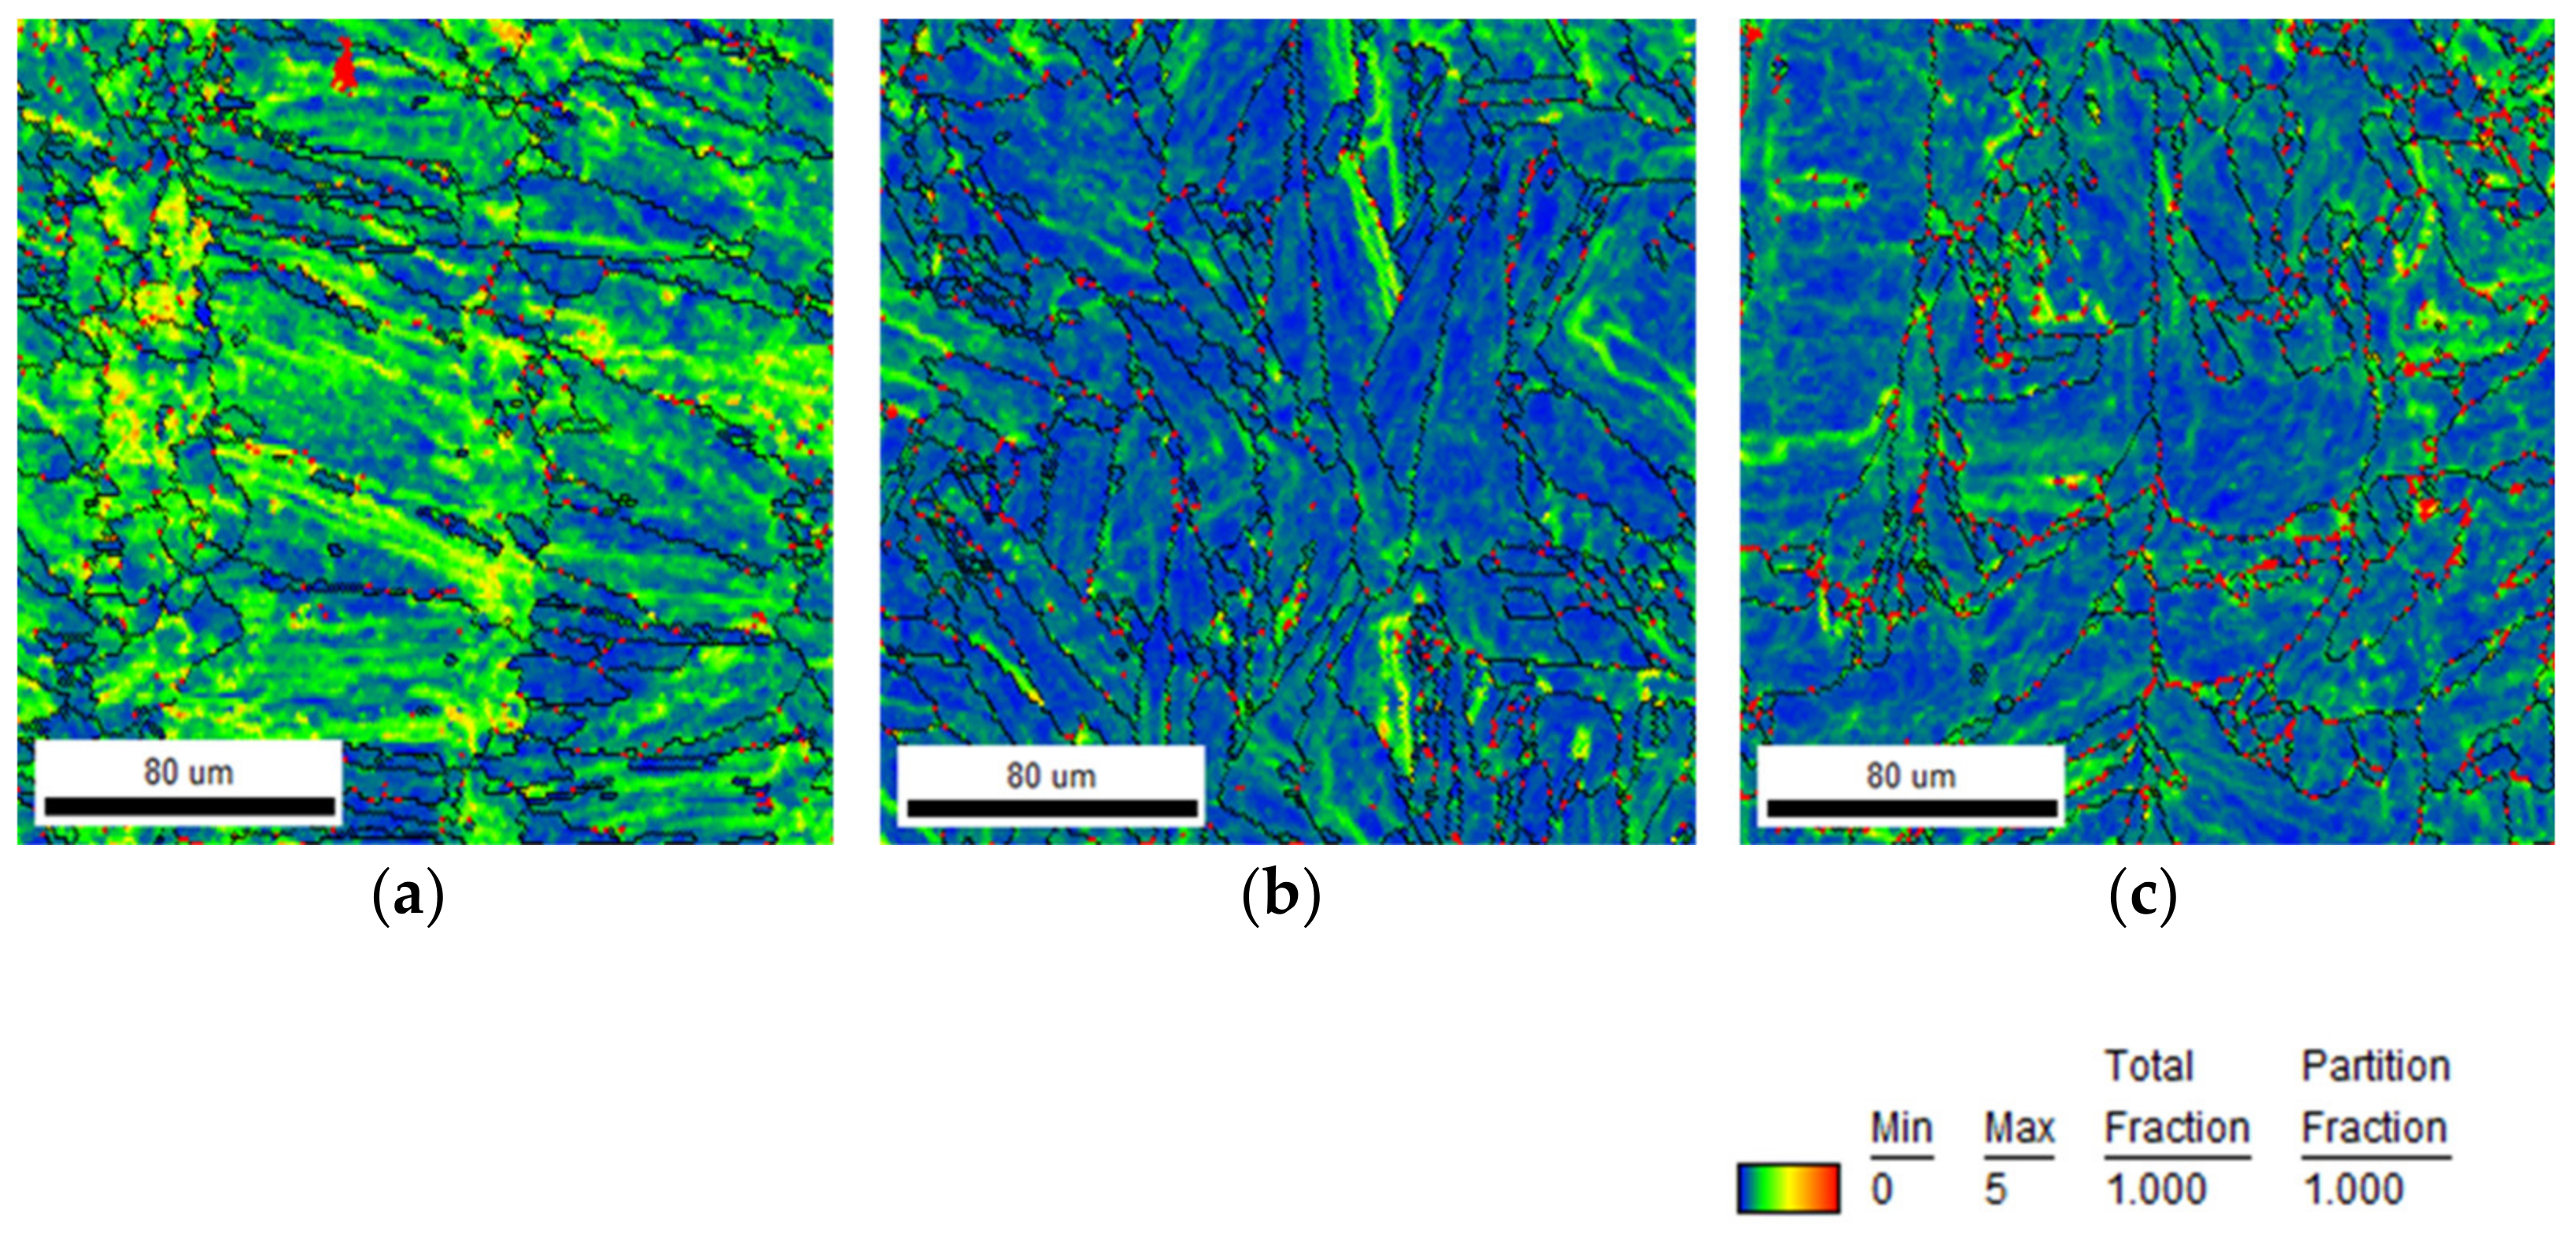
The microstructure of the as-built specimen exhibited anisotropy along the build direction. Therefore, the tensile properties are affected by the anisotropic microstructure and the existence of local strain
(5)
Tensile strength and elongation of the as-built specimen fabricated by the optimum condition at any build direction were over 1150 MPa and over 20%, respectively. Yield strength is supposed to be affected by the local strain around grain boundaries and grain sizes.

Author Contributions

Conceptualization, T.I. and H.K.; methodology, T.I., M.Y., T.-T.I., K.K., and Y.O.; validation, T.-T.I., T.N., and M.H.; writing—original draft preparation, T.I., T.-T.I., and H.K. All authors have read and agreed to the published version of the manuscript.

Funding

This research was funded by Higashihiroshima city.

Acknowledgments

We acknowledge Hitachi Metals Ltd. For technical support.

Conflicts of Interest

The authors declare no conflict of interest.

References

  1. Bourell, D.; Kruth, J.P.; Leu, M.; Levy, G.; Rosen, D.; Beese, A.M.; Clare, A. Materials for additive manufacturing. CIRP Ann. Manuf. Technol. 2017, 66, 659–681. [Google Scholar] [CrossRef]
  2. Wang, P.; Tan, X.; Nai, M.L.S.; Tor, S.B.; Wei, J. Spatial and geometrical-based characterization of microstructure and microhardness for an electron beam melted Ti–6Al–4V component. Mater. Des. 2016, 95, 287–295. [Google Scholar] [CrossRef]
  3. Wang, P.; Song, J.; Nai, M.L.L.; Wei, J. Experimental analysis of additively manufactured component and design guidelines for lightweight structures: A case study using electron beam melting. Addit. Manuf. 2020, 33, 101088. [Google Scholar] [CrossRef]
  4. Ishimoto, T.; Hagihara, K.; Hisamoto, K.; Sun, S.-H.; Nakano, T. Crystallographic texture control of beta-type Ti–15Mo–5Zr–3Al alloy by selective laser melting for the development of novel implants with a biocompatible low Young’s modulus. Scr. Mater. 2017, 132, 34–38. [Google Scholar] [CrossRef]
  5. Debroy, T.; Wei, H.L.; Zuback, J.S.; Mukherjee, T.; Elmer, J.W.; Milewski, J.O.; Beese, A.M.; Wilson-Heid, A.; De, A.; Zhang, W. Additive manufacturing of metallic components—Process, structure and properties. Prog. Mater. Sci. 2018, 92, 112–224. [Google Scholar] [CrossRef]
  6. Li, N.; Huang, S.; Zhang, G.; Qin, R.; Liu, W.; Xiong, H.; Shi, G.; Blackburn, J. Progress in additive manufacturing on new materials: A review. J. Mater. Sci. Technol. 2019, 35, 242–269. [Google Scholar] [CrossRef]
  7. George, E.P.; Raabe, D.; Ritchie, R.O. High-entropy alloys. Nat. Rev. Mater. 2019, 4, 515–534. [Google Scholar] [CrossRef]
  8. Yeh, J.-W.; Chen, S.-K.; Lin, S.-J.; Gan, J.-Y.; Chin, T.-S.; Shun, T.-T.; Tsau, C.-H.; Chang, S.-Y. Nanostructured high-entropy alloys with multiple principal elements: Novel alloys design concepts and outcomes. Adv. Eng. Mater. 2004, 6, 299–303. [Google Scholar] [CrossRef]
  9. Cantor, B.; Chang, I.T.H.; Knight, P.; Vincent, A.J.B. Microstructural development in equiatomic multicomponent alloys. Mater. Sci. Eng. A 2004, 375–377, 213–218. [Google Scholar] [CrossRef]
  10. Tsai, M.-H.; Yeh, J.-W. High-entropy alloys: A critical review. Mater. Res. Lett. 2014, 2, 107–123. [Google Scholar] [CrossRef]
  11. Miracle, D.B.; Senkov, O.N. A critical review of high entropy alloys and related concepts. Acta Mater. 2017, 122, 448–511. [Google Scholar] [CrossRef] [Green Version]
  12. Yeh, J.W. Alloy Design Strategies and Future Trends in High-Entropy Alloys. JOM 2013, 65, 1759–1771. [Google Scholar] [CrossRef]
  13. Wang, Z.; Guo, S.; Liu, C.T. Phase selection in high-entropy alloys: From nonequilibrium to equilibrium. JOM 2014, 66, 1966–1972. [Google Scholar] [CrossRef]
  14. Guo, S. Phase selection rules for cast high entropy alloys: An overview. Mater. Sci. Technol. 2015, 31, 1223–1230. [Google Scholar] [CrossRef]
  15. Ye, Y.F.; Wang, Q.; Lu, J.; Liu, C.T.; Yang, Y. High-entropy alloy: Challenges and prospects. Mater. Today 2016, 19, 349–362. [Google Scholar] [CrossRef]
  16. Chen, J.; Zhou, X.; Wang, W.; Liu, B.; Lv, Y.; Yang, W.; Xu, D.; Liu, Y. A review on fundamental of high entropy alloys with promising high-temperature properties. J. Alloys Compd. 2018, 760, 15–30. [Google Scholar] [CrossRef]
  17. Torralba, J.M.; Campos, M. High Entropy Alloys Manufactured by Additive Manufacturing. Metals 2020, 10, 639. [Google Scholar] [CrossRef]
  18. Chen, S.; Tong, Y.; Liaw, P.K. Additive Manufacturing of High-Entropy Alloys: A Review. Entropy 2018, 20, 937. [Google Scholar] [CrossRef] [PubMed] [Green Version]
  19. Gorsse, S.; Hutchinson, C.; Gouné, M.; Banerjee, R. Additive manufacturing of metals: A brief review of the characteristic microstructures and properties of steels, Ti-6Al-4V and high-entropy alloys. Sci. Technol. Adv. Mater 2017, 18, 584–610. [Google Scholar] [CrossRef] [Green Version]
  20. Demyanetz, A.K.; Popov, V.V., Jr.; Kovalevsky, A.; Safranchik, D.; Koptyug, A. Powder-bed additive manufacturing for aerospace application: Techniques, Metallic and metal/ceramic composite materials and trends. Rev. Manuf. Rev. 2019, 6, 5. [Google Scholar] [CrossRef] [Green Version]
  21. Cui, W.; Zhang, X.; Liou, F. Additive Manufacturing of High-Entropy Alloys—A Review, Solid Freeform Fabrication 2017. In Proceedings of the 28th Annual International Solid Freeform Fabrication Symposium—An Additive Manufacturing Conference, Austin, TX, USA, 7–9 August 2017. [Google Scholar]
  22. Brif, Y.; Thomas, M.; Todd, I. The use of high-entropy alloys in additive manufacturing. Scr. Mater. 2015, 99, 93–96. [Google Scholar] [CrossRef]
  23. Johnson, L.; Mahmoudi, M.; Zhang, B.; Seede, R.; Huang, X.; Maier, J.T.; Maier, H.J.; Karaman, I.; Elwany, A.; Arroyave, R. Assessing printability maps in additive manufacturing of metal alloys. Acta Mater. 2019, 176, 199–210. [Google Scholar] [CrossRef]
  24. Xu, Z.; Zhang, H.; Li, W.; Mao, A.; Wang, L.; Song, G.; He, Y. Microstructure and nanoindentation creep behavior of CoCrFeMnNi high-entropy alloy fabricated by selective laser melting. Addit. Manuf. 2019, 28, 766–771. [Google Scholar] [CrossRef]
  25. Guan, S.; Wan, D.; Solberg, K.; Berto, F.; Welo, T.; Yue, T.M.; Chan, K.C. Additive manufacturing of fine-grained and dislocation-populated CrMnFeCoNi high entropy alloy by laser engineered net shaping. Mater. Sci. Eng. A 2019, 761, 138056. [Google Scholar] [CrossRef]
  26. Zhu, Z.G.; Nguyen, Q.B.; Ng, F.L.; An, X.H.; Liao, X.Z.; Liaw, P.K.; Nai, S.M.L.; Wei, J. Hierarchical microstructure and strengthening mechanisms of a CoCrFeNiMn high entropy alloy additively manufactured by selective laser melting. Scr. Mater. 2018, 154, 20–24. [Google Scholar] [CrossRef]
  27. Wang, P.; Huang, P.; Nga, F.L.; Sin, W.J.; Lu, S.; Nai, M.L.S.; Dong, Z.; Wei, J. Additively manufactured CoCrFeNiMn high-entropy alloy via pre-alloyed powder. Mater. Des. 2019, 168, 107576. [Google Scholar] [CrossRef]
  28. Tong, Z.; Ren, X.; Jiao, J.; Zhou, W.; Ren, Y.; Ye, Y.; Larson, E.A.; Gu, J. Laser additive manufacturing of FeCrCoMnNi high-entropy alloy: Effect of heat treatment on microstructure, residual stress and mechanical property. J. Alloys Compd. 2019, 785, 1144–1159. [Google Scholar] [CrossRef]
  29. Li, R.; Niu, P.; Yuan, T.; Cao, P.; Chen, C.; Zhou, K. Selective laser melting of an equiatomic CoCrFeMnNi high-entropy alloy: Processability, non-equilibrium microstructure and mechanical property. J. Alloys Compd. 2018, 746, 125–134. [Google Scholar] [CrossRef]
  30. Piglione, A.; Dovgyy, B.; Liu, C.; Gourlay, C.M.; Hooper, P.A.; Pham, M.S. Printability and microstructure of the CoCrFeMnNi high-entropy alloy fabricated by laser powder bed fusion. Mater. Lett. 2018, 224, 22–25. [Google Scholar] [CrossRef]
  31. Song, M.; Zhou, R.; Gua, J.; Wang, Z.; Ni, S.; Liu, Y. Nitrogen induced heterogeneous structures overcome strength-ductility trade-off in an additively manufactured high-entropy alloy. Appl. Mater. Today 2020, 18, 100498. [Google Scholar] [CrossRef]
  32. Lin, D.; Xu, L.; Jing, H.; Han, Y.; Zhao, L.; Minami, F. Effects of annealing on the structure and mechanical properties of FeCoCrNi high-entropy alloy fabricated via selective laser melting. Addit. Manuf. 2020, 32, 101058. [Google Scholar] [CrossRef]
  33. Zhu, Z.G.; An, X.H.; Lu, W.J.; Li, Z.M.; Ng, F.L.; Liao, X.Z.; Ramamurty, U.; Nai, S.M.L.; Wei, J. Selective laser melting enabling the hierarchically heterogeneous microstructure and excellent mechanical properties in an interstitial solute strengthened high entropy alloy. Mater. Res. Lett. 2019, 7, 453–459. [Google Scholar] [CrossRef] [Green Version]
  34. Shiratori, H.; Fujieda, T.; Yamanaka, K.; Koizumi, Y.; Kuwabara, K.; Kato, T.; Chiba, A. Relationship between the microstructure and mechanical properties of an equiatomic AlCoCrFeNi high-entropy alloy fabricated by selective electron beam melting. Mater. Sci. Eng. A 2016, 656, 39–46. [Google Scholar] [CrossRef]
  35. Kuwabara, K.; Shiratori, H.; Fujieda, T.; Yamanaka, K.; Koizumi, Y.; Chiba, A. Mechanical and corrosion properties of AlCoCrFeNi high-entropy alloy fabricated with selective electron beam melting. Addit. Manuf. 2018, 23, 264–271. [Google Scholar] [CrossRef]
  36. Karlsson, D.; Lindwall, G.; Lundbäck, A.; Amnebrink, M.; Boström, M.; Riekehr, L.; Schuisky, M.; Sahlberg, M.; Jansson, U. Binder jetting of the AlCoCrFeNi alloy. Addit. Manuf. 2019, 27, 72–79. [Google Scholar] [CrossRef]
  37. Sun, Z.; Tan, X.P.; Descoins, M.; Mangelinck, D.; Tor, S.B.; Lim, C.S. Revealing hot tearing mechanism for an additively manufactured high-entropy alloy via selective laser melting. Scr. Mater. 2019, 168, 129–133. [Google Scholar] [CrossRef]
  38. Ishimoto, T.; Ozasa, R.; Nakano, K.; Weinmann, M.; Schnitter, C.; Stenzel, M.; Matsugaki, A.; Nagase, T.; Matsuzaka, T.; Todai, M. Development of TiNbTaZrMo bio-high entropy alloy (BioHEA) super-solid solution by selective laser melting, and its improved mechanical property and biocompatibility. Scr. Mater. 2021, 194, 113658. [Google Scholar] [CrossRef]
  39. Fujieda, T.; Shiratori, H.; Kuwabara, K.; Hirota, M.; Kato, T.; Yamanaka, K.; Koizumi, Y.; Chiba, A.; Watanabe, S. CoCrFeNiTi-based high-entropy alloy with superior tensile strength and corrosion resistance achieved by a combination of additive manufacturing using selective electron beam melting and solution treatment. Mater. Lett. 2017, 189, 148–151. [Google Scholar] [CrossRef]
  40. Fujieda, T.; Chen, M.; Shiratori, H.; Kuwabara, K.; Yamanaka, K.; Koizumi, Y.; Chiba, A.; Watanabe, S. Mechanical and corrosion properties of CoCrFeNiTi-based high-entropy alloy additive manufactured using selective laser melting. Addit. Manuf. 2019, 25, 412–420. [Google Scholar] [CrossRef]
  41. Ghayoora, M.; Leea, K.; He, Y.; Chang, C.; Paula, B.K.; Pasebani, S. Selective laser melting of 304L stainless steel: Role of volumetric energy density on the microstructure, texture and mechanical properties. Addit. Manuf. 2020, 32, 101011. [Google Scholar] [CrossRef]
  42. Kurzynowski, T.; Gruber, K.; Stopyra, W.; Kuźnicka, B.; Chlebus, E. Correlation between process parameters, microstructure and properties of 316 L stainless steel processed by selective laser melting. Mater. Sci. Eng. A 2018, 718, 64–73. [Google Scholar] [CrossRef]
  43. Tucho, W.M.; Lysne, V.H.; Austbø, H.; Sjolyst-Kverneland, A.; Hansen, V. Investigation of effects of process parameters on microstructure and hardness of SLM manufactured SS316L. J. Alloys Compd. 2018, 740, 910–925. [Google Scholar] [CrossRef]
  44. Wang, D.; Song, C.; Yang, Y.; Bai, Y. Investigation of crystal growth mechanism during selective laser melting and mechanical property characterization of 316L stainless steel parts. Mater. Des. 2016, 100, 291–299. [Google Scholar] [CrossRef]
  45. Sun, S.-H.; Ishimoto, T.; Hagihara, K.; Tsutsumi, Y.; Hanawa, T.; Nakano, T. Excellent mechanical and corrosion properties of austenitic stainless steel with a unique crystallographic lamellar microstructure via selective laser melting. Scr. Mater. 2019, 159, 89–93. [Google Scholar] [CrossRef]
  46. Leicht, A.; Fischer, M.; Klement, U.; Nyborg, L.; Hryha, E. Increasing the Productivity of Laser Powder Bed Fusion for Stainless Steel 316L through Increased Layer Thickness. J. Mater. Eng. Perform. 2020. [Google Scholar] [CrossRef]
  47. Tachibana, Y.; Ikeshoji, T.-T.; Nakamura, K.; Yonehara, M.; Kyogoku, H. Selective laser melting of Inconel 718 under high power and high scanning speed conditions. Mater. Sci. Forum 2018, 941, 1574–1577. [Google Scholar] [CrossRef]
  48. Yonehara, M.; Ikeshoji, T.-T.; Nagahama, T.; Mizoguchi, T.; Tano, M.; Yoshimi, T.; Kyogoku, H. Parameter optimization of the high-power laser powder bed fusion process for H13 tool steel. J. Adv. Manuf. Technol. 2020, 110, 427–437. [Google Scholar] [CrossRef]
  49. Bertoli, U.S.; Wolfer, A.J.; Matthews, M.J.; Delplanque, J.-P.R.; Schoenung, J.M. On the Limitations of Volumetric Energy Density as a Design Parameter for Selective Laser Melting. Mater. Des. 2017, 113, 331–340. [Google Scholar] [CrossRef] [Green Version]
  50. Bertoli, U.S.; Guss, G.; Wu, S.; Matthews, M.J.; Schoenung, J.M. In-situ characterization of laser-powder interaction and cooling rates through high-speed imaging of powder bed fusion additive manufacturing. Mater. Des. 2017, 113, 385–396. [Google Scholar] [CrossRef]
  51. Gunenthiram, V.; Peyre, P.; Schneider, M.; Dal, M.; Coste, F.; Koutiri, I.; Fabbro, R. Experimental analysis of spatter generation and melt-pool behavior during the powder bed laser beam melting process. J. Mater. Process. Technol. 2018, 251, 376–386. [Google Scholar] [CrossRef]
  52. Scime, L.; Beuth, J. Melt pool geometry and morphology variability for the Inconel 718 alloy in a laser powder bed fusion additive manufacturing process. Addit. Manuf. 2019, 29, 100830. [Google Scholar] [CrossRef]
  53. Kyogoku, H.; Ikeshoji, T.-T. A review of metal additive manufacturing technologies: Mechanism of defects formation and simulation of melting and solidification phenomena in laser powder bed fusion process. Mech. Eng. Rev. 2020, 7, 19-00182. [Google Scholar] [CrossRef] [Green Version]
  54. Dong, B.; Wang, Z.; Pan, Z.; Mur’ansky, O.; Shen, C.; Reid, M.; Wu, B.; Chen, X.; Li, H. On the development of pseudo-eutectic AlCoCrFeNi2.1 high entropy alloy using Powder-bed Arc Additive Manufacturing (PAAM) process. Mater. Sci. Eng. A 2021, 802, 140639. [Google Scholar] [CrossRef]
  55. Yoshida, S.; Ikeuchi, T.; Bhattacharjee, T.; Bai, Y.; Shibata, A.; Tsuji, N. Effect of elemental combination on friction stress and Hall-Petch relationship in face-centered cubic high / medium entropy alloys. Acta Mater. 2019, 171, 201–215. [Google Scholar] [CrossRef]
Figure 1. SEM image of HEA powder.
Crystals 11 00549 g001
Figure 2. Cubic specimens fabricated at various conditions.
Crystals 11 00549 g002
Figure 3. The SEM images of single tracks and the process map in terms of laser power and scan speed evaluated by the morphology of single tracks fabricated under condition I (Laser spot diameter: 0.1 mm). (a) SEM images of single tracks; (b) process map in terms of laser power and scan speed evaluated by the morphology of single tracks.
Crystals 11 00549 g003
Figure 4. The SEM images of single tracks and the process map in terms of laser power and scan speed evaluated by the morphology of single tracks fabricated under condition II (Laser spot diameter: 0.2 mm). (a) SEM images of single tracks; (b) process map in terms of laser power and scan speed evaluated by the morphology of single tracks.
Crystals 11 00549 g004
Figure 5. Variations of relative density of the as-built specimens as a function of energy density and the representative optical micrographs (ac) of the as-built specimens.
Crystals 11 00549 g005
Figure 6. Density-based process map in terms of laser power and scan speed using the as-built cubic specimens fabricated at various conditions.
Crystals 11 00549 g006
Figure 7. Surface-texture parameter (Sa)-based process map in terms of laser power and scan speed using the cubic specimens fabricated at various conditions.
Crystals 11 00549 g007
Figure 8. OM images of horizontal (xy) section and vertical (xz) section to the base plate of the as-built cubic specimens fabricated at various energy densities.
Crystals 11 00549 g008
Figure 9. Inverse pole figure (IPF) maps, pole figures, and distribution of grain size of the as-built cubic specimens fabricated at various energy densities. (a) E = 20.8 J/mm3; (b) E = 83.3 J/mm3; (c) E = 333 J/mm3.
Crystals 11 00549 g009
Figure 10. XRD patterns of the as-built specimens fabricated at various energy densities.
Crystals 11 00549 g010
Figure 11. Round bars for tensile test specimens in the direction of 0°, 45°, and 90° to the horizontal plane of the base plate.
Crystals 11 00549 g011
Figure 12. Stress–strain curves of the as-built specimens fabricated in the direction of 0° (horizontal direction on the base plate), 45°, and 90° (vertical direction on the base plate).
Crystals 11 00549 g012
Figure 13. IPF maps and distribution of grain size of the xy section of tensile test specimens fabricated in the direction of (a) 0°, (b) 45°, and (c) 90° before the tensile test.
Crystals 11 00549 g013
Figure 14. Fractured surfaces of the as-built specimens fabricated in the direction of (a) 0°, (b) 45°, and (c) 90°.
Crystals 11 00549 g014
Figure 15. Kernel average misorientation (KAM) maps of the xy section of tensile test specimens before the tensile test fabricated in the direction of (a) 0°, (b) 45°, and (c) 90°.
Crystals 11 00549 g015
Table 1. Chemical composition of HEA (mass%).
CoCrFeNiTiMo
Bal.16.3917.8427.837.562.93
Table 2. Fabrication conditions of single tracks.
Process ParametersCondition ICondition II
Laser power, P100–400 W100–400 W
Scan speed, v200–1400 mm/s200–1400 mm/s
Layer thickness, t0.05 mm0.05 mm
Laser spot diameter, d0.1 mm0.2 mm
Energy density, EL0.71–20.0 J/mm20.36–10.0 J/mm2
Table 3. Fabrication conditions of cubic specimens.
Process ParametersConditions
Laser power, P100, 200, 300, 400 W
Scan speed, v200, 400, 600, 800 mm/s
Hatch pitch, h0.12 mm
Layer thickness, t0.05 mm
Laser spot diameter, d0.2 mm
Energy density, E20.8–333.3 J/mm3
Table 4. Fabrication condition of round bars.
Process ParametersConditions
Laser power, P300 W
Scan speed, v600 mm/s
Hatch pitch, h0.12 mm
Layer thickness, t0.05 mm
Laser spot diameter, d0.2 mm
Energy density, E83.3 J/mm3
Table 5. Mechanical properties of the as-built specimens fabricated at the optimum condition.
Build Direction45°90°
Tensile strength (MPa)1183 ± 61156 ± 191165 ± 1
0.2% proof strength (MPa)861 ± 14817 ± 15744 ± 6
Elongation (%)21 ± 125 ± 426 ± 0
Reduction in area (%)25 ± 227 ± 630 ± 4
Publisher’s Note: MDPI stays neutral with regard to jurisdictional claims in published maps and institutional affiliations.

