Article

Quartz Crystal Microbalance Genosensing of Brettanomyces bruxellensis Yeast in Wine Using a Rapid and Efficient Drop and Collect Protocol

by
Simone Poggesi
1,2,
Lan Zhou
1,
Giuliocesare Casari Bariani
1,2,
Rakesh Mittapalli
1,
Marisa Manzano
2 and
Rodica Elena Ionescu
1,*
1
Light, nanomaterials, nanotechnologies (L2n) Laboratory, CNRS ERL 7004, University of Technology of Troyes, 12 rue Marie Curie, CS 42060, CEDEX, 10004 Troyes, France
2
Dipartimento di Scienze Agroalimentari, Ambientali e Animali (DI4A), Università degli Studi di Udine, Via Sondrio 2/A, 33100 Udine, Italy
*
Author to whom correspondence should be addressed.
Submission received: 30 March 2021 / Revised: 6 May 2021 / Accepted: 14 May 2021 / Published: 18 May 2021
(This article belongs to the Special Issue DNA and Small Molecular Complex Crystallization)

Abstract

:
A miniaturized quartz crystal microbalance (QCM) genosensor is proposed for sensitive and real-time detection of short ssDNA sequences (53 bp) or DNA extracted from Brettanomyces bruxellensis (Brett) yeast cells. The presence of Brett yeast causes a depreciation of the quality of aged fine wines, producing molecules of unpleasant odors and biogenic amines that are harmful to human health. More specifically, standard quartz crystal (S-QCM) and homemade 4 nm gold transmission electron microscopy (TEM)-grid patterned quartz (multi-TEM QCM) are herein proposed for biofunctionalization steps with different ssDNA sequences. By employing a rapid and efficient drop and collect protocol, the specific detection of 1 pg/µL ssDNA Brett of a short sequence and 100 ng/μL DNA of B. bruxellensis extracted from a wine sample (VR2008) is reported.

1. Introduction

Wine is an alcoholic beverage obtained by fermentation of grapes and its production is very important for the three main producers of wine: Italy, France, and Spain [1]. Unfortunately, the presence of Brettanomyces bruxellensis spoilage microorganisms during the wine production, principally in the aging phase, affect the aroma quality and may be responsible for important economic losses.
Brettanomyces bruxellensis was defined as “one of the most complex and controversial issues encountered in the making of red wine” [2]. The presence of volatile phenols, 4-ethylphenol and 4-ethylguaiacol, are specifically responsible for the off-flavor named “Brett character” [3,4]. However, biogenic amines, with well-known human toxicity, and the “mousy off-flavor” associated with N-heterocyclic compounds such as 2-acetyl-tetrahydro-pyridine (ATHP) and 2-ethyl-tetrahydropyridine (ETHP) are also contributing to off-flavors [5].
Fortunately, B. bruxellensis cells are perceivable at very low levels through various standard laboratory techniques: (i) plating methods, (ii) microscopic characterization and (iii) biochemical analysis. These techniques require trained researchers and extended analysis time. On the other hand, modern molecular methods based on PCR techniques may reduce the testing time but suffer from the difficulty to discriminate between viable and non-viable Brett cells [6].
In the last few years, more rapid and sensitive technologies such as DNA biosensors (genosensors) were introduced in food control and clinical detection. These types of biosensors require a capture ssDNA sequence as a bioreceptor, a complementary ssDNA sequence as a target, and a transducer (acoustic, electrochemical or optical) for converting the biorecognition events occurring between the capture probe and its target into a detectable signal [7]. The acoustic transduction named quartz crystal microbalance (QCM), uses a thin piezoelectric circular plate sputtered with two gold electrodes on both sides [8,9].
QCM was used for measurements of chemical [10,11,12], antigen–antibody affinity [13,14,15,16], DNA–DNA hybridization and DNA-cell capture [17,18,19,20] under liquid conditions where the addition or removal of any mass from the crystal would disturb the resonant frequency [21].
The relationship between increases in mass load on the crystal surface and variations in resonant frequency is described by the following Equation (1):
Δ f =     2 f 0 2 A ρ μ Δ m
where f0—the resonant frequency, Δf—the change in resonant frequency of QCM due to mass load (Δm) on the surface, A—is the reactive area of crystal, ρ—the density, and µ—the shear modulus of quartz [22].
In this work, the target ssDNA sequence from B. bruxellensis yeast was detected on quartz crystal biofunctionalized with a captured ssDNA probe sequence using a rapid and efficient drop and collect protocol in the presence of tiny bioreagents volumes. QCM detection of B. bruxellensis in the red wine sample and the influence of TEM-grid patterns on a single crystal used for acquiring different sensitives are also reported.

2. Material and Methods

2.1. Reagents

Ethanol 70% (v/v) and salts for phosphate saline buffer (PBS) based on sodium chloride 1.5 M, sodium phosphate dibasic 81 mM, sodium phosphate monobasic 19 mM, pH 7.4 were provided by Sigma–Aldrich (St. Louis, MO, USA). A Decon 90 detergent was provided by Decon Laboratories TM Decon (Fisher Scientific, Göteborg, Sweden). All chemicals were of analytical grade. Distilled water (18.2 MΩ cm) produced by a Millipore Milli-Q water purification system (Molsheim, France) was sterilized at 121 °C (1.5 bar) for 15 min. The sterilized water was named S-ddwater.

2.2. Materials

Transmission electron microscopy (TEM) copper grids (Gilder Triple slot grid, 0.54 mm × 0.95 mm slots in a 3.05 mm copper grid) were purchased from TED Pella (Redding, CA, USA). Standard quartz crystals (S-QCM) of 5 MHz (Ø = 25.4 mm) with AT-cut and gold electrodes on both sides (Cr/Au—thickness 331 μm) were provided by SRS (O100RX1) (Sunnyvale, CA, USA).

2.3. Instruments

For acoustic measurements we used a QCM200 quartz crystal microbalance (Stanford Research System, Sunnyvale, CA, USA) including a crystal oscillator QCM25 with a crystal holder that could accommodate S-QCM crystal of 5 MHz ((Ø = 25.4 mm). This type of QCM sensor uses a shear mode for measurements.
An autoclave steam sterilizer 2540 ML (Tuttnauer, Villenoy, France) was used to sterilize reagents and lab consumables while an oven provided by the VWR Company (DRY-Line drying oven DL 53) was used for drying the quartz crystals before biofunctionalization steps.
DNA concentrations extracted from Brettanomyces bruxellensis DKA and red wine were estimated using a NanoDrop 2000c (Thermoscientific, Marietta, OH, USA).
A Scanning Electron Microscope (SEM) (FEG-SU8030, Tokyo, Japan) was used for surface characterization of commercial quartz crystal before and after TEM-grid patterning.

2.4. ssDNA Sequences

Three ssDNA sequences were provided by Eurofins Genomic (Tokyo, Japan) as follows:
  • The capture ssDNA-probe sequence (53 nt) targeting the ITS1–ITS2 regions (internal transcribed spacer 1 and 2) of B. bruxellensis DNA modified with a thiol group at its 5′, named SH-capture probe [18];
  • The complementary ssDNA sequence (53 nt) used as a positive control (CS-positive control) and;
  • The non-complementary ssDNA sequence (53 nt) as a negative control (NCS-negative control).
The descriptions of the ssDNA sequences are listed in Table 1. Before acoustic measurements, all three ssDNA sequences were stored at −20 °C.
For Brett-genosensing, the complementary and non-complementary ssDNA sequences were diluted in S-ddwater, to obtain eight concentrations: 100 ng/μL, 10 ng/μL, 1 ng/μL, 100 pg/μL, 10 pg/μL, 1 pg/μL, 100 fg/μL and 10 fg/μL, while the thiol-capture ssDNA probe was diluted in PBS 1X to obtain a concentration of 10 ng/μL (0.56 M).

2.5. Whole DNA Extraction from Microorganisms

B. bruxellensis DKA yeast stored at −80 °C was revitalized in WL differential agar (Oxoid, Milan, Italy) at 30 °C for 5 days. Isolated colonies were checked before DNA extraction according to Manzano et al. [23].

2.6. DNA Extraction from Wine

A bottle of red wine (VR2008) of 0.75 L obtained from an Italian winery (Veneto Region, Italy) was analyzed for the presence of Brettanomyces bruxellensis. After bottle shaking, an aliquot of 2 mL wine was collected for DNA extraction. Finally, the NanoDrop 2000c system was used to measure the concentration of the extracted DNA, which measured precisely 100 ng/μL.

2.7. Cleaning of Commercial Quartz Crystal

2.7.1. For Application without TEM-Grid Patterns—Short DNA Sequence Sensing

The S-QCM crystal was freshly cleaned following several steps: (a) dipping with an ethanol solution (70%, v/v) in an ultrasonic bath (Elmasonic S30H) for 20 min at room temperature (RT), (b) ultrasonication in S-ddwater bath for 10 min at RT, (c) drying at 50 °C for 20 min and (d) storing under the biological hood.

2.7.2. For Micro-/Nano-Patterning with TEM-Grid—Whole DNA Sensing in Wine

The S-QCM crystal was cleaned following five steps: (a) dipping in aqueous solution containing S-ddwater and a detergent (Deacon 90) solution (2/8, v/v) at 50 °C for 15 min in an ultrasonic bath, (b) rinsing with S-ddwater in an ultrasonic bath at 50 °C for 5 min, (c) rinsing again with S-ddwater, (d) drying with a nitrogen stream and (e) drying on a plate at 100 °C for 10 min.

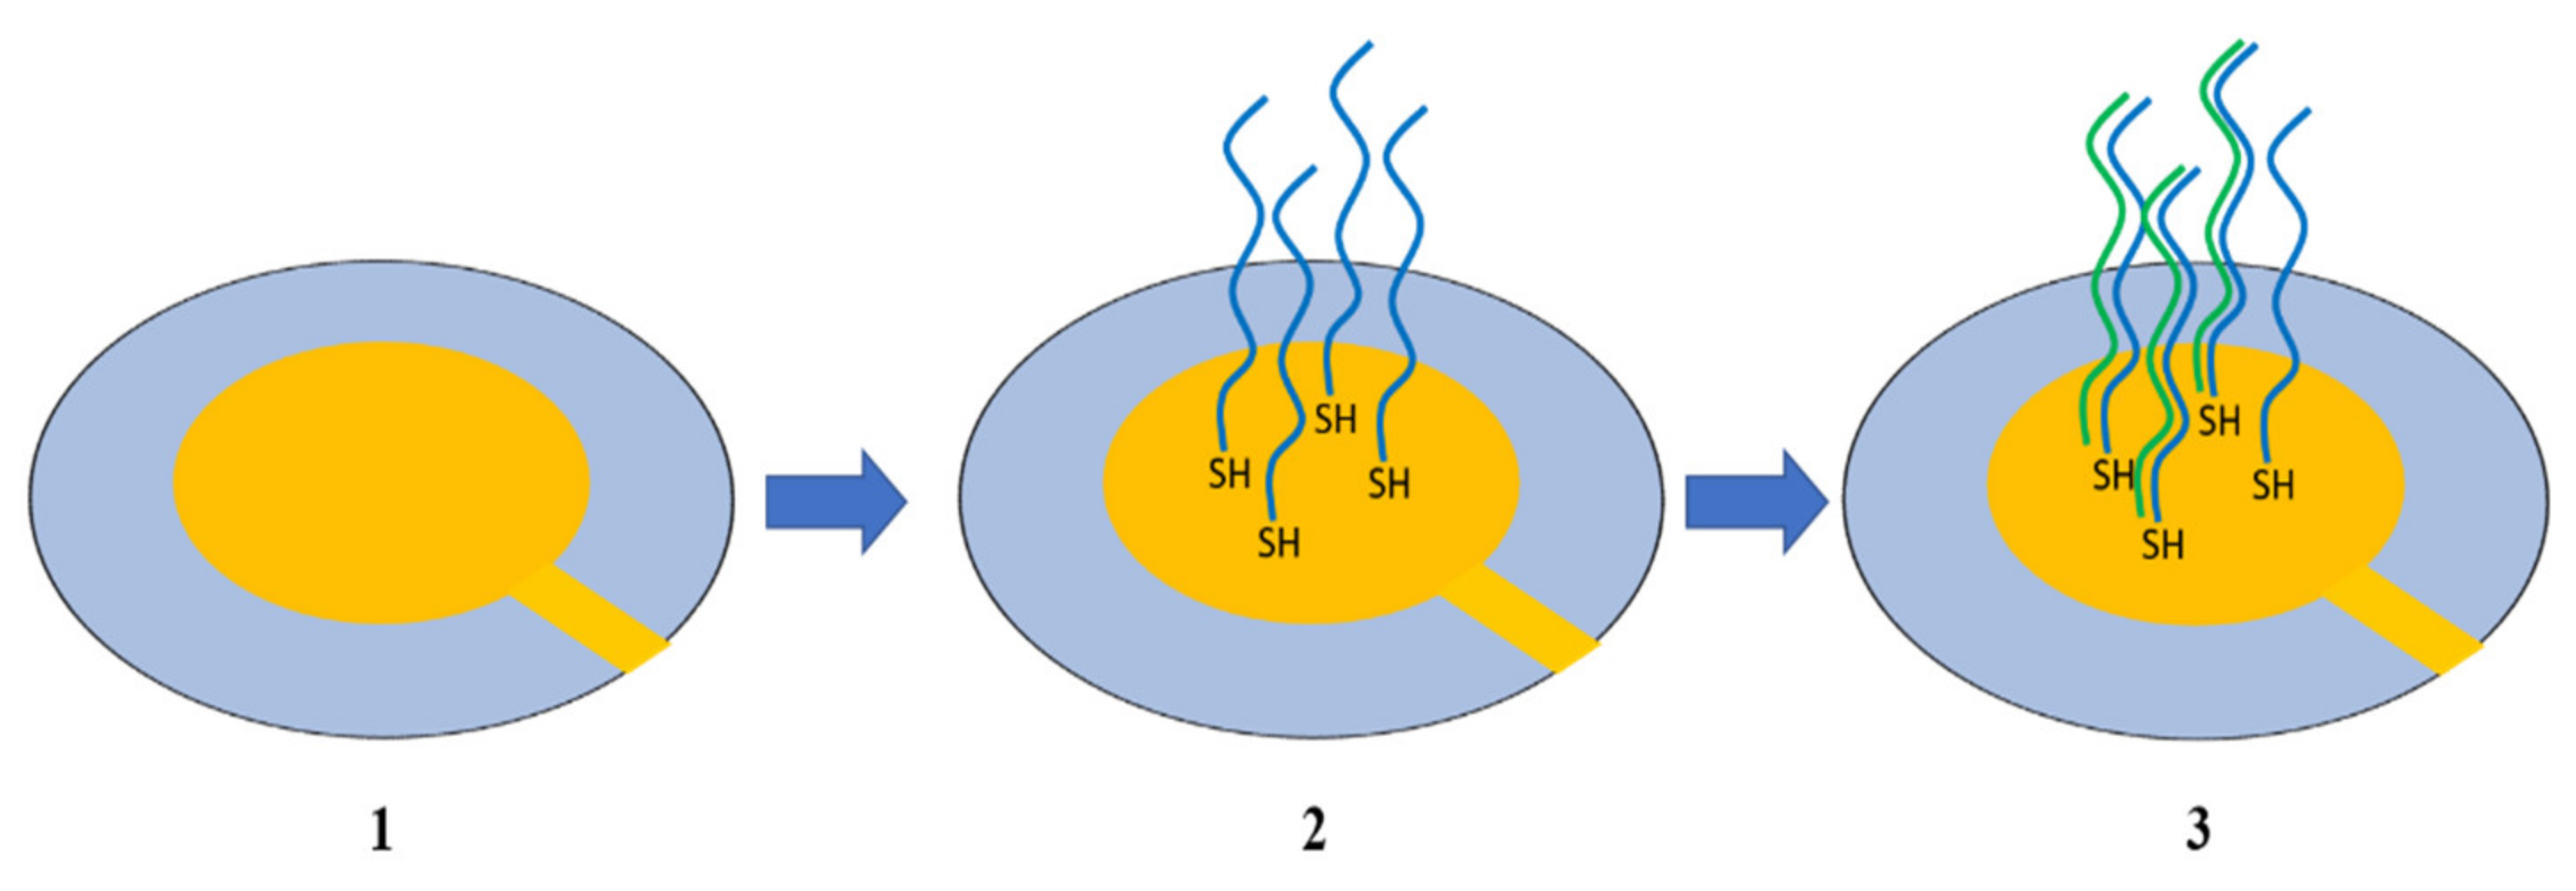
2.8. Biofunctionalization of Quartz Crystal with ssDNA Capture Probe

The SH-capture probe was firstly treated with 10 mM [tris(2-carboxyethyl)phosphine hydrochloride] solution (TCEP) and 3 M sodium acetate to activate the thiol group, and then heated at 85 °C for 5 min and placed immediately on ice. Afterwards, 20 μL of SH-capture probe at 10 ng/μL were drop casted on the gold electrode (Figure 1) and kept at RT overnight. Finally, the functionalized gold surface of the crystal was rinsed with S-ddwater and dried under a biological hood.

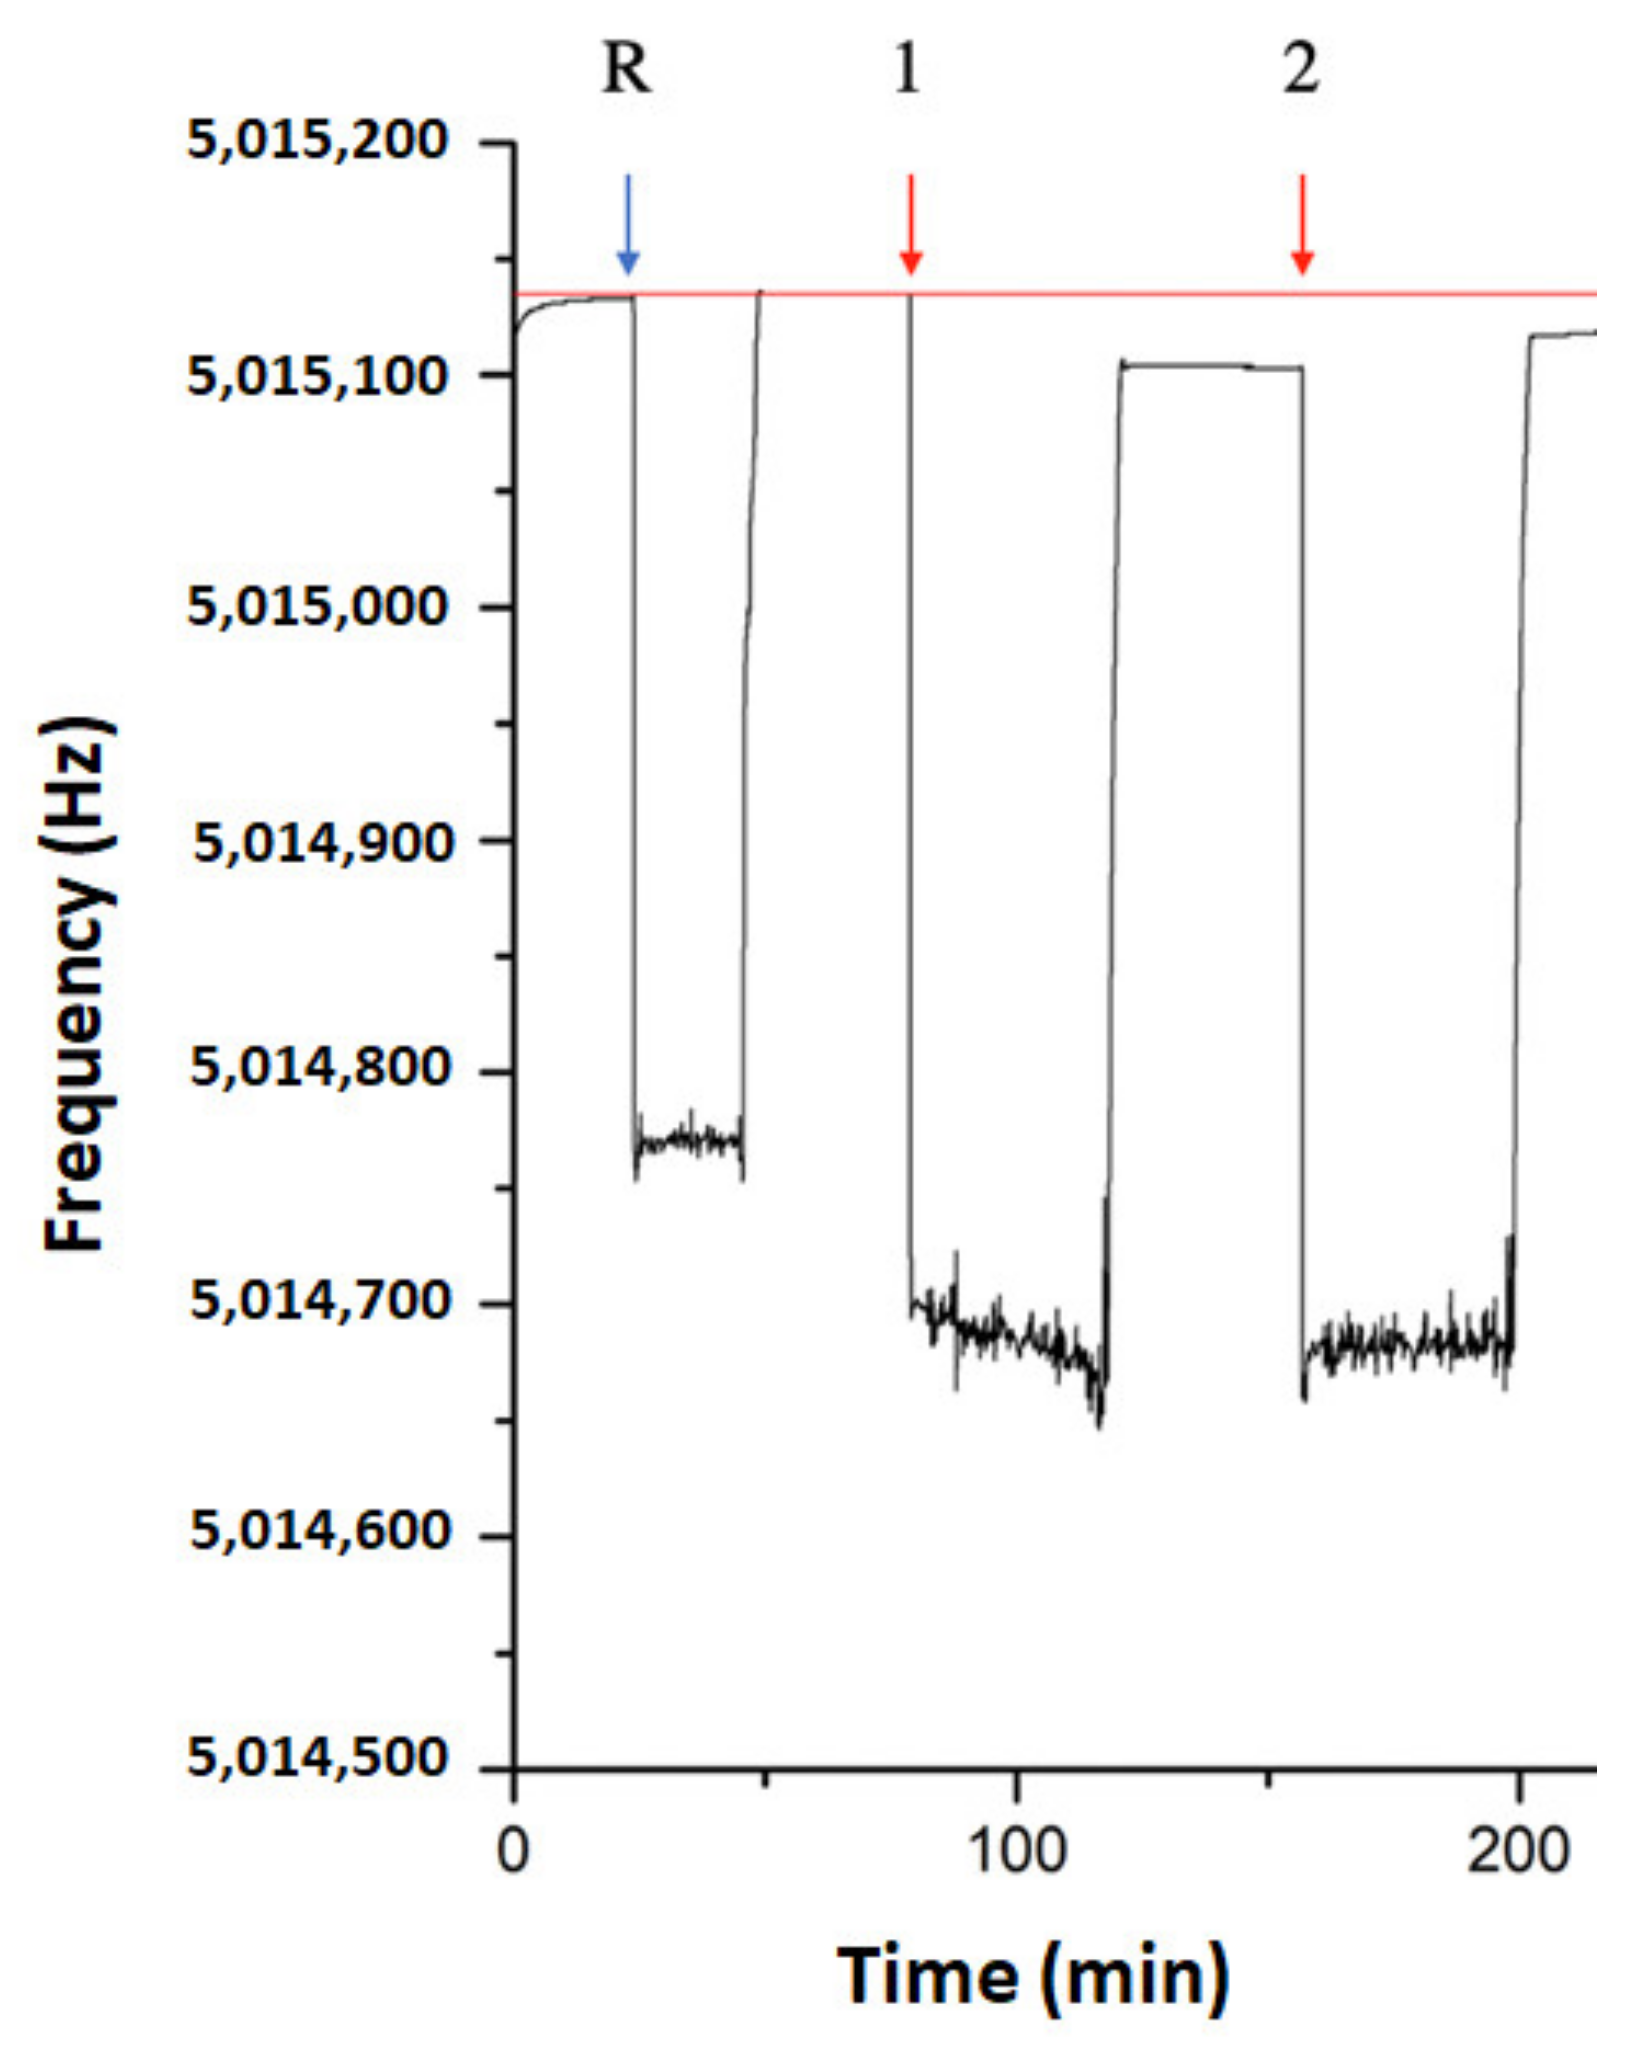
2.9. Drop and Collect Protocol for Acoustic Sensing of CS-Positive Control and NCS-Negative Control

Dried thioled-ssDNA quartz crystal was fixed on the QCM holder for recording (i) the absolute frequency of baseline, (ii) the reference frequency after dropping 10 μL S-ddwater (iii) after water collecting, and (iv) the specific frequency decays after 10 μL dropping and collecting of different complementary or non-complementary ssDNA-Brett concentrations. The waiting time for the dropping and collecting steps was fixed at 15 s/30 min and 15 s/15 min, respectively. All acoustic genosensing experiments were recorded at room temperature (23 °C) and maintained with air conditioning.

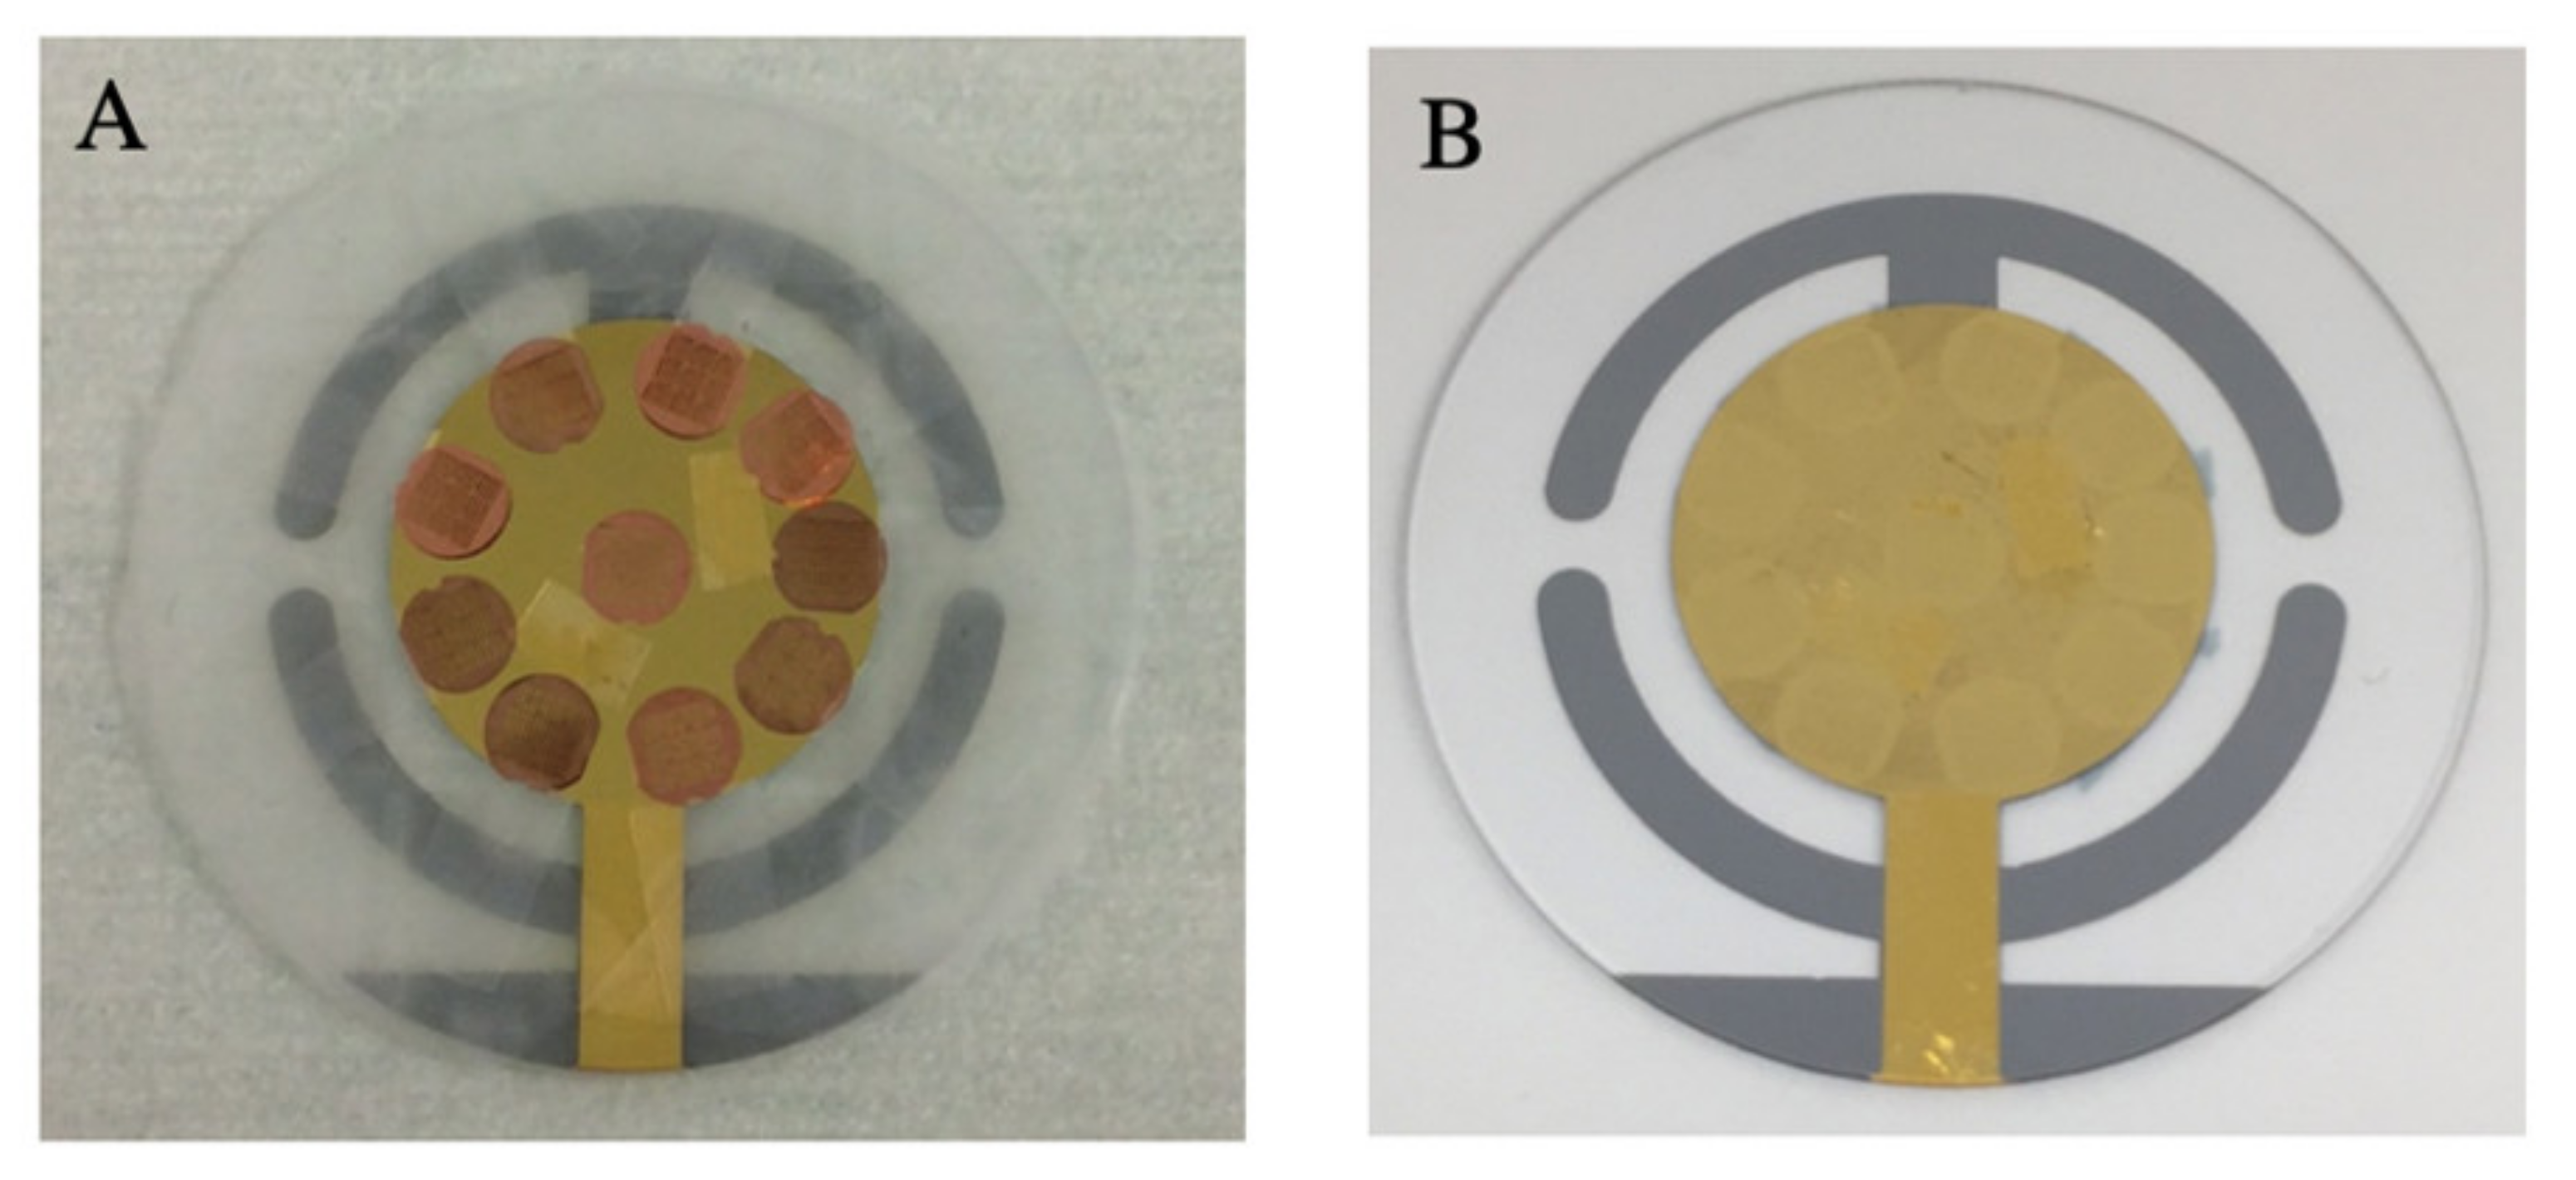
2.10. Multi-TEM Patterned Crystal—Fabrication Steps

A single quartz crystal was patterned with multi-TEM grid slots, with the aim of sequential detection of DNA concentrations using a rapid and low cost drop and collect protocol on the gold electrode.
Gold thin film (4 nm) was evaporated on the upper side of the crystal covered with regular scotch pieces except for the center of the gold electrode, while a second Au evaporation was made possible through 10 TEM grid slots circularly disposed at the electrode borders (Figure 2). The gold evaporation was performed at 25 °C under 1 × 10⁻⁵ Torr pressure with an evaporation gold rate of 0.03 nm/s.

2.11. Evaluation of Gold Grain Sizes Formed through TEM Grid on Quartz Crystal

The size distribution and background proportion were analyzed using the Public Domain ImageJ software developed by the National Institutes of Health based on recorded SEM images.

2.12. Processing the QCM Data

The recorded frequency values were analyzed using the Origin Pro software (OriginLab, MA, USA). The reference line, necessary to observe the hybridization of the CS-positive control with the immobilized SH-capture probe, was created by using a fitting function graphically interpolated at five points before and after deposition of the reference–sterile water (R deposition).
The frequency shifts were obtained as an average of five data measurements obtained through the graphical analysis with Origin, and by subtracting the value of the frequency reference to obtain the Δshift of frequency, which corresponds to the amount of CS-positive control hybridized to the SH capture probe.

3. Results and Discussion

3.1. SEM Characterization of S-QCM Gold Electrode Before and After 4 nm Au Evaporation

The SEM morphology of the S-QCM gold electrode shows dense, continued and inhomogeneous granular nanoislands (Figure 3A), while after the evaporation of the gold thin film (4 nm) through TEM-grids (Figure 3B) the random formation of nanostructures were observed between pre-existent larger nanoislands gold structures [24]. The size distribution of the gold nanoparticles was also analyzed over four selected zones (Figure 3C) based on the recorded SEM image (Figure 3B). Thus, whatever the selected zone, a narrow distribution of the nanoparticles in the range of 4–12 nm was estimated, while the most abundant nanoparticles sizes were 8 nm NPs (from 27.5 to 35%). Overall, the size distribution of NPs is almost symmetrical over the four zones with some negligible size differences in the formation process.

3.2. Genosensing of ssDNA-Brett on S-QCM Gold Electrode—Positive and Negative Controls Using Drop and Collect Protocol

The S-QCM crystal biofunctionalized with the SH-capture probe was placed in the QCM holder. After frequency stabilization in the air at RT, 10 μL of S-ddwater (R) was dropped in the center of the crystal when a rapid frequency decay was monitored over 10 min, followed by the collection of water drops when the frequency signal returned to the initial baseline in the air.
To investigate the biosensing performances, positive (complementary ssDNA) and negative (non-complementary ssDNA) controls were prepared in the presence of six concentrations: (1) 1 pg/μL, (2) 10 pg/μL, (3) 100 pg/μL, (4) 1 ng/μL, (5) 10 ng/μL and (6) 100 ng/μL ssDNA complementary and non-complementary sequence, respectively, using the drop and collect protocol.
Dose-response calibration curves (Figure 4) were proposed based on the variation of the frequency Δfrequency = (freffi) calculated by subtracting the reference vibration frequency of the quartz (fref) prior dropping to the measured frequencies (fi) versus the concentration of tested ssDNA Brett probes. The frequency—fi was measured after collecting the 10 μL drop and washing the gold electrode with S-ddwater, and after the signal stabilization.
As shown in Figure 4, in the presence of the CS-positive control, Δf is always negative, decreases monotonically with respect to the logarithm of the content (R2 = 0.9627), which confirms the expected analytical performance of the biosensor for the detection of the specific target. The detection limit is 1 pg/µL and is in good agreement with the Sauerbrey’s equation, which predicts a decrease in frequency at the increase the added mass on the quartz surface. Moreover, Δf is mainly positive for NCS-negative control showing an anti-Sauerbrey’s behavior. These results underline the selectivity of the acoustic Brett biosensor, which can unambiguously distinguish between CS-positive and NCS-negative controls.

3.3. Brett Genosensing in Wine Sample Using S-QCM Crystal

The functionalized S-QCM crystal was exposed to 100 ng/μL DNA extracted from a wine sample (VR2008) and to 100 pg/μL DNA from B. bruxellensis DSMZ 70726 (Figure 5).
As expected, no frequency shift was recorded after collecting the S-ddwater (R) drop, while frequency decays were obtained for the wine and B. bruxellensis DSMZ 70726 samples (−31.2 Hz and −16.8 Hz, respectively), indicating the specific interaction between the probe and the target.
It should be noted that the DNA content could not be directly deduced from the calibration curve presented in Section 3.2. because the mass of the ssDNA short sequences (CS-positive control) was not comparable with the longer dsDNA extracted from the wine sample VR2008.

3.4. Genosensing on TEM-Patterned QCM

Drops (5 μL) of a CS-positive control based on ssDNA Brett sequence at 1 pg/μL were circularly placed on the micro-/nano-structured areas surrounding the center of the QCM gold electrode. The decrease in the resonance frequency was rapidly recorded, confirming the potential of the newly structured QCM for multi-detection of bioreagents on the same quartz crystal.
It is worthwhile to note that the observed decreases in frequency depend on the spatial position of the micro-/nano-structured areas. This demonstrates that the sensitivity is different on the crystal’s surface, which is equivalent to existing gauges on some measuring instruments. These results confirm the possibility to adapt the detection strategy starting from the less sensitive area and continuing the process until a response is monitored. The authors recently suggested this approach by adjusting the size of the annealed nanoparticles instead of controlling the spatial distribution of the TEM patterned zones over the quartz crystal [24].

4. Conclusions

A short ssDNA sequence probe (53 bp) was used for the biofunctionalization of S-QCM and TEM-patterned QCM with the aim of specific (positive control) and non-specific (negative control) acoustic detection of ssDNA strain from Brettanomyces bruxellensis. The resulting genosensor was further tested in the presence of full-length ssDNA extracted from the red wine sample contaminated with Brett cells. It should be noted that the acoustic sensing required tens of microliters (10 µL) and an accessible newly developed drop and collect protocol applicable in the center of the crystal’s gold electrode. The specific control on the S-QCM crystal showed the detection of ssDNA Brett traces as low as 1 pg/µL that could be ascribed to about 100 cells of B. bruxellensis (considering that one yeast cell contains about 10 fg/μL DNA). Furthermore, biofunctionalization of multi-TEM grids circularly disposed on the S-QCM crystal, with thiol ssDNA probe, made possible for the first time the sequential detection of the Brett complementary ssDNA strain in several crystal areas. Thus, such TEM chip crystals open new horizons for multiplexing detection of various concentrations of target biological molecules.

Author Contributions

Conceptualization, R.E.I.; formal analysis, G.C.B., R.M. and R.E.I.; funding acquisition, R.E.I. and M.M.; investigation, S.P.; methodology, S.P., L.Z. and R.E.I.; project administration, R.E.I.; software, S.P.; supervision, R.E.I.; visualization, G.C.B.; writing—original draft, S.P.; writing—review & editing, R.E.I. All authors have read and agreed to the published version of the manuscript.

Funding

This research was funded by EIPHI Graduate School, grant number ANR17-EURE-0002.

Institutional Review Board Statement

Not applicable.

Informed Consent Statement

Not applicable.

Data Availability Statement

The data presented in this study are available within the article.

Acknowledgments

The authors thank the NANOMAT Champagne–Ardenne Regional Platform for optical and microscopic characterization facilities. L.Z. kindly thanks the Chinese Scholarship Council (CSC) for funding her doctoral scholarship in France (October 2017–April 2021). S.P. thanks the University of Udine for funding a three-month Master’s Program in France (September 2018–December 2018) Prot. N. 0037920 del 18-12-2017. R.E.I. and G.C.B. thank the EIPHI Graduate School (ANR17-EURE-0002) for financial support.

Conflicts of Interest

The authors declare no conflict of interest.

References

  1. Cibrario, A.; Avramova, M.; Dimopoulou, M.; Magani, M.; Miot-Sertier, C.; Mas, A.; Portillo, M.C.; Ballestra, P.; Albertin, W.; Masneuf-Pomrede, I.; et al. Brettanomyces bruxellensis wine isolates show high geographical dispersal and long persistence in cellars. PLoS ONE 2019, 14, e0222749. [Google Scholar] [CrossRef] [PubMed] [Green Version]
  2. Tindal, R.A.; Jeffery, D.W.; Muhlack, R.A. Mathematical modelling to enhance winemaking efficiency: A review of red wine colour and polyphenol extraction and evolution. Aust. J. Grape Wine Res. 2021, 27, 219–233. [Google Scholar] [CrossRef]
  3. Puecher, C.; Rohregger, S.; Malacarne, M.; Nicolini, G. 4-Ethylphenol and 4-ethylguaiacol depletion in wine using esterified cellulose. Food Chem. 2012, 132, 2126–2130. [Google Scholar]
  4. Tubia, I.; Prasad, K.; Perez-Lorenzo, E.; Abadin, C.; Zumarraga, M.; Oyanguren, I.; Barbero, F.; Paredes, J.; Arana, S. Beverage spoilage yeast detection methods and control technologies: A review of Brettanomyces. Int. J. Food Microbiol. 2018, 283, 65–76. [Google Scholar] [CrossRef] [PubMed]
  5. Durmuş, N.G.; Lin, R.L.; Kozberg, M.; Dermici, D.; Khademhosseini, A.; Demirci, U. Acoustic-Based Biosensors BT—Encyclopedia of Microfluidics and Nanofluidics; Springer: New York, NY, USA, 2015. [Google Scholar]
  6. Su, J.; Esmaeilzadeh, H.; Zhang, F.; Yu, Q.; Cernigliaro, G.; Xu, J.; Sun, H. An Ultrasensitive Micropillar-based Quartz Crystal Microbalance Device for Real-time Measurement of Protein Immobilization and Protein-Protein Interaction. Biosens. Bioelectron. 2018, 99, 325–331. [Google Scholar] [CrossRef] [PubMed]
  7. Buck, R.P.; Lindner, E.; Kutner, W.; Inzelt, G. Piezoeletric chemical sensors. Pure Appl. Chem. 2004, 76, 1139–1160. [Google Scholar] [CrossRef]
  8. Meccea, V.M. From Quartz Crystal Microbalance to Fundamental Principles of Mass Measurements. Anal. Lett. 2005, 38, 753–767. [Google Scholar] [CrossRef]
  9. Mujahid, A.; Dickert, F.L. Surface Acoustic Wave (SAW) for Chemical Sensing Applications of Recognition Layers. Sensors 2017, 17, 2716. [Google Scholar] [CrossRef] [Green Version]
  10. Chen, J.Y.; Penn, L.S.; Xi, J. Quartz Crystal Microbalance: Sensing Cell-substrate Adhesion and Beyond. Biosens. Bioelectron. 2018, 99, 593–602. [Google Scholar] [CrossRef]
  11. Liu, K.; Zhang, C. Volatile Organic Compounds Gas Sensor Based on Quartz Crystal Microbalance for Fruit Freshness Detection: A Review. Food Chem. 2021, 334, 1277615. [Google Scholar] [CrossRef]
  12. Wang, L.; Gao, J.; Xu, J. QCM Formaldehyde Sensing Materials: Design and Sensing Mechanism. Sens. Actuators B Chem. 2019, 293, 71–82. [Google Scholar] [CrossRef]
  13. Jia, K.; Adam, P.M.; Ionescu, R.E. Sequential Acoustic Detection of Atrazine Herbicide and Carbofuran Insecticide Using a Single Micro-structured Gold Quartz Crystal Microbalance. Sens. Actuators B Chem. 2013, 400–404. [Google Scholar] [CrossRef]
  14. Lien, T.T.N.; Lam, T.D.; An, V.T.H.; Hoang, T.V.; Quang, D.T.; Khieu, D.Q.; Kim, J.S. Multi-wall Carbon Nanotubes (MWCNTs)-Doped Polypyrrole DNA Biosensor for Label-free Detection of Genetically Modified Organisms by QCM and EIS. Talanta 2010, 80, 1164–1169. [Google Scholar] [CrossRef]
  15. Asai, N.; Shimizu, T.; Shingubara, S.; Ito, T. Fabrication of Highly Sensitive QCM Sensor using AAO Nanoholes and its Application in Biosensing. Sens. Actuators B Chem. 2018, 276, 534–539. [Google Scholar] [CrossRef]
  16. Lim, H.J.; Saha, T.; Tey, B.T.; Tan, W.S.; Ooi, C.W. Quartz Crystal Microbalance-based Biosensors as Rapid Diagnostic Devices for Infectious Diseases. Biosens. Bioelectron. 2020, 168, 112513. [Google Scholar] [CrossRef]
  17. Hao, R.Z.; Song, H.B.; Zuo, G.M.; Yang, R.F.; Wei, H.P.; Wang, D.B.; Cui, Z.Q.; Zhang, Z.; Cheng, Z.X.; Zhang, X.E. DNA Probe Functionalized QCM Biosensor based on Gold Nanoparticle Amplification for Bacillus Anthracis Detection. Biosens. Bioelectron. 2011, 26, 3398–3404. [Google Scholar] [CrossRef]
  18. Mecea, V.M. Is Quartz Crystal Microbalance Really a Mass Sensor? Sens. Actuators A Phys. 2006, 128, 270–277. [Google Scholar] [CrossRef]
  19. Wachiralurpan, S.; Chansiri, K.; Lieberzeit, P.A. Direct Detection of Listeria Monocytogenes DNA Amplification Products with Quartz Crystal Microbalance. Sens. Actuators B Chem. 2020, 308, 127678. [Google Scholar] [CrossRef]
  20. Shibata, H.; Nemoto, J.; Shiba, S.; Yamane, Y.; Kawai, G.; Hashimoto, K. Immobilization of DNA on Quartz Crystal Microbalance Sensor Modified with Self-assembled Monolayer of Thiol Derivative. J. Oleo Sci. 2020, 69, 271–276. [Google Scholar] [CrossRef] [PubMed]
  21. Latif, U.; Can, S.; Hayden, O.; Grillberger, P.; Dickert, F.L. Sauerbrey and anti-Sauerbrey Behavioral Studies in QCM Sensors—Detection of Bioanalytes. Sens. Actuators B Chem. 2013, 176, 825–830. [Google Scholar] [CrossRef]
  22. Manzano, M.; Cocolin, L.; Longo, B.; Comi, G. PCR-DGGE Differentiation of Strains of Saccharomyces sensu stricto. Antonie Leeuwenhoek Int. J. Gen. Mol. Microbiol. 2004, 85, 23–27. [Google Scholar] [CrossRef] [PubMed]
  23. Cecchini, F.; Manzano, M.; Yohai Mandabi, Y.; Perelman, E.; Marks, R.S. Chemiluminescent DNA Optical Fibre Sensor for Brettanomyces bruxellensis Detection. J. Biotechnol. 2012, 157, 25–30. [Google Scholar] [CrossRef] [PubMed]
  24. Casari Bariani, G.; Zhou, L.; Poggesi, S.; Mittapalli, R.; Manzano, M.; Ionescu, R.E. Multi-Detection of Gliadin Using QCM Crystals Patterned with Controlled Sectors of TEM Grid and Annealed Nanoislands on Gold Electrode. Nanomaterials 2020, 10, 790. [Google Scholar] [CrossRef] [PubMed]
Figure 1. Biofunctionalization of commercial quartz crystal microbalance (QCM) electrode (1), immobilization of the SH capture probe (2) and addition of the CS-positive control (3).
Crystals 11 00562 g001
Figure 2. Fabrication of micro-/nano-patterned quartz crystal with TEM grids slots before (A) and after (B) evaporation of 4 nm Au and grids collection.
Crystals 11 00562 g002
Figure 3. Scanning electron microscopy (SEM) characterization of standard QCM gold electrode (S-QCM) before (A) and after evaporation of 4 nm gold film through TEM-grids (B) with the size distribution of formed Au NPs over 4 zones (C). Scale bar: 300 nm.
Crystals 11 00562 g003
Figure 4. Dose-response curves of CS-positive control (blue) and NCS-negative control (red) tested with the SH-capture probe immobilized on S-QCM crystal. The concentrations used for both experiments were: (1) 1 pg/μL; (2) 10 pg/μL; (3) 100 pg/μL; (4) 1 ng/μL; (5) 10 ng/μL and (6) 100 ng/μL.
Crystals 11 00562 g004
Figure 5. Sensorgram of the functionalized S-QCM crystal before and after exposure to 10 µL S-ddwater (R), 10 µL wine sample VR2008 (1) and 10 µL B. bruxellensis DSMZ 70726 (2).
Crystals 11 00562 g005
Table 1. Description of ssDNA sequences. In red are the differences of negative and positive controls.
Thiol-probe
(SH-capture probe)
[ThiolC6]TGTTTGAGCGTCATTTCCTTCTCACTATTTAGTGGTTATGAGATTACACGAGG (53 bp)
Complementary sequence
(CS-positive control)
CCTCGTGTAATCTCATAACCACTAAATAGTGAGAAGGAAATGACGCTCAAACA(53 bp)
Non-complementary sequence
(NCS-negative control)
CCTAAGGTAATAGCATAAGTACTAAATAACCAGAATCAAAGAACGCTCAACTT (53 bp)
Publisher’s Note: MDPI stays neutral with regard to jurisdictional claims in published maps and institutional affiliations.

