
Azimuthal Anchoring Strength in Photopatterned Alignment of a Nematic
by

H. Nilanthi Padmini
1,2, 
Mojtaba Rajabi
1,2,
Sergij V. Shiyanovskii
1,3 and
Oleg D. Lavrentovich
1,2,3,* 1
Advanced Materials and Liquid Crystal Institute, Kent State University, Kent, WA 44242, USA
2
Department of Physics, Kent State University, Kent, WA 44242, USA
3
Materials Science Graduate Program, Kent State University, Kent, WA 44242, USA
*
Author to whom correspondence should be addressed.
Crystals 2021, 11(6), 675; https://0-doi-org.brum.beds.ac.uk/10.3390/cryst11060675
Submission received: 19 May 2021
/
Revised: 3 June 2021
/
Accepted: 9 June 2021
/
Published: 11 June 2021
(This article belongs to the Special Issue In Celebration of Noel A. Clark’s 80th Birthday)
Abstract
:Spatially-varying director fields have become an important part of research and development in liquid crystals. Characterization of the anchoring strength associated with a spatially-varying director is difficult, since the methods developed for a uniform alignment are seldom applicable. Here we characterize the strength of azimuthal surface anchoring produced by the photoalignment technique based on plasmonic metamsaks. The measurements used photopatterned arrays of topological point defects of strength +1 and −1 in thin layers of a nematic liquid crystal. The integer-strength defects split into pairs of half-integer defects with lower elastic energy. The separation distance between the split pair is limited by the azimuthal surface anchoring, which allows one to determine the strength of the latter. The strength of the azimuthal anchoring is proportional to the UV exposure time during the photoalignment of the azobenzene layer.
1. Introduction
Anisotropy of molecular interactions at bounding surfaces of liquid crystals leads to the phenomenon of surface anchoring, i.e., a preferred “easy axis” of the director specifying the average orientation of the molecules. Surface anchoring is characterized by geometrical parameters, such as the polar and azimuthal direction of the easy axis. Using the energy parameters, the so-called anchoring coefficients measure the work needed to deviate the director from the easy axis [1]. For planar alignment, with the easy axis parallel to a certain direction in the plane of a substrate, one distinguishes azimuthal and polar anchoring coefficients, related to the in-plane and out-of-plane director tilts, respectively.
For decades, the prime mode of liquid crystal alignment was a uniform one, with the director independent of spatial coordinates. There is a growing interest in alignment modes with the director varying from point to point. The patterned alignment is used, for example, in planar optics [2,3,4,5,6], bistable switching [7], shaping liquid crystal elastomers [8,9,10,11], controlling dynamics of microswimmers [12,13], and living tissues [14]. The patterned surface alignment is difficult to achieve by traditional approaches, such as mechanical rubbing [15]. Early works reported that alignment patterns could be produced by scribing the substrate with the atomic force microscope’s stylus [16,17]. The most popular current approach to produce patterned director fields is photoalignment, based on photosensitive molecules that adjust their orientation with respect to the polarization direction of impinging light [6,15,18,19]. Photoalignment is less prone to problems such as the introduction of dust particles [15]. One of the most widely used mechanisms of photoalignment is the orientational ordering of azobenzene molecules that experience trans-cis isomerization and reorientation under illumination with linearly polarized light [15]. Isomerizations and reorientations result in the alignment of long axes of trans-isomers along the direction of minimum light absorption, i.e., perpendicularly to the polarization of light [15,18,19]. There have been many different implementations of azobenzene-based photoalignment. For example, McConney et al. [20] used a laser beam with a controllable direction of polarization to irradiate a rotating substrate with a photosensitive azobenzene layer, thus producing axially-symmetric patterns, also known as q-plates [21,22,23,24]. Culbreath et al. [25] introduced a maskless digital micromirror photopatterning technique that allows one to create an array of disclinations. Most recently, Guo et al. [26,27,28] introduced a method based on plasmonic metamasks (PMMs), which allows one to imprint the entire pattern of director alignment in a single exposure, with a high spatial resolution of 1 μm. Besides high speed of production and high resolution, the advantage is that the same mask can be used repeatedly for multiple exposures with a steady long-term performance.
Most of the research on photoalignment emphasizes the geometrical features such as the direction of the easy axis, while studies on anchoring strength and its dependence on the conditions of substrate preparation are less common. Previous reports on surface anchoring coefficients characterizing the photoalignment technique have dealt with a uniform alignment of liquid crystals, (see for example [29,30,31,32,33,34]). However, the anchoring strength established in a patterned director field is not necessarily the same as in a cell with a uniform director, one of the reasons being the difference in photomasks. In this work, we present the experimental study of the in-plane (azimuthal) surface anchoring coefficient in spatially-varying director patterns produced by the PMM technique. A key question is how strong this anchoring is and how its strength depends on the irradiation time. The measurements of are based on the recently proposed analysis of splitting defect cores of integer disclinations at patterned substrates [14]. The experimental cells are of a sandwich type with both substrates photoaligned through the same PMMs to form surface director patterns in the form of square lattices of alternating and −1 disclinations. The cells are very thin, in the order of 1 μm, to assist the bulk director to remain parallel to the bounding plates. If the azimuthal anchoring were infinitely strong, these patterns would preserve the imposed director field with well-defined +1 and −1 core regions. However, when the surface anchoring is finite, the pre-patterned defects’ cores split into pairs of defects for energetic reasons. The value of is deduced by measuring the separation distance between the split defect cores.
2. Materials and Methods
2.1. Cell Preparation
We used clean indium tin oxide (ITO) coated glass plates as cell substrates. A solution of 0.5 wt% azo-dye Brilliant Yellow (BY), Figure 1a, in dimethylformamide (DMF) (both purchased from Sigma Aldrich) was spin-coated onto the glass substrates. The coated substrates were baked on a hotplate at 80 °C for 30 min. The preparation was performed inside a glovebox with the humidity level controlled to be at 20%. The cells were sealed using epoxy glue NOA 65 without any spacers to achieve the thickness of around 1 μm. The cell thickness, h, was measured by an interferometric technique using a UV/VIS spectrometer, Lambda 18 (Perkin Elmer). The separation distance of half-strength defect cores, , depends on the photopatterning time duration and the thickness of the nematic layer. It was expected that d might be a function of the cell thickness h; in particular, in very thick samples, h >> d, such as cylindrical capillaries, the escape into the third dimension is a preferred equilibrium state [35,36]. Even when the integer strength line splits into two half-integer lines, their elastic interactions might yield curved shapes, which would be detrimental for the surface anchoring measurements. To avoid these effects, the experiments were designed with very thin cells, (0.9–1.3). In thin samples, one would expect the core splitting as a prevailing director structure [37]. To verify whether d depends on h, different thin cells were explored. In weakly anchored cells (irradiation time 2 min), the value of d remained constant in the cells with . For irradiation time 6 min, for the three cells of thicknesses . We conclude that the data on collected for cells of the thickness less than 1.3 are not affected by h and thus can be used for the determination of .
2.2. Photopatterning Method
The director field was patterned using the PMM technique [26]. A PMM represents a 150 nm thick Al film with an array of nanoslits, each of a length 220 nm and width 100 nm. The nanoslits are arranged in the form of square lattices with long axes forming +1 and −1 defects (Figure 2a). An unpolarized light beam passing through the nanoslit becomes polarized along the short axis of the local aperture. When the optical pattern with spatially-varying linear polarization of light irradiates the azobenzene layers on the inner surfaces of the cell, it aligns the BY molecules perpendicular to the local polarization of the impinging light. In other words, the molecules align parallel to the long axes of the nanoslits, and the desired surface director pattern of the azobenzene layer reproduces the pattern of nanoslits. A nematic in contact with the patterned azo-dye layer acquires the same molecular orientation pattern with the director being tangential to the interface. We used a light source EXFO X-Cite with a spectral range of (320–750) nm to irradiate empty cells formed by two parallel glass plates with inner BY coatings. The plates acquired the same alignment pattern as the pattern of nanoslits in PPM, enlarged by a factor of 10 by a pair of objectives [26], Figure 2a,b. The light beam propagated along the normal to both the PMM and the cell, and the intensity is at the location of the cell. The distance between +1 and −1defects in the cells was 200 μm, which assured that the splitting distance of defects, which was on the order of 10 μm or less in the experiments, was not influenced by the proximity of other defects.
Two periodic square lattices of defects with strength +1 and −1 were designed, with the director field written using a superposition rule as , where , x and y are Cartesian coordinates, p and q are the numbers of defects in rows and columns, respectively, was the distance between the defects along the x and y directions, respectively, and the phase defines the prevailing director deformation, splay or bend, around the +1 defects. Two types of lattices were used. In the first, which we call a radial array, , the director field around the cores of +1 defects was radial, experiencing mostly splay. In the second pattern, called a circular array, the director around +1 defect was circular, , with a prevalent bend.
2.3. Nematic Material
The cells with photopatterned substrates were filled by capillary action with 4-butyl-4-heptyl-bicyclohexyl-4-carbononitrile (CCN-47), Figure 1b, in the isotropic state at the temperature 64 °C. The material showed the following phase diagram upon heating: Smectic A 29.9 °C Nematic 58.5 °C Isotropic. After the cells were filled, they were kept at 45 °C for the duration of the experiments.
The nematic phase of CCN-47 was chosen because of the following two reasons. First, at 45 °C, the elastic constants of splay and of bend of CCN-47 are equal, [38], which allows one to use the superposition rule for the director field and to analyze the elastic properties of the patterns in the so-called one-constant approximation [1]. Second, CCN-47 is of a negative dielectric anisotropy, , where and are dielectric permittivities parallel and perpendicular to the director, respectively. An AC electric field (frequency 4 kHz) applied across the cell using the top and bottom transparent ITO electrodes stabilized the director patterns in the plane parallel to the bounding plates, thus preventing [37] the potential escape of the defects into the third dimension [35,36,37].
A full-wavelength () optical compensator helped to reconstruct the director field in the nematic cells, Figure 2c. The regions in which the director was parallel to the slow axis of the compensator acquired a blue interference color. When the director was perpendicular to the slow axis, that area appeared yellow. The left defect in Figure 2c was a +1 radial defect, while the right one was a −1defect.
Cell preparation, photopatterning, filling with CCN47, and imaging were done on the same day to prevent any aging effect. It was expected that the temperature [39] and humidity [40] during the sample preparation and irradiation would affect the values of W. W would also be a function of temperature after the cell is assembled [41]. To avoid these effects, all experiments were performed at fixed conditions. Humidity and temperature were kept at 20% and 22–23 °C respectively, until the cells were filled with the nematic CCN-47. During the measurements of W, the cells’ temperature was fixed at 45 °C.
2.4. Optical Retardance of the Patterns
For accurate determination of the director alignment and splitting distance we used Exicor MicroImager (Hinds Instruments, Inc.) mapping of optical phase retardation. For the director in the plane of the cell, the optical phase retardance is , where and are the extraordinary and ordinary refractive indices of CCN-47 at 45 °C, respectively. The expected retardance for 1 cell is thus . The defect cores show a steep decrease in retardation.
3. Results
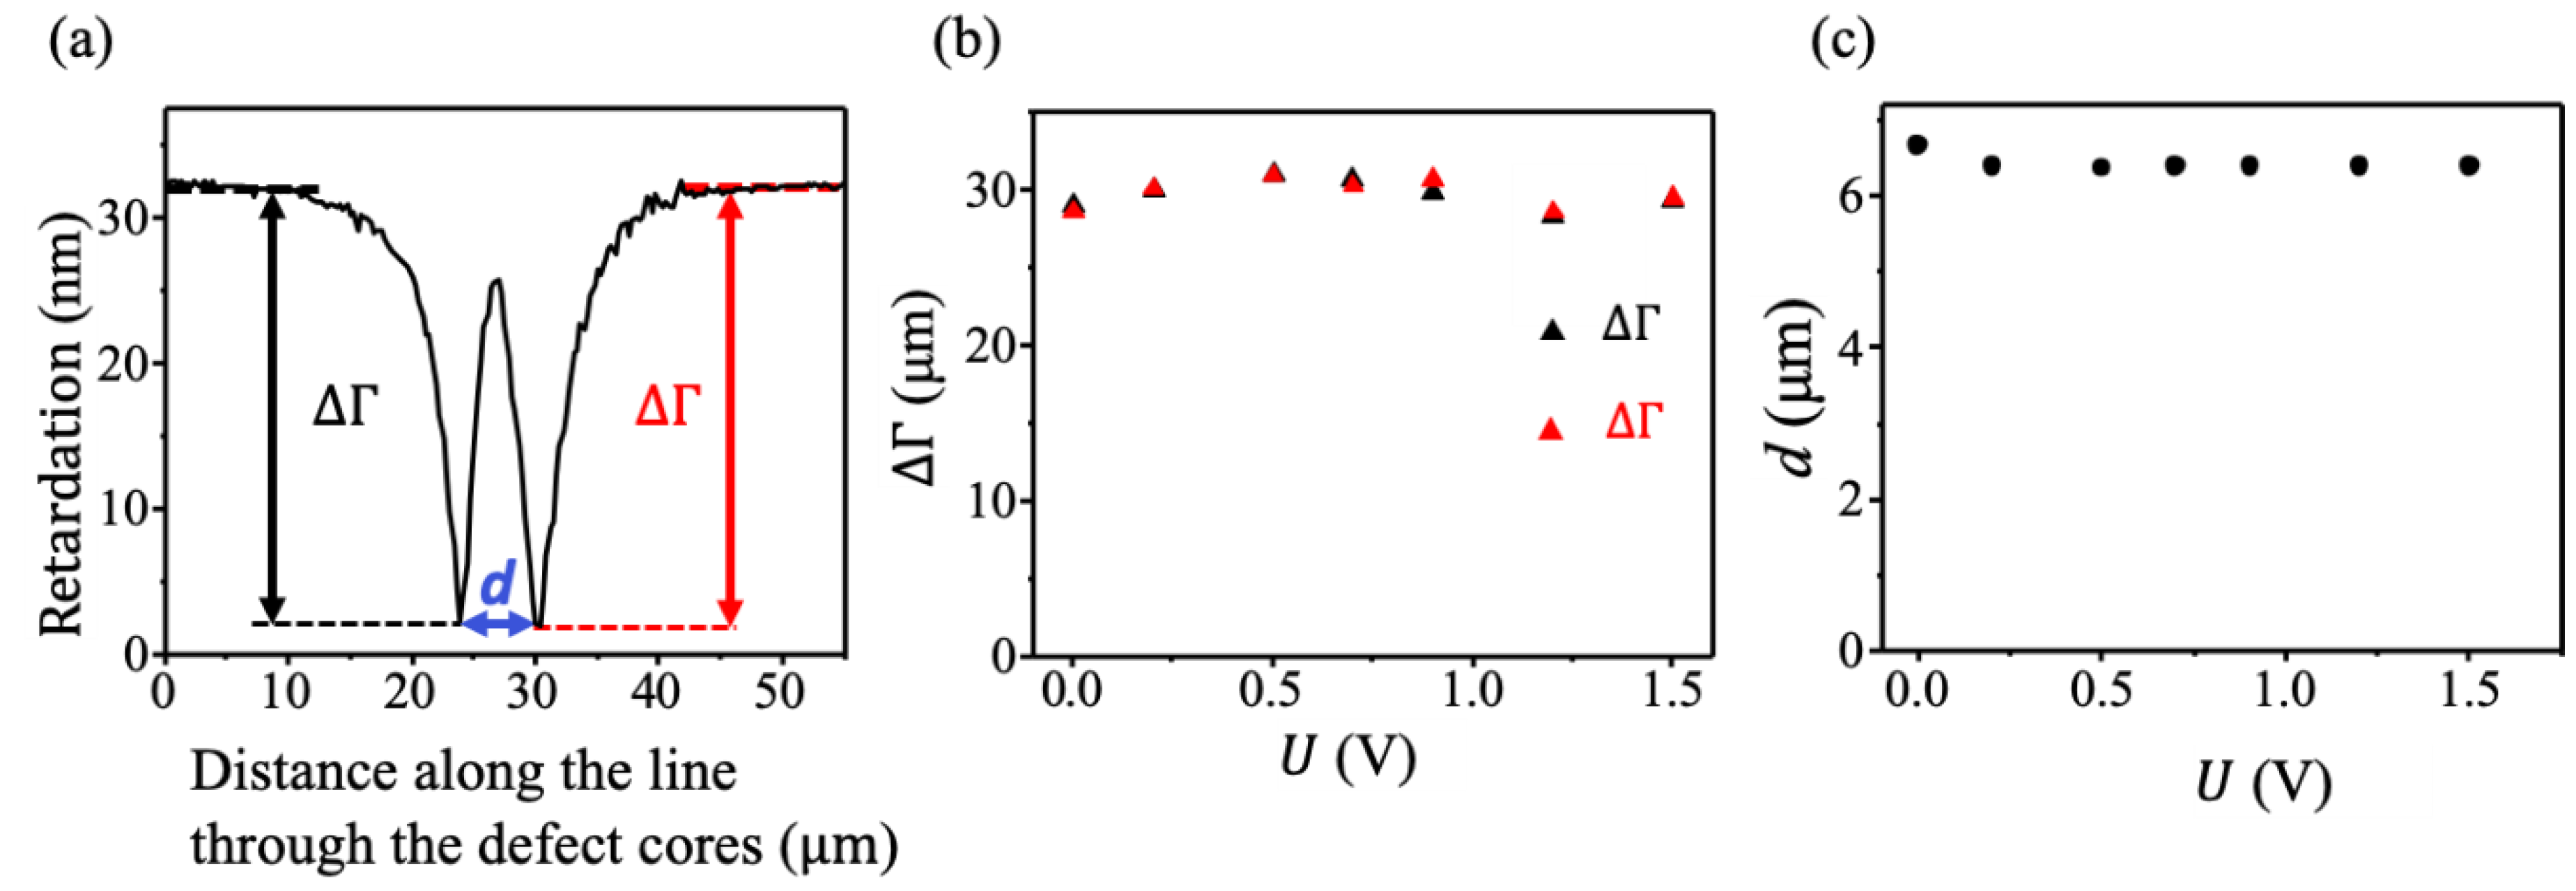
The defects in the observed textures clearly split into pairs of ½ defects, Figure 2b,c, Figure 3, and Figure 4. The split distance was determined as the distance between the minima of the optical retardance, Figure 3a. To verify whether the director remained mainly in plane, we monitored how the phase retardance of the cell changes in the presence of the electric field applied along the -axis normal to the cell. Neither the optical retardance , Figure 3b, nor d, Figure 3c changed when the electric field was applied. The result verifies that the director was confined in the plane of the cell and showed no significant escape into the third dimension: since , a significant escape would lead to an increase of when the field is applied, which was not observed.
The separation distance between the ½ defect cores was measured as the distance between the minima in the optical retardance maps, Figure 3a, and the polarizing optical microscopy (POM) images of the patterns, Figure 2b,c and Figure 4. The POM images were analyzed using the open-source software package Fiji/ImageJ. The distance d was calculated by averaging the data measured for all 50 defects of the same sign in the array. The error for d value was calculated as the standard deviation [42].
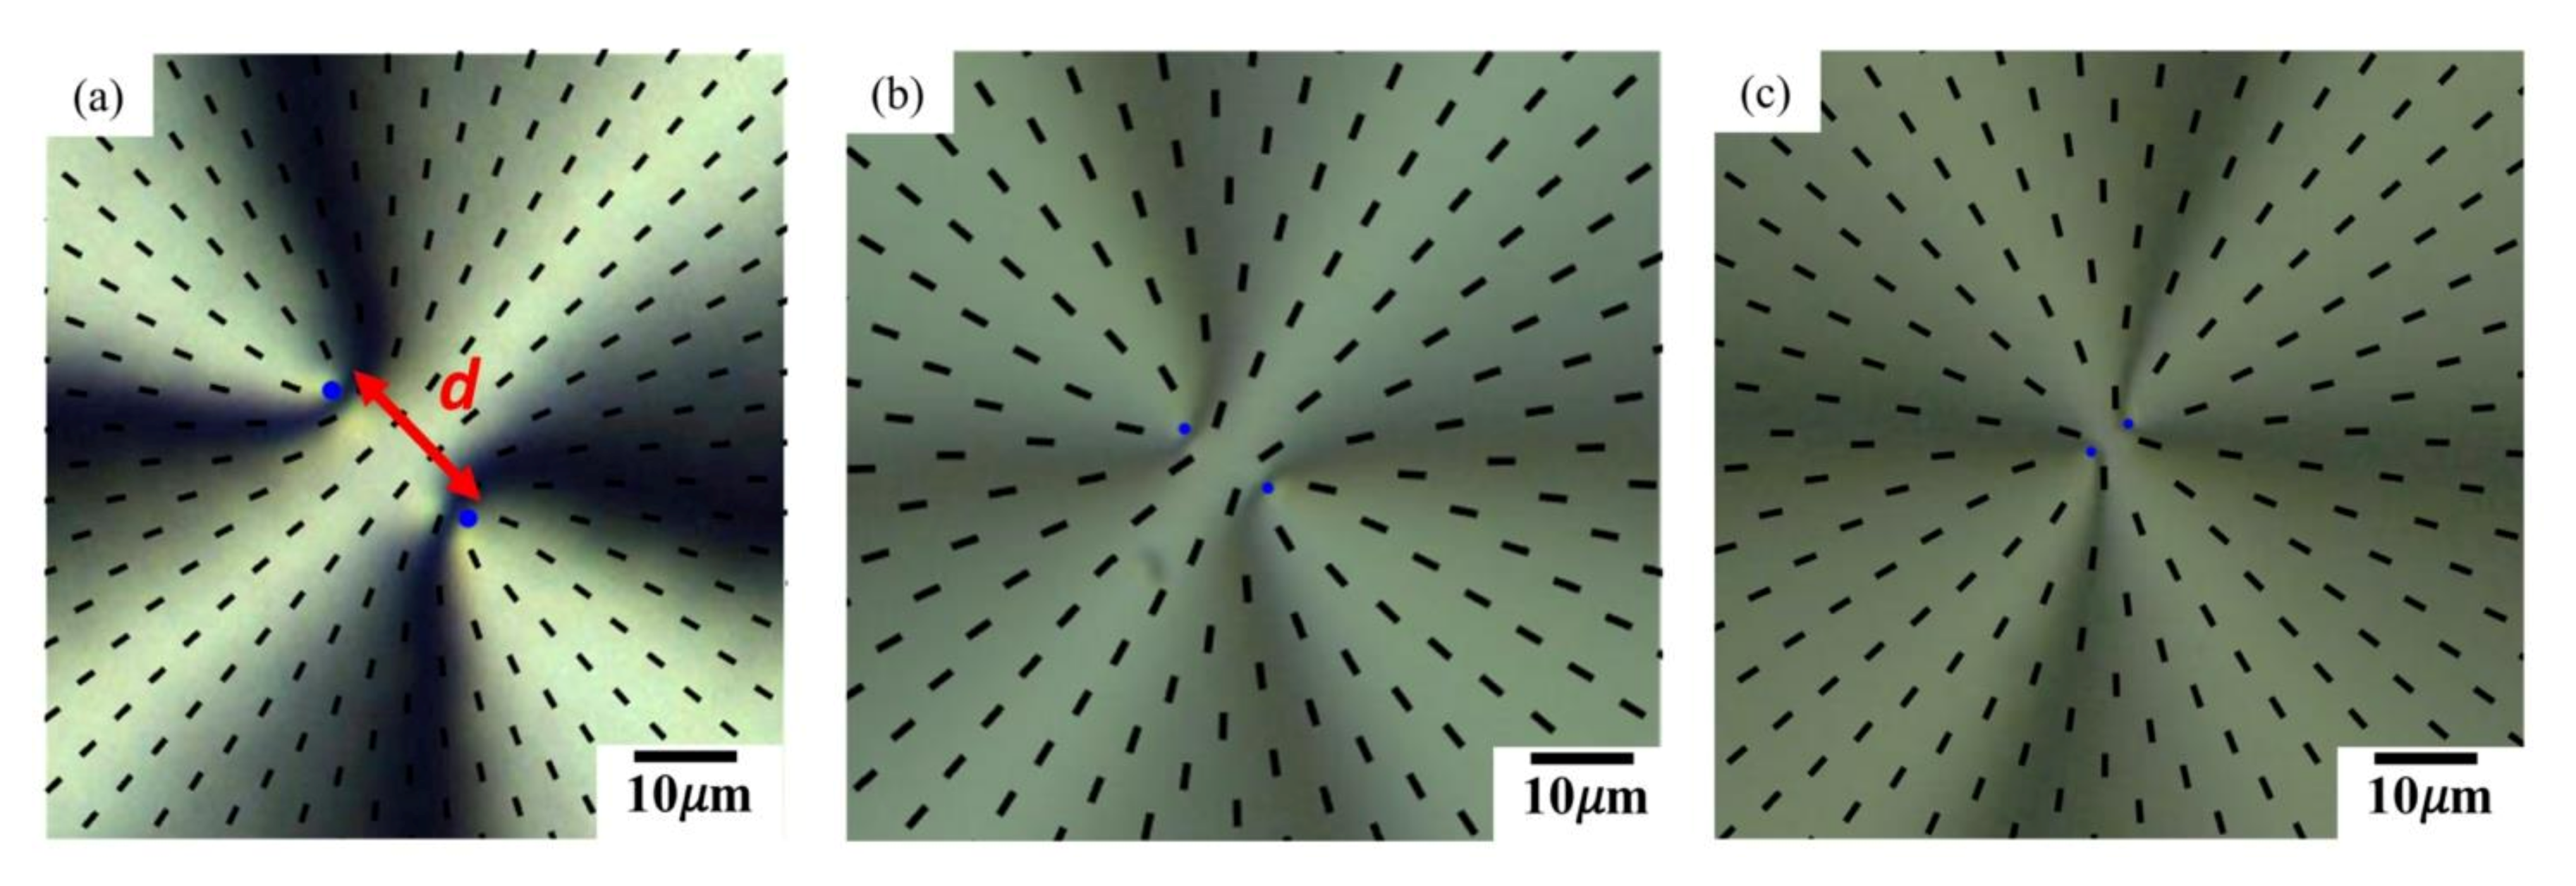
The separation distance between the defects was more significant for smaller irradiation times, Figure 4. The behavior was consistent with the expectation that a shorter exposure yields a weaker azimuthal anchoring and thus a wider splitting. We have deliberately chosen the regime of relatively weak surface anchoring, in which is larger than about 5 and thus could be measured accurately by optical microscopy, Figure 3 and Figure 4.
The measured could be used to determine the in-plane anchoring coefficient, since it is determined by the balance of elastic repulsive force, , of two half-integer defects, and surface anchoring force, that tends to keep a single core as specified by the photopatterning. The energy per unit length of a planar disclination with the director normal to the line is proportional to , where is the strength of the defect, thus a defects are of a higher elastic energy than a pair of half-integer defects [1]. Two defects of the same repel each other elastically, with the force , where is the thickness of the cell, and is the radius of the disclination core [1,14]. The surface anchoring energy can be found by integrating the Rapini-Papoular potential, which yields , where is a numerical coefficient; is the complete elliptic integral of the second kind [14].
Therefore, the surface anchoring force that tends to keep the half-integer defects as a single core is . At the balance point, , which leads to the expression for the azimuthal anchoring coefficient, . With the known , and measured , we found as a function of irradiation time, Figure 5b.
The surface anchoring grew stronger as the photopatterning time increased (Figure 5b). For irradiation times below 1 h, increased linearly with . The least squares fit of the experimental data in Figure 5b yields , where , and A non-vanishing value of could be associated with the residual surface anchoring at the BY layer that was not photopatterned, for example, because of the local orientational order of a polydomain type. As demonstrated by Clark [43], local interactions are capable of producing local “easy” axis that remains in place even after the nematic is heated to the isotropic phase and then cooled down.
4. Conclusions
Most of the existing techniques to measure the azimuthal surface anchoring energy are applicable to surfaces with unidirectional alignment [44,45,46,47,48,49,50]. In this work, we demonstrate a method to measure the azimuthal anchoring coefficient of a nematic with a patterned director field. The method is based on the idea that the integer-strength disclinations split into half-integer disclinations and the resulting separation depends on the elastic and in-plane anchoring forces. The approach is valid when the director remains parallel to the bounding plates. A mechanism competing with the defect core splitting is the escape into the third dimension [35,36,37], in which the director realigns parallel to the disclination, thus removing the singular core. The competing tendencies were analyzed by Chiccoli et al. [37]. The escaped configuration was found to be energetically more stable than the planar singular disclination at cell thicknesses exciding some critical value, , estimated to be submicron, . In an apparent contradiction, our experiments, including those with the applied electric field, did not show the escape in thicker cells, . The discrepancy might be rooted in the fact that the model assumes isotropic singular cores of disclinations with the core energies of the integer and half-integer disclinations being equal. However, the core energy of half-integer disclinations might be reduced by biaxial modifications of the order parameter [51,52]. Such a biaxial core was observed experimentally for half-integer disclinations in lyotropic nematics [53]. Furthermore, the studied nematic CCN-47 showed an enhanced susceptibility to biaxial distortions in experiments with an applied electric field [54]. Therefore, one expects that in CCN-47 the escape into the third dimension does not occur in cells used to find . Since CCN-47 yields a supramicron value of , it should allow one to explore the transition between the splitting and escape in detail, especially because the splitting scenario can be enhanced by the applied electric field. These experiments are in progress.
We found that the azimuthal anchoring energy of a nematic liquid crystal on photoaligned azo-dye substrates increases with the light irradiation time : increased from to 2.2 when increased from 0.5 min to 45 min. As already stated, we deliberately used weakly anchored substrates to measure the corresponding splitting distances and thus with a better accuracy. However, the resulting strength of anchoring turned out to be reasonably strong when compared to the available literature data. For example, Clare et al. [55] have reported for oligo-terminated self-assembled monolayers supported on obliquely deposited gold films in contact with the nematic 4-cyano-4′-pentylbiphenyl (5CB) to be in the range . The azimuthal anchoring coefficient at the interface of a rubbed polyimide PI2555 layer has been reported to be 44 [56], and for a surface coated with polyisoprene or polystyrene to be smaller than [57,58]. Shen et al. [34] reported the azimuthal anchoring at a uniformly aligned photoalignment layer SD1.
The proposed technique to measure the azimuthal anchoring strength is conceptually simple and should allow one to expand it to the studies of the memory phenomenon described by Clark [43], to explore how W is affected by irradiation intensity, temperature, multiple cycles of photopatterning, phase transitions, thickness of the photoalignment layer, parameters of the PPMs and nanoslits in PPMs, substrate aging, etc. We use this opportunity to congratulate Prof. Noel A. Clark on the anniversary.
Author Contributions
H.N.P. and M.R. did the experiments, analyzed and discussed the data, contributed to the writing, S.V.S. contributed to the analysis and writing, O.D.L. directed the research. All authors have read and agreed to the published version of the manuscript.
Funding
The work is supported by NSF grant CMMI-1663394 (preparation of PPMs) and Office of Sciences, DOE, grant DE-SC0019105 (analysis of anchoring).
Data Availability Statement
The datasets generated during and/or analyzed during the current study are available from the corresponding author on reasonable request.
Acknowledgments
We would like to thank T. Turiv for the help with the experiments and discussions.
Conflicts of Interest
The authors declare no conflict of interest.
References
- Kleman, M.; Lavrentovich, O.D. Soft Matter Physics. An Introduction; Springer: New York, NY, USA, 2003. [Google Scholar]
- Piccirillo, B.; D’Ambrosio, V.; Slussarenko, S.; Marrucci, L.; Santamato, E. Photon spin-to-orbital angular momentum conversion via an electrically tunable q-plate. Appl. Phys. Lett. 2010, 97, 241104. [Google Scholar] [CrossRef] [Green Version]
- Serak, S.V.; Hakobyan, R.S.; Nersisyan, S.R.; Tabiryan, N.V.; White, T.J.; Bunning, T.J.; Steeves, D.M.; Kimball, B.R. All-optical diffractive/transmissive switch based on coupled cycloidal diffractive waveplates. Opt. Express 2012, 20, 5460–5469. [Google Scholar] [CrossRef] [PubMed]
- Kobashi, J.; Yoshida, H.; Ozaki, M. Polychromatic Optical Vortex Generation from Patterned Cholesteric Liquid Crystals. Phys. Rev. Lett. 2016, 116, 253903. [Google Scholar] [CrossRef]
- Jiang, M.; Guo, Y.; Yu, H.; Zhou, Z.; Turiv, T.; Lavrentovich, O.D.; Wei, Q.H. Low f-Number Diffraction-Limited Pancharatnam–Berry Microlenses Enabled by Plasmonic Photopatterning of Liquid Crystal Polymers. Adv. Mater. 2019, 31, 1808028. [Google Scholar] [CrossRef]
- Chigrinov, V.; Sun, J.; Wang, X. Photoaligning and Photopatterning: New LC Technology. Crystals 2020, 10, 323. [Google Scholar] [CrossRef] [Green Version]
- Anquetil-Deck, C.; Cleaver, D.J.; Bramble, J.P.; Atherton, T.J. Independent control of polar and azimuthal anchoring. Phys. Rev. E 2013, 88, 012501. [Google Scholar] [CrossRef] [PubMed] [Green Version]
- Ware, T.H.; McConney, M.E.; Wie, J.J.; Tondiglia, V.P.; White, T.J. Voxelated liquid crystal elastomers. Science 2015, 347, 982–984. [Google Scholar] [CrossRef] [PubMed] [Green Version]
- Mostajeran, C.; Warner, M.; Ware, T.H.; White, T.J. Encoding Gaussian curvature in glassy and elastomeric liquid crystal solids. Proc. R. Soc. A Math. Phys. Eng. Sci. 2016, 472, 20160112. [Google Scholar] [CrossRef] [Green Version]
- Babakhanova, G.; Turiv, T.; Guo, Y.; Hendrikx, M.; Wei, Q.-H.; Schenning, A.P.H.J.; Broer, D.J.; Lavrentovich, O.D. Liquid crystal elastomer coatings with programmed response of surface profile. Nat. Commun. 2018, 9, 456. [Google Scholar] [CrossRef] [PubMed] [Green Version]
- Aharoni, H.; Xia, Y.; Zhang, X.; Kamien, R.D.; Yang, S. Universal inverse design of surfaces with thin nematic elastomer sheets. Proc. Natl. Acad. Sci. USA 2018, 115, 7206–7211. [Google Scholar] [CrossRef] [Green Version]
- Peng, C.; Turiv, T.; Guo, Y.; Wei, Q.H.; Lavrentovich, O.D. Command of active matter by topological defects and patterns. Science 2016, 354, 882–885. [Google Scholar] [CrossRef] [Green Version]
- Turiv, T.; Koizumi, R.; Thijssen, K.; Genkin, M.M.; Yu, H.; Peng, C.; Wei, Q.H.; Yeomans, J.M.; Aranson, I.S.; Doostmohammadi, A.; et al. Polar jets of swimming bacteria condensed by a patterned liquid crystal. Nat. Phys. 2020, 16, 481–487. [Google Scholar] [CrossRef] [Green Version]
- Turiv, T.; Krieger, J.; Babakhanova, G.; Yu, H.; Shiyanovskii, S.V.; Wei, Q.-H.; Kim, M.-H.; Lavrentovich, O.D. Topology control of human fibroblast cells monolayer by liquid crystal elastomer. Sci. Adv. 2020, 6, eaaz6485. [Google Scholar] [CrossRef]
- Yaroshchuk, O.; Reznikov, Y. Photoalignment of liquid crystals: Basics and current trends. J. Mater. Chem. 2012, 22, 286–300. [Google Scholar] [CrossRef]
- Kim, J.-H.; Yoneya, M.; Yamamoto, J.; Yokoyama, H. Surface alignment bistability of nematic liquid crystals by orientationally frustrated surface patterns. Appl. Phys. Lett. 2001, 78, 3055–3057. [Google Scholar] [CrossRef]
- Wen, B.; Petschek, R.G.; Rosenblatt, C. Nematic liquid-crystal polarization gratings by modification of surface alignment. Appl. Opt. 2002, 41, 1246–1250. [Google Scholar] [CrossRef] [PubMed]
- Ichimura, K. Photoalignment of Liquid-Crystal Systems. Chem. Rev. 2000, 100, 1847–1874. [Google Scholar] [CrossRef]
- Fang, G.J.; Maclennan, J.E.; Yi, Y.; Glaser, M.A.; Farrow, M.; Korblova, E.; Walba, D.M.; Furtak, T.E.; Clark, N.A. Athermal photofluidization of glasses. Nat. Commun. 2013, 4, 1521. [Google Scholar] [CrossRef] [Green Version]
- McConney, M.E.; Martinez, A.; Tondiglia, V.P.; Lee, K.M.; Langley, D.; Smalyukh, I.I.; White, T.J. Topography from topology: Photoinduced surface features generated in liquid crystal polymer networks. Adv. Mater. 2013, 25, 5880–5885. [Google Scholar] [CrossRef]
- Nersisyan, S.; Tabiryan, N.; Steeves, D.M.; Kimball, B.R. Fabrication of liquid crystal polymer axial waveplates for UV-IR wavelengths. Opt. Express 2009, 17, 11926–11934. [Google Scholar] [CrossRef] [PubMed]
- Cardano, F.; Karimi, E.; Slussarenko, S.; Marrucci, L.; Lisio, C.D.; Santamato, E. Polarization pattern of vector vortex beams generated by q-plates with different topological charges. Appl. Opt. 2012, 51, C1–C6. [Google Scholar] [CrossRef] [PubMed] [Green Version]
- Huang, Y.H.; Li, M.S.; Ko, S.W.; Fuh, A.Y.G. Helical wavefront and beam shape modulated by advanced liquid crystal q-plate fabricated via photoalignment and analyzed by Michelson’s interference. Appl. Opt. 2013, 52, 6557–6561. [Google Scholar] [CrossRef]
- Huang, Y.-H.; Ko, S.-W.; Li, M.-S.; Chu, S.-C.; Fuh, A.Y.-G. Modulation of shape and polarization of beam using a liquid crystal q-plate that is fabricated via photo-alignment. Opt. Express 2013, 21, 10954–10961. [Google Scholar] [CrossRef]
- Culbreath, C.; Glazar, N.; Yokoyama, H. Note: Automated maskless micro-multidomain photoalignment. Rev. Sci. Instrum. 2011, 82, 126107. [Google Scholar] [CrossRef] [Green Version]
- Guo, Y.; Jiang, M.; Peng, C.; Sun, K.; Yaroshchuk, O.; Lavrentovich, O.; Wei, Q.H. High-Resolution and High-Throughput Plasmonic Photopatterning of Complex Molecular Orientations in Liquid Crystals. Adv. Mater. 2016, 28, 2353–2358. [Google Scholar] [CrossRef]
- Guo, Y.; Jiang, M.; Peng, C.; Sun, K.; Yaroshchuk, O.; Lavrentovich, O.D.; Wei, Q.-H. Designs of Plasmonic Metamasks for Photopatterning Molecular Orientations in Liquid Crystals. Crystals 2017, 7, 8. [Google Scholar] [CrossRef] [Green Version]
- Peng, C.; Guo, Y.; Turiv, T.; Jiang, M.; Wei, Q.H.; Lavrentovich, O.D. Patterning of Lyotropic Chromonic Liquid Crystals by Photoalignment with Photonic Metamasks. Adv. Mater. 2017, 29, 1606112. [Google Scholar] [CrossRef] [PubMed]
- Voloshchenko, D.; Khyzhnyak, A.; Reznikov, Y.; Reshetnyak, V. Control of an easy-axis on nematic-polymer interface by light action to nematic bulk. Jpn. J. Appl. Phys. 1995, 34, 566–571. [Google Scholar] [CrossRef]
- Andrienko, D.; Dyadyusha, A.; Iljin, A.; Kurioz, Y.; Reznikov, Y. Measurement of Azimuthal Anchoring Energy of Nematic Liquid Crystal on Photoaligning Polymer Surface. Mol. Cryst. Liq. Cryst. Sci. Technol. Sect. A Mol. Cryst. Liq. Cryst. 1998, 321, 271–281. [Google Scholar] [CrossRef]
- Okubo, K.; Kimura, M.; Akahane, T. Measurement of Genuine Azimuthal Anchoring Energy in Consideration of Liquid Crystal Molecular Adsorption on Alignment Film. Jpn. J. Appl. Phys. 2003, 42, 6428–6433. [Google Scholar] [CrossRef]
- Faetti, S.; Mutinati, G.; Gerus, I. Measurements of the azimuthal anchoring energy at the interface between a nematic liquid crystal and photosensitive polymers. Mol. Cryst. Liq. Cryst. 2004, 421, 81–93. [Google Scholar] [CrossRef]
- Fedorenko, D.; Ouskova, E.; Reshetnyak, V.; Reznikov, Y. Evolution of light-induced anchoring in dye-doped nematics: Experiment and model. Phys. Rev. E 2006, 73, 031701. [Google Scholar] [CrossRef]
- Shen, Y.; Dierking, I. Dynamic dissipative solitons in nematics with positive anisotropies. Soft Matter 2020, 16, 5325–5333. [Google Scholar] [CrossRef] [PubMed]
- Cladis, P.E.; Kléman, M. Non-singular disclinations of strength S = + 1 in nematics. J. Phys. Fr. 1972, 33, 591–598. [Google Scholar] [CrossRef]
- Meyer, R.B. On the existence of even indexed disclinations in nematic liquid crystals. Philos. Mag. A J. Theor. Exp. Appl. Phys. 1973, 27, 405–424. [Google Scholar] [CrossRef]
- Chiccoli, C.; Feruli, I.; Lavrentovich, O.D.; Pasini, P.; Shiyanovskii, S.V.; Zannoni, C. Topological defects in schlieren textures of biaxial and uniaxial nematics. Phys. Rev. E Stat. Phys. Plasmas Fluids Relat. Interdiscip. Top. 2002, 66, 030701(R). [Google Scholar] [CrossRef] [PubMed] [Green Version]
- Zawadzki, A.; Walton, H.G. Measurements of the splay and bend elastic constants of 4′-butyl-4-heptyl-bicyclohexyl-4-carbononitrile, CCN47. Mol. Cryst. Liq. Cryst. 2012, 569, 10–14. [Google Scholar] [CrossRef]
- Mikulich, V.S.; Murauski, A.A.; Muravsky, A.A.; Agabekov, V.E. Effect of temperature on the photoalignment of azo dyes in thin films. Russ. J. Phys. Chem. A 2016, 90, 675–682. [Google Scholar] [CrossRef]
- Wang, J.; McGinty, C.; West, J.; Bryant, D.; Finnemeyer, V.; Reich, R.; Berry, S.; Clark, H.; Yaroshchuk, O.; Bos, P. Effects of humidity and surface on photoalignment of brilliant yellow. Liq. Cryst. 2017, 44, 863–872. [Google Scholar] [CrossRef]
- Iimura, Y.; Kobayashi, N.; Kobayashi, S. Measurement of Temperature Behavior of Azimuthal Anchoring Energy at Liquid Crystal/SiO Interface Using New Method. Jpn. J. Appl. Phys. 1995, 34, 1935–1936. [Google Scholar] [CrossRef]
- Taylor, J. Introduction to Error Analysis, the Study of Uncertainties in Physical Measurements, 2nd ed.; University Science Books: New York, NY, USA, 1997. [Google Scholar]
- Clark, N.A. Surface memory effects in liquid crystals: Influence of surface composition. Phys. Rev. Lett. 1985, 55, 292–295. [Google Scholar] [CrossRef]
- Faetti, S.; Palleschi, V.; Schirone, A. A reflectometric method to measure the azimuthal anchoring energy of a nematic liquid crystal. Il Nuovo Cim. D 1988, 10, 1313–1324. [Google Scholar] [CrossRef]
- Iimura, Y.; Kobayashi, N.; Kobayashi, S. A New Method for Measuring the Azimuthal Anchoring Energy of a Nematic Liquid Crystal. Jpn. J. Appl. Phys. 1994, 33, L434–L436. [Google Scholar] [CrossRef]
- Yang, F.; Sambles, J.R.; Bradberry, G.W. Half-leaky guided wave determination of azimuthal anchoring energy and twist elastic constant of a homogeneously aligned nematic liquid crystal. J. Appl. Phys. 1999, 85, 728–733. [Google Scholar] [CrossRef]
- Fonseca, J.G.; Galerne, Y. Simple method for measuring the azimuthal anchoring strength of nematic liquid crystals. Appl. Phys. Lett. 2001, 79, 2910–2912. [Google Scholar] [CrossRef]
- Vilfan, M.; Mertelj, A.; Čopič, M. Dynamic light scattering measurements of azimuthal and zenithal anchoring of nematic liquid crystals. Phys. Rev. E 2002, 65, 041712. [Google Scholar] [CrossRef] [Green Version]
- Ryu, D.G.; Huh, J.-H.; Kim, Y.-K.; Gwag, J.S. Characterization of surface anchoring energy of nematic liquid crystals via electrohydrodynamic instability. Phys. Rev. E 2020, 101, 062703. [Google Scholar] [CrossRef]
- Pavlov, I.; Candemir, O.; Rybak, A.; Dobrovolskiy, A.; Kadan, V.; Blonskiy, I.; Lytvyn, P.; Korchovyi, A.; Tytarenko, P.; Kazantseva, Z.; et al. Azimuthal and polar anchoring energies of aligning layers structured by nonlinear laser lithography. Liq. Cryst. 2021, 48, 131–149. [Google Scholar] [CrossRef]
- Lyuksyutov, I.F. Topological instability of singularities at small distances in nematics. Sov. Phys. JETP 1978, 48, 178–179. [Google Scholar]
- Schopohl, N.; Sluckin, T.J. Defect Core Structure in Nematic Liquid Crystals. Phys. Rev. Lett. 1987, 59, 2582–2584. [Google Scholar] [CrossRef]
- Zhou, S.; Shiyanovskii, S.V.; Park, H.-S.; Lavrentovich, O.D. Fine structure of the topological defect cores studied for disclinations in lyotropic chromonic liquid crystals. Nat. Commun. 2017, 8, 14974. [Google Scholar] [CrossRef] [PubMed] [Green Version]
- Borshch, V.; Shiyanovskii, S.V.; Lavrentovich, O.D. Nanosecond Electro-Optic Switching of a Liquid Crystal. Phys. Rev. Lett. 2013, 111, 107802. [Google Scholar] [CrossRef] [Green Version]
- Clare, B.H.; Guzmán, O.; de Pablo, J.J.; Abbott, N.L. Measurement of the azimuthal anchoring energy of liquid crystals in contact with oligo(ethylene glycol)-terminated self-assembled monolayers supported on obliquely deposited gold films. Langmuir 2006, 22, 4654–4659. [Google Scholar] [CrossRef]
- Yang, F.Z.; Cheng, H.F.; Gao, H.J.; Sambles, J.R. Technique for characterizing azimuthal anchoring of twisted nematic liquid crystals using half-leaky guided modes. J. Opt. Soc. Am. B 2001, 18, 994–1002. [Google Scholar] [CrossRef]
- Ramdane, O.O.; Auroy, P.; Forget, S.; Raspaud, E.; Martinot-Lagarde, P.; Dozov, I. Memory-Free Conic Anchoring of Liquid Crystals on a Solid Substrate. Phys. Rev. Lett. 2000, 84, 3871–3874. [Google Scholar] [CrossRef] [PubMed]
- Smalyukh, I.I.; Lavrentovich, O.D. Anchoring-Mediated Interaction of Edge Dislocations with Bounding Surfaces in Confined Cholesteric Liquid Crystals. Phys. Rev. Lett. 2003, 90, 085503. [Google Scholar] [CrossRef] [PubMed] [Green Version]
Figure 1.
Chemical Structure of the materials (a) Photoresponsive azo-dye Brilliant Yellow, (b) liquid crystal CCN-47.
Figure 1.
Chemical Structure of the materials (a) Photoresponsive azo-dye Brilliant Yellow, (b) liquid crystal CCN-47.

Figure 2.
(a) Polarizing optical microscope texture of a PPM with ±1 radial defect array. (b) Polarizing optical microscope image of a portion of a photopatterned nematic CCN-47 cell with a +1 radial defect on the left and −1 defect on the right. The cell thickness ; irradiation time 4 min. (c) Polarizing optical microscope texture of the photopatterned cell in b, with a full-wavelength () optical compensator. P, A, and λ represent the polarizer, analyzer, and slow axis of the full-wavelength compensator, respectively.

Figure 3.
(a) Retardation along a line passes through the core of a +1 radial defect. The two minima relate to two +1/2 defect cores. is the change of retardation between the defect core and the far field. (b) The change of retardation as a function of voltage, U. (c) The separation distance between two defect cores, d as a function of voltage, U. The data is collected from a cell photopatterned 2 h with radial ±1 defect array. The cell thickness is .

Figure 4.
Optical microscopy of separation of radial defects into pairs of defects for irradiation times of (a) 2 min, (b) 10 min, and (c) 30 min. Cell thicknesses are 1.2 μm.
Figure 4.
Optical microscopy of separation of radial defects into pairs of defects for irradiation times of (a) 2 min, (b) 10 min, and (c) 30 min. Cell thicknesses are 1.2 μm.

Figure 5.
Defect Separation and Surface Anchoring. (a) The separation distance between half-integer defects cores and (b) the azimuthal surface anchoring coefficient as functions of the photopatterning time.
Figure 5.
Defect Separation and Surface Anchoring. (a) The separation distance between half-integer defects cores and (b) the azimuthal surface anchoring coefficient as functions of the photopatterning time.

Publisher’s Note: MDPI stays neutral with regard to jurisdictional claims in published maps and institutional affiliations. |
© 2021 by the authors. Licensee MDPI, Basel, Switzerland. This article is an open access article distributed under the terms and conditions of the Creative Commons Attribution (CC BY) license (https://creativecommons.org/licenses/by/4.0/).
Share and Cite
MDPI and ACS Style
Padmini, H.N.; Rajabi, M.; Shiyanovskii, S.V.; Lavrentovich, O.D. Azimuthal Anchoring Strength in Photopatterned Alignment of a Nematic. Crystals 2021, 11, 675. https://0-doi-org.brum.beds.ac.uk/10.3390/cryst11060675
AMA Style
Padmini HN, Rajabi M, Shiyanovskii SV, Lavrentovich OD. Azimuthal Anchoring Strength in Photopatterned Alignment of a Nematic. Crystals. 2021; 11(6):675. https://0-doi-org.brum.beds.ac.uk/10.3390/cryst11060675
Chicago/Turabian StylePadmini, H. Nilanthi, Mojtaba Rajabi, Sergij V. Shiyanovskii, and Oleg D. Lavrentovich. 2021. "Azimuthal Anchoring Strength in Photopatterned Alignment of a Nematic" Crystals 11, no. 6: 675. https://0-doi-org.brum.beds.ac.uk/10.3390/cryst11060675
Note that from the first issue of 2016, this journal uses article numbers instead of page numbers. See further details here.