Article

Development of a Sulfate Resistance Performance Test for Concrete by Tensile Strength Measurements: Determination of Test Conditions

1
ZERTplus Überwachungsgesellschaft mbH, Mühlenweg 11, 06749 Bitterfeld-Wolfen, Germany
2
Institute of Building Materials Research, RWTH Aachen University, Schinkelstraße 3, 52062 Aachen, Germany
*
Author to whom correspondence should be addressed.
Submission received: 9 July 2021 / Revised: 17 August 2021 / Accepted: 19 August 2021 / Published: 22 August 2021

Abstract

:
Assessing the sulfate resistance of concrete is essential for the use of concrete in sulfate rich environments. A multitude of test methods exists worldwide, showing the relevance of the problem and the difficulty to find a suitable test setup. Testing the relative tensile strength of ASTM C307 concrete briquette specimens after exposure to a sulfate solution is a new direct method to assess the degree of deterioration. The aim of this study is to develop a new performance test, which considers both the chemical and physical resistance of a specific concrete mix against sulfate attack. In the experimental investigations, the binder type, storage temperature, type and concentration of sulfate solution, and concrete composition were varied, and the remaining tensile strength evaluated to define the test parameters. To gain significantly distinguishable data within nine months of storage, the use of sodium sulfate solution with 6000 mg SO42−/L at 5 °C is proposed.

1. Introduction

Understanding the reaction mechanism during sulfate attack on concrete has been an important research objective for decades [1]. Although there is a general agreement on which binders are considered sulfate resistant and which are susceptible to the attack, the classification between these extremes is difficult. Additionally, the use of artificial lab test conditions often generates artifacts that are lacking in practical relevance [2,3]. Therefore, no satisfactory test method could be established until now [4].
The hydration of cement results in the formation of strength developing C-S-H, portlandite (Ca(OH)2), and ettringite (Ca6(Al,Fe)2(SO4)3(OH)12∙26H2O). After the consumption of sulfates during the formation of ettringite, remaining aluminate reacts with ettringite to AFm-phases such as monosulfate (3CaO·(Al,Fe)2O3·CaSO4·nH2O) [5]. The ingress of additional sulfate can result in the formation of new ettringite from these AFm-phases, and possibly lead to the precipitation of gypsum. Both reactions are accompanied by an increase in volume, resulting in macroscopic expansion, cracking, and deterioration of the concrete.
The sulfate resistance of concrete is always a combination of the chemical resistance of the binder and the physical resistance against the ingress of the attacking liquid [6,7]. This presents a major difficulty to correctly consider these two factors independently in a lab test. To test the resistance of cement and concrete against the deterioration by sulfate attack, a multitude of different methods exists worldwide. These tests are conducted on cement paste, mortar, and concrete specimens in complete immersion, half-immersion, or under cyclic exposition to sulfate solutions of a great variety of concentrations at different temperatures. In this context, the expansion of a specimen caused by the precipitation of sulfate containing minerals, like ettringite and gypsum, is usually assessed as a measure for the sulfate resistance [8,9,10,11,12,13,14,15,16]. The characterization of changes of the dynamic elastic modulus to detect internal microstructural damage is also a common method applied in the literature [15,17,18,19,20]. Rarely, the remaining flexural [21,22,23,24,25] or tensile strengths [26,27,28] are tested.
However, cracking and a related loss of strength and surface scaling due to the formation of ettringite and gypsum represent the main concern in relation to concrete structures in the field exposed to sulfate attack. In addition, at low temperatures, the presence of a carbonate source, e.g., due to added ground limestone or the ingress of CO2, a precipitation of thaumasite, may also result in a severe loss of strength [29].
In a previous study, we proposed a new approach to test the sulfate resistance of concrete using the tensile strength as a benchmark for the deterioration of concrete [30]. It was shown that briquette specimens according to ASTM C307-03 are especially suitable for this approach, since they require a reduced effort for testing compared to concrete prisms or cylinders. The results also showed that the extent of strength loss is dependent on the binder used to produce the concrete and on the storage conditions, e.g., the concentration of the sulfate solution.
Based on these promising results, a parameter study on the impact of relevant influencing parameters, such as storage temperature as well as type and concentration of sulfate solution, on the time-dependent evolution of tensile strength of concrete briquette specimens was conducted for a selection of cementitious binders and different concrete compositions. The presented results conclude with the proposition of optimal test conditions and a novel performance test procedure to evaluate the sulfate resistance of concrete.

2. Materials and Methods

2.1. Materials

Two Portland cements (CEM I 42.5 N and CEM I 42.5 N-SR3), a Portland-composite cement (CEM II/B-S 42.5 N) and a blast furnace slag cement (CEM III/A 42.5 N), as well as a hard coal fly ash (FA) were used in this study. The chemical composition of the materials was determined according to EN 196-2 by X-ray fluorescence, the chloride content by titration with silver nitrate solution, and the SO3 content by gravimetric analysis. The results are shown in Table 1. To determine the mineralogical composition shown in Table 2, a PANalitycal X’Pert Pro X-ray diffractometer (XRD) was used. Diffractograms were measured in a range between 7 and 55 °2θ for 60 min. The machine was operated at 40 kV and 40 mA. The amorphous content was evaluated by using rutile as an internal standard at a replacement level of 20 wt%.

2.2. Concrete Composition

Quartz gravel and sand from the river Rhine were used as aggregate for concrete production. A maximum grain size of 8 mm was utilized due to the smallest width of the briquette molds being 25.4 mm. Quartz powder was used as filler. For concrete with a w/ceq ratio of 0.45, a grain size distribution according to a modified Andreasen model was utilized [31]. Concrete with w/ceq = 0.50 was produced with a C8 grading curve according to DIN 1045-2.
The composition of the different concrete mixtures used in this study is given in Table 3. A PCE superplasticizer was used to achieve an equal flow of 180 to 220 mm in accordance with EN 1015-3 (Haegerman flow table). The air void content was tested according to EN 1015-7. For each mixture, 24 concrete specimens according to ASTM C307 (cf. Figure 1) as well as 12 standard prisms (40 × 40 × 160 mm3, EN 196-1) were casted and stored at 20 °C and 90% relative humidity for 24 h before demolding. Afterwards the specimens were cured in saturated Ca(OH)2-solution at 20 °C until an age of 28 days.
After curing the specimens were stored in their respective storage solutions (solution to surface ratio ≈ 50 L/m2) until testing. The sulfate solutions were renewed every 7 days until 28 days of storage and every 14 days subsequently.

2.3. Design of Experiments

A variety of influencing parameters on the sulfate resistance of concrete was evaluated to optimize the testing procedure. The sulfate resistance test shall be used as a performance test, meaning that it is intended to assess both the chemical and the physical resistance of a specific concrete mix. It is not intended to be used as a binder test (with a given w/c ratio and a standard mix design). The concept is based on the conviction that, for practical application, it is irrelevant whether good sulfate resistance is achieved by a low chemical reactivity of the binder or by excellent physical properties, which prevent the ingress of sulfate into the concrete. The most important test parameters that need to be defined are the sulfate storage conditions (storage temperature, concentration of the sulfate solution) and the testing time. An overview on the examined test parameters can be seen in Table 4. The parameter study was conducted on different selected binder types and contents were varied as well. The equivalent water to cement ratio was kept constant at w/ceq = 0.45.
Due to the number of parameters to be evaluated, a factorial design of experiment (DoE) was chosen to reduce lab work time. The parameters temperature, concentration, cation, and binder content were included in the approach, which accumulates to a full factorial design of 36 series for each type of binder. The software Minitab 18 was utilized to optimize the experimental program for a total of 20 series for each binder. The resulting combinations are shown in Table 5.
The intended testing procedure was optimized to obtain results within a reasonable time frame. Therefore, testing was initially undertaken until a storage time of six months at 56, 119, and 182 days of storage. Testing after nine months (273 days) of storage was added later in the study, while omitting the measurements after 56 days.
The remaining relative tensile strength after storage in sulfate solution was chosen as a benchmark for the sulfate resistance of concrete specimens. Additionally, the flexural strength of concrete standard prisms was examined to estimate whether the remaining relative flexural strength would perform similarly and could provide an alternative option.

2.4. Data Analysis

To evaluate the parametric study, multiple regression analyses were performed using the software Minitab 18. Regression models were calculated for the relative flexural strength and the relative tensile strength. As predetermined by the utilized DoE, the storage temperature, sulfate concentration, and binder content were considered as independent variables. Additionally, the fresh concrete density was included as independent variable to account for the influence of the production and casting of the concrete samples. Equation (1) shows the general approach that was chosen to calculate the regression models.
f T , b , c , ρ   = a 1 · T + a 2 · b + a 3 · c + a 4 · ρ + a 5 · T 2 + a 6 · b 2 + a 7 · ρ 2 + a 8 · T · b + a 9 · T · c + a 10 · T · ρ + a 11 · b · c + a 12 · b · ρ + a 13 · c · ρ
where
  • T is the temperature in °C,
  • b is the binder content in kg/m3,
  • c is the sulfate concentration in mg SO42−/L,
  • ρ is the fresh concrete density in g/cm3, and
  • ai are the coefficients.
Significant variables and interactions were included stepwise in the regression model by forward selection. The contribution of the independent variables and interactions to the regression model was calculated by ANOVA (analysis of variance) for models with a coefficient of determination R2 above 0.50.
Significant differences between means of independent sets of data were verified by two-sample t-tests (p = 0.05). These calculations were carried out using Origin(Pro) 2019b.

2.5. Methods

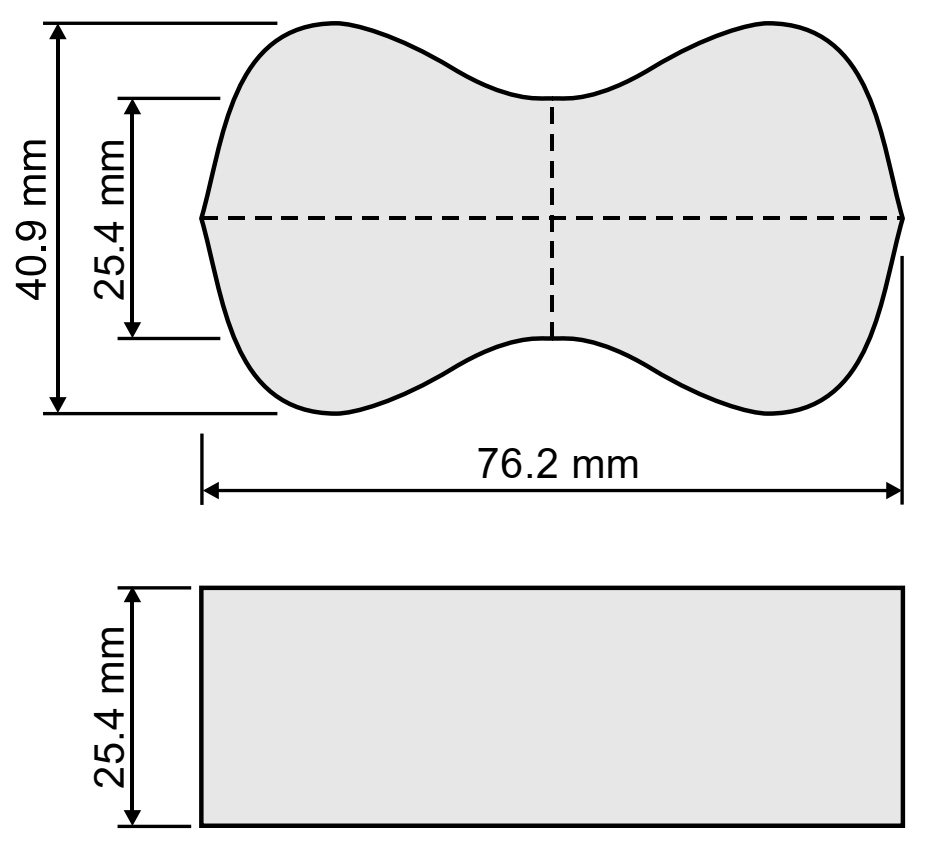
2.5.1. Strength Testing

The mass of the briquette and prism specimen was measured after 56, 119, 182, and 273 days of storage in the solutions. As reference the weight of the samples after 28 days curing was used.
The tensile strength of the briquette specimen was determined according to ASTM C307 using a universal testing machine Zwick ZMART.Pro with a 10 kN load cell. The machine was operated path-controlled with a speed of 5 mm/min. To measure the flexural strength a testing machine, Form + Test with a 10 kN load cell was used. The machine was operated in accordance with EN 196-1.

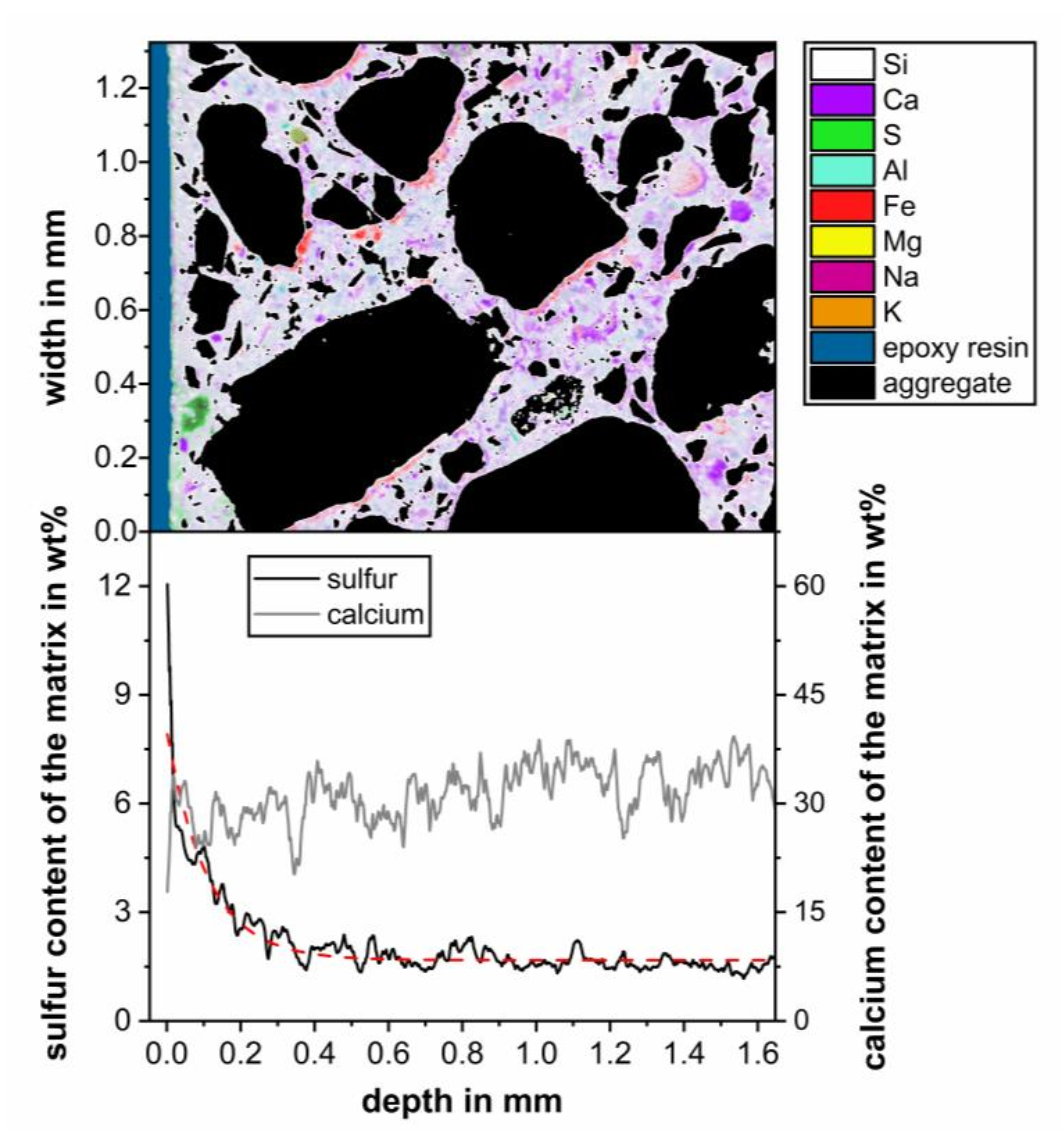
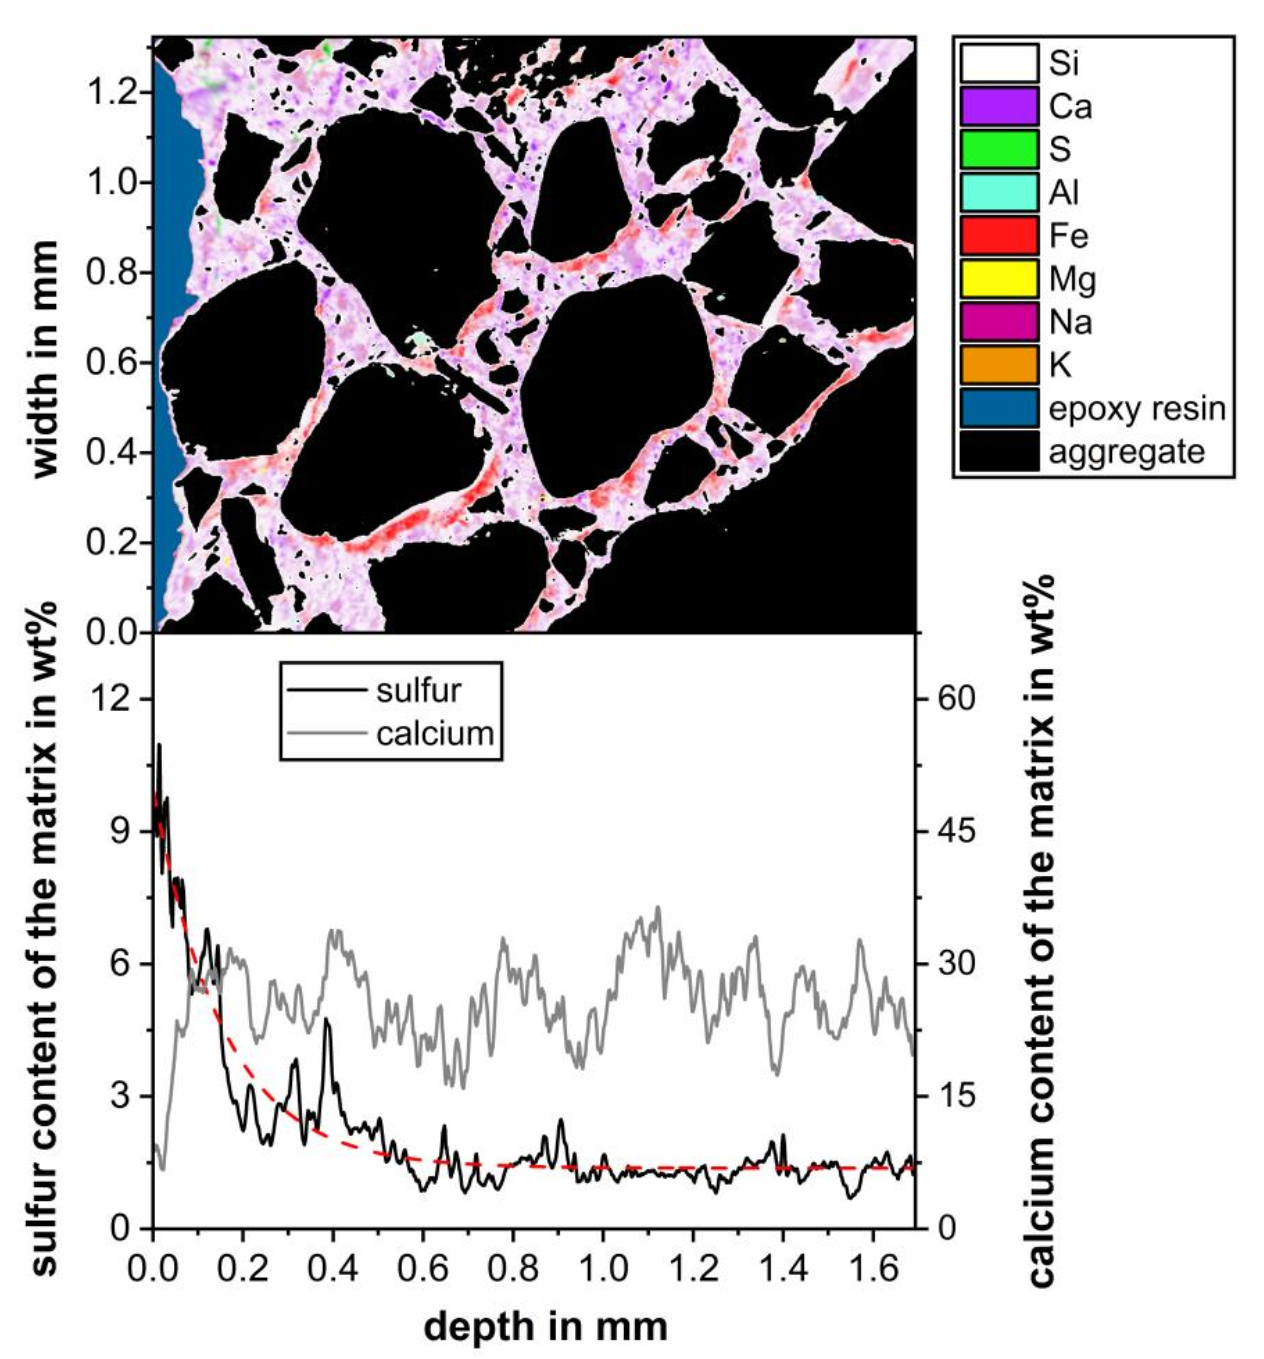
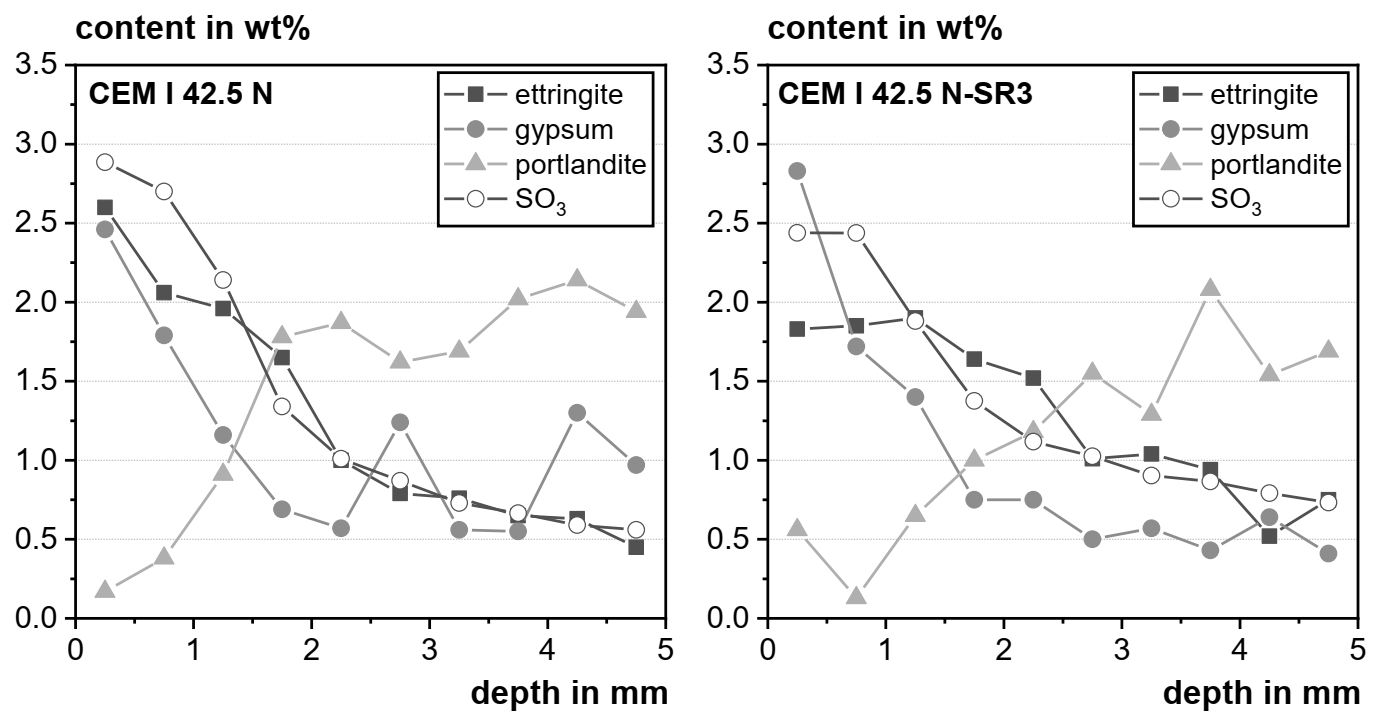
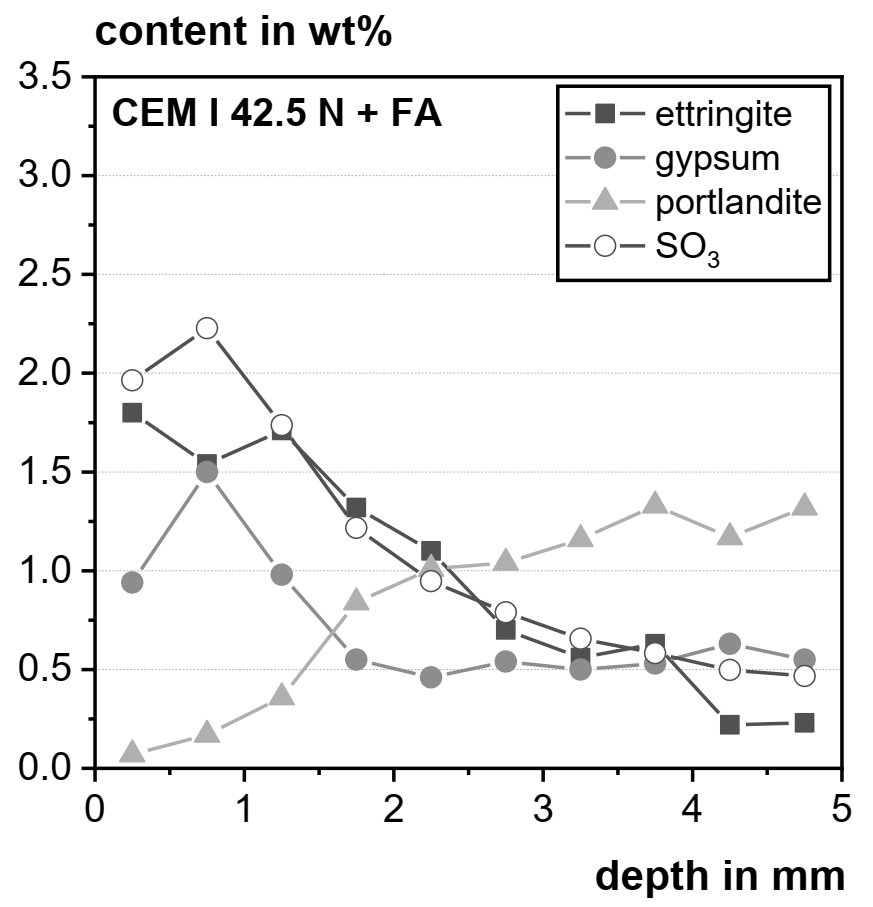
2.5.2. Microstructural Analysis

After 182 days of storage, the mineralogical zonation due to sulfate ingress was determined by means of X-ray diffraction. For the profiles, remaining halves of concrete prisms obtained after flexural strength testing (concrete prepared with w/ceq = 0.50 stored at 5 °C in sodium sulfate solutions with 6000 mg SO42−/L) were used. The specimens were dried via solution exchange in isopropanol for 24 h, followed by drying at 40 °C for 72 h. Later, the samples were ground in steps of 0.5 mm until a depth of 5 mm. The temperature at the surface of the samples during the grinding process was kept below 40 °C to avoid dehydration of ettringite and gypsum. At each step, the powder was collected, ground to a grain size below 63 µm, and analyzed with an X-ray powder diffractometer Panalytical X’Pert Pro with an X’Celerator detector in a range of 5 to 55 °2θ with a step size of 0.0167 °2θ for a measurement time of six hours per sample. The results were analyzed qualitatively, followed by quantification using the Rietveld method. Due to the expected small amount of amorphous phase in the concrete samples, no internal or external standard was used [32].
The same powder samples used for XRD analysis were examined for their total SO3 content by carbon/sulfur analysis using an Eltra CS-2000.
Scanning electron microscopy (SEM) was performed on fractured samples of selected specimens after storage for 182 days using field emission SEMs JEOL JSM-7000F and Zeiss GeminiSEM 300. On polished sections, energy-dispersive X-ray (EDX) mappings of areas of 1.69 · 1.32 mm2 were produced. The samples were previously embedded in epoxy resin, ground on a Buehler EcoMet 300 gradually with silicon carbide until a grit size of 4000, and subsequently polished with 3 µm diamond spray. Each measurement took about 13 h and a grid of 1024 · 800 EDX spots was collected. The collected data were evaluated as a sum of 3 · 3 pixels to achieve better quantitative results. The aggregated EDX spectrum was quantified for aluminum, calcium, iron, potassium, sodium, magnesium, sulfur, and silicon to a total of 100 wt%.

3. Results

The presented results of this study are divided into three main sections. At first, feasible test conditions to evaluate the deterioration of concrete specimen after sulfate storage by strength measurements had to be determined and assessed. Afterwards, the influence of the independent variables (temperature, concentration, binder content, fresh concrete density) on the dependent variables (here mainly rel. strength) was examined and conclusions for a proposed testing method drawn. These results constitute the main outcome of the study and are provided in Supplementary Materials.
Finally, results of microstructural analyses are presented to provide further information on the state of the concrete specimens after storage at the proposed storage conditions.

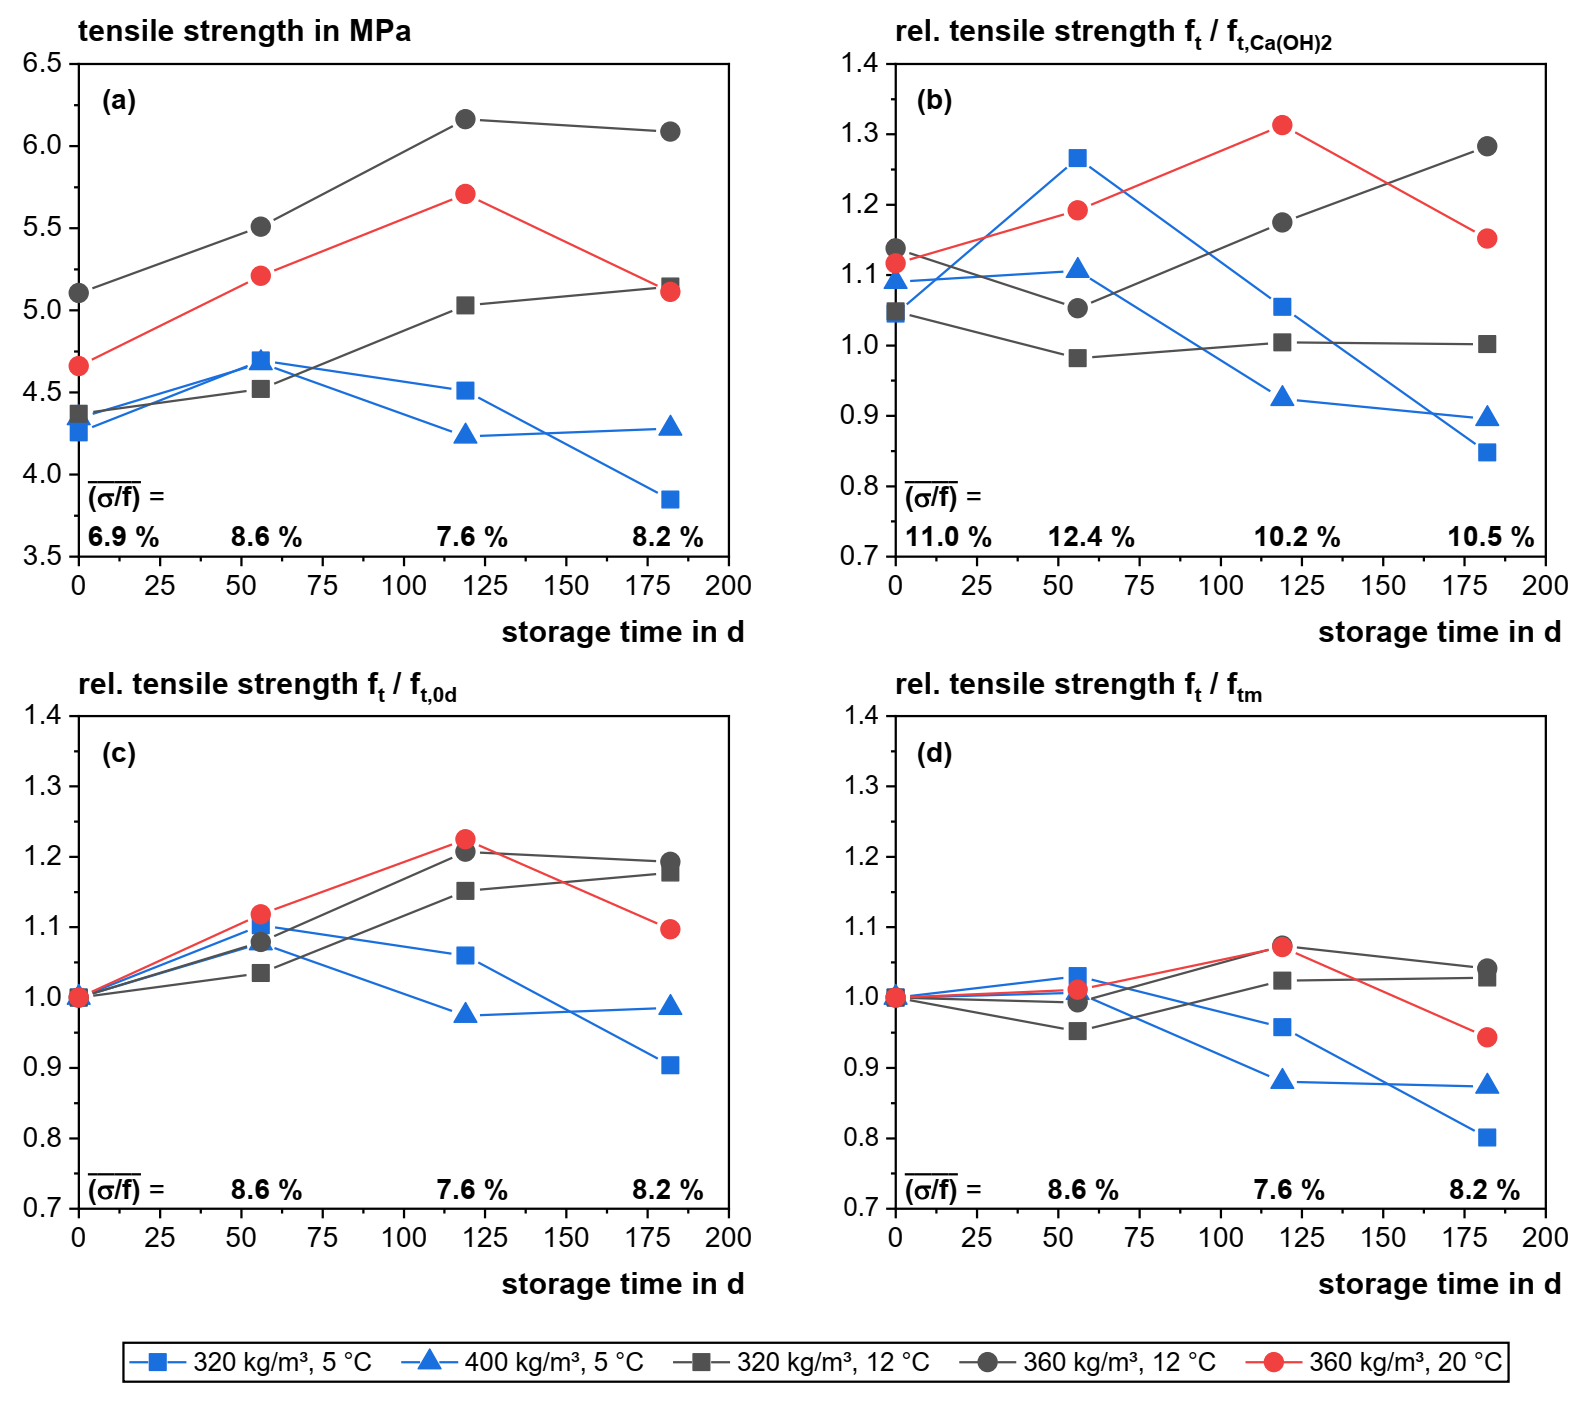
3.1. Determination of a Suitable Reference to Evaluate Strength Data

In a first approach, the sulfate resistance was assessed by measuring the evolution of relative tensile strength of the sulfate immersed samples compared to samples stored in saturated Ca(OH)2 solution at 5, 12 and 20 °C as reference. However, this approach led to unsatisfactory and inconclusive results, because the scatter of the resulting relative tensile strength was high (cf. Figure 2b) and predominantly influenced by the varying density of the specific concrete sample (cf. Supplementary Materials). Therefore, the initial 28-day strength of the series stored in portlandite solution was considered as a constant reference value. This approach led to a steadier development of the curves, because the scatter of the strength testing of the reference samples was excluded. Consequently, the differences in tensile strength loss due to the storage conditions (cf. Figure 2c) could be distinguished. However, the ongoing hydration of the samples resulted in a higher strength of the specimens stored in sulfate solution compared to the 28-day strength. This effect causes relative strength values above 1, which is usually not associated with damage. Hence, a maturity function was utilized to predict the strength at the respective testing time based on the 28-day strength of the samples stored in portlandite solution (cf. Figure 2d).
The maturity function used in this work is adapted from the fib Model code [33] and has been altered, as suggested in the work of Vollpracht et al. [34], to account for the influence of SCMs on the strength development of concrete. It must be noted that the original method was developed to predict compressive strength. Nevertheless, our experimental results prove the suitability of the method for tensile strength data as shown below.
The tensile strength of concrete is calculated analogue to compressive strength from the strength at 28 days using Equation (2):
f tm t   = β tc t · f tm , 28 d   with   β tc t   = e s · 1 28 d t
where
  • ftm(t) is the mean tensile strength in MPa at an age t in days,
  • ftm,28d is the average tensile strength in MPa at an age of 28 days,
  • βtc(t) is a function to describe the strength development with time,
  • t is the concrete age in days,
  • s is a coefficient, which depends on the strength class of the cement, the water/binder ratio and the SCM content.
The s-value has been improved by Vollpracht et al. to account not just for the cement type, but also the content of SCM and the water/binder ratio as follows:
s = c 1 · w b + c 2 · scm b
where
  • w/b is the free water to binder ratio,
  • scm/b is the mass proportion of SCM (fly ash and/or GGBS) in the binder,
  • c1, c2 are coefficients depending on the strength class of the cement.
For cements with the strength class 32.5 N, 32.5 R and 42.5 N coefficients c1 = 0.528 and c2 = 0.527 have been determined, for cements 42.5 R, 52.5 N and 52.5 R the coefficients were calculated to c1 = 0.481 and c2 = 0.441 [34]. To account for the blast furnace slag present in the CEM II/B-S and CEM III/A examined in this study, the glass content measured by XRD was taken as an approximation of the SCM content in Equation (3).
To account for the influence of different storage temperatures of the concrete, the real concrete age t (cf. Equation (3)) is replaced by a temperature-adjusted concrete age tT following the fib model code’s maturity function as follows:
t T = i = 1 n t i e 13.65 4000 273 + T α t i
where
  • tT is the temperature-adjusted concrete age in days,
  • Δti is the number of days where a temperature Tα prevails in days,
  • Tα(Δti) is the temperature of concrete during time interval Δti in °C.
To verify the suitability of this approach for the tensile strength data in this work, the relative tensile strength after storage of concrete specimen in saturated Ca(OH)2 solution in relation to the tensile strength predicted by the maturity method was calculated. The tensile strengths of 27 series of concrete specimen (nine series with CEM I 42.5 N, nine series with CEM I 42.5 N-SR3, nine series for CEM I 42.5 N + FA) were tested after 56, 119, and 182 days of storage. Figure 3 shows the results of these calculations.
The relative tensile strength varies between 0.8 and 1.2. Normality tests were performed for each testing age as well as for the total set of 81 measurements (cf. Figure 4). All distributions follow a normality function and are centered on an average relative strength of (0.99 … 1.00) with a standard deviation of 0.10. For comparison, the coefficient of variation of tensile strength testing itself was on average 7.61% in this work. It can be concluded that the approach of using the modified maturity function to predict the tensile strength of undamaged reference samples seems justified.

3.2. Strength Development

Preliminary tests with magnesium sulfate solution mostly resulted in the formation of a brucite layer on the surface of the samples (determined by XRD and SEM). Since this attack mechanism is not representative for the cases found in Germany, the results are not discussed here. In order to provide results for the research community, we included the data in the Supplementary Materials.

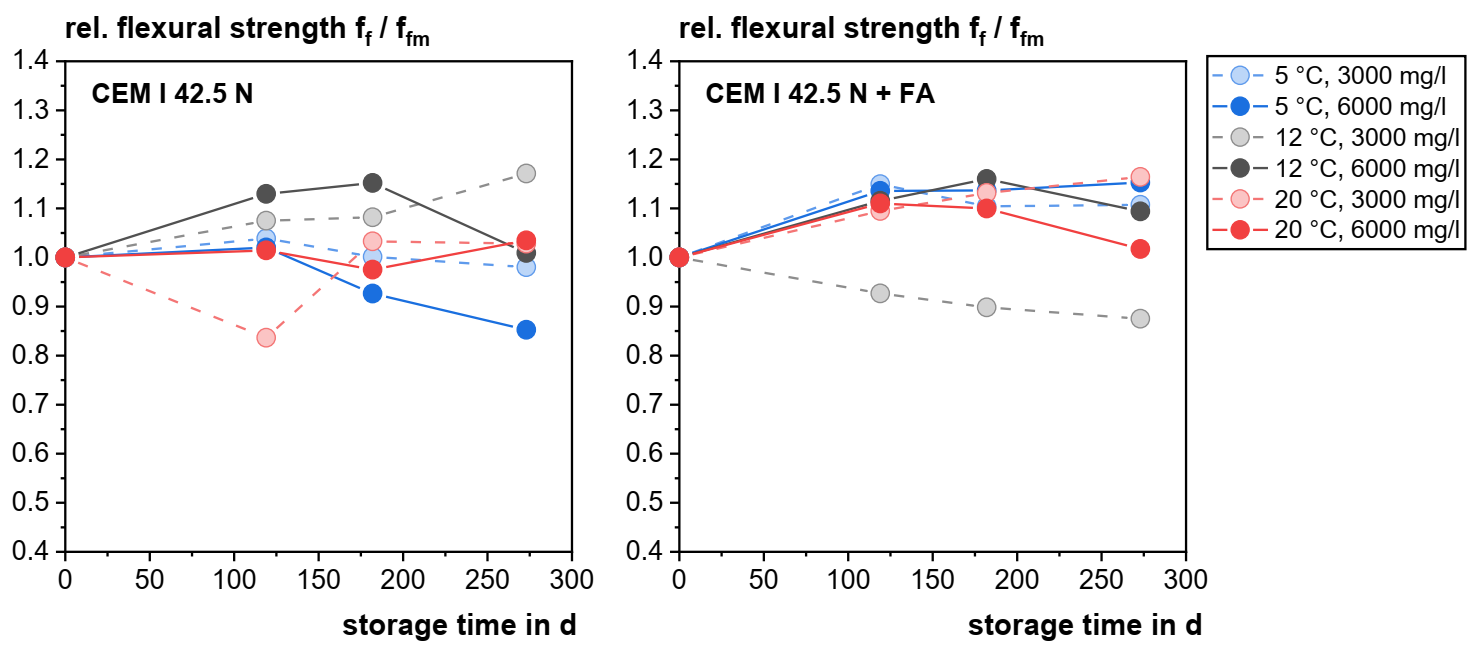
3.2.1. Flexural Strength

Table 6 shows the quality of the models achieved for relative flexural strength of concrete with w/c = 0.45 after a storage time of 182 days in sodium sulfate solution. The statistical models for the relative flexural strength are generally of low quality as reflected in the values of R2, with an exception for the series with CEM I and fly ash. To prevent misinterpretation of the poor dependencies, the contributions of influencing variables on the respective models were not determined.
The reason for the inability to determine good models for the relative flexural strength is the low diversification of the measurement data. At 182 d, there were no significant changes in flexural strength under the examined test conditions detected.
At a water to binder ratio of 0.50, the differences between the measured flexural strength samples after 182 days storage were still not large enough to allow for a good assessment of the deterioration, as shown in Figure 5. The remaining relative flexural strength after storage at 5 °C in 6000 mg SO42−/L sodium sulfate solution was 8% for concrete with Portland cement and 116% for concrete with Portland cement and fly ash. It can be concluded that six months of storage was most likely too short to evaluate the sulfate resistance of concrete by flexural strength measurements.

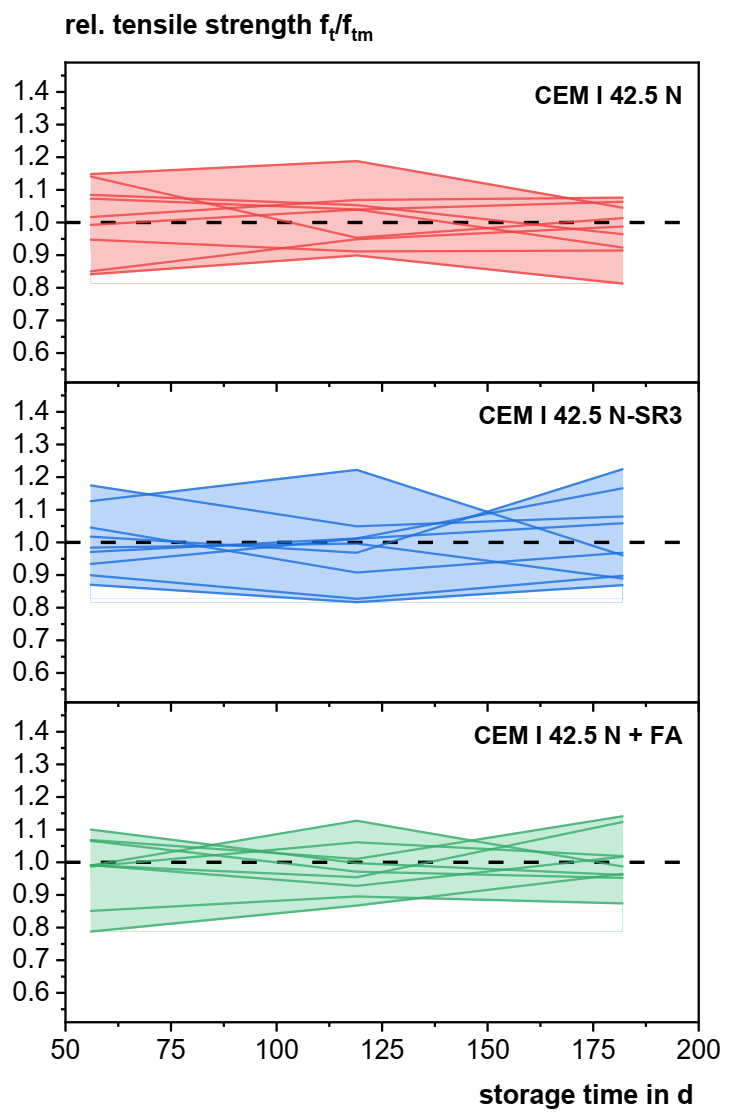
3.2.2. Tensile Strength

For the series with CEM I that was expected to be most susceptible to sulfate induced deterioration, a regression model of acceptable quality could be calculated for the relative tensile strength of concrete with w/c = 0.45 after 182 days of storage (cf. Table 7). No influence of the binder content on the models could be observed. The models for concrete with CEM I and CEM I + FA are predominantly influenced by the temperature during storage. For the series with CEM I, a significant influence of the sulfate concentration could also be detected (10% contribution). For the series CEM I-SR3 and CEM II/B-S, no models of acceptable quality could be found for the relative tensile strength.
The mathematical model as well as the underlying data for the series CEM I (cf. Figure 6) show that the higher sulfate concentration of the sodium sulfate solution results in a lower relative strength for all three tested temperatures. The predominant influence of the temperature is described by a parabolic function. The highest relative strength was observed at 12 °C storage temperature (average ft/ftm = 1.08), while lower strengths can be seen at 5 °C (average ft/ftm = 0.91) and 20 °C (average ft/ftm = 0.98). The higher relative strength at 12 °C can possibly be explained by the initial densifying effect of ettringite and gypsum before the samples deteriorate. After storage at 20 °C, the samples are mostly unaffected, while at 5 °C the specimens increasingly deteriorate, causing the reduced strength.
The dominant influence of the temperature is also apparent in the model and underlying data for series CEM I + FA (see Figure 7, right). Since there is no apparent influence by any other predictor apart from the temperature, the model shows a parabolic correlation between the temperature and the relative tensile strength. The original measurement data shown in the Figure 7 (left) confirms the validity of the calculated model. At 20 °C, the formation of ettringite and gypsum reduces the porosity and thereby improves the strength of the concrete, whereas at 5 °C this effect at longer storage times is counteracted by the loss in strength due to cracking caused by the increasing crystallization pressure (cf. Section 3.3) owing to a higher thermodynamic stability of ettringite at lower temperatures [35]. For both series, it can be concluded that the lower storage temperature of 5 °C accelerates the strength loss.
The model for CEM III/A solely predicts the sulfate concentration as an influence on the relative tensile strength. Due to this relatively small variation compared to the differences described for CEM I and CEM I + FA and the apparent influence of the fresh concrete density, the calculated model should be considered with caution (cf. Table 7).
Due to the slightly higher water to binder ratio of 0.50 (concrete mixtures M7/M8, Table 3), the dominant influence of the temperature on the relative tensile strength is more pronounced, as can be seen in Figure 8. This is especially the case for storage in 6000 mg SO42−/L. For concrete with CEM I 42.5 N stored at 5 °C and 6000 mg SO42−/L, the relative tensile strength drops significantly from 1.09 after 119 days to 0.78 after 182 days (|t| = 9.87, p = 0.05) and further to 0.50 after 273 days (|t| = 5.55, p = 0.05). The loss in tensile strength is less intense for concrete with CEM I 42.5 N-SR3, yet the changes are still significant (|t| = 4.21 from 119 day to 182 days and |t| = 3.77 from 182 days to 273 days, p = 0.05). The relative tensile strength after 273 days of storage at these conditions is 0.64.
For the concrete samples containing CEM I, there is an overall tendency towards significant strength loss in the period between 182 and 273 days of storage. Apart from the specimen stored at 20 °C in 3000 mg SO42−/L sodium sulfate solution, all mixtures experience significant strength loss. That is not the case for the sulfate resistant CEM I-SR3: the only significant changes, apart from the aforementioned strength loss at 5 °C in 6000 mg SO42−/L, can be observed between 119 days and 182 days for 5 °C at 3000 mg SO42−/L (|t| = 2.58, p = 0.05) and for the specimen stored at 20 °C in 6000 mg SO42−/L solution (|t| = 5.04, p = 0.05).
A similar behavior to the CEM I-SR3 series can be observed for the concrete samples produced with a combination of Portland cement and fly ash. The strength loss for samples stored at 5 °C in 6000 mg SO42−/L sodium sulfate solution is significant for the interval between 119 and 182 days (|t| = 2.63, p = 0.05) as well as between 182 and 273 days (|t| = 3.05, p = 0.05). The remaining relative strength is 0.71 and hence slightly above the level of the CEM I-SR3 series.
The storage of concrete with CEM II/B-S at 5 °C in 6000 mg SO42−/L results in a relative strength loss comparable to the CEM I series. The relative strength drops significantly from 1.09 after 119 days to 0.82 after 182 days (|t| = 8.07, p = 0.05) and to 0.49 after 273 days (|t| = 6.22, p = 0.05). Compared to the other binders, no big decrease in relative strength can be observed for concrete with CEM III/A, which proves the expected good sulfate resistance of this mixture.
To summarize the results on tensile strength testing as a benchmark for the sulfate resistance of concrete, in Figure 9, the results for storage in 6000 mg SO42−/L sodium sulfate solution at 5 °C are depicted for both mix designs (w/c = 0.45 and 0.50). The markers indicate measured data, while the lines represent interpolated and extrapolated data.
The increase in porosity caused by the higher water to binder ratio resulted in greater variability of the relative tensile strength data, which allows a better differentiation between the series. Enhancing the time for storage in the sulfate solution results in a further degradation of the specimens, which allows for a better evaluation of the measured data. Low relative final strength was observed for concrete with CEM I and CEM II/B-S, while the concrete with CEM I-SR3 performed slightly better, as well as a mixture of CEM I and fly ash. The highest remaining final tensile strength was detected for concrete with CEM III/A, proving the higher sulfate resistance of this concrete series.

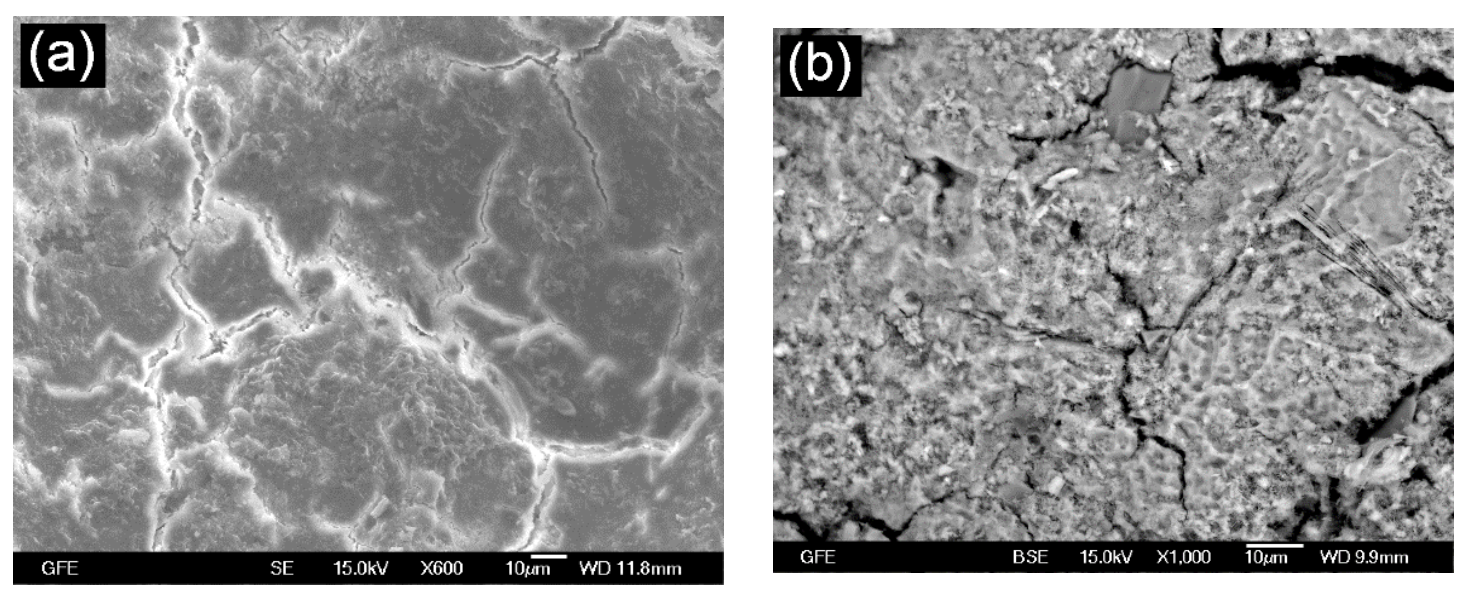
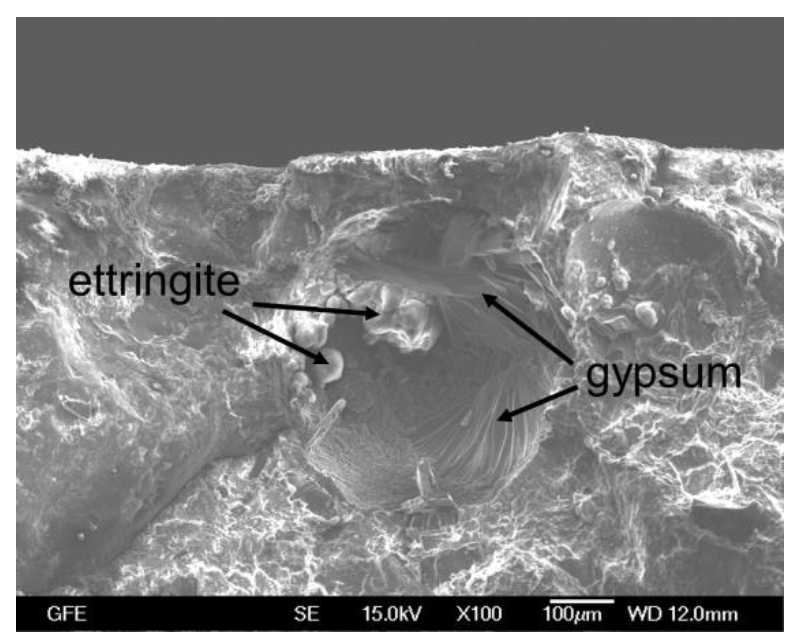
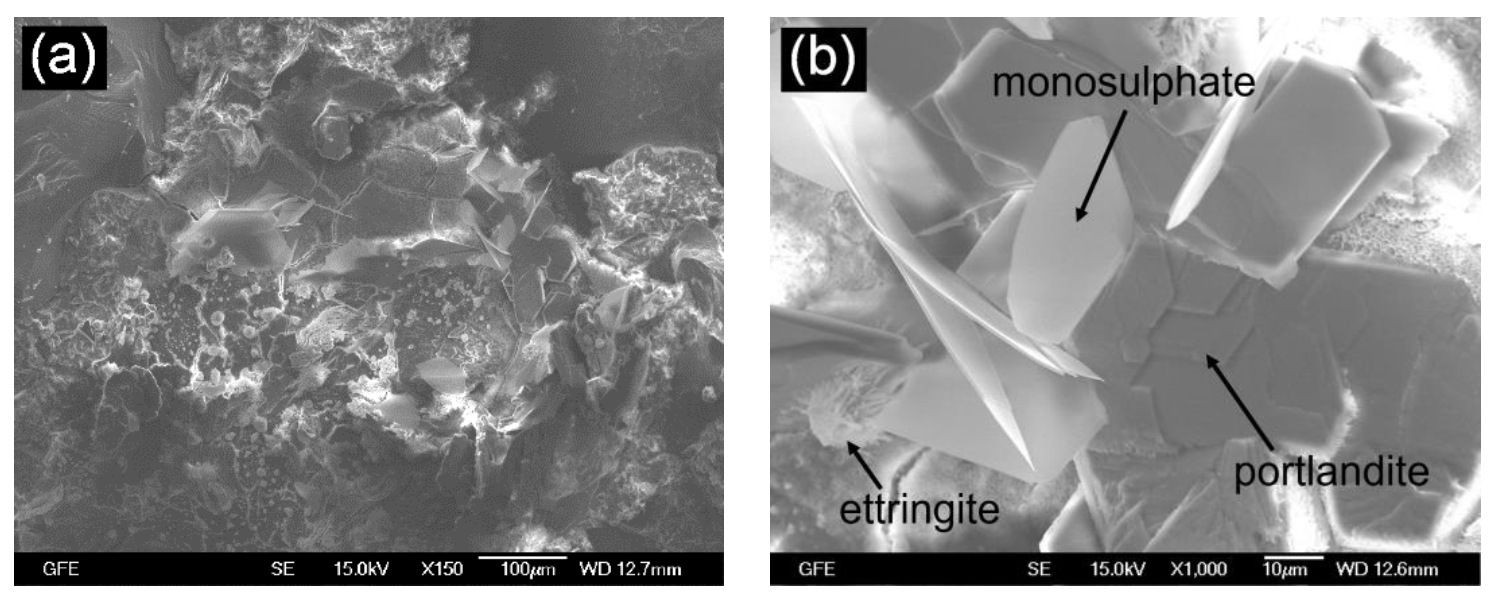
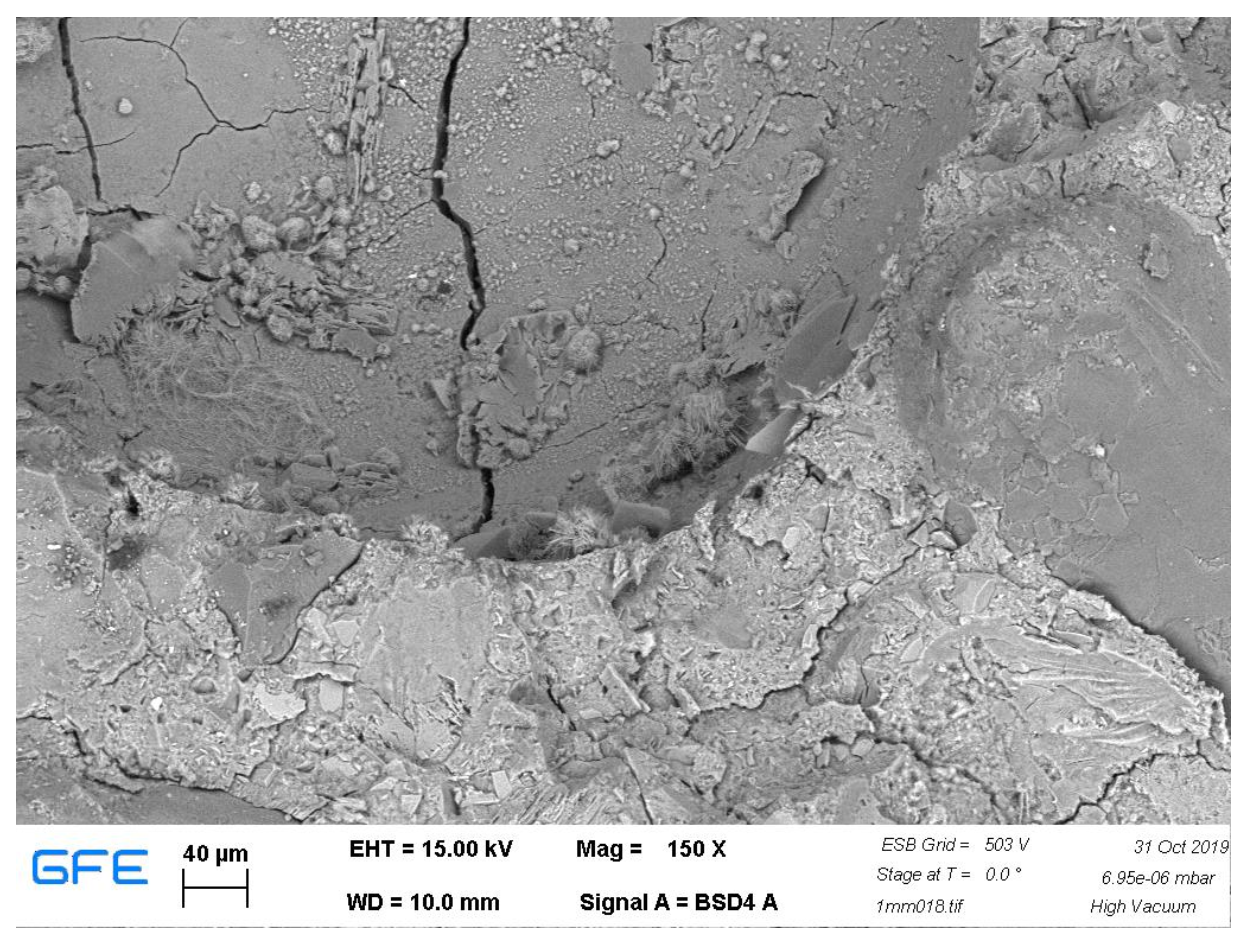
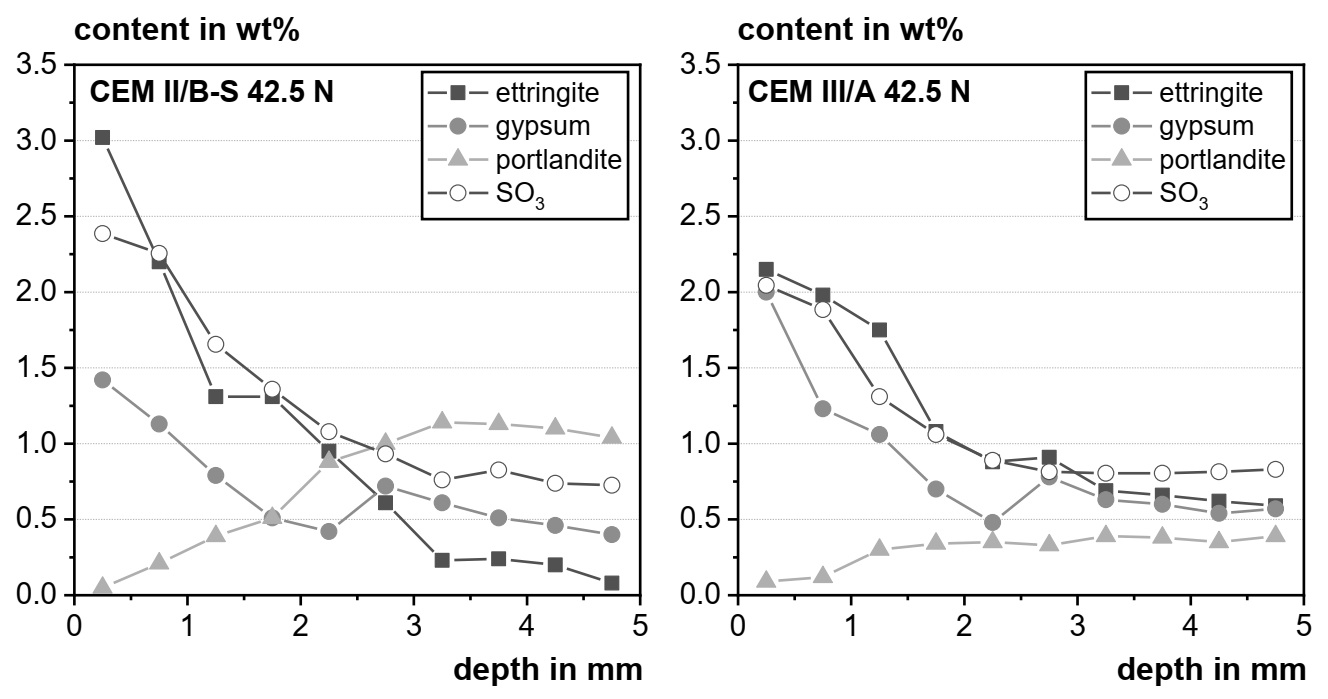
3.3. Microstructural Analysis

In Figure 10, SEM images of the fractured surface of a concrete sample made with CEM I 42.5 N and from concrete with CEM I 42.5 N-SR3 stored for 182 days in 6000 mg SO42−/L sodium sulfate solution are shown. Large cracks can be observed on the outside of the specimen with CEM I 42.5 N. The crack system runs from the surface into the center of the sample. The bigger pores close to the surface unto a depth of 1 to 2 mm are usually filled with sulfate-rich phases, predominantly large crystals of gypsum (cf. Figure 11). In the cracks, large hexagonal crystals of ettringite can be observed. The assignment of mineralogical phases was made with the help of EDX measurements. Larger cracks have a width of up to 5 µm and are wider than the cracks of 1–1.5 µm that are present in the specimen with CEM I 42.5 N-SR3 at a similar depth.
Towards the center of the samples, portlandite could be found throughout all specimens. Portlandite is not present on the surface of the specimen stored in sulfate solution because of leaching. In samples with CEM II/B-S, monosulphoaluminate (AFm) could be identified starting at a depth of 2 mm (cf. Figure 12).
The crack system for the specimen with CEM III/A was less pronounced compared to the other samples, as can be seen in Figure 13. Near the surface, ettringite and gypsum could be seen in pores and cracks. However, the sulfate intrusion depth seemed to be much lower.
In addition to the micrographs on fractured surfaces, EDX area scans were created on polished sections of samples that were embedded in epoxy resin. Aggregates were identified after determining a threshold of 75 wt% Si and are represented as black areas in the graphs. Similarly, the epoxy resin present on the surface and in pores as well as in cracks was distinguished from the sample by combining suitable EDX images to enhance the contrast. Areas with epoxy resin are filled in dark blue. The resulting diagrams (Figure 14 and Figure 15) represent the quantitative EDX analysis. The color level indicates the content of the element in the respective spot. Depth profiles of sulfur and calcium were calculated as average of a given depth, not including the aggregate and epoxy resin.
In Figure 14, the EDX area scan of a concrete sample with CEM I 42.5 N after storage for 182 days in Na2SO4 solution is shown. Near the surface of the sample, pores with large amounts of sulfur can be seen, and the calcium level is relatively low due to the leaching of calcium by the sulfate solution. Towards the inside of the sample, the calcium content increases slightly, as more portlandite is present in the pore structure. Red areas below the aggregate are a measurement artifact due to insufficient signal strength on the detector. This was caused by the texturization of the sample surface due to the different hardness of aggregate and matrix and its effect on the grinding process.
The dashed red line serves as an eye guide for the sulfur depth profile. On the surface of the sample the sulfur content of the matrix is about 12 wt%. It decreases drastically with increasing depth within the first half millimeter. At a depth of 0.8 mm, a sulfur content of 1.7 wt% was calculated, which stays constant until the end of the inspected area.
The sulfur concentration in the matrix on the surface of the sample with sulfate resistant CEM I 42.5 N-SR3 is about the same compared to the specimen with CEM I 42.5 N, as can be seen in Figure 15. Cracks filled with gypsum can be seen in the top left corner of the EDX area scan. A slower decrease in sulfur content was calculated compared to the CEM I sample until a depth of 1 mm. However, the average sulfur content at this point is slightly lower at a level of 1.4 wt%.
The average calcium content of the matrix is lower, which might be an indication of more pronounced leaching since the calcium content of the cements are similar. These results must be considered with caution since no representative sampling was done.
The similarity between the degradation of CEM I and CEM I-SR3 concretes can also be confirmed by the SO3 and XRD depth profiles, as can be seen in Figure 16. The sulfate ingress on the surface is a little higher for the CEM I sample (2.9 wt%) compared to the CEM I-SR3 sample (2.4 wt%). At a depth of 4–5 mm, the specimen with CEM I contained 0.6 wt% of SO3 whereas 0.8% by mass is present in the CEM I-SR3 specimen. This difference is explained by a higher ettringite content of the sample with CEM I 42.5 N-SR3 at this depth level. The results are in line with those obtained from the EDX area scans.
Compared to depth profiles of specimens stored in 3000 mg SO42−/L sodium sulfate solution (cf. [30]), a slightly higher content of gypsum was observed up to a depth of about 2 mm. These results are in agreement with studies by Bellmann et al. [36] which showed that, at very low sulfate concentrations (1500 mg SO42−/L), the formation of gypsum is suppressed. With increasing sulfate concentration, the formation of gypsum gets more pronounced, eventually leading to gypsum being the dominant reason for deterioration at very high levels around 30,000–50,000 mg SO42−/L. The sulfate concentration level of 6000 mg SO42−/L therefore constitutes a compromise between the realistic representation of the damage mechanism in the field and the acceleration of the deterioration process.
The incorporation of fly ash into the mix reduces the ingress of sulfate into the concrete and leads to less gypsum and ettringite formation in the outer region of the sample (cf. Figure 17). Due to the pozzolanic reaction, the portlandite content on the inside is lower compared to the sample with Portland cement as the only binder. The ettringite level at a depth of 4–5 mm is very low at 0.2 wt%, which is confirmed by the comparably lower SO3 content of 0.5 wt% determined by carbon/sulfur analysis.
The concrete with CEM II/B-S 42.5 N shows the highest ettringite content (3.0 wt%) on the surface as well as a very low level of gypsum at 1.4% by mass (see Figure 18). This is probably caused by the slag addition to the clinker that can lead to a reduced sulfate resistance of cement and concrete at low replacement levels [37], as was also confirmed by the relative tensile strength loss of the samples containing CEM II/B-S shown in Figure 8. The small depth of leaching of the concrete with CEM III/A 42.5 N can be derived from the depth profile of portlandite, proving the high physical resistance against sulfate attack of this mixture. The slightly higher SO3 content compared to the samples with Portland cement is caused by the sulfides present in the blast furnace slag.

4. Conclusions and Implications for a Future Testing Procedure

The focus of the parametric study in this publication was to develop a test set-up based on tensile strength testing, which allows a clear distinction between concrete that is sulfate resistant and not sulfate resistant. The idea was to use the relative tensile strength after storage in sulfate solution as a benchmark for the sulfate resistance of concrete.
Assessing the relative tensile strength in relation to reference samples stored in saturated lime solution has not proven to be beneficial. A high scatter was observed, and the results were not conclusive. Better results were achieved by utilizing the strength after curing of the specimen for 28 days as a reference. The suitability of a maturity function based on the fib model code was tested and proven to perform well in predicting the strength gain to be expected during the ongoing hydration of concrete. The compaction and the resulting density of the concrete have a strong influence on the tensile strength. Therefore, all samples should be produced from one batch of concrete and compacted equally. Segregation has to be avoided.
It was shown that the variation of the cement content in the concrete between 320 and 400 kg/m3 does not significantly affect the strength loss after exposure in sulfate solution. The storage temperature seems to be of superior influence. The most severe loss in overall strength could be observed for storage at 5 °C in 6000 mg SO42−/L sodium sulfate solution.
The authors therefore suggest the following test procedure to evaluate the sulfate resistance of concrete:
  • An adapted concrete mix design based on the planned concrete mixture should be used, while a maximum grain size of 8 mm must be adhered to.
  • The authors recommend raising the water to binder ratio by 10% to slightly reduce the density of the concrete, thus accelerating the performance test.
  • Briquette molds according to ASTM C307-03 should be used to produce the specimens for testing the tensile strength in one single batch, while after demolding, the samples must be stored in saturated Ca(OH)2 solution at 20 °C until an age of 28 days.
  • The tensile strength of the concrete at an age of 28 days is determined and serves as the reference strength.
  • The specimens dedicated for sulfate storage are stored in sodium sulfate solution with 6000 mg SO42−/L at 5 °C until testing. The storage solution is renewed every seven days until 28 days of storage and every 14 days afterwards to compensate the consumption of sulfates.
  • The tensile strength of the concrete is tested after 119 days (four months), 182 days (six months) and 273 days (nine months) of storage in the solution.
The relative tensile strength ft/ftm is calculated using the reference strength determined after curing for 28 days and the maturity function to account for the time of the samples in sulfate storage. The test procedure still must be verified for a large variety of binders.

Supplementary Materials

The following are available online at https://0-www-mdpi-com.brum.beds.ac.uk/article/10.3390/cryst11081001/s1. The data presented in this study are available in a digital supplement.

Author Contributions

Conceptualization, methodology, validation, formal analysis, investigation, data curation, visualization, writing—original draft preparation, J.H.; writing—review and editing, funding acquisition, supervision and advice, A.V.; supervision, T.M. All authors have read and agreed to the published version of the manuscript.

Funding

This research was funded by the AiF within the program for sponsorship by Industrial Joint Research (IGF) of the German Federal Ministry of Economic Affairs and Energy based on an enactment of the German Parliament (Project Nr. 19251N).

Data Availability Statement

The data presented in this study are available in Supplementary Materials.

Acknowledgments

This research was conducted in cooperation with the FEhS—Institut für Baustoff-Forschung e.V., Duisburg, Germany. We thank Andreas Ehrenberg and Volkert Feldrappe for the contribution of measurement data.

Conflicts of Interest

The authors declare no conflict of interest.

References

  1. Skalny, J.; Marchand, J.; Odler, I. Sulfate Attack on Concrete; Spon Press: London, UK, 2002. [Google Scholar]
  2. Santhanam, M. Effect of solution concentration on the attack of concrete by combined sulphate and chloride solutions. Eur. J. Environ. Civ. Eng. 2011, 15, 1003–1015. [Google Scholar] [CrossRef]
  3. Yu, X.; Zhu, Y.; Liao, Y.; Chen, D. Study of the evolution of properties of mortar under sulfate attack at different concentrations. Adv. Cem. Res. 2016, 28, 617–629. [Google Scholar] [CrossRef]
  4. DIN Deutsches Institut für Normung e.V. Zement-Prüfung der Leistungsfähigkeit hinsichtlich des Sulfatwiderstands-Bericht zum Stand der Technik. In DIN-Fachbericht CEN/TR 15697; Beuth Verlag GmbH: Berlin, Germany, 2008. [Google Scholar]
  5. Müllauer, W. Mechanismen des Sulfatangriffs auf Beton-Phasenneubildungen und Expansionsdrücke in Mörteln unter Na2SO4 Belastung. Ph.D. Thesis, Technische Universität München, München, Germany, 2013. [Google Scholar]
  6. Glasser, F.P.; Marchand, J.; Samson, E. Durability of concrete—Degradation phenomena involving detrimental chemical reactions. Cem. Concr. Res. 2008, 38, 226–246. [Google Scholar] [CrossRef]
  7. Kunther, W.; Lothenbach, B.; Scrivener, K.L. On the relevance of volume increase for the length changes of mortar bars in sulfate solutions. Cem. Concr. Res. 2013, 46, 23–29. [Google Scholar] [CrossRef]
  8. Lee, S.T.; Moon, H.Y.; Hooton, R.D.; Kim, J.P. Effect of solution concentrations and replacement levels of metakaolin on the resistance of mortars exposed to magnesium sulfate solutions. Cem. Concr. Res. 2005, 35, 1314–1323. [Google Scholar] [CrossRef]
  9. Loser, R.; Leemann, A. An accelerated sulfate resistance test for concrete. Mater. Struct. 2016, 49, 3445–3457. [Google Scholar] [CrossRef]
  10. Müllauer, W.; Beddoe, R.E.; Heinz, D. Sulfate attack expansion mechanisms. Cem. Concr. Res. 2013, 52, 208–215. [Google Scholar] [CrossRef]
  11. Ogawa, S.; Nozaki, T.; Yamada, K.; Hirao, H.; Hooton, R.D. Improvement on sulfate resistance of blended cement with high alumina slag. Cem. Concr. Res. 2012, 42, 244–251. [Google Scholar] [CrossRef]
  12. Rozière, E.; Loukili, A.; El Hachem, R.; Grondin, F. Durability of concrete exposed to leaching and external sulphate attacks. Cem. Concr. Res. 2009, 39, 1188–1198. [Google Scholar] [CrossRef] [Green Version]
  13. Shi, Z.; Ferreiro, S.; Lothenbach, B.; Geiker, M.R.; Kunther, W.; Kaufmann, J.; Herfort, D.; Skibsted, J. Sulfate resistance of calcined clay—Limestone—Portland cements. Cem. Concr. Res. 2019, 116, 238–251. [Google Scholar] [CrossRef]
  14. Suma, F.M.; Santhanam, M. Influence of Specimen Size on the Expansion of Portland Cement Mortars Immersed in Sodium Sulphate Solution. In External Sulphate Attack–Field Aspects and Lab Tests: RILEM Final Workshop of TC 251-SRT (Madrid-SPAIN, 2018); Menéndez, E., Baroghel-Bouny, V., Eds.; Springer: Cham, Switzerland, 2020; pp. 81–91. ISBN 978-3-030-20331-3. [Google Scholar]
  15. Wu, K.; Kang, W.; Xu, L.; Sun, D.; Wang, F.; de Schutter, G. Damage evolution of blended cement concrete under sodium sulfate attack in relation to ITZ volume content. Constr. Build. Mater. 2018, 190, 452–465. [Google Scholar] [CrossRef]
  16. Zhongya, Z.; Xiaoguang, J.; Wei, L. Long-term behaviors of concrete under low-concentration sulfate attack subjected to natural variation of environmental climate conditions. Cem. Concr. Res. 2019, 116, 217–230. [Google Scholar] [CrossRef]
  17. Bassuoni, M.T.; Nehdi, M.L. Durability of self-consolidating concrete to sulfate attack under combined cyclic environments and flexural loading. Cem. Concr. Res. 2009, 39, 206–226. [Google Scholar] [CrossRef]
  18. Khayat, K.H.; Tagnit-Hamou, A.; Petrov, N. Performance of concrete wharves constructed between 1901 and 1928 at the Port of Montréal. Cem. Concr. Res. 2005, 35, 226–232. [Google Scholar] [CrossRef]
  19. Yang, D.; Luo, J. The damage of concrete under flexural loading and salt solution. Constr. Build. Mater. 2012, 36, 129–134. [Google Scholar] [CrossRef]
  20. Zhu, J.; Cao, Y.; Chen, J. Study on the evolution of dynamic mechanics properties of cement mortar under sulfate attack. Constr. Build. Mater. 2013, 43, 286–292. [Google Scholar] [CrossRef]
  21. Biricik, H.; Aköz, F.; Türker, F.; Berktay, I. Resistance to magnesium sulfate and sodium sulfate attack of mortars containing wheat straw ash. Cem. Concr. Res. 2000, 30, 1189–1197. [Google Scholar] [CrossRef]
  22. Guerrero, A.; Goñi, S.; Macías, A. Durability of new fly ash–belite cement mortars in sulfated and chloride medium. Cem. Concr. Res. 2000, 30. [Google Scholar] [CrossRef]
  23. Guo, Z.; Wang, Y.; Hou, P.; Shao, Y.; Zuo, X.; Li, Q.; Xie, N.; Cheng, X. Comparison study on the sulfate attack resistivity of cement-based materials modified with nanoSiO2 and conventional SCMs: Mechanical strength and volume stability. Constr. Build. Mater. 2019, 211, 556–570. [Google Scholar] [CrossRef]
  24. Irassar, E.F.; Gonzalez, M.; Rahhal, V. Sulphate resistance of type V cements with limestone filler and natural pozzolana. Cem. Concr. Comp. 2000, 22, 361–368. [Google Scholar] [CrossRef]
  25. Zhang, M.; Jiang, M.; Chen, J. Variation of flexural strength of cement mortar attacked by sulfate ions. Eng. Fract. Mech. 2008, 75, 4948–4957. [Google Scholar] [CrossRef] [Green Version]
  26. Boyd, A.J.; Mindess, S. The use of tension testing to investigate the effect of W/C ratio and cement type on the resistance of concrete to sulfate attack. Cem. Concr. Res. 2004, 34, 373–377. [Google Scholar] [CrossRef]
  27. Mulenga, D.M.; Stark, J.; Nobst, P. Thaumasite formation in concrete and mortars containing fly ash. Cem. Concr. Comp. 2003, 25, 907–912. [Google Scholar] [CrossRef]
  28. Yan, C.; Yang, D.; Liu, S.; Zhang, J.; Hu, Z. Splitting Tensile Strength of Concrete Corroded by Saline Soil. ACI Mater. J. 2020, 117, 15–23. [Google Scholar] [CrossRef]
  29. Matschei, T.; Glasser, F.P. Thermal stability of thaumasite. Mater. Struct. 2015, 48, 2277–2289. [Google Scholar] [CrossRef]
  30. Haufe, J.; Vollpracht, A. Tensile strength of concrete exposed to sulfate attack. Cem. Concr. Res. 2019, 116, 81–88. [Google Scholar] [CrossRef]
  31. Funk, J.E.; Dinger, D.R. Predictive Process Control of Crowded Particulate Suspensions; Springer: Boston, MA, USA, 1994; ISBN 978-0-7923-9409-9. [Google Scholar]
  32. Westphal, T. Quantitative Rietveld-Analyse von amorphen Materialien. Ph.D. Thesis, Martin-Luther-Universität Halle-Wittenberg, Halle, Germany, 2007. [Google Scholar]
  33. FIB. Fib Model Code for Concrete Structures 2010; Ernst & Sohn: Berlin, Germany, 2013; ISBN 9783433604083. [Google Scholar]
  34. Vollpracht, A.; Soutsos, M.; Kanavaris, F. Strength development of GGBS and fly ash concretes and applicability of fib model code’s maturity function—A critical review. Constr. Build. Mater. 2018, 162, 830–846. [Google Scholar] [CrossRef] [Green Version]
  35. Matschei, T.; Glasser, F.P. Temperature dependence, 0 to 40 °C, of the mineralogy of Portland cement paste in the presence of calcium carbonate. Cem. Concr. Res. 2010, 40, 763–777. [Google Scholar] [CrossRef]
  36. Bellmann, F.; Möser, B.; Stark, J. Influence of sulfate solution concentration on the formation of gypsum in sulfate resistance test specimen. Cem. Concr. Res. 2006, 36, 358–363. [Google Scholar] [CrossRef]
  37. Gollop, R.S.; Taylor, H.F.W. Microstructural and microanalytical studies of sulfate attack. V. Comparison of different slag blends. Cem. Concr. Res. 1996, 26, 1029–1044. [Google Scholar] [CrossRef]
Figure 1. Briquette specimen according to ASTM C307.
Crystals 11 01001 g001
Figure 2. Exemplary results of concrete with CEM I 42.5 N and w/c = 0.45 stored in Na2SO4 solution at 6000 mg SO42−/L, (a) tensile strength, (b) relative tensile strength with Ca(OH)2-storage as a reference, (c) relative tensile strength with 28 d strength as a reference (called ft,0d for 0 d of sulfate storage) and (d) relative tensile strength with the reference strength calculated with the maturity function.
Crystals 11 01001 g002
Figure 3. Relative tensile strength (ref.: maturity function) after storage in saturated Ca(OH)2 solution.
Crystals 11 01001 g003
Figure 4. Histogram of the relative tensile strength (ref.: maturity function) and associated Gauss distribution for samples after storage in saturated Ca(OH)2 solution (series with CEM I 42.5 N, CEM I 42.5 N-SR3 and CEM I 42.5 N + FA).
Crystals 11 01001 g004
Figure 5. Relative flexural strength (ref.: maturity function) of concrete with CEM I 42.5 N and CEM I 42.5 N + FA (w/ceq = 0.50) after storage in Na2SO4 solution.
Crystals 11 01001 g005
Figure 6. Tensile strength (ref.: maturity function) of concrete with CEM I 42.5 N and w/c = 0.45 after 182 days storage in Na2SO4 solution.
Crystals 11 01001 g006
Figure 7. Tensile strength (left) and calculated regression model for the relative tensile strength (182 d, ref.: maturity function) of concrete with CEM I 42.5 N + FA and w/ceq = 0.45 after storage in Na2SO4 solution.
Crystals 11 01001 g007
Figure 8. Relative tensile strength (ref.: maturity function) of concrete with w/ceq = 0.50 after storage in Na2SO4 solution.
Crystals 11 01001 g008
Figure 9. Relative tensile strength (ref.: maturity function) of the concretes with w/ceq = 0.45 and w/ceq = 0.50 after storage in Na2SO4 solution with 6000 mg SO42−/L at 5 °C (dashed lines: extrapolated data).
Crystals 11 01001 g009
Figure 10. SEM micrographs (1 mm depth) of concrete with (a) CEM I 42.5 N and (b) CEM I 42.5 N-SR3 (w/c = 0.50) stored for 182 d at 5 °C in Na2SO4 solution with 6000 mg SO42−/L.
Crystals 11 01001 g010
Figure 11. SEM micrographs (surface) of concrete with CEM I 42.5 N (w/c = 0.50) stored for 182 d at 5 °C in Na2SO4 solution with 6000 mg SO42−/L.
Crystals 11 01001 g011
Figure 12. SEM micrographs (2 mm depth, (a) overview and (b) detail) of concrete with CEM II/B-S 42.5 N (w/c = 0.50) stored for 182 d at 5 °C in Na2SO4 solution with 6000 mg SO42−/L.
Crystals 11 01001 g012
Figure 13. SEM micrograph (1 mm depth) of concrete with CEM III/A 42.5 N (w/c = 0.50) stored for 182 d at 5 °C in Na2SO4 solution with 6000 mg SO42−/L.
Crystals 11 01001 g013
Figure 14. EDX map of a concrete sample with CEM I 42.5 N (w/c = 0.50) stored for 182 d at 5 °C in Na2SO4 solution with 6000 mg SO42−/L and corresponding depth profile.
Crystals 11 01001 g014
Figure 15. EDX map of a concrete sample with CEM I 42.5 N-SR3 (w/c = 0.50) stored for 182 d at 5 °C in Na2SO4 solution with 6000 mg SO42−/L and corresponding depth profile.
Crystals 11 01001 g015
Figure 16. Ettringite, gypsum, portlandite content (XRD) and SO3 content (carbon/sulfur analysis) over the depth of the specimen with CEM I 42.5 N and CEM I 42.5 N-SR3 (w/c = 0.50) stored for 182 d at 5 °C in Na2SO4 solution with 6000 mg SO42−/L.
Crystals 11 01001 g016
Figure 17. Ettringite, gypsum, portlandite content (XRD) and SO3 content (carbon/sulfur analysis) over the depth of the specimen with CEM I 42.5 N + FA (w/c = 0.50) stored for 182 d at 5 °C in Na2SO4 solution with 6000 mg SO42−/L.
Crystals 11 01001 g017
Figure 18. Ettringite, gypsum, portlandite content (XRD) and SO3 content (carbon/sulfur analysis) over the depth of the specimen with CEM II/B-S 42.5 N and CEM III/A 42.5 N (w/c = 0.50) stored for 182 d at 5 °C in Na2SO4 solution with 6000 mg SO42−/L.
Crystals 11 01001 g018
Table 1. Chemical composition of the cements and the fly ash.
ComponentCEM I 42.5 NCEM I 42.5 N-SR3CEM II/B-S 42.5 NCEM III/A 42.5 NFly Ash
CaO64.762.855.549.83.2
SiO221.519.825.630.150.1
Al2O34.104.005.597.4025.80
Fe2O32.716.551.831.177.29
MgO0.871.382.584.361.64
K2O0.621.010.630.582.03
Na2O0.340.140.390.370.91
TiO20.180.140.330.490.93
Cl0.0560.0540.0280.061<0.001
SO32.762.562.813.130.65
LOI2.391.820.41−0.964.72
Table 2. Mineralogical composition of the cements and the fly ash.
ComponentCEM I 42.5 NCEM I 42.5 N-SR3CEM II/B-S 42.5 NCEM III/A 42.5 NFly Ash
Alite57.653.833.518.6-
Belite13.09.66.14.1-
C3A7.43.05.02.7-
Ferrite6.319.92.92.1-
Gypsum0.9---0.1
Hemihydrate2.00.71.10.40.3
Anhydrite2.05.43.84.5-
Calcite5.7 *5.10.10.20.8
Periclase-0.50.2-0.2
Quartz1.10.60.20.14.8
Arcanite1.70.70.1--
Ca-Langbeinite0.90.60.80.5-
Lime----0.1
Portlandite1.4-0.40.2-
Mullite----13.2
Hematite----0.6
Magnetite----0.9
Amorphous--45.666.778.8
* Value verified by chemical analysis.
Table 3. Composition of the concrete mixtures (assumed air content: 2 vol%).
ComponentM1 (2)M2 (2)M3 (2)M4 (3)M5 (3)M6 (3)M7 (2)M8 (3)
Cement in kg/m3320360400270285300360285
Fly ash in kg/m3---9094100-94
Water in kg/m3144162180138145153180162
w/ceq (1)0.450.50
Quartz filler in kg/m3458408360354323292253249
Aggregate in kg/m314731441176715271519151115481550
Grading curvemod. Andreasen, n = 0.25
D = 8 mm, d = 1 µm
C8 (DIN 1045-2)
(1) w/ceq = w/(c + k · f) with k = 0.4, f … fly ash content (2) concrete with CEM I, CEM I-SR3, CEM II/B-S and CEM III/A (3) concrete with CEM I + fly ash.
Table 4. Examined independent variables.
Independent VariableVariation
Temperature5 °C, 12 °C, 20 °C
Concentration of the sulfate solution3000 mg SO42−/L, 6000 mg SO42−/L
cement content320 kg/m3, 360 kg/m3, 400 kg/m3
cement + fly ash content(270 + 90) kg/m3, (285 + 94) kg/m3, (300 + 100) kg/m3
Table 5. Factorial design of experiments.
SolutionTemperature in °CConcentration in mg SO42−/LConcrete Mixture
Na2SO453000M1/M4
M2/M5
6000M1/M4
M3/M6
123000M3/M6
6000M1/M4
M2/M5
203000M1/M4
M3/M6
6000M2/M5
Ca(OH)2 (1)5saturatedM1/M4
M2/M5
M3/M6
12M1/M4
M2/M5
M3/M6
20M1/M4
M2/M5
M3/M6
(1) reference storage in saturated Ca(OH)2 solution was undertaken for the series with CEM I, CEM I-SR3 and CEM I + FA.
Table 6. Coefficient of variation R2 and contribution of independent variables/interactions for regression models of the relative flexural strength (ff/ffm) of concrete with w/c = 0.45 after 182 days storage in Na2SO4 solution.
CementCEM ICEM I-SR3CEM I + FACEM II/B-S (1)CEM III/A (1)
R217%34%68%45%31%
contributionTn. d.n. d.33%n. d.n. d.
c1%
T25%
b·c34%
T: temperature, b: binder content, c: sulfate concentration, n. d.: not determined (1) influence of binder content not considered in this series.
Table 7. Coefficient of variation R2 and contribution of independent variables/interactions for regression models of the relative tensile strength (ft/ftm) of concrete with w/c = 0.45 after 182 days storage in Na2SO4 solution.
CementCEM ICEM I-SR3CEM I + FACEM II/B-S (1)CEM III/A (1)
R254%16%61%12%54%
contributionT6n. d.49n. d.n. i.
c10n. i.26
ρn. i.n. i.18
T2366n. i.
T·ρ48n. i.
c·ρn. i.n. i.14
T: temperature, c: sulfate concentration, ρ: fresh concrete density, n. d.: not determined, n. i.: no influence (1) influence of binder content not considered in this series.
Publisher’s Note: MDPI stays neutral with regard to jurisdictional claims in published maps and institutional affiliations.

