Article

Experiment Study and Finite Element Analysis of the Coupling Effect of Steel Fiber Length and Coarse Aggregate Maximum Size on the Fracture Properties of Concrete

1
School of Water Conservancy Engineering, Zhengzhou University, Zhengzhou 450001, China
2
State Key Laboratory of Coastal and Offshore Engineering, Dalian University of Technology, Dalian 116023, China
3
Taiyuan Water Resources Management and Protection Center, Taiyuan Water Affair Burea, Taiyuan 030000, China
*
Author to whom correspondence should be addressed.
Submission received: 1 June 2021 / Revised: 3 July 2021 / Accepted: 19 July 2021 / Published: 22 July 2021
(This article belongs to the Special Issue Advances in Green Building Materials and Structural Performances)

Abstract

:
The effects of steel fiber length (lf = 30 mm, 40 mm, 50 mm and 60 mm) and coarse aggregate maximum size (Dmax = 10 mm, 20 mm, 30 mm and 40 mm) on fractural properties of steel fiber reinforced concrete (SFRC) was investigated. The results show that the fracture energy (Gf) of SFRC reaches its maximum when Dmax increases to 30 mm, and it increases first and then decreases as lf increases, but it still has a significant increase compared to the control concrete. The Gf ratio increases first and then decreases as the lf/Dmax increases. The Gf of the SFRC fracture surface follows the same trend as the fractal dimension. The rational range of the lf/Dmax is 2.5–4 for the considerable strengthening effect of steel fiber on fracture performances of concrete with the Dmax of 10 mm and 20 mm and 1.5–2.33 for that concrete with the Dmax of 30 mm and 40 mm. The finite element analysis results are compared with the experimental results, and the results show that the fracture process of the finite element model is consistent with the experiment.

1. Introduction

Concrete often takes the form of brittle failure because of its high brittleness [1]. Adding steel fiber to concrete has the effect of strengthening and toughening because it could limit the expansion of internal microcracks and the development of macrocracks [2,3]. Therefore, SFRC is widely used in many fields such as pavement, hydraulic structure, civil construction, port and so on [4].
Han et al. [5,6,7,8,9,10] found that the tensile strength of concrete is affected more significantly by steel fiber than the compressive strength. It increases with the increase in volume fraction of steel fiber. The addition of steel fiber improves the flexural properties of concrete because there is a bonding effect between steel fiber and concrete matrix. It increases as the volume fraction of steel fiber increases, and flexural tensile failure of specimens requires much energy, thus improving the flexural tensile strength of concrete [11,12,13]. Additionally, the coarse aggregate maximum size has different degrees of influence on the concrete properties [14,15]. The larger coarse aggregate makes the uniform dispersion of steel fibers in the concrete plays a detrimental role, and the bending toughness of SFRC is affected. The smaller the coarse aggregate maximum size, the better the working properties of concrete.
Recently, a lot of research on the fracture properties of SFRC has been conducted. The results show that the fracture toughness and Gf of concrete increase with the increase in the coarse aggregate maximum size [16,17,18,19,20,21] and volume fraction [22,23]. The addition of steel fiber can improve the fracture properties of concrete. The fracture toughness and Gf of SFRC increase significantly with the increase in steel fiber length [24,25] and volume fraction [13,26,27,28,29,30,31,32]. However, these research results are mainly focused on the concrete of which the coarse aggregate maximum size is not larger than 25 mm. It has been concluded that when the steel fiber length is 35 mm and the volume fraction is 1.0%–1.5%, the steel fiber reinforced two-grade aggregate concrete and the steel fiber reinforced one-grade aggregate concrete have the same compressive, splitting tensile and flexural fatigue properties [31,32]. Adding steel fiber length of 60 mm into two-grade aggregate concrete can improve the strengthening and toughening effect of concrete [33]. Zhao et al. [5] studied the SFRC with the coarse aggregate maximum size of 40 mm and steel fiber length from 30 mm to 60 mm. It is found that the slump, splitting tensile strength, flexural strength, initial flexural toughness ratio, flexural toughness ratio, Gf and K Ic un of SFRC increase with the increase in steel fiber length. The flexural strength ratio increases with lf/Dmax up to 3 and then decreases. The Gf and K Ic un of SFRC gradually increase with the increase in steel fiber length, while the Gf ratio and K Ic un ratio have no obvious change with the increase in lf/Dmax. The reasonable range of lf/Dmax for splitting tensile strength and flexural properties of SFRC is 1.25–3, and for fracture properties, it is 1–4. The above research does not systematically study the fracture performance of SFRC under the coupling action of steel fiber length and coarse aggregate maximum size, which limits the application of SFRC in engineering practice.
The macro-mechanical test method is simple and easy to perform, and the test material properties are close to the actual material properties. It can describe the mechanical properties of concrete materials more directly. However, the influence of the internal components of concrete and the mechanism of damage cannot be satisfactorily explained. With the development of fine-scale mechanics, a new way was provided to study the mechanical properties of concrete at the fine-scale level. Roelfstra P. E. [34] first introduced the concept of fine-scale into the study of mechanical properties of concrete. Concrete is viewed at the fine view level as a composite material consisting of aggregates, cement mortar and the interface between them. Numerical simulation is one of the main methods used in fine-scale mechanics. Many scholars have established numerical computational models based on the study of damage of concrete, such as with mesh model, MH model and finite element model.
The traditional finite element method is a numerical method that approximates the solution of a general continuous field, which discretizes the physical model into several cell assemblies connected in some way. The workload using the traditional finite element method is large, and the crack expansion path must be predetermined when simulating concrete damage. The cracks can only expand along a specific path, which does not match the real damage of concrete. Belytschko [35] and Moés [36] modified the traditional finite element method and put forward a new calculation method of the “extended finite element method” (XFEM). The XFEM uses the proximal asymptotic field with minimal mesh reconstruction to enrich the elements near the crack tip and along the crack surface. Compared with the traditional finite element method, the XFEM has the advantages of short calculation time and simple initial crack definition [37]. By using the XFEM, the development of cracks in any path can be truly simulated [38,39,40,41]. Additionally, the voids in inhomogeneous materials such as concrete can also be simulated, which makes the simulation results closer to the macroscopic experimental results. Some scholars regard concrete as several composite materials composed of coarse aggregate, cement mortar and interfacial transition zone and establish a simplified model of concrete for numerical simulation. The numerical results are in good agreement with the experimental results [42,43,44]. At present, the use of numerical simulation to study the mechanical properties of concrete is mostly focused on ordinary concrete. There are few studies on the numerical simulation of fracture properties of SFRC using the extended finite element method. In the modeling process, the presence of steel fibers makes it much more difficult to realize the random distribution of steel fibers and coarse aggregates.
This work intends to study the fracture performance of SFRC under the coupling action of steel fiber length and the coarse aggregate maximum size through the three-point bending fracture experiments. The effects of steel fiber length, the coarse aggregate maximum size, and their ratio on the fracture parameters of SFRC were analyzed. The finite element model was established to simulate and analyze the fracture failure of SFRC. The reasonable ratio range of steel fiber length to the coarse aggregate maximum size was optimized in order to provide a reference for practical engineering design.

2. Experimental Program

2.1. Raw Materials

The P.O 42.5 ordinary Portland cement was used. The crushed stone has better bonding properties with cement mortar compared to pebbles. The coarse aggregate was crushed stone with different maximum sizes (Dmax = 10 mm, 20 mm, 30 mm and 40 mm). The fine aggregate was natural river sand with a fineness modulus of 2.5. The hooked-end steel fiber has a stronger reinforcing effect on concrete than straight steel fiber. This paper focuses on the effect of steel fiber length on concrete performance, so a single hooked-end steel fiber shape was chosen. Steel fibers shorter than 30 mm on the two-grade aggregate concrete performance enhancement are not obvious. The steel fiber was hooked-end steel fiber with different lengths (lf = 30 mm, 40 mm, 50 mm and 60 mm), all of which have a diameter of 0.75 mm. According to the team’s research [5], when the volume rate of steel fiber is less than 0.5%, it has no significant enhancement effect on the ultimate strength of concrete. When it is greater than 1.5%, it causes difficulty in mixing. When it is 1%, the strength of concrete is better, so it is determined to 1%. The water was ordinary tap water.

2.2. Mixture Proportions

According to the Chinese Standards DL/T 5150-2017 [45], the mix proportion design was carried out on the reference concrete with a strength grade of C30. The mix proportion design of SFRC is carried out with reference to the Chinese Standards CECS 13-2009 [46] and JGT 472-2015 [47]. The mix proportions of the concrete series were listed in Table 1.

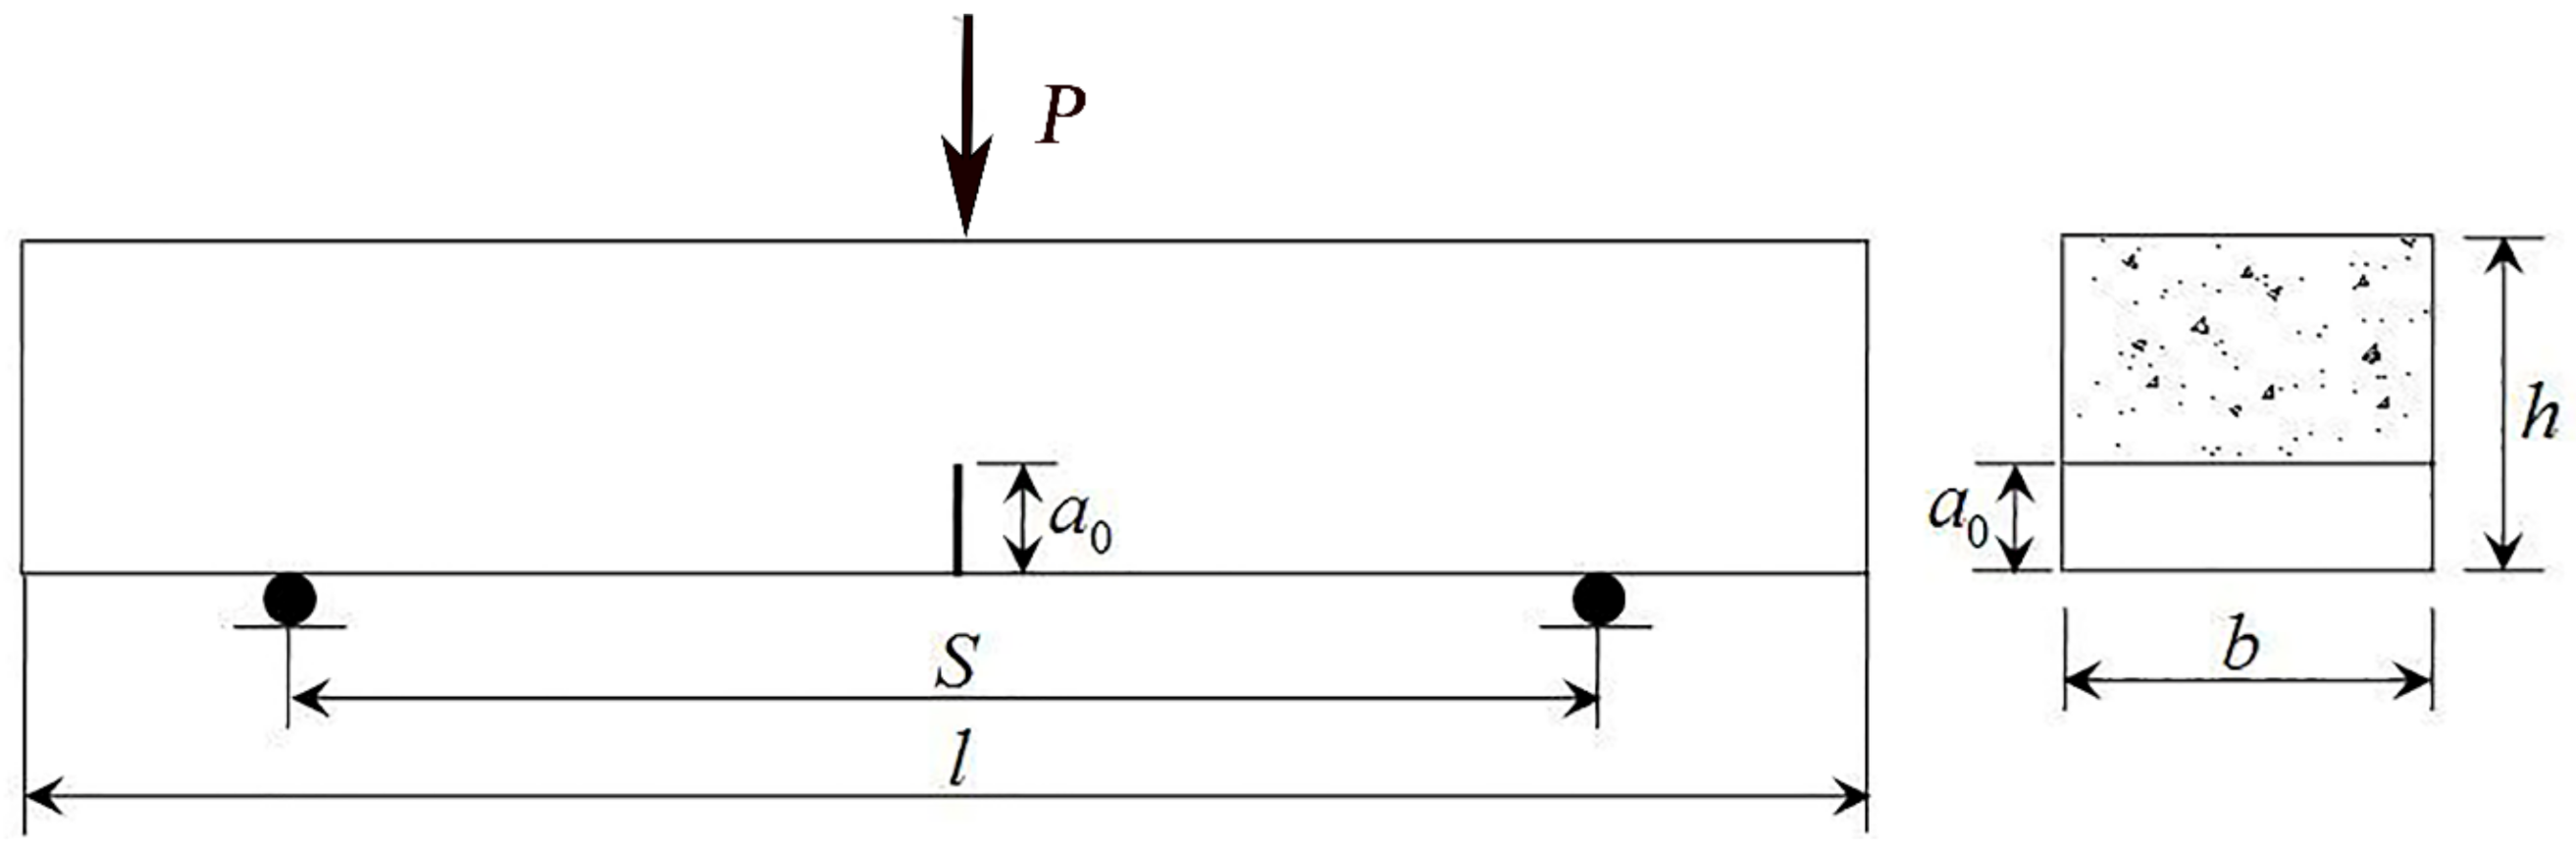
2.3. Experimental Methods

The fracture experiment of a three-point bending beam with a notch was carried out according to the Chinese Standards DL/T 5332-2005 [48]. Five specimens of 150 mm × 150 mm × 700 mm were used in each group, of which has a span(S) of 600 mm. An initial crack with a depth (of 60 mm and a width of 3 mm was cut at the bottom. The experiment drawing of the three-point bending beam is shown in Figure 1.

3. Results and Discussion
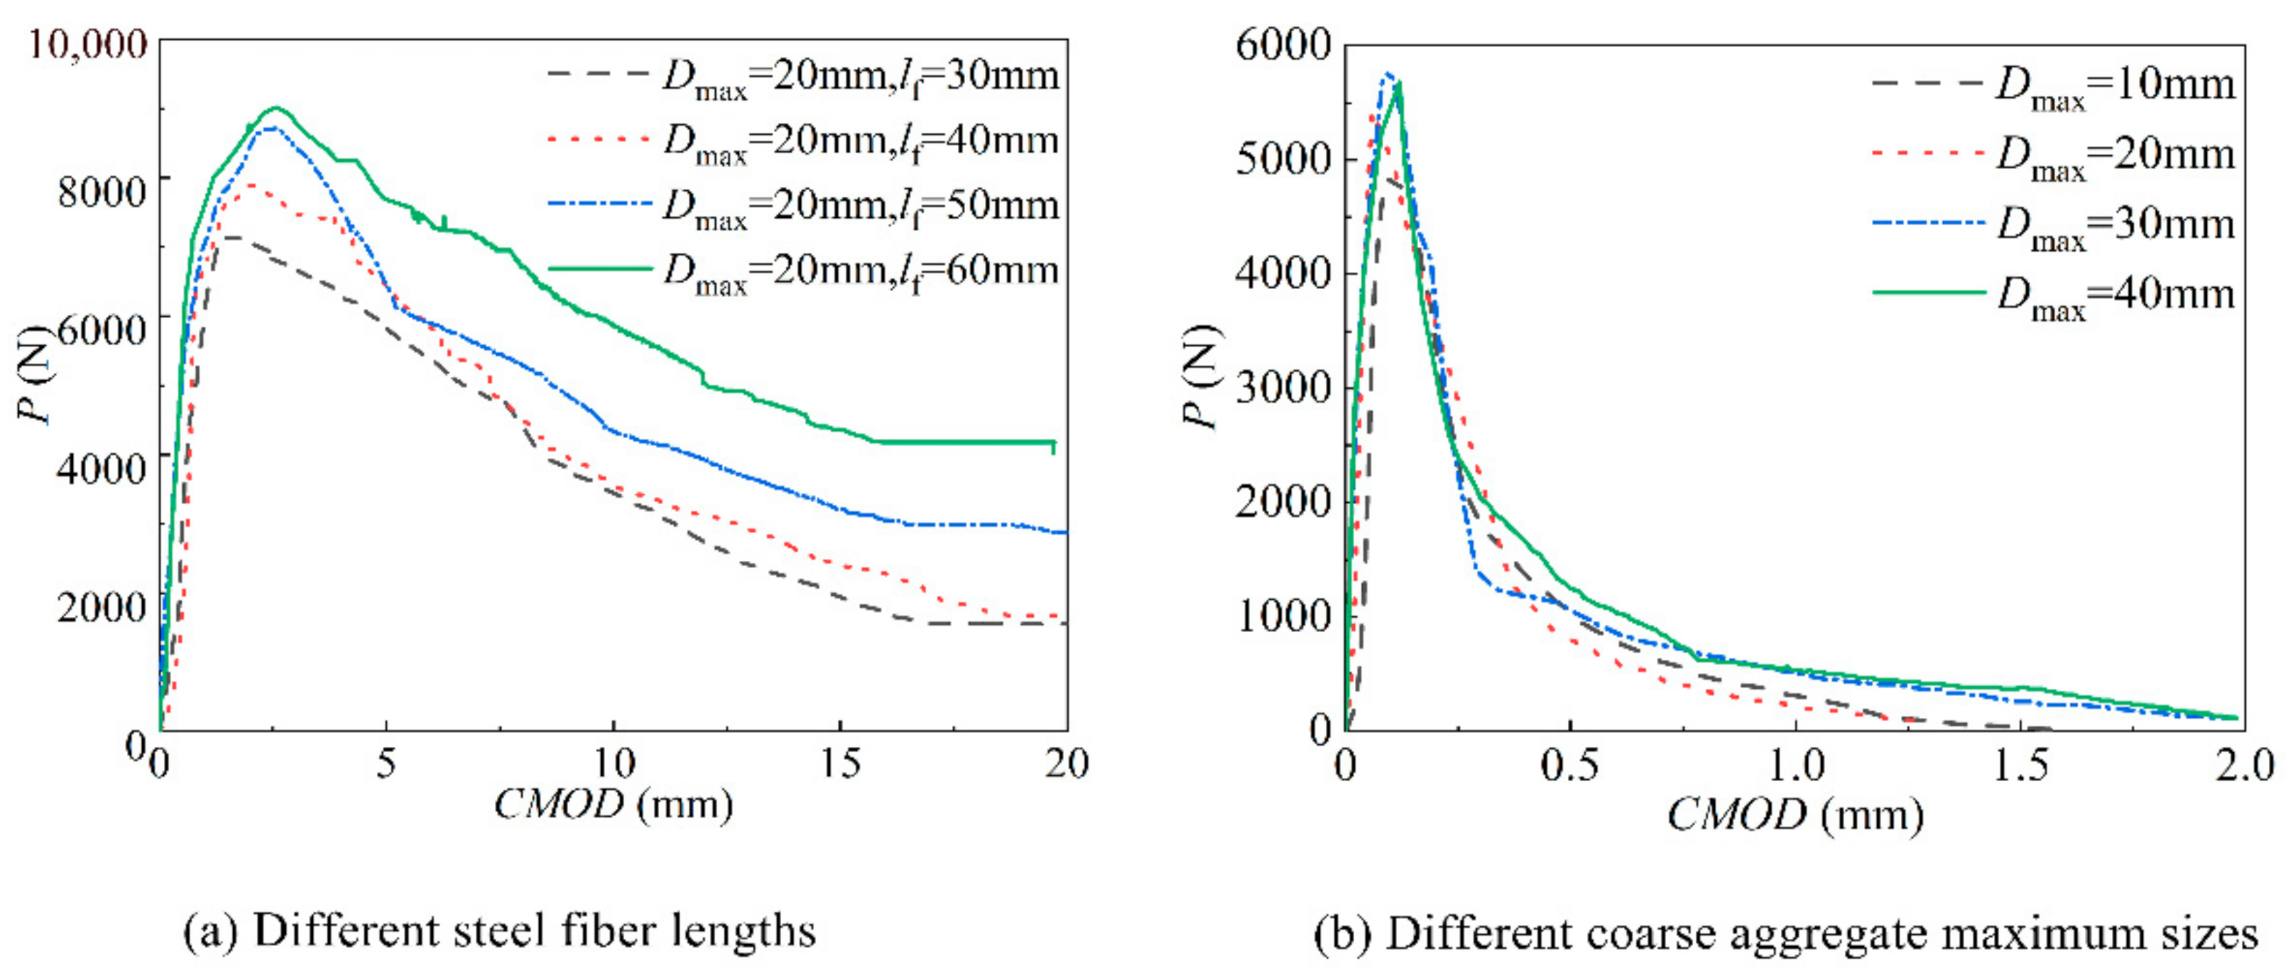
Based on the fracture experiment results, the typical crack-mouth opening displacement (P-CMOD) curve of 8 groups of concrete at different steel fiber lengths and the coarse aggregate maximum size is picked up, as shown in Figure 2.
Figure 2 shows the crack-mouth opening displacement (P-CMOD) curve of three-point bending beam specimens of SFRC with different steel fiber lengths and different coarse aggregate maximum sizes. According to Figure 2, it can be derived that steel fiber can obviously improve the fracture property of concrete. The unstable load increases and the curve descending section is slow after the addition of the steel fiber. The control concrete suffered a brittle failure in the fracture experiment. With the increase in the coarse aggregate maximum size, the unstable load of the control concrete increased slightly. Compared with the control concrete with the coarse aggregate maximum size of 10 mm, the unstable load increased, respectively, by 12%, 19% and 17%.
The stressing process of SFRC is roughly divided into three stages.
(1)
Elastic phase. The curve in this stage is linearly increasing. Because the external load is small, the original microcracks and pores inside the specimen are in a stable state, and the specimen has no obvious cracks.
(2)
Stable expansion stage. At this stage, with the increase in the load, the straight line turns into a curve, and the load value at the loading point is the initial cracking load currently. Under the load, the micro-cracks in the specimen start to expand slowly and steadily.
(3)
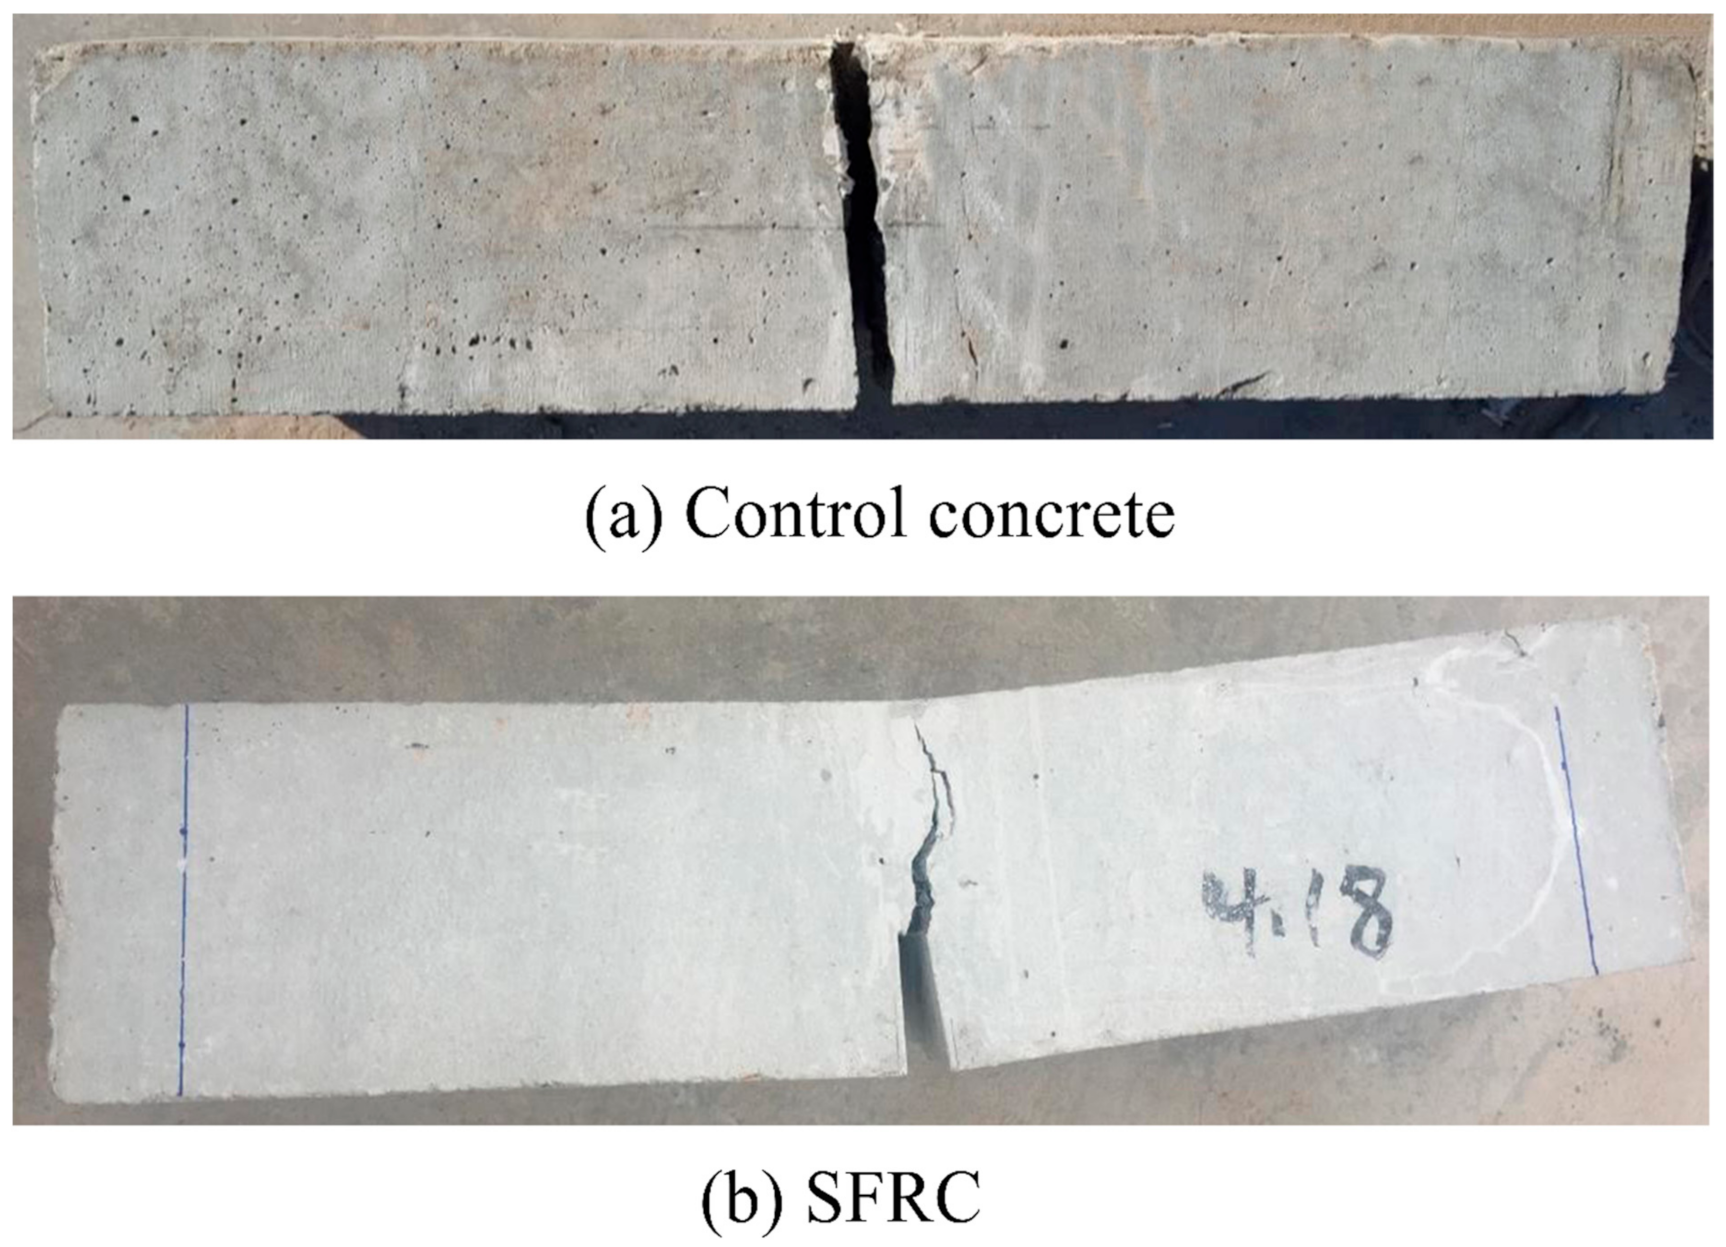
Unstable failure stage. At this stage, after the load reaches the maximum value, unstable load, the cracks inside the specimen expand rapidly, and macro-cracks begin to appear in the specimen. The load decreases, the bearing capacity of the specimen decreases, and the macroscopic crack expands continuously.
Based on the above analysis of the curves, the initial cracking loads Fini and unstable loads Fun corresponding to the two characteristic points of the crack initiation and unstable failure can be found, as well as the initial crack-mouth opening displacement a1 and critical crack-mouth opening displacement VC corresponding to both. According to the double-K fracture criterion [49], the initial fracture toughness ( K Ic ini ) of concrete can be determined through:
K I C i n i = 1.5 ( F i n i + m g 2 × 10 2 ) × 10 3 S a 1 b h 2 f ( α )
f ( α ) = 1.99 α × ( 1 α ) × ( 2.15 3.93 α + 2.7 α 2 ) ( 1 + 2 α ) × ( 1 α ) 3 / 2 , α = a 1 h
where m is mass between specimen supports; S is the span between the two supports of the specimen; b is the thickness of specimen; h is the height of specimen.
The unstable fracture toughness ( K Ic un ) of concrete can be determined through:
K I C un = 1.5 × ( F un + m g 2 × 10 2 ) × 10 3 S a c b h 2 f ( α )
f ( α ) = 1.99 α × ( 1 α ) × ( 2.15 3.93 α + 2.7 α 2 ) ( 1 + 2 α ) × ( 1 α ) 3 / 2 , α = a c h
a c = 2 π ( h + h 0 ) arctan b E V C 32.6 F un 0.1135 h 0
where h0 is the thickness of the thin steel plate of clip type extensometer, and E is the modulus of elasticity of concrete.
The results of the fracture toughness calculation for SFRC are shown in Table 2.
Table 2 shows that for concrete with a coarse aggregate maximum size of 20 mm, the fracture toughness of concrete increases as the steel fiber length increases. The maximum increase in K Ic ini is 33.3%, and the maximum increase in K Ic un is 113%. Because there is an initial microcrack inside the control concrete due to shrinkage, the stress concentration of the crack tip so that the crack sharply expands [50] when it is acted on by an external force. After the addition of steel fiber, the crack arresting effect of the steel fibers moderates the stress concentration at the crack tip and handers the crack expansion, thus improving the K Ic ini of the concrete. Because when the length of steel fiber increases, the anchoring effect of steel fiber in concrete is enhanced. It increases the bonding force between steel fiber and concrete and effectively hinders the development of cracks, thus improving the K Ic un of SFRC.
For control concrete, the fracture toughness of concrete reaches its maximum when the coarse aggregate maximum size is 30 mm. Within a certain range, the increase in the coarse aggregate maximum size can effectively hinder the crack. Due to the increase in the initial defects at the aggregate–mortar interface, when the coarse aggregate maximum size is larger, the microcracks of concrete are increased, and the bearing capacity decreases, thus reducing the fracture toughness of concrete.

4. Meso-Analysis of Finite Element Model

4.1. Electron Microscope Scanning

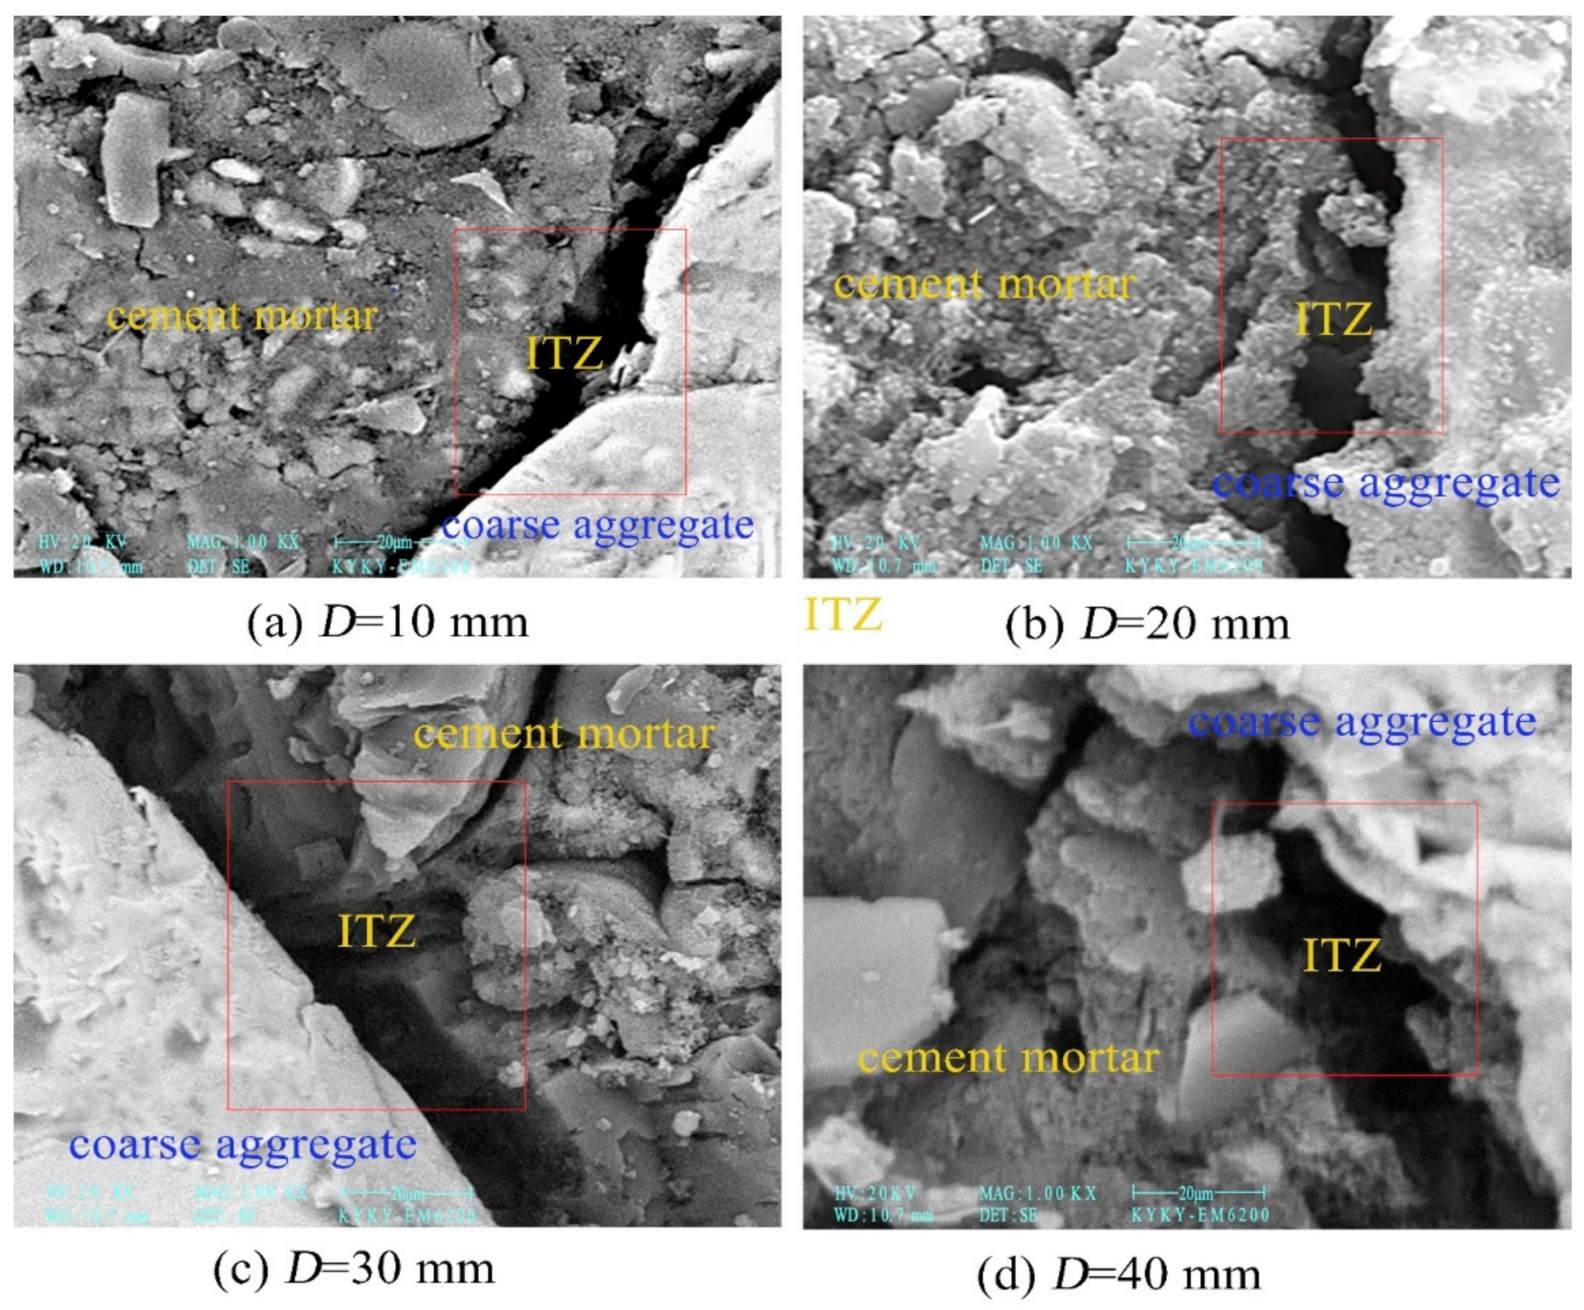
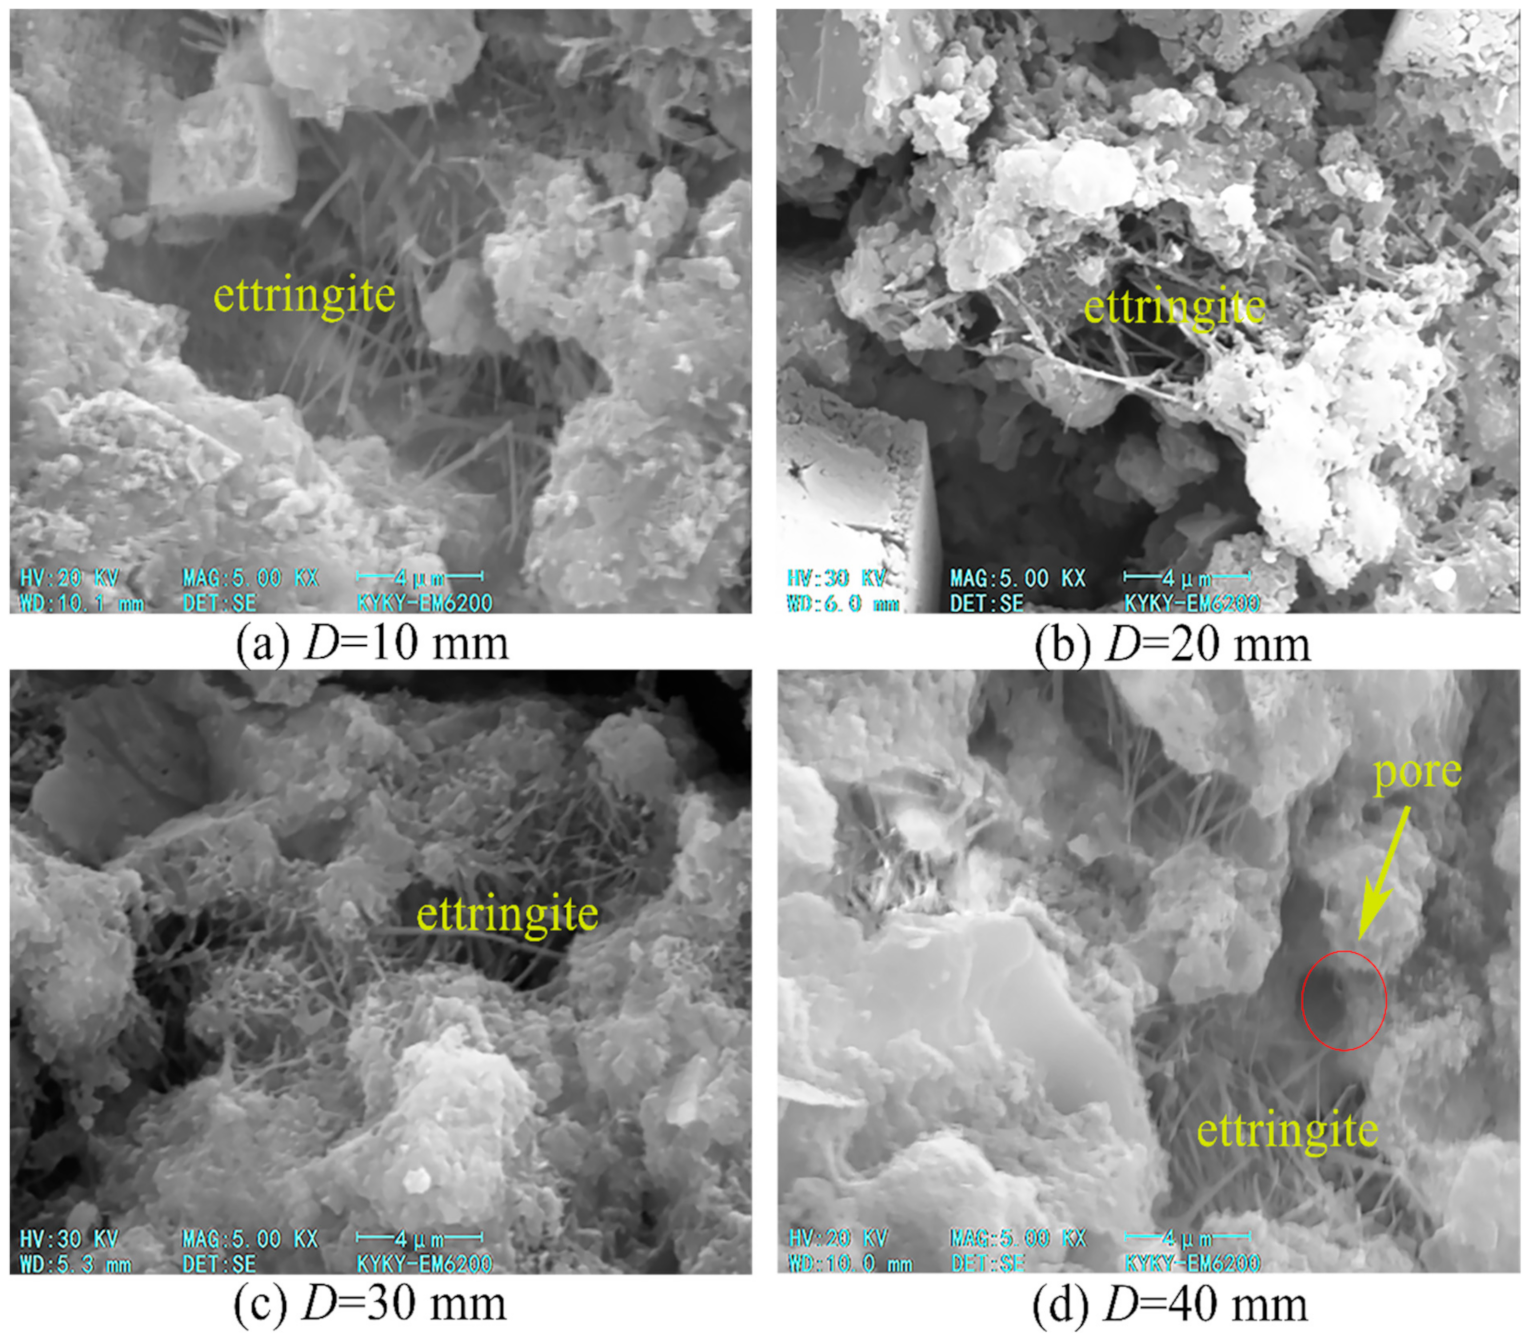
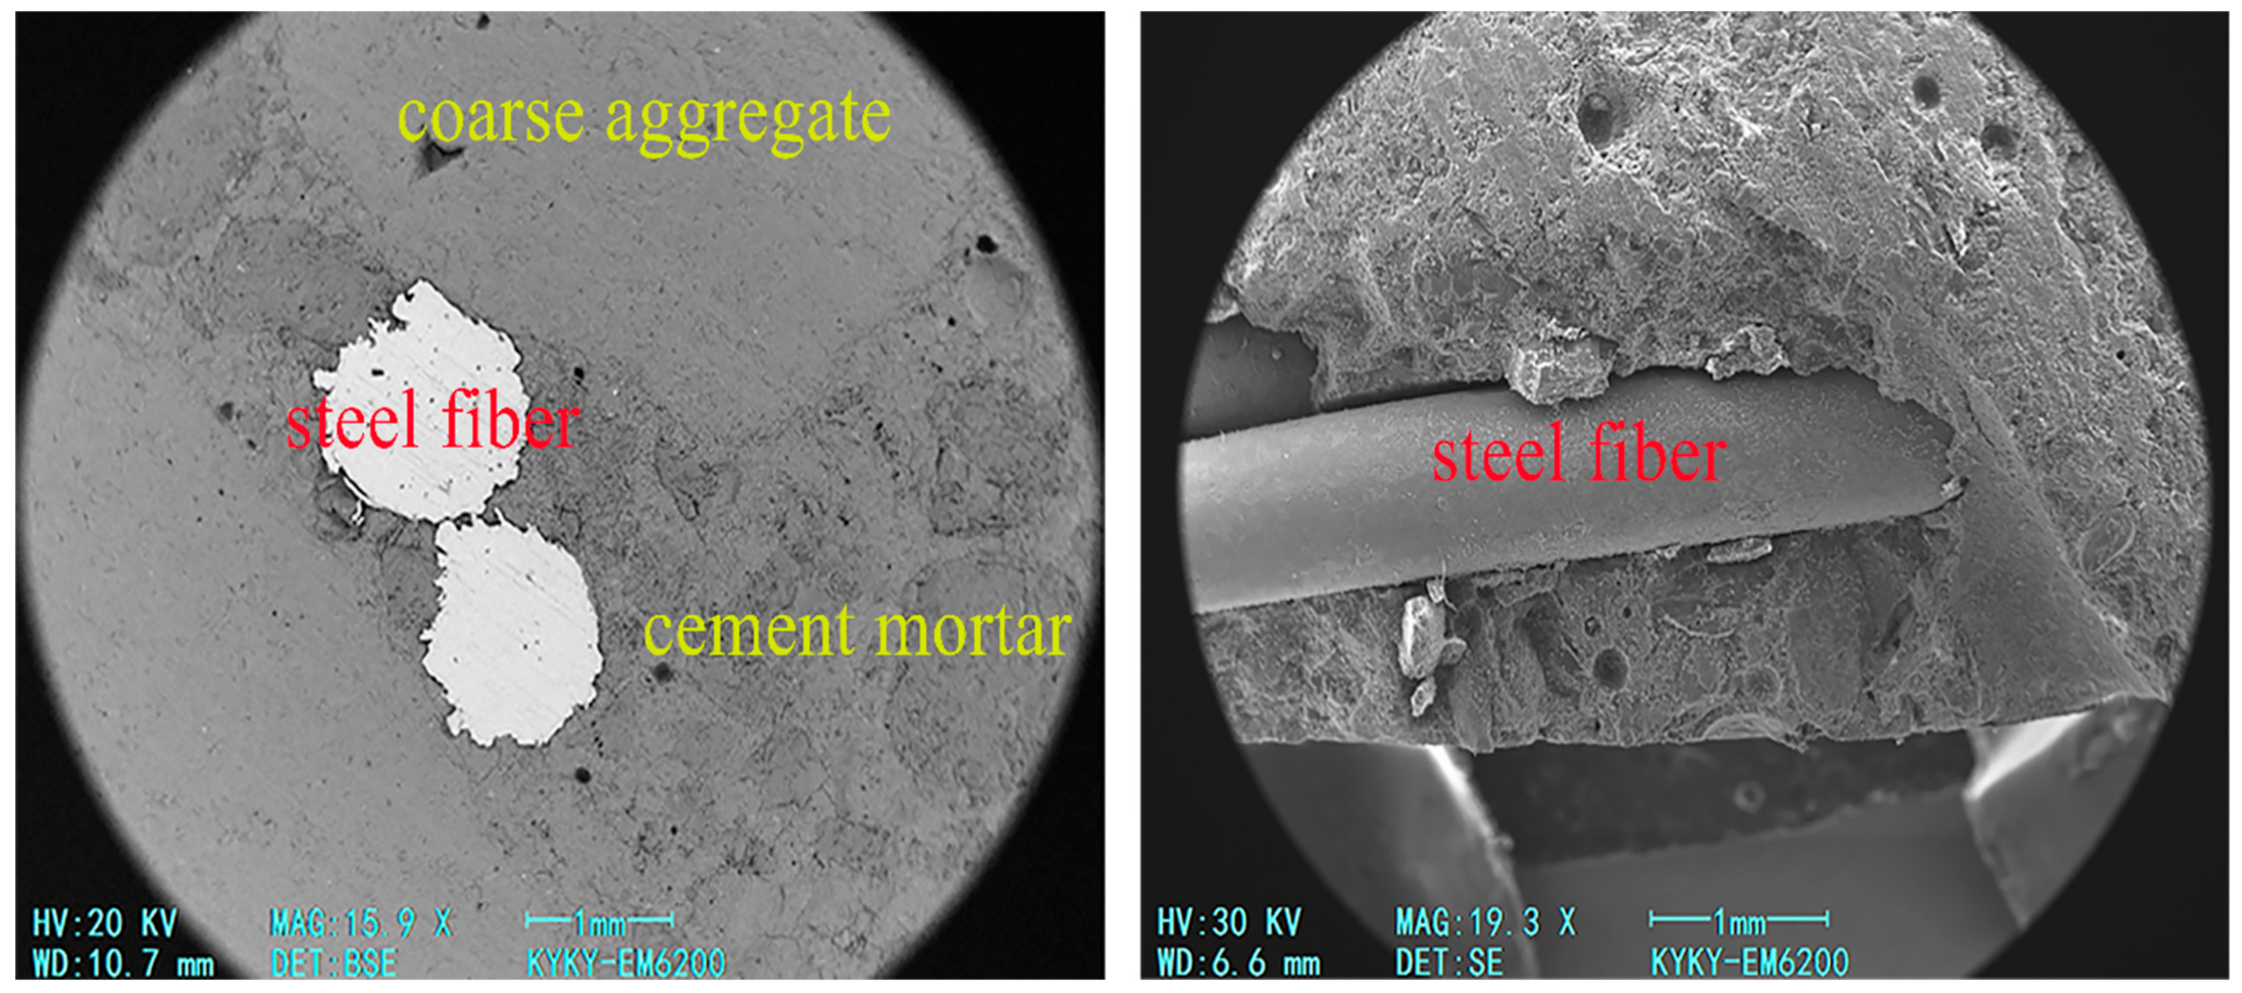
4.1.1. Structural Analysis of the Transition Zone at the Aggregate-Mortar Interface

The microstructure of the interfacial transition zone is multinomially inhomogeneous [51]. The secondary electron signal of the electron microscope scan was used to measure the structural distribution of the aggregate–mortar interfacial transition zone (ITZ). The microstructure of the SFRC aggregate–mortar interfacial transition zone at different coarse aggregate maximum sizes is shown in Figure 3 and Figure 4.
Figure 3 shows the morphology of the interfacial transition zone with different coarse aggregate maximum sizes at a magnification factor of 1000 times. It can be seen from Figure 3 that there is a structural loose zone between the aggregate and cement mortar. It is the interfacial transition zone. The thickness of the interfacial transition zone gradually increases with the increase in the coarse aggregate maximum sizes.
Figure 4 shows the morphology of the interfacial transition zone with different coarse aggregate maximum sizes at a magnification factor of 5000 times. It can be seen from Figure 4 that the structure of the interfacial transition zone is significantly looser than that of the cement mortar. A large amount of fibrous material ettringite was observed. With the increase in coarse aggregate maximum size, the structural denseness of the interfacial transition zone gradually decreases, and the pore content gradually increases. Because with the increase in coarse aggregate maximum size, the tendency of its surface to collect water film is stronger. The local water–cement ratio in the transition zone is increased, and larger crystals are generated. More pore structures are formed in the interfacial transition zone, and their thickness increases.

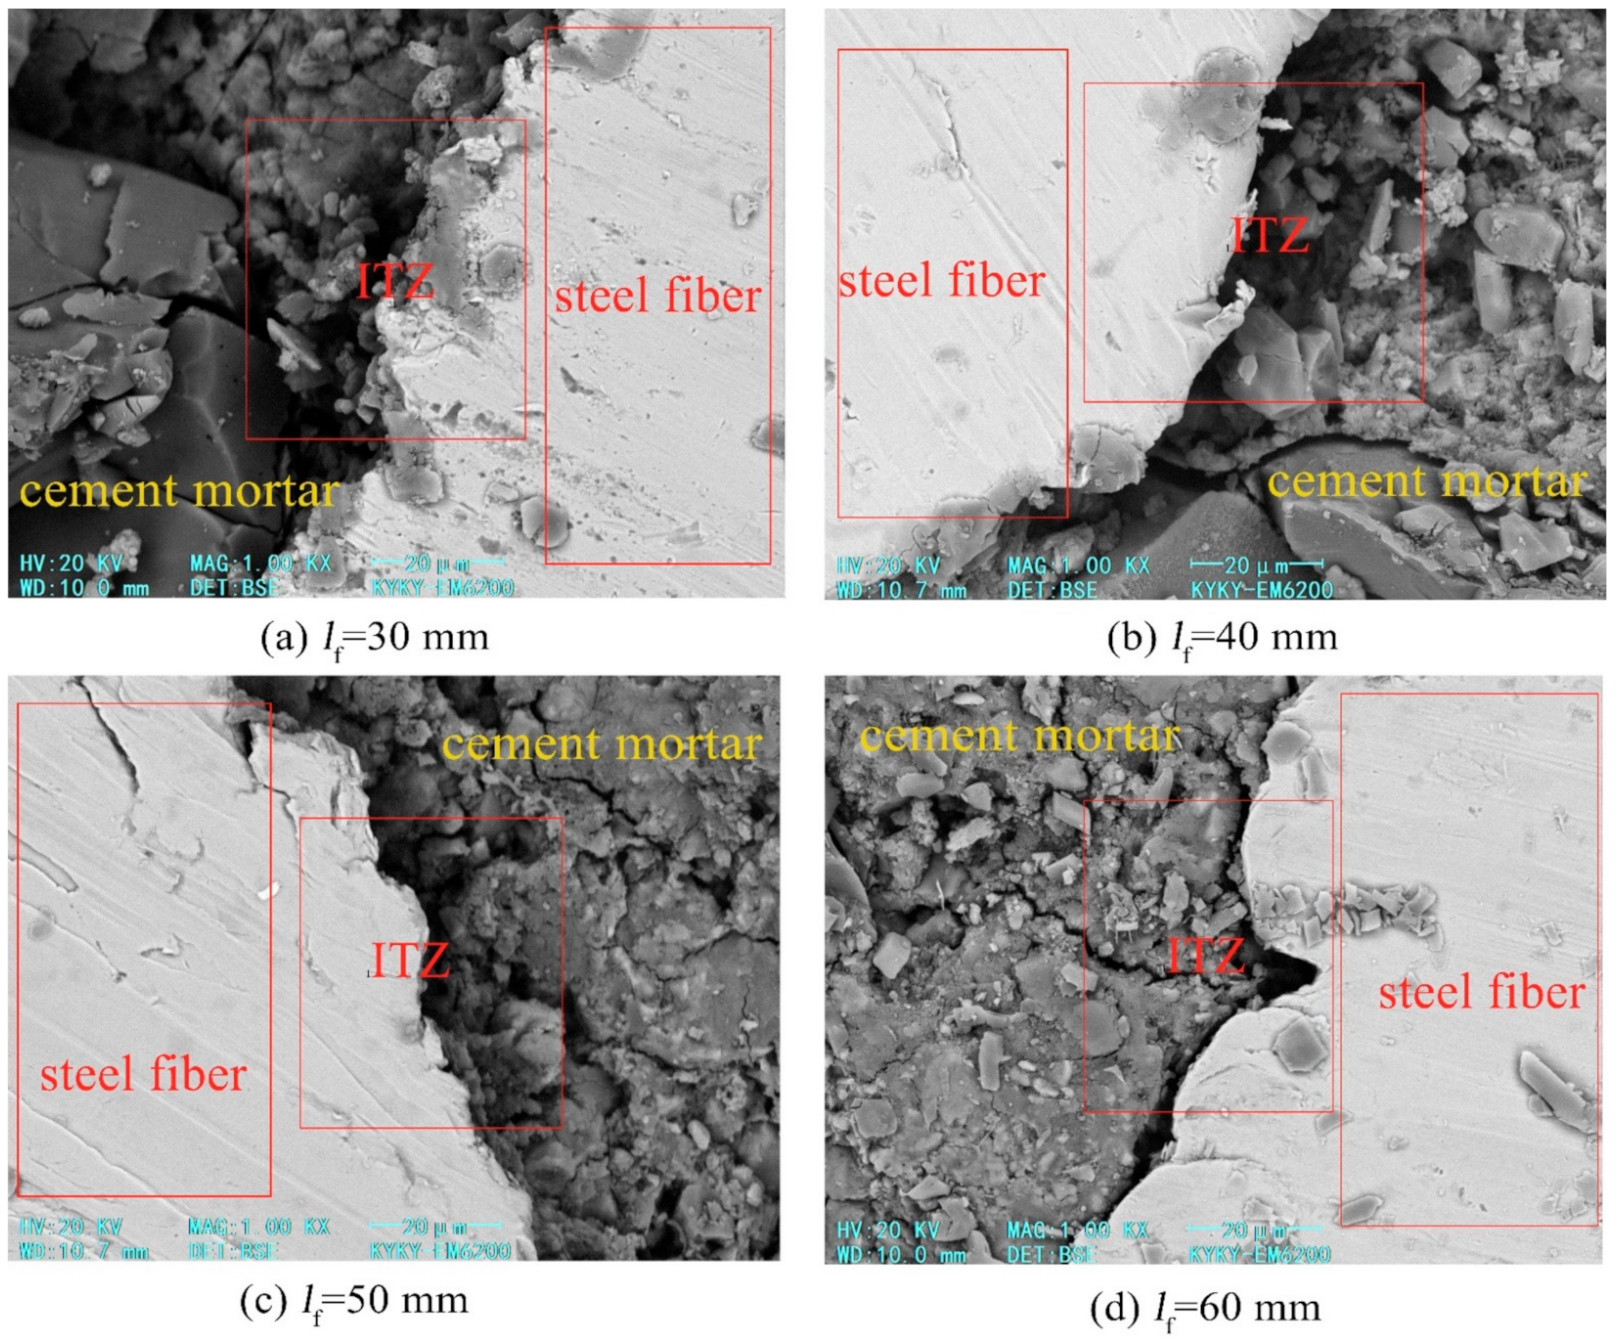
4.1.2. Structural Analysis of the Transition Zone at the Steel Fiber–Mortar Interface

The observation determination of the steel fiber position by using the backscattering electron image of the scanning electron microscope is shown in Figure 5.
Figure 5 shows a partial view of the SFRC electron microscope scan. It can be seen from Figure 5 that the steel fiber–mortar interface has better denseness compared to the coarse aggregate–mortar interface. Because the interfacial transition zone between steel fiber and cement mortar produces a water film layer between the steel fiber and cement mortar during the concrete forming process. The calcium hydroxide crystals in the cement hydration products are gathered in the water film layer in large quantities. Iron ions can reduce some of the negative effects of the water film layer [52]. More hydrated calcium silicate gel is generated in the immediate vicinity of the fibers. It is easier to contact the fibers and fill in the porous structure immediately adjacent to the fiber surface, thus enhancing the denseness of the structure.
The structural distribution of the transition zone at the steel fiber–mortar interface was measured using the secondary electron signal from the electron microscope scan. The microstructure of the steel fiber–mortar interfacial transition zone of SFRC with different steel fiber lengths is shown in Figure 6.
Figure 6 shows the morphology of the interfacial transition zone at different steel fiber lengths with different magnification factors. It can be seen from the figures that the thickness of the interfacial transition zone decreases as the length of steel fibers increases. The interfacial transition zone between steel fiber and cement mortar is mainly due to the water film layer generated between steel fiber and cement mortar during the concrete forming process, and the calcium hydroxide crystals in the cement hydration products are gathered in large quantities in the water film layer. Iron ions were able to reduce some adverse effects of the water film layer to some extent, which led to the generation of more hydrated calcium silicate gel in the immediate vicinity of the fibers, increasing its contact with the fibers and filling in the porous structure immediately above the fiber surface, thus enhancing the denseness of the structure. The longer the length of the steel fiber, the greater the contact area with the mortar, the more dissolved iron ions, the higher the concentration of ions in the interfacial transition zone, the denser the structure. When the steel fiber length is 30–60 mm, the longer the steel fiber length, the denser the interface transition zone.
At present, there is no unified value for the thickness of the interface transition zone, and it is generally considered that the thickness of the interface transition zone is 20–100 μm. In the concrete fine view study, considering the special characteristics of the interface transition zone and combining it with the computer computing ability, the thickness of the interface transition zone is usually set between 0.1 and 0.5 mm. According to the SEM results, the thicknesses of the coarse aggregate–mortar interface and the steel fiber–mortar interface were set to 0.2 mm.

4.2. Establishment of Finite Element Model of Steel Fiber Reinforced Concrete

4.2.1. Finite Element Modeling

This study adopts the extended finite element method (XFEM). The Monte Carlo method is used to generate random numbers for the simulation to achieve the random distribution of the aggregate position and the steel fiber position. The mesoscale numerical model of a two-dimensional SFRC is shown in Figure 7. The coarse aggregate, the cement mortar and the two interfaces adopt the CPS4R element. The steel fiber adopts the T2D2 element. The fine-scale mechanical parameters of each phase component of SFRC have no accurate values so far, so in this paper, the parameters are substituted into the model according to the research results of many scholars [53,54,55,56,57,58], and the simulation results are compared with the macroscopic test results to make the model more reasonable by adjusting the mechanical parameters. The parameters are finally determined by considering their convergence through model trial calculations. The parameters used in the numerical simulation are as follows in Table 3.

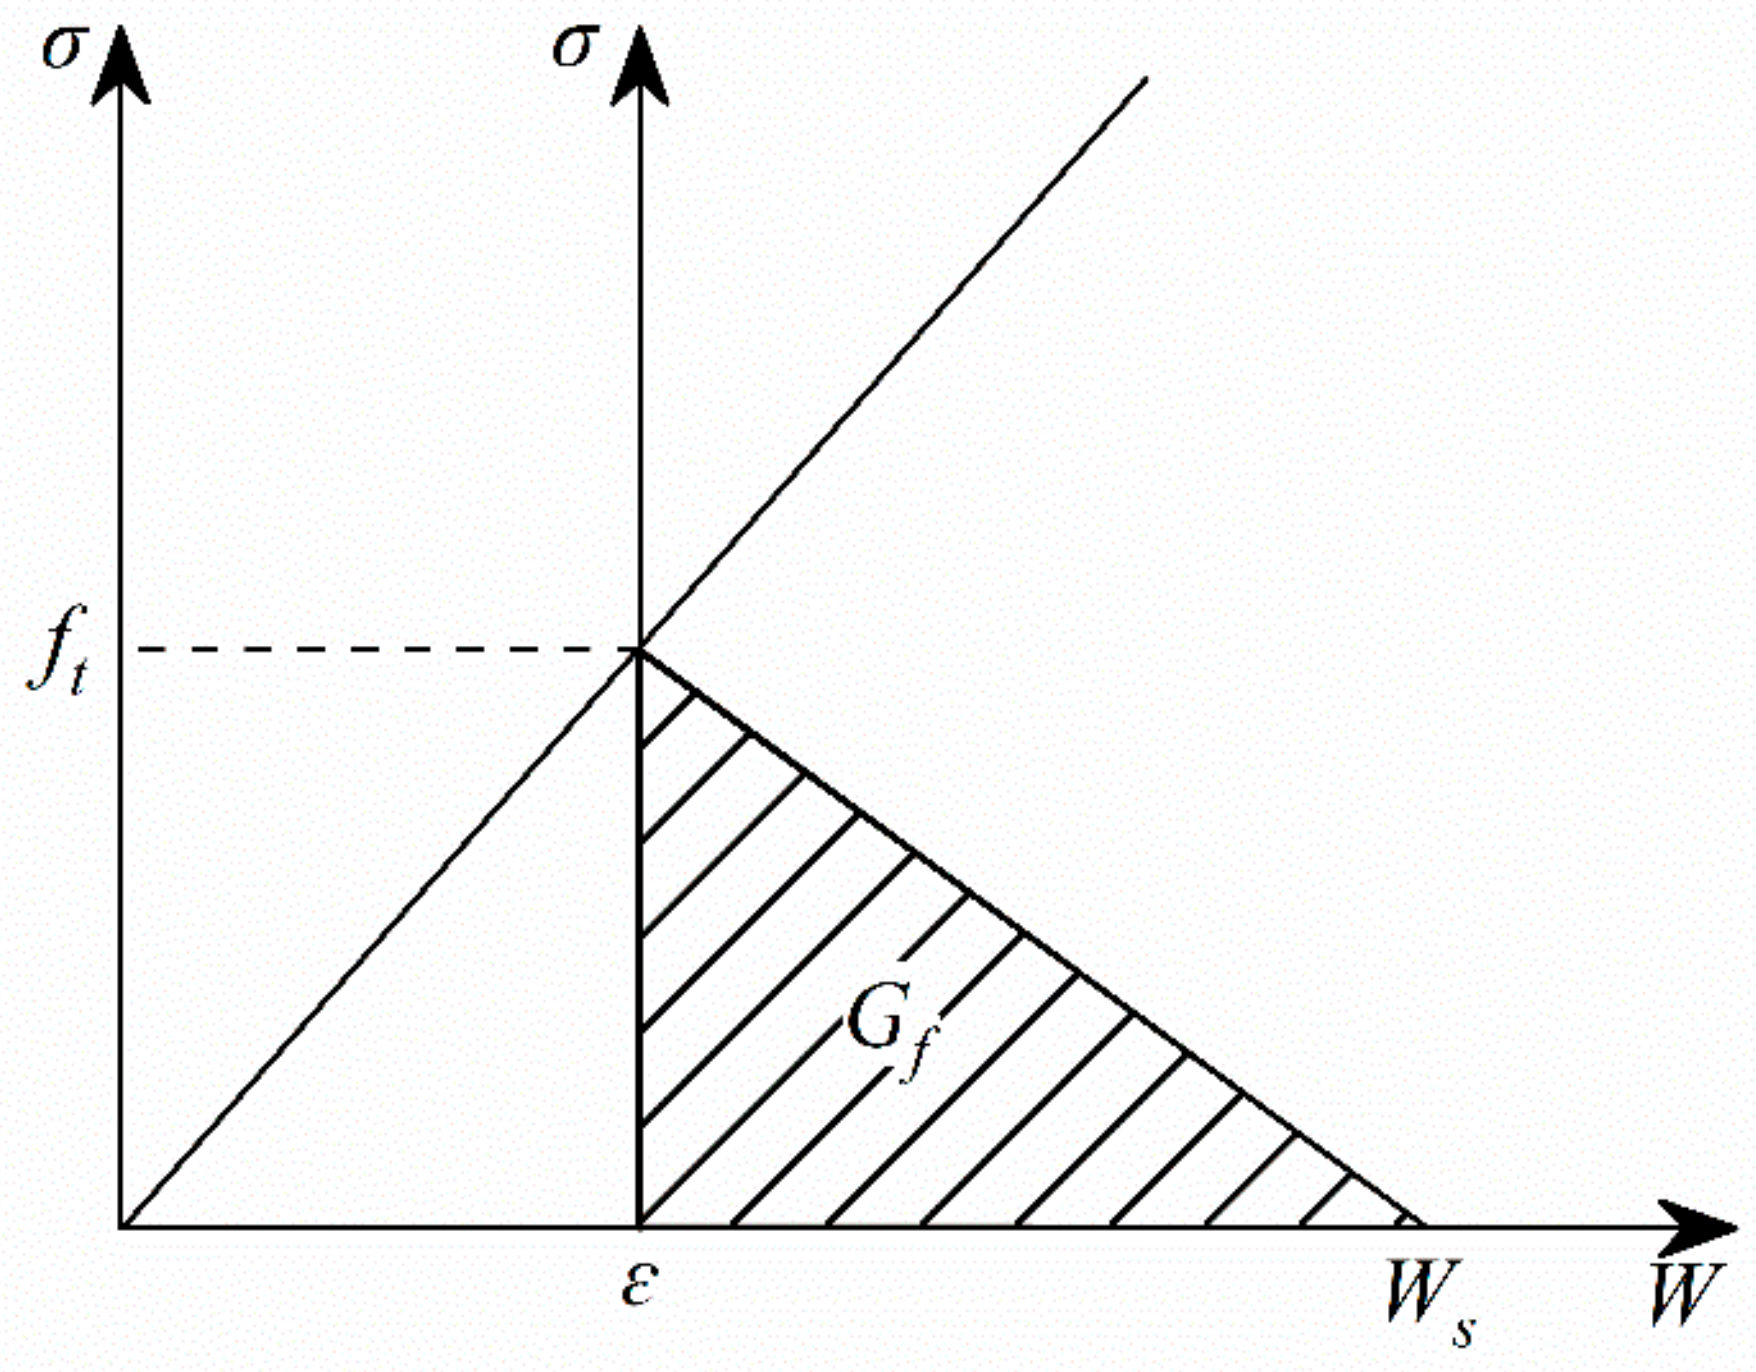
4.2.2. Constitutive Relation of Materials

Assuming no damage failure to the coarse aggregate and steel fibers, so the coarse aggregate and steel fiber adopt the linear-elastic constitutive modeling. Its model is shown in Figure 8, and the expression of the constitutive model is Equation (6). The mortar and interface adopt the bilinear constitutive model. Assuming that the material is linear-elastic before the peak stress, and the stress-crack opening displacement is used to characterize the softening mechanical behavior of the material after reaching the peak stress. Its model is shown in Figure 9.
The coarse aggregate and the steel fiber constitutive relation:
σ = ε E

4.2.3. Failure Criterion

Combined with macroscopic experiments, the maximum principal stress criterion is chosen as the initial fracture criterion of the model. In the initial state, the microscopic element is an elastomer that uses an elastic modulus and a Poisson ratio to express its mechanical properties. As the element stress increases, when the maximum principal tensile stress of the microscopic element reaches its ultimate tensile stress, the element starts to have tensile damage. Its fracture criterion can be expressed as:
f = { σ max σ max 0 } 1
  stands for the Macaulay bracket, defined as:
x = x + | x | 2

4.3. Finite Element Numerical Results and Analysis

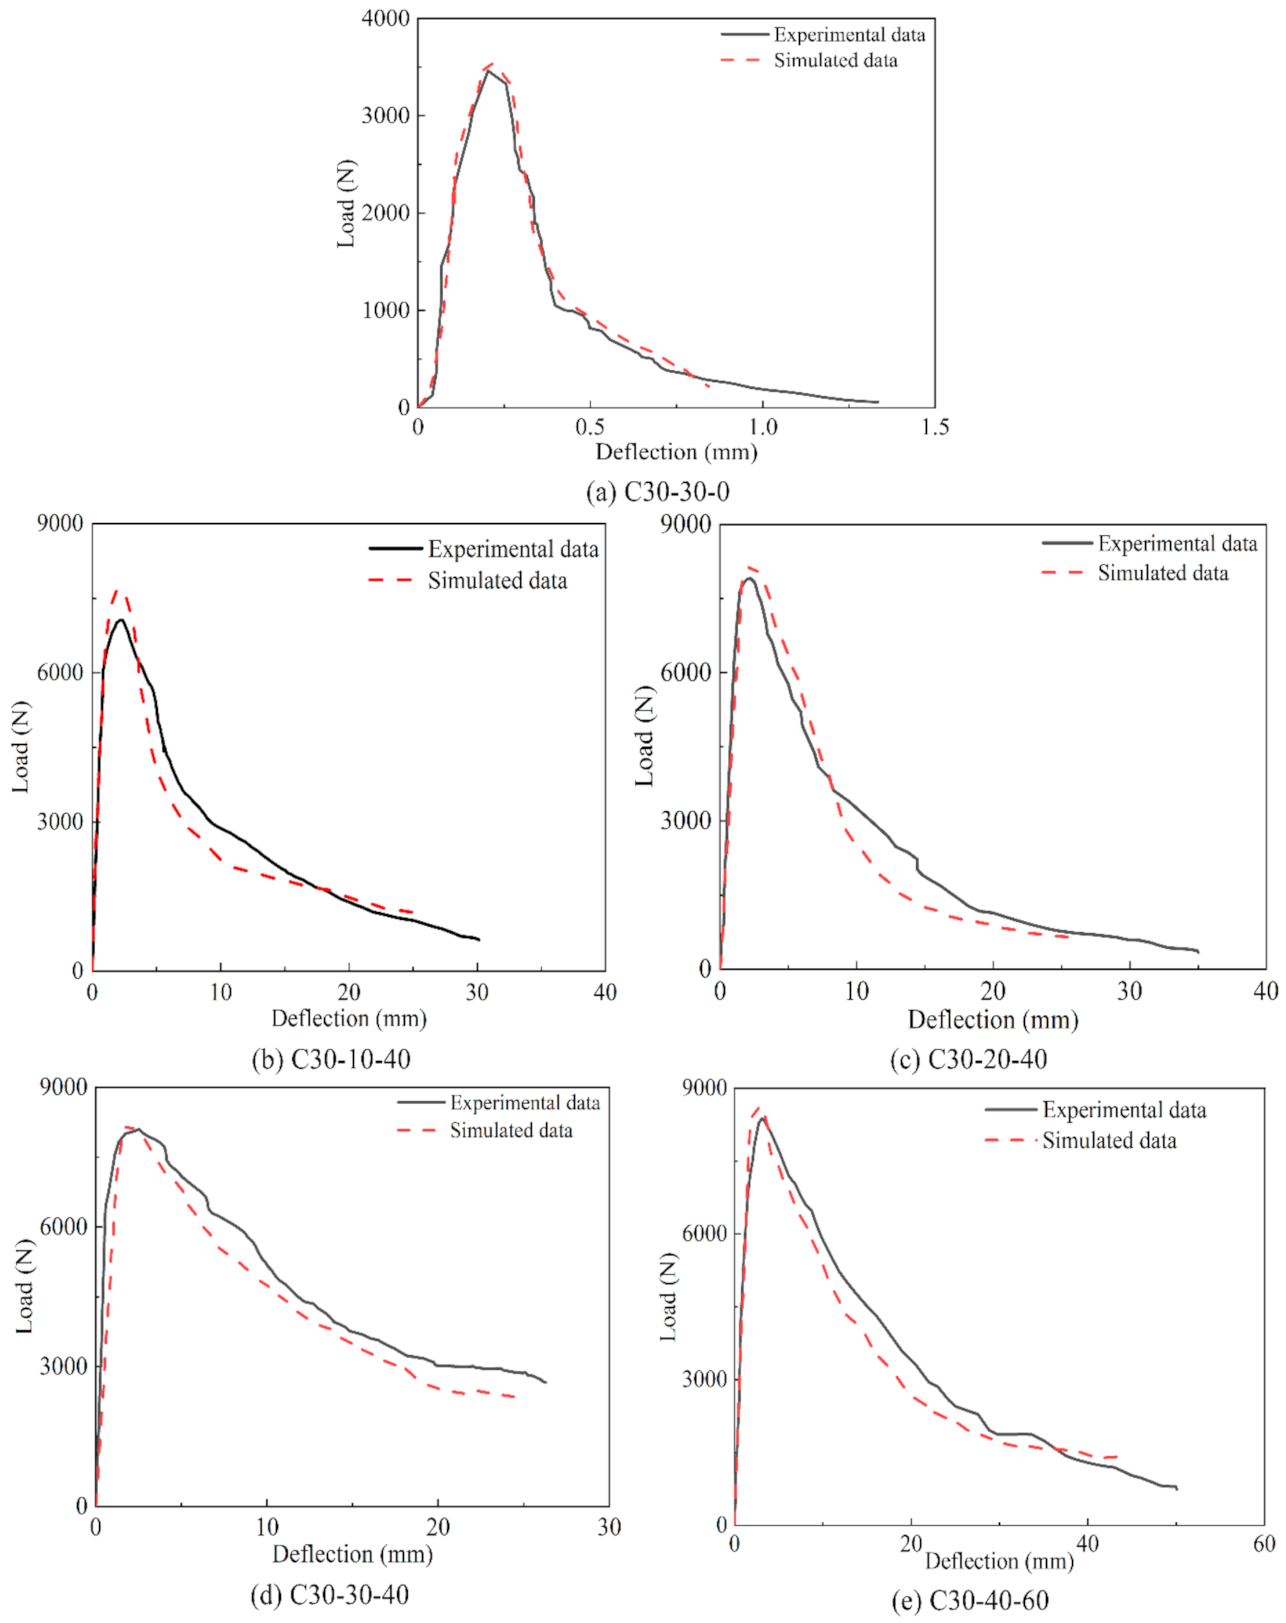
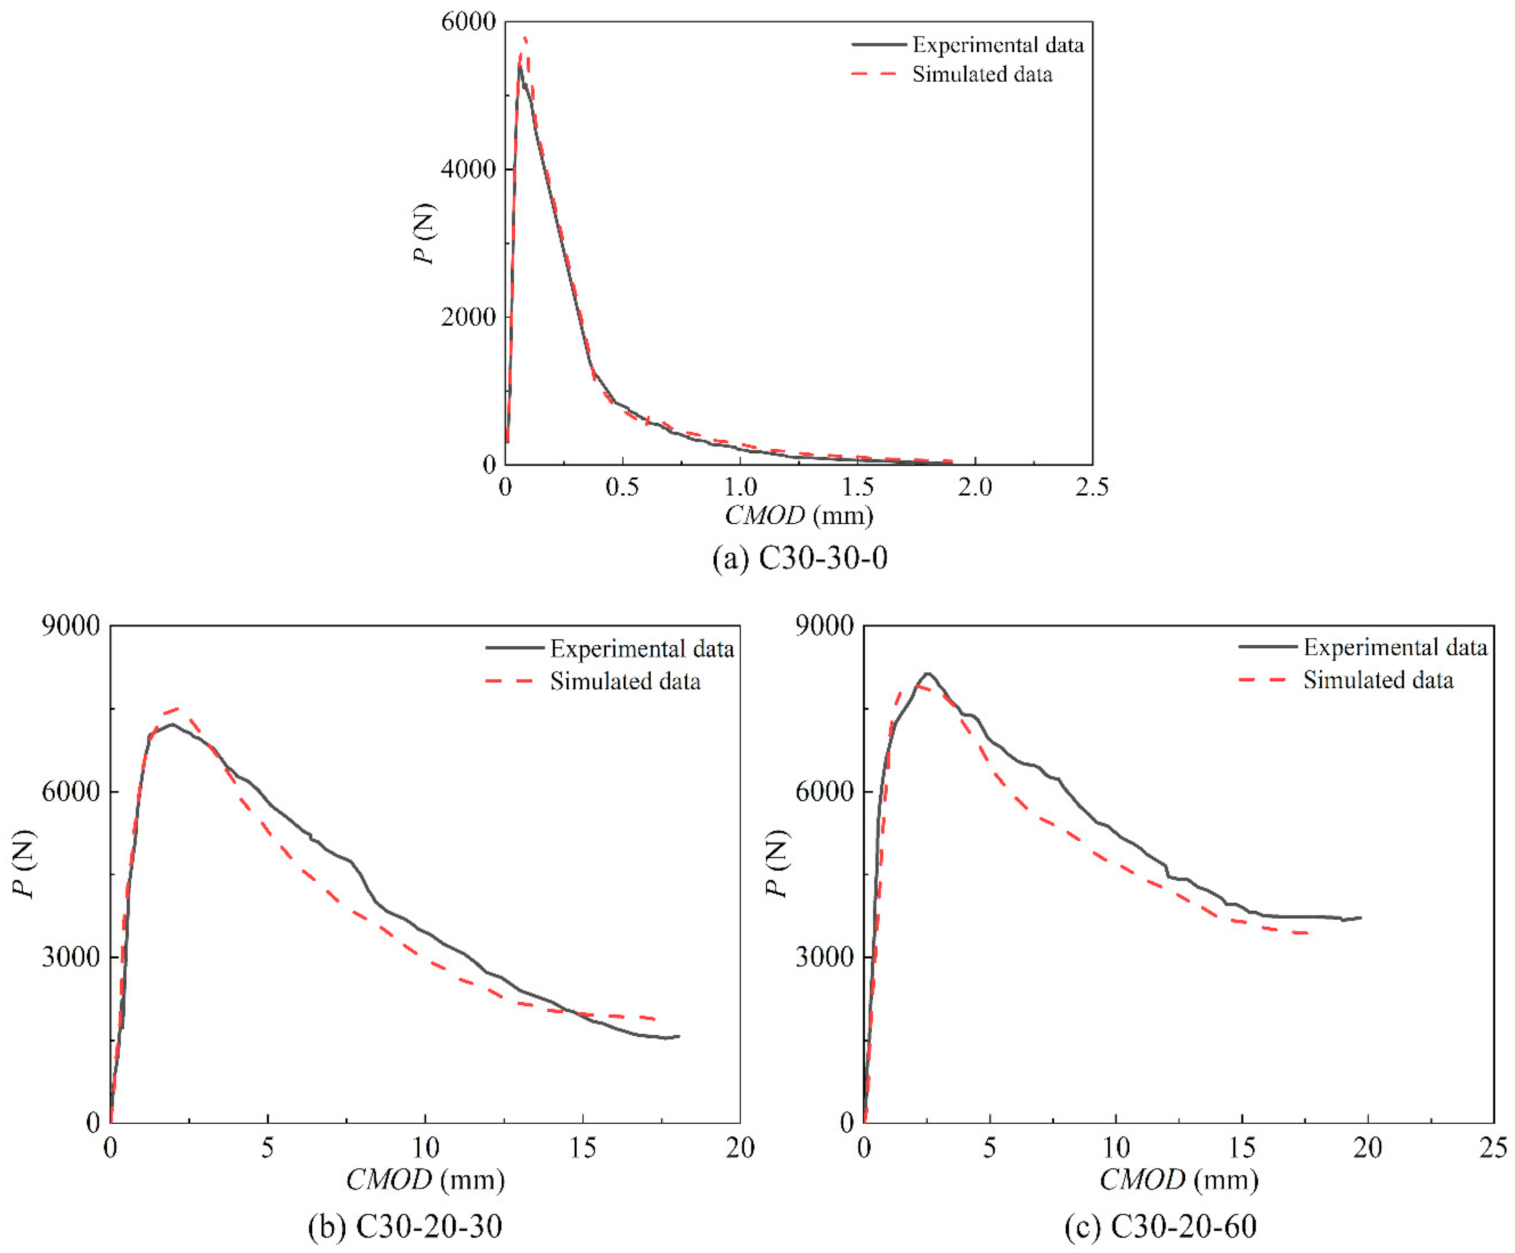
4.3.1. Fracture Curve Analysis

Based on the established numerical model, load-deflection curves and P-CMOD curves were plotted. The load-deflection curves and P-CMOD curves of control concrete and SFRC specimens under typical working conditions were selected and compared with macroscopic tests, as shown in Figure 10 and Figure 11. The specimen number C30-XX-ZZ, C30 indicates the strength grade of concrete, XX indicates the coarse aggregate maximum size (mm), and ZZ indicates the steel fiber length (mm).
Figure 10 shows the load-deflection curves of different SFRC. From Figure 10, the calculated data curves of the finite element model have the same development trend as the macroscopic experiment curves, and they are in good agreement.
Figure 11 shows the P-CMOD curves of different SFRC. It can be seen from Figure 11 that the calculated data curves of the finite element model are in good agreement with the macroscopic experiment curves.

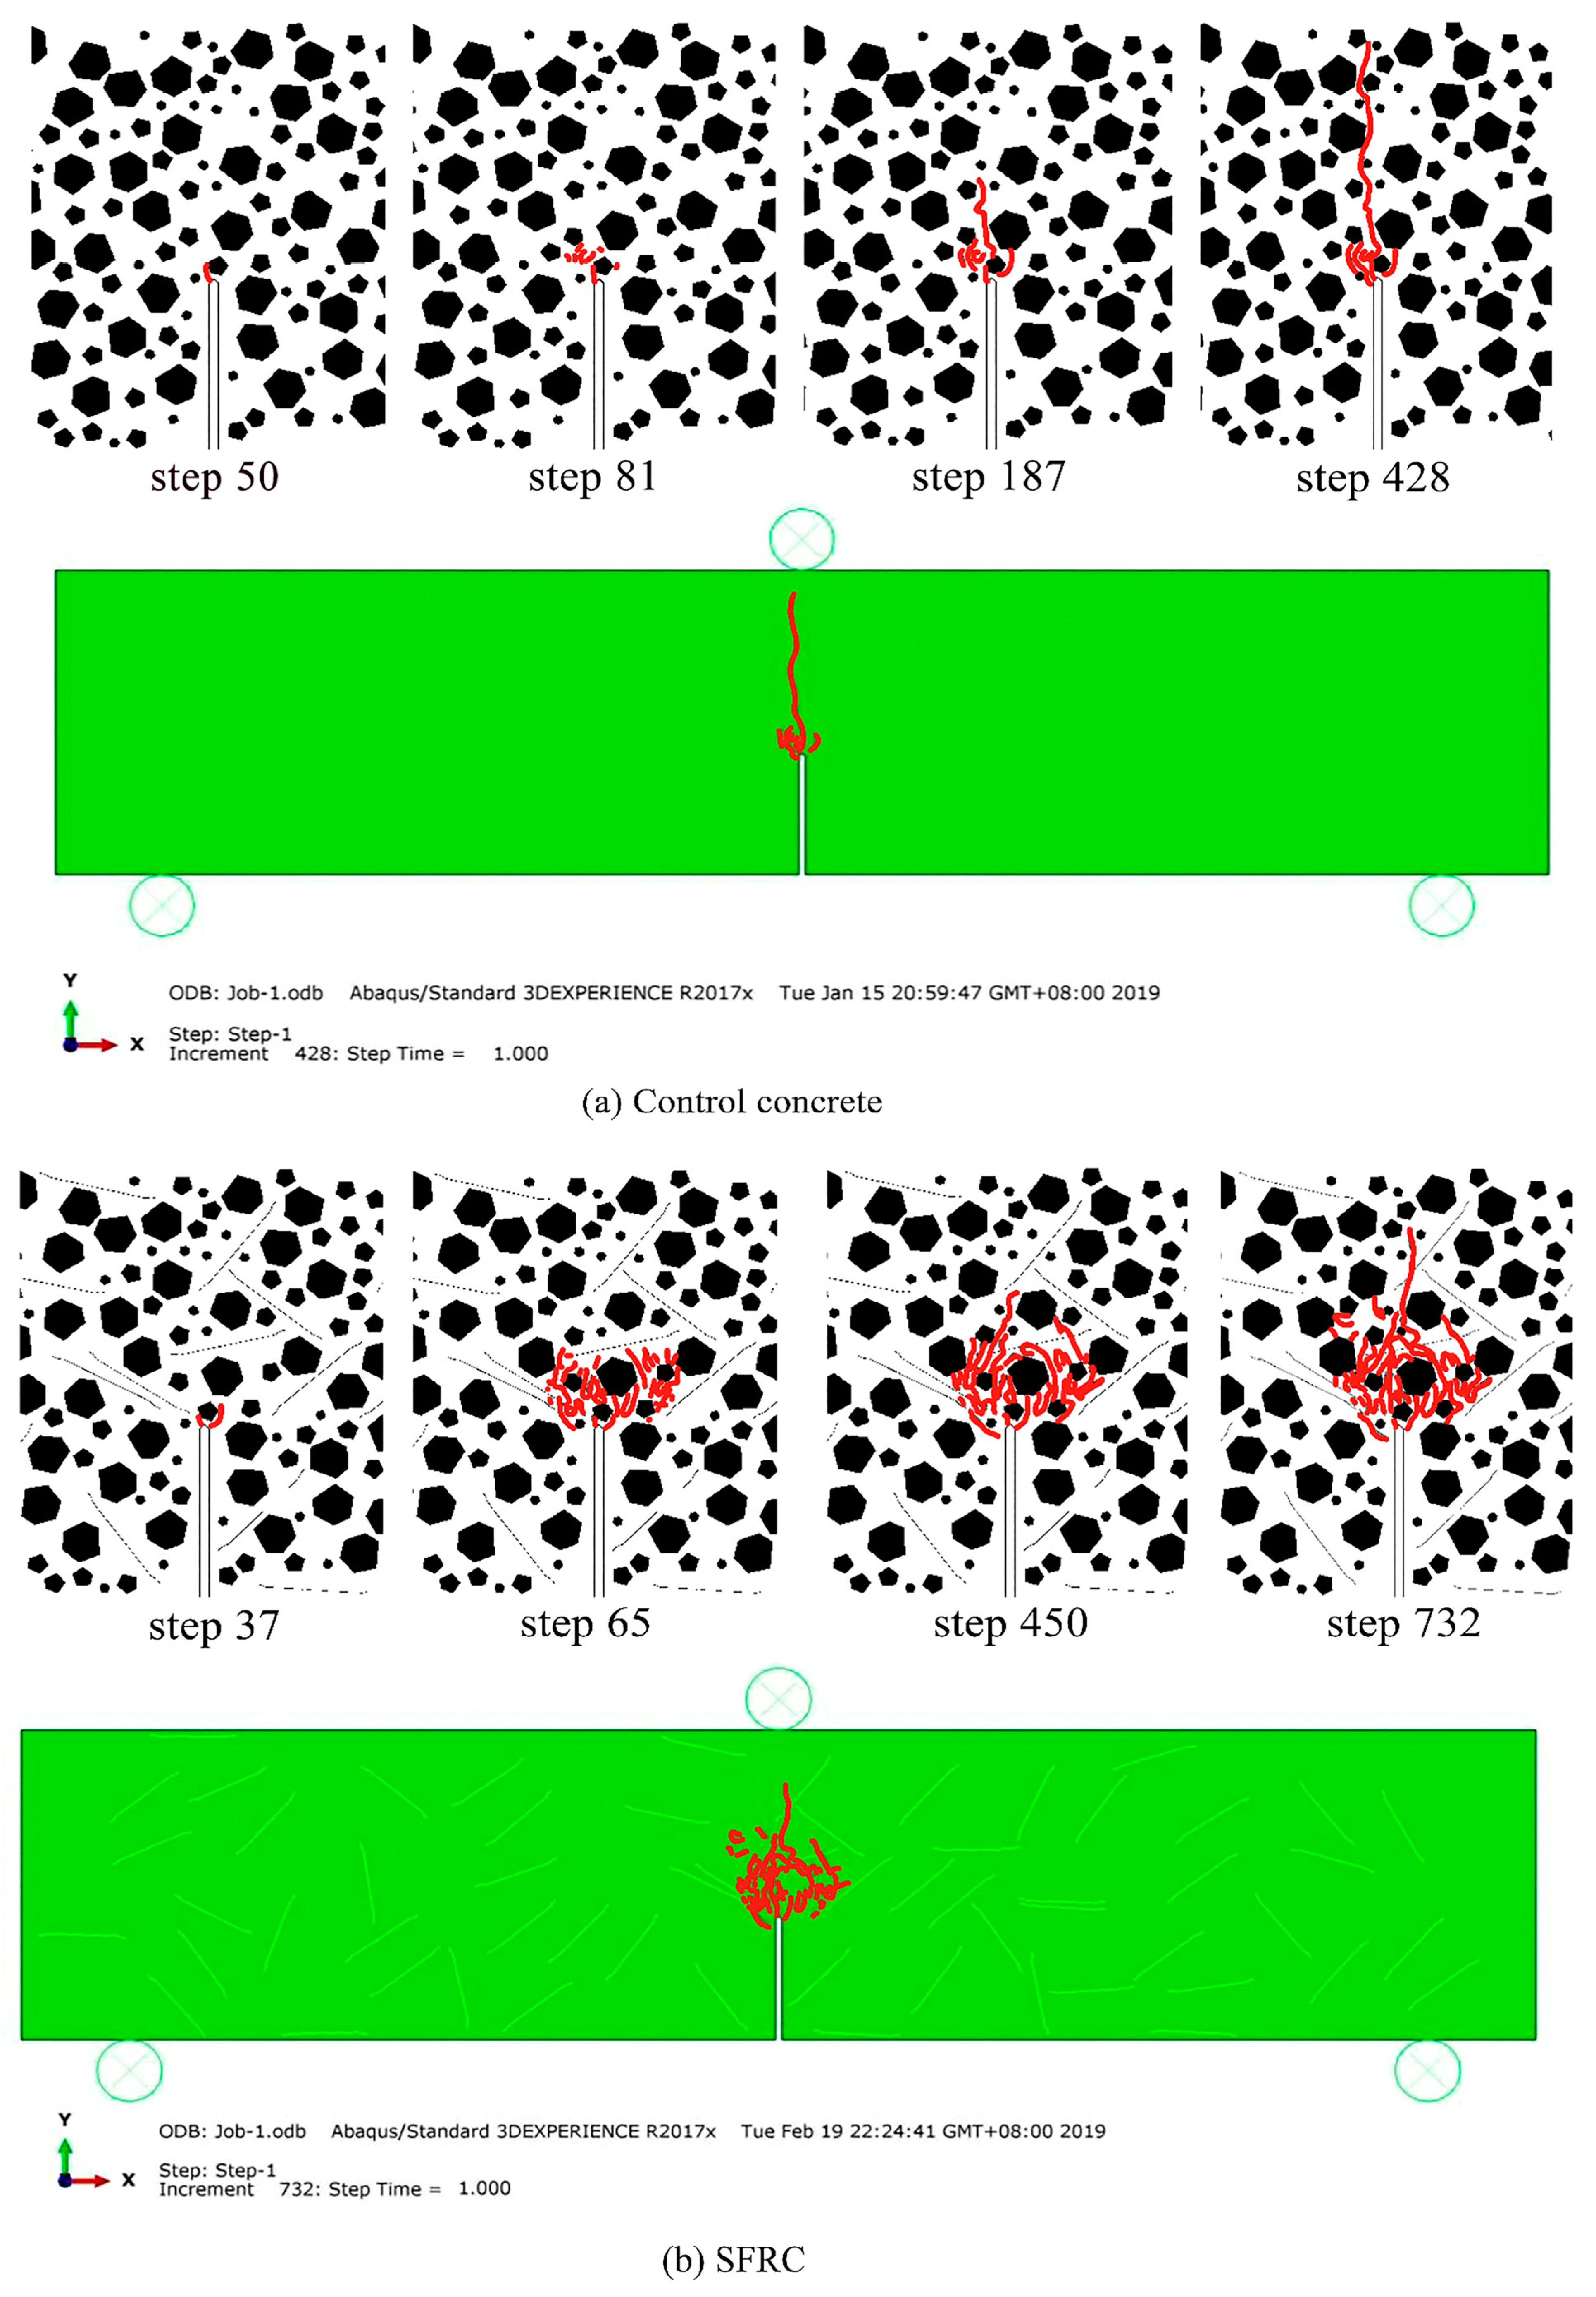
4.3.2. Crack Evolution Analysis

The crack evolution process of the numerical models of control concrete and SFRC during fracture is shown in Figure 12 and Figure 13. The black lines in the Figurehs indicate the crack expansion paths.
Figure 12 shows the crack evolution process of control concrete and SFRC. The red line is the crack expansion path. It can be seen from Figure 12 that the specimens did not show cracks at the beginning of loading of normal concrete. The stress concentration appeared at the tip of the predetermined cracks. With the increase in loading, microcracks started to increase, and damage started to occur at the weak points in the mortar. The cracks started to develop along the predetermined cracks. The internal microcracks continued to collect and expand and soon penetrated the concrete beam. At smaller deflections, the specimens have been damaged, and it shows brittle damage. SFRC produced microcracks under load, and the microcracks gradually expanded as the load increased. However, because the steel fiber can hinder the expansion of microcracks, the cracks are more curved in the process of expansion, and the number of microcracks is higher. In the macroscopic experiments, SFRC still has a strong load-bearing capacity after the formation of cracks, showing a certain ductility. Because as the load increases to the unstable load, the bond between the steel fiber and the concrete reaches its limit. The steel fiber begins to appear as the bending hook is straightened and the debonding is pulled out. However, in this process, the specimen still needs to absorb more energy, so the SFRC has the characteristics of cracking and continuous.
Figure 13 shows the macroscopic experimental damage diagrams of control concrete and SFRC. Comparing the crack evolution process in Figure 12, the final damage morphology of the control concrete model and SFRC model is similar to the damage morphology of the macroscopic experimental specimens.

4.3.3. Calculation Results of Fracture Energy and Analysis of Influencing Factors

The concrete fracture energy is the energy required to extend the crack per unit area.
Figure 14 shows the effect of steel fiber length and coarse aggregate maximum size on the Gf of SFRC. It can be seen from Figure 14 that the maximum Gf of SFRC increased by 2039% compared to the control concrete. The Gf increases with the increase in the length of steel fiber, and it increases with a coarse aggregate maximum size up to 30 mm and then decreases, but it is still larger than the concrete of 20 mm. Because of the bonding force between the steel fiber and the concrete matrix, the development of the cracks is hinder. The steel fibers need to absorb a lot of energy during the pull-out process. As the steel fiber length increases, the anchorage between the steel fiber and the concrete strengthens, and the friction increases. SFRC fracture process needs to absorb more energy, thus improving the Gf of SFRC. When the coarse aggregate maximum size increases, the crack development path is more tortuous. More energy needs to be consumed in this process, which is expressed as an increase in fracture energy. With the further increase in the coarse aggregate maximum size, the concrete is prone to segregation during the vibrating process. It makes the bond between the coarse aggregate and the cement paste matrix weaken, thus reducing Gf.
Figure 15 shows the effect of lf/Dmax on the Gf ratio (the ratio of the Gf of SFRC to the Gf of the control concrete) of SFRC. From Figure 15, it can be concluded that the Gf ratio increases with lf/Dmax up to 3 (lf = 60 mm, Dmax = 20 mm) and then decreases for the concrete with Dmax of 10 mm and 20 mm, the maximum increase is 67%. It is obvious that the reinforcement effect of steel fiber on Gf of concrete is considerable with the lf/Dmax in the range of 2.5–4. The Gf ratio increases with lf/Dmax up to 2 (lf = 60 mm, Dmax = 30 mm) and then decreases for the concrete with Dmax of 30 mm and 40 mm; the maximum increase is 82%. It is obvious that the reinforcement effect of steel fiber on the Gf of concrete is considerable with the lf/Dmax in the range of 1.5–2.33. When the lf/Dmax is the same, the reinforcement effect of steel fibers increases with the increase in the lf and Dmax. Because it depends on the bonding force between steel fiber and concrete, when the length of steel fibers increases, the bond strength between steel fibers and concrete increases. Because the steel fibers are pulled out from the concrete or pulled off when the specimen is damaged, more energy is required to be consumed.
Figure 16 shows the effect of volume fraction on the Gf and Gf ratio of SFRC. It can be seen from Figure 16 that when the coarse aggregate maximum size is 40 mm and the steel fiber length is 60 mm, the Gf and Gf ratio of SFRC increases first and then decreases with the increase in steel fiber volume fraction. It can be seen from Figure 16 that the maximum Gf of SFRC increased by 2242%, and the maximum Gf ratio of SFRC increased by 49% compared to the control concrete, reaching the maximum at the volume fraction of 1.5% of steel fiber. Because with the increase in steel fiber volume fraction, the bridging role played by steel fibers in concrete is enhanced. It makes the crack development needs to absorb more energy, and the Gf of SFRC increases. However, when the volume fraction of steel fibers is larger, steel fibers are prone to agglomeration, and the Gf of SFRC decreases.

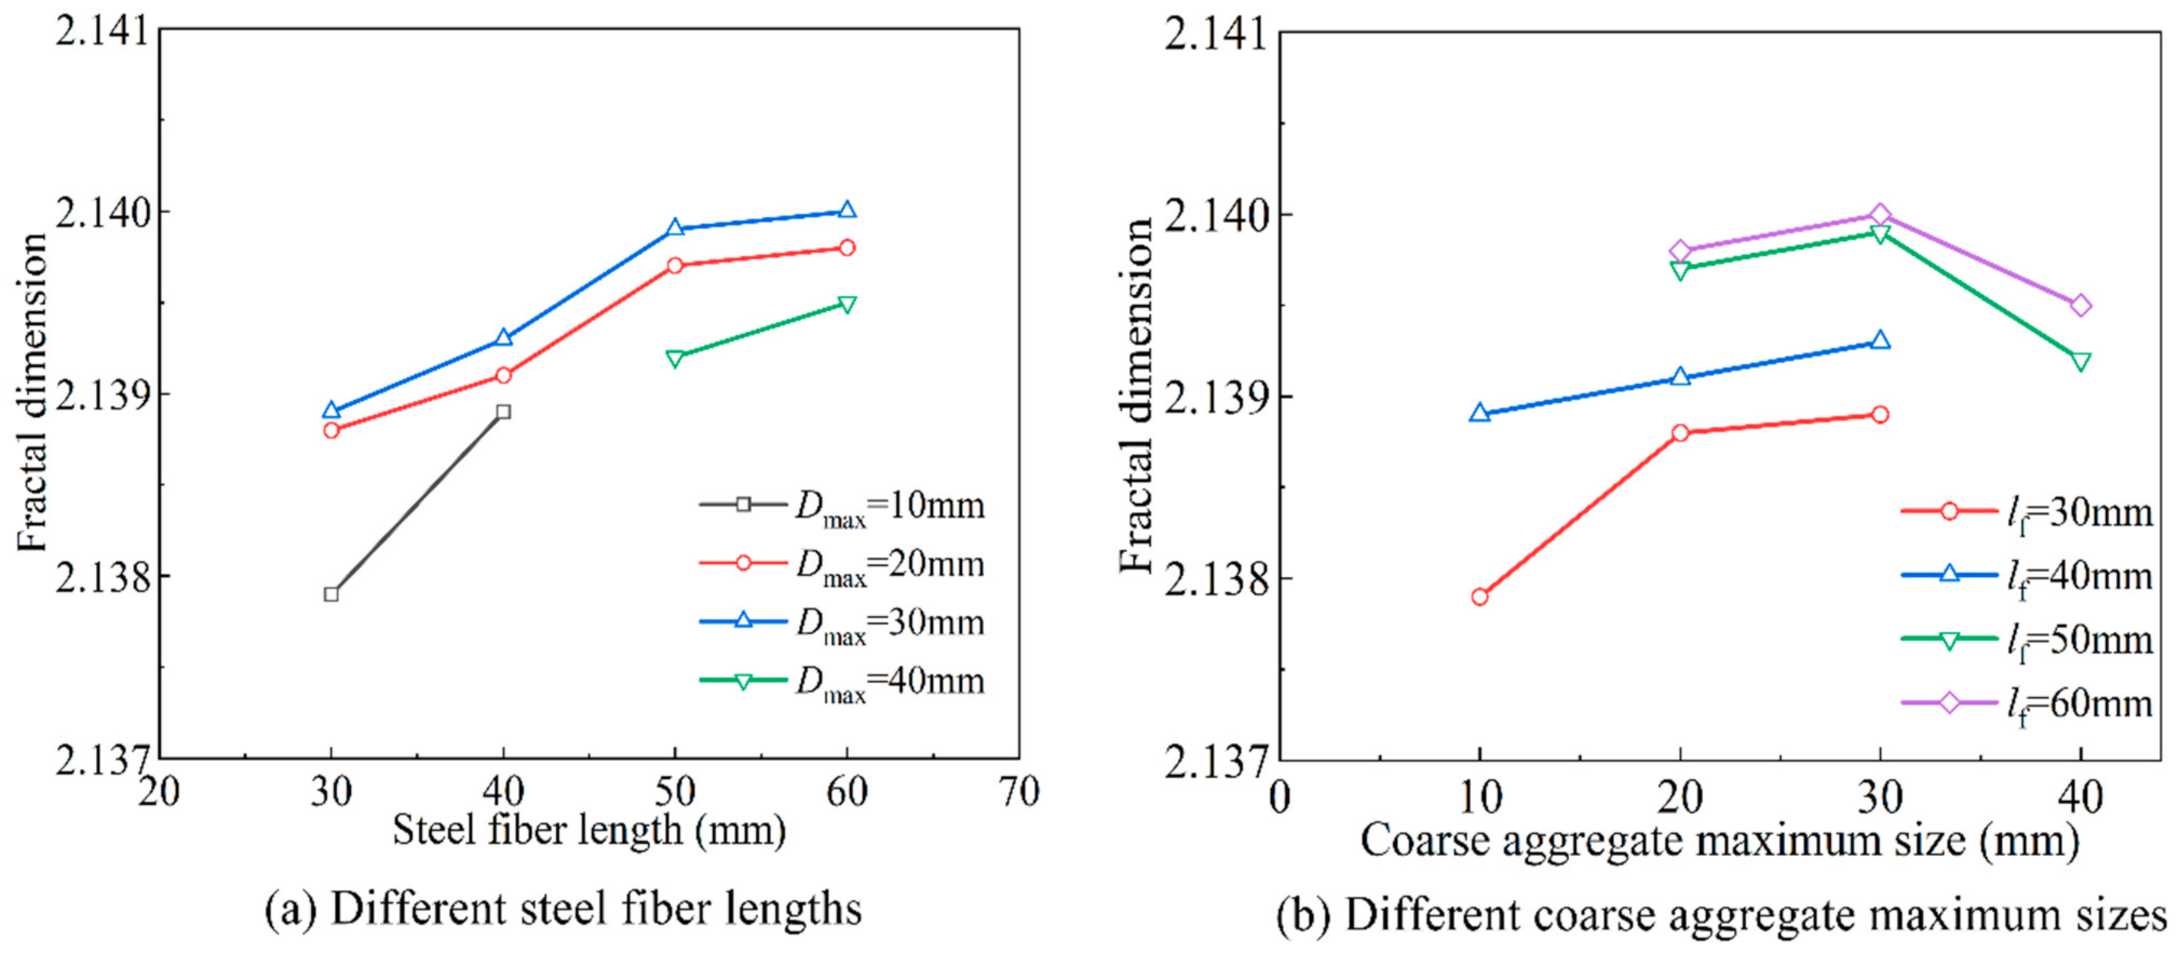
5. Fractal Dimension of Concrete Fracture Surface

The fracture surface of SFRC is a complex and irregular geometric surface, and its roughness can reflect the magnitude of the Gf of SFRC to some extent [59,60]. According to the fractal theory, the fractal dimension D was calculated by the box dimension method. It can quantitatively describe the relationship between the roughness of the fracture surface, the length of steel fibers and the coarse aggregates’ maximum size. The roughness of the fracture surface and Gf increase as the fractal dimension increases. The D can be determined through:
D = log ( N i + 1 / N i ) log ( L i + 1 / L i )
where Ni is the total number of boxes required for the i-th overlay, and Li is the length of the side of the box used for the i-th overlay.
Figure 17 shows the effect of steel fiber length and coarse aggregate maximum size on the fractal dimension of SFRC. From Figure 17, it can be concluded that the fractal dimension of SFRC is more consistent with the trend of the Gf. The microcracks in SFRC start to expand under the action of external forces, but the steel fibers inhibit their expansion path. It makes the SFRC section exhibit a more complex section morphology and increases the roughness and fractal dimension of the section, which improves the Gf of SFRC.

6. Conclusions

The effects of steel fiber length (lf = 30 mm, 40 mm, 50 mm and 60 mm) and coarse aggregate maximum size (Dmax = 10 mm, 20 mm, 30 mm and 40 mm) on fractural properties of SFRC was investigated. The following conclusions were obtained.
  • The fracture toughness of concrete can be improved by incorporating steel fibers, and it increases as steel fiber length increases. The fracture toughness of the control concrete reaches the maximum when the coarse aggregate maximum size is 30 mm.
  • The interfacial transition zone has a loose structure and high porosity. The steel fiber–mortar interface is better compacted than the aggregate–mortar interface. The thickness of the aggregate–mortar interfacial transition zone increases as coarse aggregate maximum size increases, while the thickness of the steel fiber–mortar interfacial transition zone decreases with the increase in the steel fiber length.
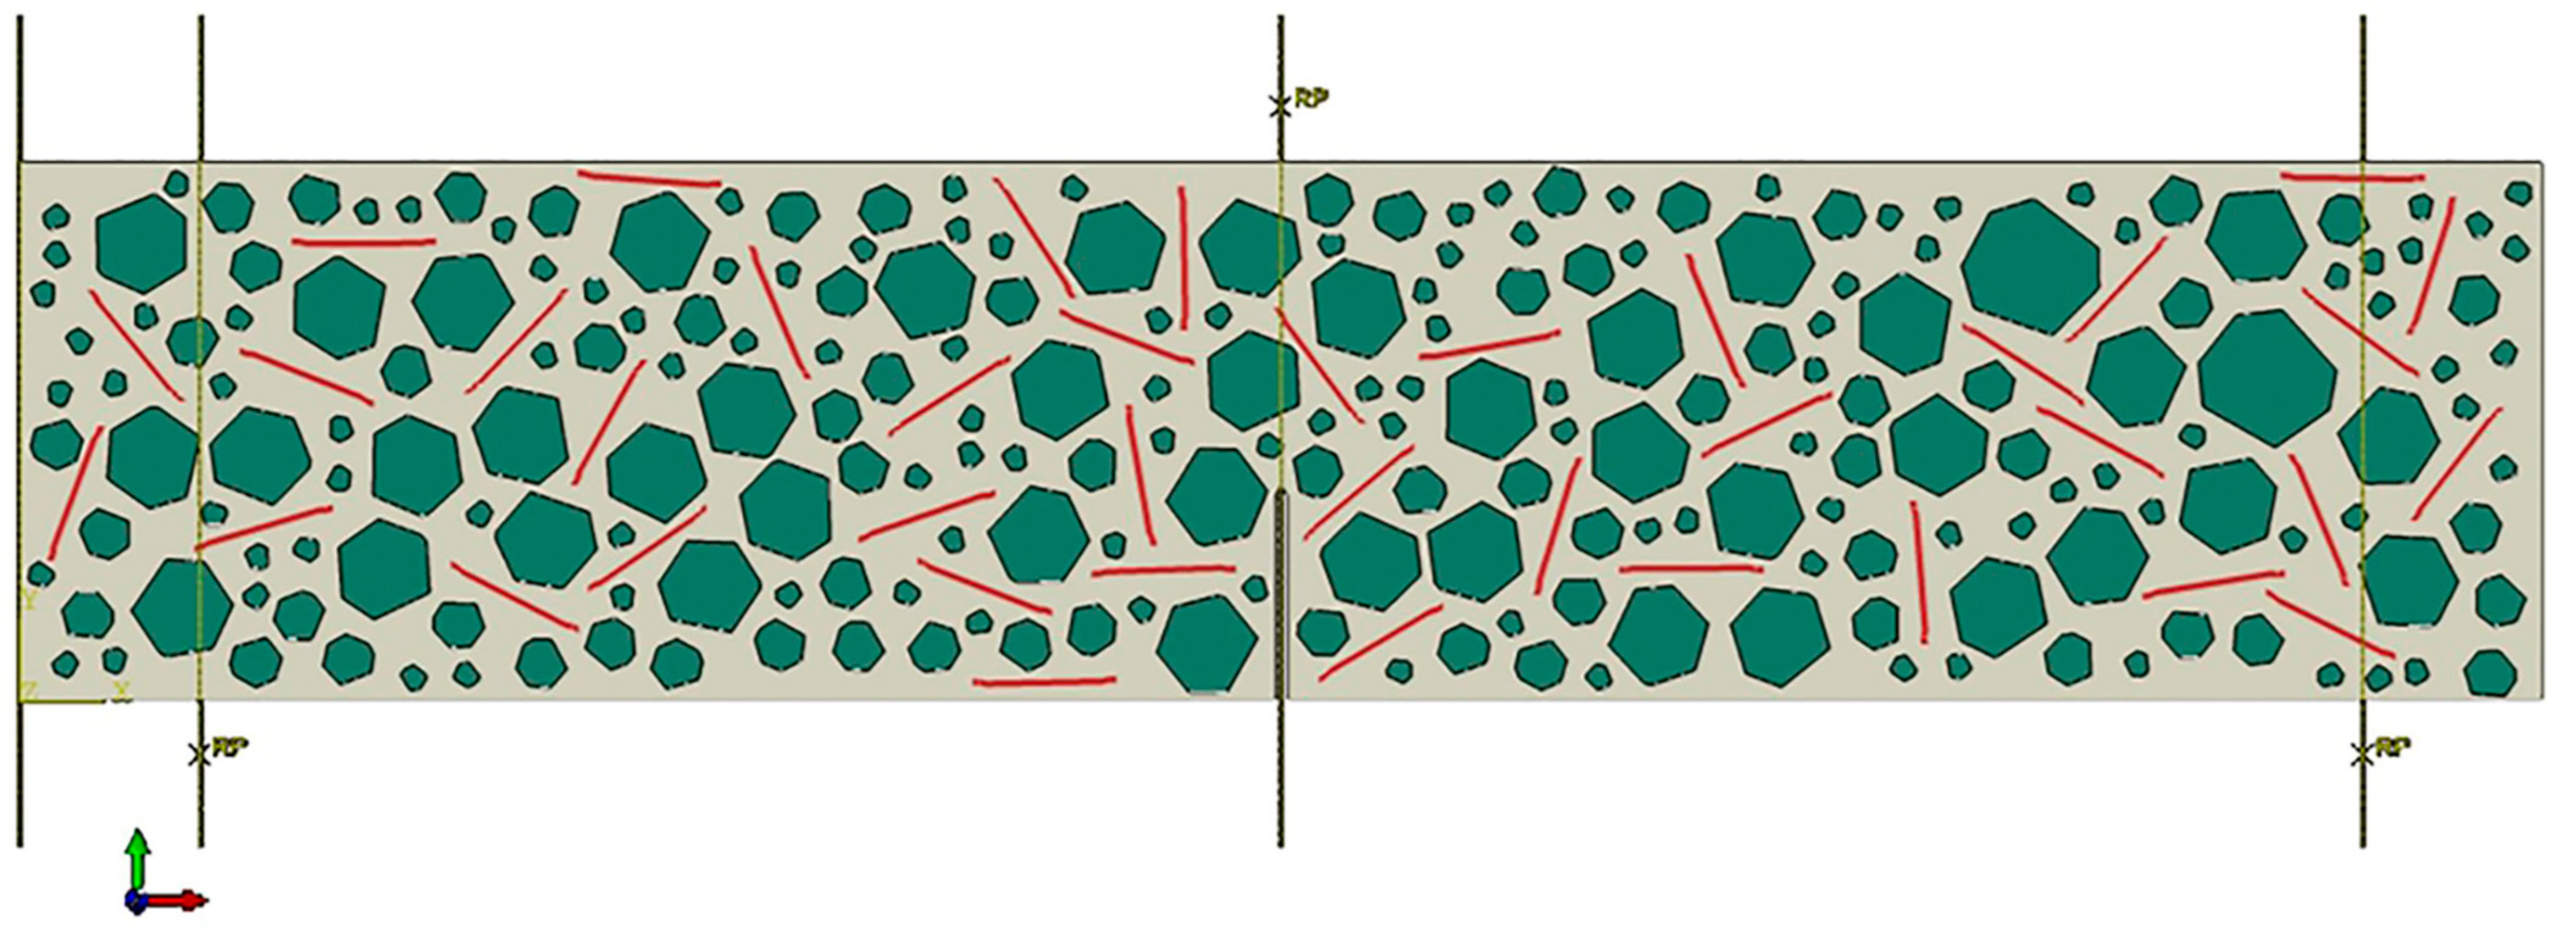
  • Consider SFRC as a five-phase composite consisting of coarse aggregate, mortar, steel fiber, aggregate–mortar interface and steel fiber–mortar interface. The Monte Carlo method was used to generate random numbers for the simulation to achieve the random distribution of the aggregate position and the steel fiber position, and a two-dimensional fine-scale numerical model of steel fiber concrete was established.
  • The load-deflection curves and P-COMD curves of the simulated specimens are in good agreement with the macroscopic experimental. The analysis using a finite element program can reproduce the crack evolution behavior of SFRC during the fracture process.
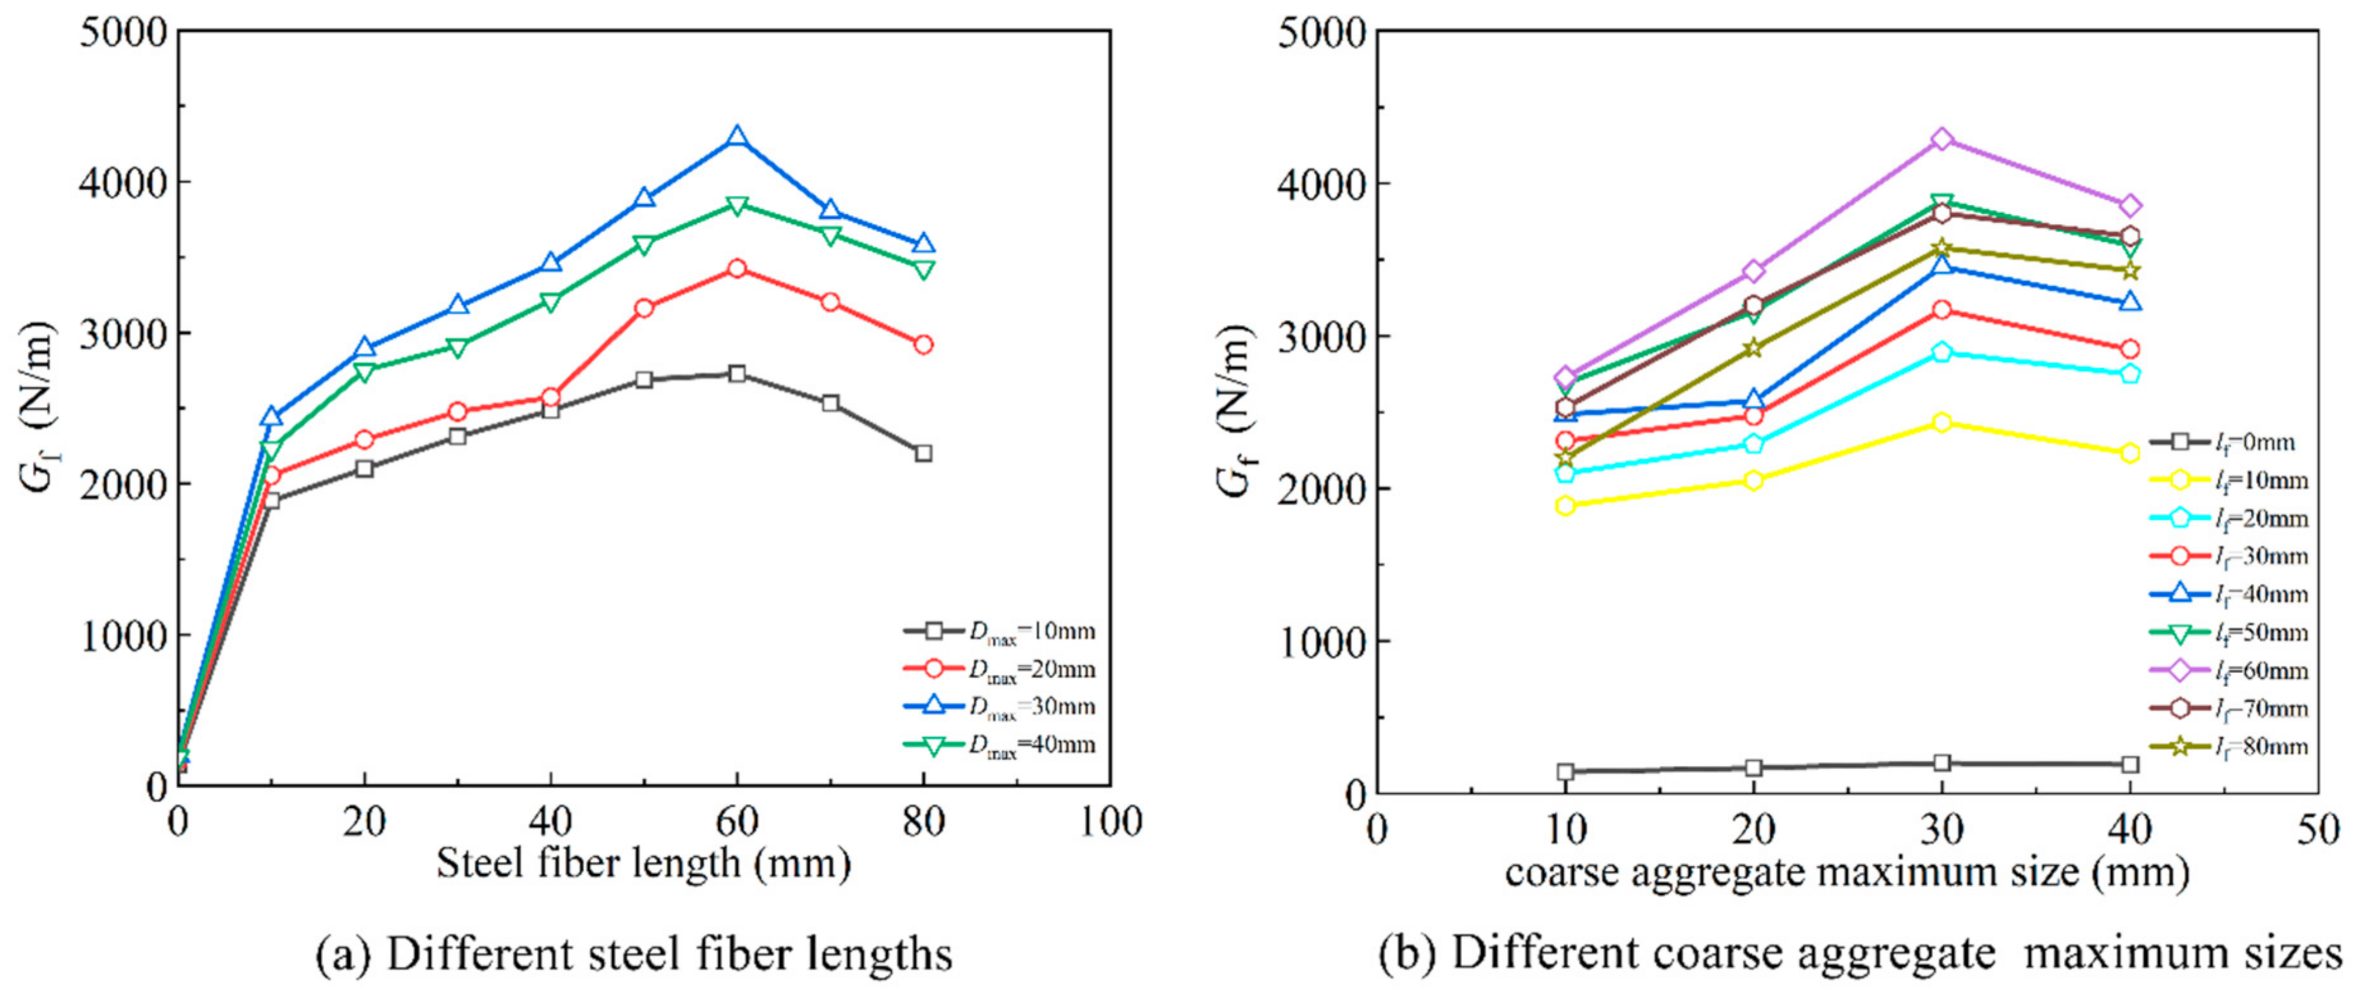
  • Combining the simulation results with the macroscopic experiment results, the Gf of SFRC increases with the coarse aggregate maximum size up to 30 mm and then decreases, but it is still larger than the concrete of 20 mm. Similarly, they increase with steel fiber length up to 60 mm and then decrease, but it is still larger than the control concrete. The maximum Gf of SFRC increased by 2039% compared with the control concrete.
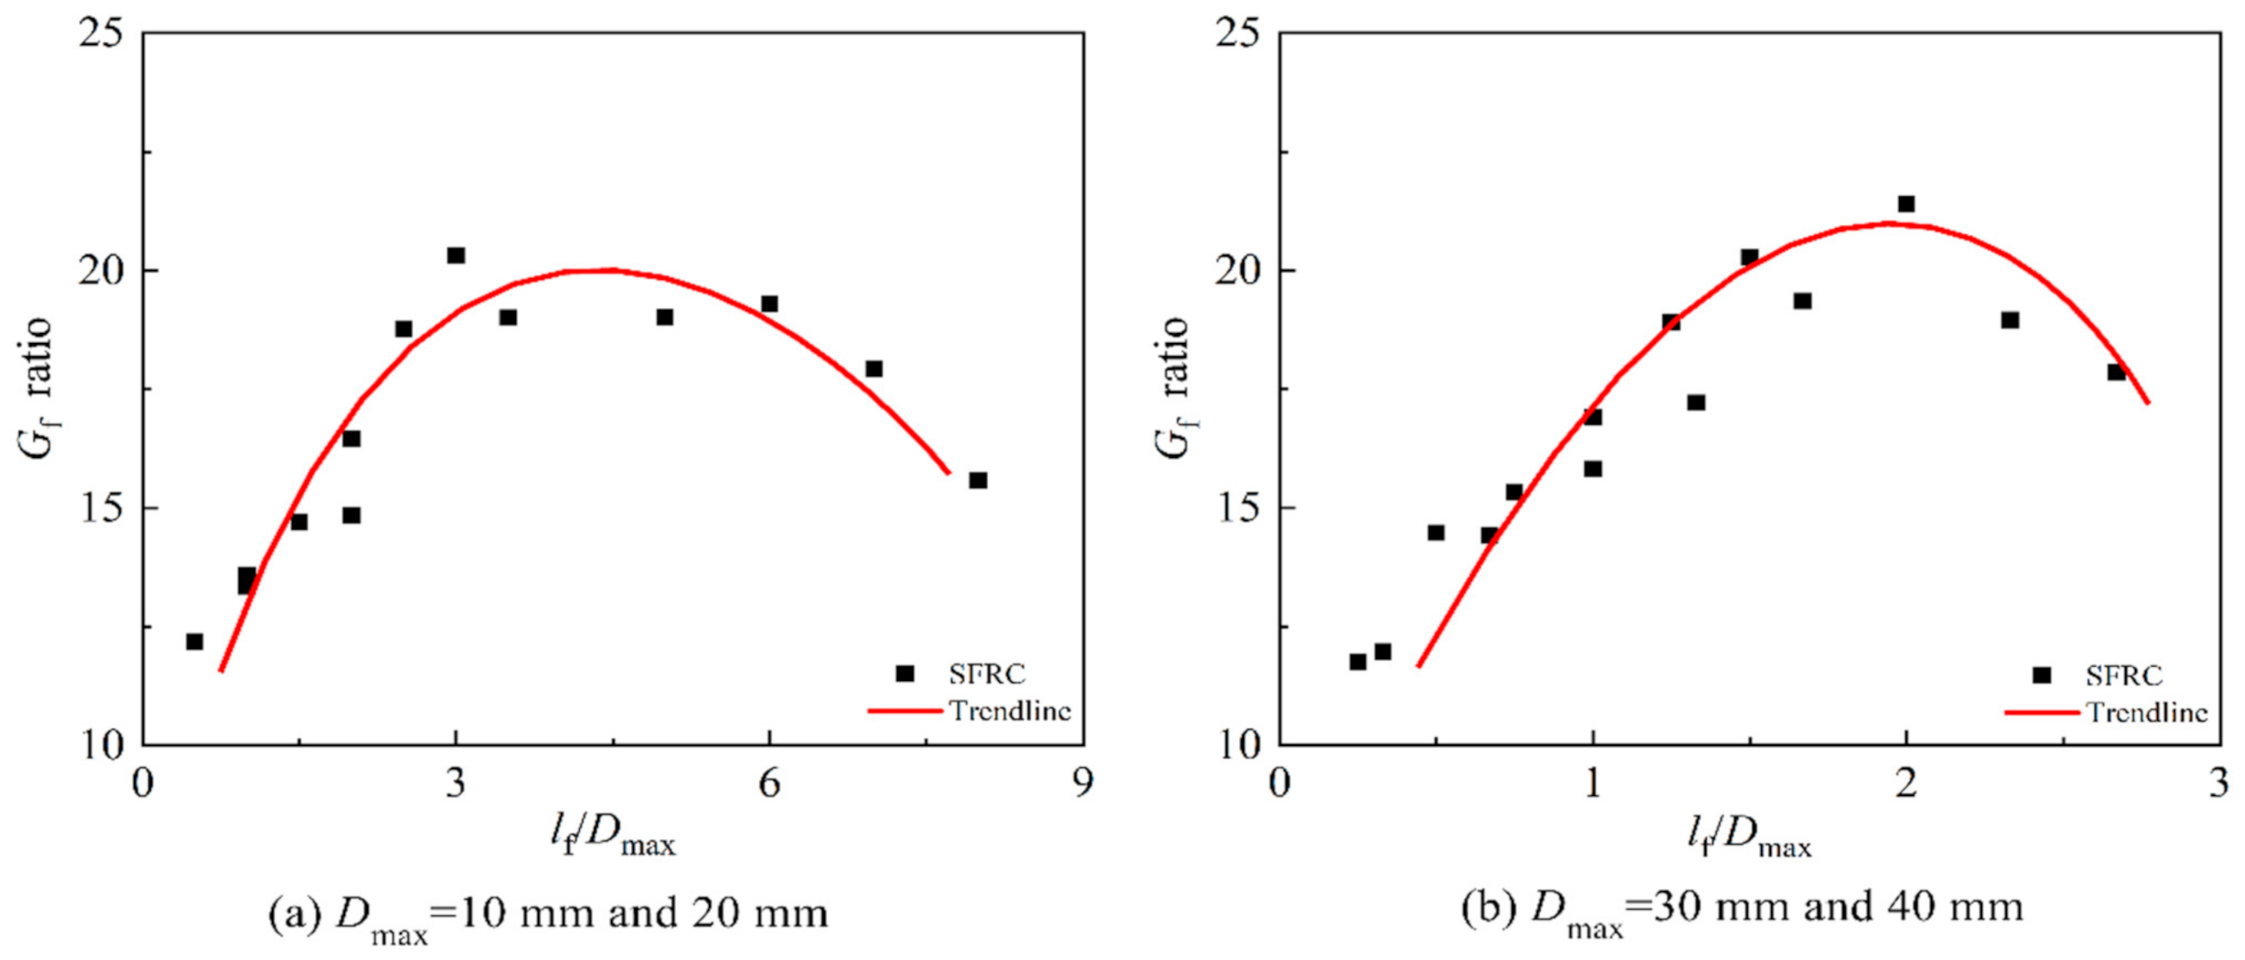
  • For the concrete with Dmax of 10 mm and 20 mm, the reinforcing effect of steel fiber on the Gf is considerable with the lf/Dmax in the range from 2.5 to 4. The Gf ratio increases with lf/Dmax up to 3(lf = 60 mm, Dmax = 20 mm) and then decreases, and the maximum increase is 67%. Similarly, for the concrete with Dmax of 30 mm and 40 mm, the reinforcing effect of steel fiber on the Gf is considerable with the lf/Dmax in the range from 1.5 to 2.33. The Gf ratio increases with lf/Dmax up to 2(lf = 60 mm, Dmax = 30 mm) and then decreases, and the maximum increase is 82%.
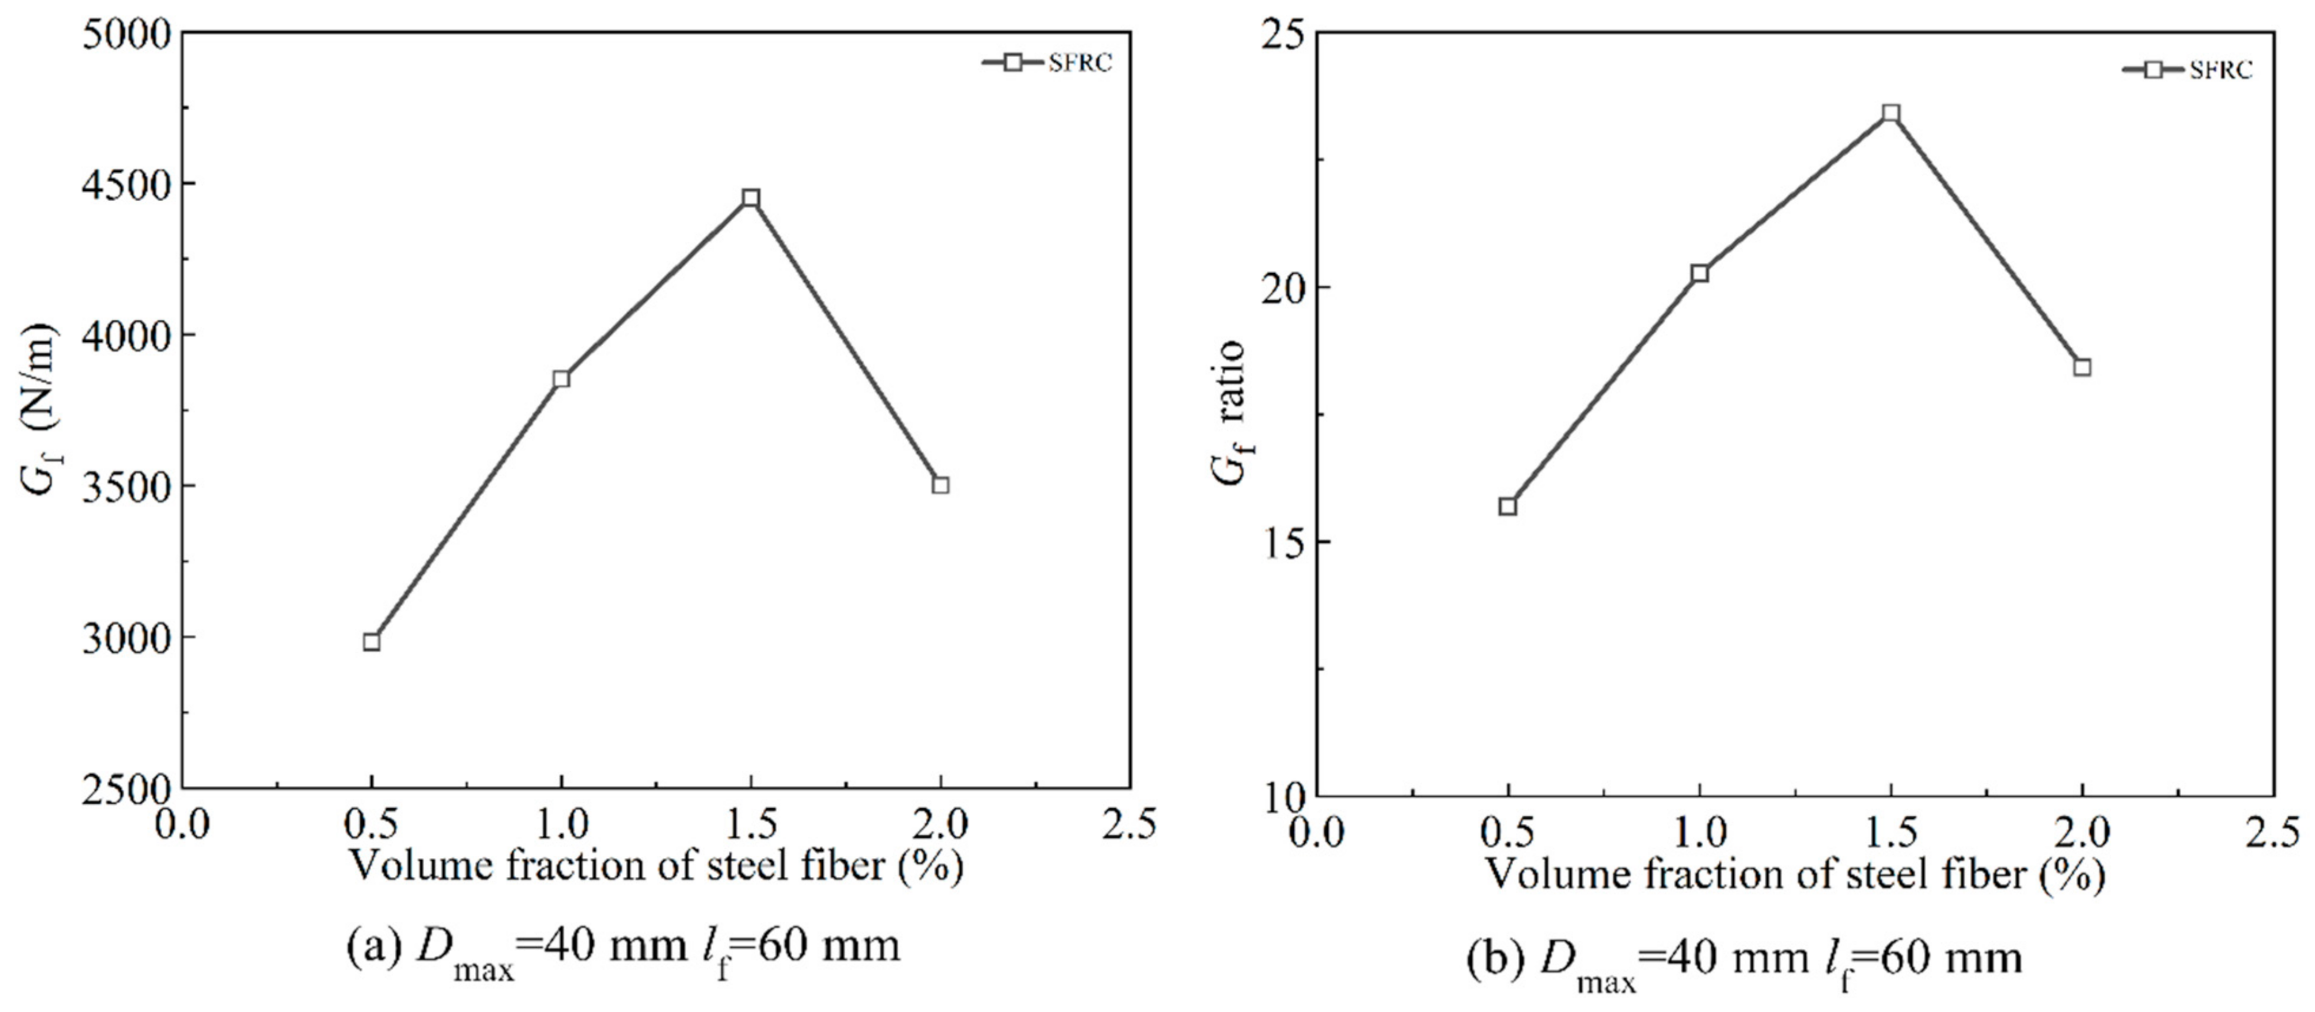
  • The reinforcing effect of all factors on the Gf is considerable with the Dmax of 40 mm, lf of 60 mm and steel fiber volume fraction of 1.5%. It is suggested that SFRC design can be carried out according to this matching method to meet the actual engineering requirements.

Author Contributions

Writing—review & editing, J.H.; Writing—original draft, D.H.; Conceptualization, J.C. and X.L. All authors have read and agreed to the published version of the manuscript.

Funding

This research was funded by the National Natural Science Foundation of China (Grant No. 51679221, 51879244), Project for Famous Teacher Support Plan in Central Plains (2018) and Pro-gram for Innovative Research Team (in Science and Technology) in the University of Henan Province of China (Grant No. 20IRTSTHN009).

Institutional Review Board Statement

Not applicable.

Informed Consent Statement

Not applicable.

Data Availability Statement

The author confirms that the data supporting the findings of this study are available within the article.

Conflicts of Interest

The authors declare no conflict of interest.

Nomenclature

SFRCsteel fiber reinforced concrete mthe mass between specimen supports
lf steel fiber length VCthe critical crack-mouth opening displacement
Dmax coarse aggregate maximum size ac the effective crack length
Gf fracture energy K Ic ini the initial fracture toughness
a0 the initial crack notch height of the specimen Ethe modulus of elasticity of concrete.
h the height of specimen h0the thickness of the thin steel plate of clip type extensometer
b the thickness of specimen K Ic un unstable fracture toughness
S the span between the two supports of the specimen ft the tensile strength of the material
l The length of specimen W opening displacement
P the total load applied by the specimen Ws ultimate opening displacement
CMOD the crack mouth opening displacement σ max the maximum principal stress
Pmax the maximum load σ max 0 the allowable stress
Finithe initial cracking loadsD fractal dimension
Funthe unstable loadsNi the total number of boxes required for the i-th overlay
a1the initial crack-mouth opening displacementLi the length of the side of the box used for the i-th overlay
SFRC steel fiber reinforced concrete mthe mass between specimen supports
lf steel fiber length VCthe critical crack-mouth opening displacement
Dmax coarse aggregate maximum size ac the effective crack length
Gf fracture energy K Ic ini the initial fracture toughness
a0 the initial crack notch height of the specimen Ethe modulus of elasticity of concrete.
h the height of specimen h0the thickness of the thin steel plate of clip type extensometer
b the thickness of specimen K Ic un unstable fracture toughness
S the span between the two supports of the specimen ft the tensile strength of the material
l The length of specimen W opening displacement
P the total load applied by the specimen Ws ultimate opening displacement
CMOD the crack mouth opening displacement σ max the maximum principal stress
Pmax the maximum load σ max 0 the allowable stress
Finithe initial cracking loadsD fractal dimension
Funthe unstable loadsNi the total number of boxes required for the i-th overlay
a1the initial crack-mouth opening displacementLi the length of the side of the box used for the i-th overlay

References

  1. Yoo, D.; Yoon, Y.; Banthia, N. Flexural response of steel-fiber-reinforced concrete beams: Effects of strength, fiber content, and strain-rate. Cem. Concr. Compos. 2015, 64, 84–92. [Google Scholar] [CrossRef]
  2. Tiberti, G.; Minelli, F.; Plizzari, G.; Vecchio, F.J. Influence of concrete strength on crack development in SFRC members. Cem. Concr. Compos. 2014, 45, 176–185. [Google Scholar] [CrossRef]
  3. Chalioris, C.E.; Karayannis, C.G. Effectiveness of the use of steel fibers on the torsional behavior of flanged concrete beams. Cem. Concr. Compos. 2009, 31, 331–341. [Google Scholar] [CrossRef]
  4. Carneiro, J.A.; Lima, P.; Leite, M.; Filho, R.T. Compressive stress–strain behavior of steel fiber reinforced-recycled aggregate concrete. Cem. Concr. Compos. 2014, 46, 65–72. [Google Scholar] [CrossRef]
  5. Han, J.; Zhao, M.; Chen, J.; Lan, X. Effects of steel fiber length and coarse aggregate maximum size on mechanical properties of steel fiber reinforced concrete. Constr. Build. Mater. 2019, 209, 577–591. [Google Scholar] [CrossRef]
  6. Yazıcı, Ş.; İnan, G.; Tabak, V. Effect of aspect ratio and volume fraction of steel fiber on the mechanical properties of SFRC. Constr. Build. Mater. 2007, 21, 1250–1253. [Google Scholar] [CrossRef]
  7. Wang, H.T.; Wang, L.C. Experimental study on static and dynamic mechanical properties of steel fiber reinforced lightweight aggregate concrete. Constr. Build. Mater. 2013, 38, 1146–1151. [Google Scholar] [CrossRef]
  8. Khaloo, A.; Raisi, E.M.; Hosseini, P.; Tahsiri, H. Mechanical performance of self-compacting concrete reinforced with steel fibers. Constr. Build. Mater. 2014, 51, 179–186. [Google Scholar] [CrossRef]
  9. Iqbal, S.; Ali, A.; Holschemacher, K.; Bier, T.A. Mechanical properties of steel fiber reinforced high strength lightweight self-compacting concrete (SHLSCC). Constr. Build. Mater. 2015, 98, 325–333. [Google Scholar] [CrossRef]
  10. Holschemacher, K.; Mueller, T.; Ribakov, Y. Effect of steel fibers on mechanical properties of high-strength concrete. Mater. Des. 2010, 31, 2604–2615. [Google Scholar] [CrossRef]
  11. Soutsos, M.N.; Le, T.T.; Lampropoulos, A.P. Flexural performance of fiber reinforced concrete made with steel and synthetic fibers. Constr. Build. Mater. 2012, 36, 704–710. [Google Scholar] [CrossRef]
  12. Siddique, R.; Kaur, G.; Kunal. Strength and permeation properties of self-compacting concrete containing fly ash and hooked steel fibers. Constr. Build. Mater. 2016, 103, 15–22. [Google Scholar] [CrossRef]
  13. Pająk, M.; Ponikiewski, T. Flexural behavior of self-compacting concrete reinforced with different types of steel fibers. Constr. Build. Mater. 2013, 47, 397–408. [Google Scholar] [CrossRef]
  14. Jang, S.J.; Yun, Y.J.; Yun, H.D. Influence of Fiber Volume Fraction and Aggregate Size on Flexural Behavior of High Strength Steel Fiber-Reinforced Concrete. Appl. Mech. Mater. 2013, 372, 223–226. [Google Scholar] [CrossRef]
  15. Grünewald, S.; Walraven, J.C. Parameter-study on the influence of steel fibers and coarse aggregate content on the fresh properties of self-compacting concrete. Cem. Concr. Res. 2001, 31, 1793–1798. [Google Scholar] [CrossRef]
  16. Huang, C.; Zhao, G.; Peng, J. The fatigue performance of steel fiber reinforced concrete with two gradings of aggregates. China J. Highw. Transp. 1994, 3, 29–35. (In Chinese) [Google Scholar]
  17. He, J.; He, Z.; Fu, J.; Luo, X. Study of Steel-fiber Reinforced Concrete with Two Gradings of Aggregate. J. Build. Mater. 2004, 4, 425–431. (In Chinese) [Google Scholar]
  18. Shi, G.; Han, J.; Zhang, L. Fracture performance of steel fiber reinforced concrete with big aggregate. Concrete 2006, 2, 70–71, 87. (In Chinese) [Google Scholar]
  19. Ghasemi, M.; Ghasemi, M.R.; Mousavi, S.R. Studying the fracture parameters and size effect of steel fiber-reinforced self-compacting concrete. Constr. Build. Mater. 2019, 201, 447–460. [Google Scholar] [CrossRef]
  20. Rao, G.A.; Prasad, B.R. Fracture energy and softening behavior of high-strength concrete. Cem. Concr. Res. 2002, 32, 247–252. [Google Scholar] [CrossRef]
  21. Meddah, M.S.; Zitouni, S.; Belâabes, S. Effect of content and particle size distribution of coarse aggregate on the compressive strength of concrete. Constr. Build. Mater. 2010, 24, 505–512. [Google Scholar] [CrossRef]
  22. Beygi, M.H.; Kazemi, M.T.; Nikbin, I.M.; Amiri, J.V.; Rabbanifar, S.; Rahmani, E. The influence of coarse aggregate size and volume on the fracture behavior and brittleness of self-compacting concrete. Cem. Concr. Res. 2014, 66, 75–90. [Google Scholar] [CrossRef]
  23. Ghasemi, M.; Ghasemi, M.R.; Mousavi, S.R. Investigating the effects of maximum aggregate size on self-compacting steel fiber reinforced concrete fracture parameters. Constr. Build. Mater. 2018, 162, 674–682. [Google Scholar] [CrossRef]
  24. Karamloo, M.; Mazloom, M.; Payganeh, G. Effects of maximum aggregate size on fracture behaviors of self-compacting lightweight concrete. Constr. Build. Mater. 2016, 123, 508–515. [Google Scholar] [CrossRef]
  25. Chen, B.; Liu, J. Effect of aggregate on the fracture behavior of high strength concrete. Constr. Build. Mater. 2004, 18, 585–590. [Google Scholar] [CrossRef]
  26. Akcay, B.; Ozbek, A.S.A.; Bayramov, F.; Atahan, H.N.; Sengul, C.; Tasdemir, M.A. Interpretation of aggregate volume fraction effects on fracture behavior of concrete. Constr. Build. Mater. 2012, 28, 437–443. [Google Scholar] [CrossRef]
  27. Nikbin, I.; Beygi, M.; Kazemi, M.; Amiri, J.V.; Rahmani, E.; Rabbanifar, S.; Eslami, M. Effect of coarse aggregate volume on fracture behavior of self compacting concrete. Constr. Build. Mater. 2014, 52, 137–145. [Google Scholar] [CrossRef]
  28. Mousavi, S.M.; Ranjbar, M.M.; Madandoust, R. Combined effects of steel fibers and water to cementitious materials ratio on the fracture behavior and brittleness of high strength concrete. Eng. Fract. Mech. 2019, 216, 106517. [Google Scholar] [CrossRef]
  29. Kazemi, M.; Golsorkhtabar, H.; Beygi, M.; Gholamitabar, M. Fracture properties of steel fiber reinforced high strength concrete using work of fracture and size effect methods. Constr. Build. Mater. 2017, 142, 482–489. [Google Scholar] [CrossRef]
  30. Şahin, Y.; Köksal, F. The influences of matrix and steel fiber tensile strengths on the fracture energy of high-strength concrete. Constr. Build. Mater. 2011, 25, 1801–1806. [Google Scholar] [CrossRef]
  31. Sangeetha, S.; Sakthieswaran, N.; Babu, O.G. Effect of steel fiber on fracture toughness of concrete. Mater. Today. Proc. 2021, 37, 1036–1040. [Google Scholar] [CrossRef]
  32. Michels, J.; Christen, R.; Waldmann, D. Experimental and numerical investigation on postcracking behavior of steel fiber reinforced concrete. Eng. Fract. Mech. 2013, 98, 326–349. [Google Scholar] [CrossRef] [Green Version]
  33. Yoo, D.; Kang, S.; Yoon, Y. Effect of fiber length and placement method on flexural behavior, tension-softening curve, and fiber distribution characteristics of UHPFRC. Constr. Build. Mater. 2014, 64, 67–81. [Google Scholar] [CrossRef]
  34. Roelfstra, P.E.; Sadouki, H.; Wittmann, F.H. Le béton numérique. Mater. Struct. 1985, 18, 327–335. [Google Scholar] [CrossRef]
  35. Belytschko, T.; Black, T. Elastic crack growth in finite elements with minimal remeshing. Int. J. Numer. Methods Eng. 1999, 45, 601–620. [Google Scholar] [CrossRef]
  36. Nicolas, M.S.; John, D.; Ted, B. A finite element method for crack growth without remeshing. Int. J. Numer. Methods Eng. 1999, 46, 131–150. [Google Scholar]
  37. Faron, A.; Rombach, G.A. Simulation of crack growth in reinforced concrete beams using extended finite element method. Eng. Fail. Anal. 2020, 116, 104698. [Google Scholar] [CrossRef]
  38. Aghajanzadeh, S.M.; Mirzabozorg, H. Concrete fracture process modeling by combination of extended finite element method and smeared crack approach. Theor. Appl. Fract. Mech. 2019, 101, 306–319. [Google Scholar] [CrossRef]
  39. Bobiński, J.; Tejchman, J. A coupled constitutive model for fracture in plain concrete based on continuum theory with non-local softening and eXtended Finite Element Method. Finite Elem. Anal. Des. 2016, 114, 1–21. [Google Scholar] [CrossRef]
  40. Javanmardi, M.R.; Maheri, M.R. Extended finite element method and anisotropic damage plasticity for modelling crack propagation in concrete. Finite Elem. Anal. Des. 2019, 165, 1–20. [Google Scholar] [CrossRef]
  41. Stolarska, M.; Chopp, D.L.; Moes, N.; Belytschko, T. Modelling crack growth by level sets in the extended finite element method. Int. J. Numer. Methods Eng. 2001, 51, 943–960. [Google Scholar] [CrossRef]
  42. Xu, Y.; Chen, S. A method for modeling the damage behavior of concrete with a three-phase mesostructure. Constr. Build. Mater. 2016, 102, 26–38. [Google Scholar] [CrossRef]
  43. Xu, Z.; Hao, H.; Li, H.N. Mesoscale modelling of fiber reinforced concrete material under compressive impact loading. Constr. Build. Mater. 2012, 26, 274–288. [Google Scholar] [CrossRef]
  44. Liang, X.; Wu, C. Meso-scale modelling of steel fibre reinforced concrete with high strength. Constr. Build. Mater. 2018, 165, 187–198. [Google Scholar] [CrossRef]
  45. Chinese Industry Standard. Test Code for Hydraulic Concrete; DL/T 5150–2017; National Energy Administration: Beijing, China, 2018. [Google Scholar]
  46. Chinese Industry Standard. Standard Test Methods for Fiber Reinforced Concrete; CECS 13-2009; Dalian University of Technology: Dalian, China, 2009. [Google Scholar]
  47. Chinese Industry Standard. Steel Fiber Reinforced Concrete; JGT 472-2015; Ministry of Housing and Urban-Rural Development of the People’s Republic of China: Beijing, China, 2015. [Google Scholar]
  48. Chinese Industry Standard. Norm for Fracture Test of Hydraulic Concrete; DL/T 5332-2005; Hohai University: Nanjing, China, 2005. [Google Scholar]
  49. Xu, S.; Zhang, X.; Zhang, S. Experimental measurement of double-K fracture parameters of concrete with small size aggregate. J. Hydraul. Eng. 2006, 5, 543–553. (In Chinese) [Google Scholar]
  50. Shi, G. Experimental Research on the Flexural Performance and Fracture Property of Steel Fiber Reinforced Concrete. Master’s Thesis, Zhengzhou University, Zhengzhou, China, 2005. (In Chinese, dissertation). [Google Scholar]
  51. Zimbelmann, R. A contribution to the problem of cement-aggregate bond. Cem. Concr. Res. 1985, 15, 801–808. [Google Scholar] [CrossRef]
  52. Yu, H. Nano-indentation Character of Interfacial Transition Zone between Steel Fiber and Cement Paste. Master’s Thesis, Wuhan University, Wuhan, China, 2017. (In Chinese, dissertation). [Google Scholar]
  53. Zhou, X.Q.; Hao, H. Mesoscale modelling of concrete tensile failure mechanism at high strain rates. Comput. Struct. 2008, 86, 2013–2026. [Google Scholar] [CrossRef]
  54. Agioutantis, Z.; Chatzopoulou, E.; Stavroulaki, M. A numerical investigation of the effect of the interfacial zone in concrete mixtures under uniaxial compression. Cem. Concr. Res. 2000, 30, 715–723. [Google Scholar] [CrossRef]
  55. Zhao, X.-H.; Chen, W.F. Effective elastic moduli of concrete with interface layer. Comput. Struct. 1998, 66, 275–288. [Google Scholar] [CrossRef]
  56. Zhang, Y. Study on the Mechanical Properties of Interfacial Transition Zone Based on the Mesoscopic Model of Concrete Random Aggregate. Master’s Thesis, Northwest A & F University, Xianyang, China, 2017. (In Chinese, dissertation). [Google Scholar]
  57. Liu, J. Three Dimension Lattice Modelling of Tensile Fracture of Concrete in Multiscales. Master’s Thesis, Harbin Institute of Technology, Harbin, China, 2016. (In Chinese, dissertation). [Google Scholar]
  58. Liu, J. Study on Meso—Scopic Model and Analysis Method of Concrete. Doctoral Thesis, Beijing University of Technology, Beijing, China, 2014. (In Chinese, dissertation). [Google Scholar]
  59. Zhang, H. Investigation on Fracture Behaviors and Damage Constitutive Relation of Concrete Considering Fractal Effects. Ph.D. Thesis, South China University of Technology, Guangzhou, China, 2010. (In Chinese, dissertation). [Google Scholar]
  60. Sun, H.; Xie, H. Fractal simulation of rock fracture surface. Rock Soil Mech. 2008, 29, 347–352. (In Chinese) [Google Scholar]
Figure 1. The three-point bending fracture experiments.
Crystals 11 00850 g001
Figure 2. The typical P-CMOD curve with different steel fiber lengths and coarse aggregate maximum sizes.
Crystals 11 00850 g002
Figure 3. ITZ morphology under different coarse aggregate maximum sizes (1000×).
Crystals 11 00850 g003
Figure 4. ITZ morphology under different coarse aggregate maximum sizes (5000×).
Crystals 11 00850 g004
Figure 5. Local view of electron microscope scan of SFRC.
Crystals 11 00850 g005
Figure 6. Interfacial transition zone morphology under different steel fiber lengths (1000×).
Crystals 11 00850 g006
Figure 7. A two-dimensional mesoscale numerical model of SFRC.
Crystals 11 00850 g007
Figure 8. The constitutive model of coarse aggregate and steel fiber.
Crystals 11 00850 g008
Figure 9. The bilinear constitutive model of mortar and interface.
Crystals 11 00850 g009
Figure 10. Load-deflection curves.
Crystals 11 00850 g010
Figure 11. P-CMOD curves.
Crystals 11 00850 g011
Figure 12. The crack evolution process.
Crystals 11 00850 g012
Figure 13. The macro-experiment.
Crystals 11 00850 g013
Figure 14. The effect of steel fiber length and coarse aggregate maximum size on fracture energy of SFRC.
Crystals 11 00850 g014
Figure 15. The effect of lf/Dmax on the Gf ratio of SFRC.
Crystals 11 00850 g015
Figure 16. The effect of volume fraction on the Gf and Gf ratio of SFRC.
Crystals 11 00850 g016
Figure 17. The effect of steel fiber length and coarse aggregate maximum size on the fractal dimension of SFRC.
Crystals 11 00850 g017
Table 1. Mix proportions of the concrete series.
Strength GradeAggregate Maximum Size (mm)Steel Fiber Length (mm)Cement (kg/m3)Sand (kg/m3)Coarse Aggregate (kg/m3)Water (kg/m3)Steel Fiber (kg/m3)
C3010/20/30/4033672911891950
C3010/20/3030336750114519578.5
C3010/20/3040336750114519578.5
C3020/30/4050336750114519578.5
C3020/30/4060336750114519578.5
Note: In order to compare the performance of different groups of SFRC, when the coarse aggregate maximum size changes, the concrete adopts the same mixture proportions.
Table 2. The fracture toughness of SFRC.
Strength GradeAggregate Maximum Size (mm)Steel Fiber Length (mm)Pmax
(N)
ac
(mm)
K Ic ini ( MPa · m 1 / 2 ) K Ic un ( MPa · m 1 / 2 )
C3010493862.30.4910.912
C3020542964.70.5151.057
C3030631768.40.5671.138
C3040579866.90.5041.021
C301030672570.30.6121.291
C302030704172.90.6471.453
C303030721179.00.6331.346
C301040788782.10.6681.599
C302040874385.70.6721.976
C303040901887.40.6872.25
C302050772980.10.6411.422
C303050821482.90.6711.655
C304050948185.20.6832.126
C302060992989.10.6942.411
C303060812275.80.6711.605
C304060834680.40.6771.810
Table 3. The value of each component of SFRC.
ComponentTensile Strength (MPa)Modulus of Elasticity (GPa)Poisson RatioGf (N/m)
Aggregate 500.16-
Mortar2.8250.22143
Interface2.5220.22109.2
Steel 2160.3-
Publisher’s Note: MDPI stays neutral with regard to jurisdictional claims in published maps and institutional affiliations.

