Article

Inverse Columnar-Equiaxed Transition (CET) in 304 and 316L Stainless Steels Melt by Electron Beam for Additive Manufacturing (AM)

by
Yuichiro Miyata
1,
Masayuki Okugawa
1,2,*,
Yuichiro Koizumi
1,2,* and
Takayoshi Nakano
1,2
1
Graduate School of Engineering, Osaka University, 2-1 Yamadaoka, Suita 565-0871, Japan
2
Anisotropic Design & Additive Manufacturing Research Center, Osaka University, Suita 565-0871, Japan
*
Authors to whom correspondence should be addressed.
Submission received: 17 June 2021 / Revised: 20 July 2021 / Accepted: 20 July 2021 / Published: 23 July 2021

Abstract

:
According to Hunt’s columnar-to-equiaxed transition (CET) criterion, which is generally accepted, a high-temperature gradient (G) in the solidification front is preferable to a low G for forming columnar grains. Here, we report the opposite tendency found in the solidification microstructure of stainless steels partially melted by scanning electron beam for powder bed fusion (PBF)-type additive manufacturing. Equiaxed grains were observed more frequently in the region of high G rather than in the region of low G, contrary to the trend of the CET criterion. Computational thermal-fluid dynamics (CtFD) simulation has revealed that the fluid velocity is significantly higher in the case of smaller melt regions. The G on the solidification front of a small melt pool tends to be high, but at the same, the temperature gradient along the melt pool surface also tends to be high. The high melt surface temperature gradient can enhance Marangoni flow, which can apparently reverse the trend of equiaxed grain formation.

Graphical Abstract

1. Introduction

Recently, additive manufacturing (AM) technologies are emerging rapidly and being applied to various materials. In conventional forming processes, materials are cast, deformed, and/or subtracted from bulk by cutting tools. In contrast, materials are subsequently added to form parts with the desired shape in AM processes, and it enables us to build 3D parts with complicated geometry easily. Austenitic 316L and 304 stainless steels (hereafter denoted by SS) are commonly used in a wide range of fields, including plant piping, valves, tools, household equipment, food, and biomedical devices. AM technologies are proposed to be applied to fabricate SS parts as well [1,2,3,4,5,6].
Among the AM processes applied to metals, a powder-bed fusion (PBF)-type AM has been most commonly used in this decade for its accuracy and degree of freedom in the shape of objects fabricated. In the PBF-AM process, 3D parts are fabricated by repeating the selective melting of metal powders by laser or electron beams and subsequent solidification. With optimized process parameters, AM-processed SS parts possessing a relative density higher than 99% can be fabricated with good reproducibility [2].
Mechanical properties of metal parts largely depend on their microstructure. Therefore, many researchers have investigated the relationship between process parameters for PBF and microstructures in recent years [4,5,6,7,8,9,10,11,12,13]. Dehoff et al. [10,11] succeeded in fabricating IN718 parts with equiaxed and columnar microstructures by controlling the beam irradiation conditions. Ding et al. [12] also obtained equiaxed grains in IN718 by PBF-EB under condition with large melt pool and large scanning-line offset. On the other hand, Gotterbarm et al. [13] fabricated a single crystal part by the unique beam-scanning strategy mimicking the spiral grain selector used in an investment casting for single crystal growth.
Microstructures of metals fabricated by the PBF process are solidification structures. In general, solidification microstructures can be predicted from solidification conditions defined by the combination of a temperature gradient, G, and a solidification rate, R, at a solid/liquid interface according to the columnar-equiaxed transition (CET) criterion proposed by Hunt [14]. Thus, solidification maps, in which the types of the solidification microstructures are indicated in the space of G and R, have been proposed as a guide for predicting the microstructure formed by the PBF-AM process. Moreover, the solidification maps are proposed as a guide for determining a process condition for obtaining the desired microstructure [8,15,16,17,18].
According to the CET criterion [14,15], the condition for fully columnar dendrites growth can be represented by
G n R   >   a ( 8.6 Δ T 0 N 0 1 / 3 n + 1 ) n
where n and a are alloy constants. ∆T0 and N0 are an equilibrium liquidus–solidus interval and a heterogeneous nucleation density, respectively. However, it is unclear whether the CET criterion can be applied to the PBF process because of the high G and the high R, even for major materials such as 316L and 304 SSs. In particular, it is crucial to reveal the relationships between the solidification conditions and the microstructures of the austenitic steels fabricated by AM since the austenitic SSs do not exhibit solid–solid phase transformation, and the microstructure of AM build parts are essentially the same as the as-solidified microstructure. The microstructures determine the properties of AM processed parts.
In this study, to reveal the relationships between microstructures and solidification conditions, we have investigated the solidification microstructures of 316L and 304 SSs induced by electron-beam irradiation. In addition, the solidification conditions at the solid/liquid interface have been evaluated using a computational thermal-fluid dynamics (CtFD) simulation. The factors determining the formation of equiaxed grains are discussed with reference to the CET criterion. The roles of a fluid flow on the microstructure formation are discussed by utilizing the results of the microstructure analysis and the CtFD simulation.

2. Methods

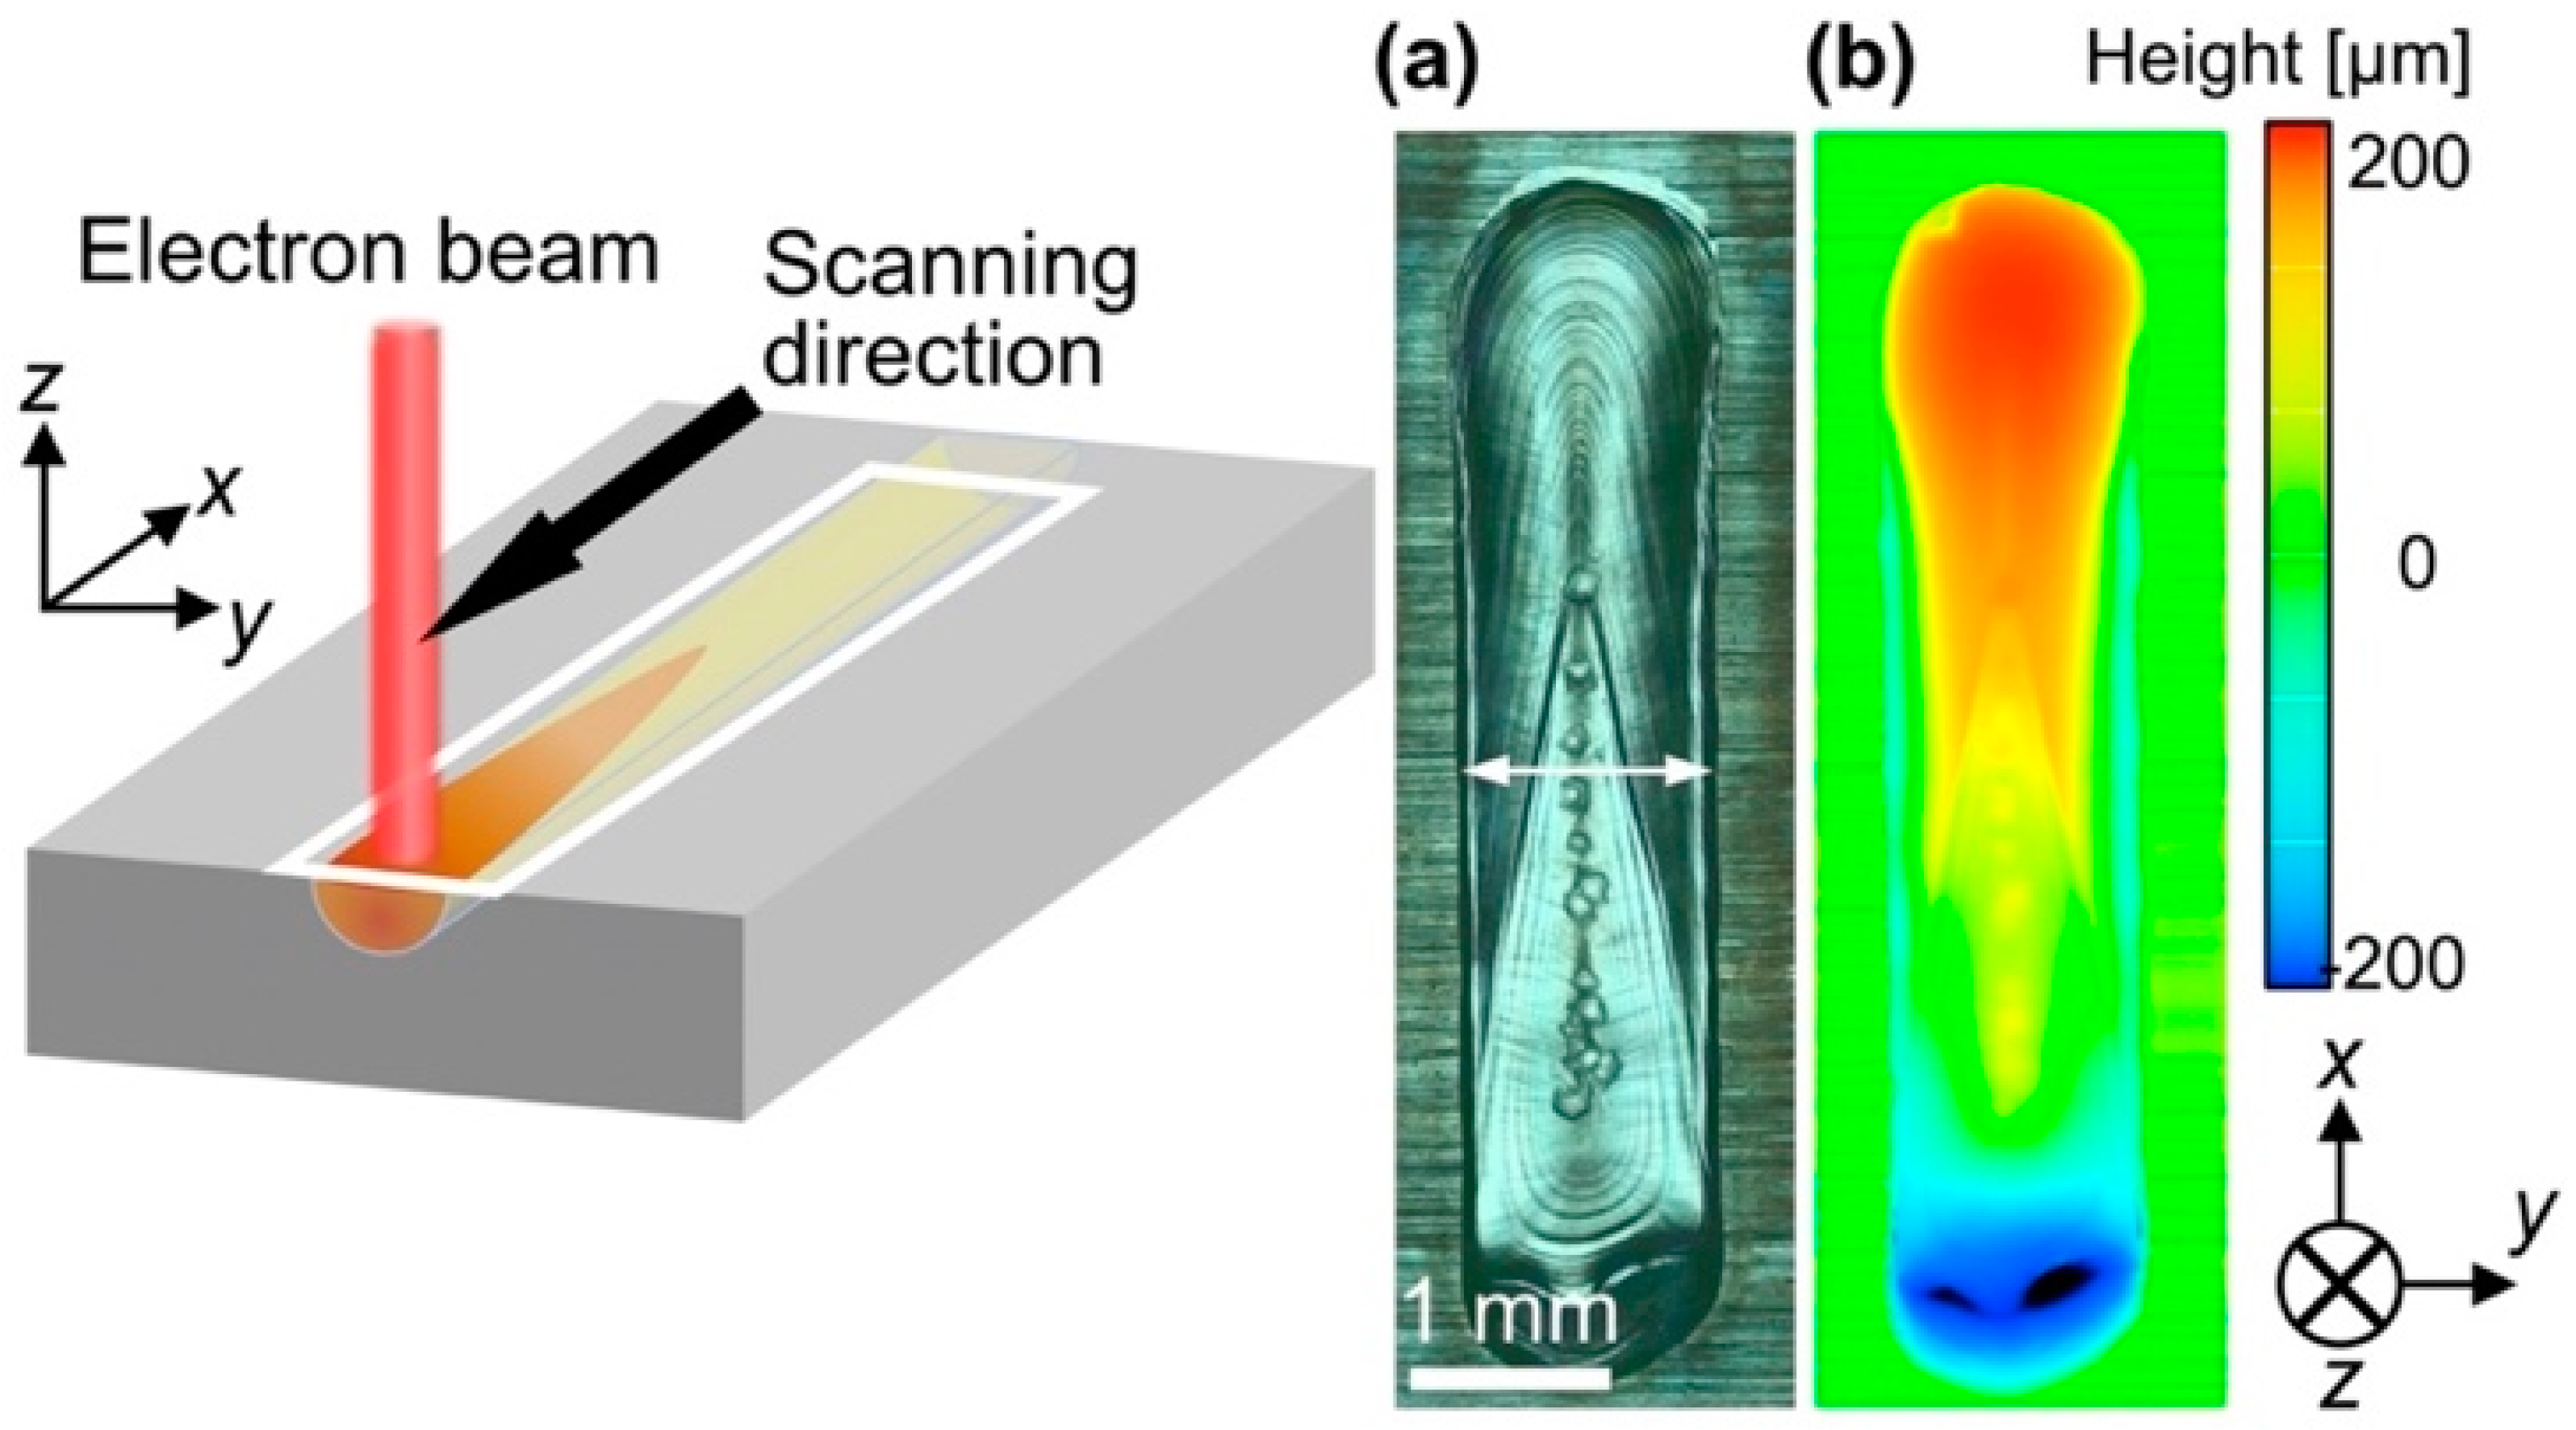
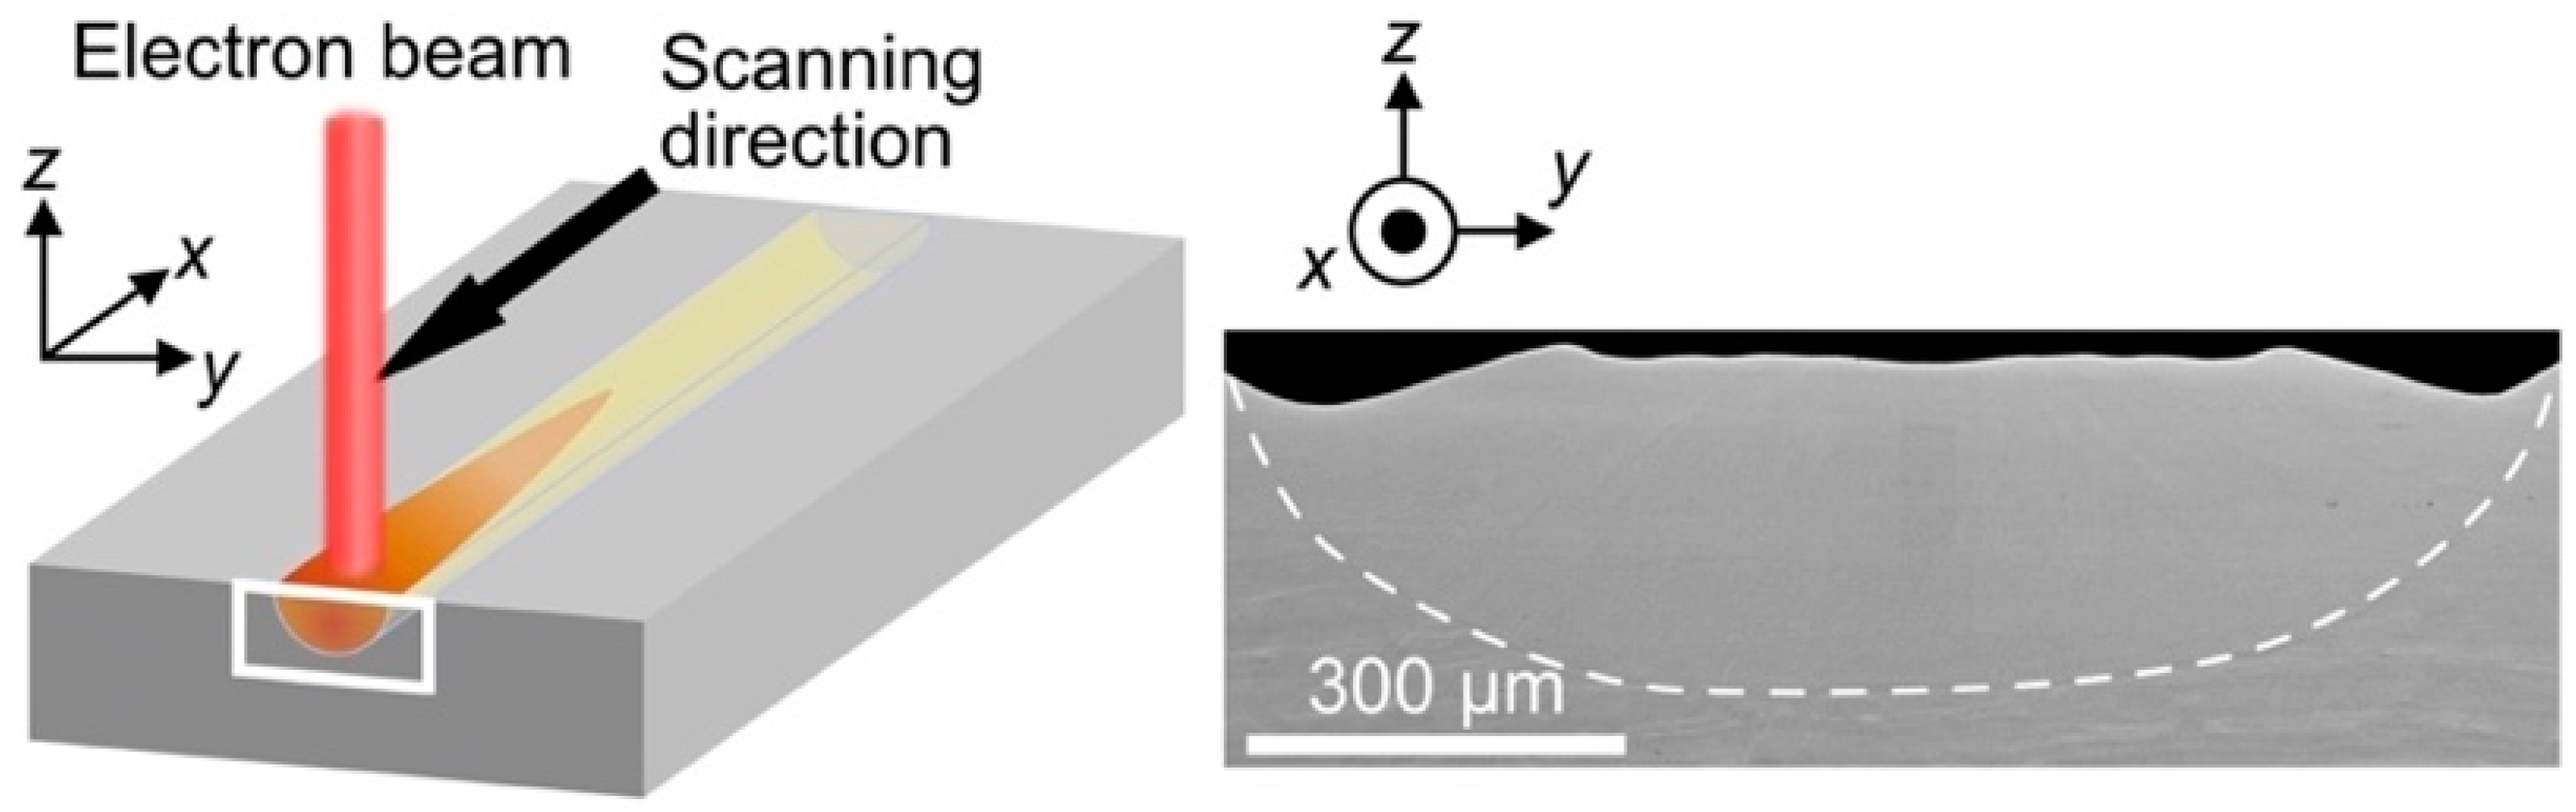
2.1. Experimental Methods

Specimens of 316L and 304 SSs with a dimension of 20 mm × 50 mm × 10 mm were received. The specimens were irradiated with electron beams scanned along straight lines with a length of 5 mm using an electron beam machine (Mitsubishi Electric EBM-6LB-1, Mitsubishi Electric, Tokyo, Japan) under a helium atmosphere with a pressure of 0.5 Pa. Acceleration voltage and convergence current were fixed to be 60 kV and 1150 mA, respectively. The irradiations were conducted under 12 conditions combining three levels of beam power, P (600, 900, and 1200 W, i.e., beam current of 10, 15, and 20 mA, respectively), and four levels of scanning speed, V (100, 300, 1000, and 3000 mm/s). Line energies for each irradiation condition are listed in Table 1.
The top surfaces of the electron-beam irradiated samples were observed using a laser microscope (Keyence VK-X200/210, Keyence Corporation, Osaka, Japan) for measuring the widths and the surface topographies of the melt tracks. The samples were cut perpendicular to the beam-scanning direction for cross-sectional observation using a field emission scanning electron microscope (FE-SEM, JEOL JSM 6500, JEOL Ltd., Tokyo, Japan). Crystal orientation analysis was performed by electron backscatter diffraction (EBSD). The sizes of each crystal grain and their aspect ratio were evaluated by analyzing the EBSD datum.

2.2. Simulation Methods

CtFD simulations of electron-beam irradiations to 316L and 304 SSs were performed using a commercial 3D thermo-fluid analysis software (Flow Science FLOW-3D® with Flow-3D Weld module, Flow Science, Inc., New Mexico, NM, USA). Table 2 shows the parameters for the simulations. Most of the parameters of physical properties were evaluated by calculation using an alloy physical property calculation software (Sente software JMatPro v11, Sente Software, Guildford, UK). For the emissivity and the Stefan–Boltzmann constant, the values in [19] were used, and for the heat of vaporization and vaporization temperature, the values for pure Fe [20] were used. In this study, only a half region was modeled for the single-track electron-beam-scanning simulation to reduce computational cost assuming the symmetric boundary at a center plane. The dimensions of the computational domain of the numerical model were 5.0 mm in the beam-scanning direction, 1.0 mm in width (i.e., imaginarily 2 mm on the assumption of symmetry), and 1.3 mm in height. A uniform mesh size of 20 μm was applied to the whole computational domain. Boundary condition of continuity was applied to all the boundaries except for the top surface. The temperature and the pressure of simulation domains were initially set to be 300 K and 0.5 Pa, respectively. Beam powers and scanning speeds were the same as these in the experiment, shown in Table 1. A single-track melting simulation with a scan length of 3 mm took approximately 12 h to complete using an Intel® Core™ i9-9900K CPU (3.60 GHz) with 32 GB of RAM. Solidification conditions at the solid/liquid interface of G, R, cooling rate, and flow velocity, U, were calculated. Beam diameter and absorption efficiency were tuned as fitting parameters, and determined so that the morphology of the experimentally observed melt regions were reproduced by the simulation. Then, the relationships between these solidification conditions and the microstructures were examined based on the experimental and simulation results.

3. Results and Discussion

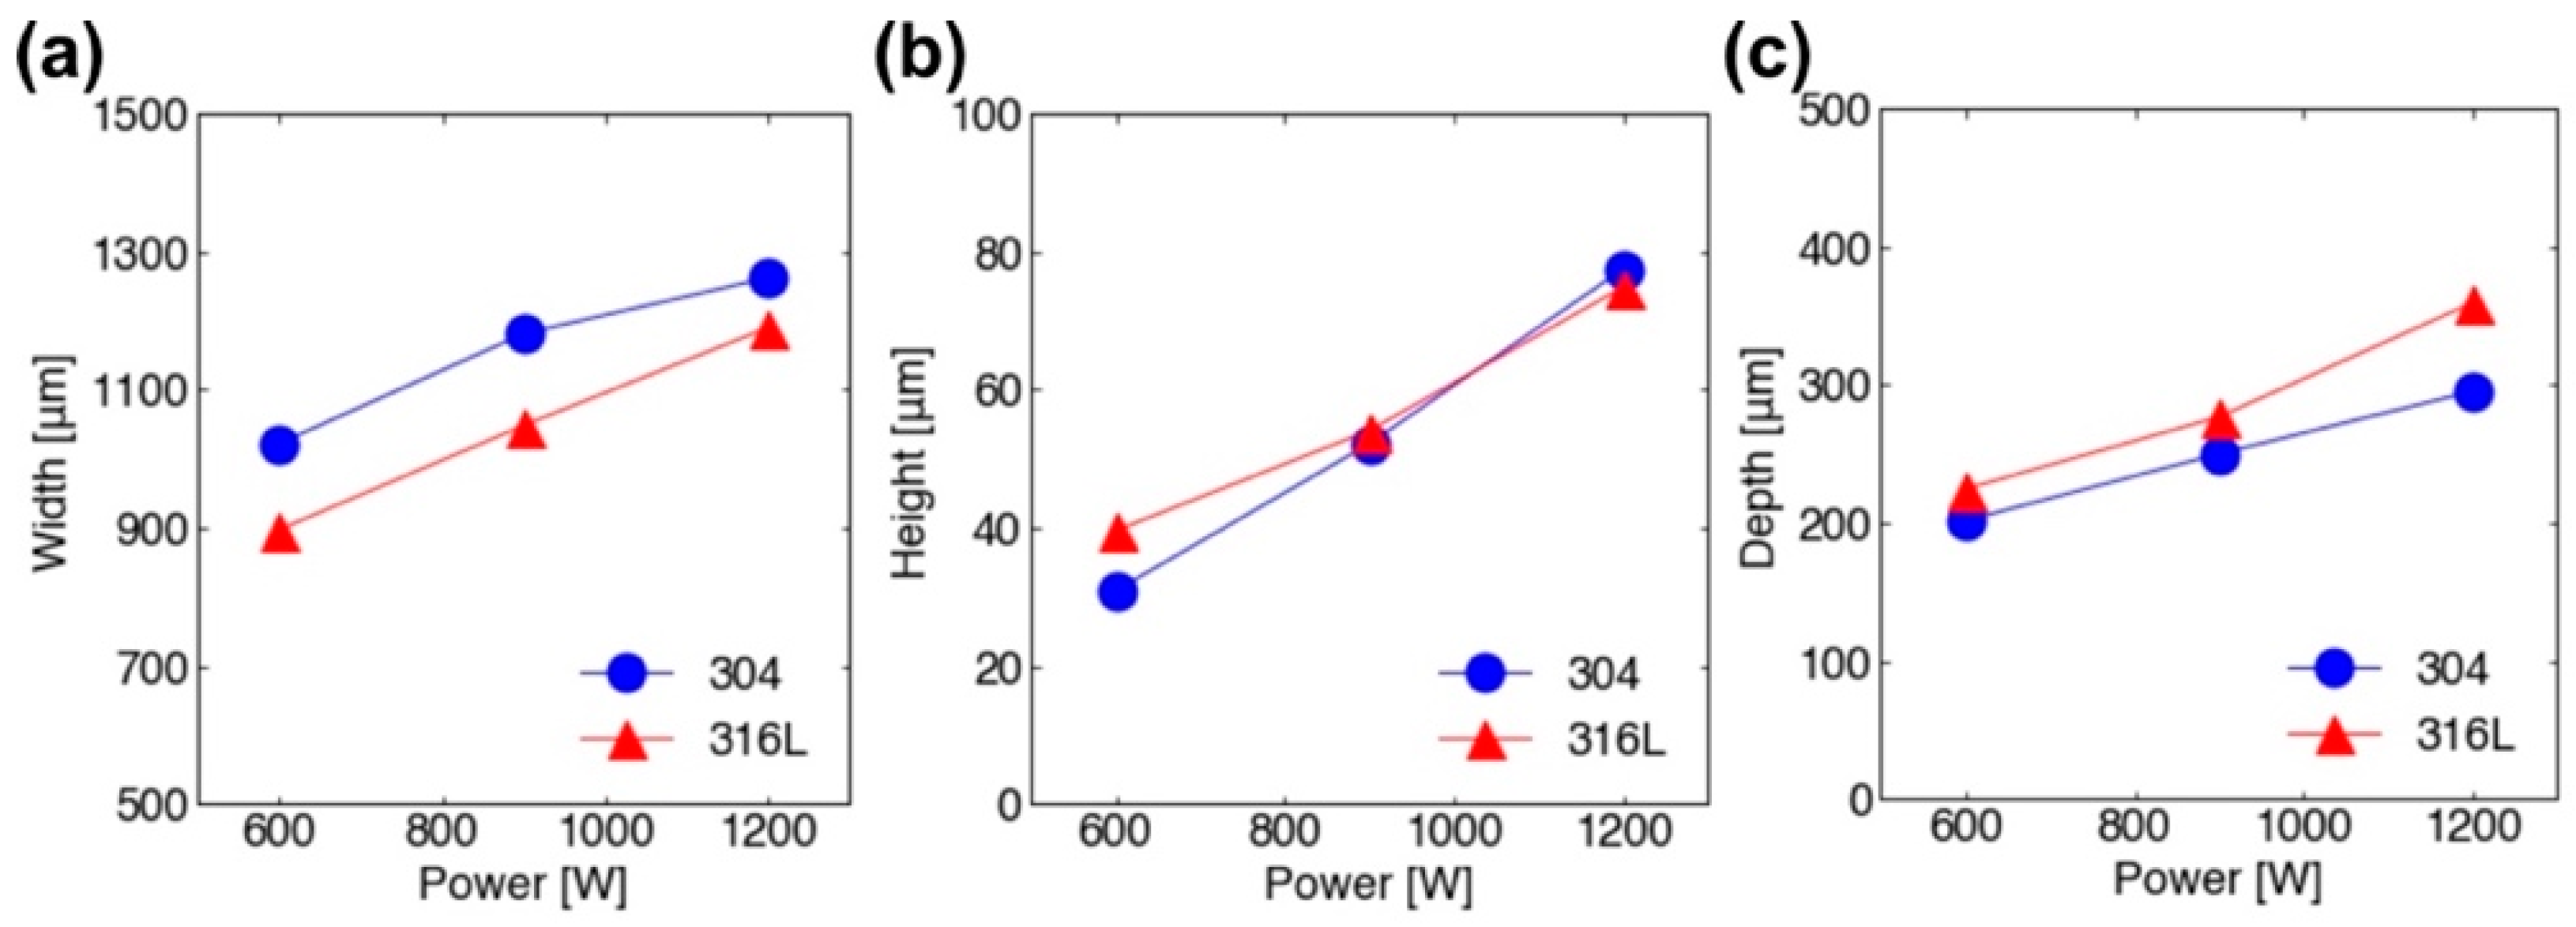
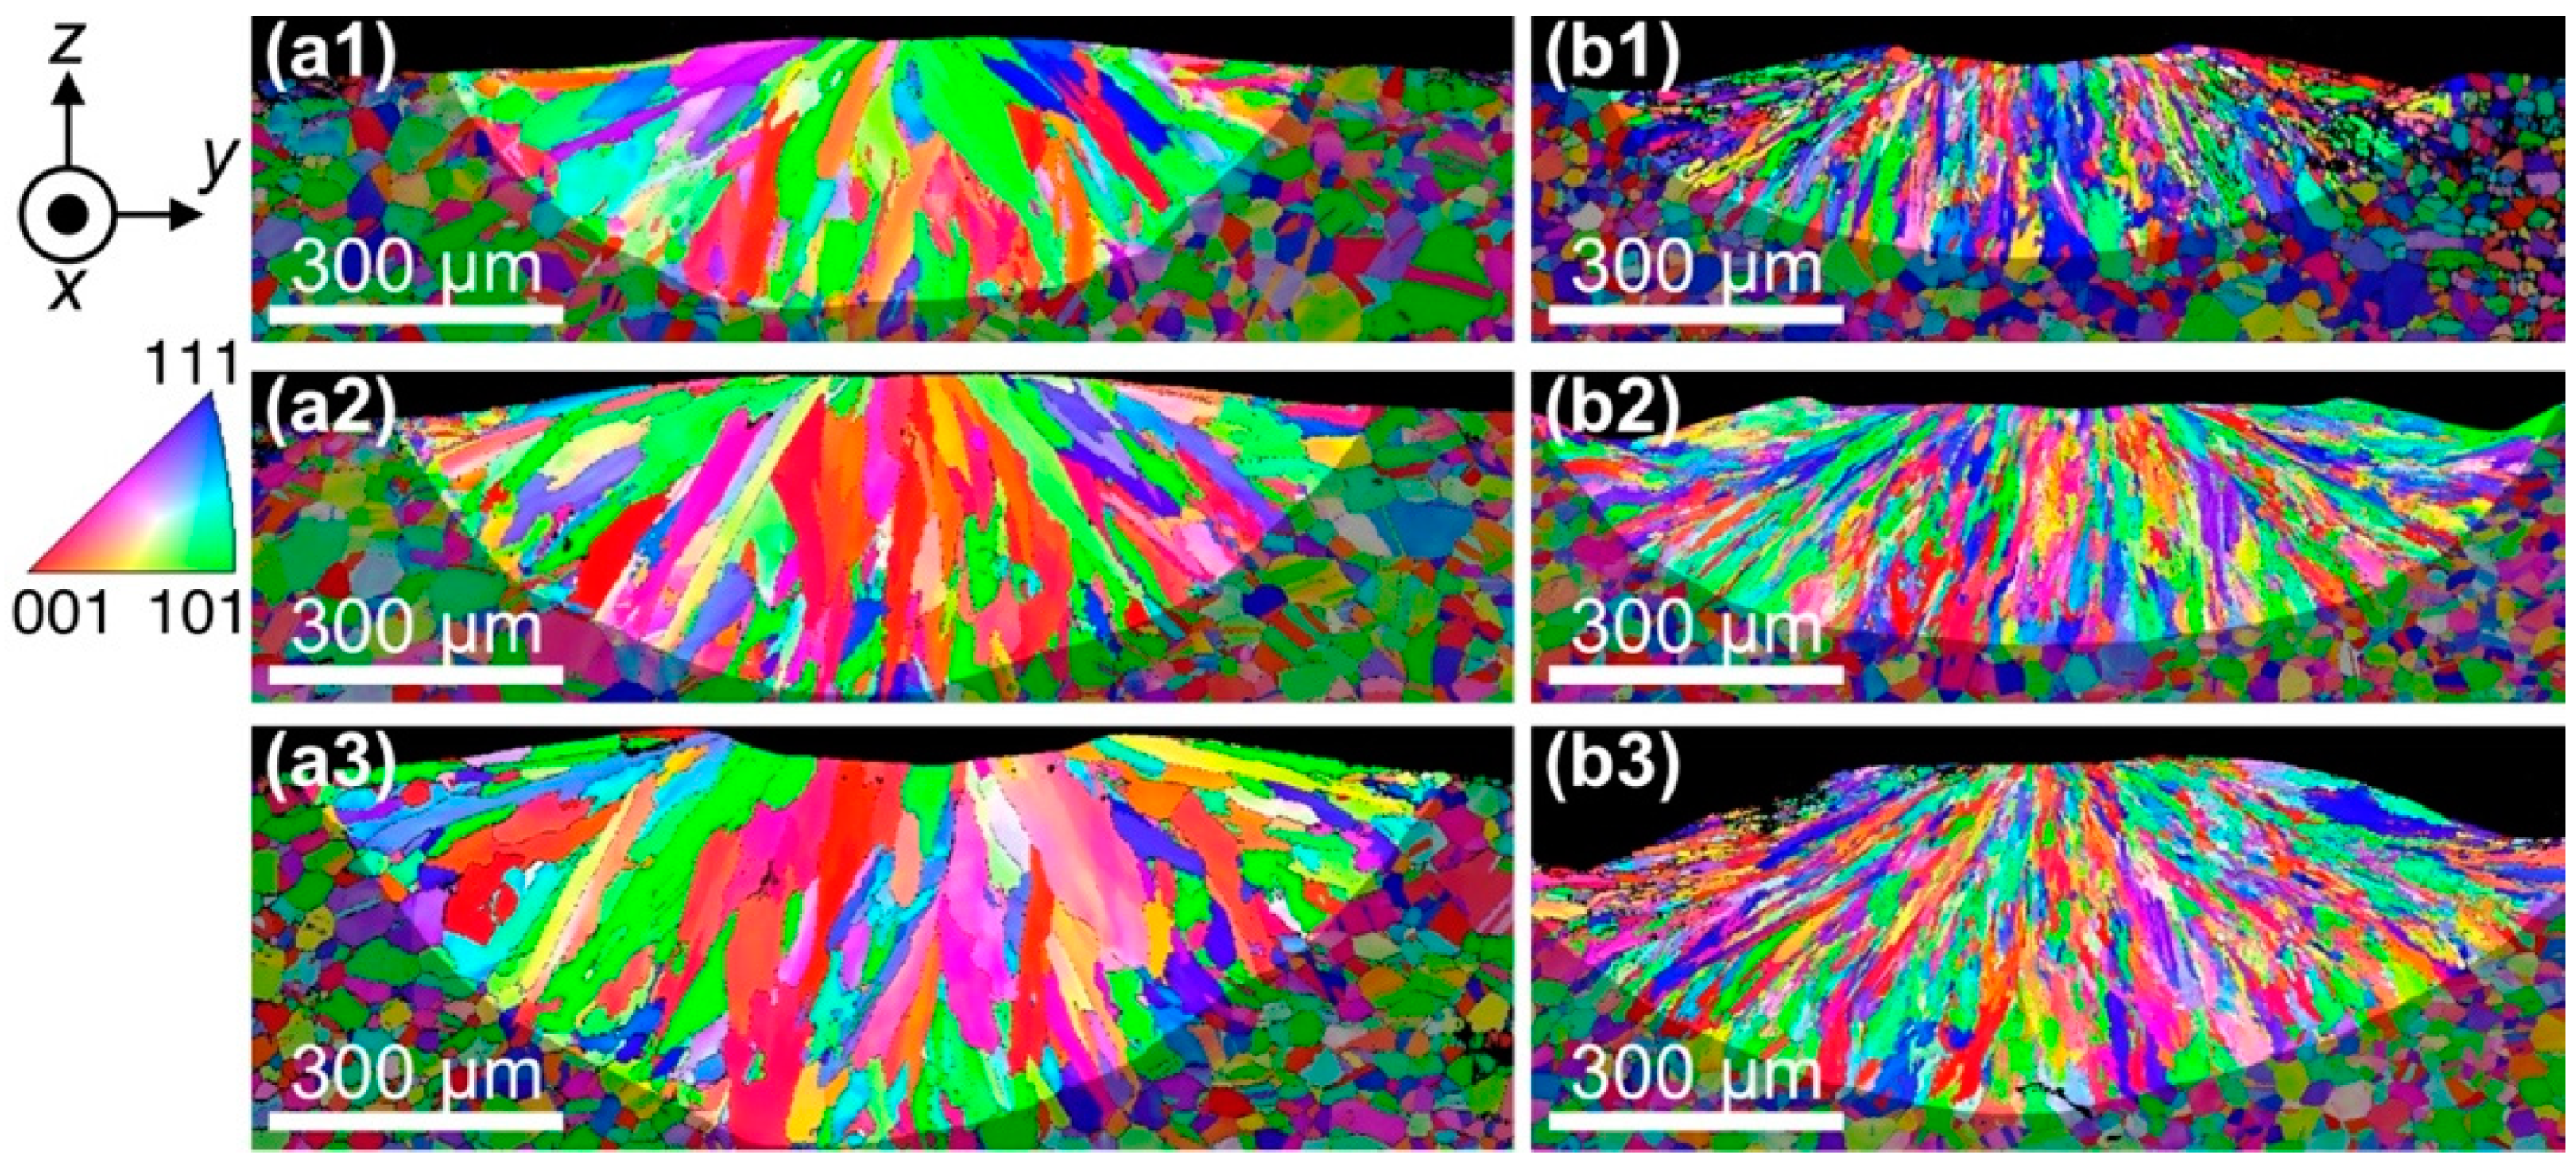
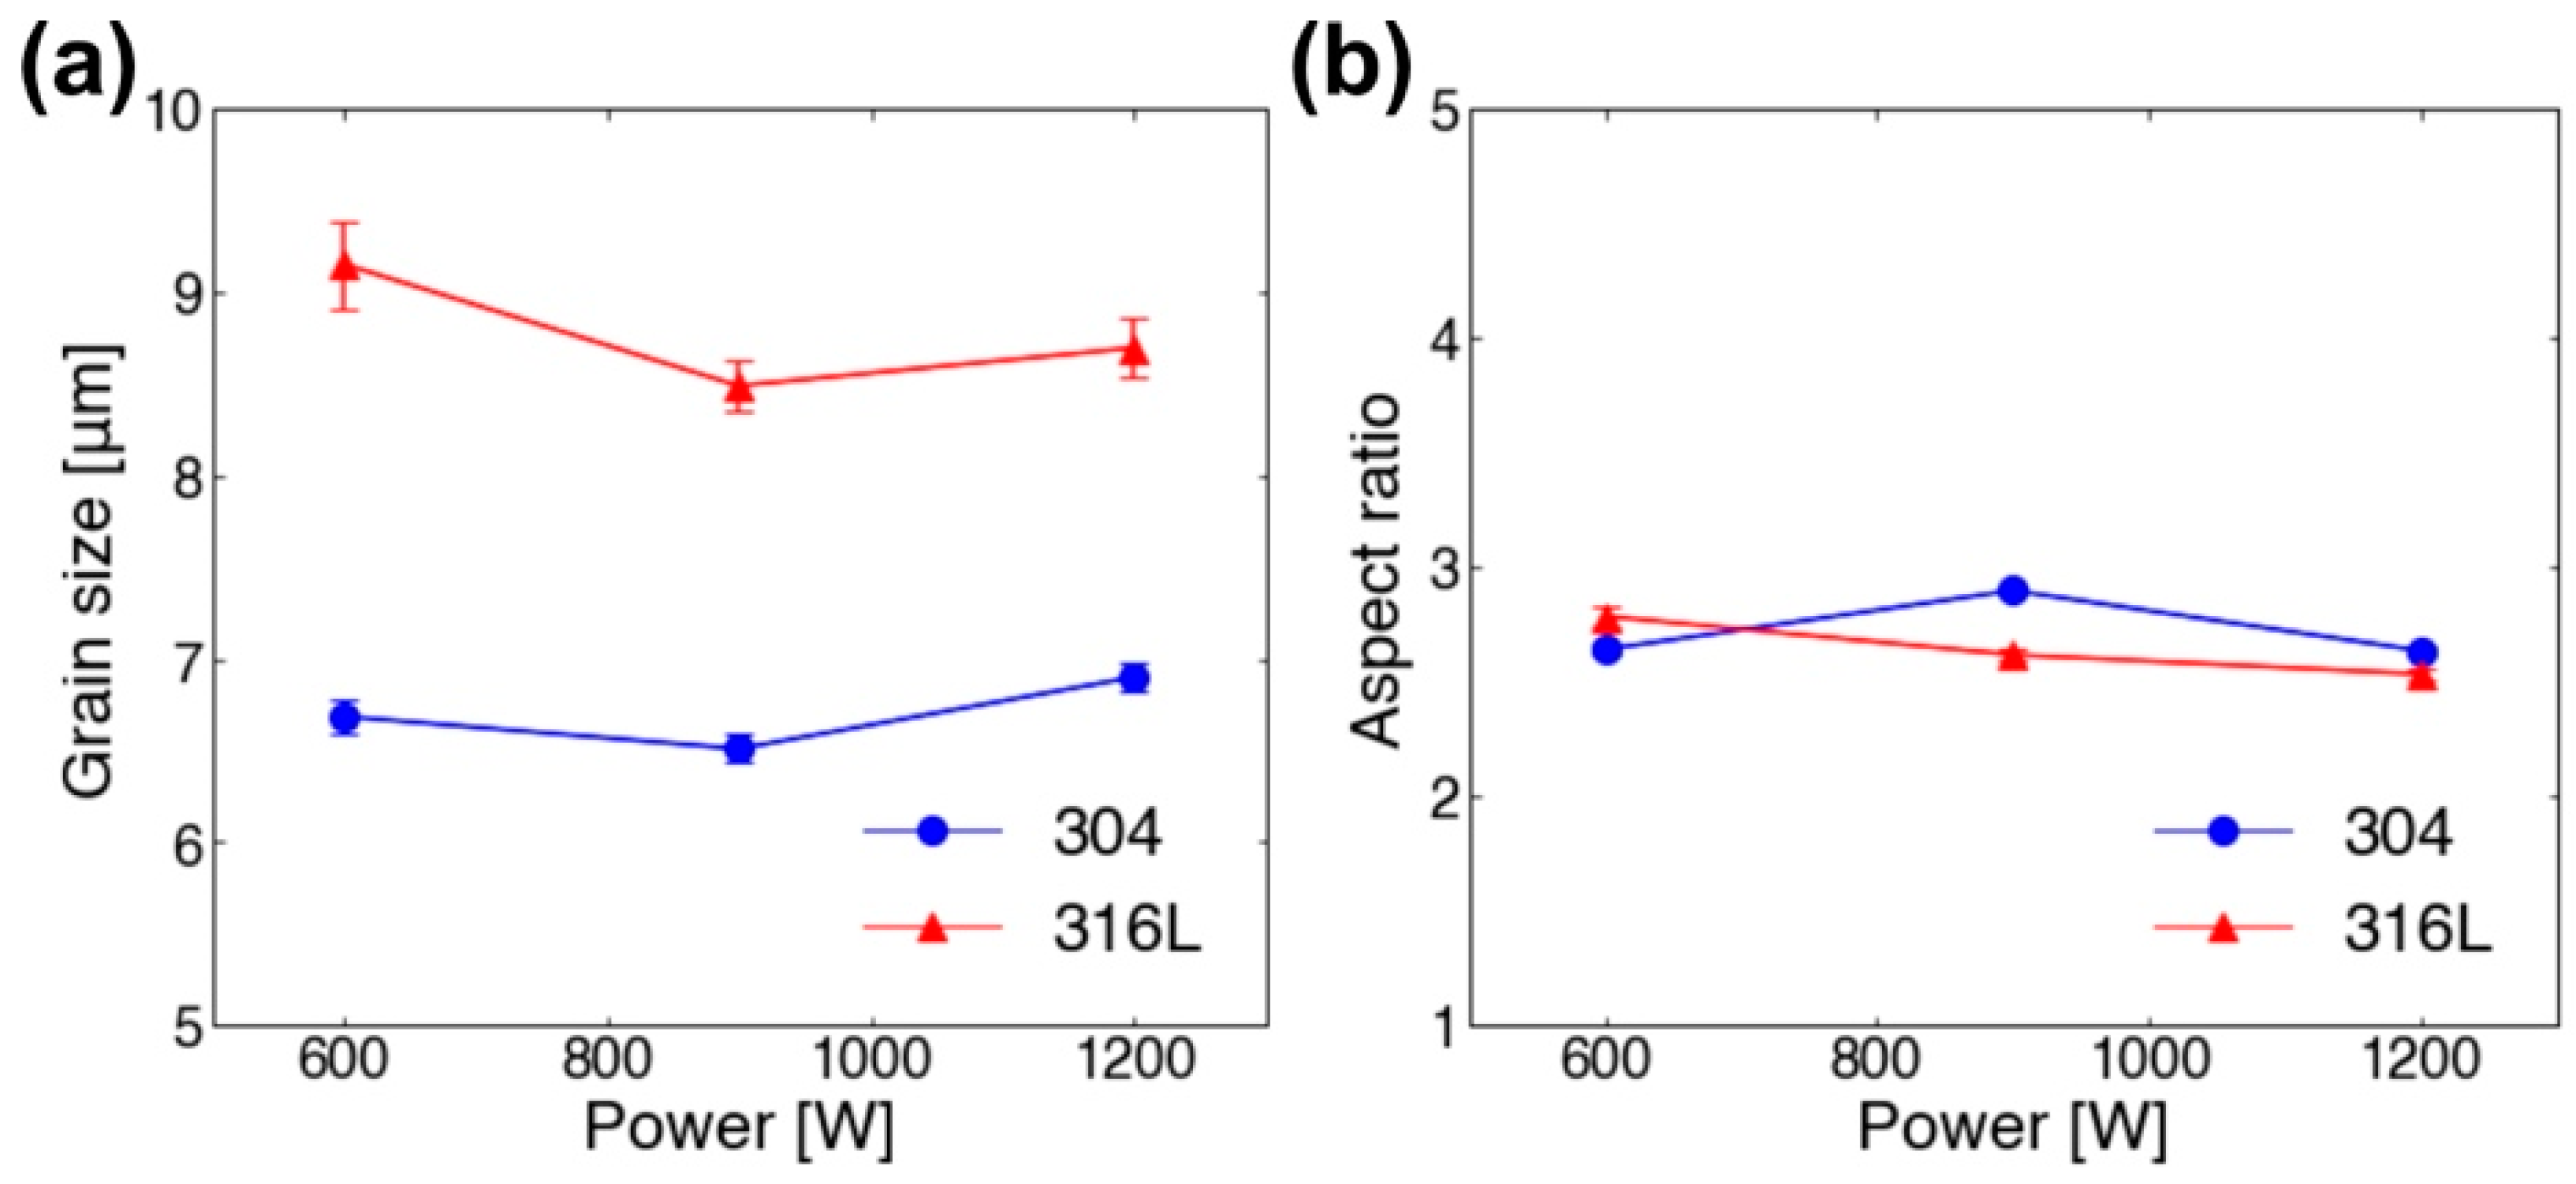
3.1. Experimental Results

Figure 1 shows a typical example of a surface laser microscope image and corresponding height map of the electron-beam irradiated region of 304 SS. The melt region can be seen in Figure 1a. The width of the melt regions tended to increase with increasing beam power. Additionally, the height map of Figure 1b shows that the surface of the melt region is not flat.
Figure 2 shows a cross-sectional SEM image taken from the electron-beam melt region of 304 SS. The fusion line can be seen, as indicated by dashed lines. The area of melt regions tend to increase with increasing beam power. The geometries of the melt regions in 304 SS for each of the same beam conditions are similar to those in 316L SS.
The width, height, and depth are measured from these surface and cross-sectional images. Figure 3 shows the width, height, and depth of melt tracks formed by scanning electron beam as a function of beam power. All of the width (Figure 3a), height (Figure 3b), and depth (Figure 3c) increased as the beam power increased. Under all process conditions, the melt regions formed in 316L SS were narrower and deeper than those in 304 SS.
Figure 4 shows the cross-sectional inverse pole figure (IPF) orientation maps of melt region in 316L SS and 304 SS samples irradiated with electron beam of various power at a scanning speed of 100 mm/s. Microstructures largely depend on the type of steels: in 316L SS samples (Figure 4(a1–a3)), equiaxed crystalline grains with diameters of 10–30 μm appear at the fusion line, and fine columnar crystalline grains with diameters of 20–50 μm appear at the center of the melt regions. In 304 SS (Figure 4(b1–b3)), coarse equiaxed grains with diameters of 5–20 μm are formed nearby the fusion line, and coarse columnar crystals with diameters of 5–10 μm are formed in the center. The morphology of the microstructures does not depend on the beam power significantly. Note that microstructures in the matrix of both steels are similar to each other, and the difference between the solidification microstructures in the melt region of the two SSs cannot be attributed to the difference in the microstructures in the matrix. From these EBSD data, average grain sizes and their aspect ratios in the melt regions were evaluated, as shown in Figure 5. The average grain size in 316L SS was larger than that of 304 SS under all process conditions, and the average grain size does not depend on beam power for both steels. Their average aspect ratios also do not depend on the process conditions, and are nearly the same for 316L and 304 SSs.

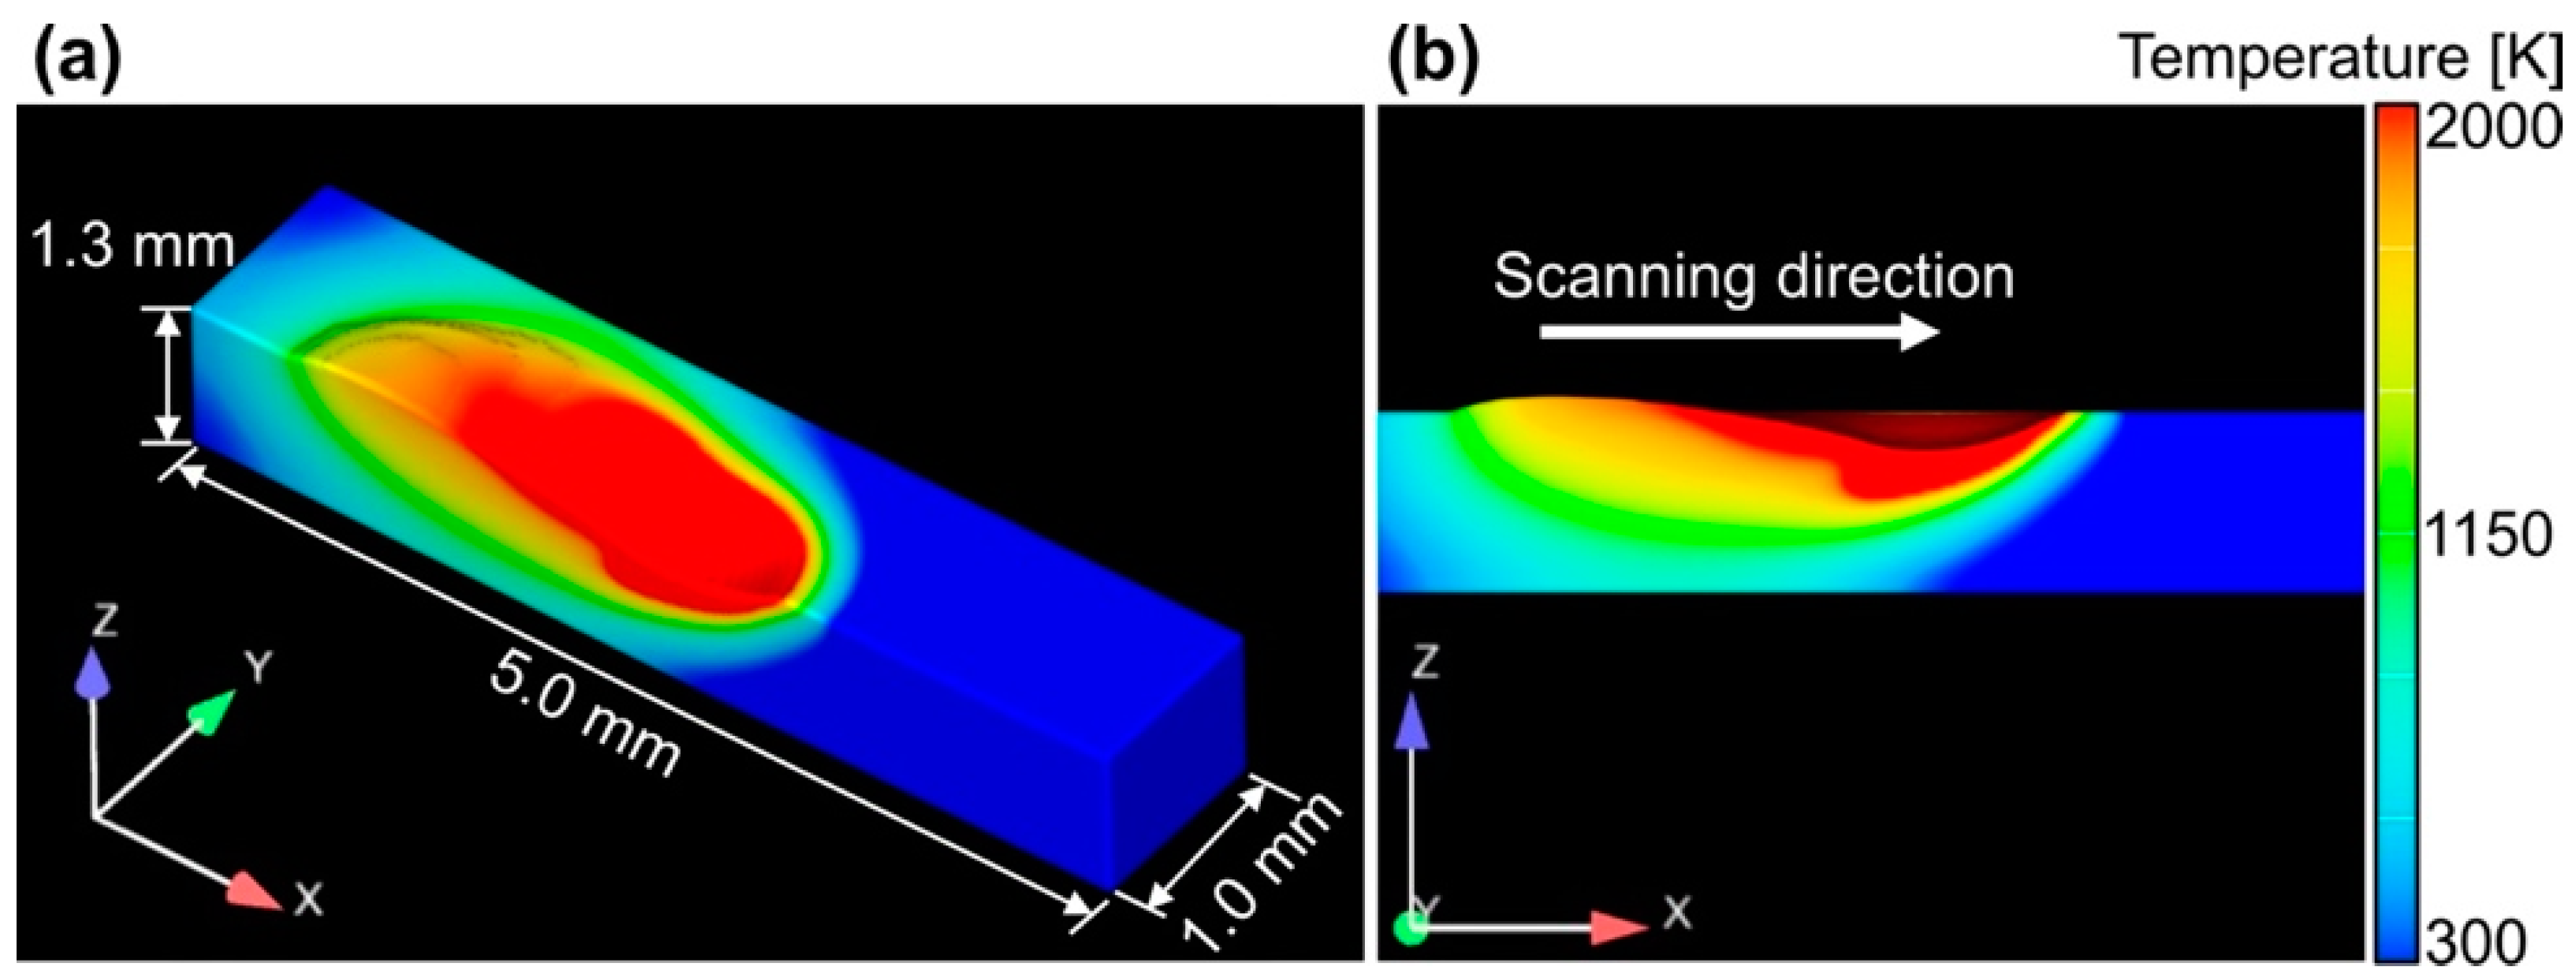
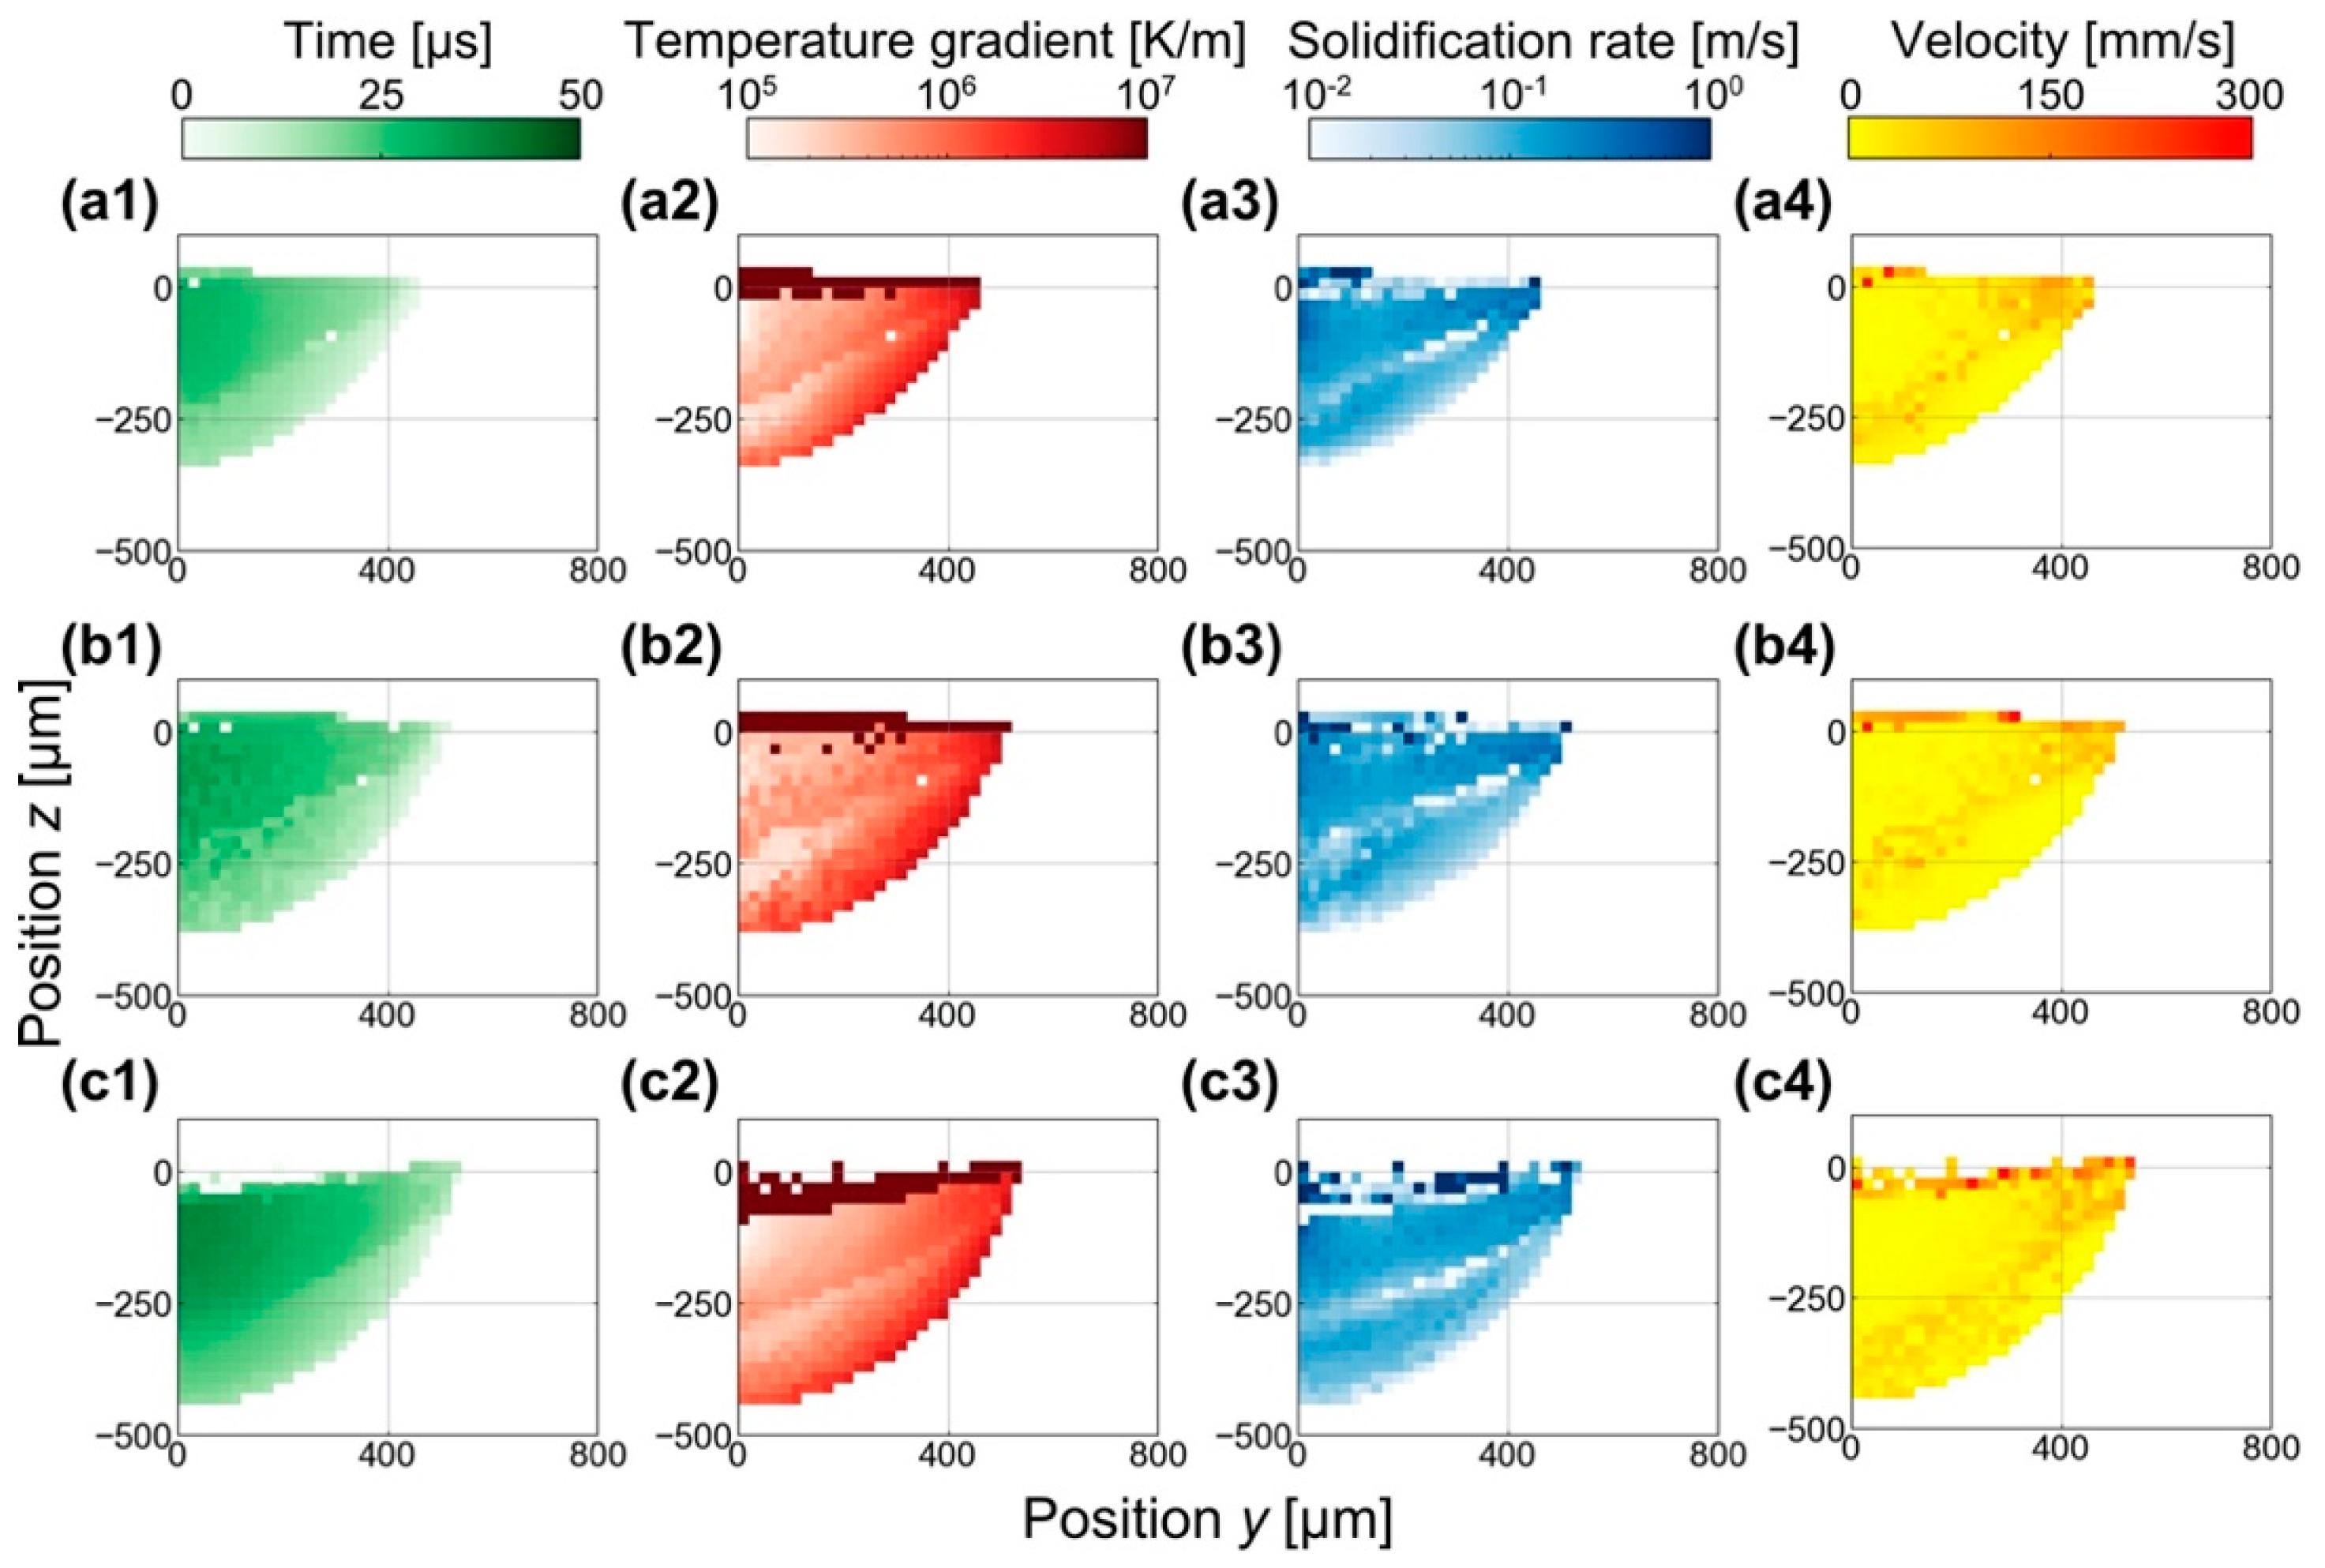
3.2. Computational Thermal-Fluid Dynamic (CtFD) Simulation

Figure 6 shows a snapshot of the CtFD simulation for 316L SS in the case of the electron-beam power, P, of 1200 W and scanning speed, V, of 100 mm/s, respectively.
Figure 7 compares a CtFD-simulated melt pool model of 316L SS with the EBSD IPF map of the corresponding cross section. By using a beam absorption efficiency of 0.8, the width and depth of the simulated melt region were in good agreement with these experimentally observed melt pools. On the other hand, there is a difference in the height between the experimentally observed melt pools and the simulated ones. The melt tracks have a rough surface, and the height depends on the cutting position. Thus, the height was excluded from the values, indicating the geometry of the melt region for examining the similarity of melt regions in the experiment to those in simulation in this study. The height will be included for further improvement of the model in future work. The value of the beam absorption efficiently is close to that reported in the literature [8,21]. The absorption efficiency of 0.8 was also used in CtFD simulations under other process conditions.
The solidification conditions at a liquid/solid interface were calculated from the CtFD simulation results. Figure 8 and Figure 9 show cross-sectional melt pools colored by solidification times (Figure 8(a1–c1) and Figure 9(a1–c1)), G (Figure 8(a2–c2) and Figure 9(a2–c2)), R (Figure 8(a3–c3) and Figure 9(a3–c3)), and U (Figure 8(a4–c4) and Figure 9(a4–c4)). Here, the solidification time is defined as the time when a liquid/solid interface has passed a mesh. Solidification times (Figure 8(a1–c1) and Figure 9(a1–c1)) indicate that the solidification starts at the region nearby the fusion line toward the center of the melt pool. In 316L SS, the G is highest in the regions near the fusion line and decreases as the solid–liquid interface moves toward the center of the melt pool (Figure 8(a2–c2)). On the other hand, the R is lowest near the fusion line and becomes higher as the interface approaches the center of the melt region (Figure 8(a3–c3)). In 304 SS, the regions solidified under the lowest G and R can be seen at the middle of the melt pools (Figure 9(a2–c2,a3–c3)). The distributions of G and R do not depend on beam power significantly in both 316L and 304 SSs. It is noted that the G became extremely large at the surface of the melt pool in both steels. It is suggested that the surface region was cooled mainly by external thermal radiation rather than by thermal diffusion through the metal substrate. As seen in Figure 8(a4–c4) and Figure 9(a4–c4), the fast fluid flow occurs in both steels, and the magnitude of flow velocity is larger in 316L SS than in 304 SS.
Figure 10a,b show the plot of the solidification conditions of each mesh in the GR space. Except for the surface regions, all the regions exist under conditions of G in the range of 1.0 × 10⁵–3.0 × 10⁷ K/m and of R in the range of 10−2–100 m/s. The average solidification conditions and its magnified picture are shown in Figure 10c,d, respectively. Compared with 316L SS, 304 SS solidified with a smaller G. In both SSs, the R slightly decreases with an increase in the beam power.

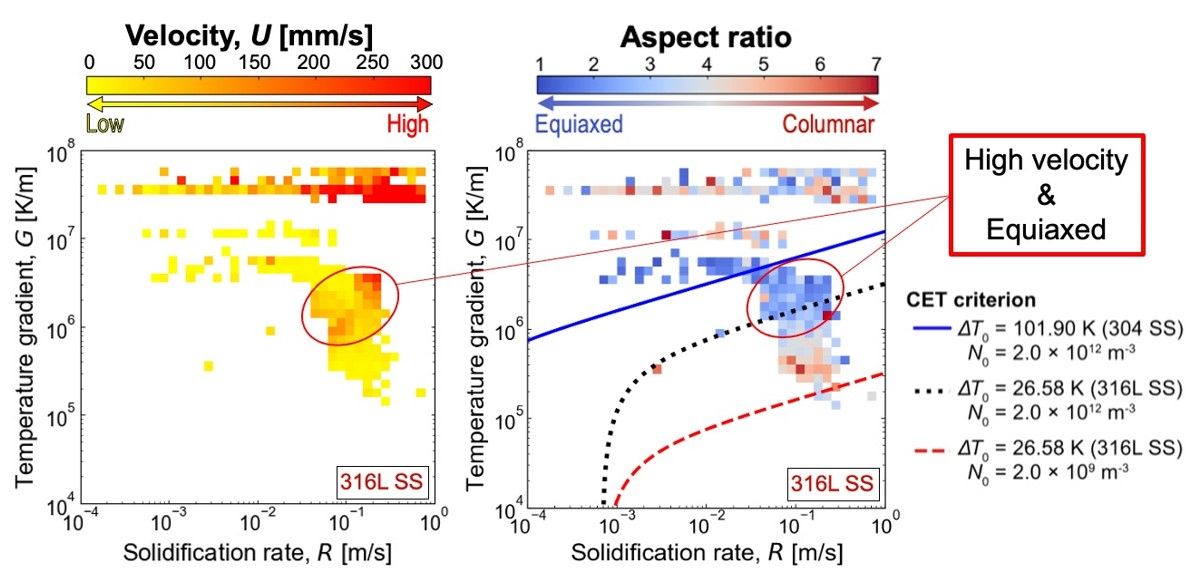
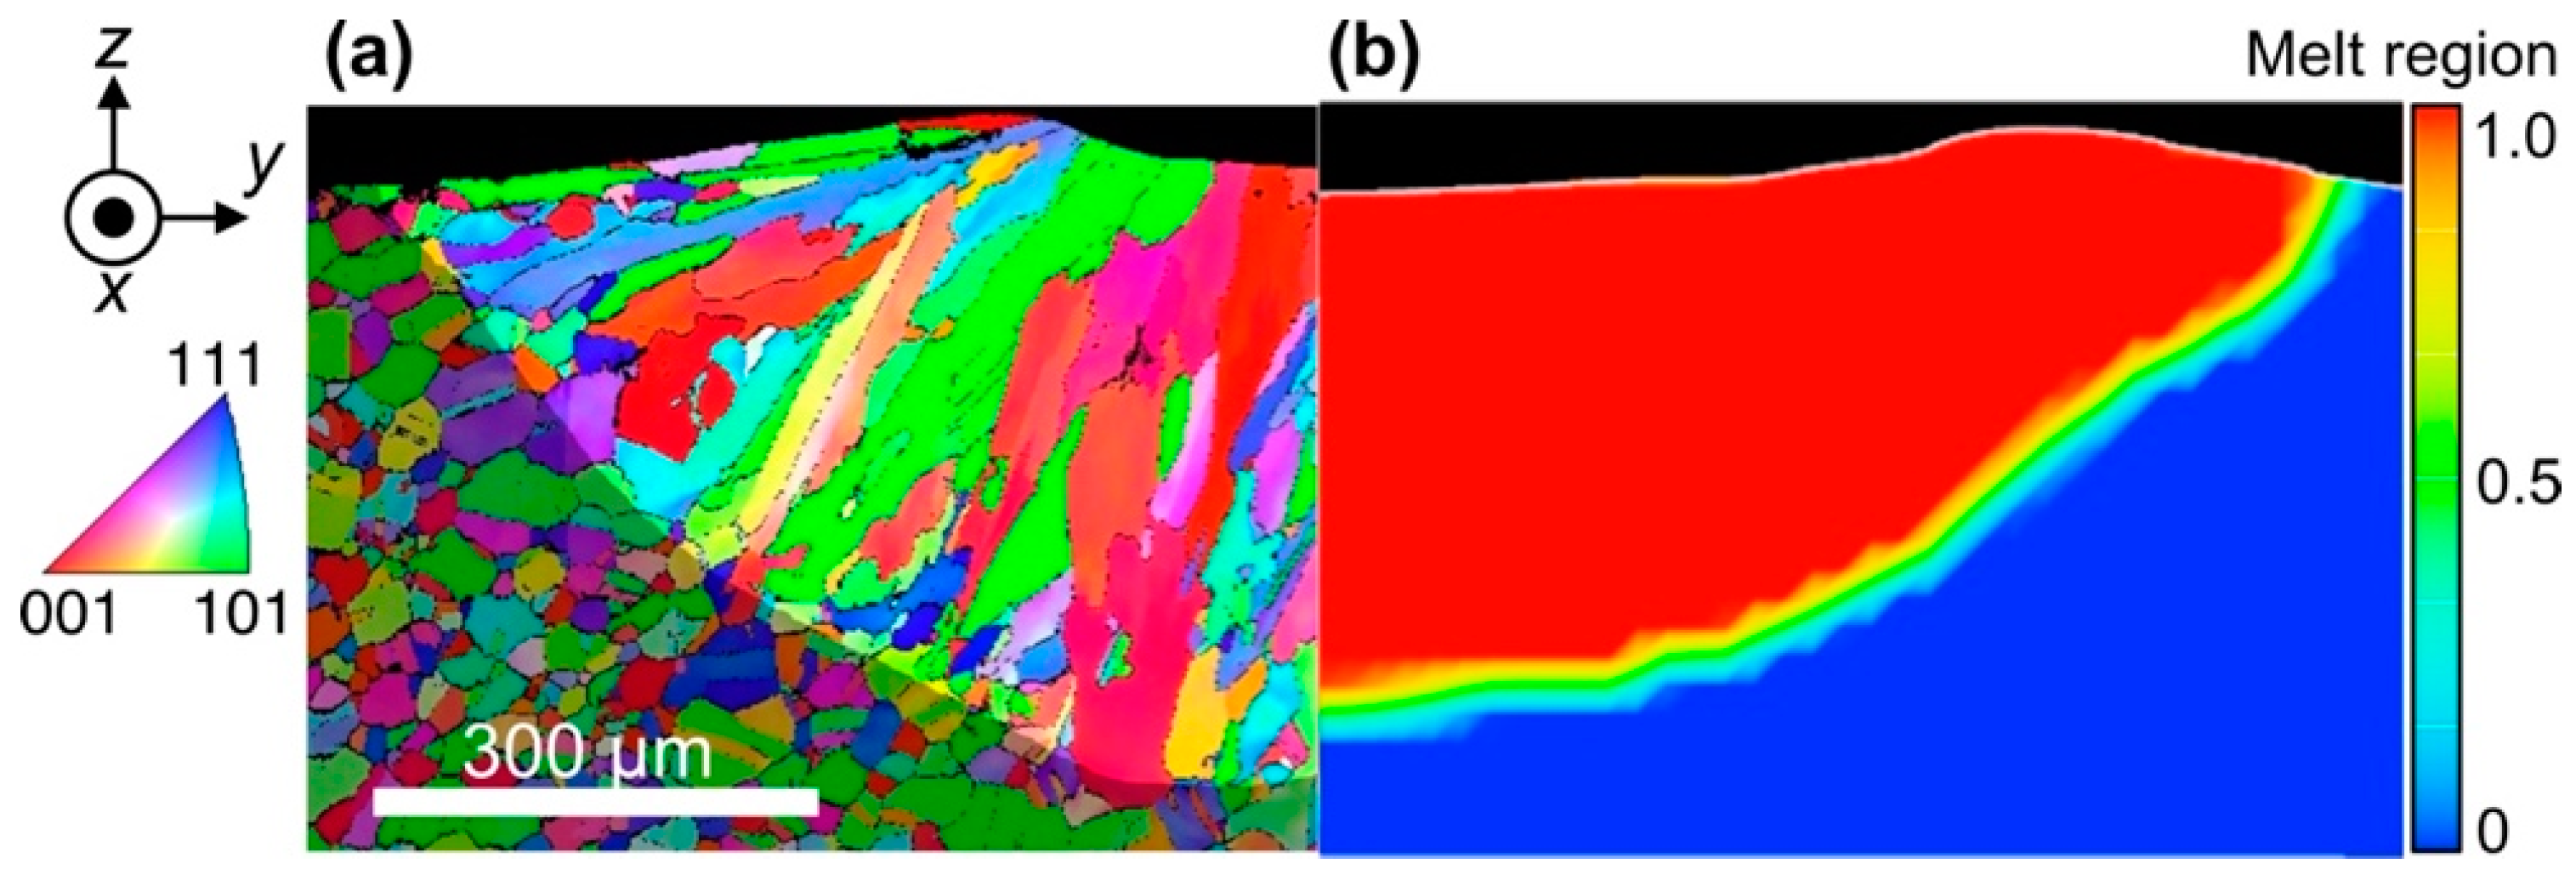
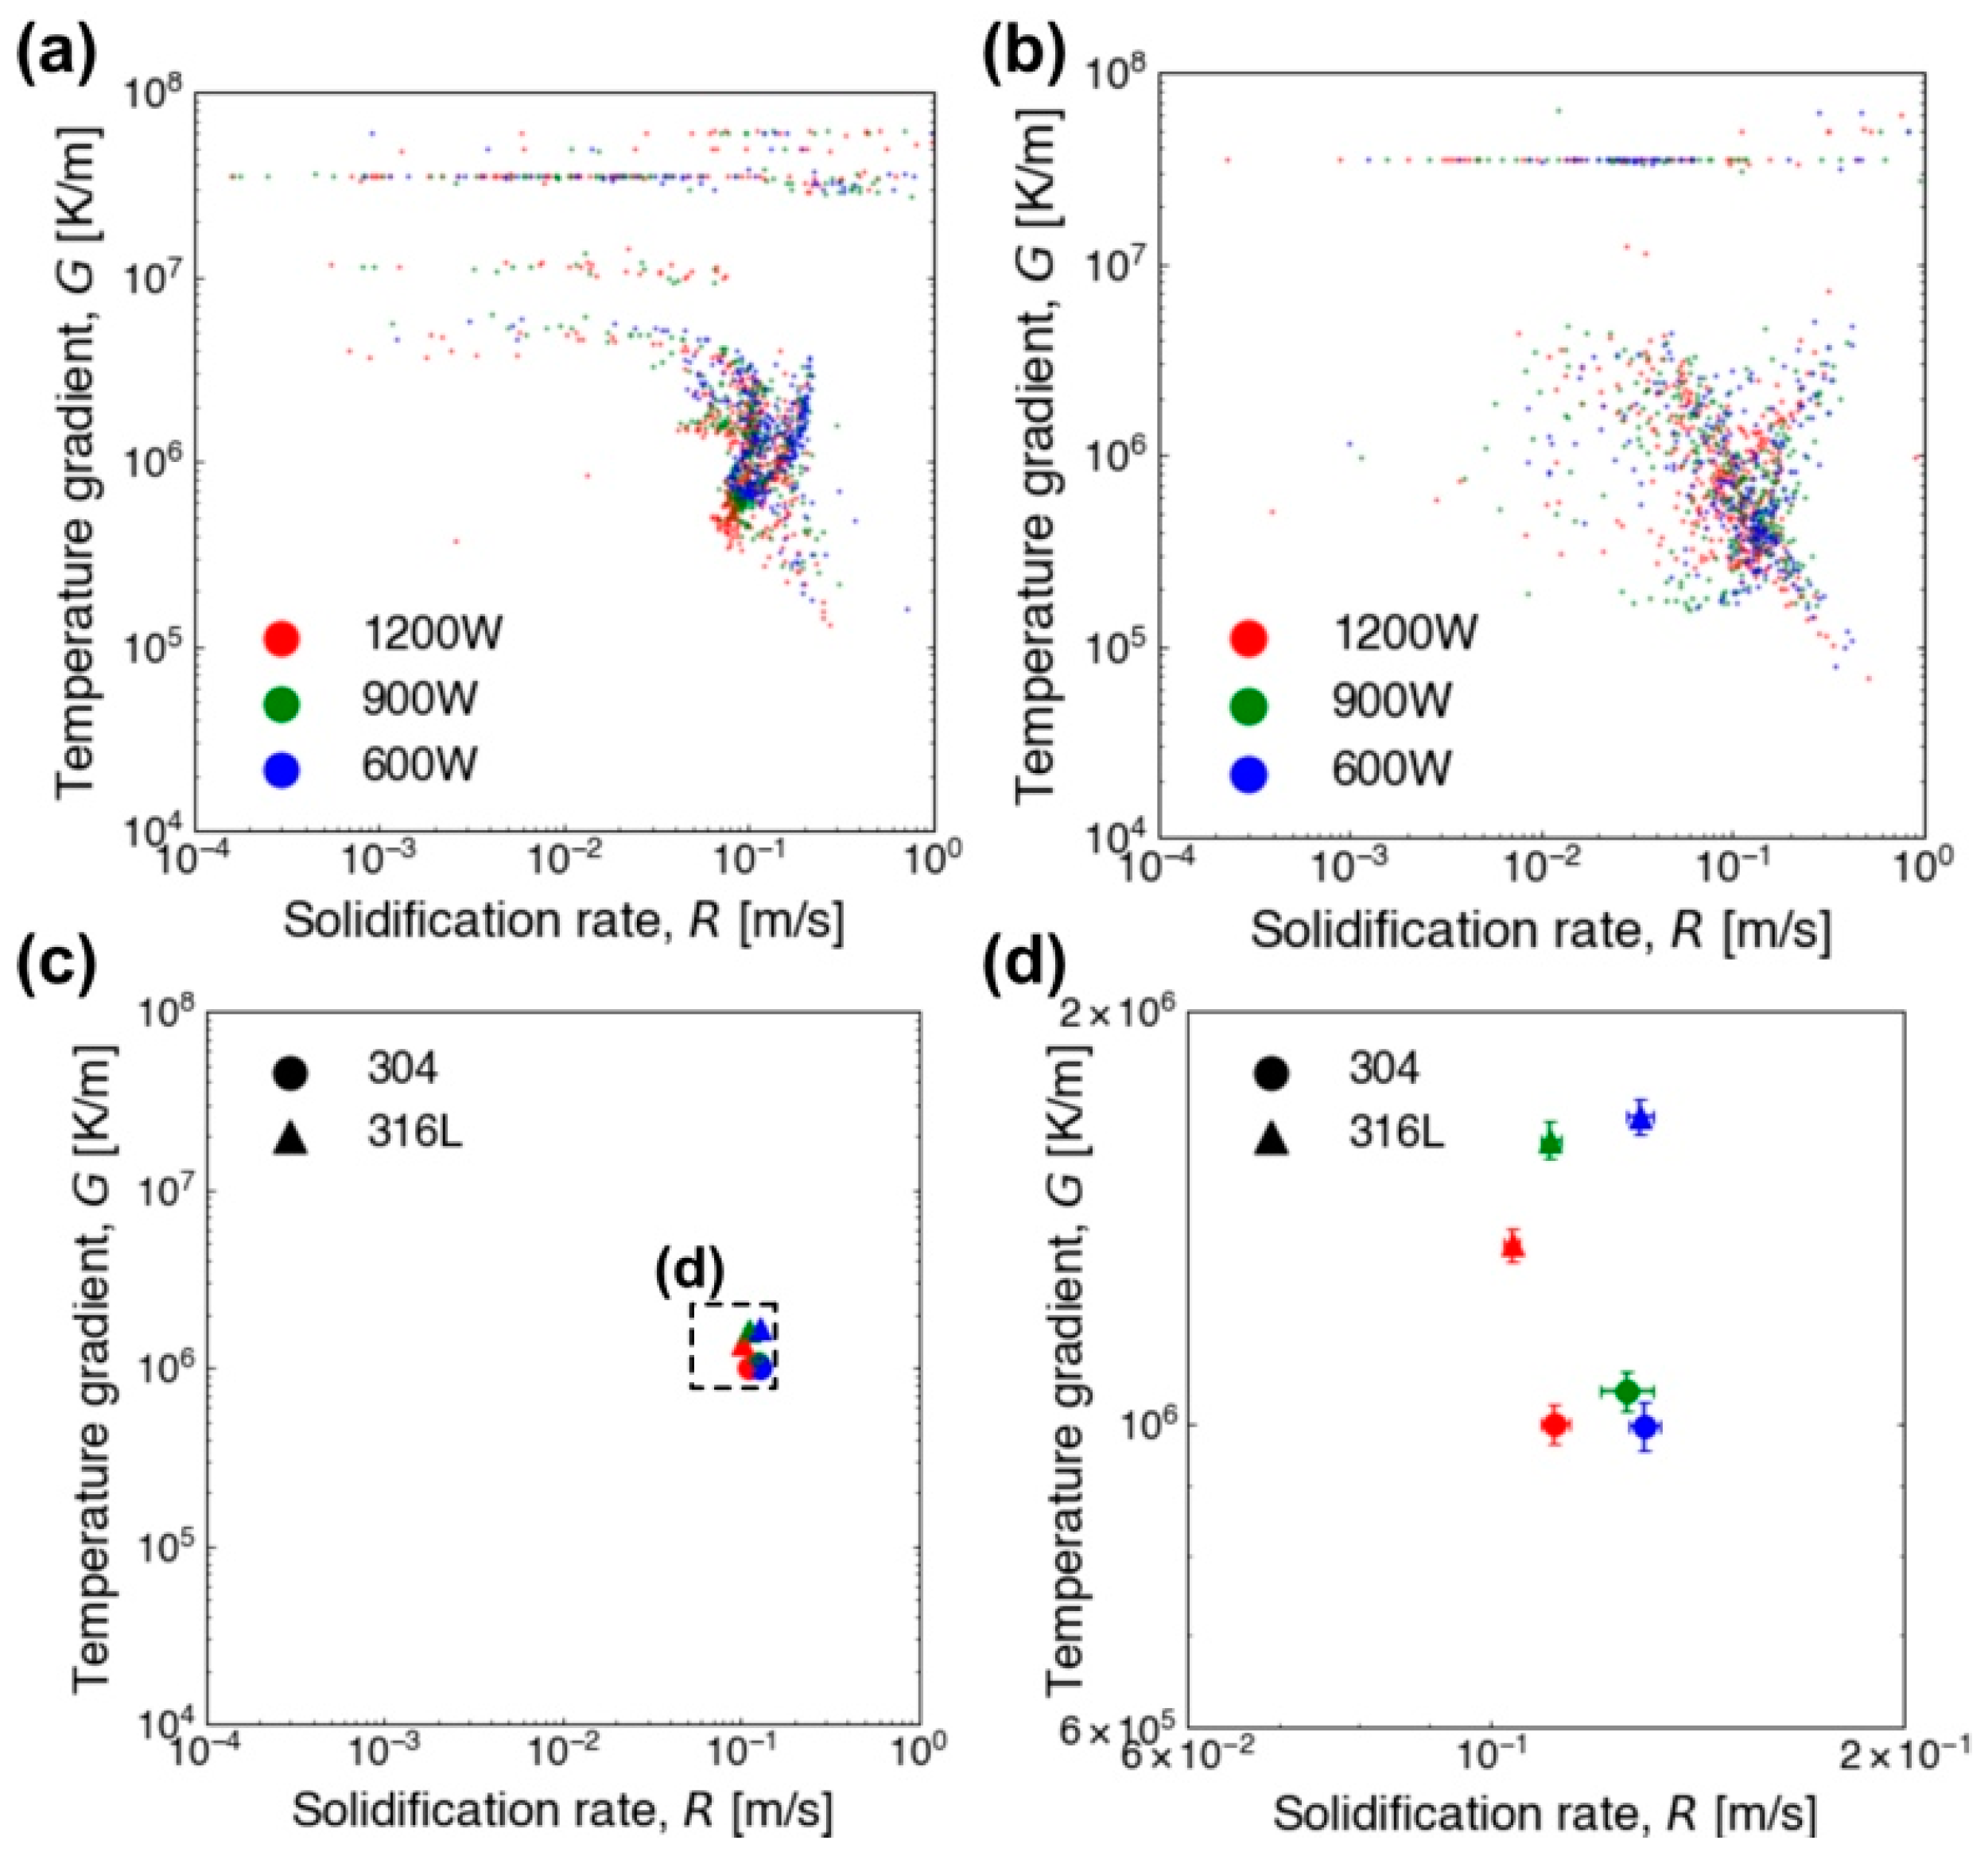
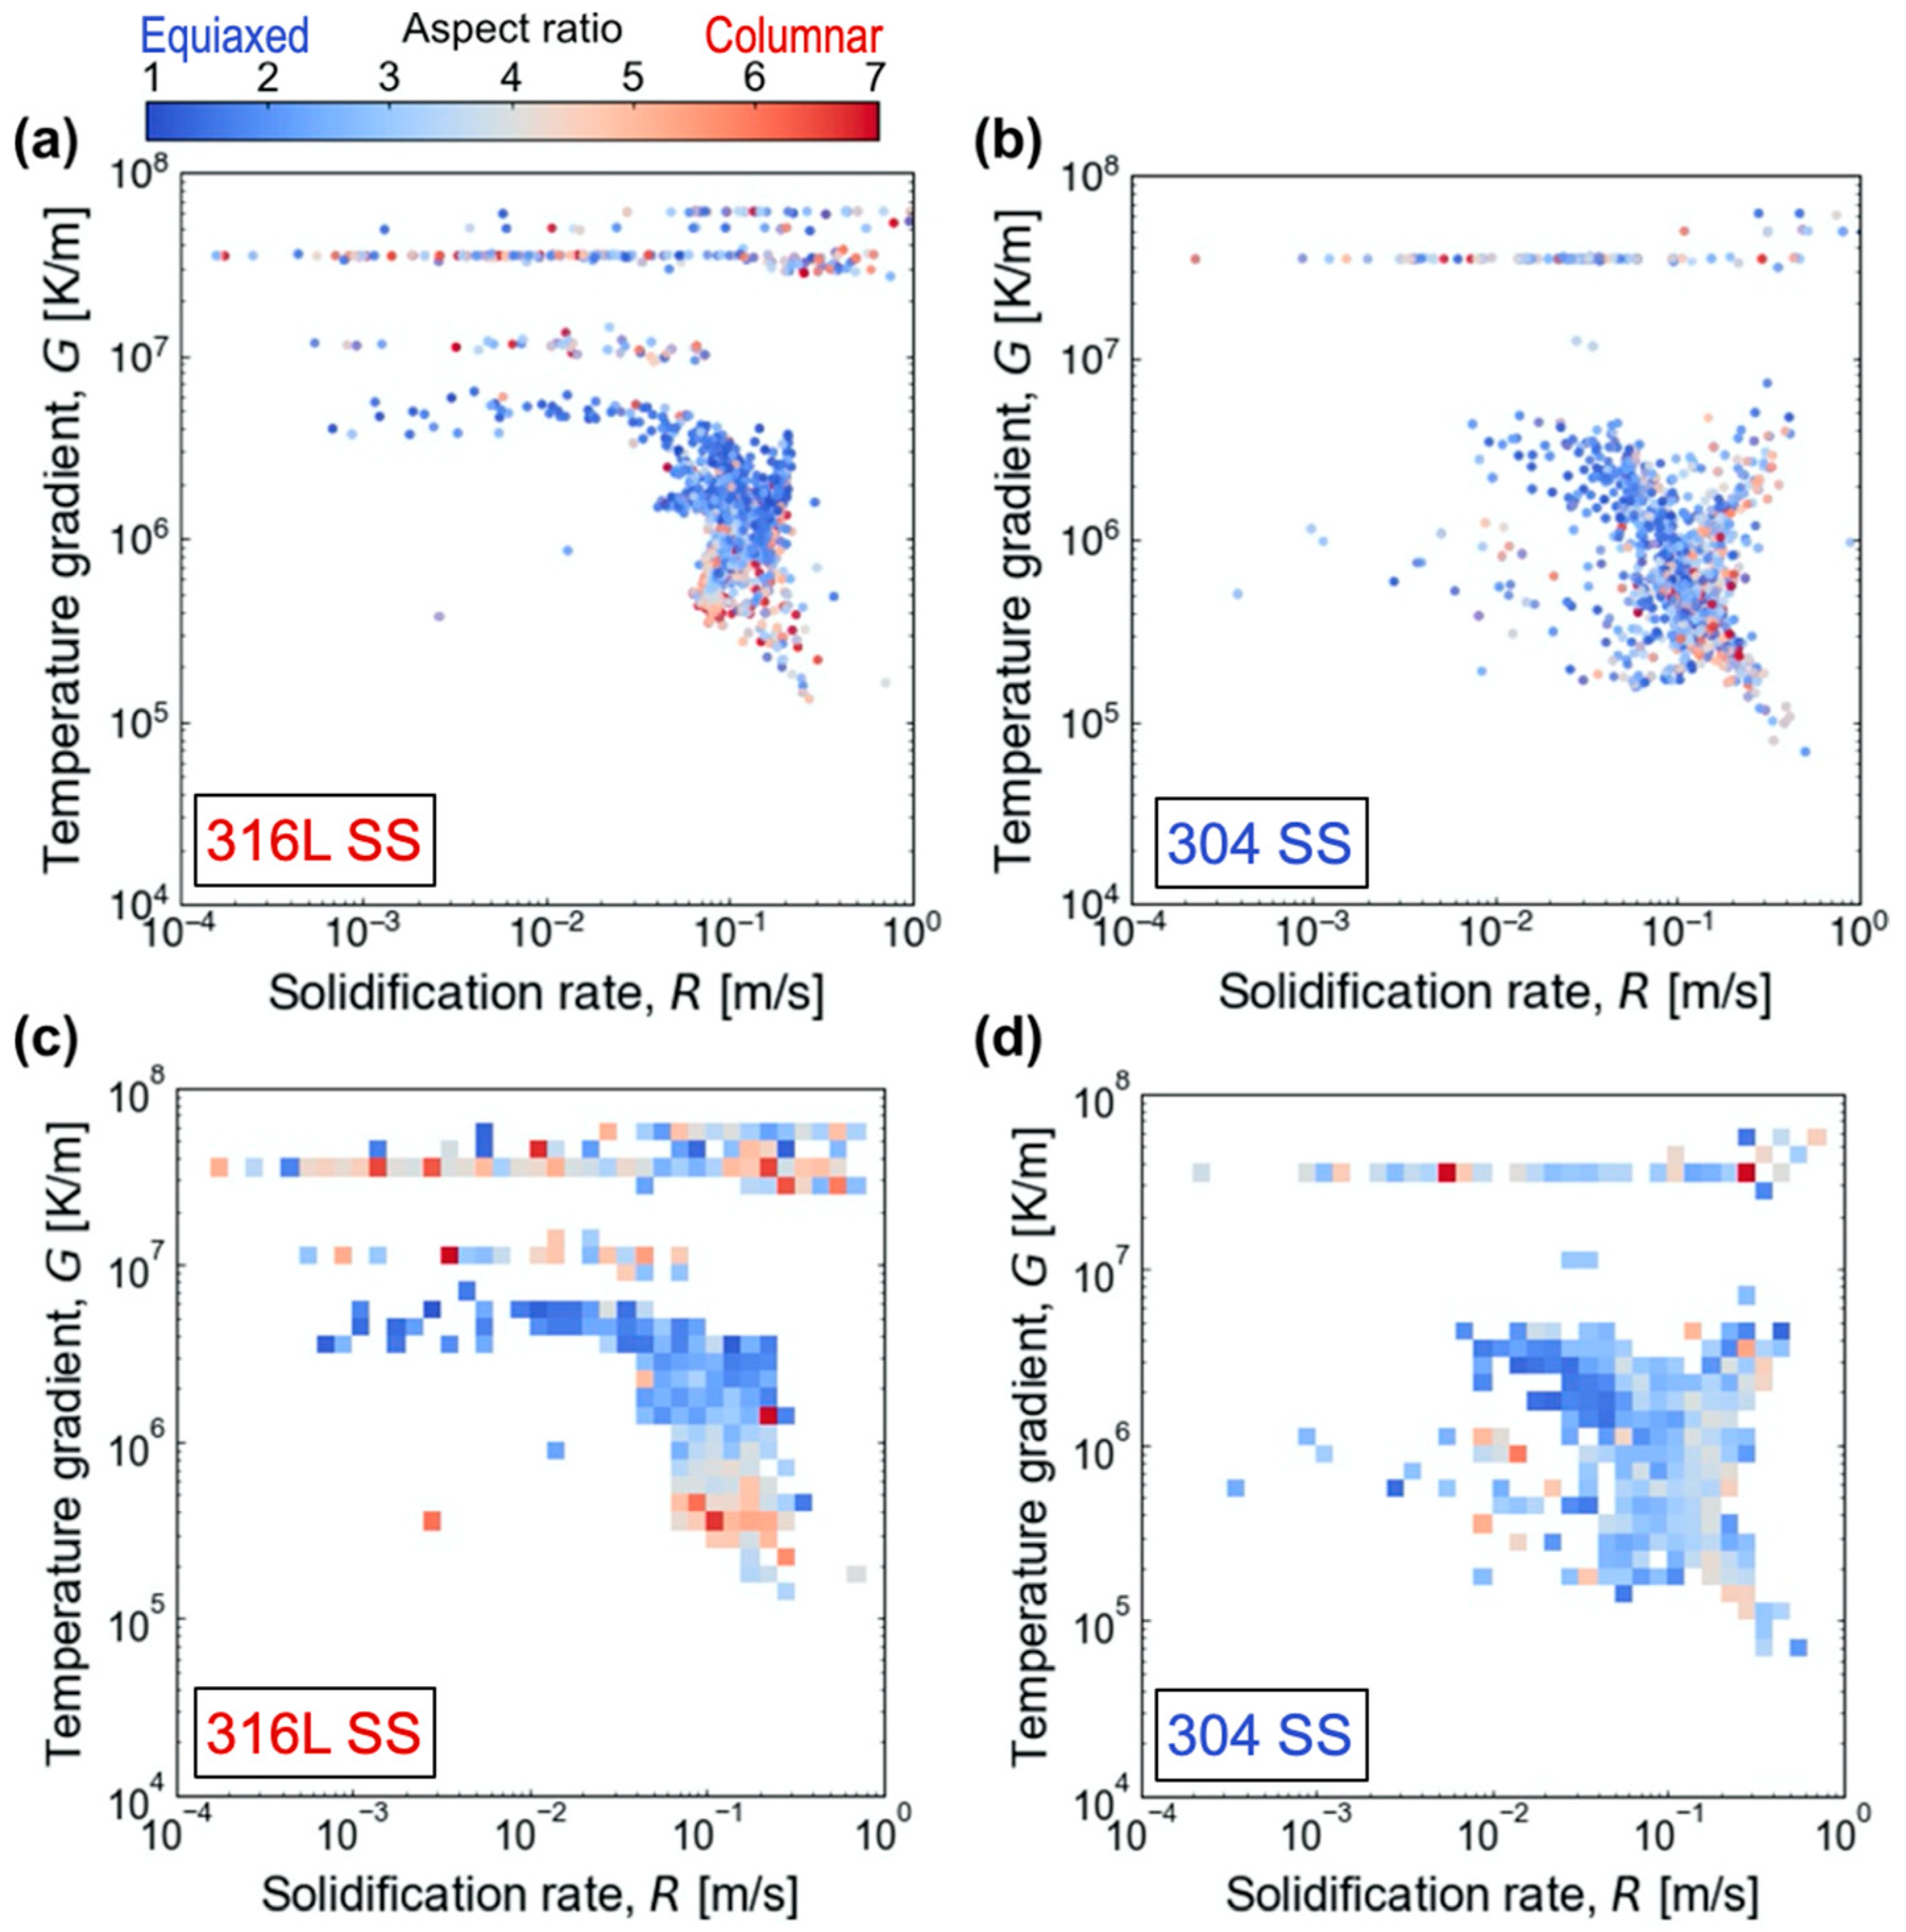
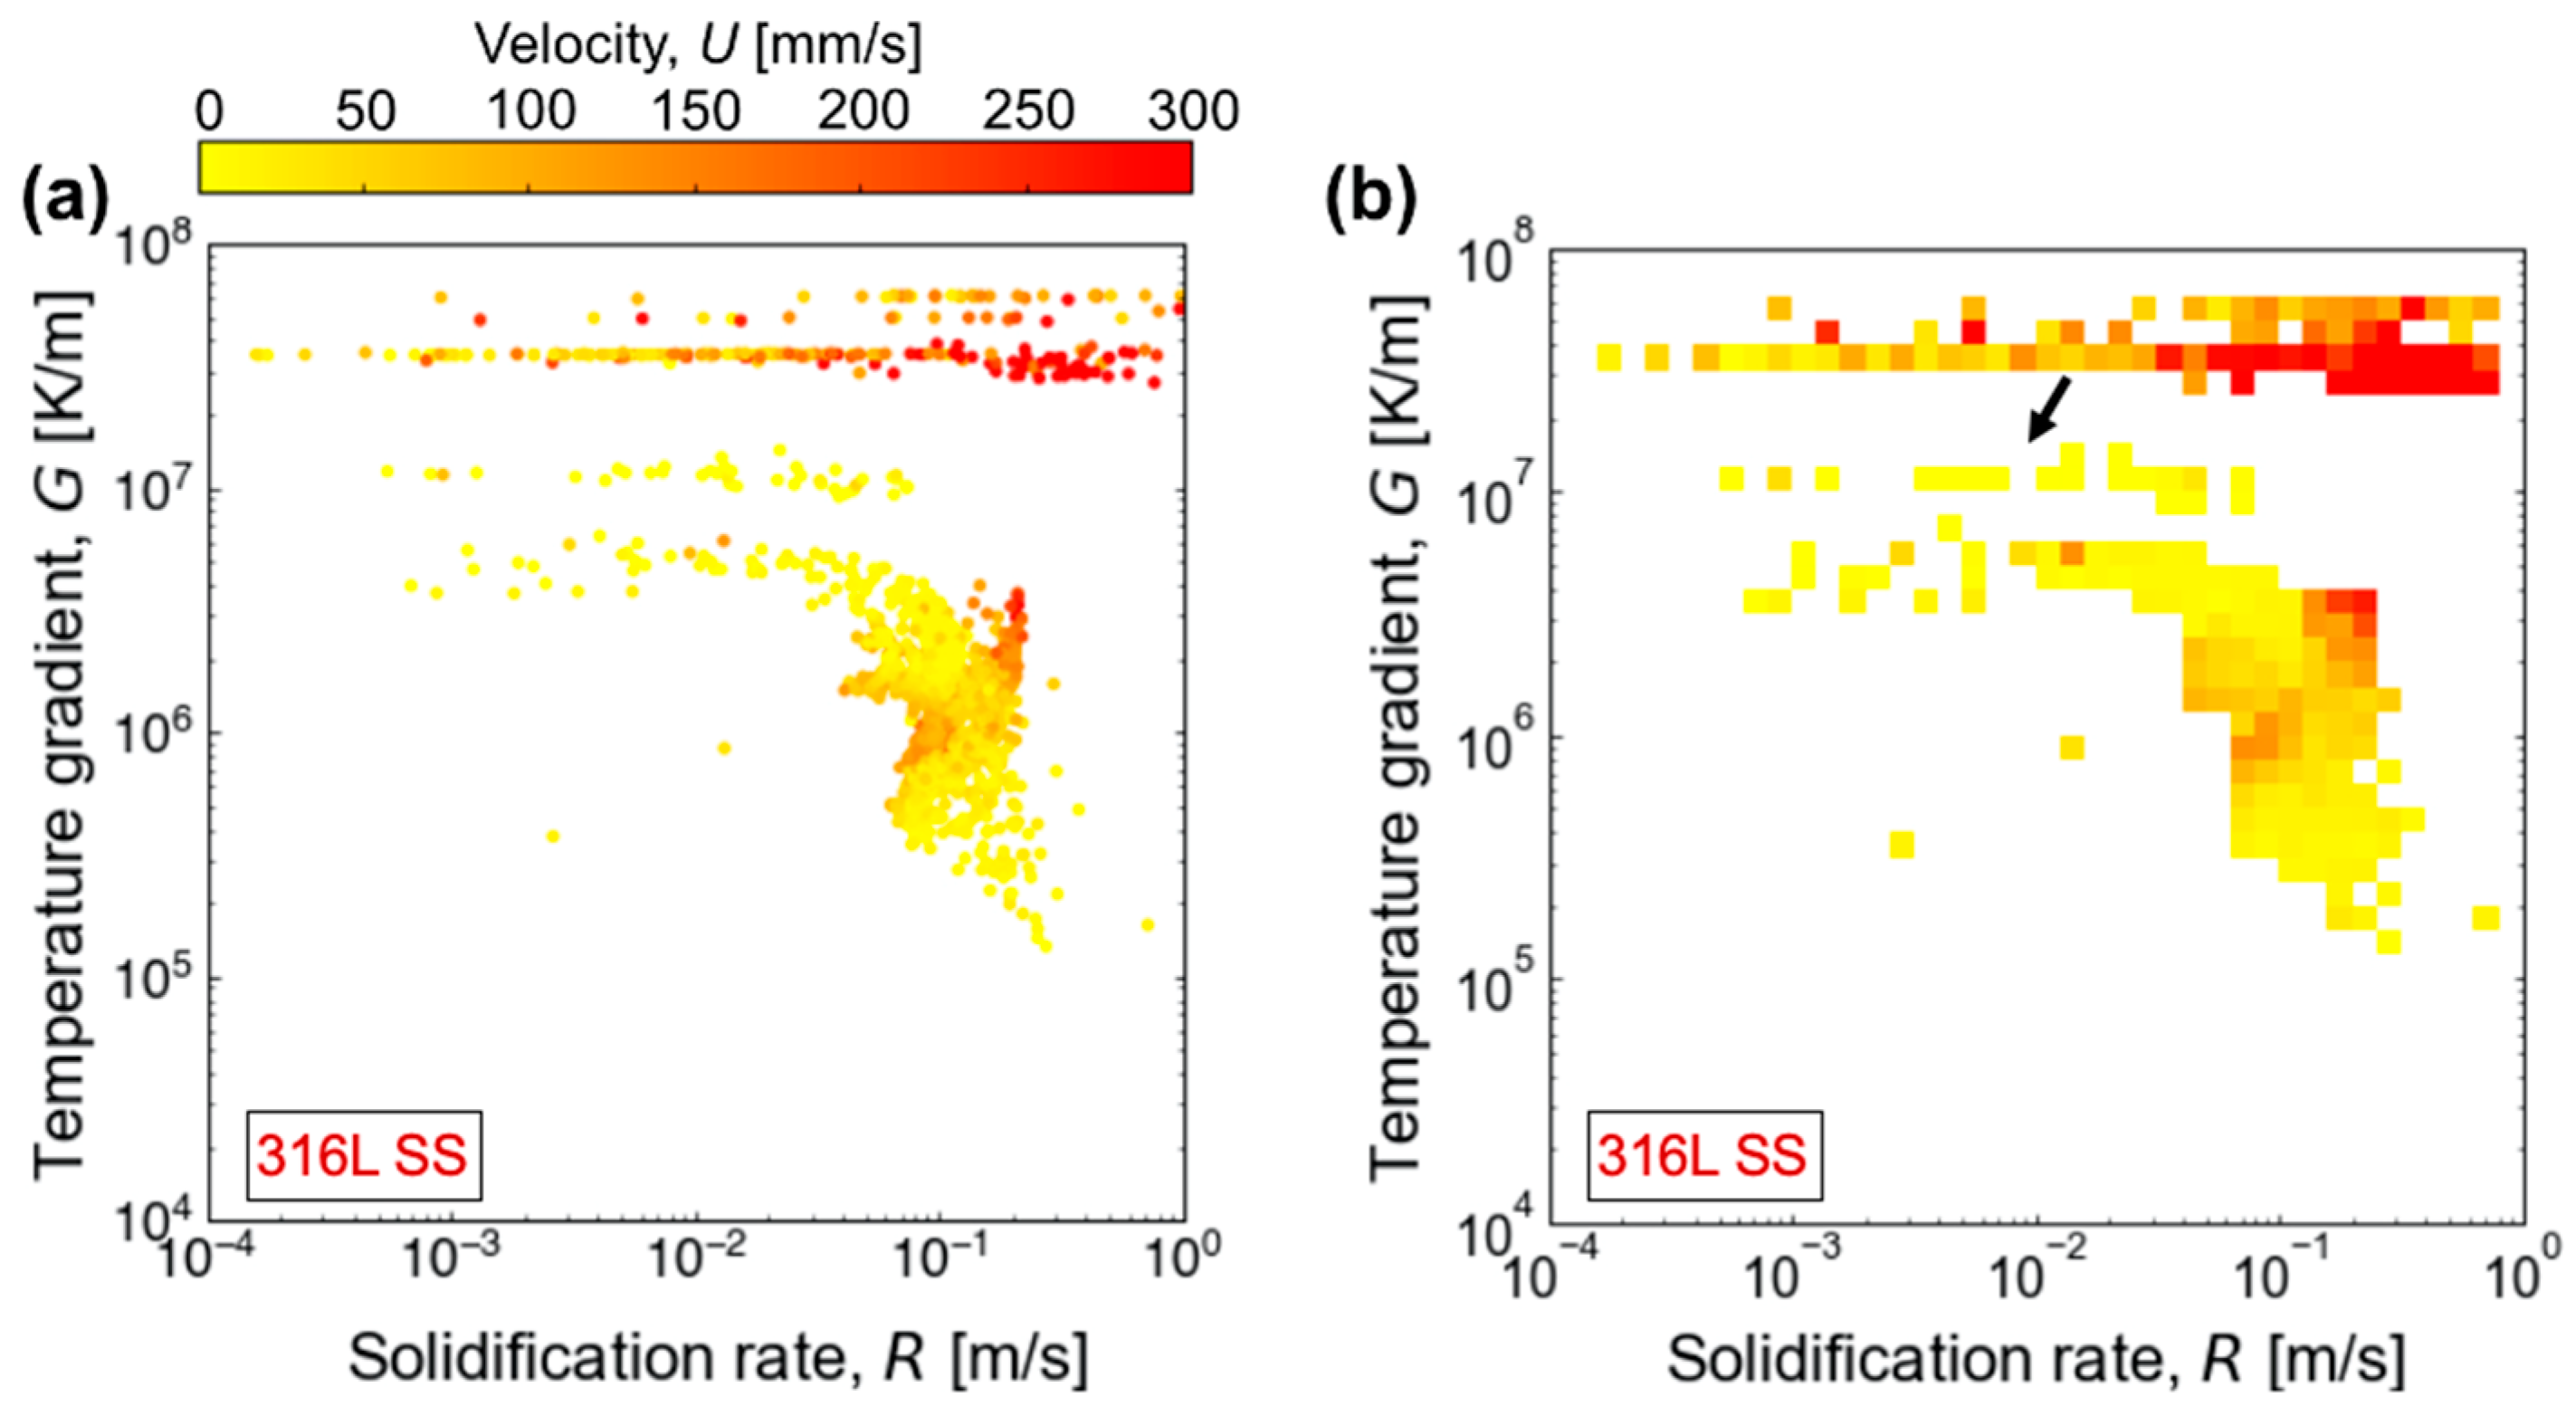
3.3. Relationships between Microstructures and Solidification Conditions

Each crystalline grain formed in melt regions corresponds with solidification conditions obtained by CtFD simulations. All the solidification conditions are plotted in the GR space colored by the aspect ratio, as shown in Figure 11a,b. For a better visual understanding, average aspect ratios were calculated for each mesh of the double logarithmic grid using the points of solidification condition within each mesh as shown in Figure 11c,d.
Only equiaxed crystalline grains were formed in the 304 SS under the whole range of solidification conditions obtained in this study. On the other hand, equiaxed crystalline grains appeared in the high G region, whereas columnar crystals appear in the low G region in the GR map of 316L SS. This relationship between the microstructures and solidification conditions is contrary to that predicted by the CET criterion.
In the welding process [22,23], equiaxed grains are reported to be formed owing to the effect of fragmentations of dendrites and the transport of the fragments. The same formation mechanism of equiaxed grain was reported to occur in the AM process [18]. Therefore, solidification conditions of 316L SS are plotted in GR space colored by flow velocities, as shown in Figure 12. The average flow velocities were also calculated for each mesh of the double logarithmic grid. There is a region solidified under a high flow velocity and is essentially the same as the region in which equiaxed crystalline grains appeared.
Figure 13 shows the cross-sectional EBSD IPF-Z map of the bead solidified under P = 1200 W and V = 100 mm/s, and the corresponding flow velocity distribution map. Equiaxed crystalline grains were observed near the outmost part of the melt region. It is indicated that such regions were solidified under the condition with high flow velocities. These results also suggest that equiaxed crystals are formed owing to a high velocity of fluid flow even in the PBF-AM process, even though the G and the R are in the range for columnar grain formation. A similar trend has been reported for Co–Cr–Mo alloy [18].
As shown in Figure 11, columnar crystal grains were formed in 316L SS, even in the ranges of G and R for the formation of equiaxed crystals grains formed in 304 SS. The CET line of 316L SS is suggested to be shifted downward significantly from that of 304 SS. According to Equation (1), the downward shift of the CET line can be caused by the decrease in the nucleation frequency and/or the decrease in the difference between solidus–liquidus temperature, ∆T0. Table 3 compares the solidus and liquidus temperatures of 316L and 304 SSs. The ∆T0 of 316L and 304 SSs are 26.58 K and 101.90 K, respectively.
Thus, it is suggested that the CET line for 316L SS shifts toward lower G from that of 304 SS because of the smaller ∆T0 of 316L SS than that of 304 SS. Moreover, the N0 for 316L SS is expected to be lower than that for 304 SS due to the much lower concentration of impurity to form compounds, such as carbides, which can be the heterogeneous nucleation site. These are the possible reason for the formation of columnar grains even in low-G region.
Figure 14a compares the solidification conditions of 316L and 304 SSs except for those for the surface regions, which were evaluated by the CtFD. CET criteria was calculated by Equation (1) using the values of ΔT0 evaluated from the equilibrium phase diagram and assumed values of a and N0. In the case of 304 SS, equiaxed grains were formed under almost all of the solidification conditions, as shown in Figure 11. Therefore, the solidification conditions indicated by the points are supposed to be within the equiaxed region, i.e., the region in which the G is lower than that for the CET criterion. The blue solid line in Figure 14a indicates the CET criterion calculated by using ΔT0 = 101.90 K (the value for 304 SS), N0 = 2.0 × 10¹² m−3, n = 3.4, and a = 1.25 × 10⁴. The values of N0 and a were determined so as to locate the line of CET criteria immediately above most of the blue points for 304 SS tentatively. The same line is drawn in Figure 14b and compared to the plot of solidification condition for 316L SS colored by the aspect ratio of grains on the basis of Figure 11c. In contrast to the case of 304 SS, columnar grains were formed in 316L SS even for the cases with the lowest G and the highest R. The black dotted lines in both Figure 14a,b indicate the CET criterion calculated by replacing the value of ΔT0 from 101.90 for 304 SS with 26.58 K for 316L SS. The red dashed line indicates the CET criterion calculated by assuming a smaller nuclei density of N0 = 2.0 × 10⁹ m−3, with the relations between the solidification condition and the microstructures of 316L SS. This analysis also suggests that both ΔT0 and N0 shift the CET criterion toward lower G. Apparently, the black dotted line separates the region where columnar grains are frequently observed from that where equiaxed grains are. However, it should be noted that the tendency of solidification conditions for the formation of equiaxed grain in 316L SS is opposite to that for the conventional CET. This is probably due to the high fluid-flow velocity. Therefore, it is suggested that the inverse CET is caused by the high fluid velocity. Thus, the difference in microstructure between 316L and 304 SSs cannot be attributed to only the differences in ΔT0 and N0.

4. Conclusions

We have investigated the solidification microstructures of 316L and 304 SSs induced by electron-beam irradiation for PBF-EB, and evaluated the solidification conditions at the solid/liquid interface using a CtFD simulation.
The width, height, and depth of melt track induced by electron-beam irradiation increased as the beam power increased. Under all process conditions, melt regions formed in 316L SS were narrower and deeper than those in 304 SS. EBSD analysis revealed that the average grain size in 316L SS was larger than that in 304 SS under all process conditions, while their average aspect ratios were nearly the same for 316L and 304 SSs. It was found that, contrary to the CET criterion, equiaxed grains were frequently formed under high G conditions in 316L SS. CtFD simulation revealed that there was a fluid flow with a velocity of up to approximately 400 mm/s, and suggested that equiaxed grains are formed owing to the effect of fragmentations of dendrites and the transport of the fragments. In 316L SS, columnar crystals were formed even in the case where the G and R were within the range of equiaxed crystals’ grain formation in 304 SS. It is suggested that the CET line shifts downward because of the smaller ∆T0 of 316L SS compared to that of 304 SS.
In this study, it was found that solidification microstructures formed in the PBF-EB process are intricately related to various factors such as temperature gradient, solidification rate, and flow velocity. The machine learning-assisted analysis is currently underway.

Author Contributions

Conceptualization, Y.K. and T.N.; methodology, Y.M., M.O. and Y.K.; software, Y.M., M.O. and Y.K.; validation, Y.M., M.O. and Y.K.; investigation, Y.M., M.O. and Y.K.; data curation, Y.M., M.O. and Y.K.; writing—original draft preparation, Y.M., M.O. and Y.K.; writing—review and editing, M.O. and Y.K; supervision, Y.K. and T.N.; project administration, Y.K. and T.N.; funding acquisition, Y.K. and T.N. All authors have read and agreed to the published version of the manuscript.

Funding

This work was supported by JSPS KAKENHI Grant Number 17H01329 and by Cabinet Office, Government of Japan, Cross-ministerial Strategic Innovation Promotion Program (SIP), “Materials Integration for Revolutionary Design System of Structural Materials”, (funding agency: The Japan Science and Technology Agency).

Acknowledgments

We would like to thank H. Kawabata for technical support for sample preparations and electron beam irradiation experiments.

Conflicts of Interest

The authors declare no conflict of interest.

References

  1. Sow, M.C.; De Terris, T.; Castelnau, O.; Hamouche, Z.; Coste, F.; Fabbro, R.; Peyre, P. Influence of beam diameter on Laser Powder Bed Fusion (L-PBF) process. Addit. Manuf. 2020, 36, 101532. [Google Scholar] [CrossRef]
  2. Simmons, J.C.; Chen, X.; Azizi, A.; Daeumer, M.A.; Zavalij, P.Y.; Zhou, G.; Schiffres, S.N. Influence of processing and microstructure on the local and bulk thermal conductivity of selective laser melted 316L stainless steel. Addit. Manuf. 2020, 32, 100996. [Google Scholar] [CrossRef]
  3. Dryepondt, S.; Nandwana, P.; Fernandez-Zelaia, P.; List, F. Microstructure and high temperature tensile properties of 316L fabricated by laser powder-bed fusion. Addit. Manuf. 2021, 37, 101723. [Google Scholar] [CrossRef]
  4. Sun, S.H.; Ishimoto, T.; Hagihara, K.; Tsutsumi, Y.; Hanawa, T.; Nakano, T. Excellent mechanical and corrosion properties of austenitic stainless steel with a unique crystallographic lamellar microstructure via selective laser melting. Scr. Mater. 2019, 159, 89–93. [Google Scholar] [CrossRef]
  5. Tsutsumi, T.; Ishimoto, T.; Oishi, T.; Manaka, T.; Chen, P.; Ashida, M.; Doi, K.; Katayama, H.; Hanawa, T.; Nakano, T. Crystallographic textureand grain boundary density-independent improvement of corrosion resistance in austenitic 316L stainless steel fabricated via laser powder bed fusion. Addit. Manuf. 2021, 45, 102066. [Google Scholar]
  6. Ishimoto, T.; Wu, S.; Ito, Y.; Sun, S.-H.; Amano, H.; Nakano, T. Crystallographic Orientation Control of 316L Austenitic Stainless Steel via Selective Laser Melting. ISIJ Int. 2020, 60, 1758–1764. [Google Scholar] [CrossRef] [Green Version]
  7. Ishimoto, T.; Hagihara, K.; Hisamoto, K.; Sun, S.H.; Nakano, T. Crystallographic texture control of beta-type Ti–15Mo–5Zr–3Al alloy by selective laser melting for the development of novel implants with a biocompatible low Young’s modulus. Scr. Mater. 2017, 132, 34–38. [Google Scholar] [CrossRef]
  8. Ding, X.; Koizumi, Y.; Wei, D.; Chiba, A. Effect of process parameters on melt pool geometry and microstructure development for electron beam melting of IN718: A systematic single bead analysis study. Addit. Manuf. 2019, 26, 215–226. [Google Scholar] [CrossRef]
  9. Karayagiz, K.; Johnson, L.; Seede, R.; Attari, V.; Zhang, B.; Huang, X.; Ghosh, S.; Duong, T.; Karaman, I.; Elwany, A.; et al. Finite interface dissipation phase field modeling of Ni–Nb under additive manufacturing conditions. Acta Mater. 2020, 185, 320–339. [Google Scholar] [CrossRef] [Green Version]
  10. Kirka, M.M.; Lee, Y.; Greeley, D.A.; Okello, A.; Goin, M.J.; Pearce, M.T.; Dehoff, R.R. Strategy for Texture Management in Metals Additive Manufacturing. JOM 2017, 69, 523–531. [Google Scholar] [CrossRef] [Green Version]
  11. Babu, S.S.; Raghavan, N.; Raplee, J.; Foster, S.J.; Frederick, C.; Haines, M.; Dinwiddie, R.; Kirka, M.K.; Plotkowski, A.; Lee, Y.; et al. Additive Manufacturing of Nickel Superalloys: Opportunities for Innovation and Challenges Related to Qualification. Metall. Mater. Trans. A 2018, 49, 3764–3780. [Google Scholar] [CrossRef]
  12. Ding, X.; Koizumi, Y.; Aoyagi, K.; Kii, T.; Sasaki, N.; Hayasaka, Y.; Yamanaka, K.; Chiba, A. Microstructural control of alloy 718 fabricated by electron beam melting with expanded processing window by adaptive offset method. Mater. Sci. Eng. A 2019, 764, 138058. [Google Scholar] [CrossRef]
  13. Gotterbarm, M.R.; Rausch, A.M.; Körner, C. Fabrication of Single Crystals through a µ-Helix Grain Selection Process during Electron Beam Metal Additive Manufacturing. Metals 2020, 10, 313. [Google Scholar] [CrossRef] [Green Version]
  14. Hunt, J.D.D. Steady state columnar and equiaxed growth of dendrites and eutectic. Mater. Sci. Eng. 1984, 65, 75–83. [Google Scholar] [CrossRef]
  15. Kurz, W.; Bezencon, C.; Gäumann, M. Columnar to equiaxed transition in solidification processing. Sci. Technol. Adv. Mater. 2001, 2, 185–191. [Google Scholar] [CrossRef]
  16. Bontha, S.; Klingbeil, N.W.; Kobryn, P.A.; Fraser, H.L. Effects of process variables and size-scale on solidification microstructure in beam-based fabrication of bulky 3D structures. Mater. Sci. Eng. A 2009, 513–514, 311–318. [Google Scholar] [CrossRef]
  17. Schoinochoritis, B.; Chantzis, D.; Salonitis, K. Simulation of metallic powder bed additive manufacturing processes with the finite element method: A critical review. Proc. Instit. Mech. Eng. Part B J. Eng. Manuf. 2017, 231, 96–117. [Google Scholar] [CrossRef]
  18. Zhao, Y.; Koizumi, Y.; Aoyagi, K.; Wei, D.; Yamanaka, K.; Chiba, A. Molten pool behavior and effect of fluid flow on solidification conditions in selective electron beam melting (SEBM) of a biomedical Co-Cr-Mo alloy. Addit. Manuf. 2019, 26, 202–214. [Google Scholar] [CrossRef]
  19. Tang, C.; Tan, J.L.; Wong, C.H. A numerical investigation on the physical mechanisms of single track defects in selective laser melting. Int. J. Heat Mass Transf. 2018, 126, 957–968. [Google Scholar] [CrossRef]
  20. Technical Data for Iron. Available online: http://periodictable.com/Elements/026/data.html (accessed on 15 June 2021).
  21. Raghavan, N.; Dehoff, R.; Pannala, S.; Simunovic, S.; Kirka, M.; Turner, J.; Carlson, N.; Babu, S.S. Numerical modeling of heat-transfer and the influence of process parameters on tailoring the grain morphology of IN718 in electron beam additive manufacturing. Acta Mater. 2016, 112, 303–314. [Google Scholar] [CrossRef] [Green Version]
  22. Hellawell, A.; Liu, S.; Lu, S.Z. Dendrite fragmentation and the effects of fluid flow in castings. JOM 1997, 49, 18–20. [Google Scholar] [CrossRef]
  23. Campanella, T.; Charbon, C.; Rappaz, M. Grain refinement induced by electromagnetic stirring: A dendrite fragmentation criterion. Metall. Mater. Trans. A 2004, 35, 3201–3210. [Google Scholar] [CrossRef]
Figure 1. Typical examples of (a) a surface laser microscope image and (b) corresponding height map of 304 SS. The electron-beam power, P, and scanning speed, V, are 1200 W and 100 mm/s, respectively.
Crystals 11 00856 g001
Figure 2. A typical example of a cross-sectional SEM image taken from the electron-beam irradiated region of 304 SS. P and V are 900 W and 100 mm/s, respectively. The dashed line indicates the fusion line.
Crystals 11 00856 g002
Figure 3. (a) Width, (b) height, and (c) depth of melt tracks formed on 316L and 304 SSs as a function of beam power. The width and the height were measured by laser microscope and the depths were measured by cross-sectional SEM observation.
Crystals 11 00856 g003
Figure 4. SEM electron backscatter diffraction (EBSD) IPF orientation maps on the transversal cross section of (a1a3) 316L and (b1b3) 304 SS samples irradiated with electron beams under V = 100 mm/s and various beam power conditions: (a1,b1) P = 600 W, (a2,b2) P = 900 W, and (a3,b3) P = 1200 W.
Crystals 11 00856 g004
Figure 5. (a) Average grain size and (b) their aspect ratio evaluated from EBSD IPF orientation maps taken from the electron-beam irradiated regions in 316L and 304 SS samples.
Crystals 11 00856 g005
Figure 6. Snapshot of CtFD simulation of electron-beam irradiation on 316L SS with process parameters of P = 1200 W and V = 100 mm/s. (a) Bird’s eye view, (b) side view on the vertical cross section along the center of the scanning line. The color indicates the temperature.
Crystals 11 00856 g006
Figure 7. Comparison of melt regions in (a) experimental SEM image and (b) CtFD simulation for the case with a beam diameter of 1200 µm, absorption rates of 0.8, beam power (P) of 1200 W, and beam scanning speed (V) of 100 mm/s.
Crystals 11 00856 g007
Figure 8. CtFD simulated cross-sectional melt pools of 316L SS colored by (a1c1) a solidification time, (a2c2) a temperature gradient, G, (a3c3) a solidification rate, R, and (a4c4) a flow velocity, U. The beam powers were (a1a4) P = 600 W, (b1b4) P = 900 W, and (c1c4) P = 1200 W.
Crystals 11 00856 g008
Figure 9. CtFD simulated cross-sectional melt pools of 304 SS colored by (a1c1) a solidification time, (a2c2) a temperature gradient, G, (a3c3) a solidification rate, R, and (a4c4) a flow velocity, U. The beam powers were (a1a4) P = 600 W, (b1b4) P = 900 W, and (c1c4) P = 1200 W.
Crystals 11 00856 g009
Figure 10. GR plots of (a) 316L and (b) 304 SSs colored by the beam power. (c) Average solidification conditions of each process parameter, and (d) magnified picture of (c).
Crystals 11 00856 g010
Figure 11. GR plots of (a) 316L and (b) 304 SSs colored by an aspect ratio of crystalline grains. Average aspect ratios of (c) 316L and (d) 304 SSs calculated for each mesh of the double logarithmic grid using the points of solidification condition within each mesh.
Crystals 11 00856 g011
Figure 12. (a) GR plot of 316L SS colored by a fluid velocity. (b) The average fluid velocity of 316L SS calculated for each mesh of the double logarithmic grid using the points of solidification condition within each mesh.
Crystals 11 00856 g012
Figure 13. Comparison of (a) solidification microstructure (EBSD IPF map) of melt region in 316L SS formed by scanning electron beam and (b) a corresponding snapshot of CtFD simulation colored by fluid velocity.
Crystals 11 00856 g013
Figure 14. Comparison between solidification conditions (dots and squares) evaluated by CtFD simulation and CET criteria (lines) calculated by Equation (1) with the values of ΔT0 for 304 SS and 316L SS and those of assumed N0. (a) dots are colored by the type of steel 304 SS (blue) and 316L SS (red). (b) each square is colored by the average aspect ratio of grains in 316L SS for the range of solidification condition indicated by its area.
Crystals 11 00856 g014
Table 1. Electron-beam irradiation conditions.
Line Energy, Eline (J/mm)Scanning Speed, V (mm/s)
10030010003000
Beam power, P (W)600620.60.2
900930.90.3
12001241.20.4
Table 2. Parameters used in CtFD simulations.
NameSymbolValue for 316L SSValue for 304 SS
Density at 298.15 Kρ (kg/m3)8000 a7892.77 a
Liquidus temperatureTL (K)1710.26 a1721.05 a
Solidus temperatureTS (K)1683.68 a1619.15 a
Viscosity at TLη (g/m∙s)7.83 a7.35 a
Specific heat at 298.15 KCP (J/kg∙K)440 a453.66 a
Thermal conductivity at 298.15 Kλ (W/m∙K)13.58 a15.066 a
Surface tension at TLγL (J/m2)1.80216 a1.78225 a
Temperature coefficient of surface tensiondγL/dT
(J/m2∙K)
−3.6616 × 10⁻⁴ a−3.5992 × 10⁻⁴ a
EmissivityΕ0.27 [19]
Stefan–Boltzmann constantσ (W/m2∙K4)5.67 × 10−8 [19]
Heat of vaporizationΔHLV (J/kg)6.21 × 10⁶ [20]
Vaporization temperatureTV (K)3134 [20]
a Calculated using JMatPro v11 software.
Table 3. Liquidus and solidus temperatures of 316L SS and 304 SS.
NameSymbolValue for 316L SSValue for 304 SS
Liquidus temperatureTL1710.26 K a1721.05 K a
Solidus temperatureTS1683.68 K a1619.15 K a
Temperature difference between TL and TSΔT026.58 K101.90 K
a Calculated using JMatPro v11 software.
Publisher’s Note: MDPI stays neutral with regard to jurisdictional claims in published maps and institutional affiliations.

