
Experimental Analysis of Changes in Cement Mortar Containing Oil Palm Boiler Clinker Waste at Elevated Temperatures in Different Cooling Conditions


Abstract
:1. Introduction
2. Materials and Methods
2.1. Materials
2.2. Mortar Mixtures and Sample Preparation
2.3. Heating Pattern
2.4. Test of the Compressive Strength of Hardened Mortars
2.5. Microstructural Property Determination
2.5.1. Microstructural Investigation
2.5.2. Mineral Composition Determination
2.6. Thermal Conductivity Determination
3. Results and Discussion
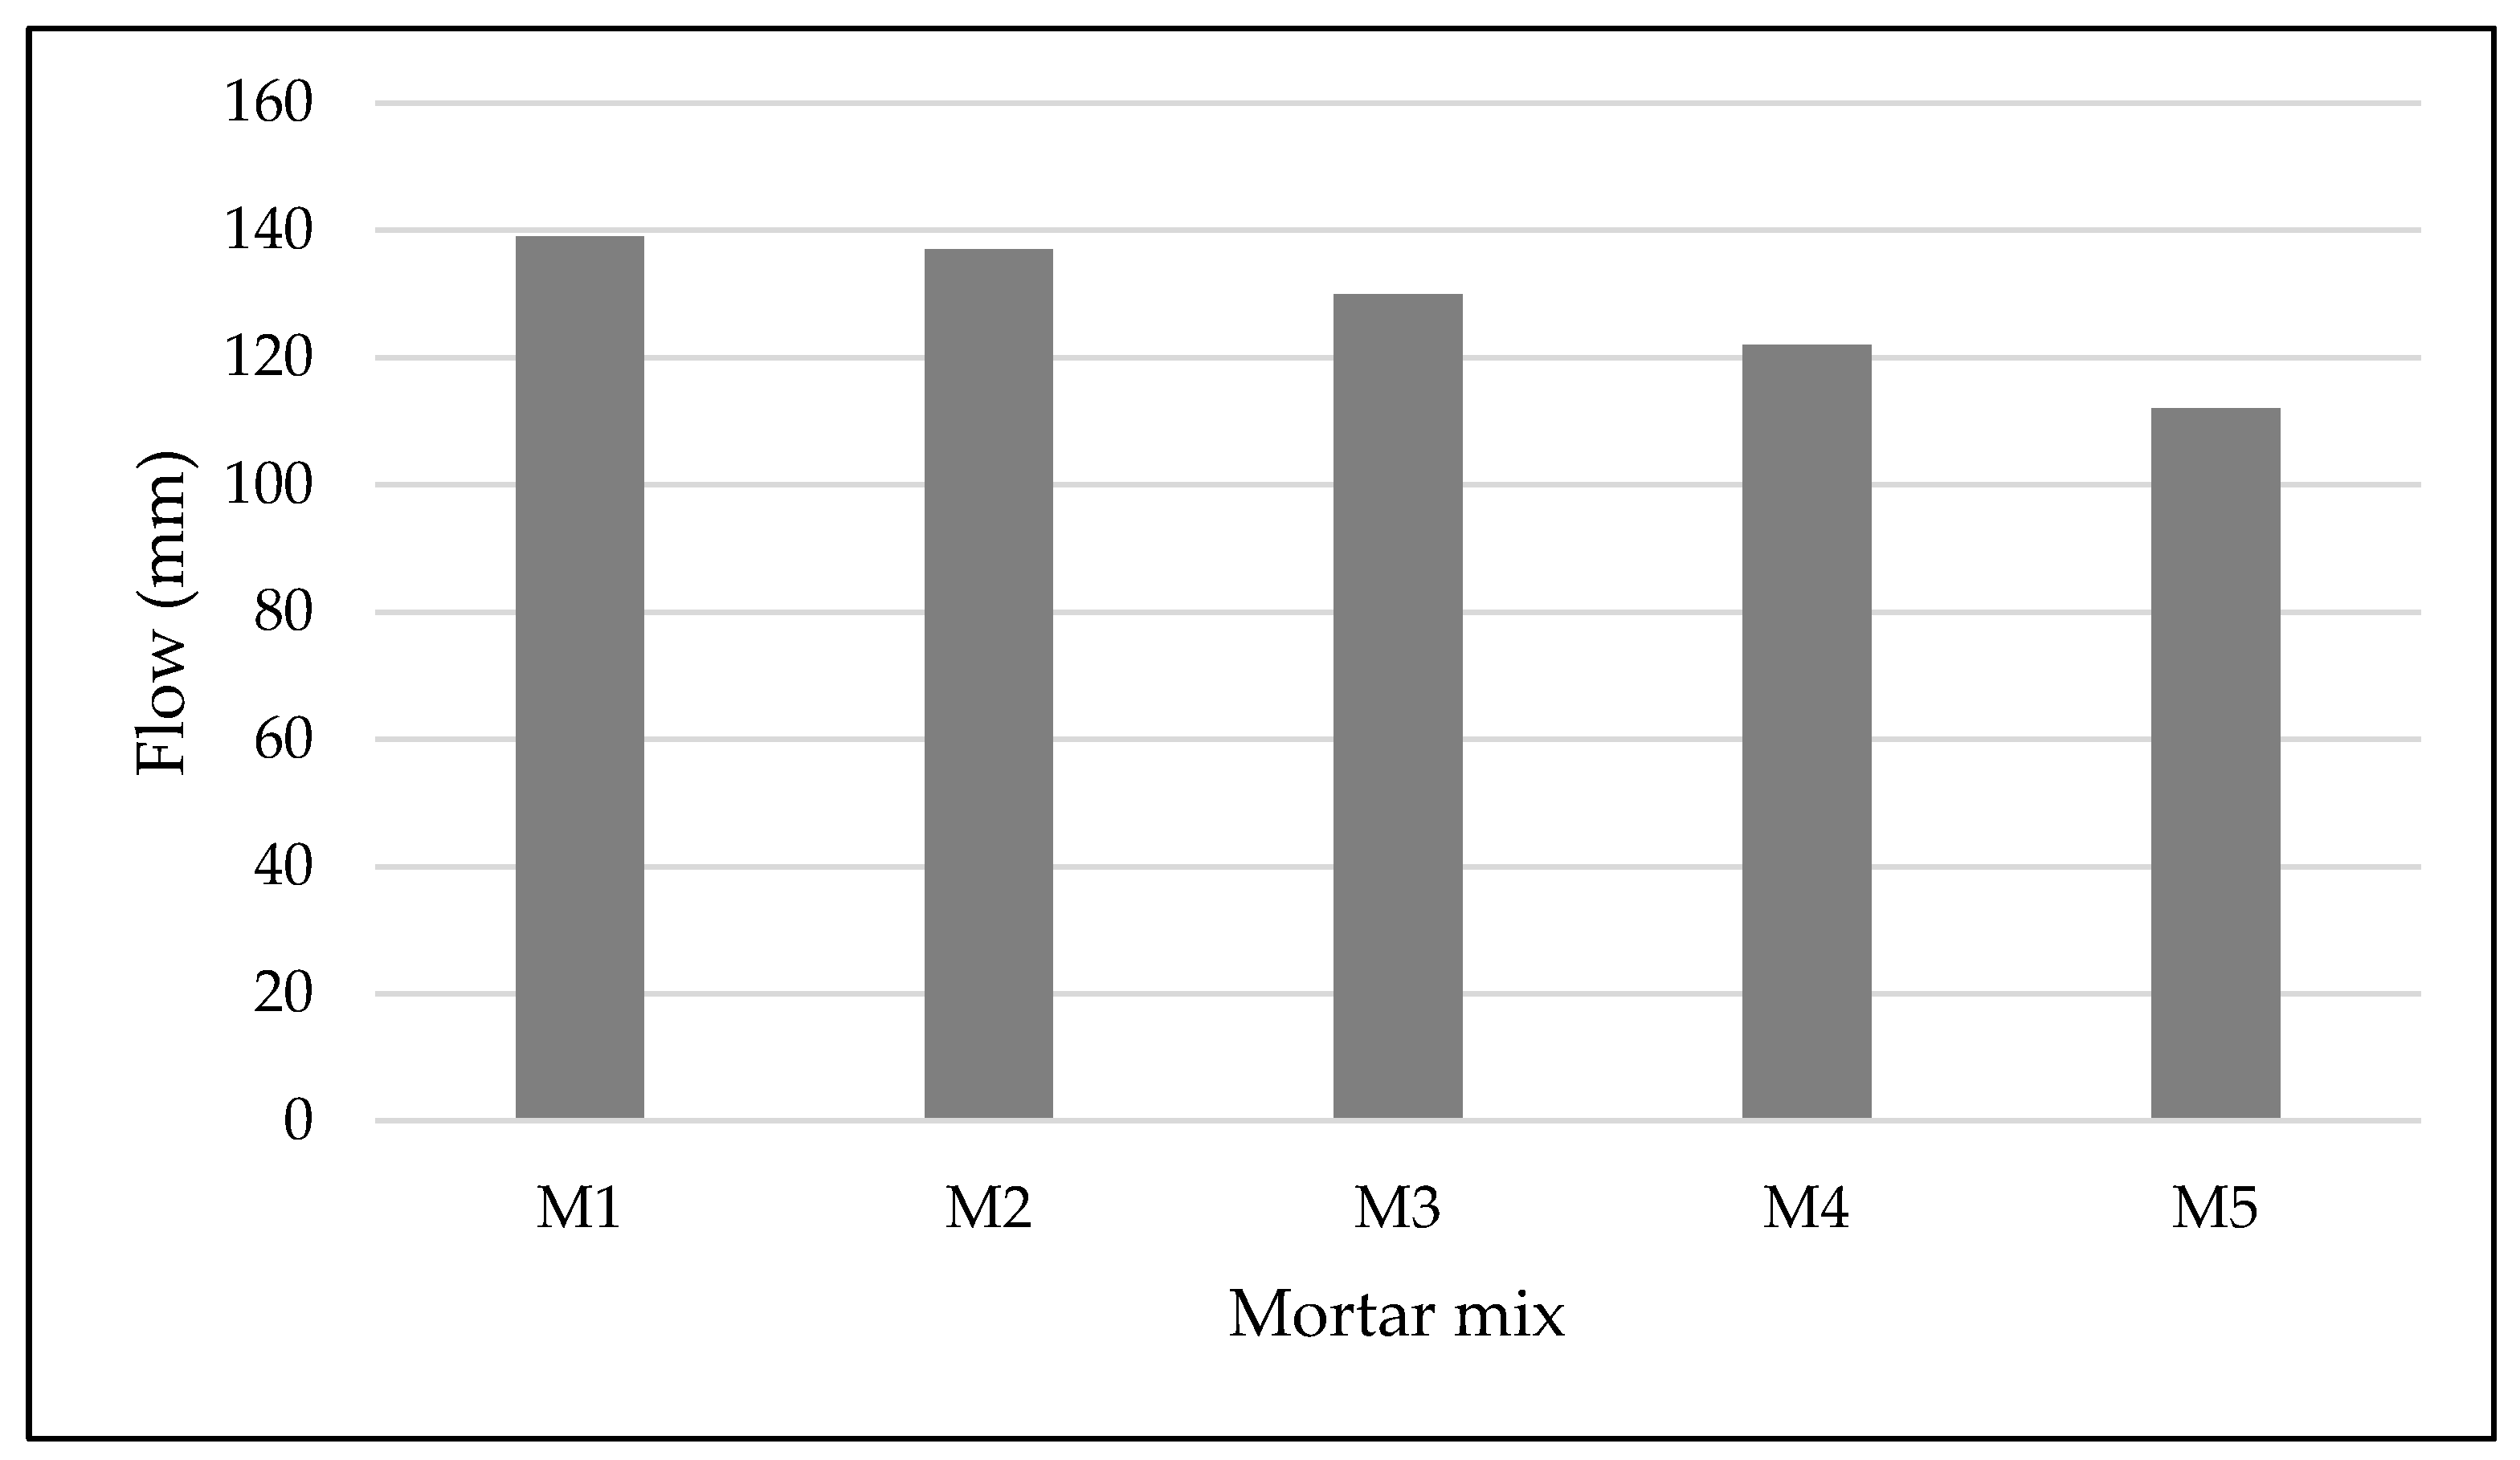
3.1. Consistency of Fresh Mix (Flow Table Test)
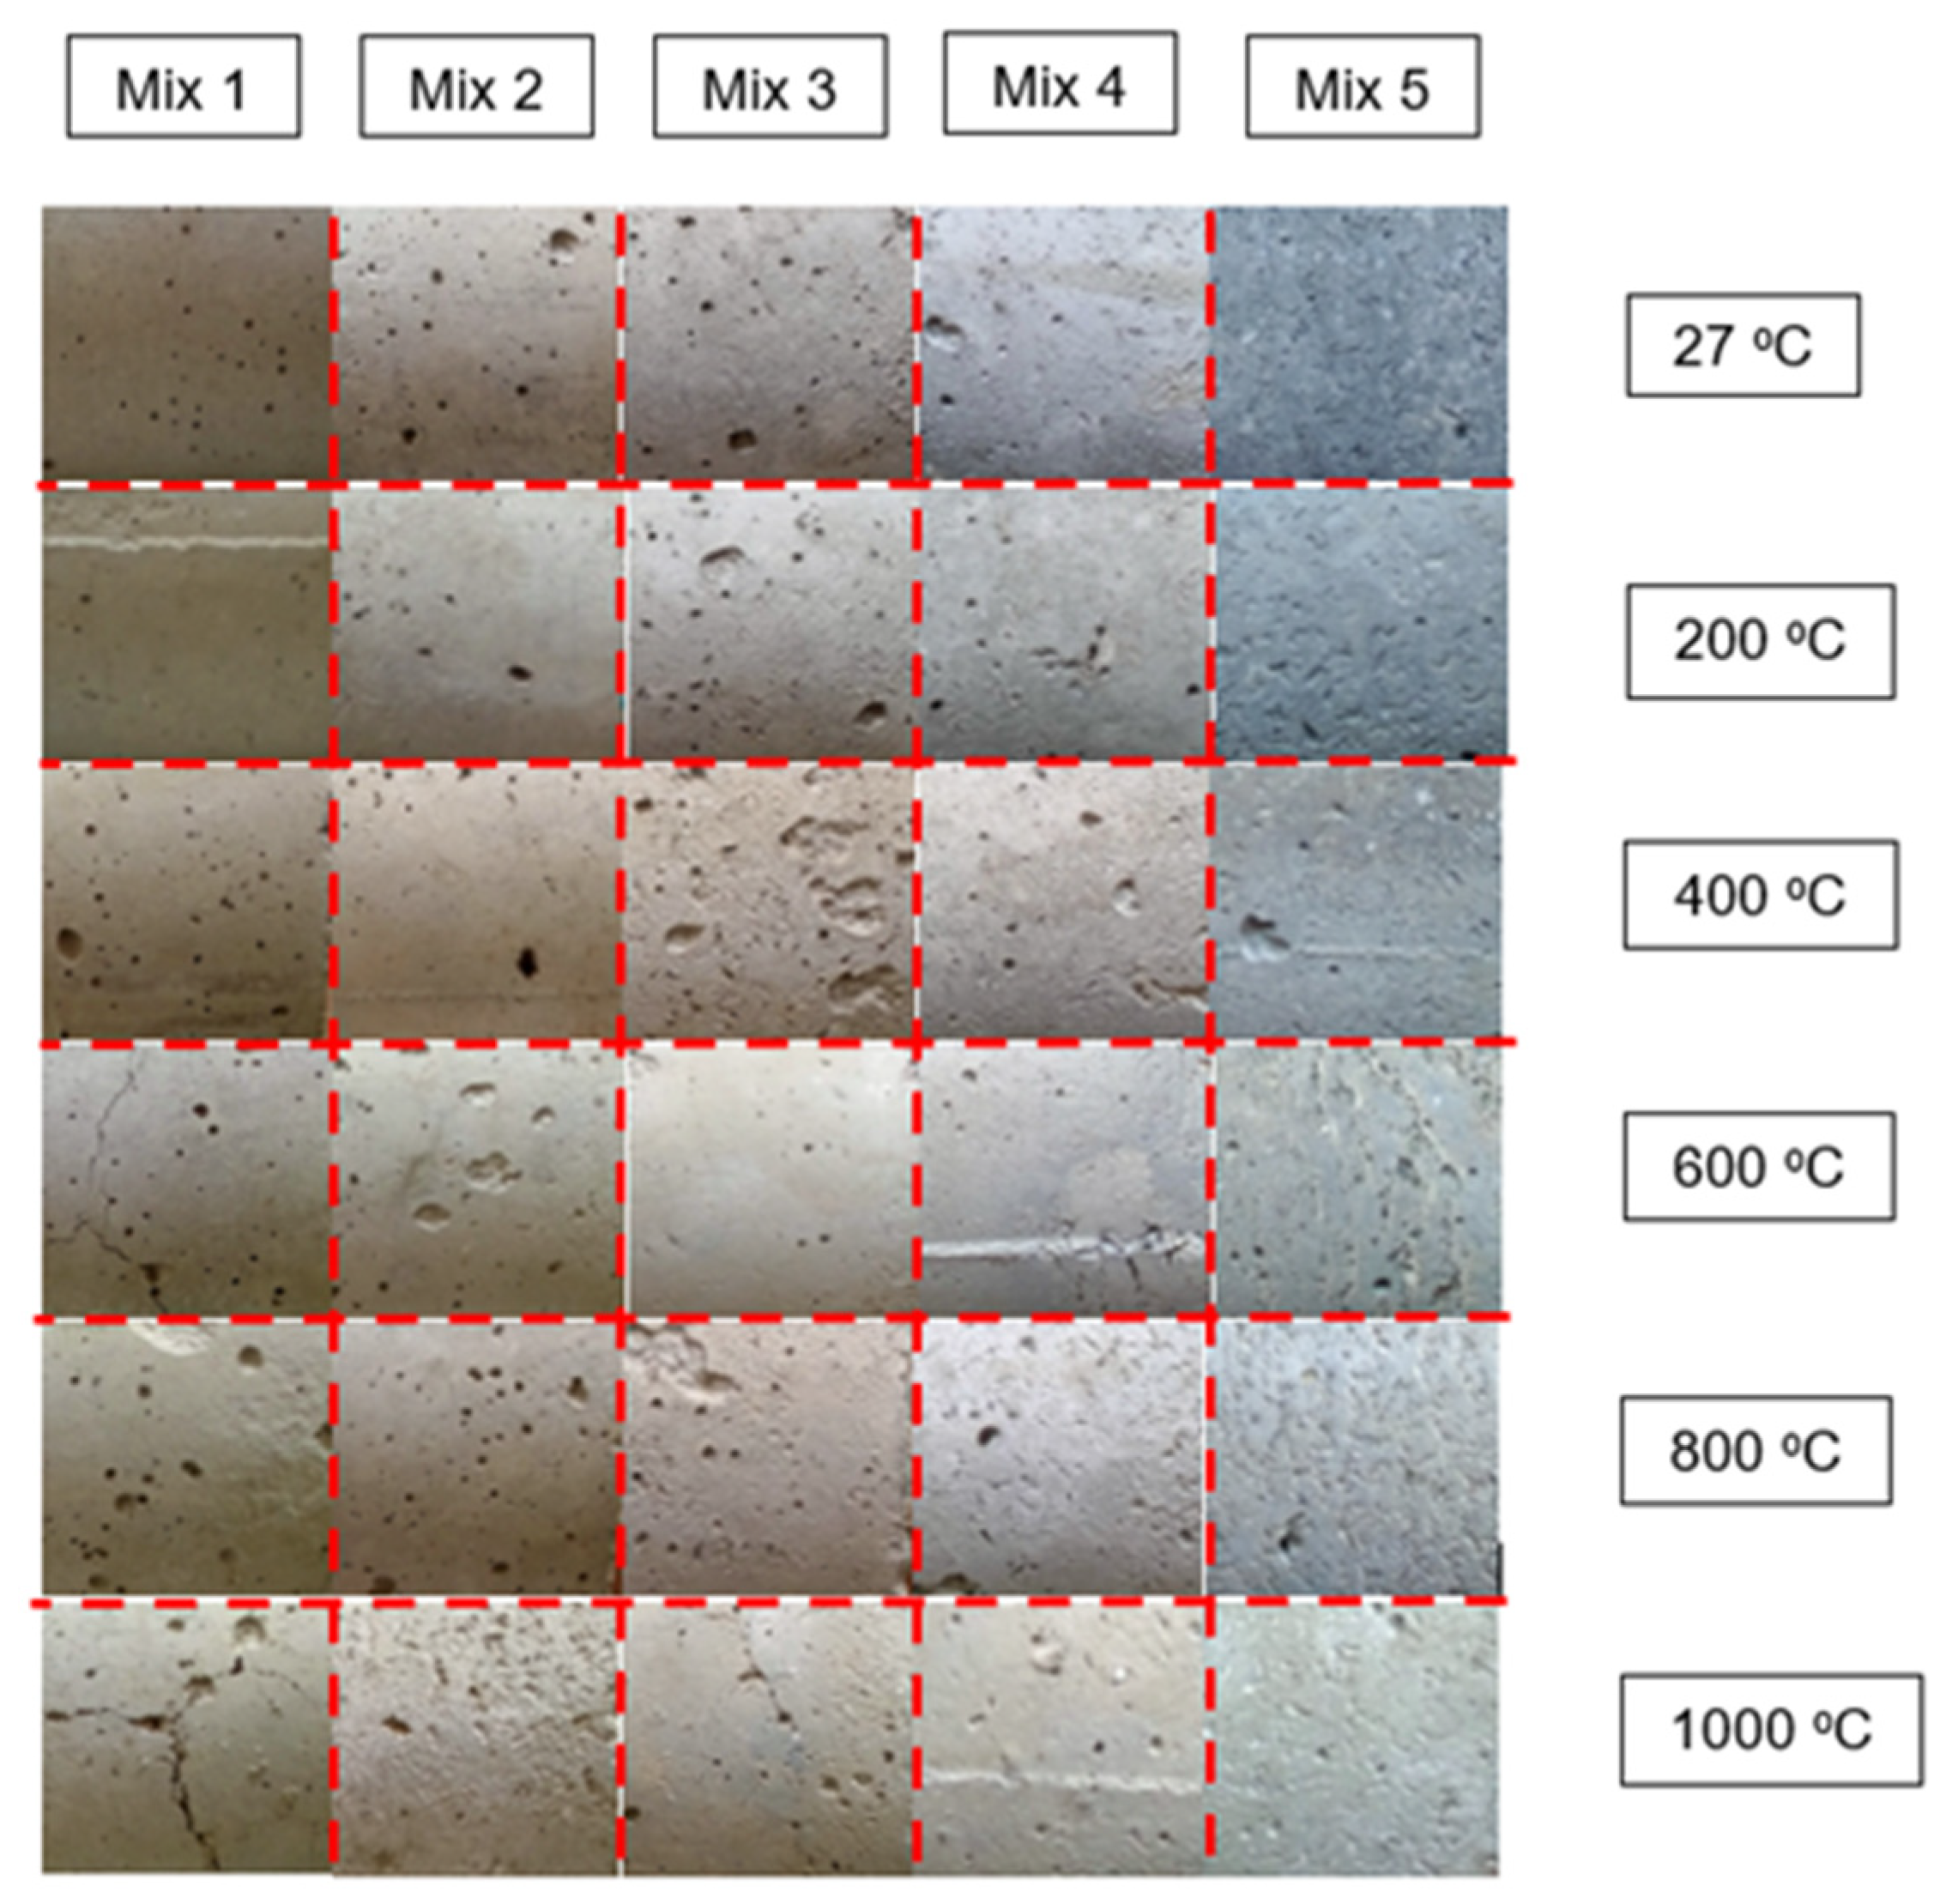
3.2. Colour Changes
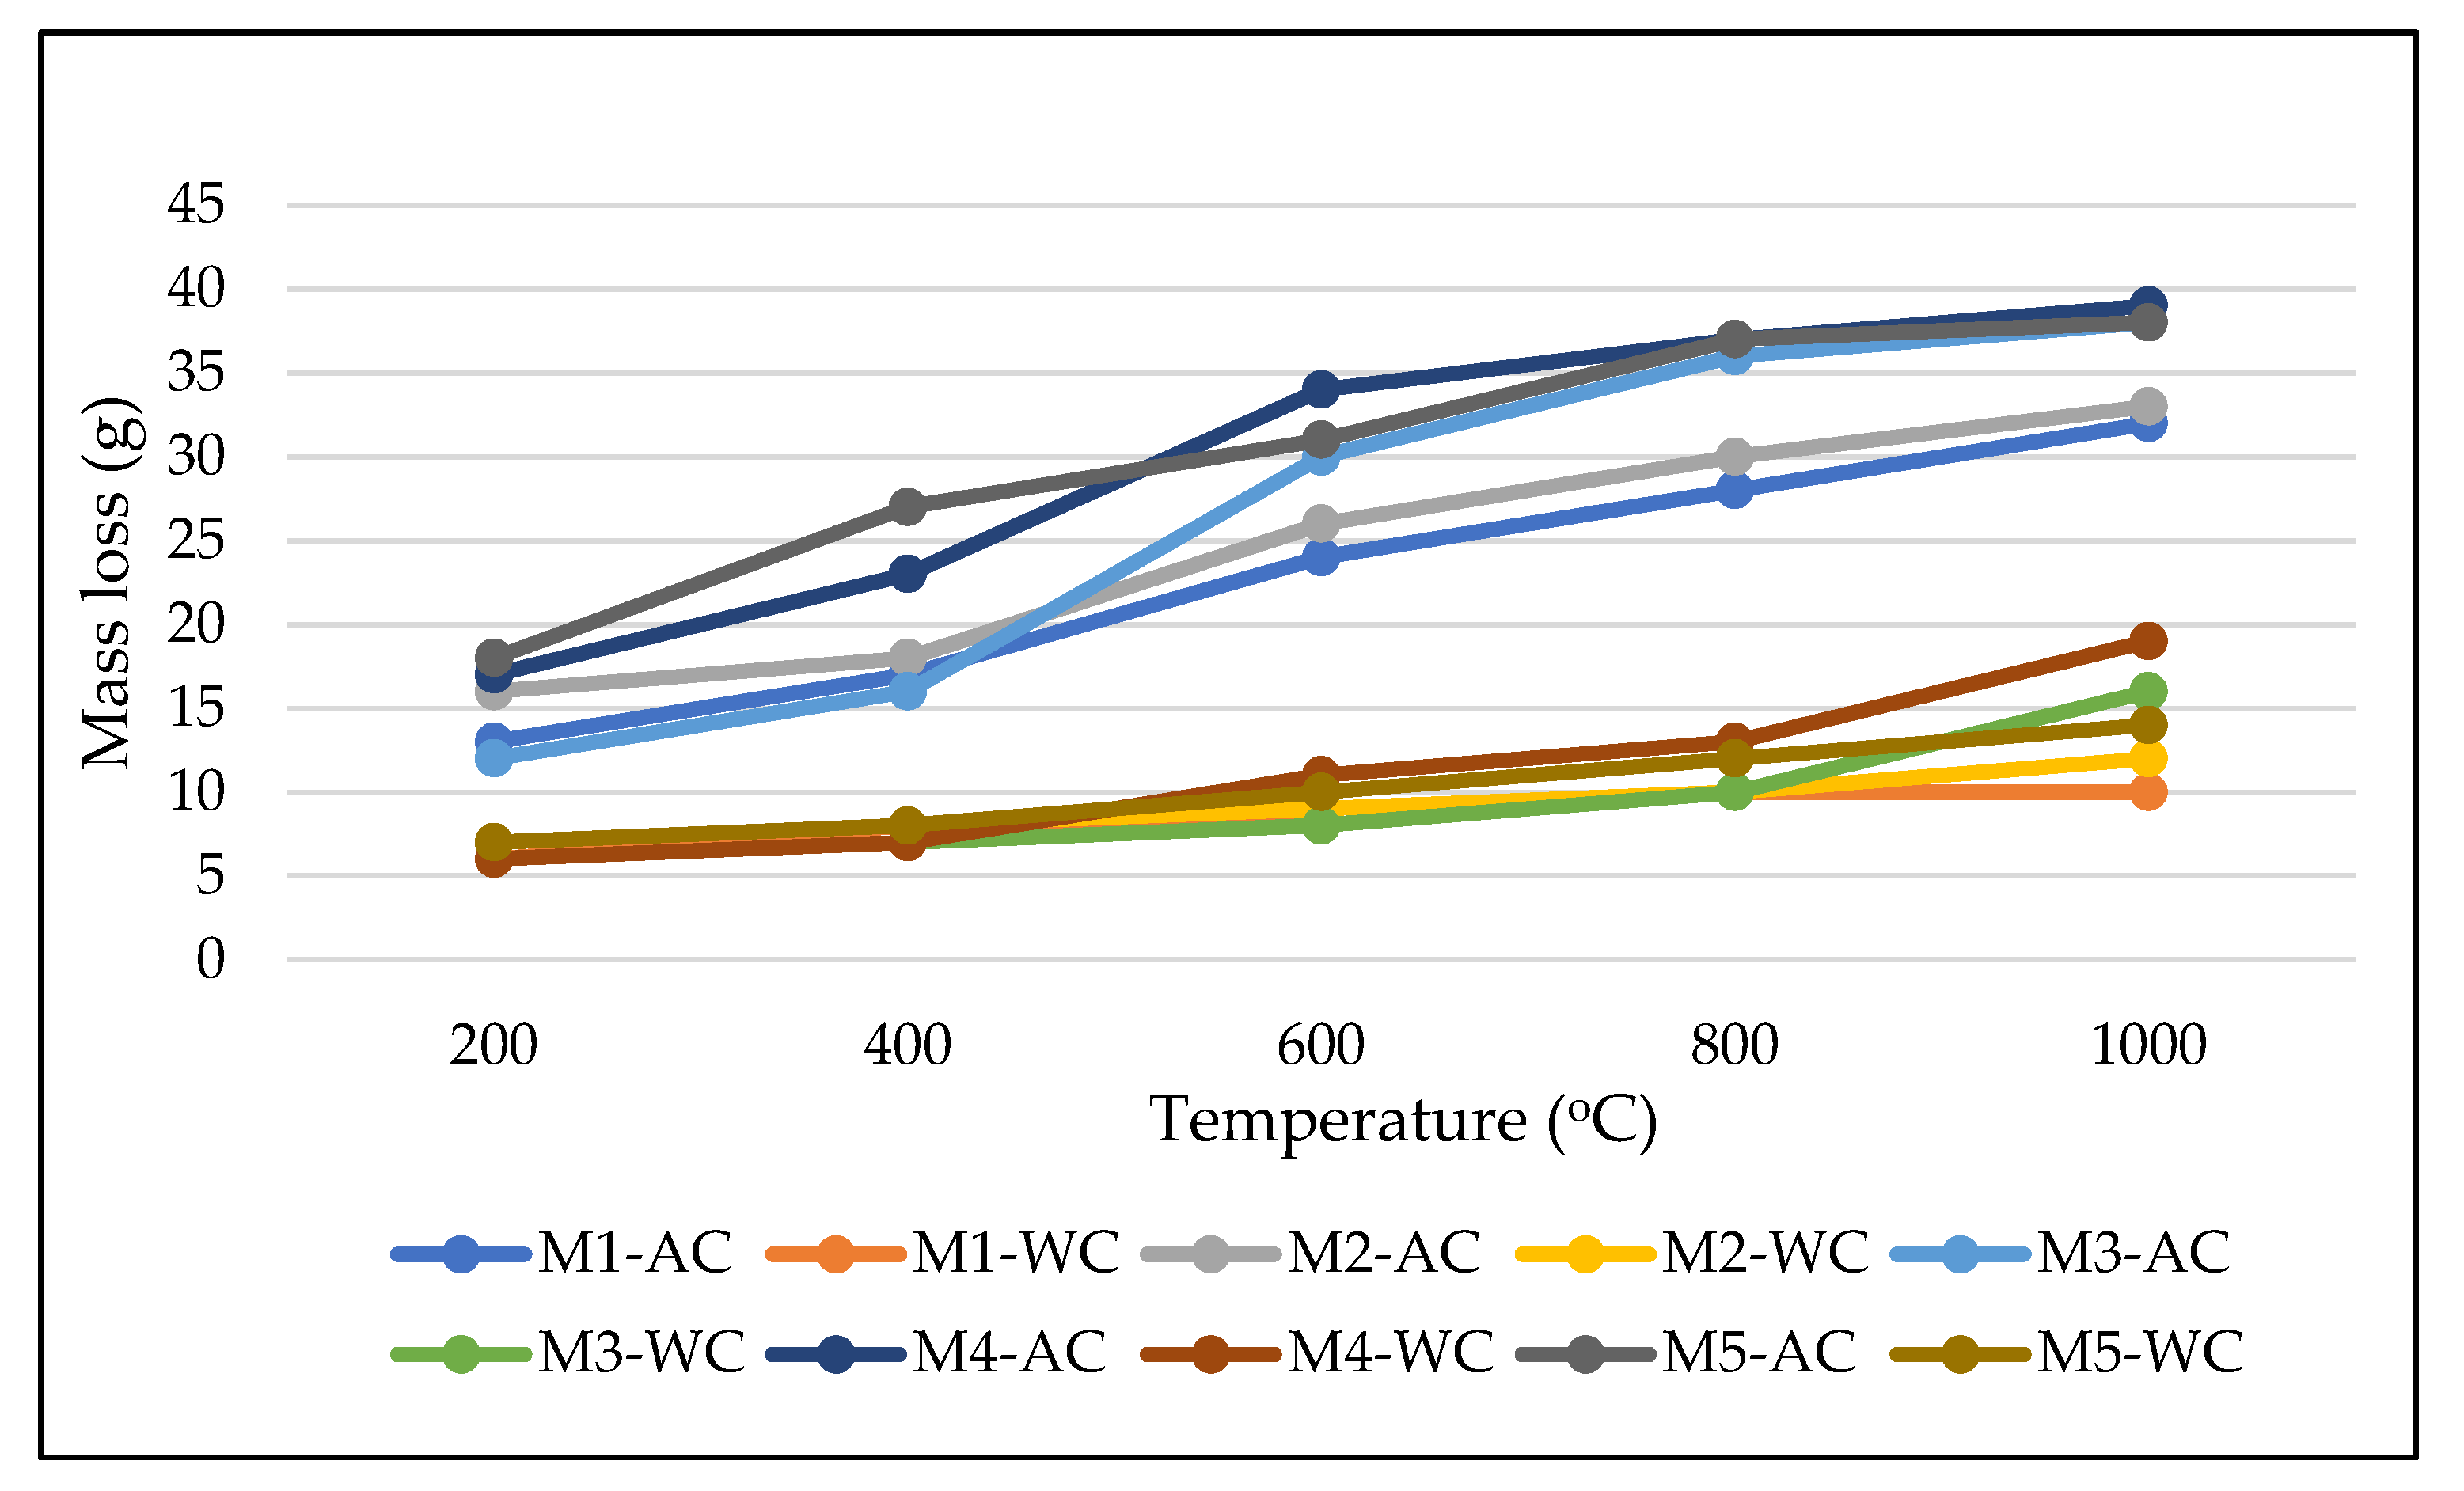
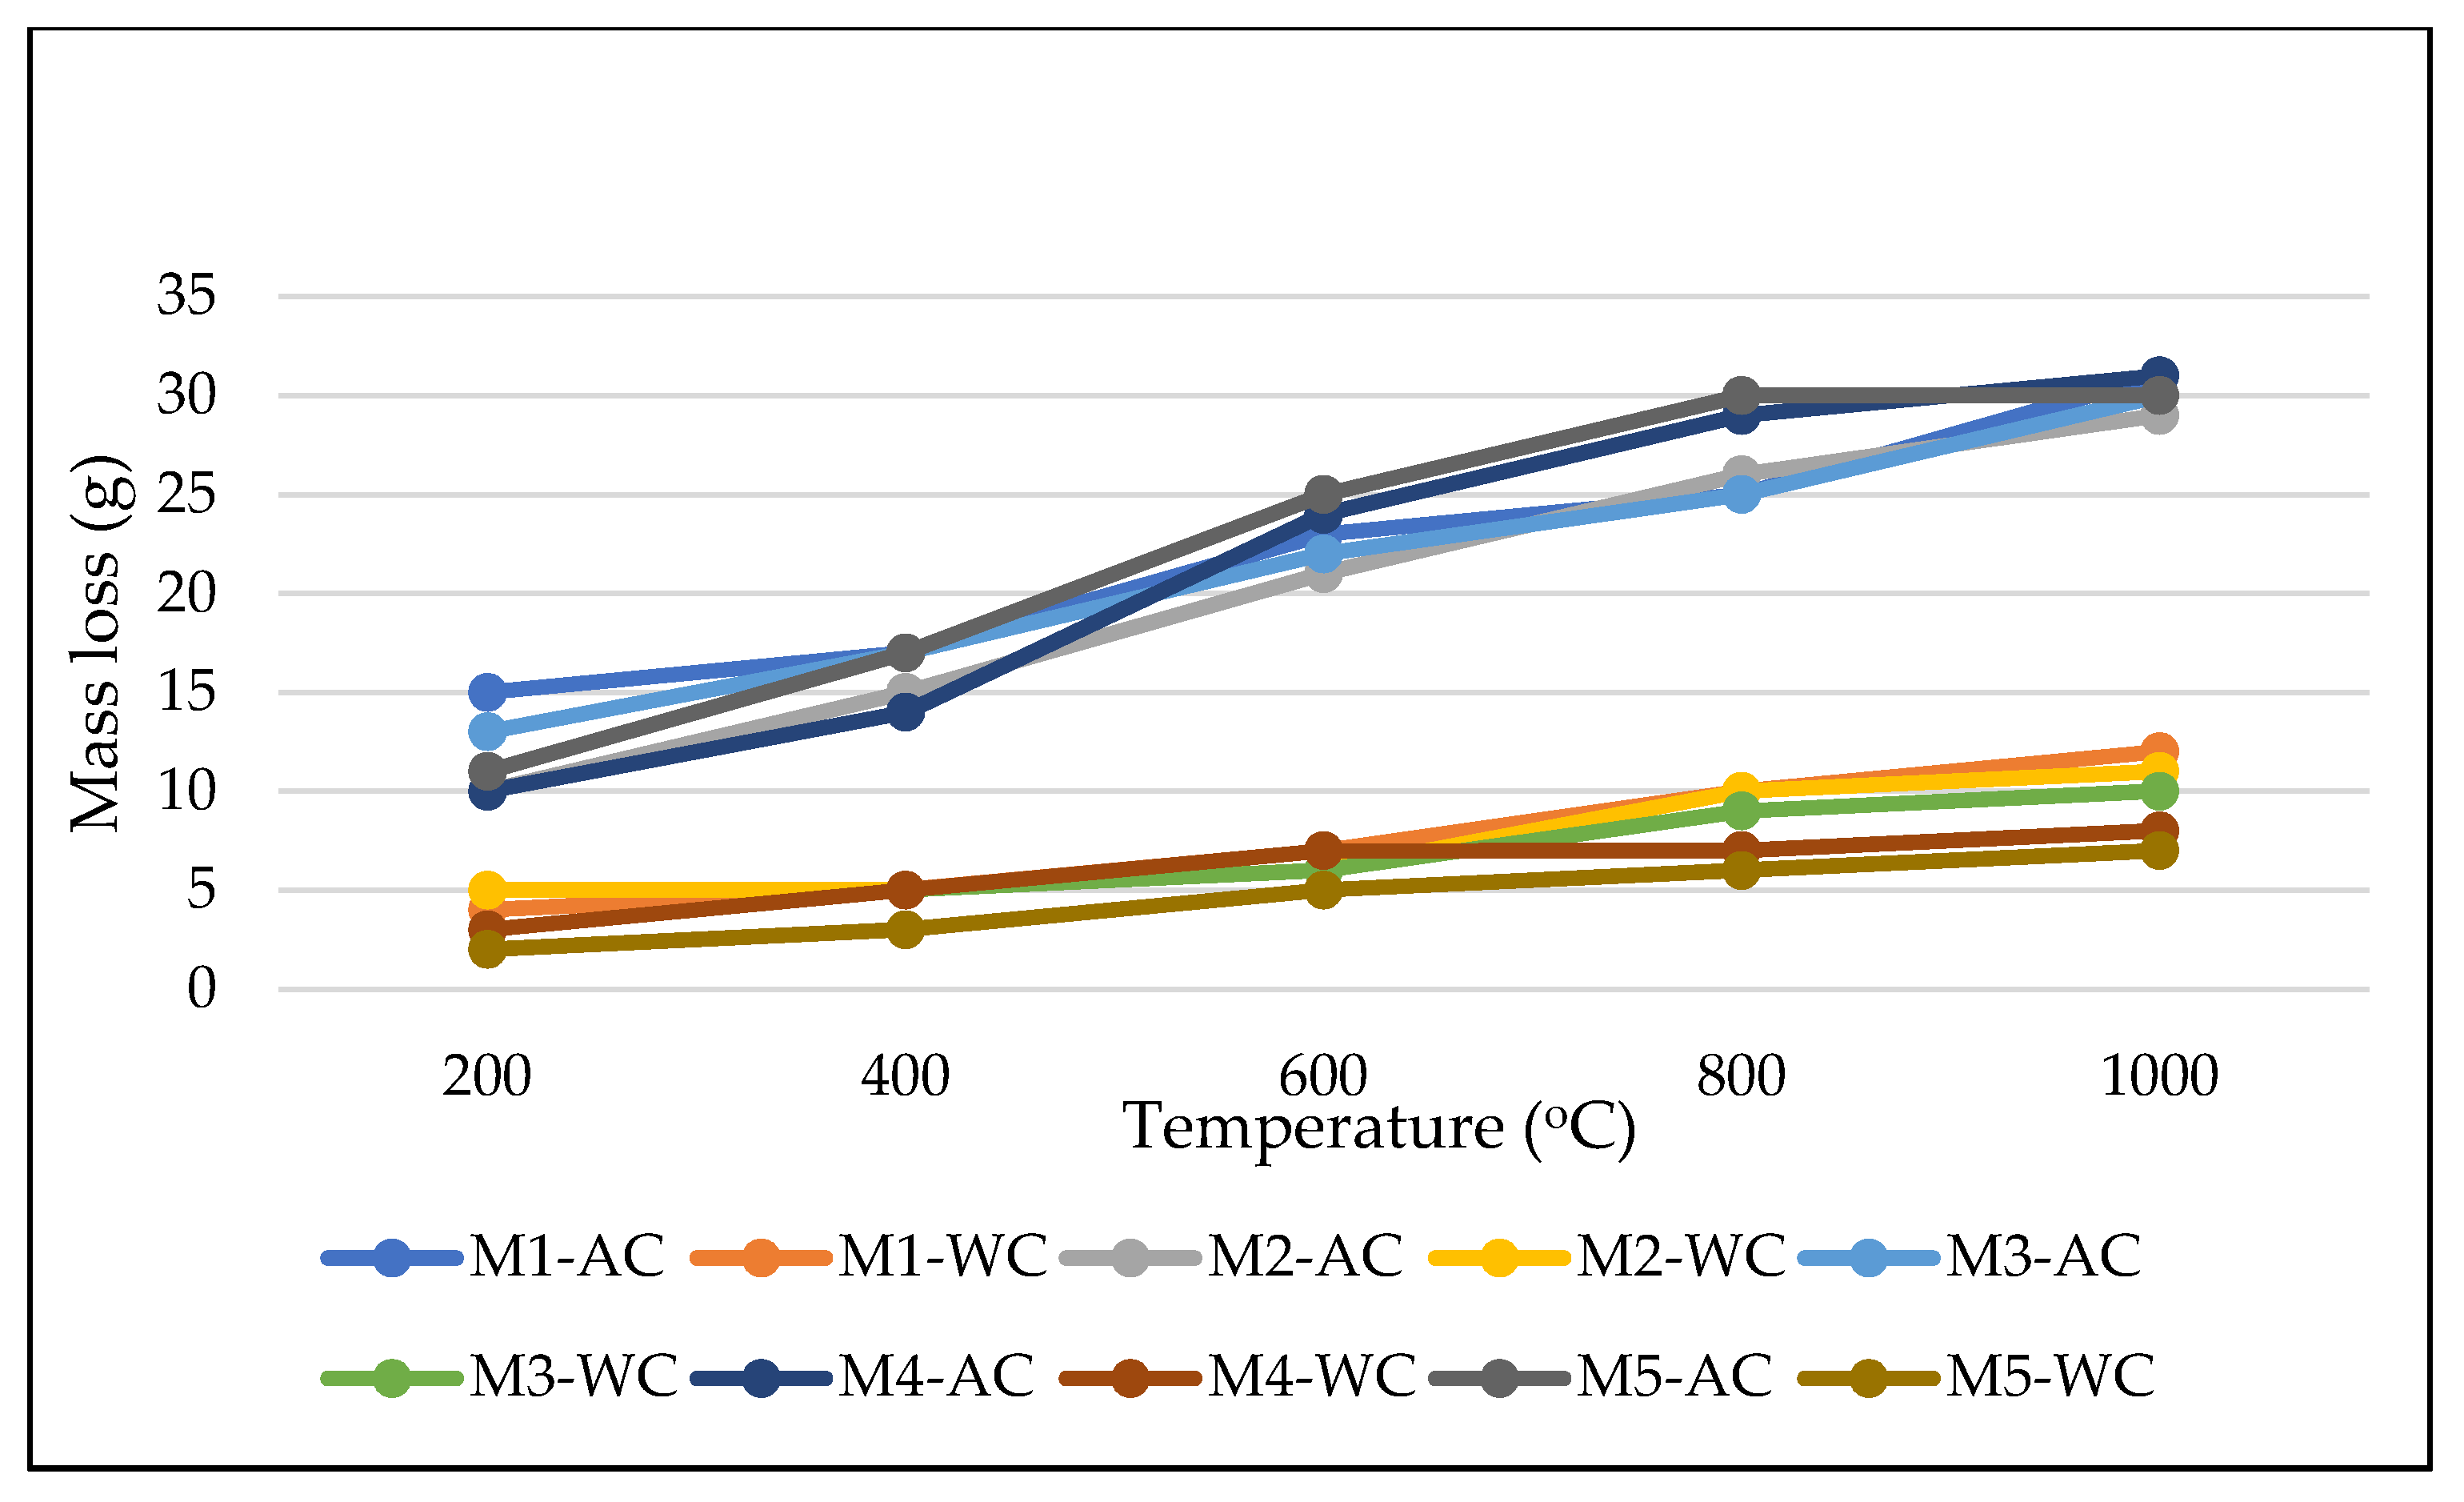
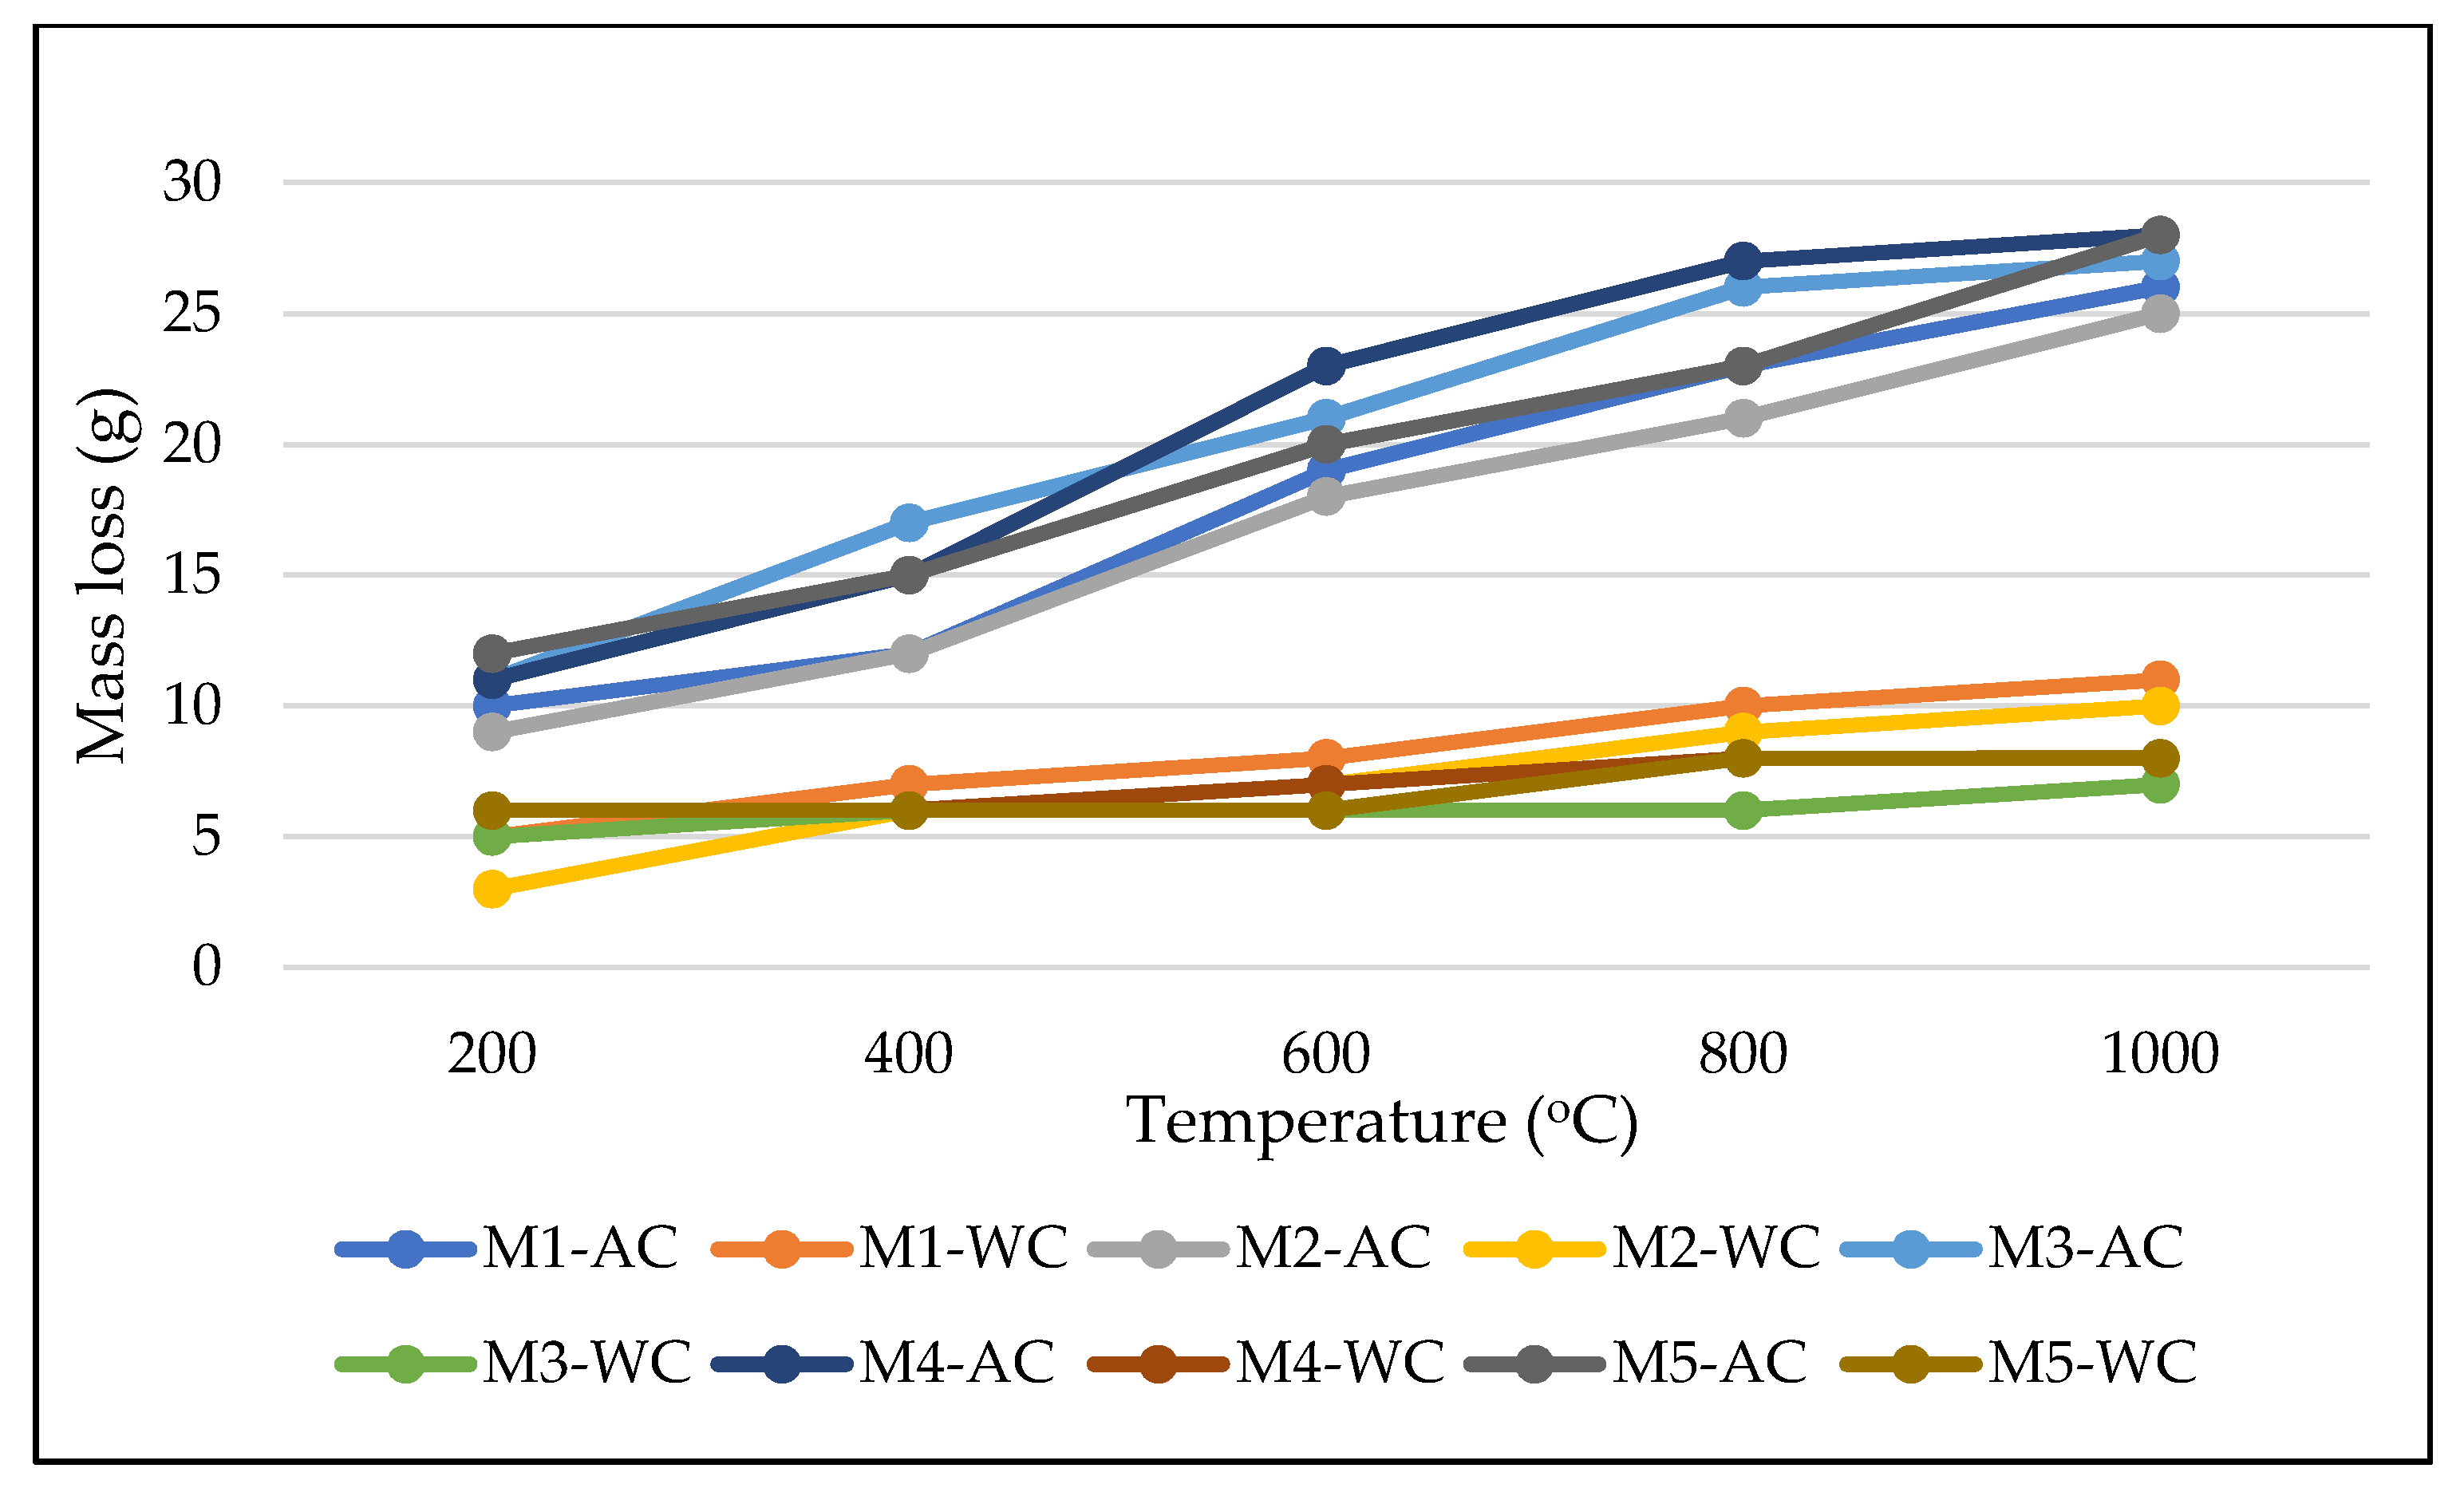
3.3. Mass Loss
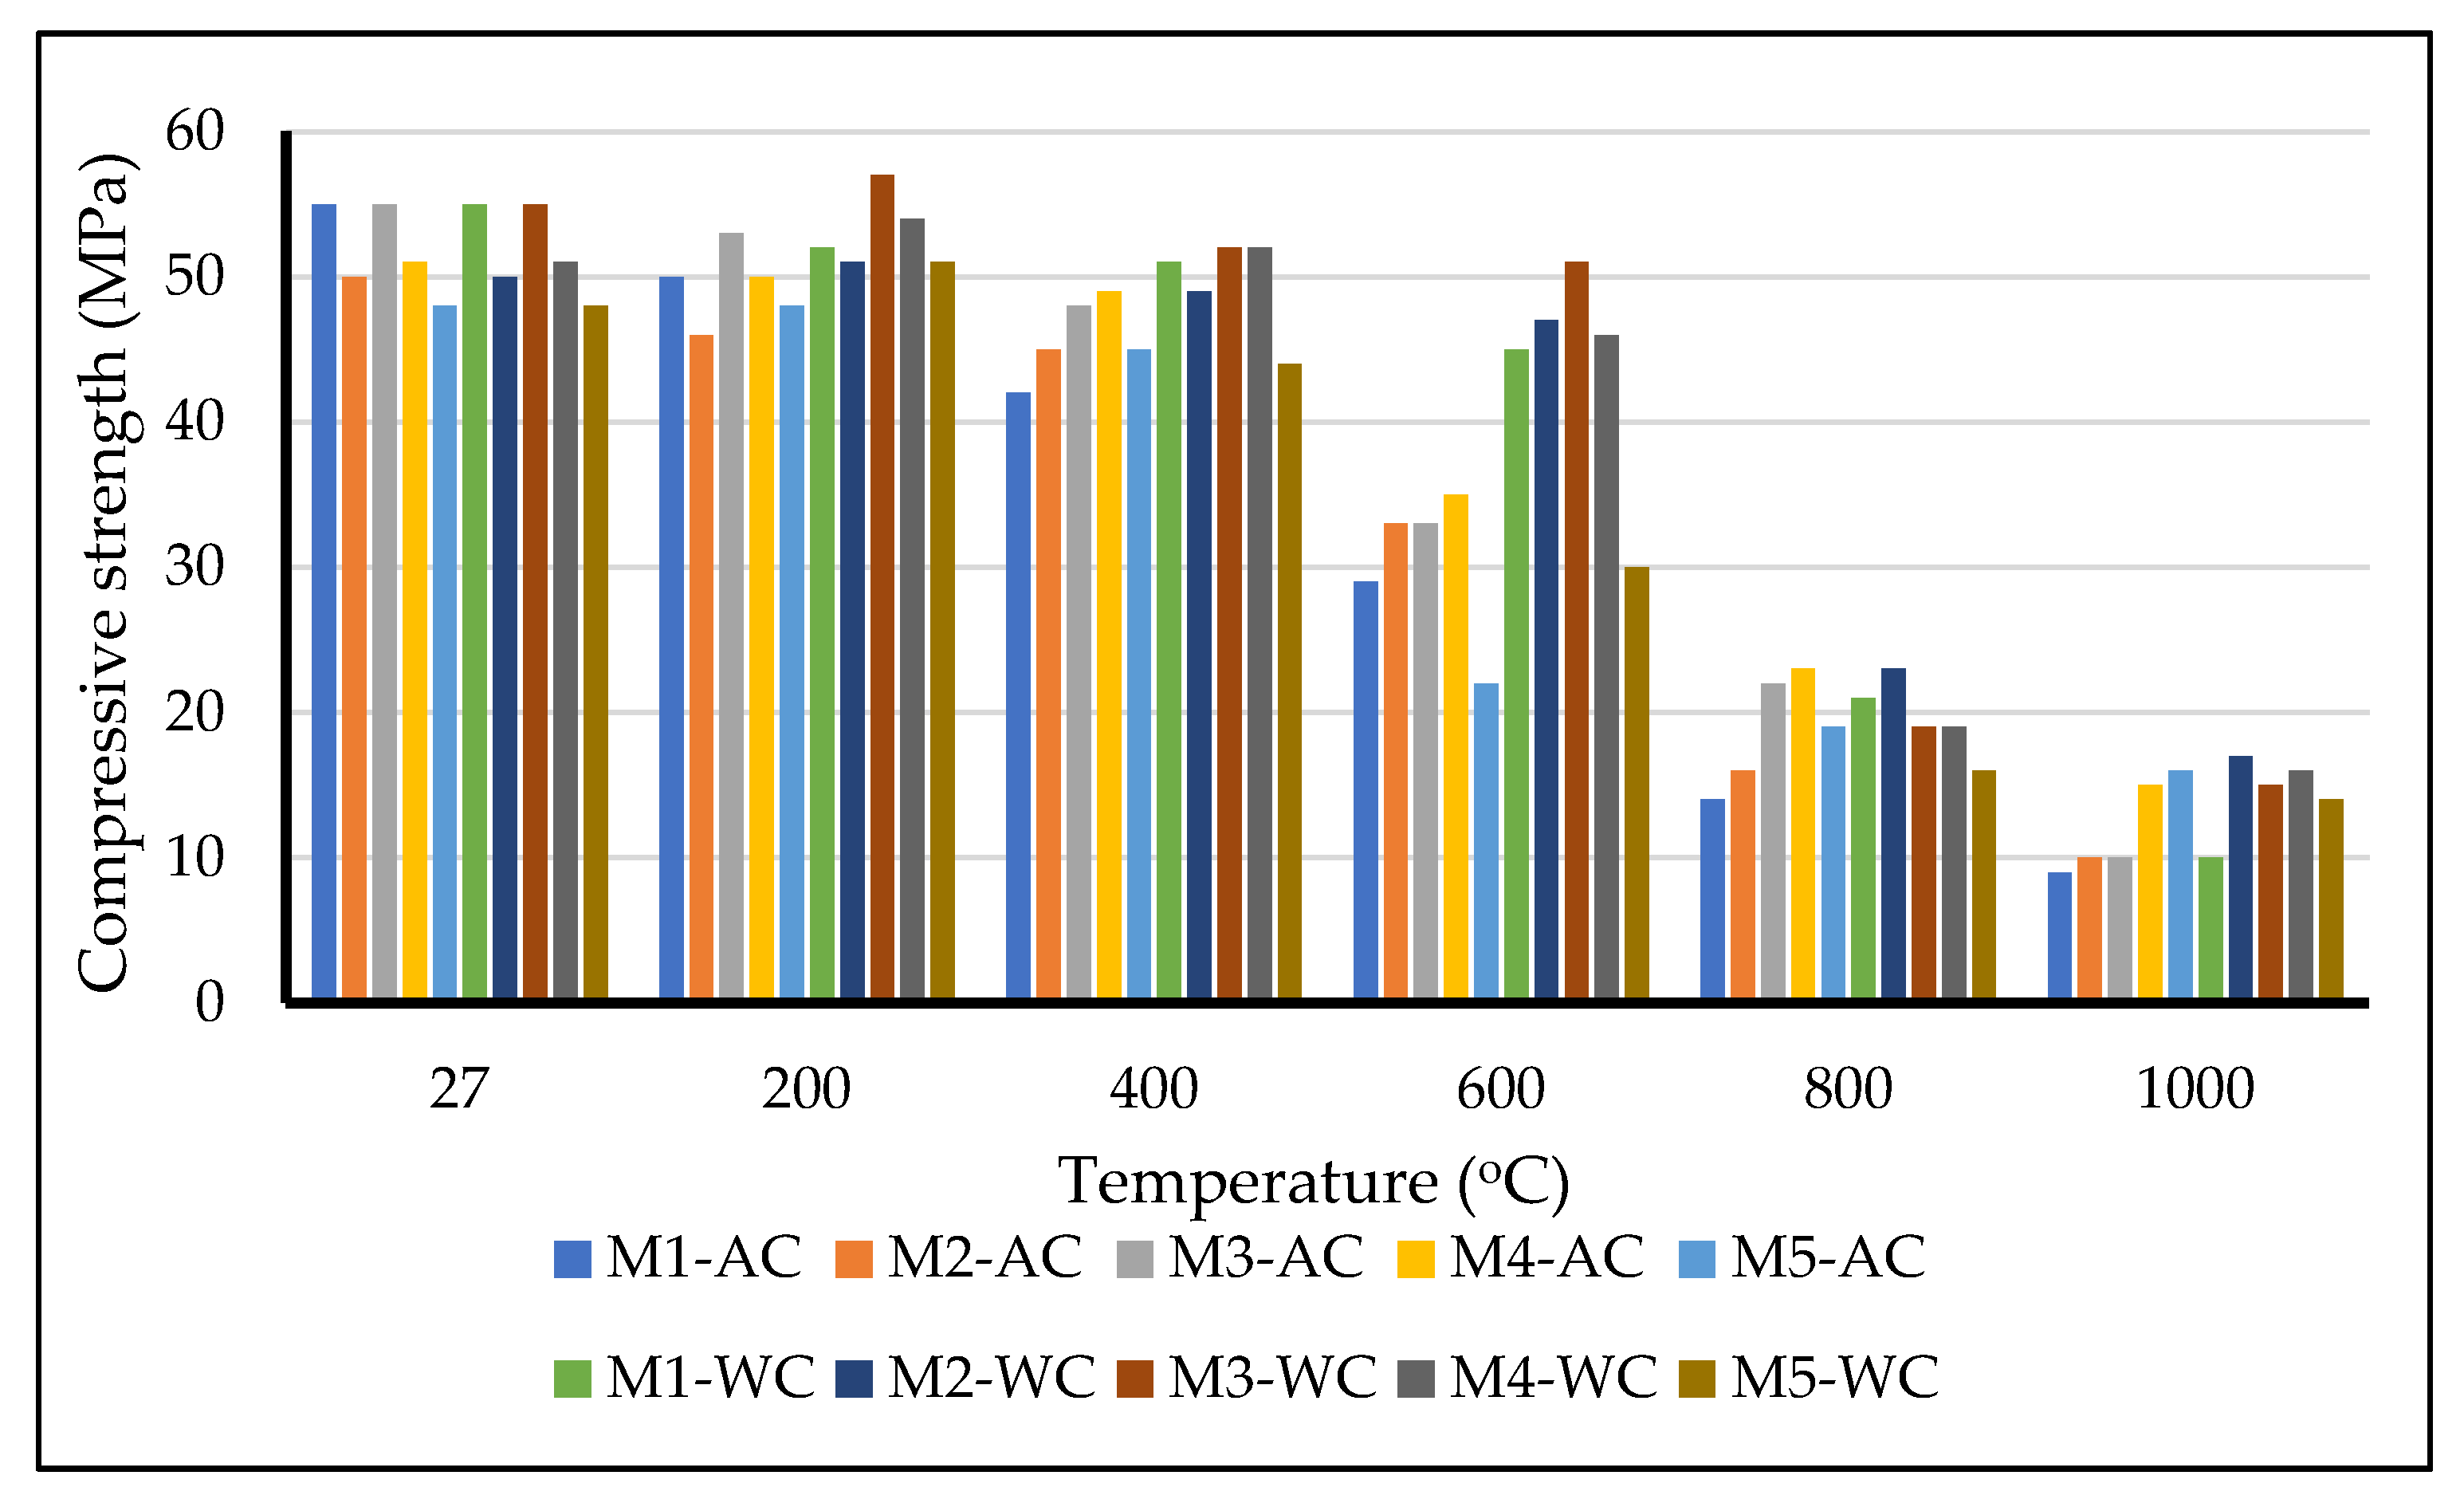
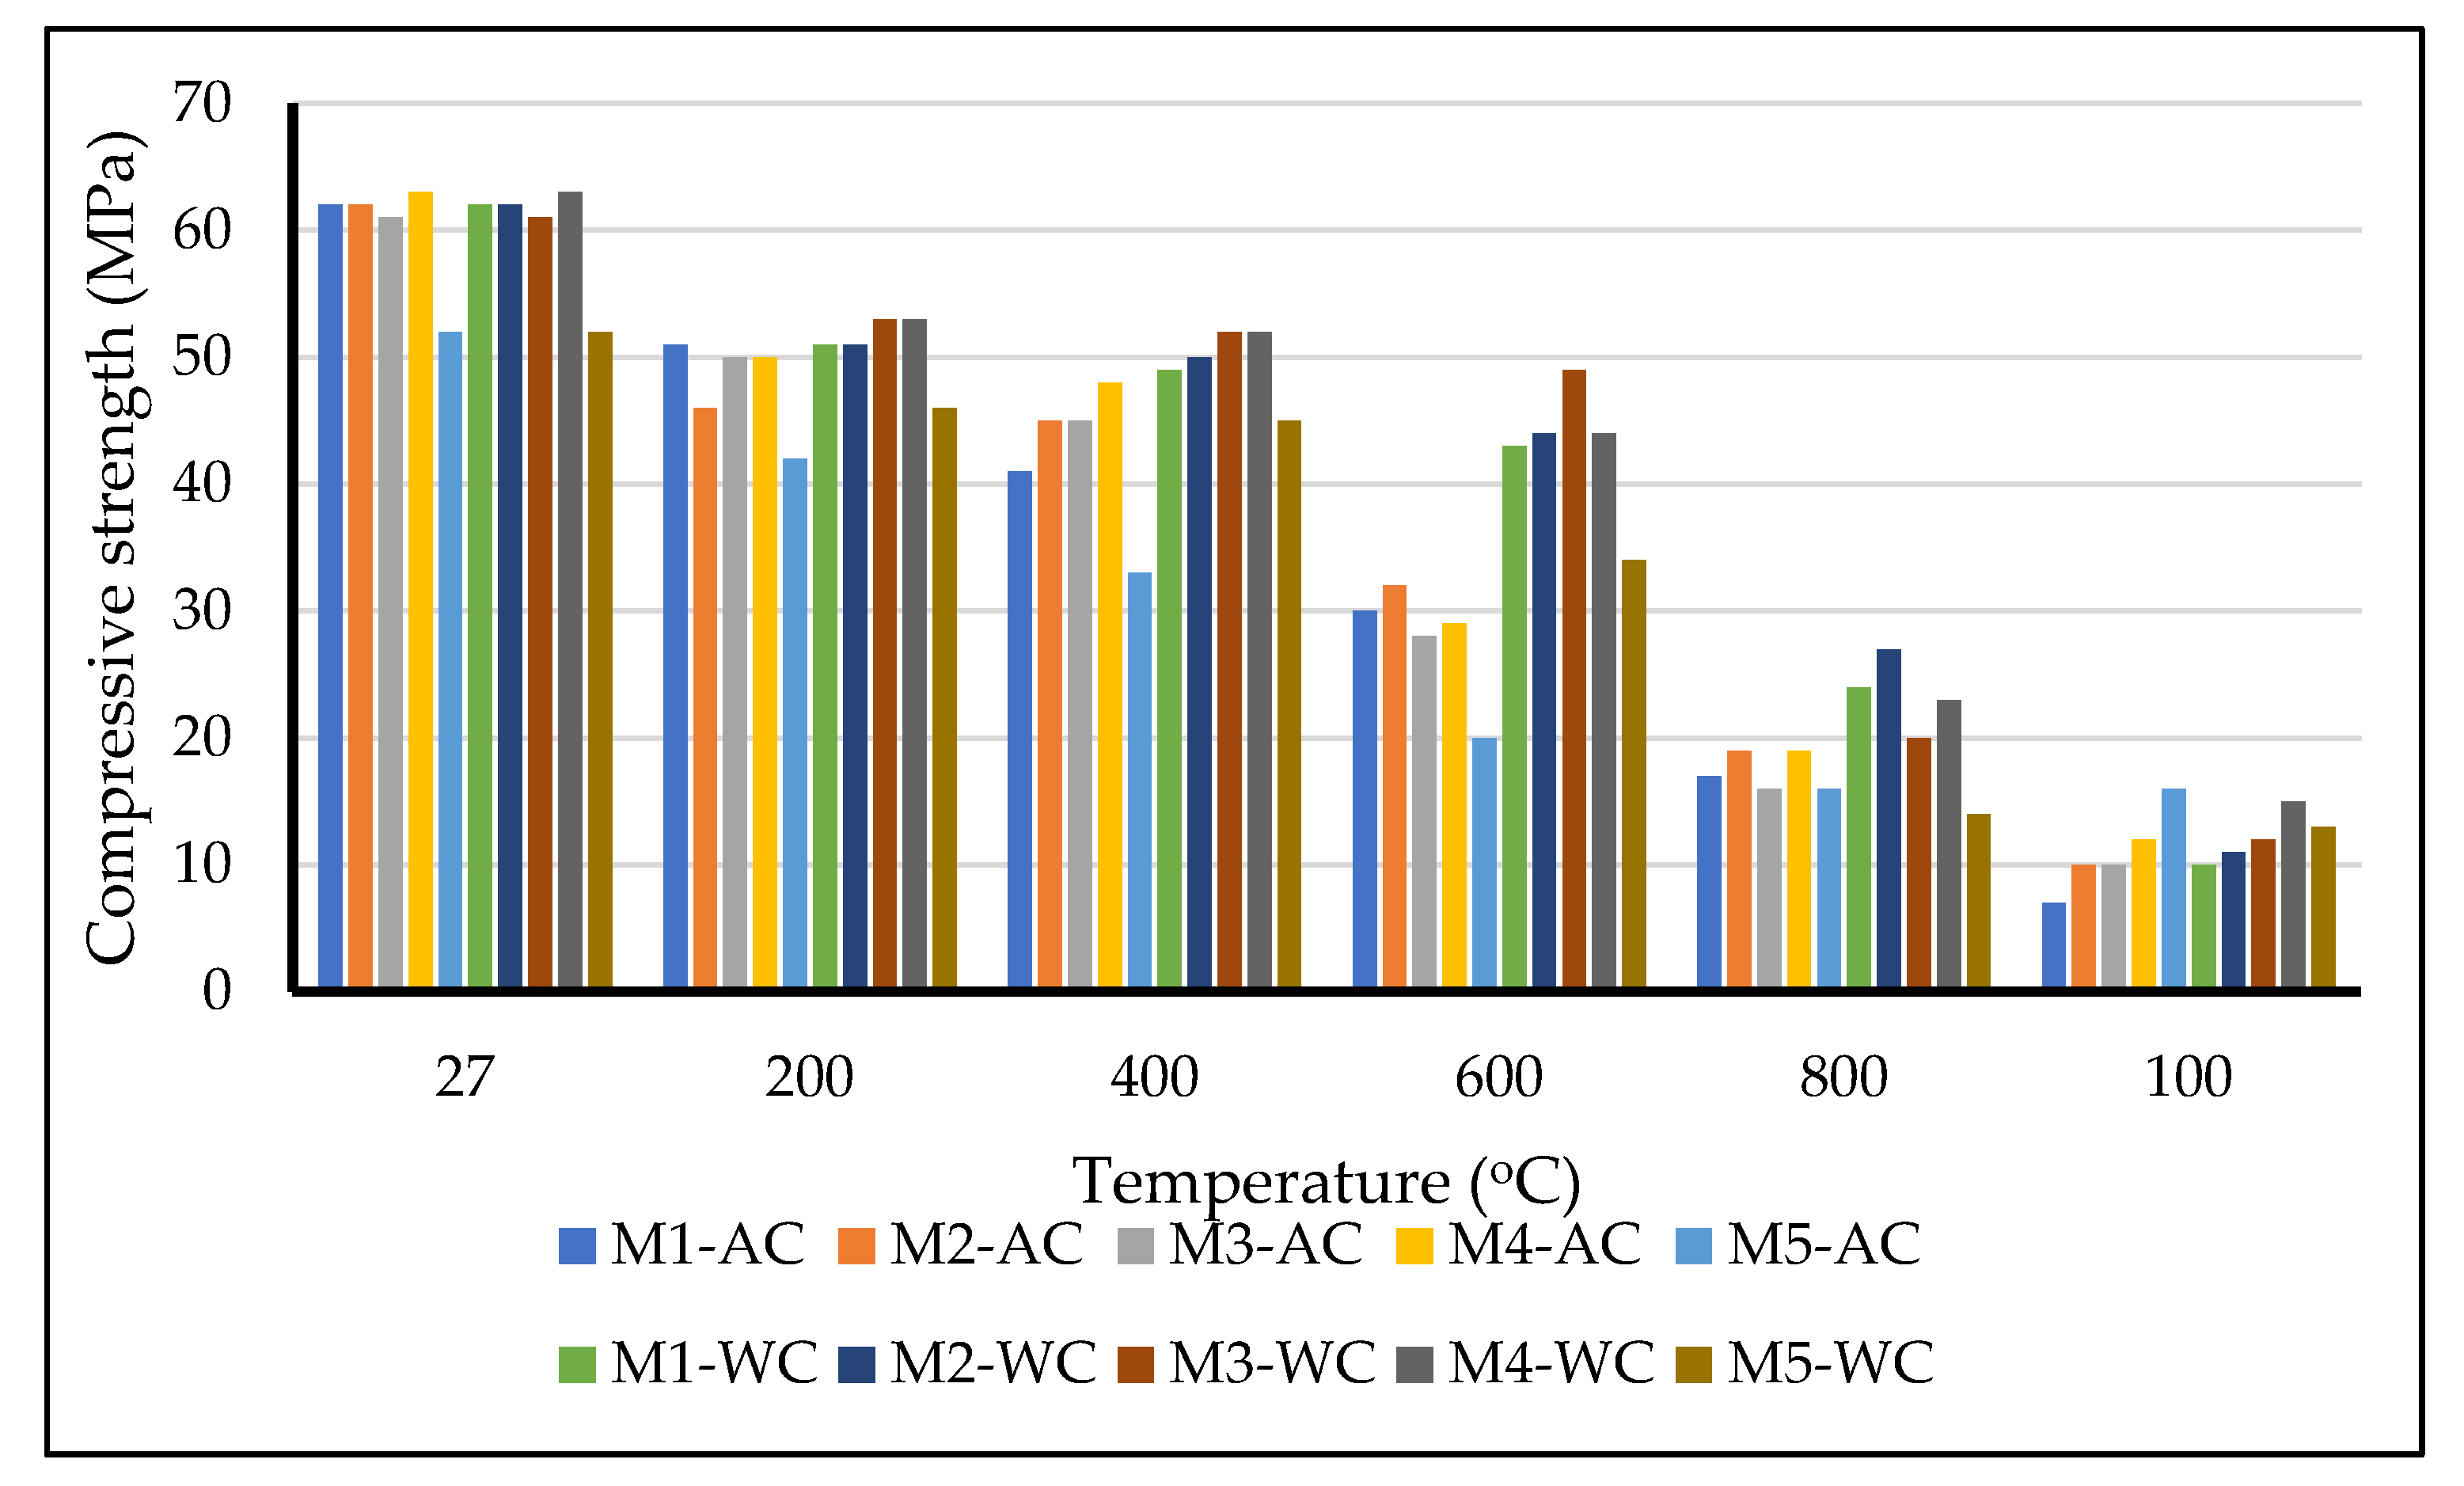
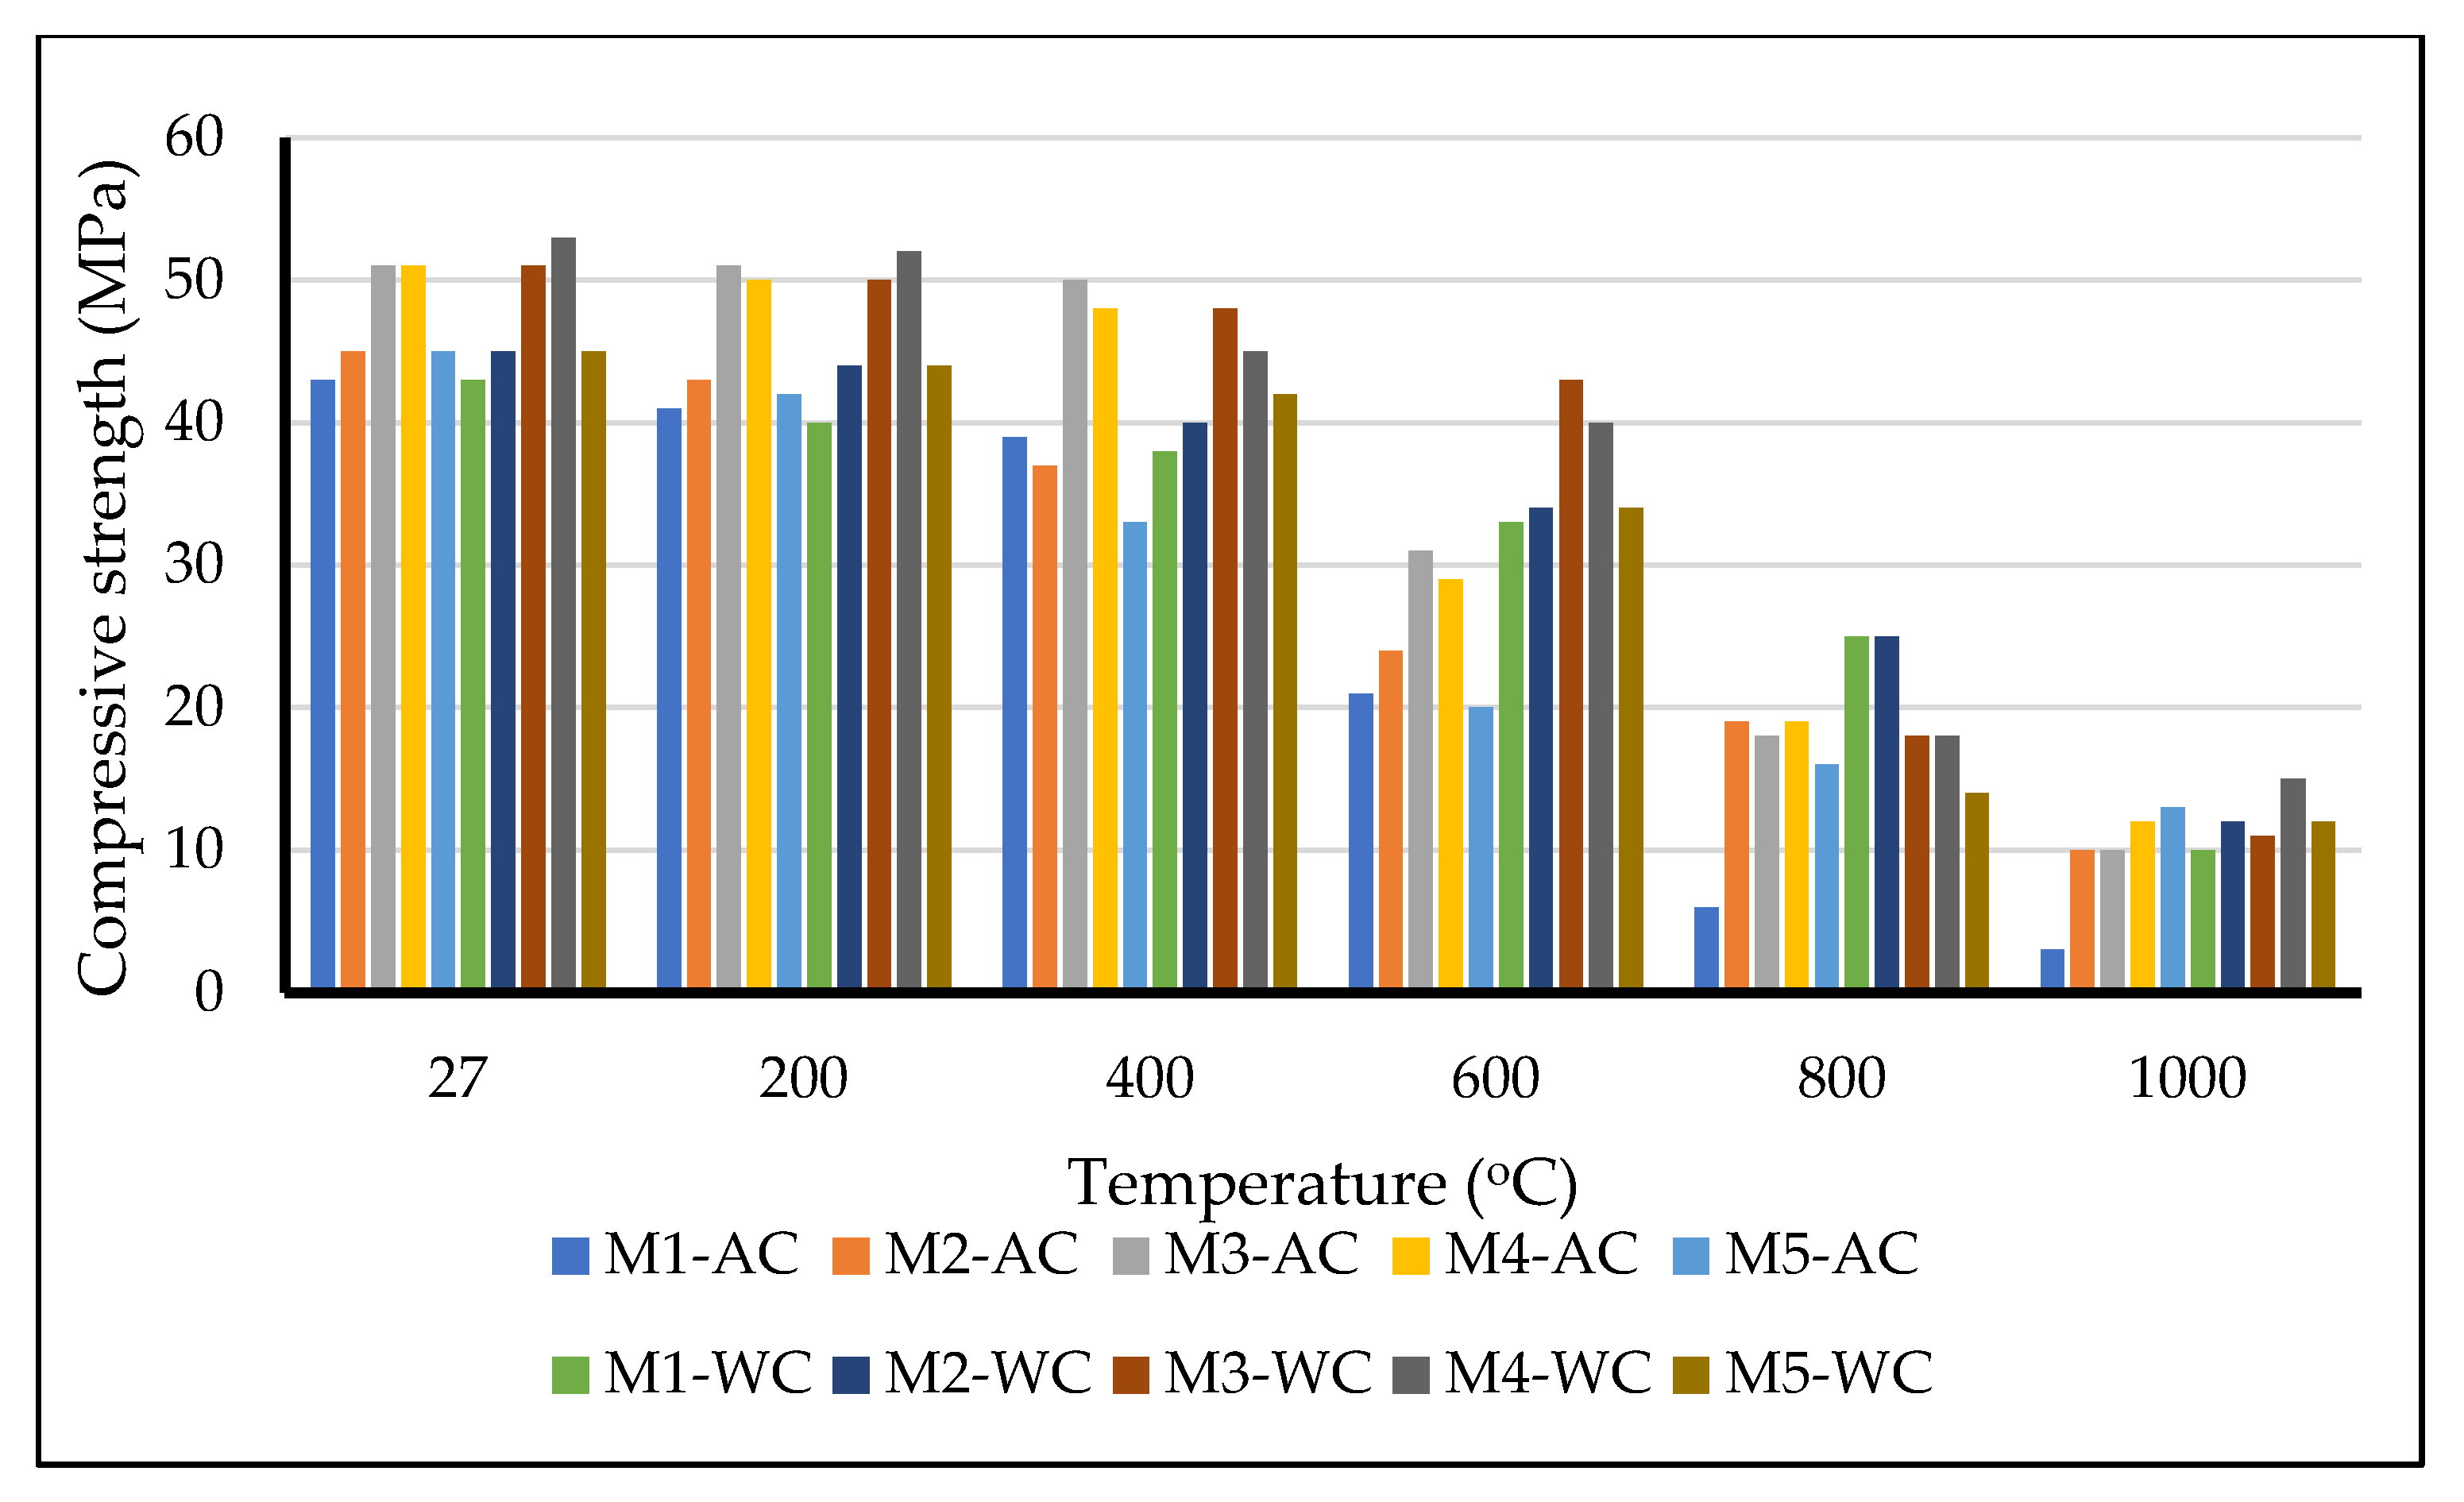
3.4. Compressive Strength
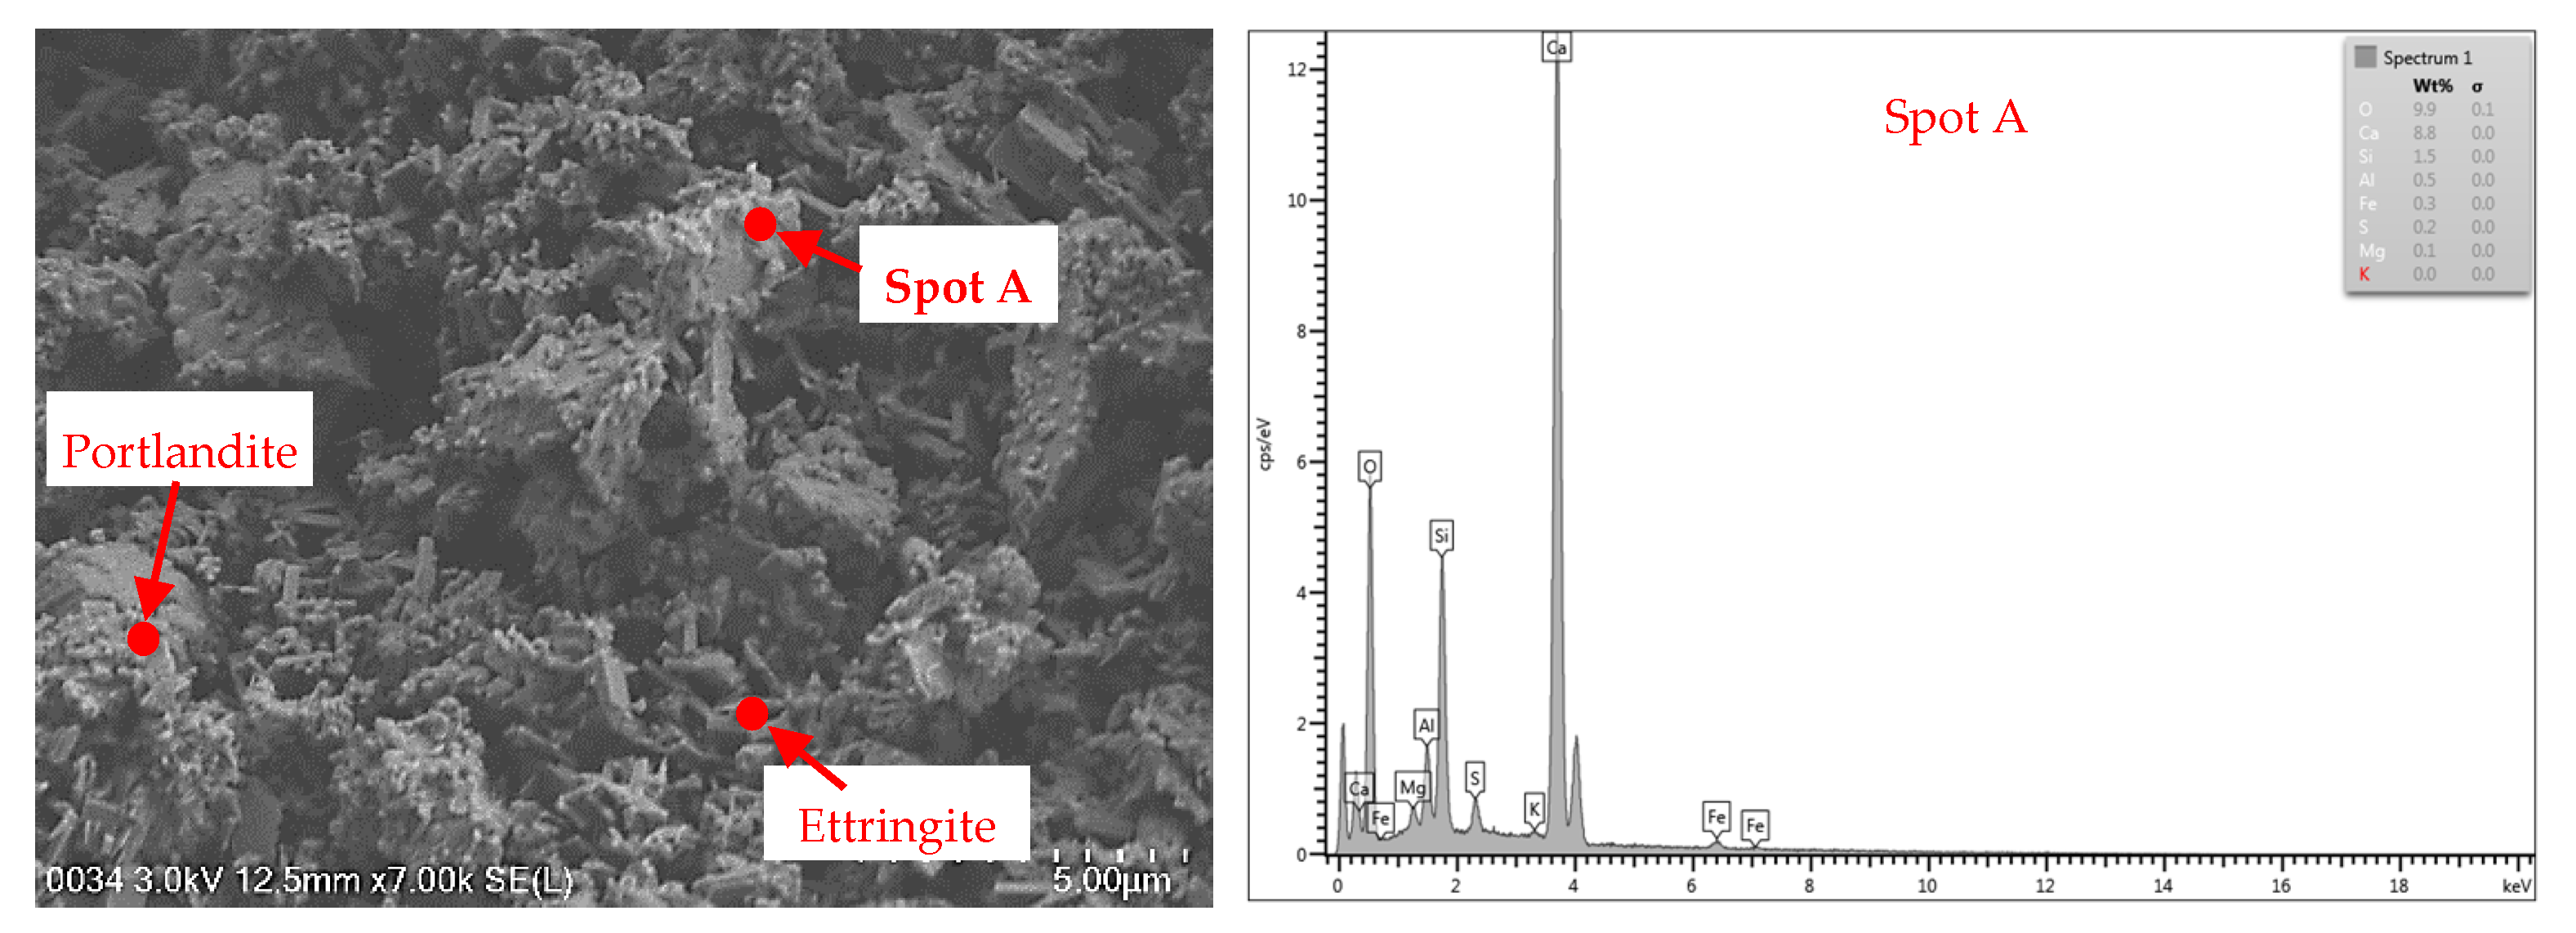
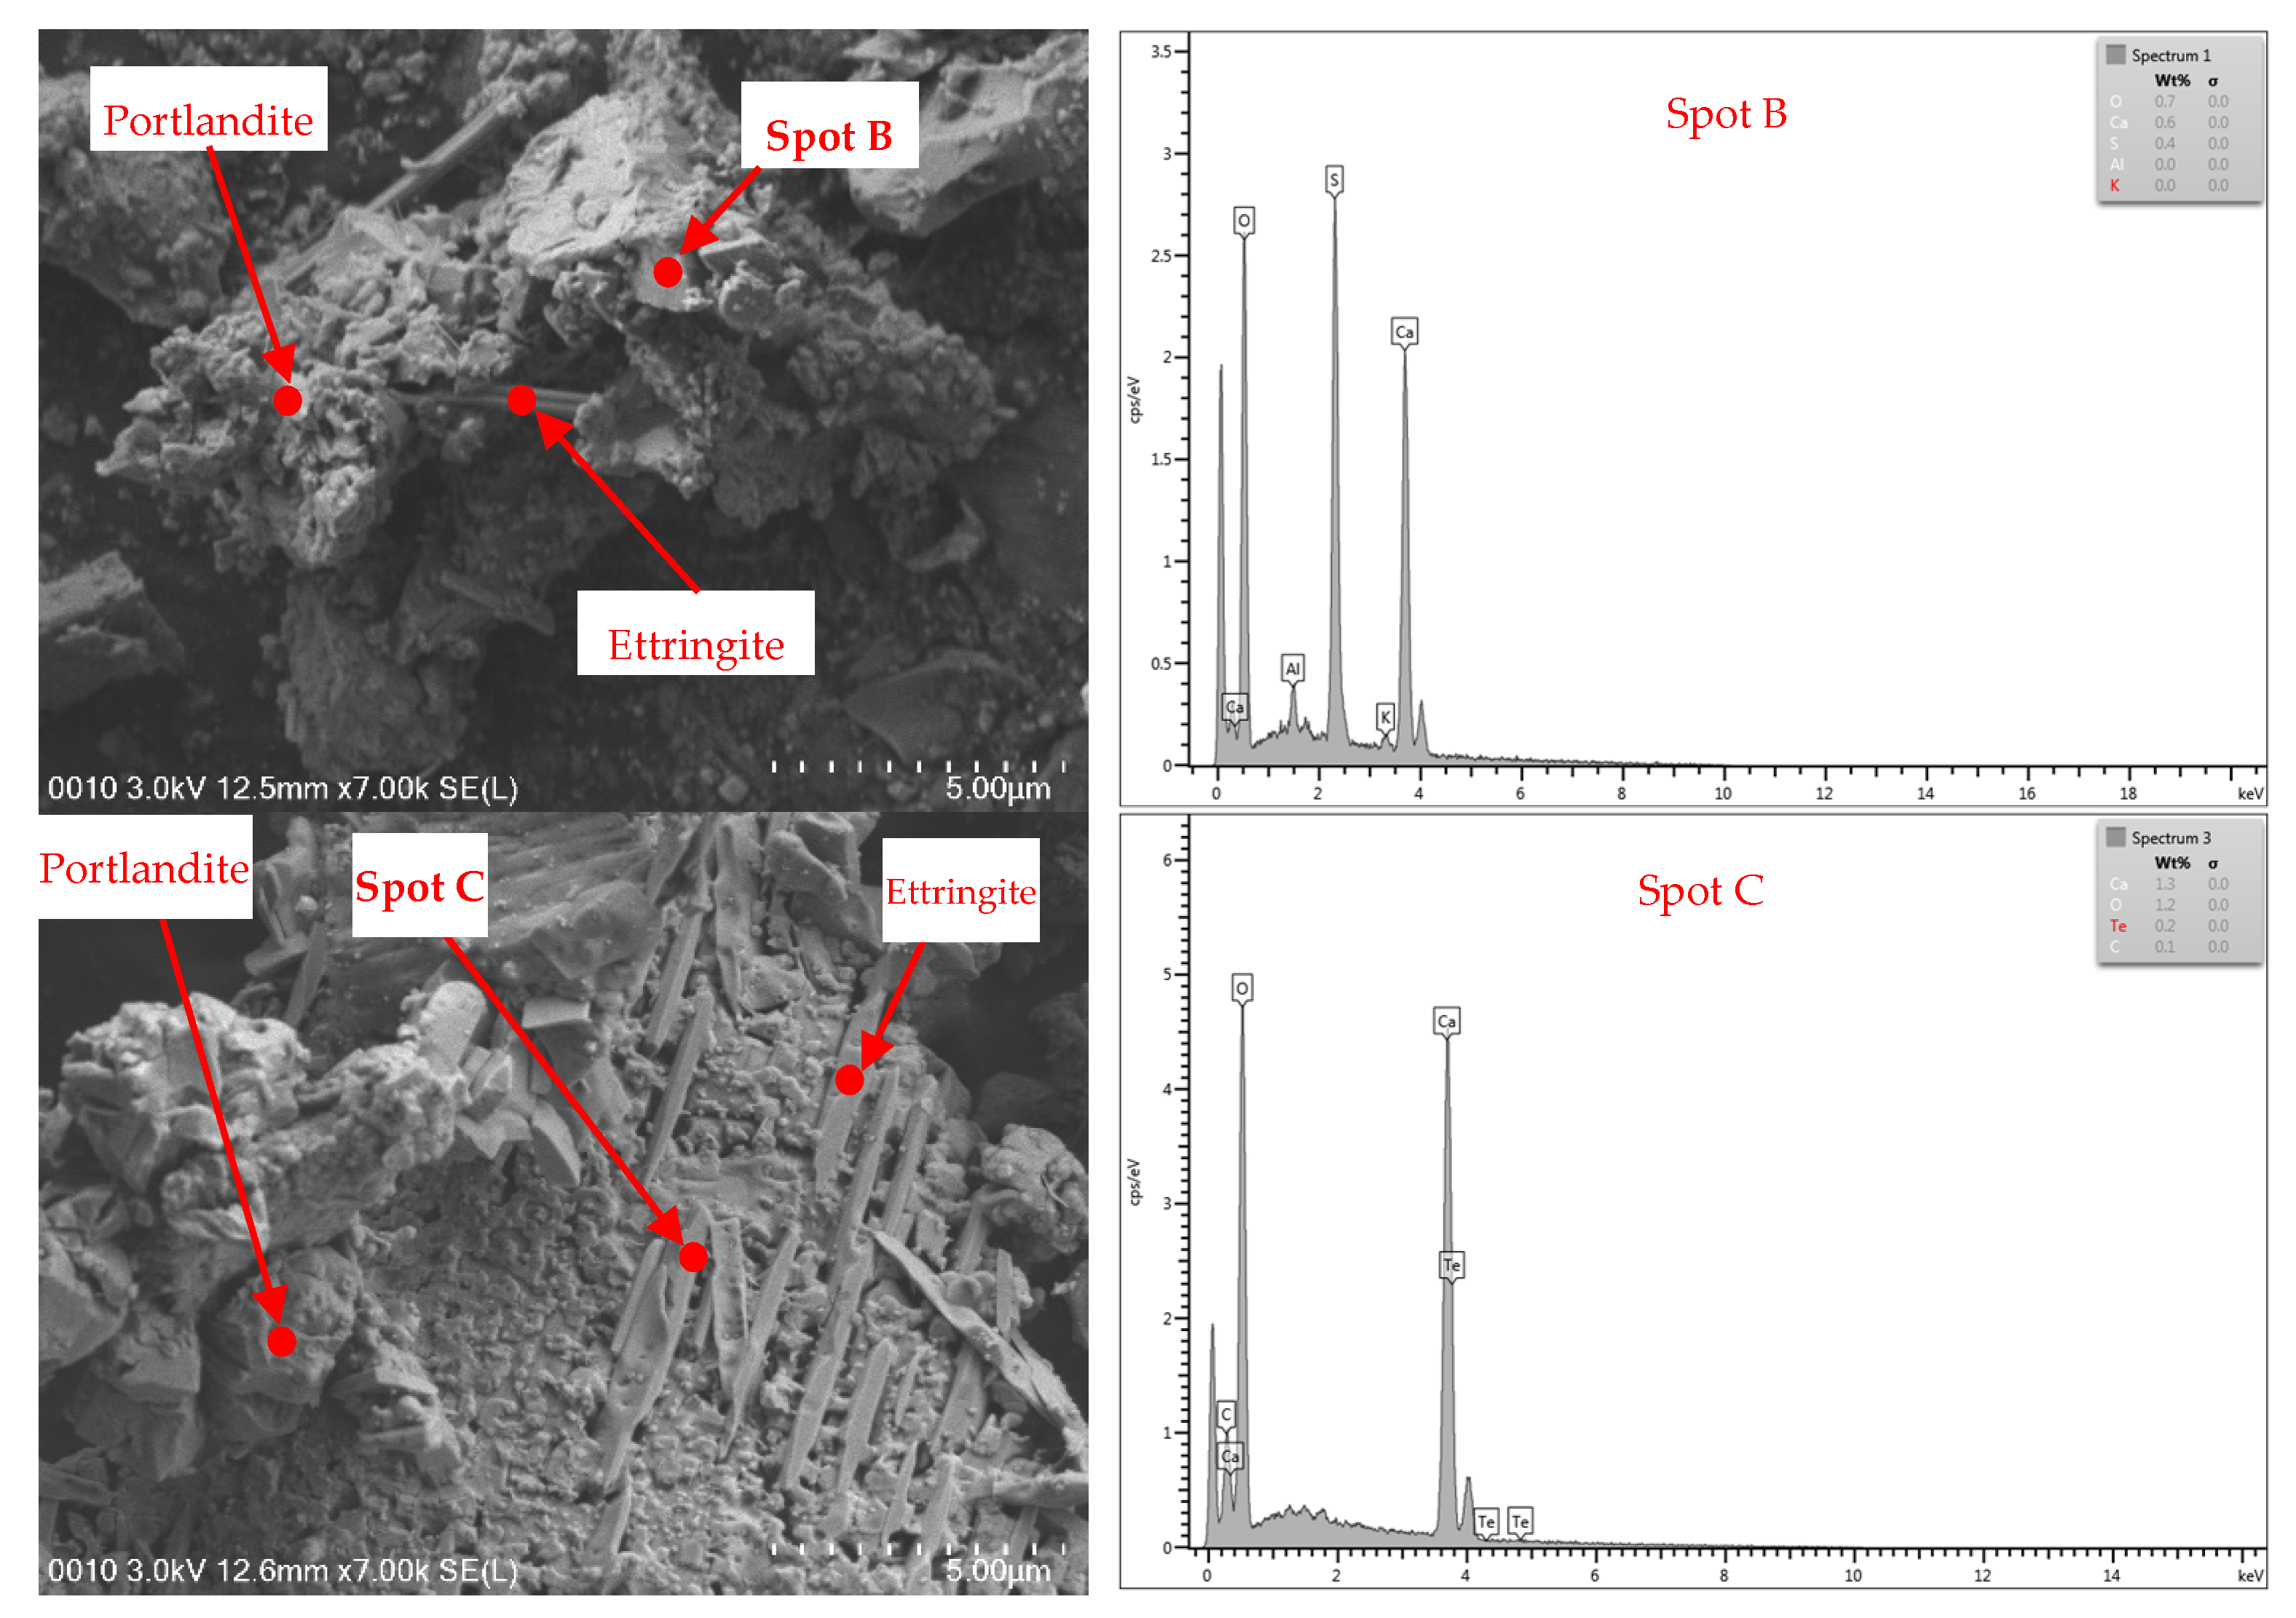
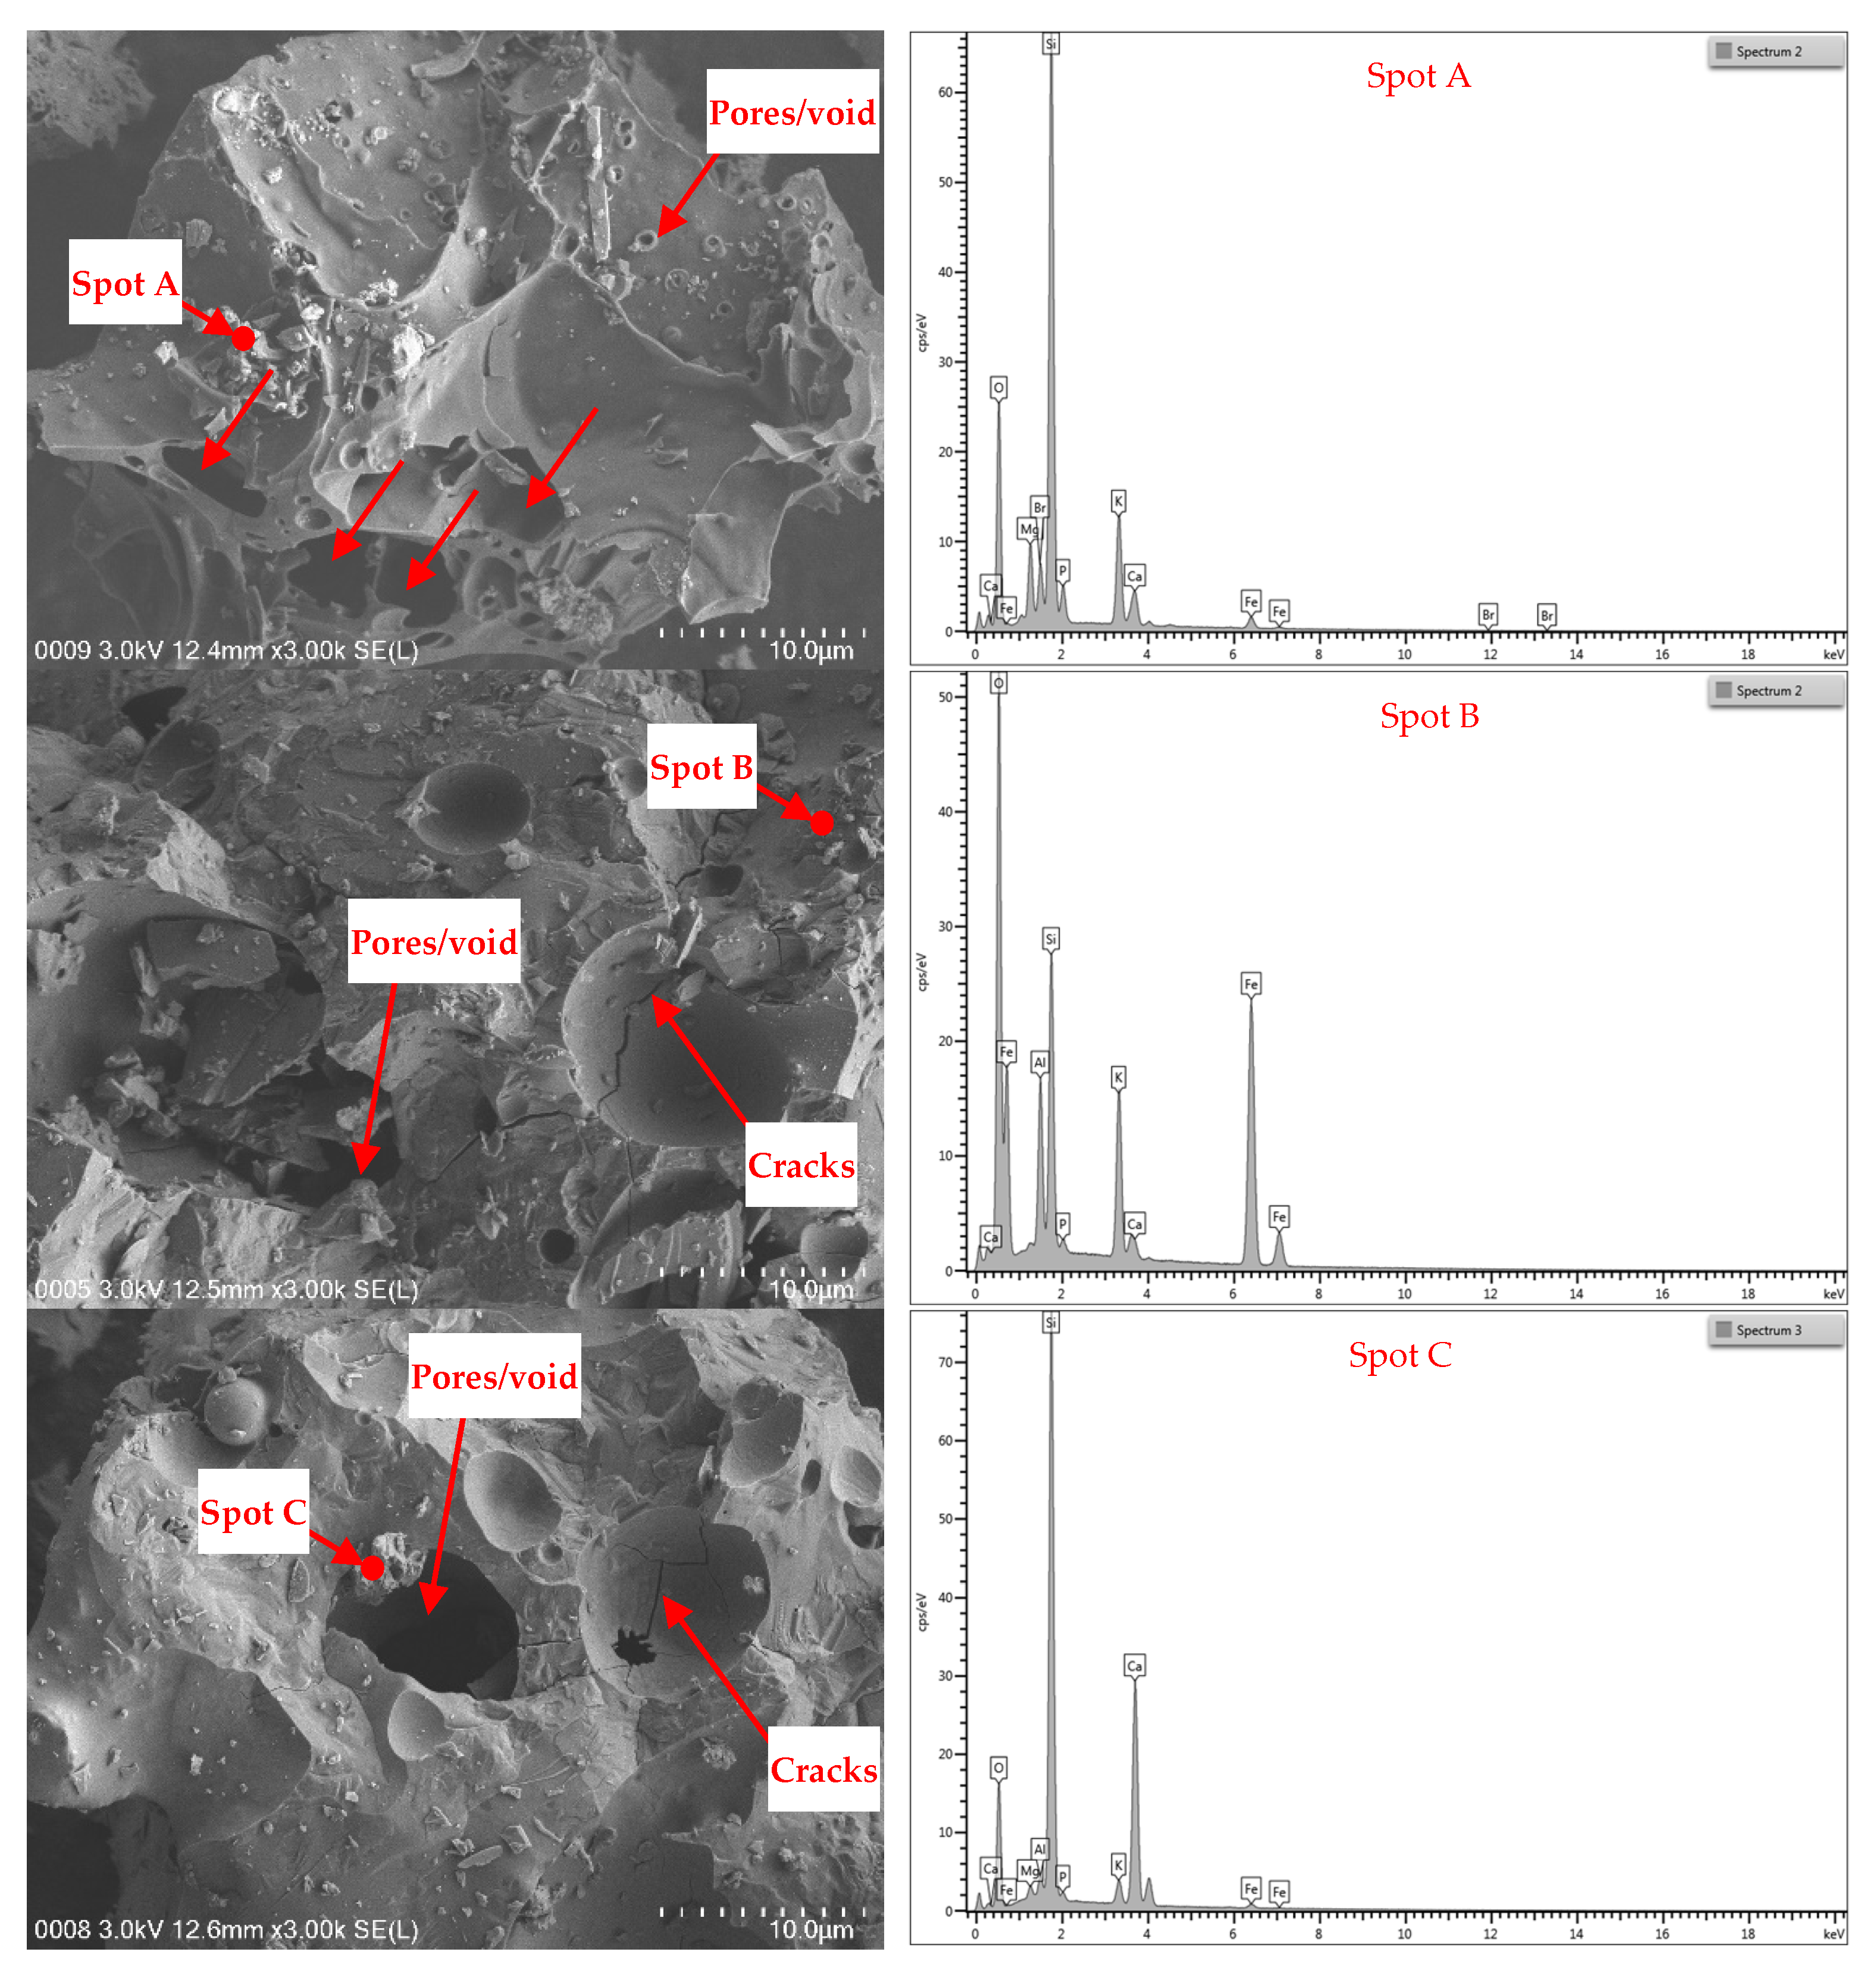
3.5. FESEM–EDX
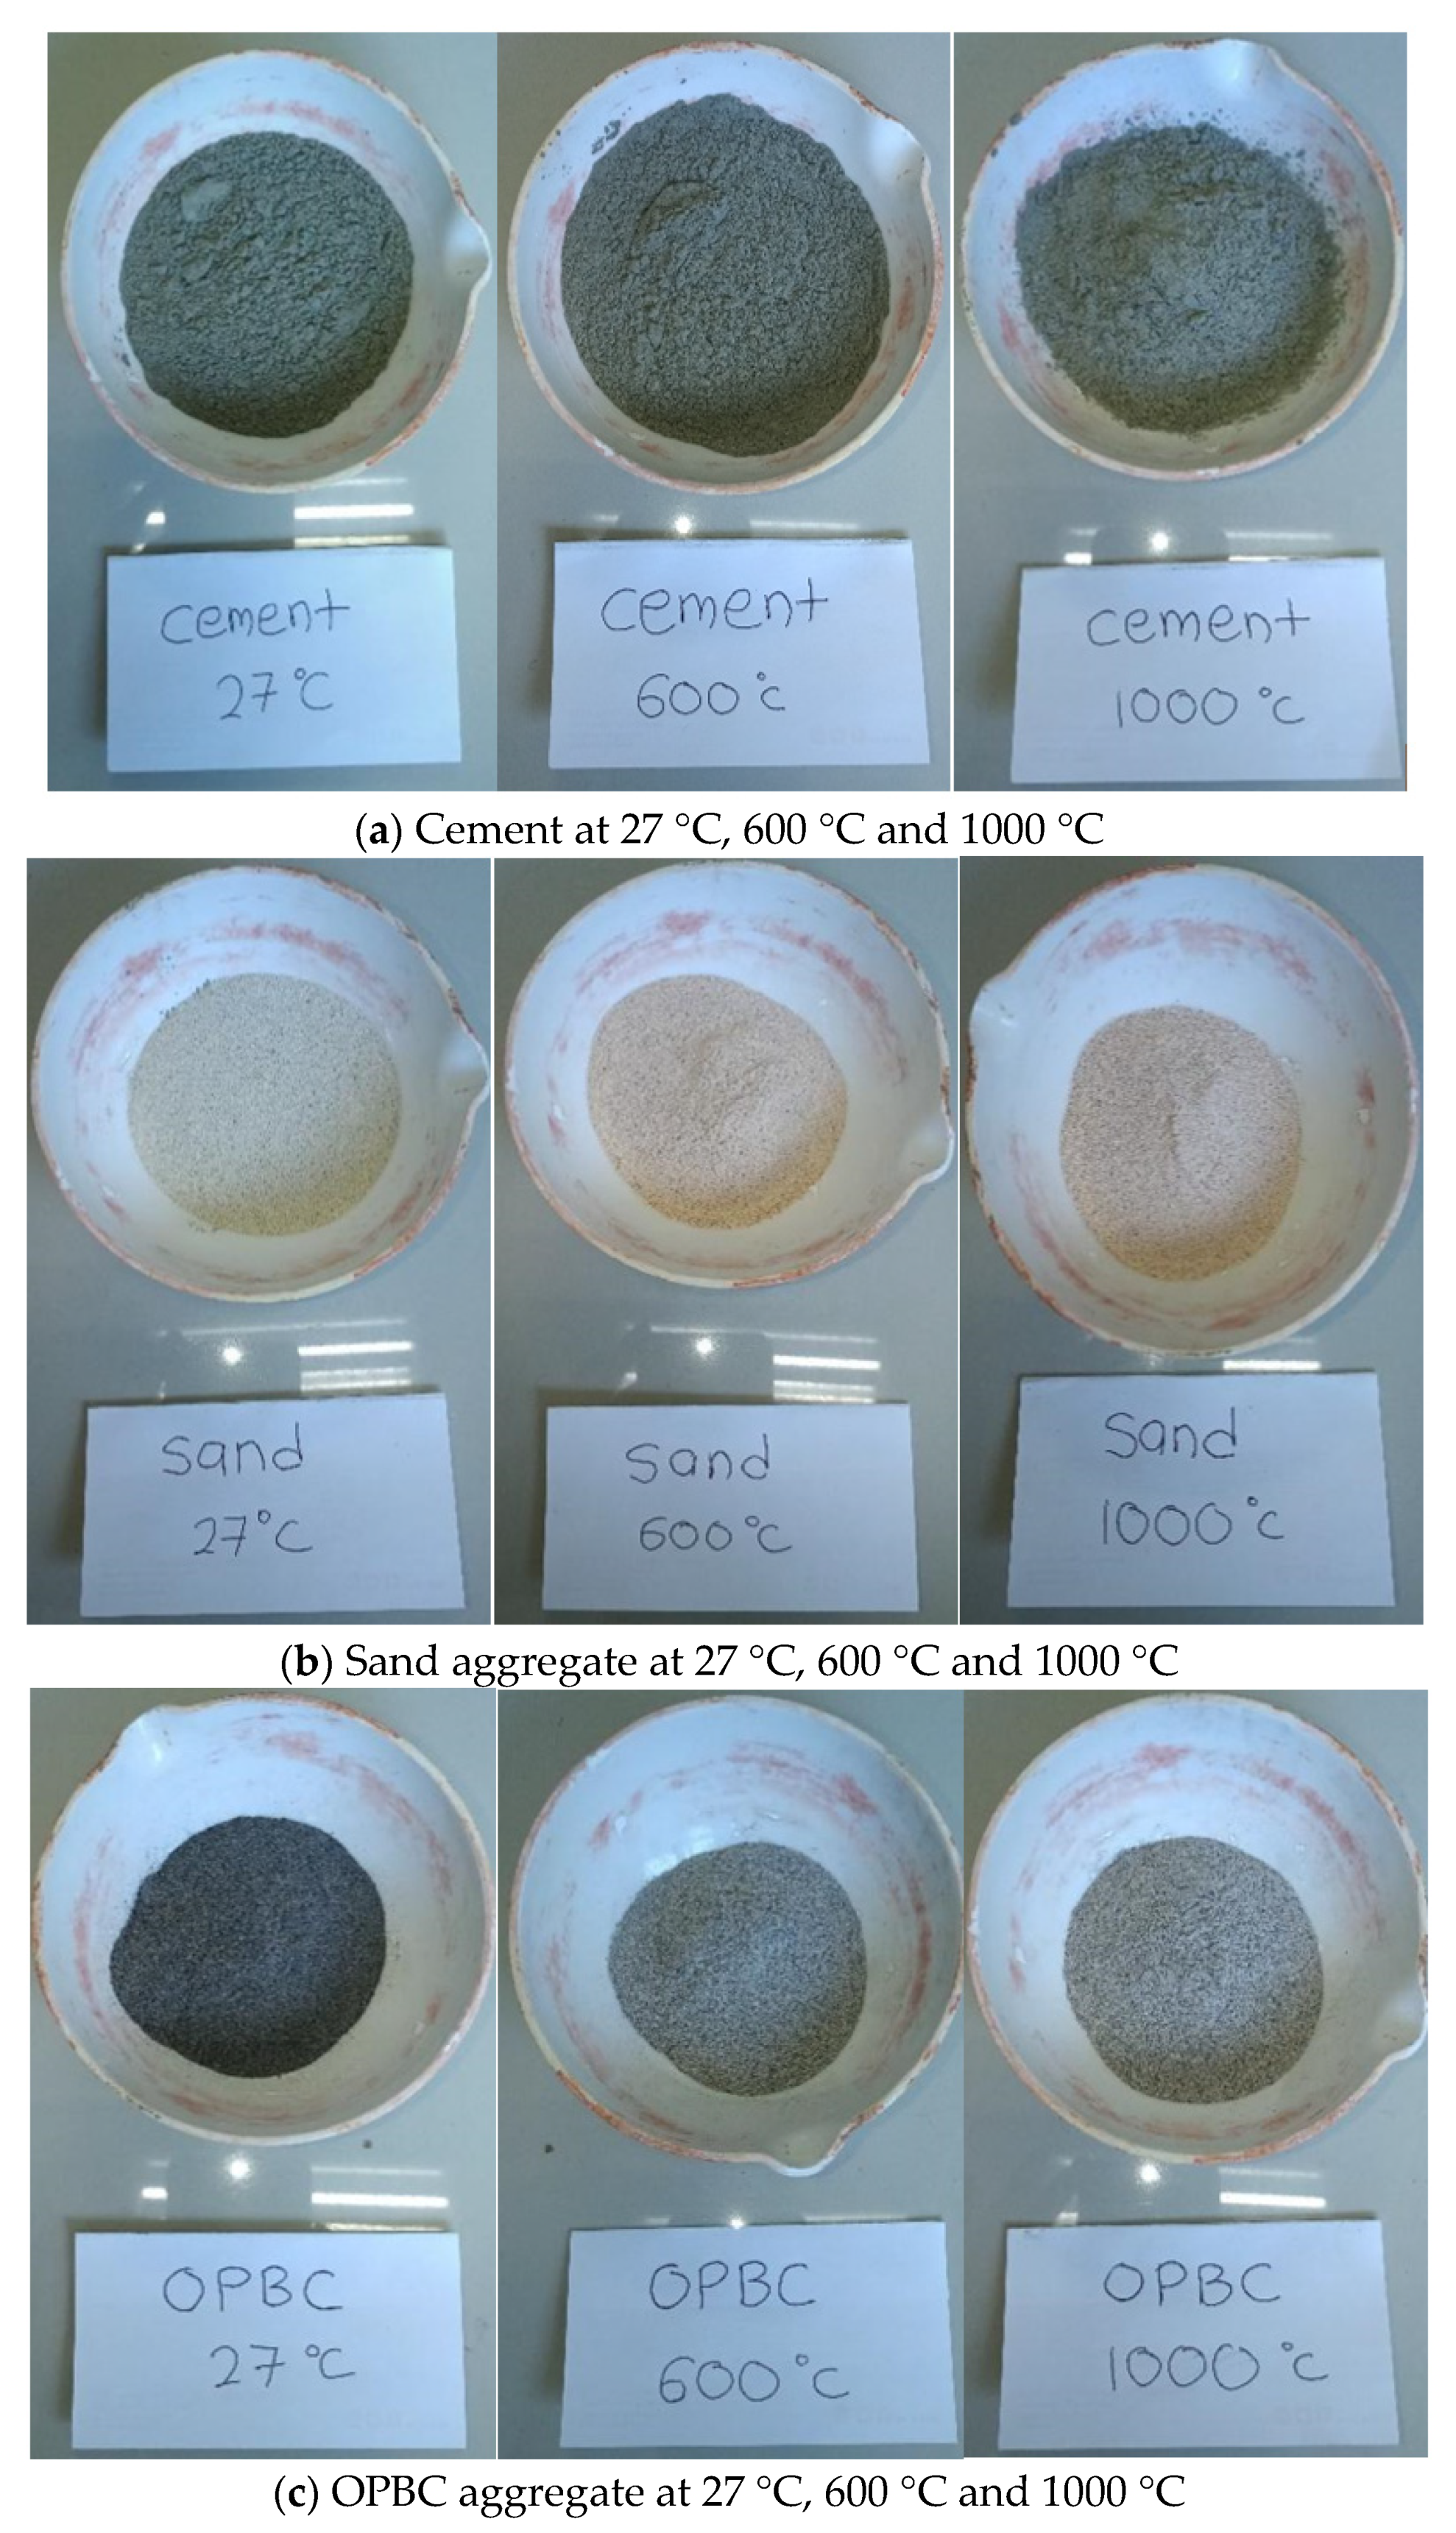
3.5.1. Cement
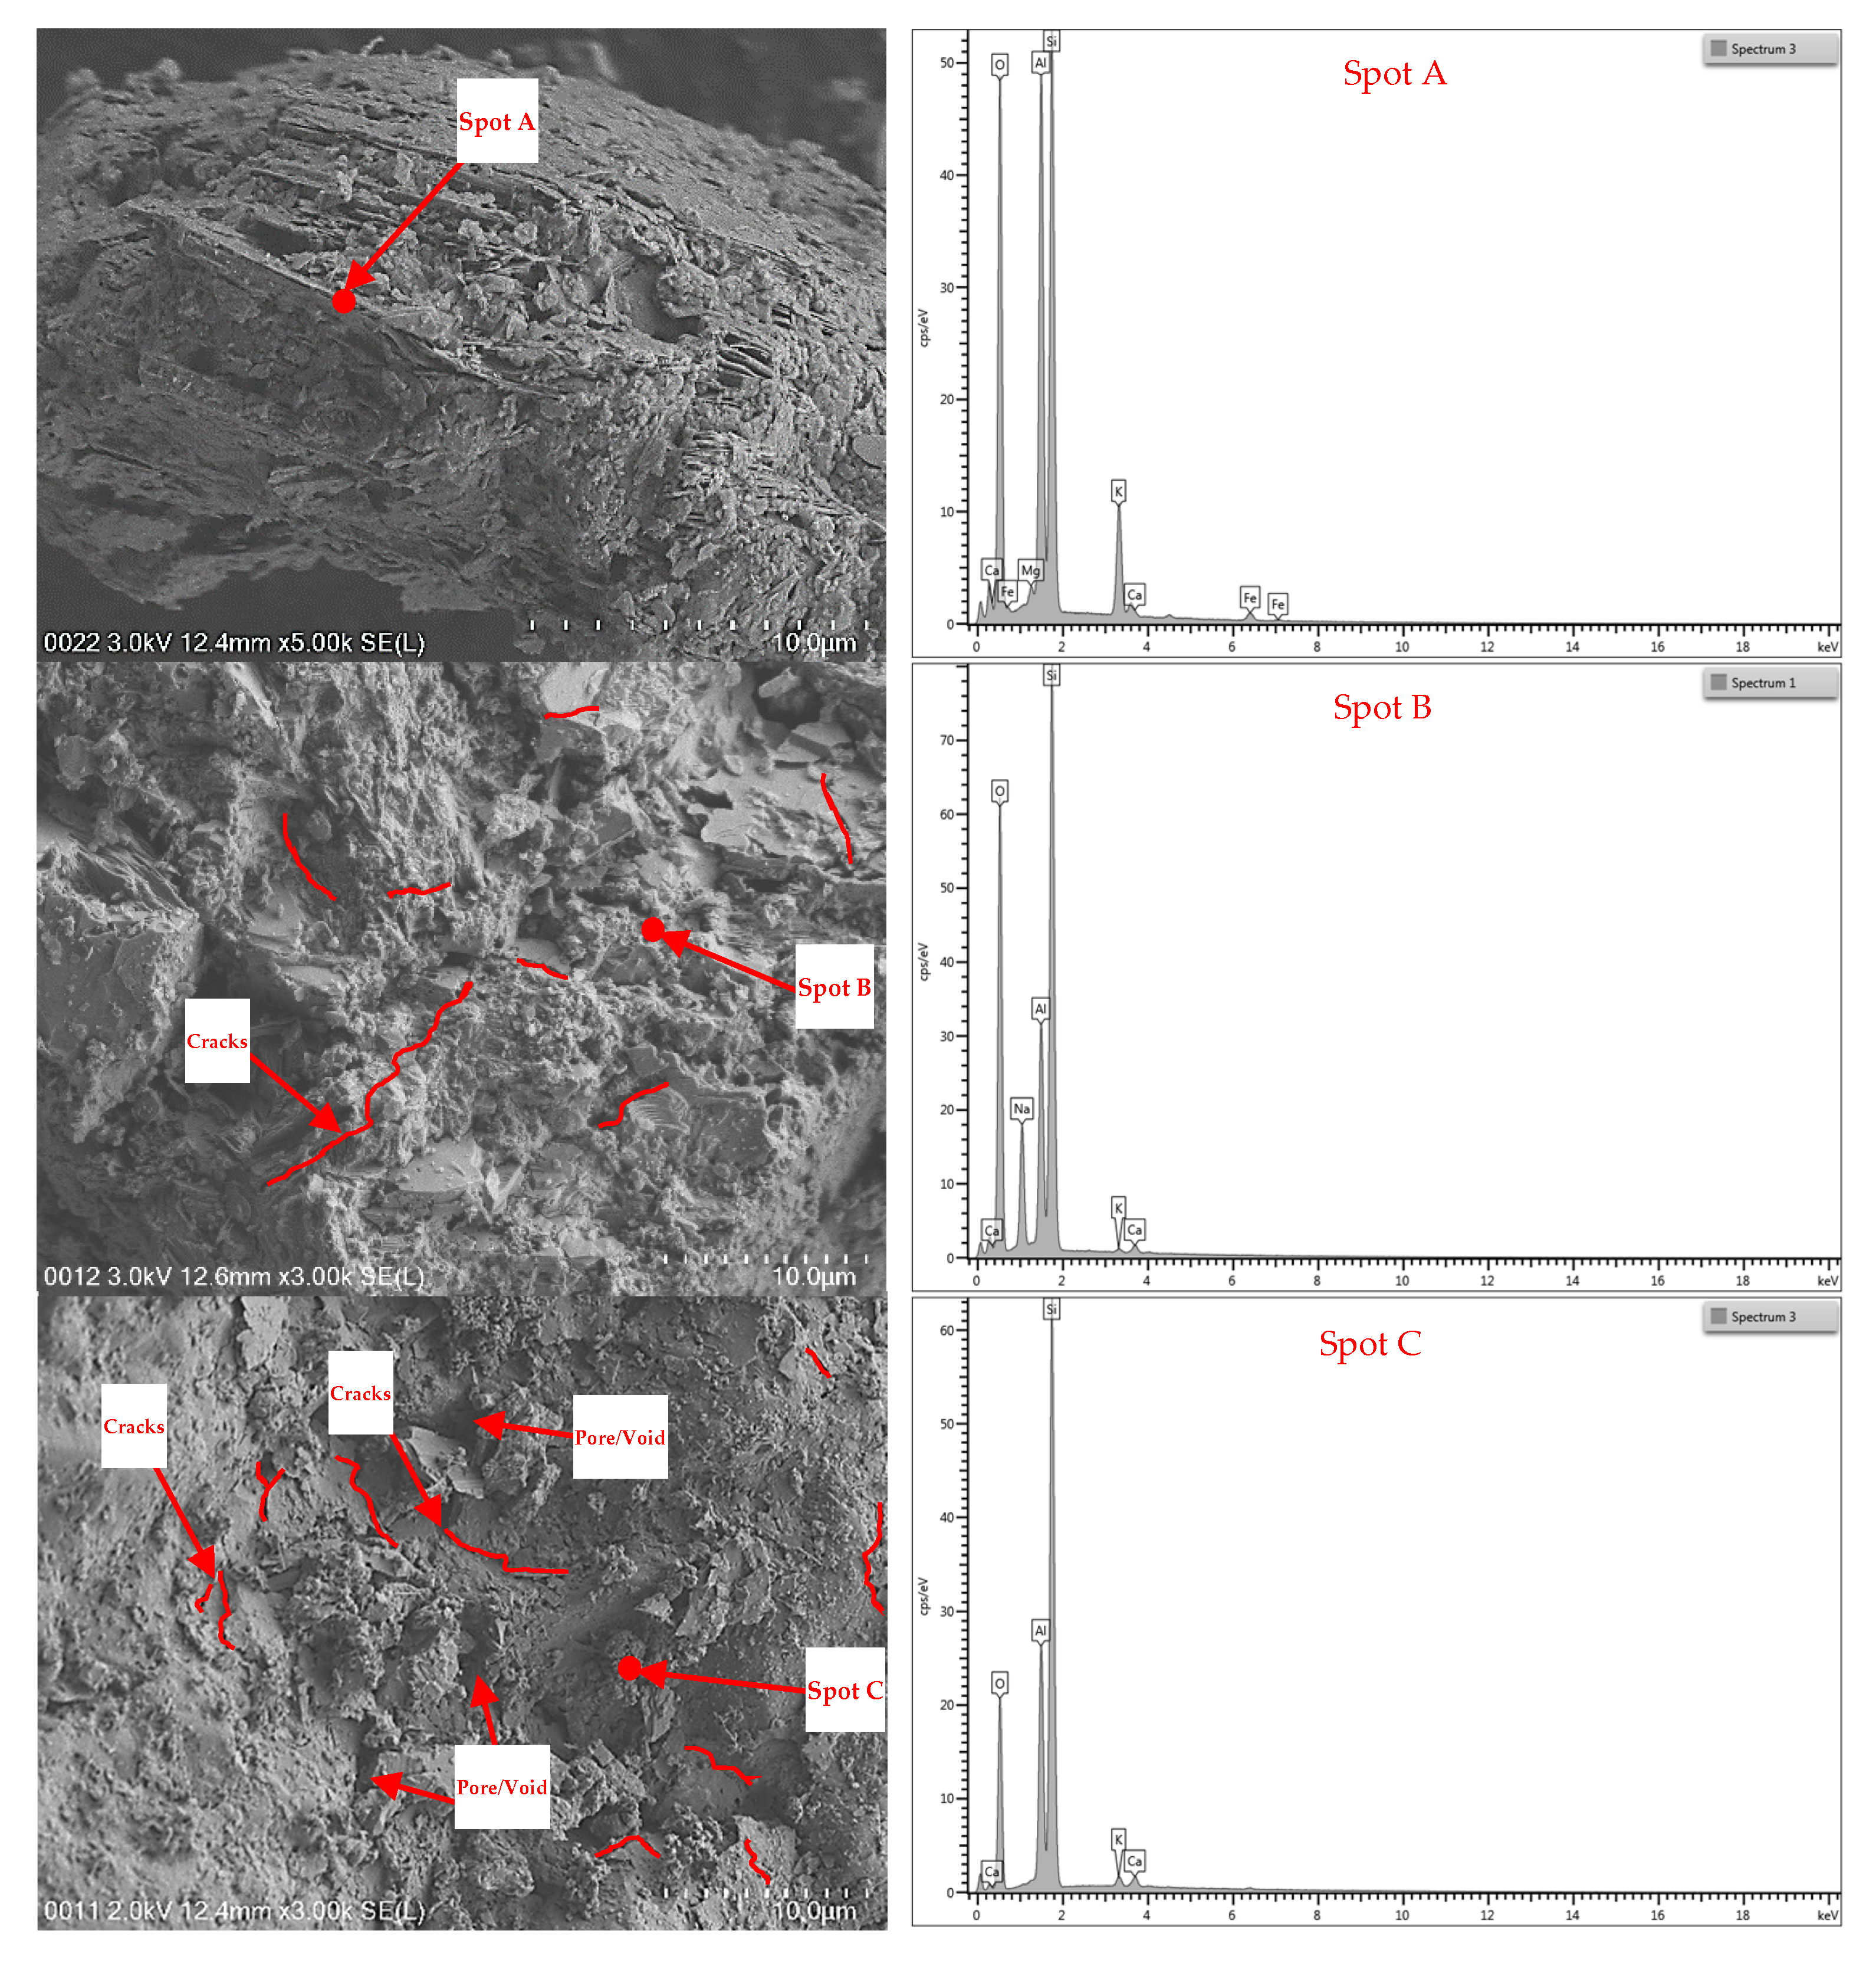
3.5.2. Aggregates
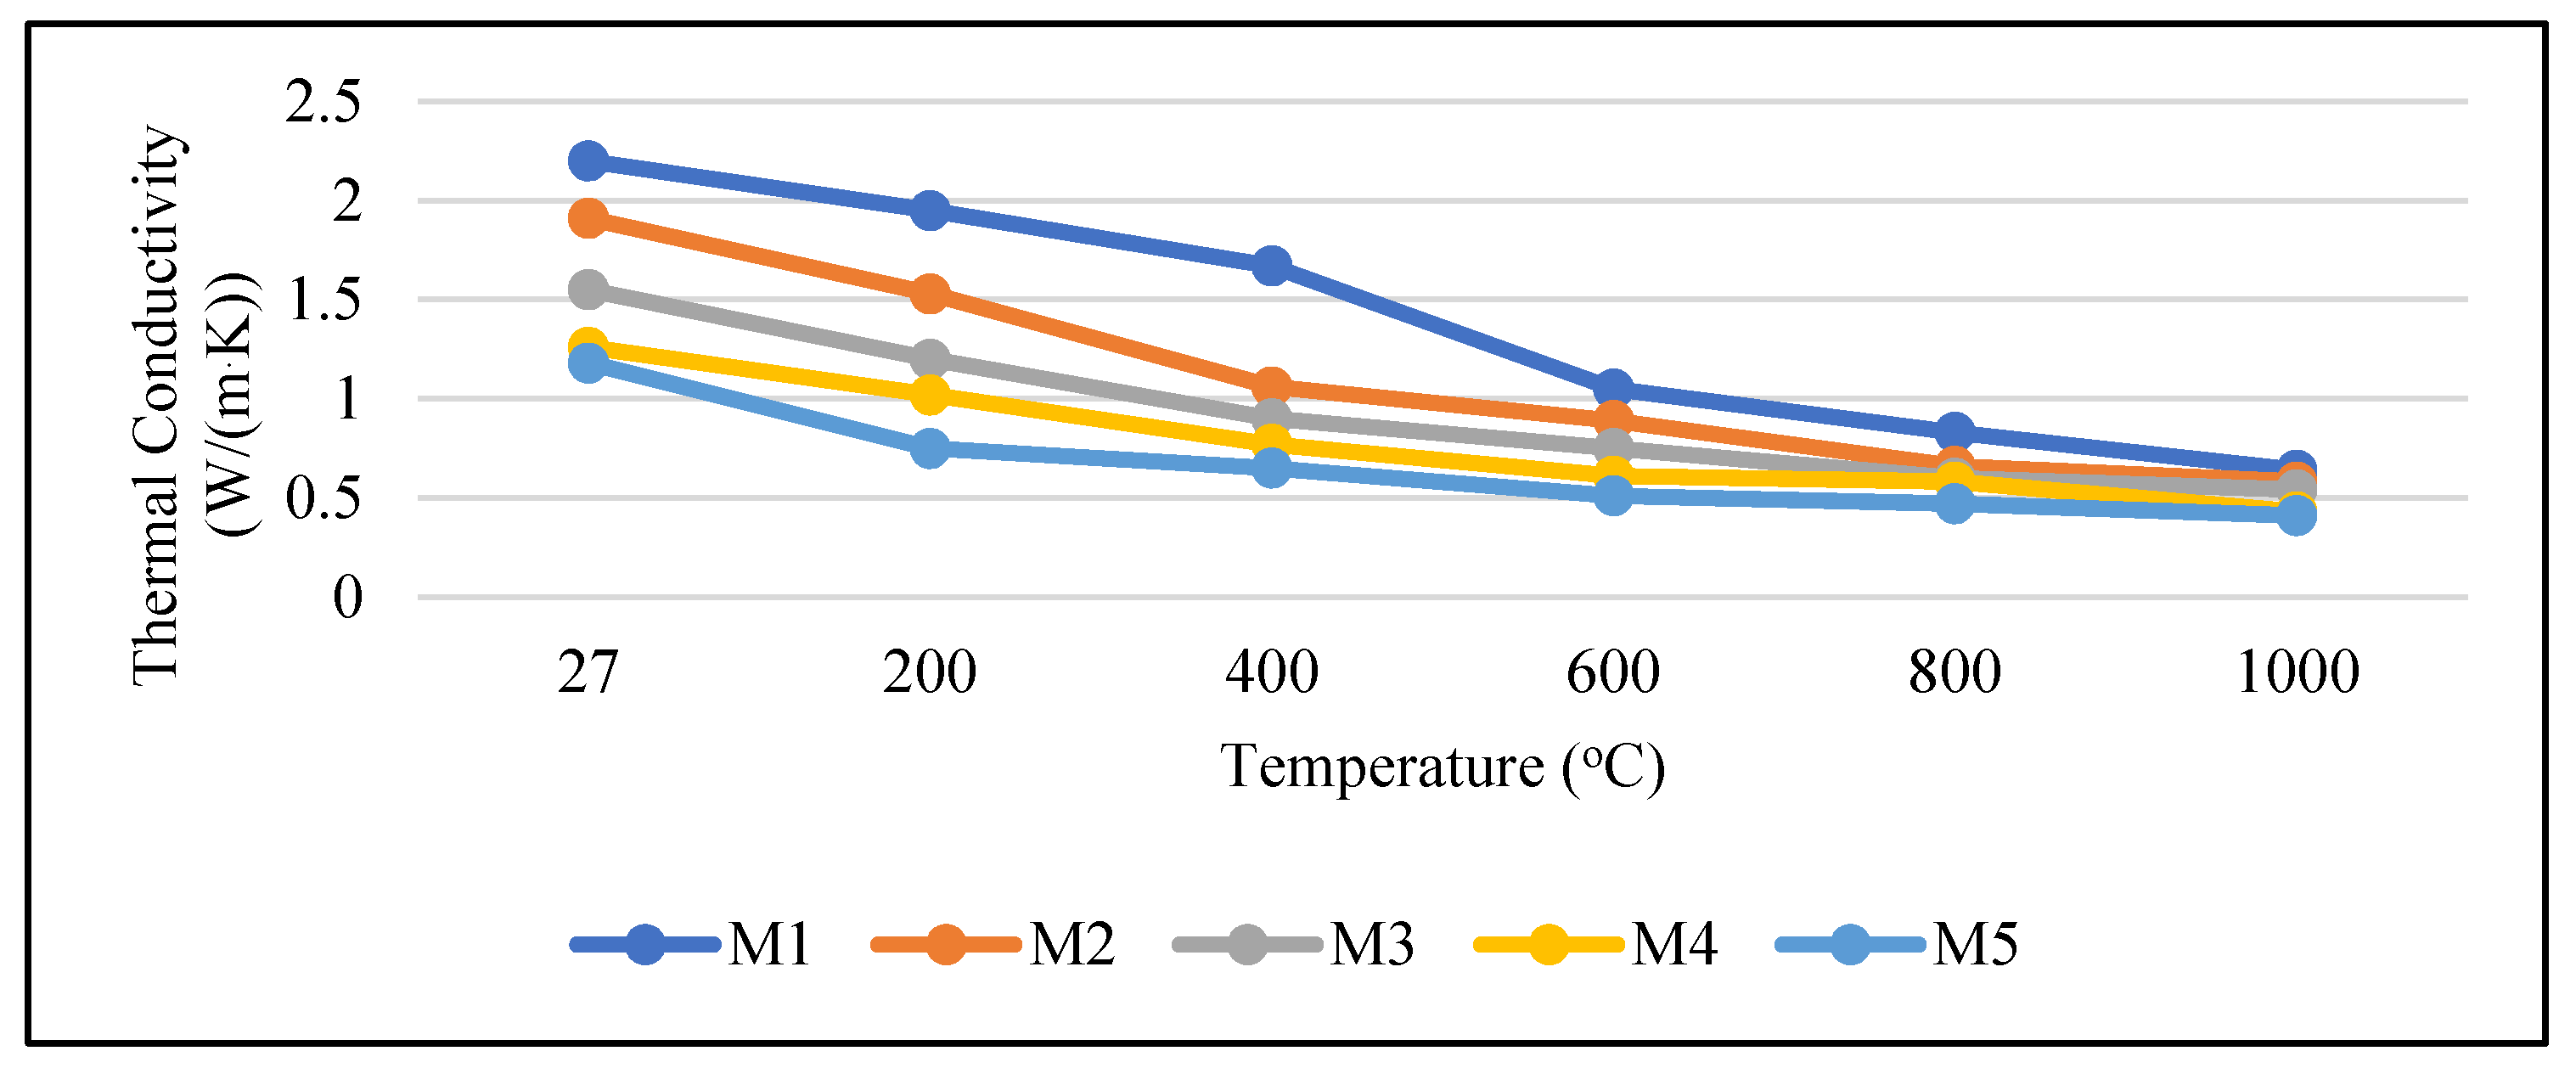
3.6. Thermal Conductivity
4. Conclusions
- Heating led to many changes, especially in the properties of cement mortar samples. These changes affected colour as reported in Section 3.2, mass loss in Section 3.3, compressive strength in Section 3.4, microstructure and mineral compositions in Section 3.5, and thermal conductivity in Section 3.6
- The colour of OPBC mortar samples was shown to fade and was higher in lightness contrast starting at the temperature of 400 °C. These changes may be an apparent indicator of the variation in the moisture content of the samples.
- Major mass loss was observed at the temperature of 600 °C, possibly due to the degradation of organic compounds in the presence of OPBC aggregate.
- The presence of OPBC in the mortar mixes resulted in an insignificant mass loss effect after exposure to heat of up to 600 °C.
- The existence of OPBC aggregate improved the compressive strength of mortar at elevated temperatures. The compressive strength of sample mixes at high temperatures was higher in both cooling conditions compared to that of the control mix.
- Amongst various blended samples, the M4 sample performed better at elevated temperatures. That is, the combination of 75% OPBC aggregate and 25% natural sand aggregate showed better performance in terms of mass loss and compressive strength, even at high temperatures.
- The effect of water-cooling condition on the samples showed less damage and higher compressive strength compared to that of the air-cooling condition.
- The FESEM images of the raw materials proved that the changes in colour, mass loss, and compressive strength of the samples at elevated temperatures were influenced by the microproperties of the constituent materials at unheated and heated conditions.
- The mortars containing OPBC aggregates resulted in lower thermal conductivity compared to the control cement mortar. This result demonstrated that OPBC mortar is suitable for use as a heat-resistant material. The higher the percentage of OPBC in the mortar was, the lower the k-value was. After heat exposure, the k-value of the samples decreased as the temperature increased.
Author Contributions
Funding
Institutional Review Board Statement
Informed Consent Statement
Data Availability Statement
Acknowledgments
Conflicts of Interest
References
- Namdar, A.; Feng, X. Economical considerations in the development of construction materials—A review. Eng. Rev. 2015, 35, 291–297. [Google Scholar]
- Hamzah, N.; Tokimatsu, K.; Yoshikawa, K. Solid fuel from oil palm biomass residues and municipal solid waste by hydrothermal treatment for electrical power generation in Malaysia: A review. J. Sustain. 2019, 11, 1060. [Google Scholar] [CrossRef]
- Samadi, M.; Hussin, M.W.; Seung Lee, H.; Mohd Sam, A.R.; Ismail, M.A.; Abdul Shukor Lim, N.H.; Ariffin, N.F.; Khalid, N.H.A. Properties of mortar containing ceramic powder waste as cement replacement. J. Teknol. 2015, 77, 12. [Google Scholar] [CrossRef]
- Kanadasan, J.; Razak, H.A. Engineering and sustainability performance of self-compacting palm oil mill incinerated waste concrete. J. Clean. Prod. 2015, 89, 78–86. [Google Scholar] [CrossRef]
- Zarina, Y.; Al Bakri, A.M.M.; Kamarudin, H.; Nizar, I.K.; Rafiza, A.R. Review on the various ash from palm oil waste as geopolymer material. Rev. Adv. Mater. Sci. 2013, 34, 37–43. [Google Scholar]
- Koehnken, L.; Rintoul, M.S.; Goichot, M.; Tickner, D.; Loftus, A.-C.; Acreman, M.C. Impacts of riverine sand mining on freshwater ecosystems: A review of the scientific evidence and guidance for future research. River Res. Appl. 2020, 36, 362–370. [Google Scholar] [CrossRef]
- Yusoff, S. Renewable energy from palm oil—Innovation on effective utilization of waste. J. Clean. Prod. 2006, 14, 87–93. [Google Scholar] [CrossRef]
- Thomas, B.S.; Kumar, S.; Arel, H.S. Sustainable concrete containing palm oil fuel ash as a supplementary cementitious material—A review. Renew. Sustain. Energy Rev. 2017, 80, 550–561. [Google Scholar] [CrossRef]
- Aslam, M.; Shafigh, P.; Nomeli, M.A.; Jumaat, M.Z. Manufacturing of high-strength lightweight aggregate concrete using blended coarse lightweight aggregates. J. Build. Eng. 2017, 13, 53–62. [Google Scholar] [CrossRef]
- Aslam, M.; Shafigh, P.; Jumaat, M.Z.; Lachemi, M. Benefits of using blended waste coarse lightweight aggregates in structural lightweight aggregate concrete. J. Clean. Prod. 2016, 119, 108–117. [Google Scholar] [CrossRef]
- Shafigh, P.; Mahmud, H.B.; Jumaat, M.Z.B.; Ahmmad, R.; Bahri, S. Structural lightweight aggregate concrete using two types of waste from the palm oil industry as aggregate. J. Clean. Prod. 2014, 80, 187–196. [Google Scholar] [CrossRef]
- Aslam, M.; Shafigh, P.; Jumaat, M.Z. High strength lightweight aggregate concrete using blended coarse lightweight aggregate origin from palm oil industry. Sains Malays. 2017, 46, 667–675. [Google Scholar] [CrossRef]
- Hartono, H.; Chai, L.J.; Lee, B. Lightweight Concrete Using Oil Palm Boiler Clinker (OPBC)—A Review. MATEC Web Conf. 2016, 47, 1012. [Google Scholar] [CrossRef]
- Jumaat, M.Z.; Alengaram, U.J.; Ahmmad, R.; Bahri, S.; Islam, A.B.M.S. Characteristics of palm oil clinker as replacement for oil palm shell in lightweight concrete subjected to elevated temperature. Constr. Build. Mater. 2015, 101, 942–951. [Google Scholar] [CrossRef]
- Alengaram, U.J.; Al Muhit, B.A.; Jumaat, M.Z. Utilization of oil palm kernel shell as lightweight aggregate in concrete—A review. Constr. Build. Mater. 2013, 38, 161–172. [Google Scholar] [CrossRef]
- Asadi, I.; Shafigh, P.; Hassan, Z.F.B.A.; Mahyuddin, N.B. Thermal conductivity of concrete—A review. J. Build. Eng. 2018, 20, 81–93. [Google Scholar] [CrossRef]
- Abid, M.; Hou, X.; Zheng, W.; Hussain, R.R. High temperature and residual properties of reactive powder concrete—A review. Constr. Build. Mater. 2017, 147, 339–351. [Google Scholar] [CrossRef]
- Alonso, C.; Fernandez, L. Dehydration and rehydration processes of cement paste exposed to high temperature environments. J. Mater. Sci. 2004, 39, 3015–3024. [Google Scholar] [CrossRef]
- Ma, Q.; Guo, R.; Zhao, Z.; Lin, Z.; He, K. Mechanical properties of concrete at high temperature—A review. Constr. Build. Mater. 2015, 93, 371–383. [Google Scholar] [CrossRef]
- Chai, L.J.; Shafigh, P.; Bin Mahmud, H. Production of high-strength lightweight concrete using waste lightweight oil-palm-boiler-clinker and limestone powder. Eur. J. Environ. Civ. Eng. 2019, 23, 325–344. [Google Scholar] [CrossRef]
- Ahmad, H. Mechanical properties of palm oil clinker concrete. In Proceedings of the EnCon 2007, Kuching, Malaysia, 27–28 December 2007. [Google Scholar]
- Ahmad, H.; Hilton, M.; Mohd Noor, N. Physical properties of local palm oil clinker and fly ash. In Proceedings of the EnCon 2007, Kuching, Malaysia, 27–28 December 2007. [Google Scholar]
- Teo, D.C.L.; Mannan, M.A.; Kurian, V.J. Structural concrete using oil palm shell (OPS) as lightweight aggregate. Turk. J. Eng. Environ. Sci. 2006, 30, 251–257. [Google Scholar]
- Sajedi, F. Effect of curing regime and temperature on the compressive strength of cement-slag mortars. Constr. Build. Mater. 2012, 36, 549–556. [Google Scholar] [CrossRef]
- Li, X.; Ma, X.; Zhang, S.; Zheng, E. Mechanical properties and microstructure of class C fly ash-based geopolymer paste and mortar. Materials 2013, 6, 1485–1495. [Google Scholar] [CrossRef] [PubMed]
- Phoo-ngernkham, T.; Sata, V.; Hanjitsuwan, S.; Ridtirud, C.; Hatanaka, S.; Chindaprasirt, P. Compressive strength, bending and fracture characteristics of high calcium fly ash geopolymer mortar containing Portland cement cured at ambient temperature. Arab. J. Sci. Eng. 2016, 41, 1263–1271. [Google Scholar] [CrossRef]
- Karahan, O.; Durak, U.; İlkentapar, S.; Atabey, İ.İ.; Atiş, C.D. Resistance of polypropylene fibered mortar to elevated temperature under different cooling regimes. J. Constr. 2020, 18, 386–397. [Google Scholar] [CrossRef]
- Selim, F.; Amin, M.S.; Ramadan, M.; Hazem, M.M. Effect of elevated temperature and cooling regimes on the compressive strength, microstructure and radiation attenuation of fly ash–cement composites modified with miscellaneous nanoparticles. Constr. Build. Mater. 2020, 258, 119648. [Google Scholar] [CrossRef]
- Yang, S.; Ling, T.C.; Poon, C.S. High temperature performance of wet-mix and dry-mix mortars prepared with different contents and size gradings of glass aggregates: Hot test and cold test. Cem. Concr. Compos. 2020, 108, 103548. [Google Scholar] [CrossRef]
- Pham, S.; Prince, W. Effects of high temperature on the microstructure of cement mortar. Appl. Mech. Mater. 2014, 556–562, 969–972. [Google Scholar] [CrossRef]
- Tantawy, M. Effect of high temperatures on the microstructure of cement paste. J. Mater. Sci. Chem. Eng. 2017, 5, 33. [Google Scholar] [CrossRef]
- Fernandes, B.; Gil, A.M.; Bolina, F.L.; Tutikian, B.F. Microstructure of concrete subjected to elevated temperatures: Physico-chemical changes and analysis techniques. Rev. IBRACON Estrut. Mater. 2017, 10, 838–863. [Google Scholar] [CrossRef]
- Ahmed, A.; Al-Shaikh, A.; Arafat, T. Residual compressive and bond strengths of limestone aggregate concrete subjected to elevated temperatures. Mag. Concr. Res. 1992, 44, 117–125. [Google Scholar] [CrossRef]
- Khoury, G. Compressive strength of concrete at high temperatures: A reassessment. Mag. Concr. Res. 1992, 44, 291–309. [Google Scholar] [CrossRef]
- Mohamedbhai, G. Effect of exposure time and rates of heating and cooling on residual strength of heated concrete. Mag. Concr. Res. 1986, 38, 151–158. [Google Scholar] [CrossRef]
- Sarshar, R.; Khoury, G. Material and environmental factors influencing the compressive strength of unsealed cement paste and concrete at high temperatures. Mag. Concr. Res. 1993, 45, 51–61. [Google Scholar] [CrossRef]
- Karim, M.R.; Chowdhury, F.I.; Zabed, H.; Saidur, M.R. Effect of elevated temperatures on compressive strength and microstructure of cement paste containing palm oil clinker powder. Constr. Build. Mater. 2018, 183, 376–383. [Google Scholar] [CrossRef]
- Karim, M.R.; Hashim, H.; Razak, H.A.; Yusoff, S. Characterization of palm oil clinker powder for utilization in cement-based applications. Constr. Build. Mater. 2017, 135, 21–29. [Google Scholar] [CrossRef]
- Standard, M. Portland Cement (Ordinary and Rapid-Hardening): Part 1: Specification (Second Revision); MS522: Part 1:2003; Department of Standards Malaysia (DSM): Kuala Lumpur, Malaysia, 2003. [Google Scholar]
- Institution, B.S. Specification for Aggregates from Natural Sources for Concrete in Fine Aggregate; British Standards Institution: London, UK, 1992. [Google Scholar]
- Shi, X.; Fay, L.; Peterson, M.M.; Berry, M.; Mooney, M. A FESEM/EDX investigation into how continuous deicer exposure affects the chemistry of Portland cement concrete. Constr. Build. Mater. 2011, 25, 957–966. [Google Scholar] [CrossRef]
- Kanadasan, J.; Razak, H.A.; Subramaniam, V. Properties of high flowable mortar containing high volume palm oil clinker (POC) fine for eco-friendly construction. J. Clean. Prod. 2018, 170, 1244–1259. [Google Scholar] [CrossRef]
- Mo, K.H.; Thomas, B.S.; Yap, S.P.; Abutaha, F.; Tan, C.G. Viability of agricultural wastes as substitute of natural aggregate in concrete: A review on the durability-related properties. J. Clean. Prod. 2020, 275, 123062. [Google Scholar] [CrossRef]
- Salomão, M.C.d.F.; Bauer, E.; Kazmierczak, C.d.S. Drying parameters of rendering mortars. Ambiente Construído 2018, 18, 7–19. [Google Scholar] [CrossRef]
- Shoaib, M.M.; Ahmed, S.A.; Balaha, M.M. Effect of fire and cooling mode on the properties of slag mortars. Cem. Concr. Res. 2001, 31, 1533–1538. [Google Scholar] [CrossRef]
- Smyl, D.; Ghasemzadeh, F.; Pour-Ghaz, M. Modeling water absorption in concrete and mortar with distributed damage. Constr. Build. Mater. 2016, 125, 438–449. [Google Scholar] [CrossRef]
- Yüzer, N.; Aköz, F.; Öztürk, L.D. Compressive strength–color change relation in mortars at high temperature. Cem. Concr. Res. 2004, 34, 1803–1807. [Google Scholar] [CrossRef]
- Hager, I. Colour Change in Heated Concrete. Fire Technol. 2014, 50, 945–958. [Google Scholar] [CrossRef]
- Hager, I. Behaviour of cement concrete at high temperature. Bull. Pol. Acad. Sci. Tech. Sci. 2013, 61, 145–154. [Google Scholar] [CrossRef]
- Zihms, S.; Switzer, C.; Karstunen, J.I.M. Effects of high temperature processes on physical properties of silica sand. Eng. Geol. 2013, 164, 139–145. [Google Scholar] [CrossRef]
- Heikal, M.; El-Didamony, H.; Sokkary, T.M.; Ahmed, I.A. Behavior of composite cement pastes containing microsilica and fly ash at elevated temperature. Constr. Build. Mater. 2013, 38, 1180–1190. [Google Scholar] [CrossRef]
- Morsy, M.; Alsayed, S.; Aqel, M. Effect of elevated temperature on mechanical properties and microstructure of silica flour concrete. Int. J. Civ. Environ. Eng. 2010, 10, 1–6. [Google Scholar]
- Shoaib, M.M.; Balaha, M.M.; Abdel-Rahman, A.G. Influence of cement kiln dust substitution on the mechanical properties of concrete. Cem. Concr. Res. 2000, 30, 371–377. [Google Scholar] [CrossRef]
- Khurram, N.; Khan, K.; Saleem, M.U.; Amin, M.N.; Akma, U. Effect of Elevated Temperatures on Mortar with Naturally Occuring Volcanic Ash and Its Blend with Electric Arc Furnace Slag. Adv. Mater. Sci. Eng. 2018, 2018, 5324036. [Google Scholar] [CrossRef]
- Xiao, J.; König, G. Study on concrete at high temperature in China—An overview. Fire Saf. J. 2004, 39, 89–103. [Google Scholar] [CrossRef]
- Kürklü, G. The effect of high temperature on the design of blast furnace slag and coarse fly ash-based geopolymer mortar. Compos. Part B Eng. 2016, 92, 9–18. [Google Scholar] [CrossRef]
- Dao, D.; Forth, J. Investigation of the Behaviour of Geopolymer Mortar After Heating to Elevated Temperatures. In Proceedings of the 3rd International Conference on Sustainable Construction Materials and Technologies, Kyoto, Japan, 18–21 August 2013. [Google Scholar]
- Zhou, J.; Lu, D.; Yang, Y.; Gong, Y.; Ma, X.; Yu, B.; Yan, B. Physical and mechanical properties of high strength concrete modified with supplementary cementitious materials after exposure to elevated temperature up to 1000 °C. Materials 2020, 13, 532. [Google Scholar] [CrossRef] [PubMed]
- Morsy, M.S.; Galal, A.; Abo-El-Enein, S. Effect of temperature on phase composition and microstructure of artificial pozzolana-cement pastes containing burnt kaolinite clay. Cem. Concr. Res. 1998, 28, 1157–1163. [Google Scholar] [CrossRef]
- Treguer, P.; Nelson, D.M.; Van Bennekom, A.J.; De Master, D.J.; Leynaert, A.; Quéguiner, B. The silica balance in the world ocean: A reestimate. Science 1995, 268, 375–379. [Google Scholar] [CrossRef]
- Shafigh, P.; Asadi, I.; Akhiani, A.R.; Mahyuddin, N.B.; Hashemi, M. Thermal properties of cement mortar with different mix proportions. Mater. Construcción 2020, 70, 224. [Google Scholar] [CrossRef]
- Zhang, B.; Poon, C.S. Use of furnace bottom ash for producing lightweight aggregate concrete with thermal insulation properties. J. Clean. Prod. 2015, 99, 94–100. [Google Scholar] [CrossRef]
- Zhang, Y.; Sun, Q.; Yang, X. Changes in color and thermal properties of fly ash cement mortar after heat treatment. Constr. Build. Mater. 2018, 165, 72–81. [Google Scholar] [CrossRef]


| Composition of Oxide | Content (%) |
|---|---|
| SiO2 | 21.28 |
| Al2O3 | 5.60 |
| Fe2O3 | 3.36 |
| CaO | 64.64 |
| MgO | 2.06 |
| SO3 | 2.14 |
| Total alkalis | 0.05 |
| Insoluble residue | 0.22 |
| Loss on ignition | 0.64 |
| Item | Value |
|---|---|
| Specific weight (g/cm3) | 3.05 |
| Specific surface area (cm2/g) | 3204 |
| Initial setting time (min) Final setting time (min) | 110 215 |
| Sieve, mm | Cumulative Passing (%) | BS882 | |
|---|---|---|---|
| OPBC | Natural Sand | ||
| 4.75 | 99 | 89 | 89–100 |
| 2.36 | 63 | 60 | 60–100 |
| 1.18 | 39 | 44 | 30–90 |
| 0.60 | 23 | 30 | 15–54 |
| 0.30 | 10 | 19 | 5–40 |
| 0.15 | 0 | 0 | 0–15 |
| Mix ID | Water-to-Cement Ratio | Cement (kg) | Natural Sand (kg) | OPBC (kg) | SP (kg) |
|---|---|---|---|---|---|
| M1 | 0.50 | 38 | 113 | 0 | 0.094 |
| M2 | 0.50 | 38 | 84 | 21 | 0.150 |
| M3 | 0.50 | 38 | 56 | 42 | 0.263 |
| M4 | 0.50 | 38 | 28 | 63 | 0.413 |
| M5 | 0.50 | 38 | 0 | 84 | 0.523 |
| Curing Code | Description |
|---|---|
| A-C | Specimens placed in the air under laboratory conditions |
| PW-C | Specimens placed in water conditions for 7 days after demoulding and cured under laboratory conditions |
| FW-C | Specimens placed in water conditions |
Publisher’s Note: MDPI stays neutral with regard to jurisdictional claims in published maps and institutional affiliations. |
© 2021 by the authors. Licensee MDPI, Basel, Switzerland. This article is an open access article distributed under the terms and conditions of the Creative Commons Attribution (CC BY) license (https://creativecommons.org/licenses/by/4.0/).
Share and Cite
Anuar, M.F.; Shafigh, P.; Ma’amor, A.; Yousuf, S.; Akashah, F.W. Experimental Analysis of Changes in Cement Mortar Containing Oil Palm Boiler Clinker Waste at Elevated Temperatures in Different Cooling Conditions. Crystals 2021, 11, 988. https://0-doi-org.brum.beds.ac.uk/10.3390/cryst11080988
Anuar MF, Shafigh P, Ma’amor A, Yousuf S, Akashah FW. Experimental Analysis of Changes in Cement Mortar Containing Oil Palm Boiler Clinker Waste at Elevated Temperatures in Different Cooling Conditions. Crystals. 2021; 11(8):988. https://0-doi-org.brum.beds.ac.uk/10.3390/cryst11080988
Chicago/Turabian StyleAnuar, Muhammad Firdaus, Payam Shafigh, Azman Ma’amor, Sumra Yousuf, and Farid Wajdi Akashah. 2021. "Experimental Analysis of Changes in Cement Mortar Containing Oil Palm Boiler Clinker Waste at Elevated Temperatures in Different Cooling Conditions" Crystals 11, no. 8: 988. https://0-doi-org.brum.beds.ac.uk/10.3390/cryst11080988