Article

Structural, Optical, and Photocatalytic Properties of ZnSe Nanoparticles Influenced by the Milling Time

1
Institute of Materials Science, Vietnam Academy of Science and Technology, 18 Hoang Quoc Viet, Cau Giay, Hanoi 100000, Vietnam
2
Department of Natural Sciences Education, Sai Gon University, 273 An Duong Vuong Road, Ward 3, Distrist 5, Ho Chi Minh City 008428, Vietnam
3
Institute of Science and Technology, TNU-University of Sciences, Tan Thinh Ward, Thai Nguyen City 24000, Vietnam
*
Author to whom correspondence should be addressed.
Submission received: 13 August 2021 / Revised: 8 September 2021 / Accepted: 9 September 2021 / Published: 15 September 2021
(This article belongs to the Section Inorganic Crystalline Materials)

Abstract

:
ZnSe nanoparticles (NPs) were prepared by combining both hydrothermal and mechanical milling methods. Transmission electron microscopy images show that fabricated ZnSe NPs with a sphere-like shape have an average size (d) in the range of 20–100 nm, affected by changing the milling time from 10 to 60 min. All the samples crystalize in zincblende-type structure without impurities, as confirmed by analyzing X-ray diffraction patterns, Raman spectra, and energy-dispersive X-ray spectroscopy. Carefully checking Raman spectra, we have observed the broadening and redshift of vibration modes as decreasing NP size, which are ascribed to extra appearance of disorder and defects. The photoluminescence study has found a blue emission at 462 nm attributed to the excitonic near-band edge and a broad defect-related emission around 520–555 nm. Increasing milling time leads to the decrease in the exciton-emission intensity, while the defect-related emissions increase gradually. Interestingly, as decreasing d, we have observed an improved photodegradation of Rhodamine B under UV irradiation, proving application potentials of ZnSe NPs in photocatalytic activity.

1. Introduction

In recent years, nanostructured semiconductors have been widely studied not only for understanding their fundamental properties but also for technological applications in electronic and optoelectronic devices [1,2]. In particular, they also have great potential in the photocatalysis for solar-fuel production and environmental remediation [3]. The photocatalytic process using semiconductors as photocatalysts is to produce active species, which decompose organic pollutants into non-toxic by-products. Basically, the photocatalysis generates electron-hole pairs under exposure proper light irradiation; these electron-hole pairs move to the surface of semiconductors to participate in the redox reactions in order to form reactive oxygen species (ROS), including OH*, O2*, and OOH*. The active species decompose organic pollutants (typically, industrial dyes) into CO2 and H2O.
TiO2 is a well-known photocatalyst offering a high efficiency as reported in previous studies [4]. However, its photocatalytic activity is limited because its large bandgap leads to the sunlight absorption taking place in a narrow spectral range. It is necessary to find alternative materials to overcome this limit. It has been found that ZnSe is an excellent candidate because it is known as a suitable band gap (Eg = 2.67 eV) material [5] and has a large exciton binding energy at room temperature (21 meV), which can be used as a photocatalyst in degrading pollutant molecules, including methylene blue [6], Rhodamine B (RhB) [7], and methyl orange [8,9]. Suitable values of Eg and exciton binding energy of ZnSe are also important criteria to fabricate blue-laser diodes and blue-emitting diodes [10,11]. As the photocatalytic activity occurs on the surface [12], a large surface area of the catalyst is a crucial point to enhance the photocatalytic activity. Based on this feature, it has been fabricated various ZnSe nanostructures, including nanoparticles (NPs) [7], nanorods [8], hierarchical structures [6], and nanotubes [5]. To further improve the photocatalytic activity, it has also been fabricated RGO-ZnSe nanocomposites [13], ZnSe-CdSe [14], ZnO-ZnSe [15], and MoS2-ZnSe nano heterostructures [16].
In this work, we present a simple route that combines the hydrothermal and mechanical milling methods for preparing ZnSe NPs with different particle sizes of 20–100 nm. Additional milling method is critical point to achieve NPs with desired sizes that could not be obtained by using alone hydrothermal synthesis without surface active agents or ligands. The fabricated samples have zincblende structure based on X-ray diffraction (XRD) and Raman scattering (RS) analyses. The broadening and redshift of structures in Raman spectra with increasing grinding time are a result of arising more disorders and defects in NPs. This is confirmed again by the photoluminescence (PL) study in which the variations of the intensity of the exciton- and defect-related emissions as a function of the particle size (or the milling time, tm). Our investigations into the photocatalytic activity prove that the photodegradation of the RhB solution under UV-light irradiation is higher than 90% for the sample with the smallest size, which has the largest surface–volume ratio. A possible mechanism of the photocatalytic activity is provided.

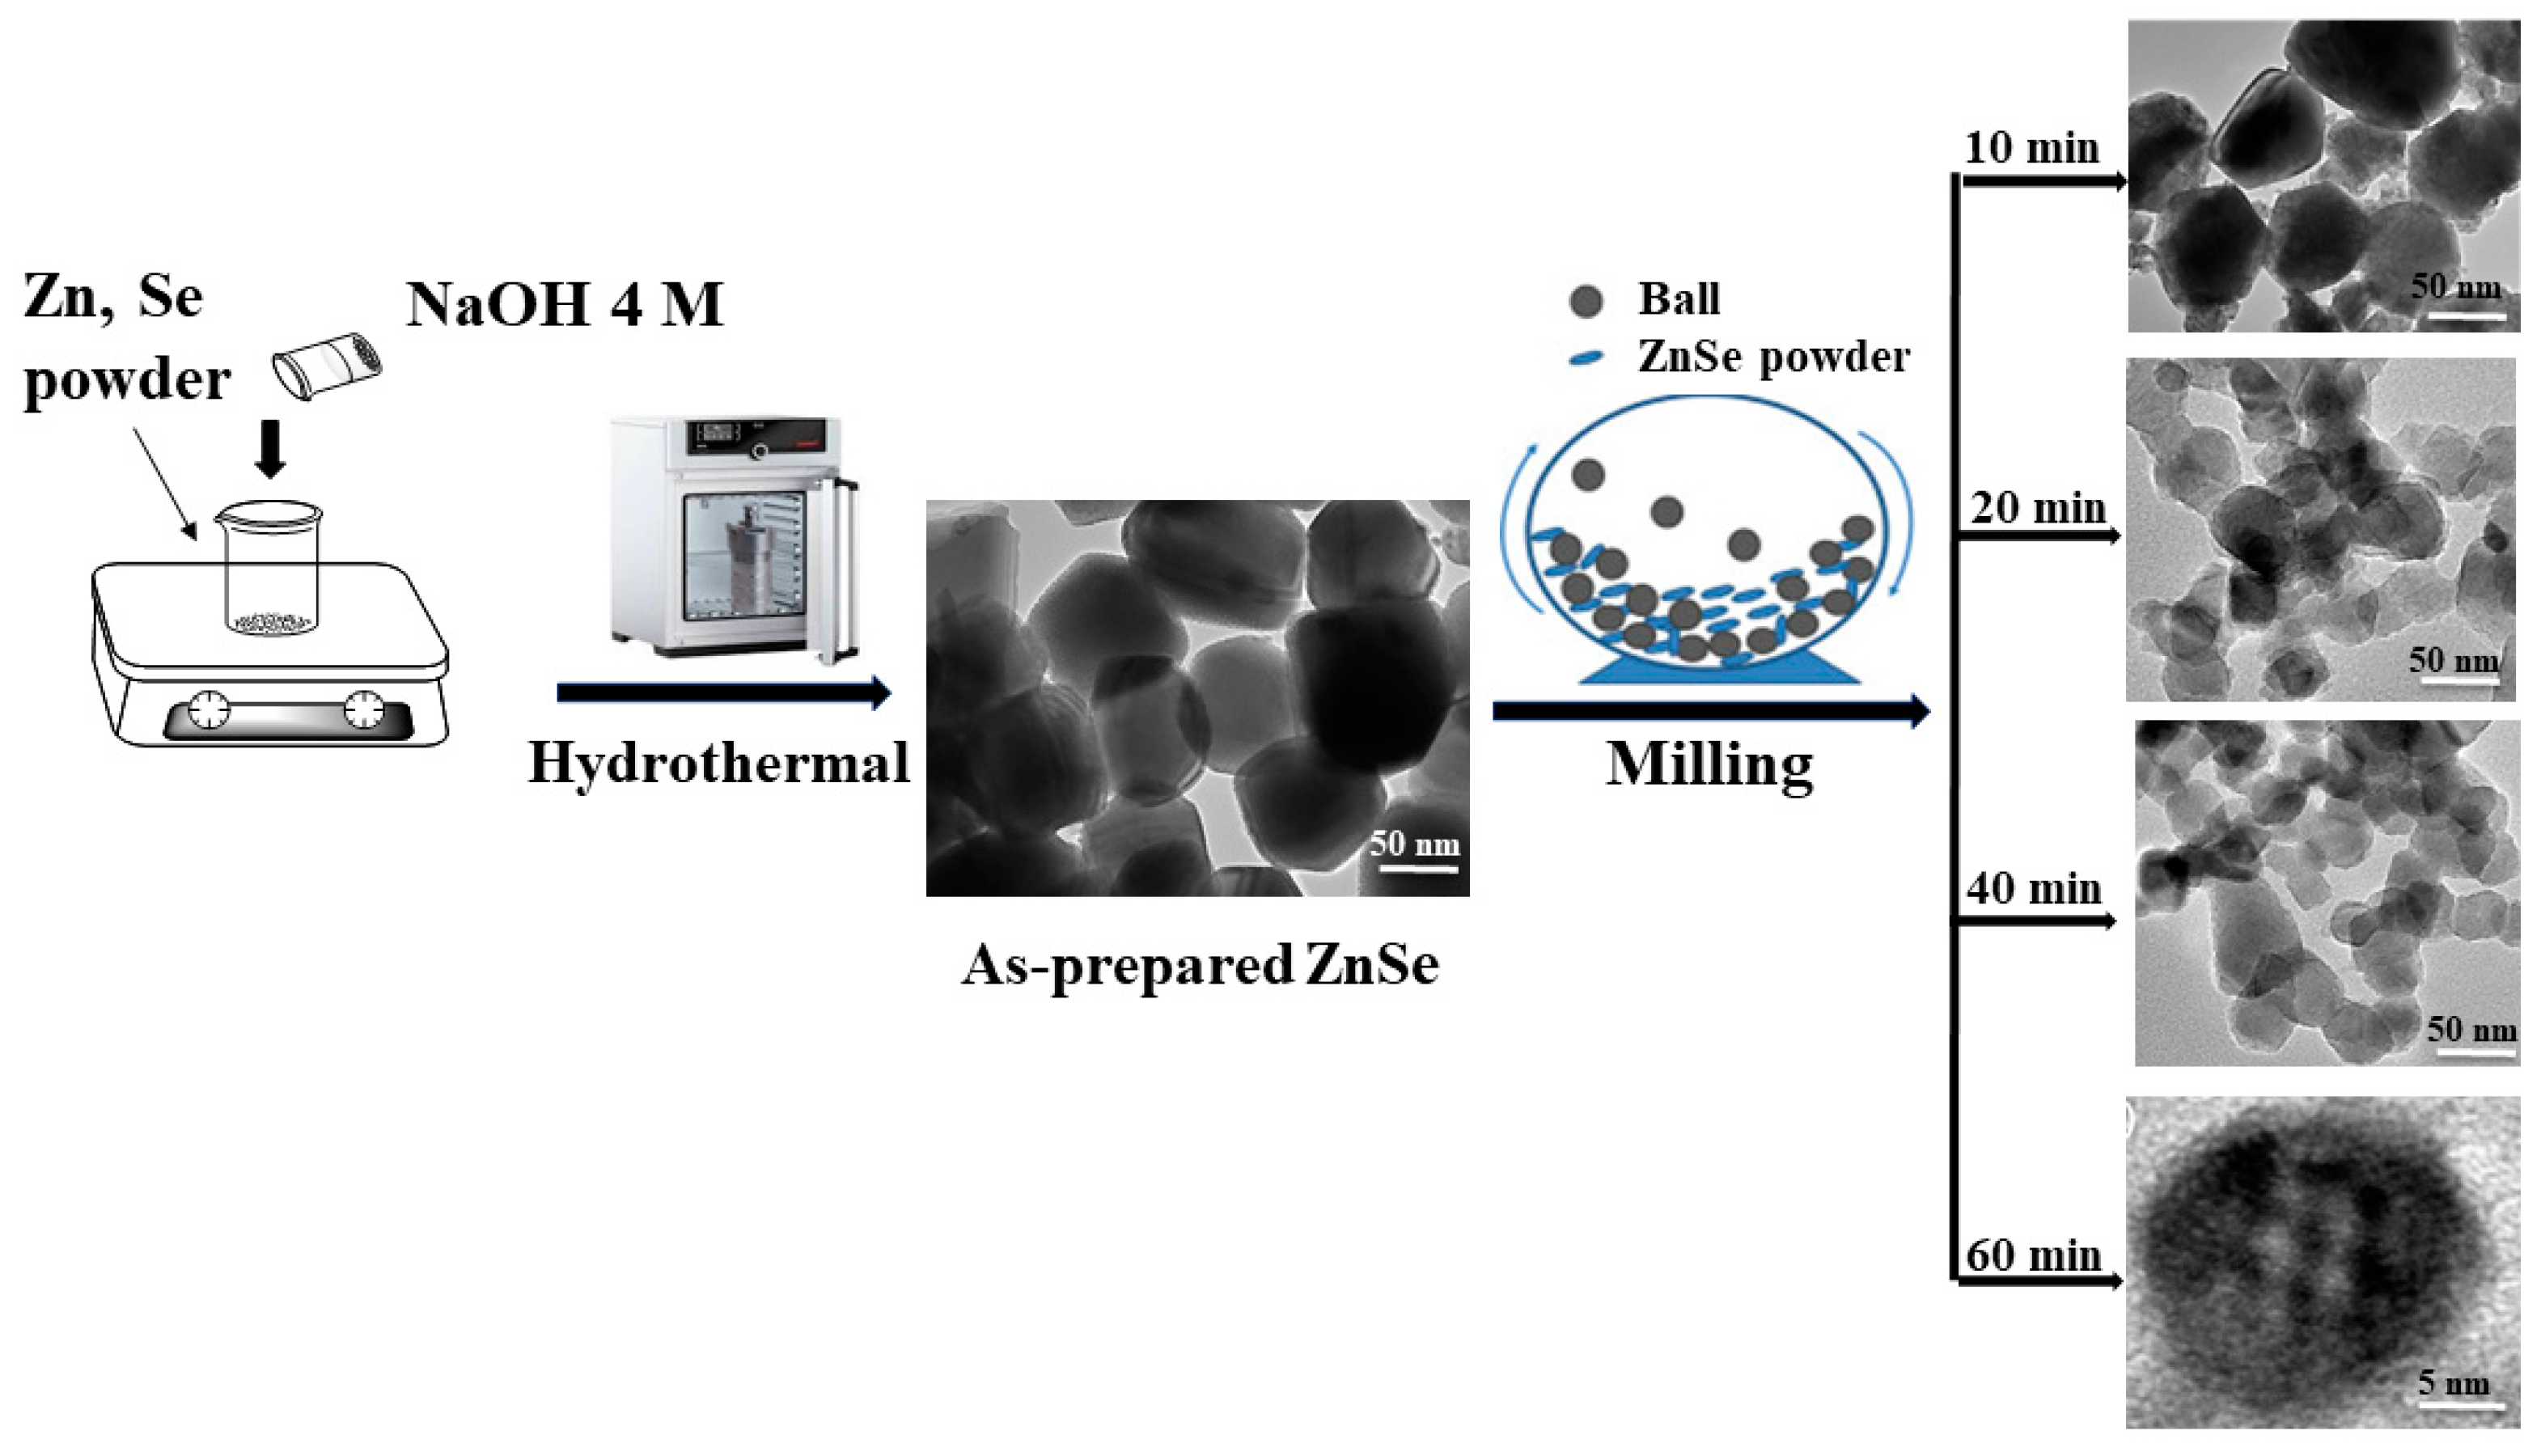
2. Materials and Methods

Chemical agents including Zn, Se, and NaOH (99.99%) were purchased from Merck (Kenilworth, NJ, USA). First, ZnSe NPs were synthesized by using a hydrothermal method [17]. Briefly, Zn and Se powder (3.5 mmol) together with 70 mL NaOH (4 M) were put in a Teflon lined stainless steel autoclave. The autoclave was then kept at 190 °C for 25 h. After chemical reactions as shown in Equations (1)–(4), the autoclave was cooled down to room temperature. The precipitate (ZnSe) in the autoclave was filtered, washed, and dried. The powder product was then divided into small parts (~2 g) and ground for different times of 10, 20, 40, and 60 min; herein, as-prepared ZnSe NPs would be labelled as the sample with tm = 0. The grinding used a high-energy mechanical ball miller (SPEX 8000D, Spex SamplePrep, Metuchen, NJ, USA) and the set of stainless-steel vials and balls, as described in Figure 1. Before milling, the grinding medium was coated by a ZnSe layer (by putting ZnSe powder into the grinding media and mixing about 10 min, without collecting the product after that). This is to avoid unexpected dopants appearing in the samples. The milling with various tm values would create the samples having different sizes.
Zn + 2 H 2 O + 2 OH [ Zn ( OH ) 4 ] 2 + H 2
3 Se + 6 OH 2 Se 2 + SeO 3 2 + 3 H 2 O
3 H 2 + SeO 3 2 Se 2 + 3 H 2 O
[ Zn ( OH ) 4 ] 2 + Se 2 ZnSe + 4 OH
Following the fabrication, NPs were dispersed on carbon-coated copper grids, then a transmission electron microscope (TEM, JEM-2100) operating at 200 kV was employed to check the particle size, crystal quality, and morphology of the samples. The crystal structure was checked by using a D8 Advance diffractometer working with a Cu-Kα radiation source (λ = 0.154 nm). This electron microscope also linked with energy-dispersive X-ray spectroscopy (EDS) that allowed us to check elements present in the samples. Raman scattering (RS) spectra were acquired by using a RS spectrometer (Xplora plus, Horiba), which operated with a laser wavelength (λexc) of 532 nm. To study the PL properties, we used an iHR-550 fluorescence spectrophotometer working with λexc = 355 nm, with the resolution of ~0.03 nm.
Regarding the photocatalytic performance of ZnSe NPs, it was evaluated upon photodegrading RhB under UV irradiation. In each experiment, 0.06 mg of each sample of ZnSe NPs was put into a glass beaker containing 60 mL RhB solution (5 ppm). The mixture was magnetically stirred in the dark for 30 min. After achieving the adsorption equilibrium, this mixture was checked the photocatalytic performance using a set of four UV solarium lamps with the total power of 90 W and the radiation intensity of 3.2 mW/cm2. After certain time intervals of UV irradiating, a PL spectrum was recorded to examine the photodegradation of the RhB solution, using an iHR550 spectrophotometer (Horiba).

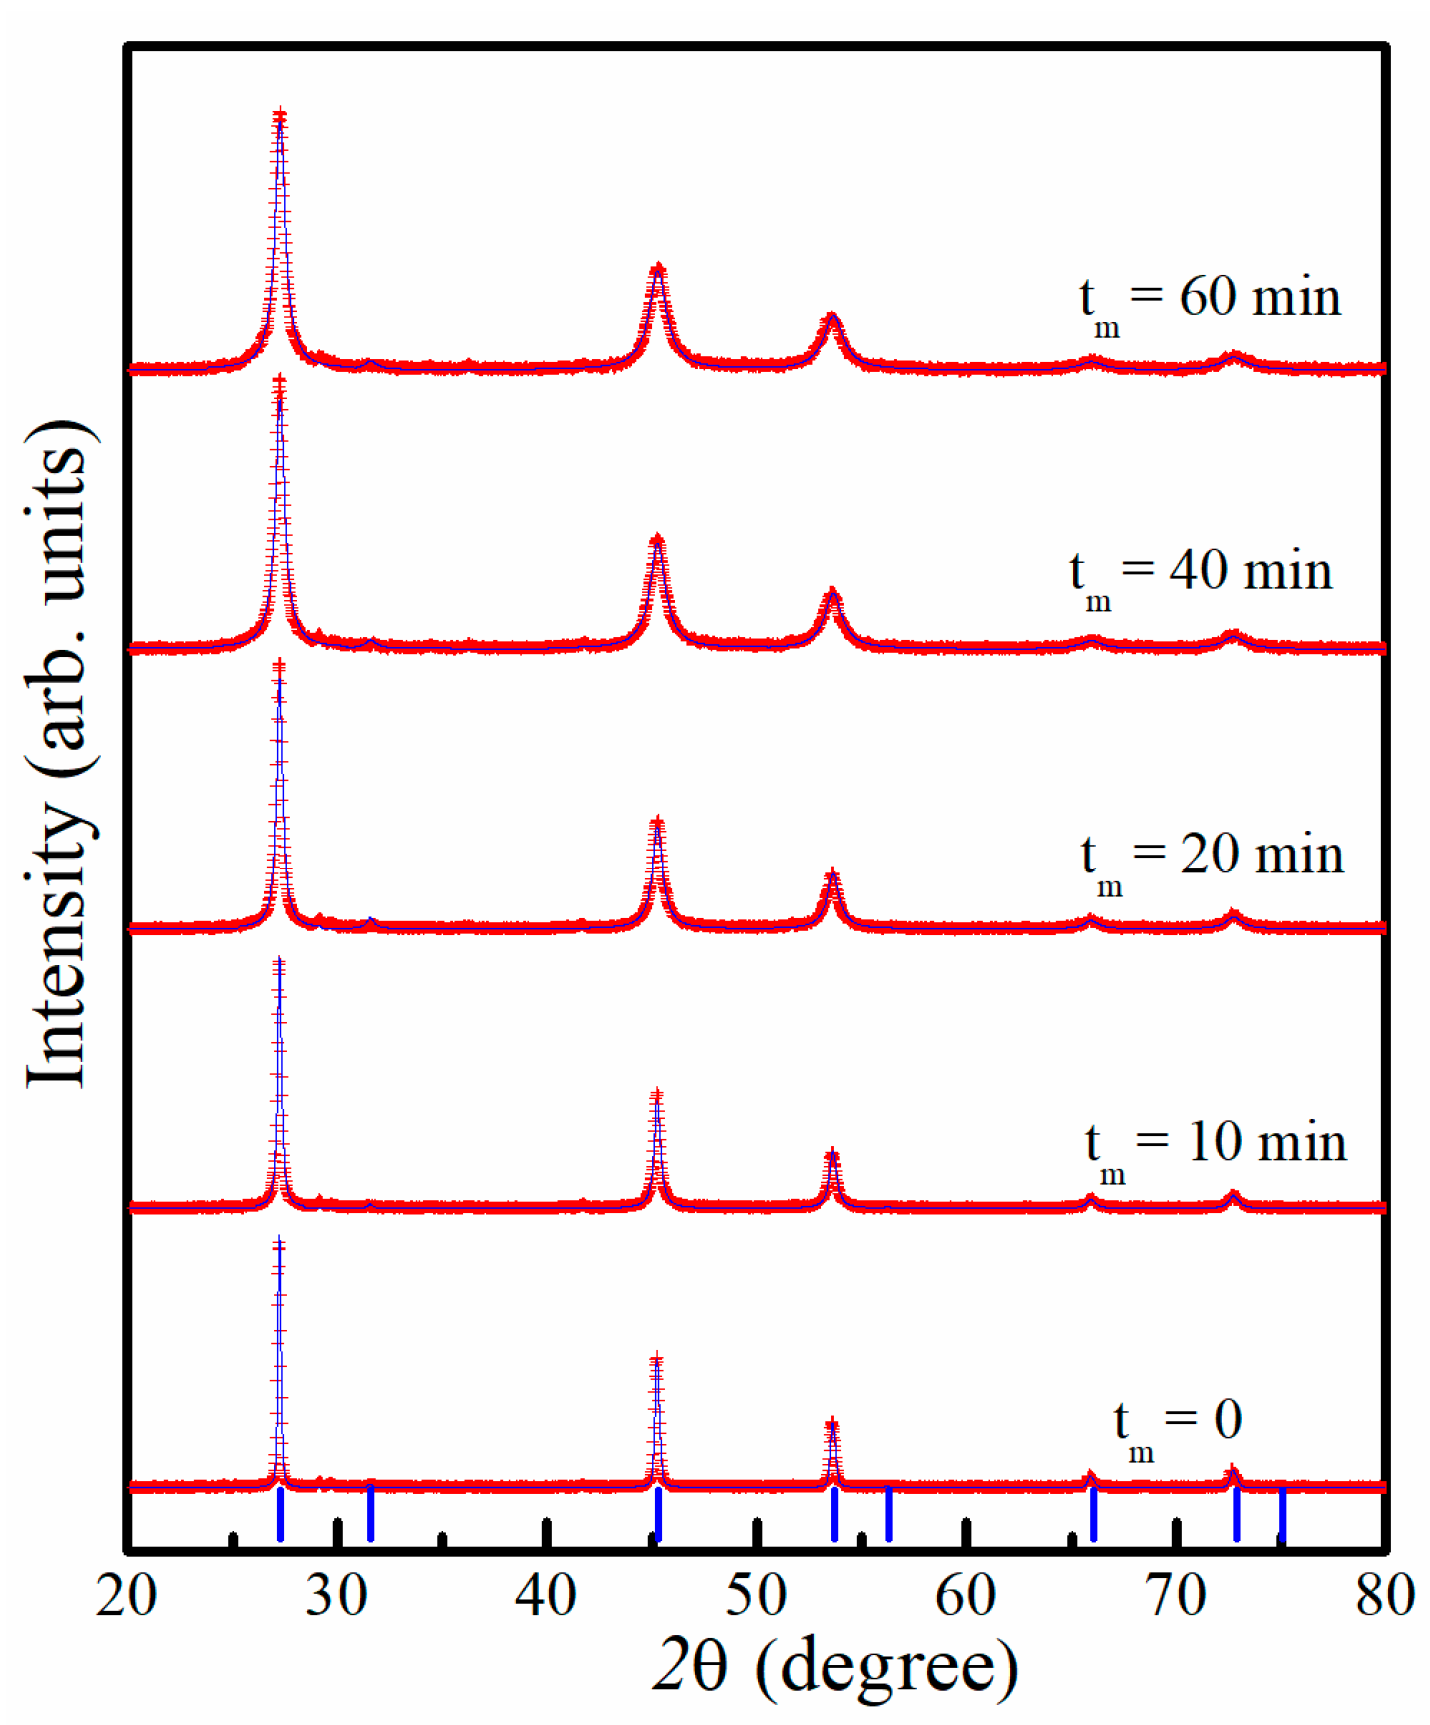
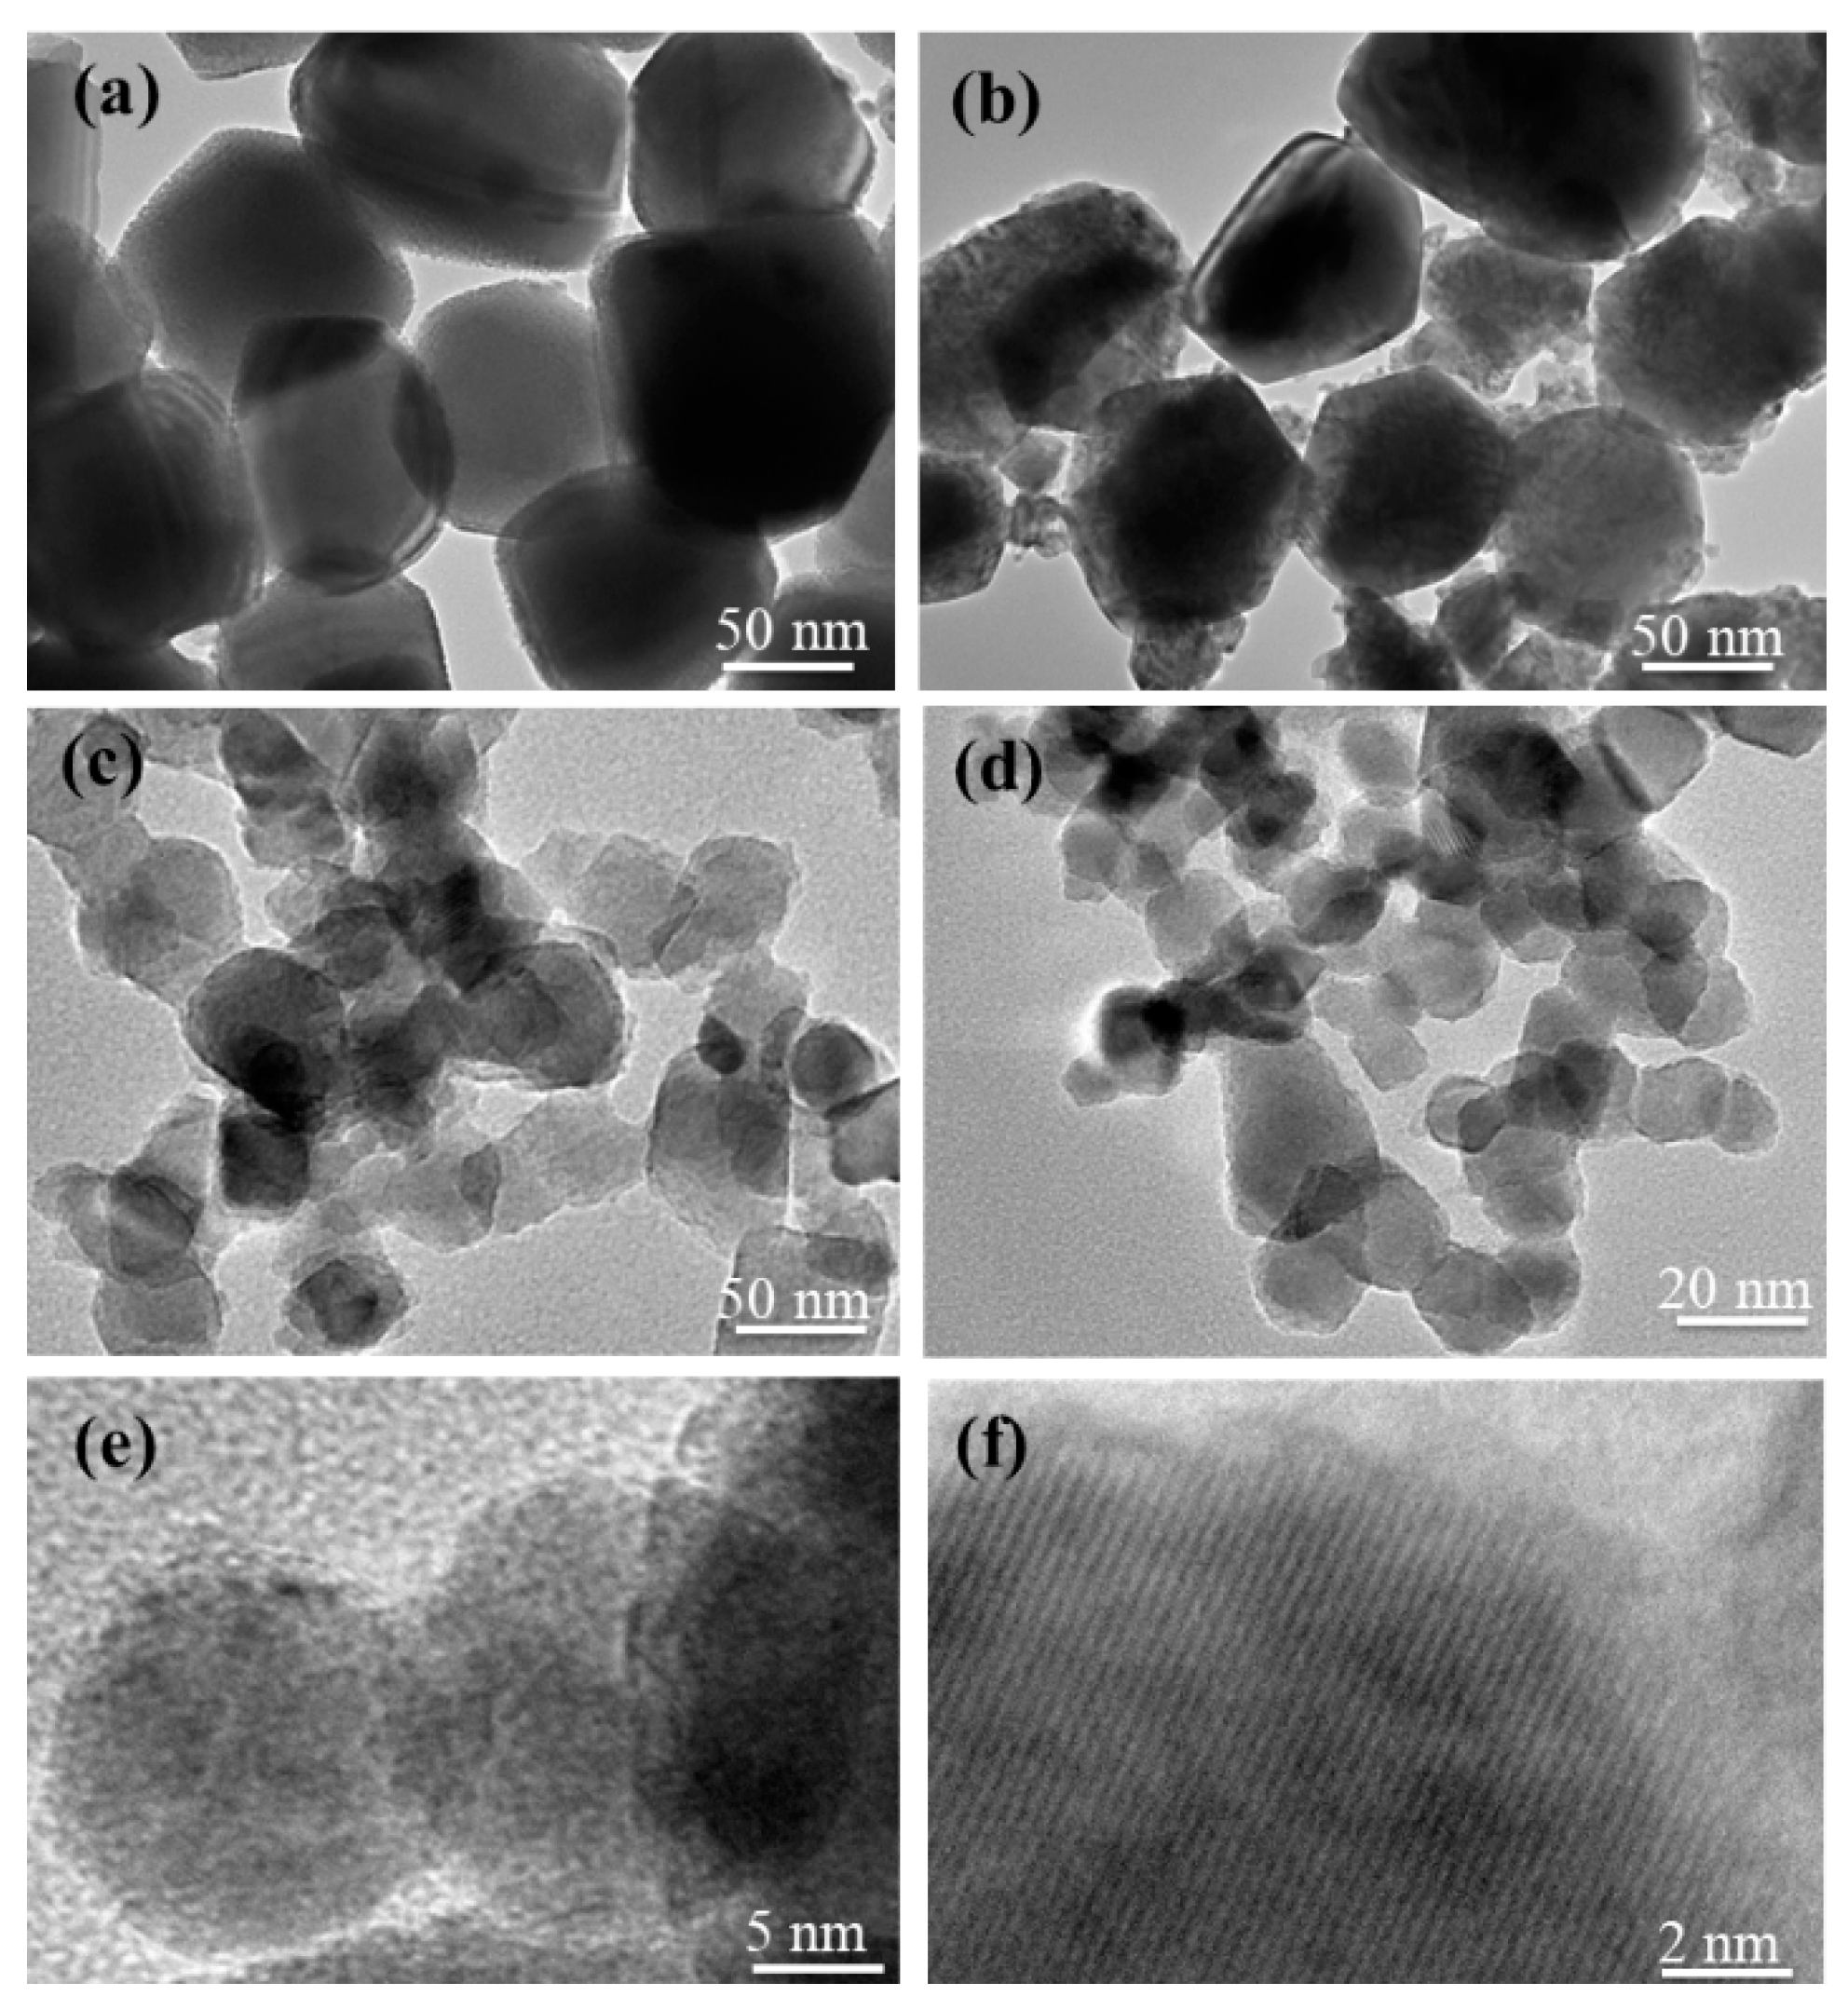
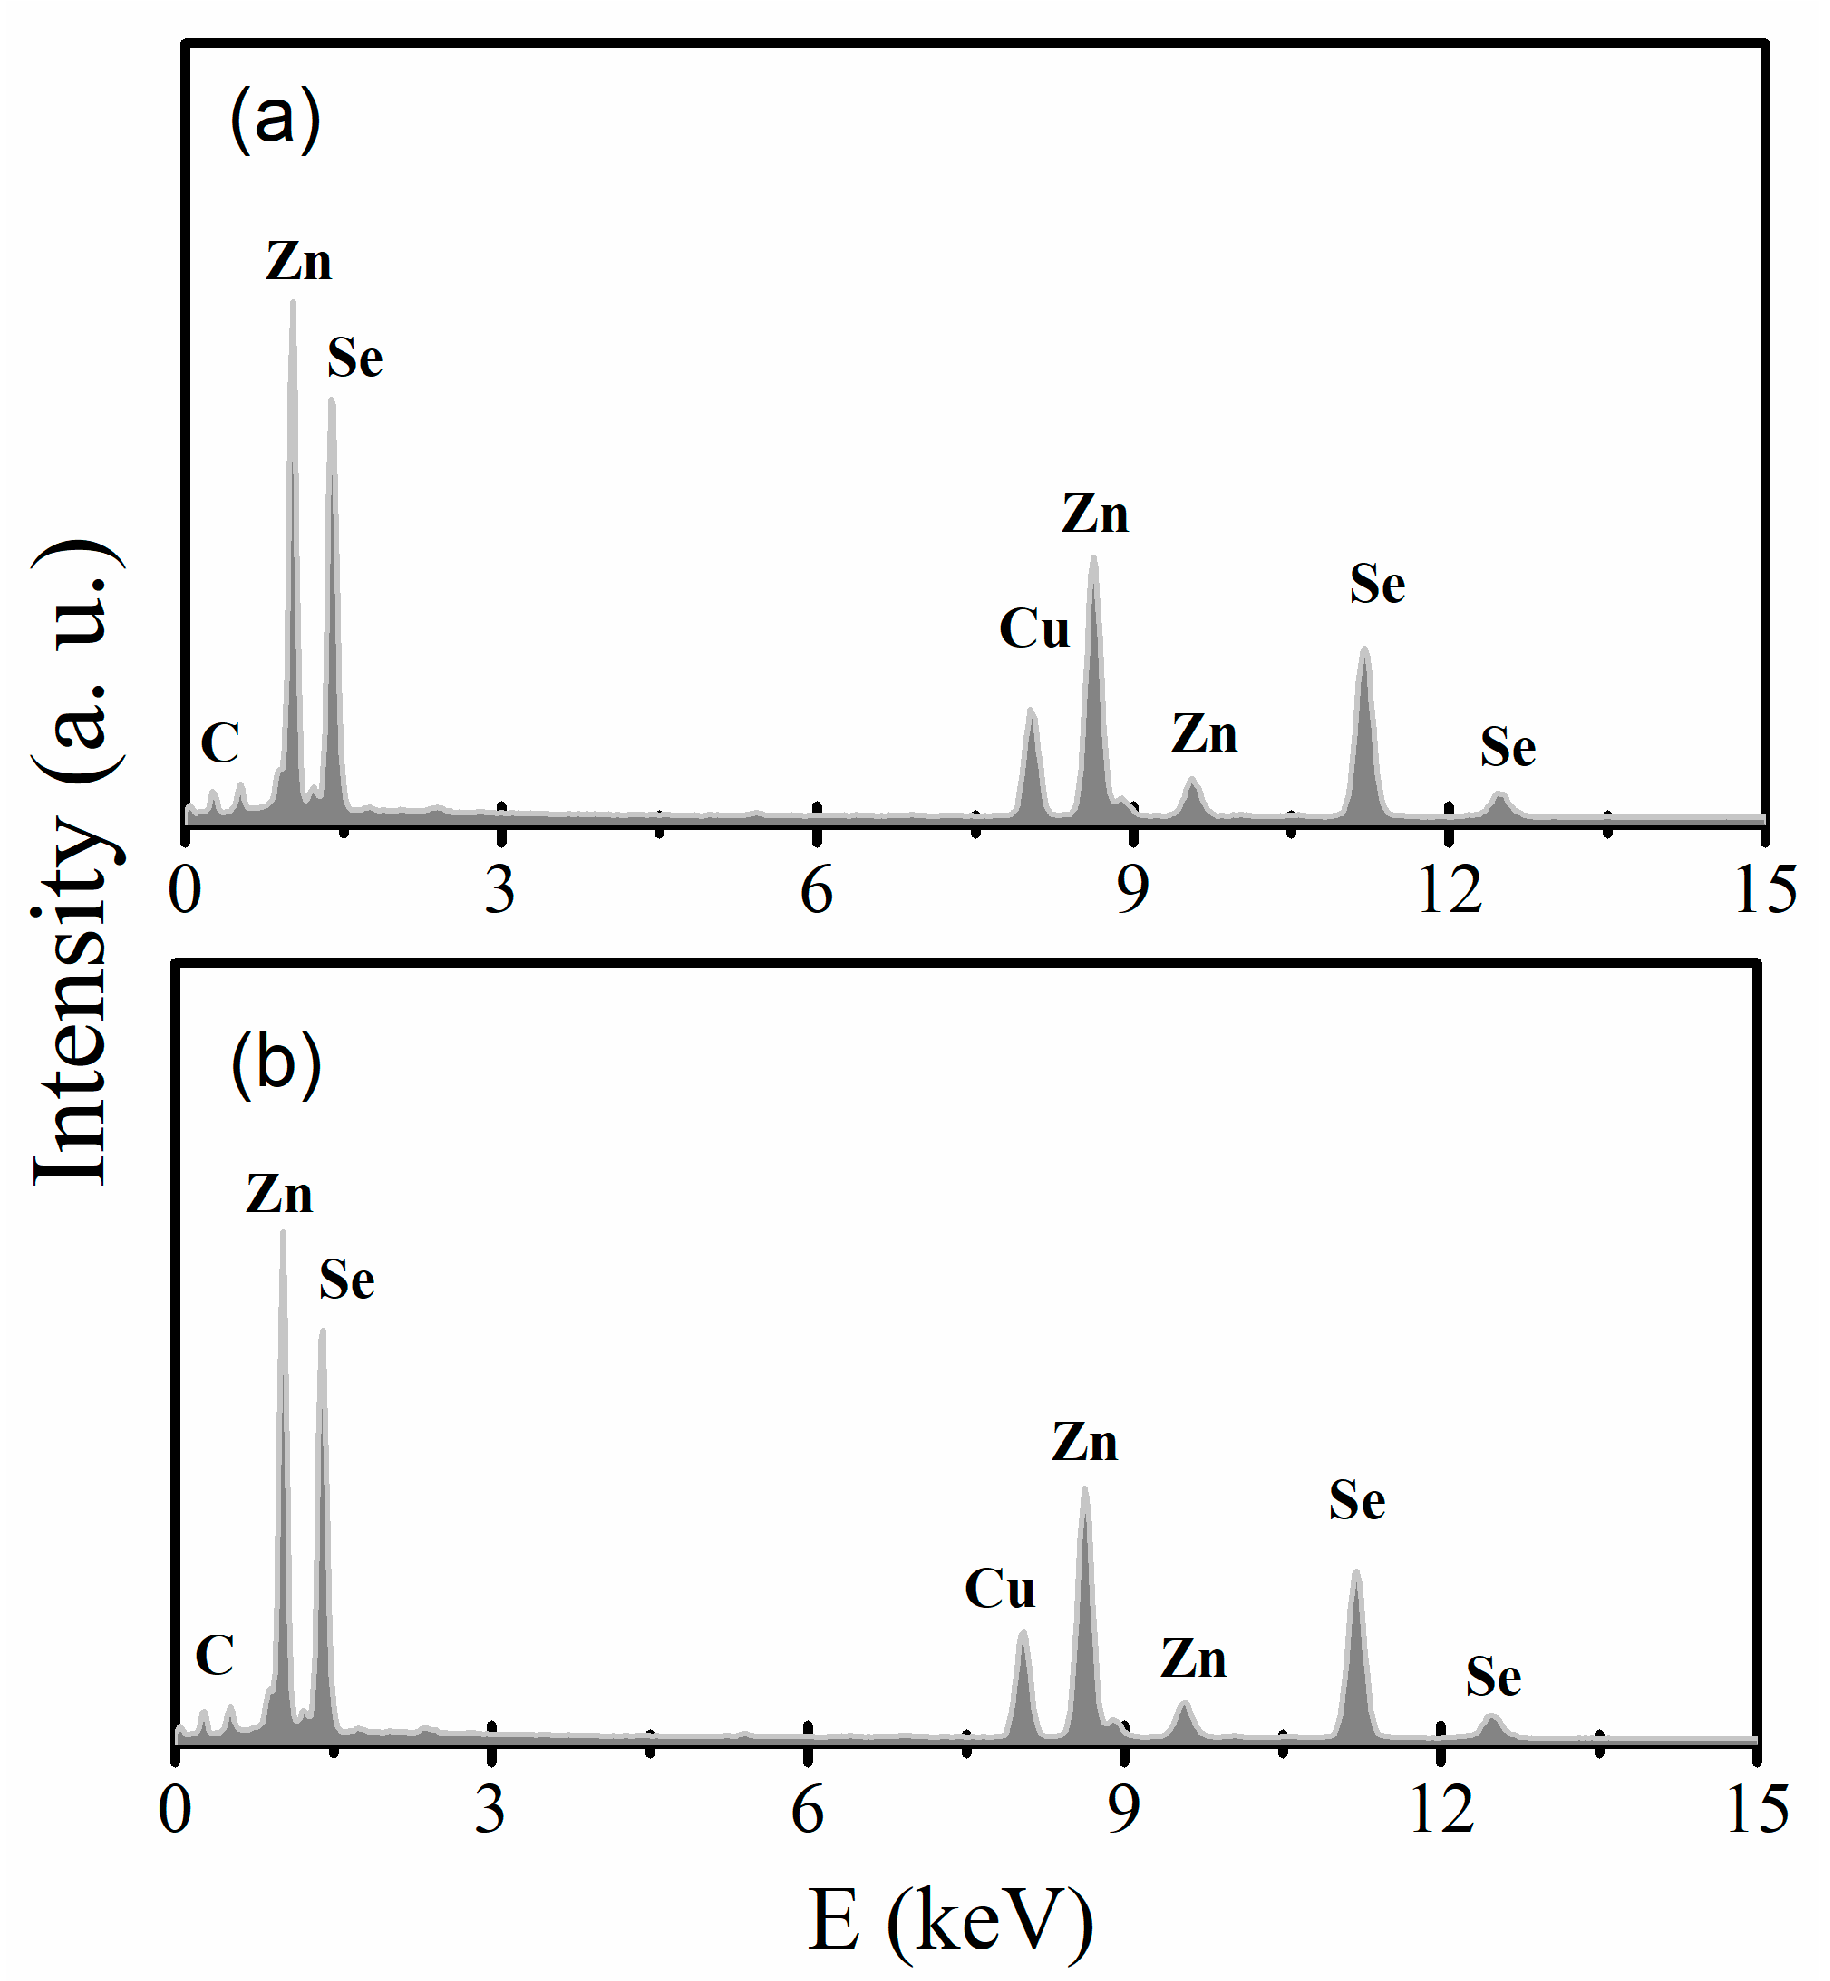
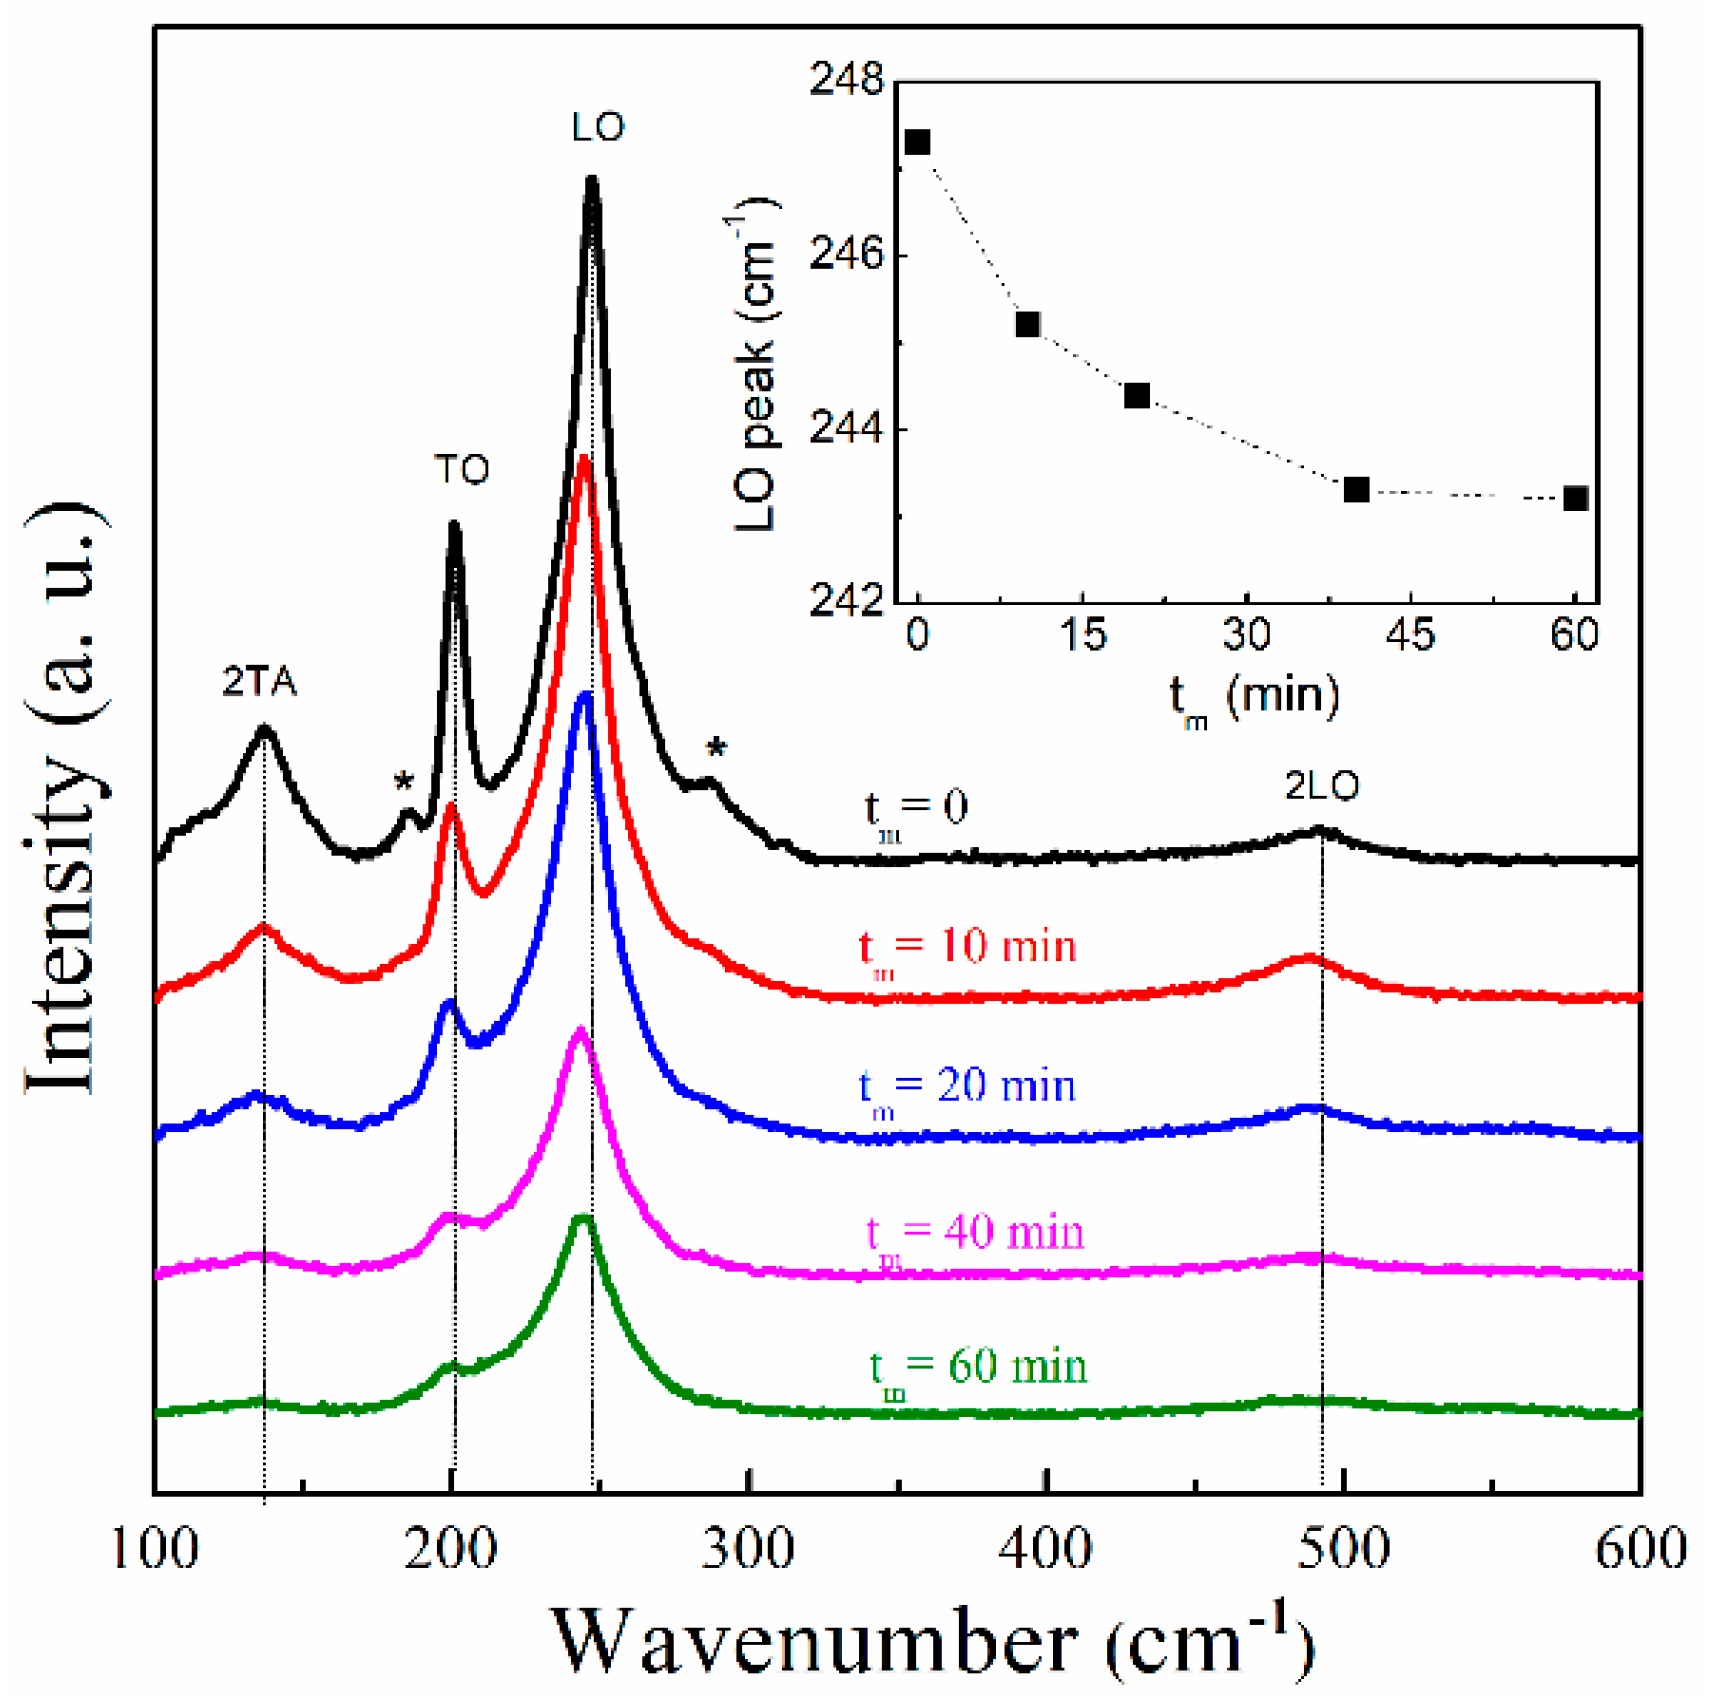
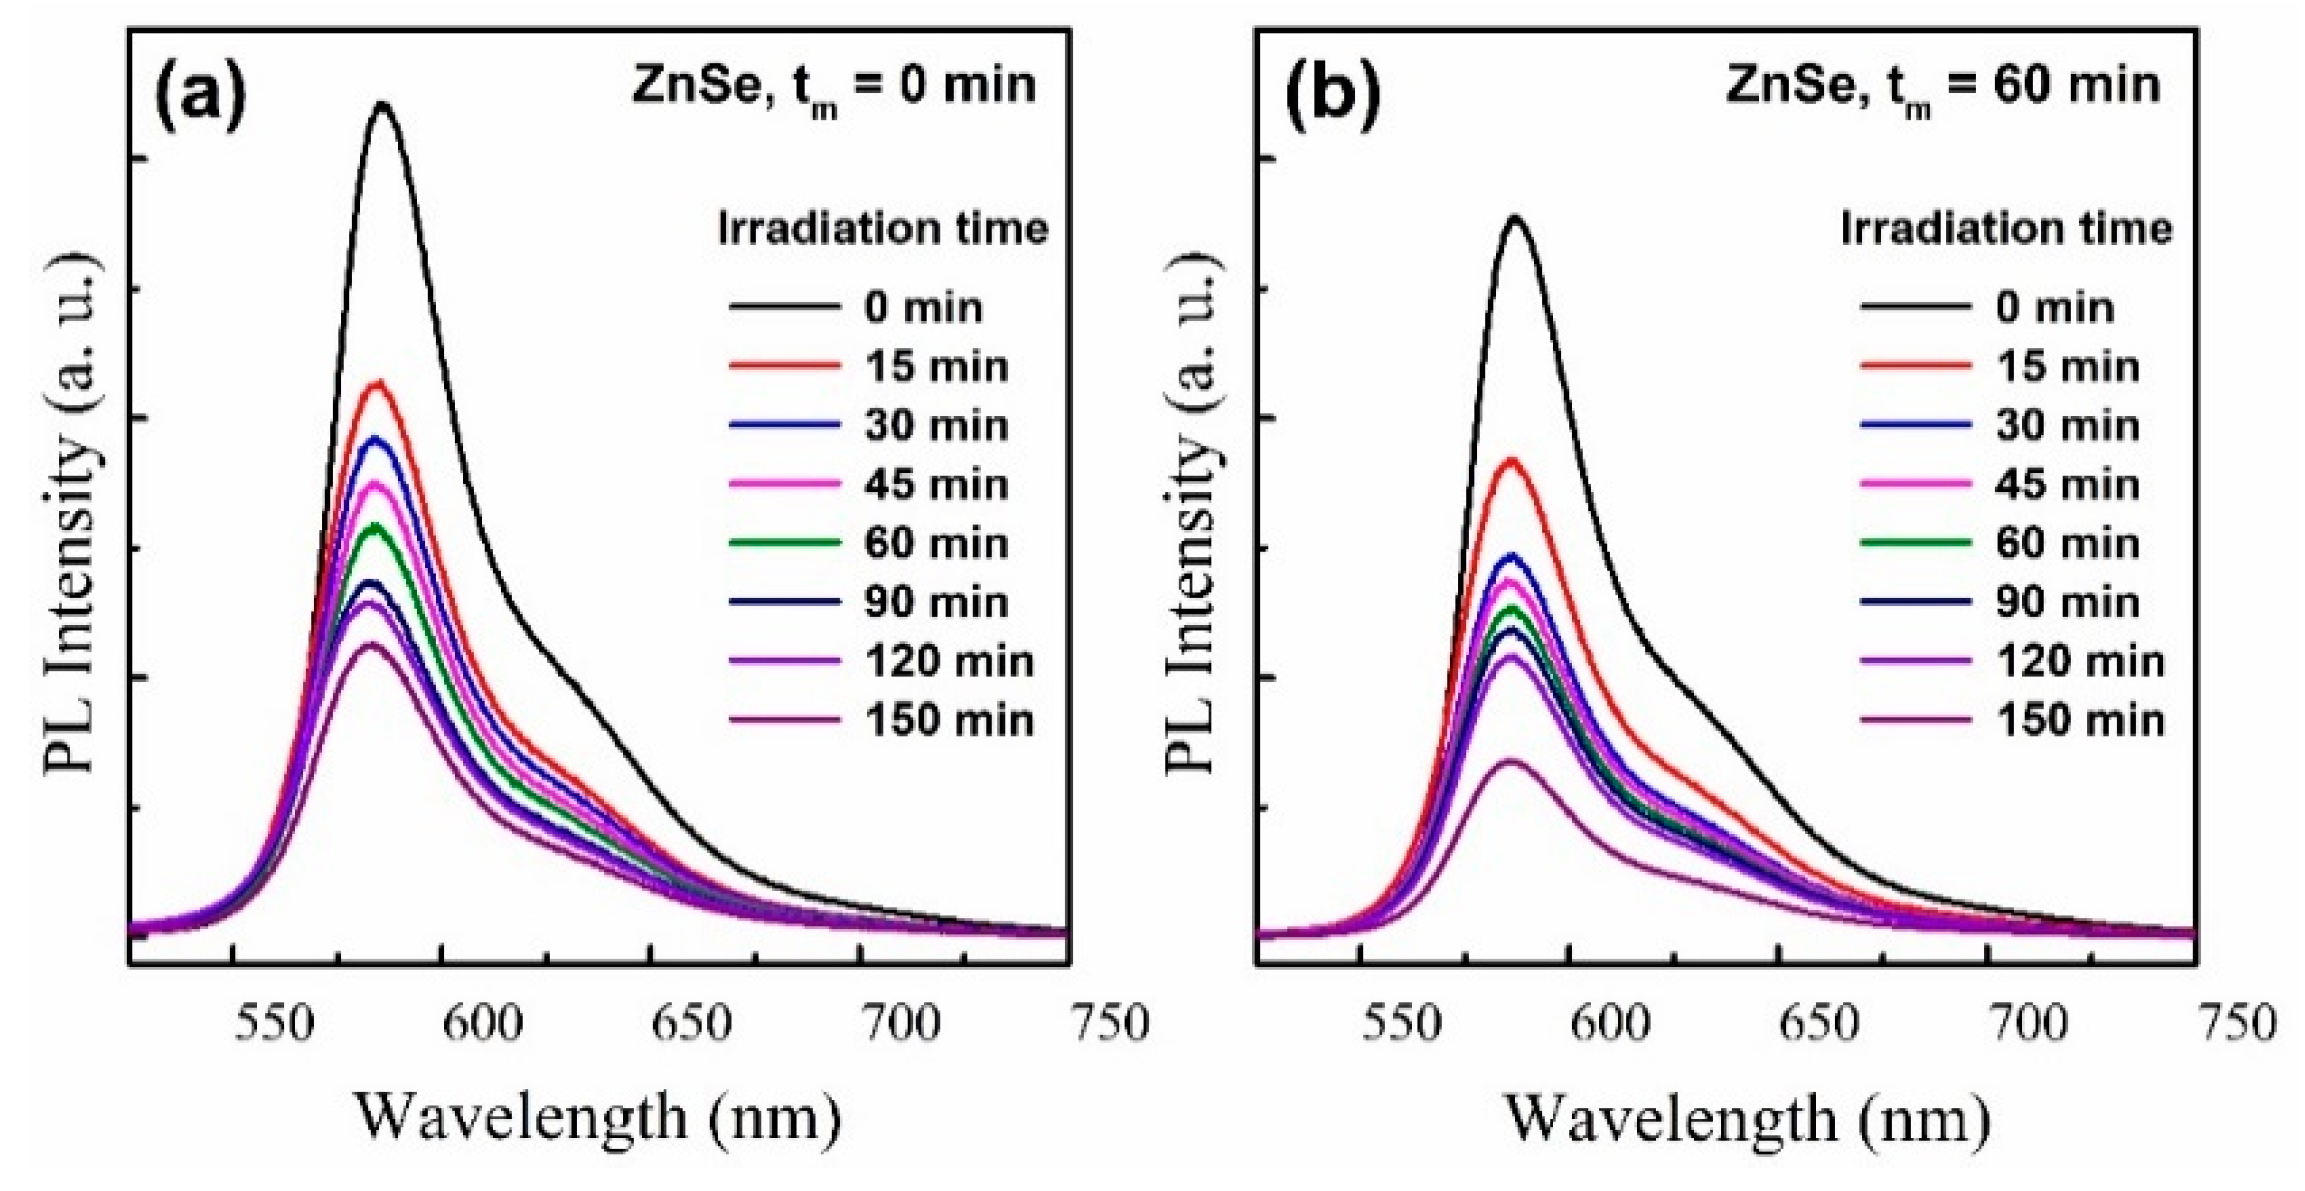
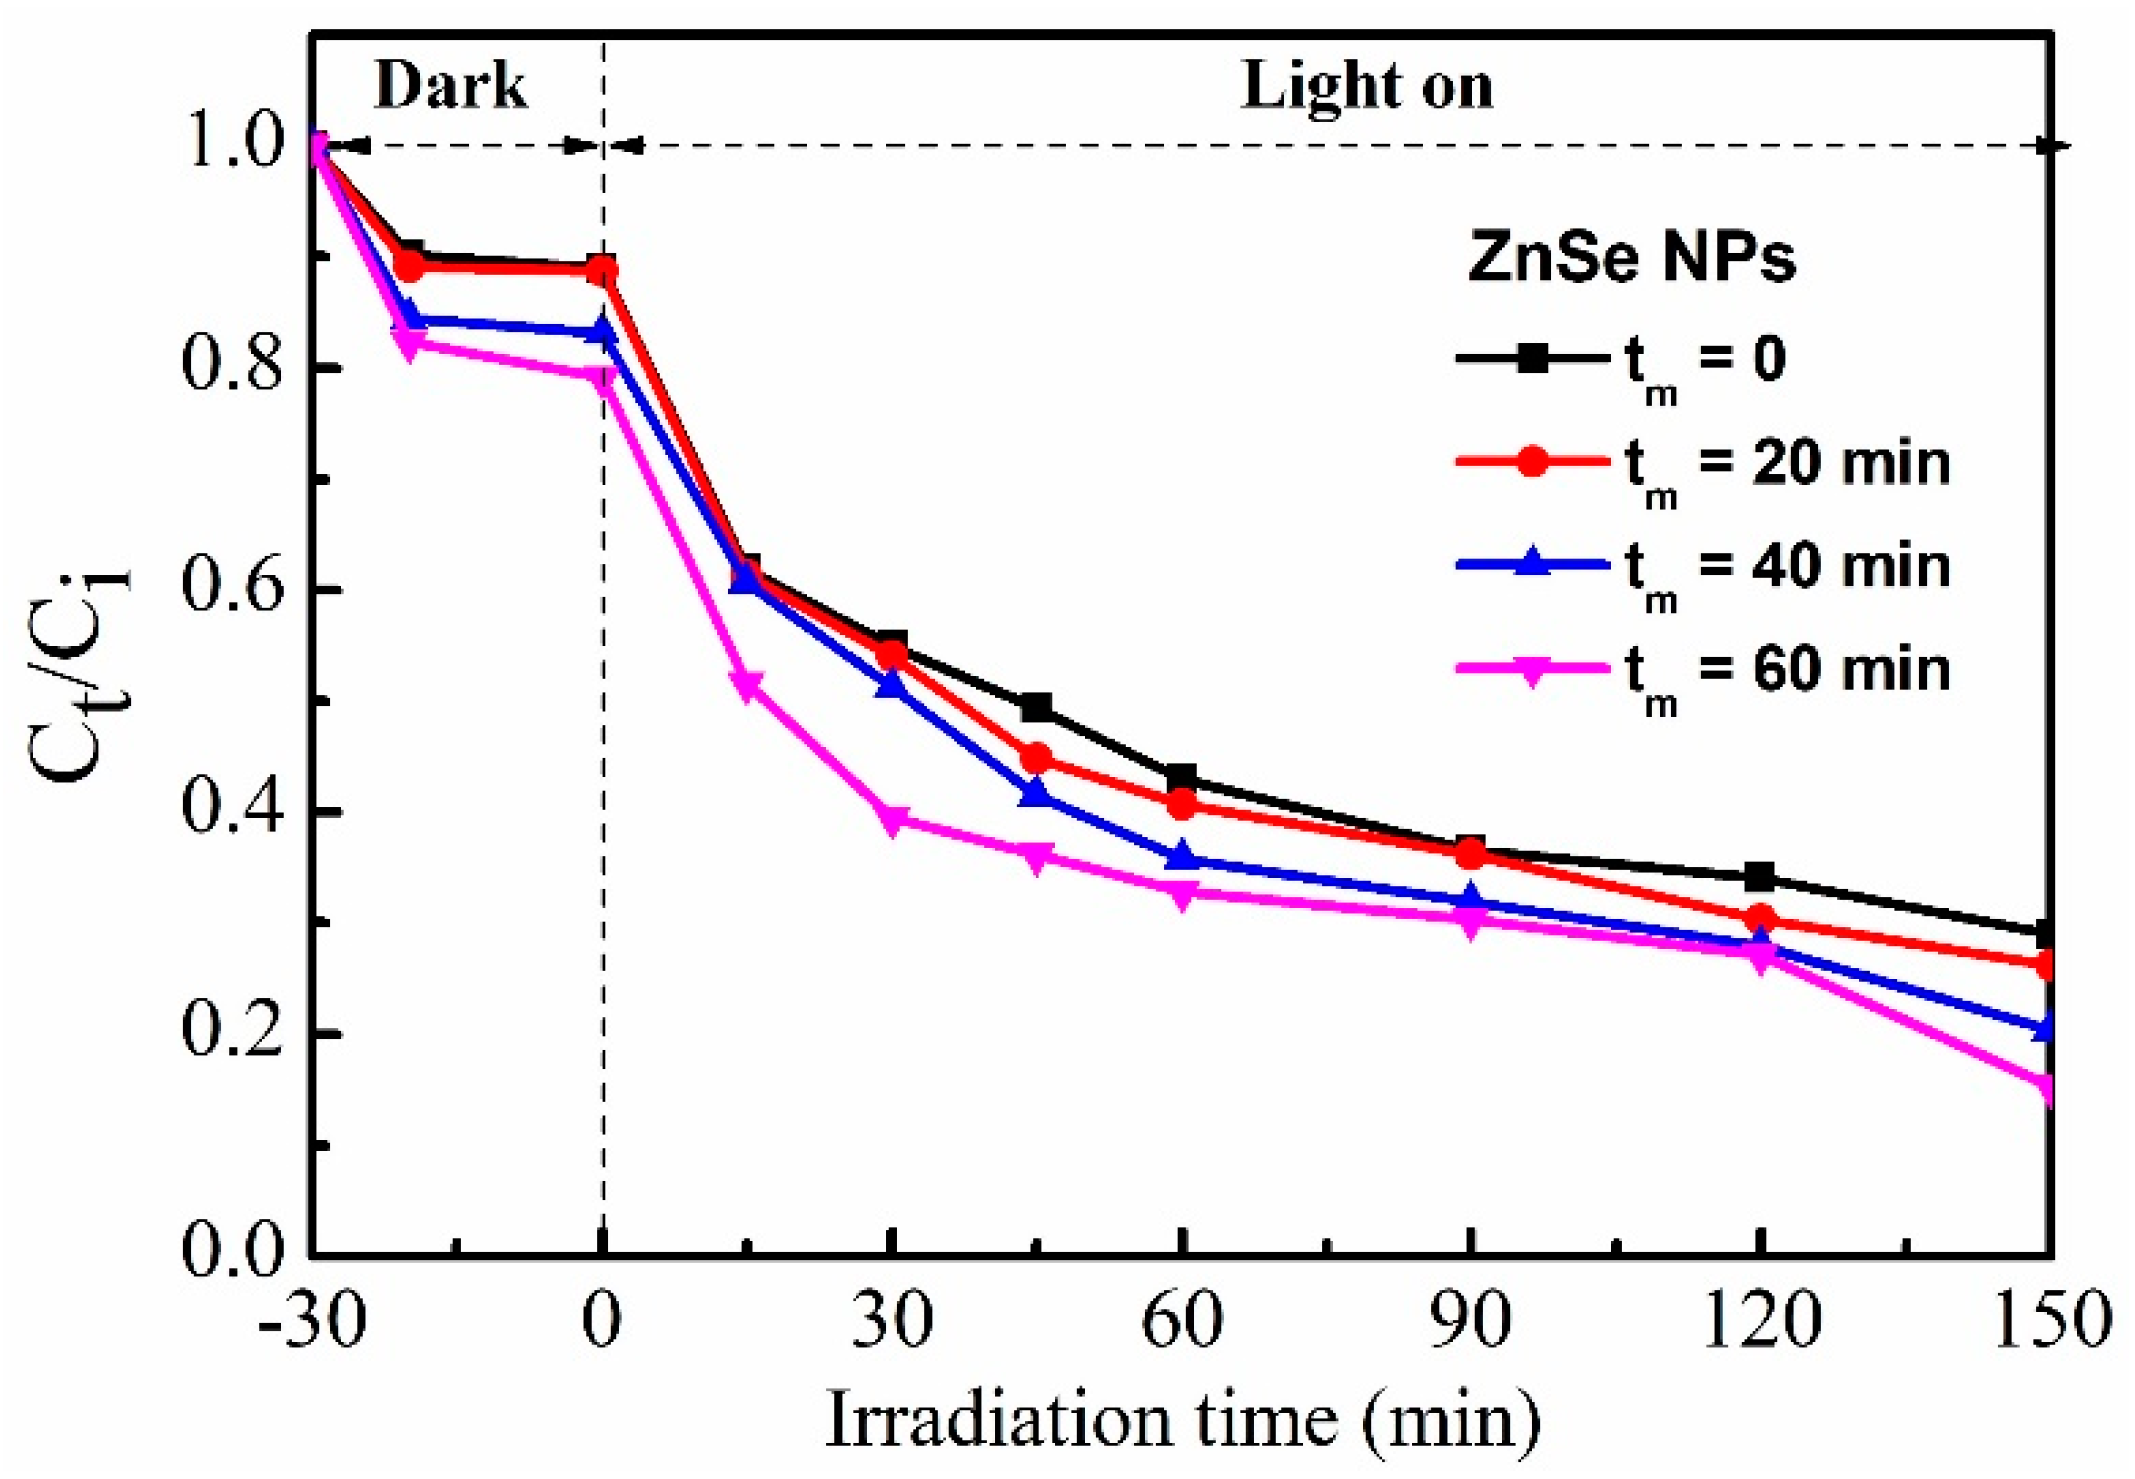
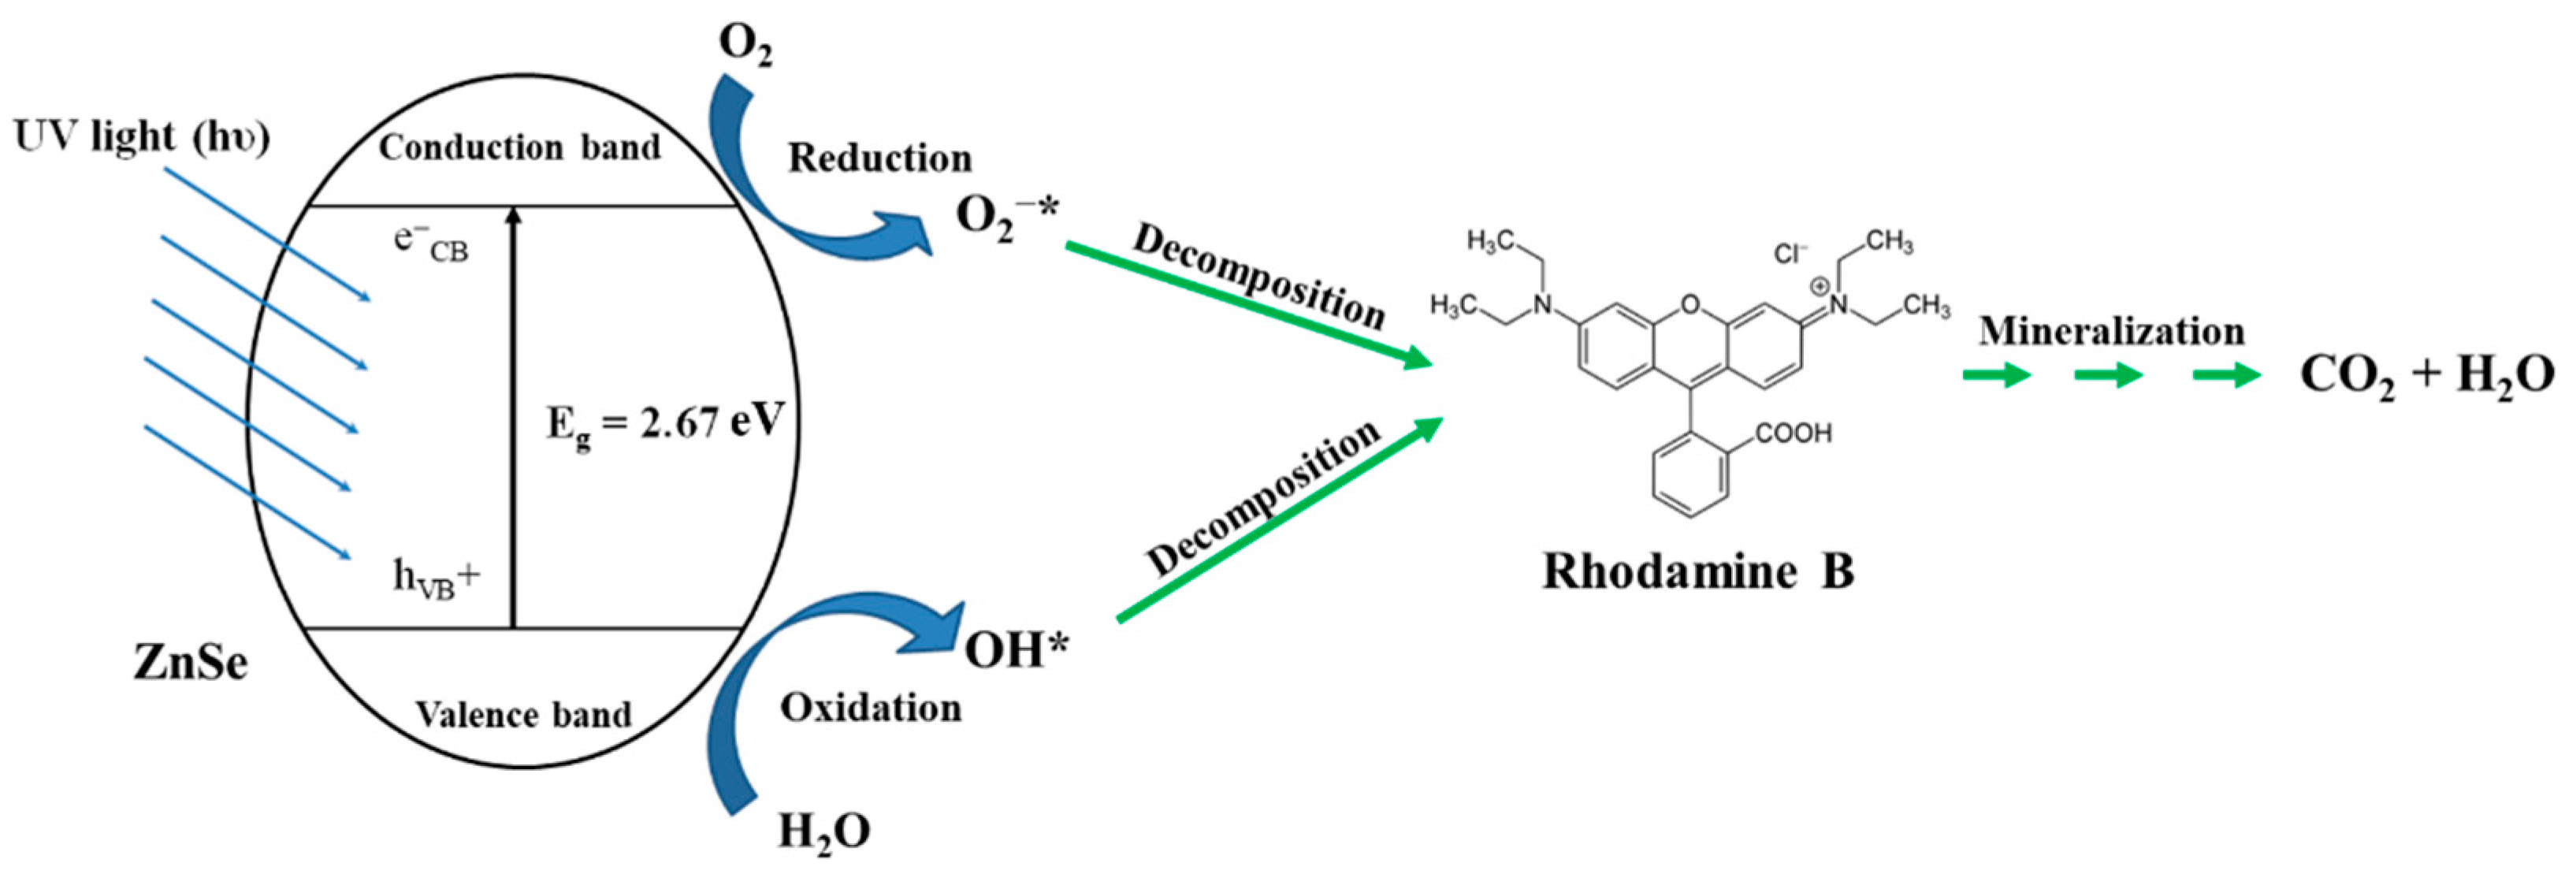
3. Results and Discussion

The XRD method was used to examine the crystal structure of all the fabricated samples, as shown in Figure 2. Diffraction patterns were recorded in the range of 2θ = 20–80°, where scanning steps were fixed at 0.01°. XRD peaks are clearly observed. Careful analyses upon the Rietveld refinement technique have found that the XRD data of the samples well match the zincblende-type structure, belonging to the F 4 ¯ 3 m space group (JCPDS No. 37-1463) [18]. The zincblende-type structure of ZnSe is depicted in Figure 3a for illustration. To the XRD limit, no impurity phase was detected. As analyzing the diffraction patterns, lattice constance of samples is about 5.666 ± 0.002 Å, which is well in agreement with previous works [19,20,21].
TEM images of the fabricated samples are shown in Figure 3a–f, which indicate that the NPs have a sphere-like shape, where both d and surface morphology are changed with respect to variation time tm. While the as-prepared sample (tm = 0) includes uniform NPs with smooth surface and d ≈ 100 nm, increasing the milling time reduces d gradually from about 80 nm for tm = 10 min, through 50 nm for tm = 20 min, to ~20 nm for tm = 40 and 60 min. For the samples with long milling time, particles tightly attached to each other to form clusters. It should be noticed that for as-prepared NPs synthesized by the same method, Peng et al. [22] obtained smaller-sized NPs, which are due to the difference in fabrication conditions, such as starting materials, reaction time, reaction temperature, and especially containing surface active agent.
Photographing high-resolution TEM images of ZnSe NPs, as shown representatively in Figure 3f for tm = 60 min, we have observed lattice-fringe spacings in the center covered by a very thin amorphous-like layer (~0.5 nm) on the surface, which is considered as a defect layer. Such a feature suggests long-milled ZnSe NPs having the formation of the core/shell-type structure, which is usually observed in nanomaterials [7]. In an attempt to check possible elements in the fabricated NPs, EDS spectra were recorded at energies of 0–15 keV. The data plotted in Figure 4 reveal the EDS spectra having the energy peaks of Zn and Se, besides some peaks from carbon-coated copper grids. To the equipment limit, impurities related to the sample fabrication have not been detected. In short, the results collected from the XRD, TEM, and EDS analyses proved the high quality of fabricated ZnSe NPs.
The crystal structure of ZnSe NPs have also been assessed upon the features of RS spectra. Figure 5 shows their RS spectra in the wavenumber range of 100–600 cm−1. For the sample with tm = 0, its spectrum exhibits vibration modes peaked at about 138, 186, 201, 247, 289, and 492 cm−1. According to Refs. [23,24,25], the modes at 138, 201, and 247 cm−1 are assigned to 2TA, TO, and LO, respectively, while the mode at 492 cm−1 is associated with the LO phonon replica (2LO). They are considered as the characteristic modes of the zincblende-type ZnSe structure. These modes still persist in the other samples, proving good quality of the fabricated ZnSe NPs, which is in accordance with the results obtained from the XRD studies. The intensity of peaks rapidly decreases (particularly, 2TO and 2LO) while their peak position shifts towards lower frequencies when tm increases from 10 to 60 min, as shown in Figure 5 and its inset. This is related to lattice defects induced in ZnSe NPs by the milling process as decreasing the particle size d [26]. According to the spatial-correlation model [27], the spatial-correlation function of phonons in an ideal ZnSe crystal is infinite and obeys the q = 0 selection rules. For ZnSe NPs, the appearance and enhancement of the lattice defects can cause micro-structural disorders and shatter the translational symmetry. Under such situations, the standard selection rules (q = 0) would be modified and the correlations among phonon modes become restricted. It means that there is the contribution of q ≠ 0 phonons to RS processes. This results in the redshift and reduced intensity of the vibrations as observed above. Notably, besides four assigned modes, the RS spectrum of the as-prepared ZnSe NPs (tm = 0) have two additional weak modes (indicated as the asterisks in Figure 5) at about 186 and 289 cm−1. The first one (186 cm−1) is assigned to the LA mode [23] or the plasmon-LO-phonon-coupled mode [28], which becomes invisible as tm ≥ 10 min. Meanwhile, the other could be associated with the defect-related mode [29].
All the above results demonstrated that NP samples have the single phase and high crystal quality. The milling would reduce the particle size d and create more bulk defects [10]. Under an excitation wavelength of λexc = 355 nm, we observed their PL spectra having two emission bands labeled as E1 and E2, as shown in Figure 6a and its inset. The first emission E1 is blue at 462 nm, which is associated to the near-band-edge emission due to the recombination of free excitons [30]. It is evident that the intensity of the E1 peak rapidly decreases after 10 min of grinding and gradually drops with the milling time increasing, as shown in Figure 6a. In contrast to E1 peak behavior, the intensity of the E2 peak is enhanced with a longer grinding time. Combined with the structural and RS analyses, we assume that such changes in the peak position and intensity of E1 and E2 are associated with lattice defects and disorders induced by lowering the particle size d due to the tm increase. During the high-energy milling, many defects could be induced, such as zinc vacancies (VZn), selenide vacancies (VSe), zinc interstitials (Zni), selenide interstitials (Sei), and so forth. As E2 is found to be a broad emission, it is possible for all of these defects to appear in the samples. However, with the features of the PL spectra, we can assess which defect types are dominant in the samples.
For tm = 0–30 nm, only one peak in E2 region is observed at about 520–550 nm (2.38–2.25 eV), which is ascribed to VSe [31], VZn, and/or Zni defects [10,32]. The E2 band can be deconvoluted into two components for samples tm = 40 and 60 min, as shown in the inset of Figure 6a. The first peak (520–550 nm) in the E2 band is assigned relating to the vacancies and interstitials, while the feature at ~600 nm refers to lattice defects [10]. Thus, a strong increase in the E2 intensity as tm = 40–60 min, as shown in the inset of Figure 6a, proves that the concentrations of VSe, VZn, and/or Zni defects in ZnSe NPs increase. They can play as trapped electron centers and/or radiative recombination centers (with energy states within the band gap) and cause a quick decrease in intensity of E1. It is interesting that the dominant emission from the bulk defects was also observed in the similar ZnO NPs prepared by the same method (high energy ball milling), as reported by Aggelopoulos et al. [33]. Figure 6b shows the variation of the integrated PL intensity ratio of E2 to E1 (IE2/IE1), which exponentially increases as a function of tm. We note that the error value of tm = 60 is much larger than others for two reasons. Firstly, this sample has a signal-to-noise ratio lower than the remained samples, as clearly seen in Figure 6a. In addition, the error value is proportional to the obtained value.
To assess the applicability of ZnSe NPs in the photocatalytic activity, we have examined the photodegradation experiments of the RhB solution, which is a typical organic dye used in the textile industry. This process was carried out with different time durations under the UV-light condition. Figure 7a,b shows the PL spectra of two representative samples with tm = 0 and 60 min, which were measured with different intervals, until 150 min. We note that these two graphs are plotted on the same scale. As observed in Figure 7a, the PL intensity of RhB over hydrothermal sample (ZnSe NPs with tm = 0) immediately reduced for the first 15 min at the onset of reaction, followed by the subsequent decrease. At the same time (Figure 7b), the decrease occurred more rapidly by the presence of milling sample (ZnSe NPs with tm = 60 min). Here, the PL-intensity variation at 585 nm versus the irradiation time was used to assess the photocatalytic degradation efficiency because it is related to the relative concentration of the RhB solution [34].
If labelling Ci and Ct as the RhB concentrations at the initial time (ti = −30 min) and different illumination intervals, respectively, the efficiency will be estimated by the Ct/Ci ratio. The Ci and Ct values were determined via the emission intensities of the 585 nm peak of RhB solutions under the irradiation time during the photocatalytic reaction. The Ct/Ci plots versus the irradiation time are shown in Figure 8. It can be seen that the adsorption ability determined by the reaction took place under the dark condition for 30 min was slightly significant (less than 20%) for all investigating materials. This step is important to ensure that RhB solution is stable before photocatalytic process is proceeded. Under the UV-light condition, a rapid decrease within the first 15 min (~30%), followed by the subsequent decrease. The photocatalytic degradation performance was nearly completely achieved (~80%) after 150 min with the milled ZnSe sample (tm = 60 min). The obtained results partly confirmed the impact of milling on the improved photocatalytic activity of ZnSe samples. Based on other reports [35,36,37] and our obtained results, degradation mechanisms can be described in Figure 9.
Firstly, ZnSe catalyst absorbs UV light with an energy of hν to generate electron (e) and hole (h+) pairs in the valence band (VB) and conduction band (CB), respectively, according to the following equation:
ZnSe +   h υ   ( UV   light ) ZnSe   ( h VB + +     e CB )
The h+VB carriers are subsequently trapped by absorbed H2O on the ZnSe surface to generate highly reactive hydroxyl radicals (OH*), as shown in the equations:
ZnSe   ( h VB + ) + H 2 O ZnSe +   H + + OH *
ZnSe   ( h VB + ) + OH ZnSe + OH *
Concurrently, O2 acts as an electron acceptor from the CB to form a superoxide anion radical (O2*), which combines with protons to generate HO2*, as shown in the following equations:
ZnSe   ( e VB ) + O 2 ZnSe + O 2 * _
O 2 * _ + H + HO 2
The OH* radical can be also generated from the trapped electron (e) after creating the OOH* radical by the sequence of the following equations:
HO 2 + H + + ZnSe   ( e VB ) H 2 O 2 + ZnSe
H 2 O 2 + ZnSe   ( e VB ) OH * + OH + ZnSe
OH * + RhB     CO 2 +   H 2 O
After the processes from Equations (5)–(12), RhB molecules will be degraded to their intermediates and the expected products such as CO2 and H2O. The photocatalytic activity depends on many factors, for example, the UV-irradiation time, bandgap energy, particle size, and/or defect types of ZnSe. In our work, among the studied samples, ZnSe NPs with tm = 60 min were the most active photocatalyst, corresponding to ~80% RhB decomposed after 150 min being irradiated by the UV light, which was about 10% higher than the value of the as-prepared NPs (tm = 0). This value is comparable to that obtained for ZnO/ZnSe hybrid nanocomposites [38], and higher than that obtained in the previous studies for ZnSe NPs [7] and nanorod films [8]. We suggest that a high photocatalytic performance of our ZnSe NPs with tm = 60 min is mostly related to their large surface area. This allows more RhB molecules adsorbed on the surface of ZnSe NPs that enhances a charge-transfer rate, due to a higher number of active-catalytic centers. Based on the PL data, as shown in Figure 6a, it was evident that the photocatalytic activity was dependent on both the particle size and defects. The smallest size (the largest surface area) and a green emission at ~555 nm due to VZn defects of ZnSe NPs with tm = 60 min mainly contributed the improved photocatalytic activity.

4. Conclusions

We investigate the structural characterization, optical properties, and photocatalytic performance of ZnSe NPs, which were obtained by changing the milling time tm = 0–60 min. All obtained samples have the single phase of zincblende-type and without impurities, confirmed by XRD, TEM, EDS, and RS analyses. It should be noticed that the increasing tm results in the redshift and broadening of the characteristic Raman modes of ZnSe, which are related to the NP surface state, lattice defects, and micro-structural disorders. From the PL spectra, the existence of the E1 and E2 peaks are attributed to the excitonic-near-band edge and defects, respectively. Their intensity and peak position strongly change with respect to tm, due to more defects induced in the ZnSe host lattice. The photocatalytic activity of ZnSe NPs was also assessed upon the RhB-solution degradation. We found that ZnSe NPs with tm = 60 min showing the best photocatalytic performance, which could be related to the enhanced emission intensity at ~555 nm due to VZn defects that acted as a co-catalyst to limit the recombination of charge carriers. Photocatalytic mechanisms were proposed to explain the RhB degradation.

Author Contributions

B.T.T.H. prepared ZnSe by combining both hydrothermal and mechanical milling methods. V.T.M. performed XRD, Raman, and TEM measurements and analysis. P.T.T. and V.X.H. performed the transport measurement and analyzed the results. Writing, reviewing, and editing: T.T.K.C. All authors discussed the results and contributed to writing the manuscript. All authors have read and agreed to the published version of the manuscript.

Funding

The current work was financially supported by the NAFOSTED 103.03-2017.363.

Data Availability Statement

We are able to deliver analyzed data via e-mail (the request may be sent to: [email protected]).

Conflicts of Interest

The authors declare no conflict of interest.

References

  1. Yi, G.-C. (Ed.) Semiconductor Nanostructures for Optoelectronic Devices; Springer: Berlin/Heidelberg, Germany, 2012. [Google Scholar]
  2. Nguyen, H.P.T.; Arafin, S.; Piao, J.; Cuong, T.V. Nanostructured Optoelectronics: Materials and Devices. J. Nanomater. 2016, 2016, 2051908. [Google Scholar] [CrossRef]
  3. Prakash, T. Review on nanostructured semiconductors for dye sensitized solar cells. Electron. Mater. Lett. 2012, 8, 231–243. [Google Scholar] [CrossRef]
  4. Schneider, J.; Matsuoka, M.; Takeuchi, M.; Zhang, J.; Horiuchi, Y.; Anpo, M.; Bahnemann, D.W. Understanding TiO2 Photocatalysis: Mechanisms and Materials. Chem. Rev. 2014, 114, 9919–9986. [Google Scholar] [CrossRef] [PubMed]
  5. Chen, L.; Zhang, W.; Feng, C.; Yang, Z.; Yang, Y. Replacement/Etching Route to ZnSe Nanotube Arrays and Their Enhanced Photocatalytic Activities. Ind. Eng. Chem. Res. 2012, 51, 4208–4214. [Google Scholar] [CrossRef]
  6. Cao, F.; Shi, W.; Zhao, L.; Song, S.; Yang, J.; Lei, Y.; Zhang, H. Hydrothermal Synthesis and High Photocatalytic Activity of 3D Wurtzite ZnSe Hierarchical Nanostructures. J. Phys. Chem. C 2008, 112, 17095–17101. [Google Scholar] [CrossRef]
  7. Feng, B.; Cao, J.; Han, D.; Liang, H.; Yang, S.; Li, X.; Yang, J. ZnSe nanoparticles of different sizes: Optical and photocatalytic properties. Mater. Sci. Semiconduct. Process. 2014, 27, 865–872. [Google Scholar] [CrossRef]
  8. Yin, J.; Yang, C.; Yang, X.; Wang, S.; Zhang, H.; Zhou, S.; Feng, G. Fabrication and Photocatalytic Properties of ZnSe Nanorod Films. J. Nanomater. 2016, 2016, 1738608. [Google Scholar] [CrossRef] [Green Version]
  9. Cao, H.; Xiao, Y.; Zhang, S. The synthesis and photocatalytic activity of ZnSe microspheres. Nanotechnology 2011, 22, 015604. [Google Scholar] [CrossRef]
  10. Feng, B.; Cao, J.; Han, D.; Yang, S.; Yang, J. Study on growth mechanism and optical properties of ZnSe nanoparticles. J. Mater. Sci. Mater. Electron. 2015, 26, 3206–3214. [Google Scholar] [CrossRef]
  11. Feng, B.; Yang, J.; Cao, J.; Yang, L.; Gao, M.; Wei, M.; Liu, Y.; Song, H. Controllable synthesis, growth mechanism and optical properties of the ZnSe quantum dots and nanoparticles with different crystalline phases. Mater. Res. Bull. 2013, 48, 1040–1044. [Google Scholar] [CrossRef]
  12. Yao, T.; Zhao, Q.; Qiao, Z.; Peng, F.; Wang, H.; Yu, H.; Chi, C.; Yang, J. Chemical Synthesis, Structural Characterization, Optical Properties, and Photocatalytic Activity of Ultrathin ZnSe Nanorods. Chem. A Eur. J. 2011, 17, 8663–8670. [Google Scholar] [CrossRef]
  13. Das, P.; Pan, A.; Chakraborty, K.; Pal, T.; Ghosh, S. RGO-ZnSe Photocatalyst towards Solar-Light-Assisted Degradation of Tetracycline Antibiotic Water Pollutant. ChemistrySelect 2018, 3, 10214–10219. [Google Scholar] [CrossRef]
  14. Sun, C.; Li, T.; Wen, W.; Luo, X.; Zhao, L. ZnSe/CdSe core–shell nanoribbon arrays for photocatalytic applications. CrystEngComm 2020, 22, 895–904. [Google Scholar] [CrossRef]
  15. Chen, W.; Zhang, N.; Zhang, M.Y.; Zhang, X.T.; Gao, H.; Wen, J. Controllable growth of ZnO–ZnSe heterostructures for visible-light photocatalysis. CrystEngComm 2014, 16, 1201–1206. [Google Scholar] [CrossRef]
  16. Sitara, E.; Ehsan, M.F.; Nasir, H.; Iram, S.; Bukhari, S.A.B. Synthesis, Characterization and Photocatalytic Activity of MoS2/ZnSe Heterostructures for the Degradation of Levofloxacin. Catalysts 2020, 10, 1380. [Google Scholar] [CrossRef]
  17. Chi, T.T.K.; Hien, B.T.T.; Nam, M.H.; Hai, P.N. Structural and Optical Properties of ZnSe Nanoparticles. J. Nanosci. Nanotechnol. 2021, 21, 2582–2587. [Google Scholar] [CrossRef]
  18. Zhang, Q.; Li, H.; Ma, Y.; Zhai, T. ZnSe nanostructures: Synthesis, properties and applications. Prog. Mater. Sci. 2016, 83, 472–535. [Google Scholar] [CrossRef]
  19. Miah, M.A.H.; Begum, J.; Uddin, M.J.; Momin, M.A.; Bhuiyan, M.R.A. Influence of Thickness on the Structural and Optical Properties of ZnSe Thin Films. J. Appl. Sci. Technol. 2010, 7, 27–32. [Google Scholar]
  20. Reiss, P. ZnSe based colloidal nanocrystals: Synthesis, shape control, core/shell, alloy and doped systems. New J. Chem. 2007, 31, 1843–1852. [Google Scholar] [CrossRef]
  21. Yang, L.; Xie, R.; Liu, L.; Xiao, D.; Zhu, J. Synthesis and Characterization of ZnSe Nanocrystals by W/O Reverse Microemulsion Method: The Effect of Cosurfactant. J. Phys. Chem. C 2011, 115, 19507–19512. [Google Scholar] [CrossRef]
  22. Peng, L.L.; Wang, Y.H.; Li, C.Y. Ultraviolet-Blue Photoluminescence of ZnSe Quantum Dots. J Nanosci. Nanotechnol. 2010, 10, 2113–2118. [Google Scholar] [CrossRef]
  23. Lu, G.; An, H.; Chen, Y.; Huang, J.; Zhang, H.; Xiang, B.; Zhao, Q.; Yu, D.; Du, W. Temperature dependence of Raman scattering of ZnSe nanoparticle grown through vapor phase. J. Cryst. Growth 2005, 274, 530–535. [Google Scholar] [CrossRef]
  24. Shi, L.; Wang, C.; Wang, J.; Fang, Z.; Xing, H. Temperature-Dependent Raman Scattering of ZnSe Nanowires. Adv. Mater. Phys. Chem. 2016, 6, 305–317. [Google Scholar] [CrossRef] [Green Version]
  25. Hui-Zhi, A.; Qing, Z.; Wei-Min, D. Raman spectra of ZnSe nanoparticles synthesized by thermal evaporation method. Chin. Phys. 2004, 13, 1753–1757. [Google Scholar] [CrossRef]
  26. Gao, Y.; Zhao, X.; Yin, P.; Gao, F. Size-Dependent Raman Shifts for nanocrystals. Sci. Rep. 2016, 6, 20539. [Google Scholar] [CrossRef]
  27. Phan, T.-L.; Yu, S.C. Optical and Magnetic Properties of Zn1–x MnxO Nanorods Grown by Chemical Vapor Deposition. J. Phys. Chem. C 2013, 117, 6443–6453. [Google Scholar] [CrossRef]
  28. Yugami, H.; Nakashima, S.; Sakai, K.; Kojima, H.; Hangyo, M.; Mitsuishi, A. Raman Scattering from Plasmon-LO-Phonon Coupled Modes in n-ZnSe. J. Phys. Soc. Jpn. 1987, 561, 881–1889. [Google Scholar] [CrossRef]
  29. Xu, J.; Lu, A.; Wang, C.; Zou, R.; Liu, X.; Wu, X.; Wang, Y.; Li, S.; Sun, L.; Chen, X.; et al. ZnSe-Based Longitudinal Twinning Nanowires. Adv. Eng. Mater. 2014, 16, 459–465. [Google Scholar] [CrossRef]
  30. Shi, L.; Xu, Y.; Li, Q. Controlled Fabrication of ZnSe Arrays of Well-Aligned Nanorods, Nanowires, and Nanobelts with a Facile Template-Free Route. J. Phys. Chem. C 2009, 113, 1795–1799. [Google Scholar] [CrossRef]
  31. Li, J.; Wang, M.; Huo, X.; Yao, X. Preparation and optical properties of dispersible ZnSe nanocrystals synthesized by high energy ball milling. Ceram. Int. 2008, 34, 1077–1080. [Google Scholar] [CrossRef]
  32. Baltramiejūnas, R.; Ryzhikov, V.D.; Račiukaitis, G.; Gavryushin, V.; Juodžbalis, D.; Kazlauskas, A. Centers of radiative and nonradiative recombination in isoelectronically doped ZnSe: Te crystals. Phys. B Condens. Matter. 1993, 185, 245–249. [Google Scholar] [CrossRef]
  33. Aggelopoulos, C.A.; Dimitropoulos, M.; Govatsi, A.; Sygellou, L.; Tsakiroglou, C.D.; Yannopoulos, S.N. Influence of the surface-to-bulk defects ratio of ZnO and TiO2 on theirUV-mediated photocatalytic activity. Appl. Catal. B Environ. 2017, 205, 292–301. [Google Scholar] [CrossRef]
  34. Dirany, N.; Hallaoui, A.; Valmalette, J.C.; Arab, M. Effect of morphology and temperature treatment control on the photocatalytic and photoluminescence properties of SrWO4 crystals. Photochem. Photobiol. Sci. 2020, 19, 235–250. [Google Scholar] [CrossRef]
  35. Isari, A.A.; Payan, A.; Fattahi, M.; Jorfi, S.; Kakavandi, B. Photocatalytic degradation of rhodamine B and real textile wastewater using Fe-doped TiO2 anchored on reduced graphene oxide (Fe-TiO2/rGO): Characterization and feasibility, mechanism and pathway studies. Appl. Surf. Sci. 2018, 462, 549–564. [Google Scholar] [CrossRef]
  36. Sui, Y.; Liub, Q.; Jianga, T.; Guoa, Y. Synthesis of nano-TiO2 photocatalysts with tunable Fe doping concentration from Ti-bearing tailings. Appl. Sci. 2018, 428, 1149–1158. [Google Scholar] [CrossRef]
  37. Yang, J.; Zhu, H.; Peng, Y.; Li, P.; Chen, S.; Yang, B.; Zhang, J. Photocatalytic Performance and Degradation Pathway of Rhodamine B with TS-1/C3N4 Composite under Visible Light. Nanomaterials 2020, 10, 756. [Google Scholar] [CrossRef] [PubMed] [Green Version]
  38. Al Abass, N.; Qahtan, T.F.; Gondal, M.A.; Moqbel, R.A.; Bubshait, A. Laser-assisted synthesis of ZnO/ZnSe hybrid nanostructured films for enhanced solar-light induced water splitting and water decontamination. Int. J. Hydrogen Energy 2020, 45, 22938–22949. [Google Scholar] [CrossRef]
Figure 1. Fabrication steps of ZnSe NPs using the hydrothermal and mechanical milling methods.
Crystals 11 01125 g001
Figure 2. XRD patterns of the samples with tm = 0–60 min (red symbols) fitted to the theoretical model using Rietveld refinement (the blue solid lines); vertical blue sticks correspond to standard diffraction angles of the F 4 ¯ 3 m zincblende-type structure addressed for tm = 0.
Crystals 11 01125 g002
Figure 3. TEM images of ZnSe NPs with (a) tm = 0, (b) tm = 10 min, (c) tm = 20 min, (d) tm = 40 min, and (e) tm = 60 min, which show the change in particle sizes. (f) A typical high-resolution TEM image for with tm = 60 min.
Crystals 11 01125 g003
Figure 4. EDS spectra of two representative ZnSe NPs with (a) tm = 0, and (b) tm = 60 min.
Crystals 11 01125 g004
Figure 5. RS spectra of ZnSe NPs with different tm values, excited by λexc = 532 nm. The asterisks show the additional modes coming from chemical remnants. The inset indicates the redshift of the 1LO peak as increasing tm (Peaks at “*” are assigned to the LA mode or the plasmon-LO-phonon-coupled mode).
Crystals 11 01125 g005
Figure 6. (a) PL spectra of ZnSe NPs with different tm values excited by a wavelength λexc = 355 nm; the inset shows the PL spectra of the samples tm = 20–60 min in order to resolve their low PL signals. (b) The integrated PL intensity ratio of IE2/IE1 varying as a function of tm. ∗ is multiplication symbol in the equation.
Crystals 11 01125 g006
Figure 7. PL spectra of RhB over two typical ZnSe NPs samples with different milling time (a) tm = 0 and (b) tm = 60 min under UV-light irradiation at various periods. Note that two graphs are plotted on the same scale.
Crystals 11 01125 g007
Figure 8. Photodegradation efficiency (Ct/C0) of RhB over ZnSe NPs (tm = 0–60 min) under UV irradiation for different times.
Crystals 11 01125 g008
Figure 9. Schematic illustration of photocatalytic performance of ZnSe NCs for RhB decomposition.
Crystals 11 01125 g009
Publisher’s Note: MDPI stays neutral with regard to jurisdictional claims in published maps and institutional affiliations.

