
Preparation of Zinc Oxide and Zinc Ferrite from Zinc Hypoxide by Wet Process and Electrochemistry

College of Metallurgy and Energy, North China University of Science and Technology, Tangshan 063210, China
*
Author to whom correspondence should be addressed.
Crystals 2021, 11(9), 1133; https://0-doi-org.brum.beds.ac.uk/10.3390/cryst11091133
Submission received: 31 August 2021
/
Revised: 10 September 2021
/
Accepted: 12 September 2021
/
Published: 18 September 2021
(This article belongs to the Special Issue Metallurgical Slag)
Abstract
:With the increase of zinc resource consumption, the recovery and utilization of zinc resources in zinc suboxide has become one of the current research hotspots. In this study, the electrochemical method was used to remove the impurities in the zinc leaching night and enrich the zinc ferrite in the ammonia leaching residue for the solution and ammonia leaching slag after the ammonia leaching of zinc hypoxide, in order to realize the comprehensive utilization of the essence of zinc immersion night and new resources. The results showed that the reduction potentials of copper, lead, cadmium, and zinc in the ammonia leaching solution were analyzed by electrochemical testing methods to be −0.76 V, −0.82 V, −0.94 V, and −1.3 V, respectively. Through constant potential electrodeposition, the removal rate of copper, lead, cadmium. The removal rate of cadmium is 98.73%, and the removal rate of lead and copper is more than 99%. The purified ammonia leaching solution is evaporated at 90 °C for 25 min to obtain basic zinc carbonate. The purity of ZnO obtained after calcination at 500 °C for 120 min is 96.31%. The ammonia leaching residue was pickled with 3 mol·L−1 acetic acid for 30 min to effectively remove PbCO3, and then magnetic separation was carried out with a current intensity of 1.4 A. The final zinc ferrite content was 83.83%.
1. Introduction
The treatment of zinc hypoxide is usually carried out by a wet process. There is also a big gap in the composition and zinc content of zinc hypoxide from different sources. Therefore, in the process of studying zinc oxide, it is necessary to adjust and change the experimental program according to the actual analysis results and to carry out targeted treatment. According to the different leaching agents, the treatment process of zinc hypoxide is usually divided into acid leaching method [1,2], alkaline leaching method [3,4], and ammonia leaching method [5,6,7]. In the ammonia leaching process, zinc oxide exists in the form of zinc–ammonia complexes, and elements such as lead, cadmium, copper and ammonia will also enter the ammonia leaching solution in the form of complexes with ammonia. Elements such as magnesium, aluminum, manganese, silicon, and arsenic will not react with the leaching agent and will not enter the ammonia leaching slag; there will be zinc ferrite in zinc hypoxide. The chemical properties of zinc ferrite are stable during the leaching process, therefore, zinc ferrite will not react with the ammonia leaching solution but will enter the ammonia leaching residue, thereby reducing the zinc leaching rate [8,9]. At the same time, the excellent properties of zinc ferrite make it have a wide range of research and development prospects [10,11,12].
According to the characteristics of zinc ferrite, its treatment process is mainly divided into physical methods and roasting methods. The physical method is mainly used to directly or indirectly destroy the structure of zinc ferrite [13], including the ultrasonic stirring method, mechanical strengthening method, and microwave method. The roasting method includes two treatment processes: high temperature and low temperature. Among them, the high-temperature roasting process is mainly divided into a reduction roasting process [14] and a CaO roasting process [15]. The low-temperature roasting process is mainly roasted at 150 °C by adding FeCl3·6H2O or other chemical reagents to make it mix with ferric acid. Zinc reacts to form a salt with higher solubility [16]. The aim of the present paper is to study the ammonia leaching solution and ammonia leaching residue produced after the ammonia leaching of zinc oxide and to explore the electrochemical reduction mechanism of impurity elements in the solution by cyclic voltammetry. Then, the impurity elements of lead, copper, and cadmium in the ammonia leaching solution are removed by the constant potential electrodeposition method to realize the direct separation and purification of the impurity elements, and a pure zinc–ammonia solution is obtained. Compared with the traditional wet method, the process greatly shortens the process flow, and proposes a new idea for the removal of impurity ions in the ammonia zinc leaching solution. At the same time, acetic acid with a concentration of 3 mol·L−1 was used to remove PbCO3 from the ammonia leaching residue after 30 min pickling. Finally, the enrichment and extraction of zinc ferrite was achieved by magnetic separation.
2. Materials and Methods
In the experiment process, X-ray fluorescence (XRF) detection was carried out on the raw material of zinc hypoxide first, and the solution and ammonia leaching residue of zinc hypoxide after ammonia leaching were selected as the research objects. The zinc–ammonia complex and the ammonia leaching residue were separated by filtration, and the impurity elements in the ammonia leaching solution are detected by inductively coupled plasma mass spectrometry (ICP). The experimental conditions are: stirring speed was 500 r·min−1, total ammonia concentration is 4 mol·L−1, [NH4]/[NH3] T = 0.3:1, temperature was 35 °C, time is 30 min, The liquid–solid ratio is 7 mL·g−1.
A three-electrode system is used for electrochemical testing. The working electrode is an L-shaped glassy carbon electrode with Φ = 3 mm, the auxiliary electrode is a platinum electrode with a size of 10 mm × 10 mm × 0.1 mm, and the reference electrode is a double salt bridge Hg/HgO (0.098 V) electrode, the experimental temperature is 30 °C, respectively test the cyclic voltammetry curve, square wave voltammetry curve, and chronopotential curve under different conditions.
A three-electrode system was used for the constant potential electrodeposition experiment. The cathode and anode were made of 15 mm × 15 mm × 0.5 mm stainless steel sheets, and the reference electrode was a double salt bridge Hg/HgO electrode. The experiment temperature was 30 °C, and the potential change was selected. The range is −0.5–−1.2 V. After the experiment, the cathode plate is washed and tested.
The acetic acid leaching experiment was carried out with a three-necked flask equipped with a mechanical stirring paddle and a thermometer at the mouth of the bottle. The experimentally prepared acetic acid was poured into the flask and heated to the experimental temperature in a constant temperature water bath. Then 10 g of the sample was weighed into the flask and stirred at 400 r·min−1—the dissolution time was 90 min— and finally, the sample was sealed. After the dissolution, the filtrate and the filter residue were separated using a vacuum filter flask, and the filter residue was washed three times with distilled water. Finally, the dried filter residue was weighed and tested.
A CHI660E (Shanghai, China) electrochemical workstation was used for electrochemical testing and electrodeposition experiments; the X-ray diffractometer (D/MAX2500PC, Tokyo, Japan) of Rigaku Corporation was used to characterize the phase composition of the samples; the high-throughput field emission projection of Nihon Electronics Corporation was used as an electron microscope (JEM-2800F, Tokyo, Japan) for scanning electron microscopy (SEM) analysis of the samples; the US Thermo Fisher iCAP7000 (ICP, Waltham, MA, USA) inductively coupled plasma spectrometer was used for element content analysis; XRF (1800 Shimadzu Limited, Japan) was used for composition detection.
3. Results
3.1. Extraction of Zinc Oxide
3.1.1. Purification of Zinc Ammonia Solution
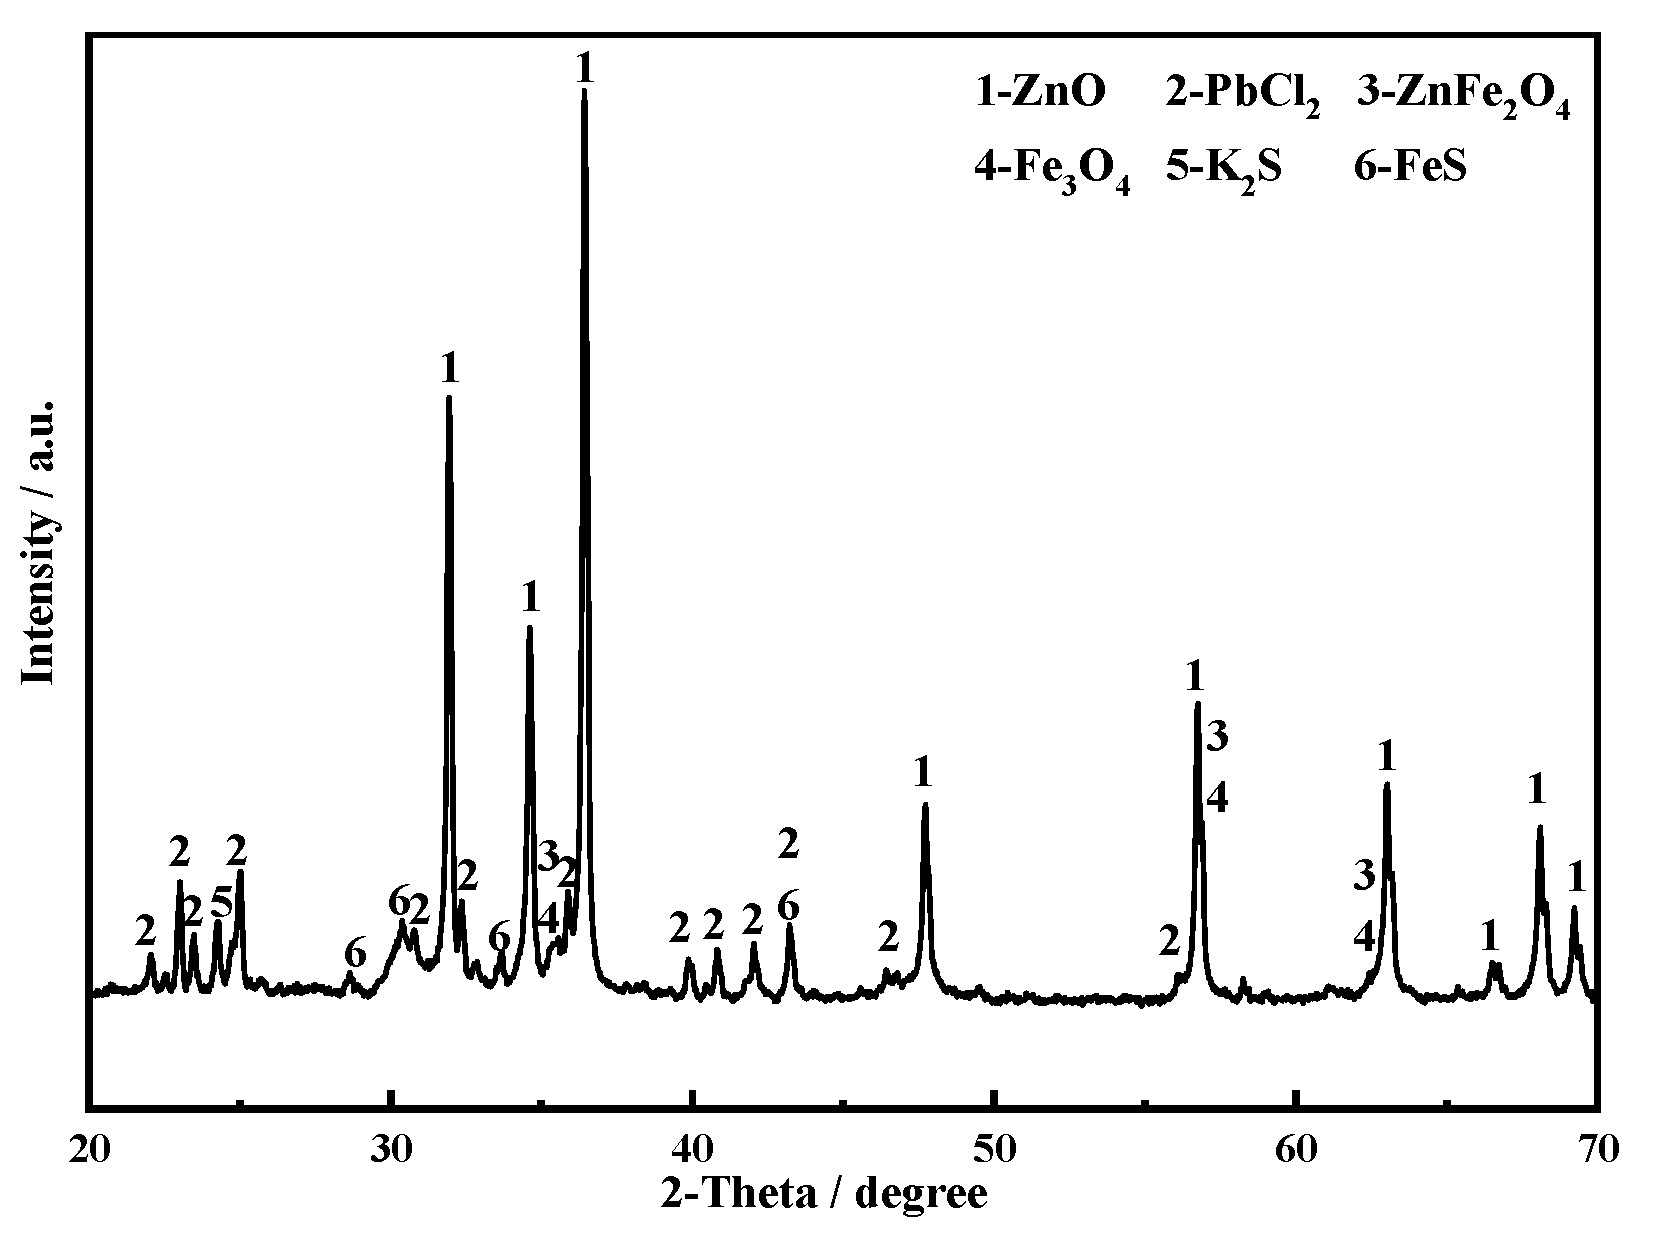
Figure 1 and Table 1 are the XRD patterns and XRF data of zinc hypoxide raw materials, respectively. After the zinc hypoxide was leached by the ammonia solution, the zinc oxide in the zinc hypoxide entered the solution, and at the same time, some impurity ions were leached out together. The main element content of impurity ions is shown in Table 2. Since the leaching solution contained large concentrations of lead, cadmium, and copper ions, these impurity ions affect the quality of zinc oxide in the subsequent preparation of zinc oxide. Therefore, it is necessary to separate the lead, cadmium, and copper impurities in the solution. Electrochemistry was used to study the deposition process of each impurity.
3.1.2. Cyclic Voltammetry
The black dotted line in Figure 2 is the cyclic voltammetric test result of the NH3-NH4HCO3-H2O system. It can be seen that there is no redox peak in the voltage range of −1.6 to 1 V. The red solid line is the cyclic voltammetry test result after adding ZnO to the NH3-NH4HCO3-H2O system. The amount of ZnO added is consistent with the zinc content in the zinc hypoxide leaching solution. The redox peaks (A, A′) appearing in the range of −1.3 to 0 V correspond to the redox process of zinc. When the potential is −1.2 V, the redox curve appears at an intersection, which indicates the nucleation process of zinc. The blue solid line is the cyclic voltammetry curve of the zinc suboxide leaching solution. There are four oxidation peaks (A, B, C, D) and two reduction peaks (A′, B′) at −1.6–1 V. According to the standard electrode potential in Table 3, peaks B and B′ are the redox peaks of Cd element, and peaks C and D are the oxidation peaks of Pb and Cu, respectively. No reduction peaks corresponding to peaks C and D were observed.
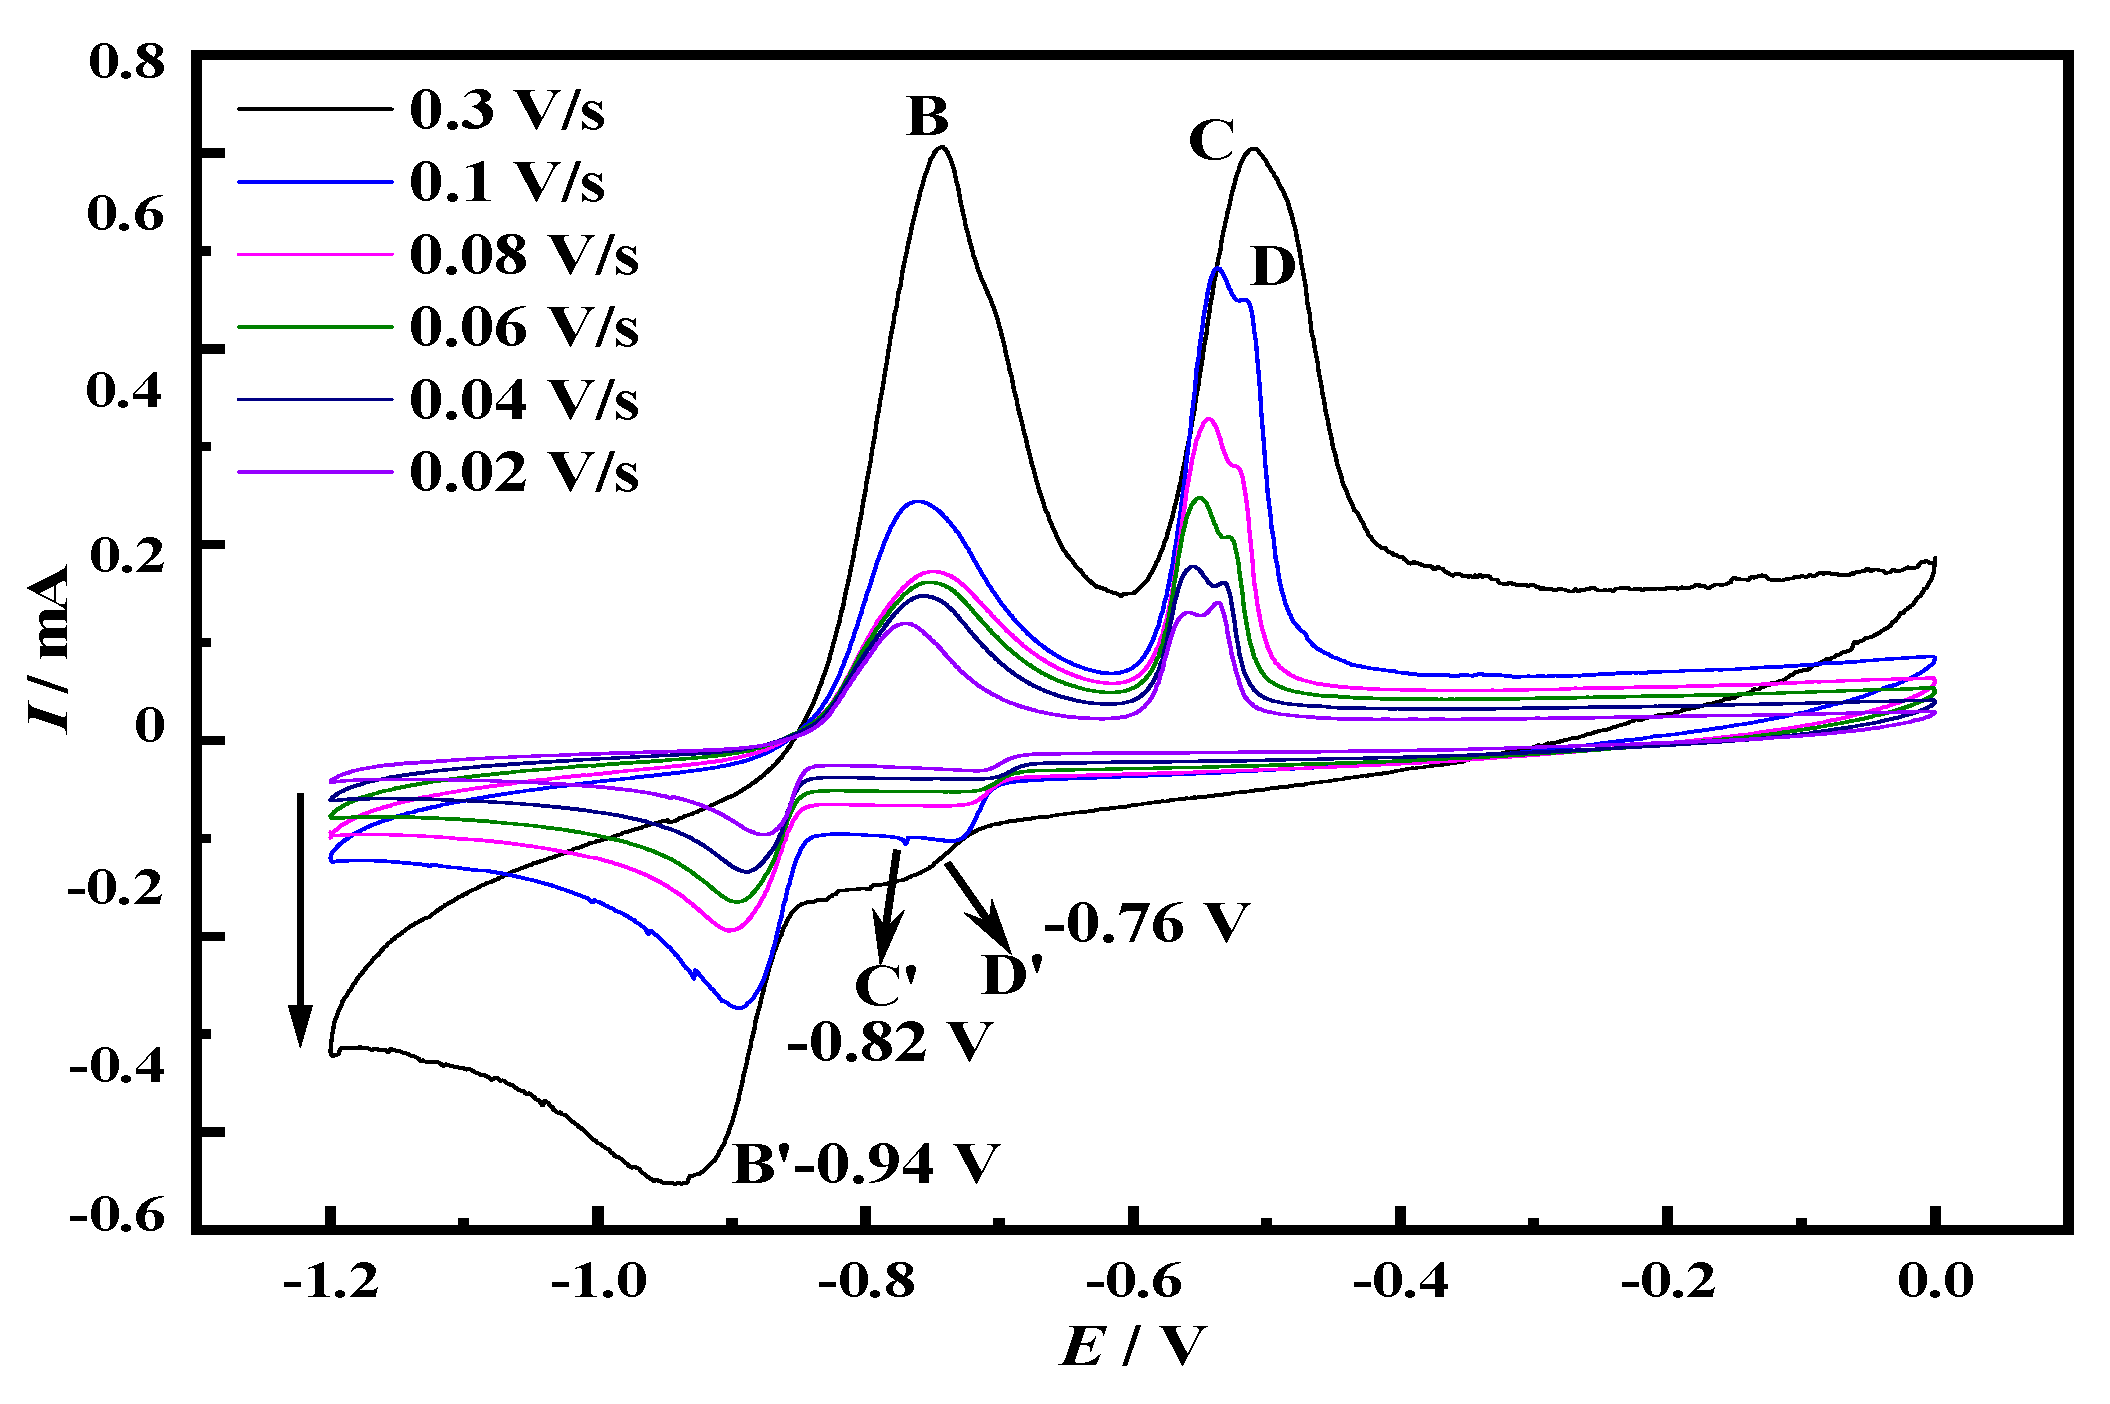
The cyclic voltammetry test with different sweep speeds (0.02–0.3 V·s−1) was carried out in the potential range of −1.2 to 0 V, and the results are shown in Figure 3, where there are multiple redox peaks. According to the electronegativity of copper, lead, and cadmium, it is judged that the three groups of peaks of B/B′, peak C/C′, and peak D/D′ correspond to the oxidation–reduction process of cadmium, lead, and copper, respectively. The peak current gradually increases with the increase of the sweep speed, because the electrochemical reaction speed increases with the increase of the sweep speed, which promotes the rapid transfer of charges and increases the limiting current. In addition, the polarization phenomenon causes the peak potential to shift at different scanning speeds.
3.1.3. Square Wave Voltammetry
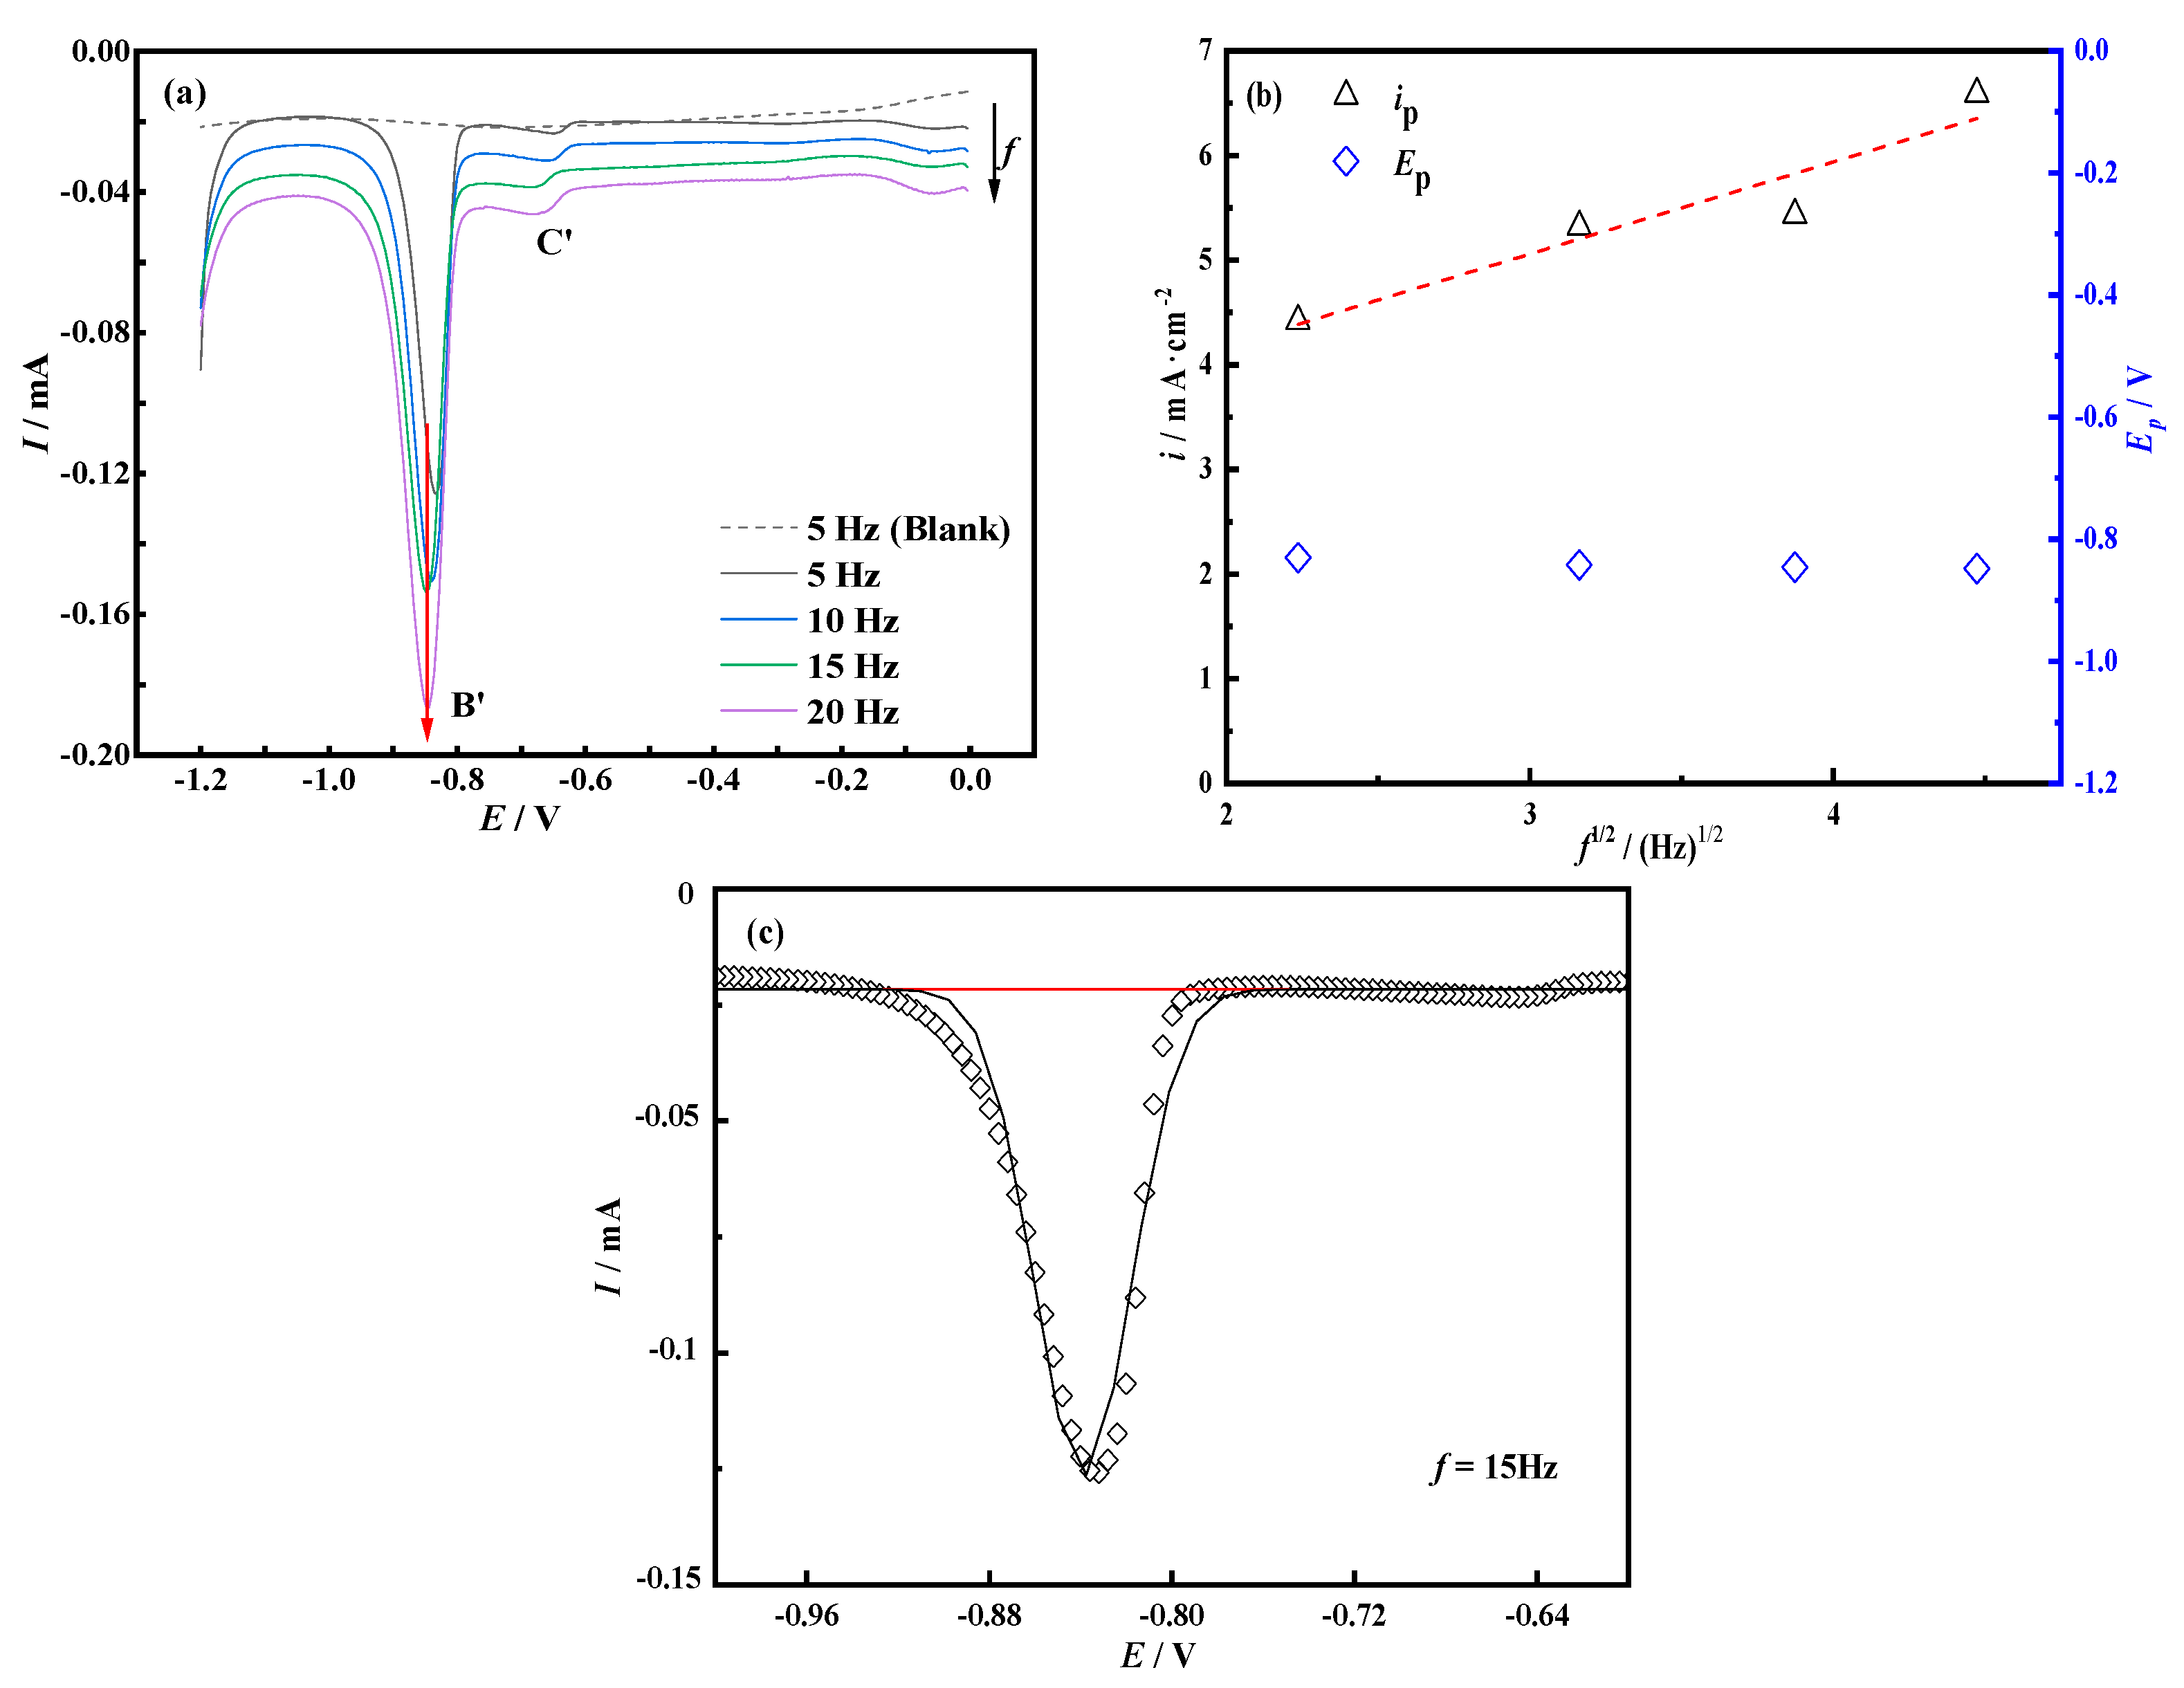
The leaching solution of zinc suboxide was tested with square wave voltammetry at different frequencies (5–20 Hz) in the potential range of −1.2 V to 0 V. The results are shown in Figure 4a. It can be seen from the Figure that there are two peaks (B′, C′) in the potential range of −1 V to −0.6 V, and peak B′ corresponds to the reduction process of cadmium. According to the relationship between the current density of peak B′ and the square root of the scanning frequency obtained in Figure 4b, the current density has a linear relationship with the square root of the frequency, and the peak potential does not significantly shift with the increase of the scanning frequency. It can be judged that the reduction reaction of the cadmium element corresponding to peak B′ is a reversible reaction. The 15 Hz square wave volt-ampere curve was selected for fitting as shown in Figure 4c, and the half-peak width (W1/2) was obtained, and calculated by formula (1), the n value is 1.83, which proves that the peak B′ was the electrochemical reduction process in which the number of transferred electrons was 2.
In the formula: R-molar gas constant (8.3145 J/mol/K); n-electron transfer number; T-temperature (K); F-Faraday’s constant (96,485 C/mol).
3.1.4. Chronopotential
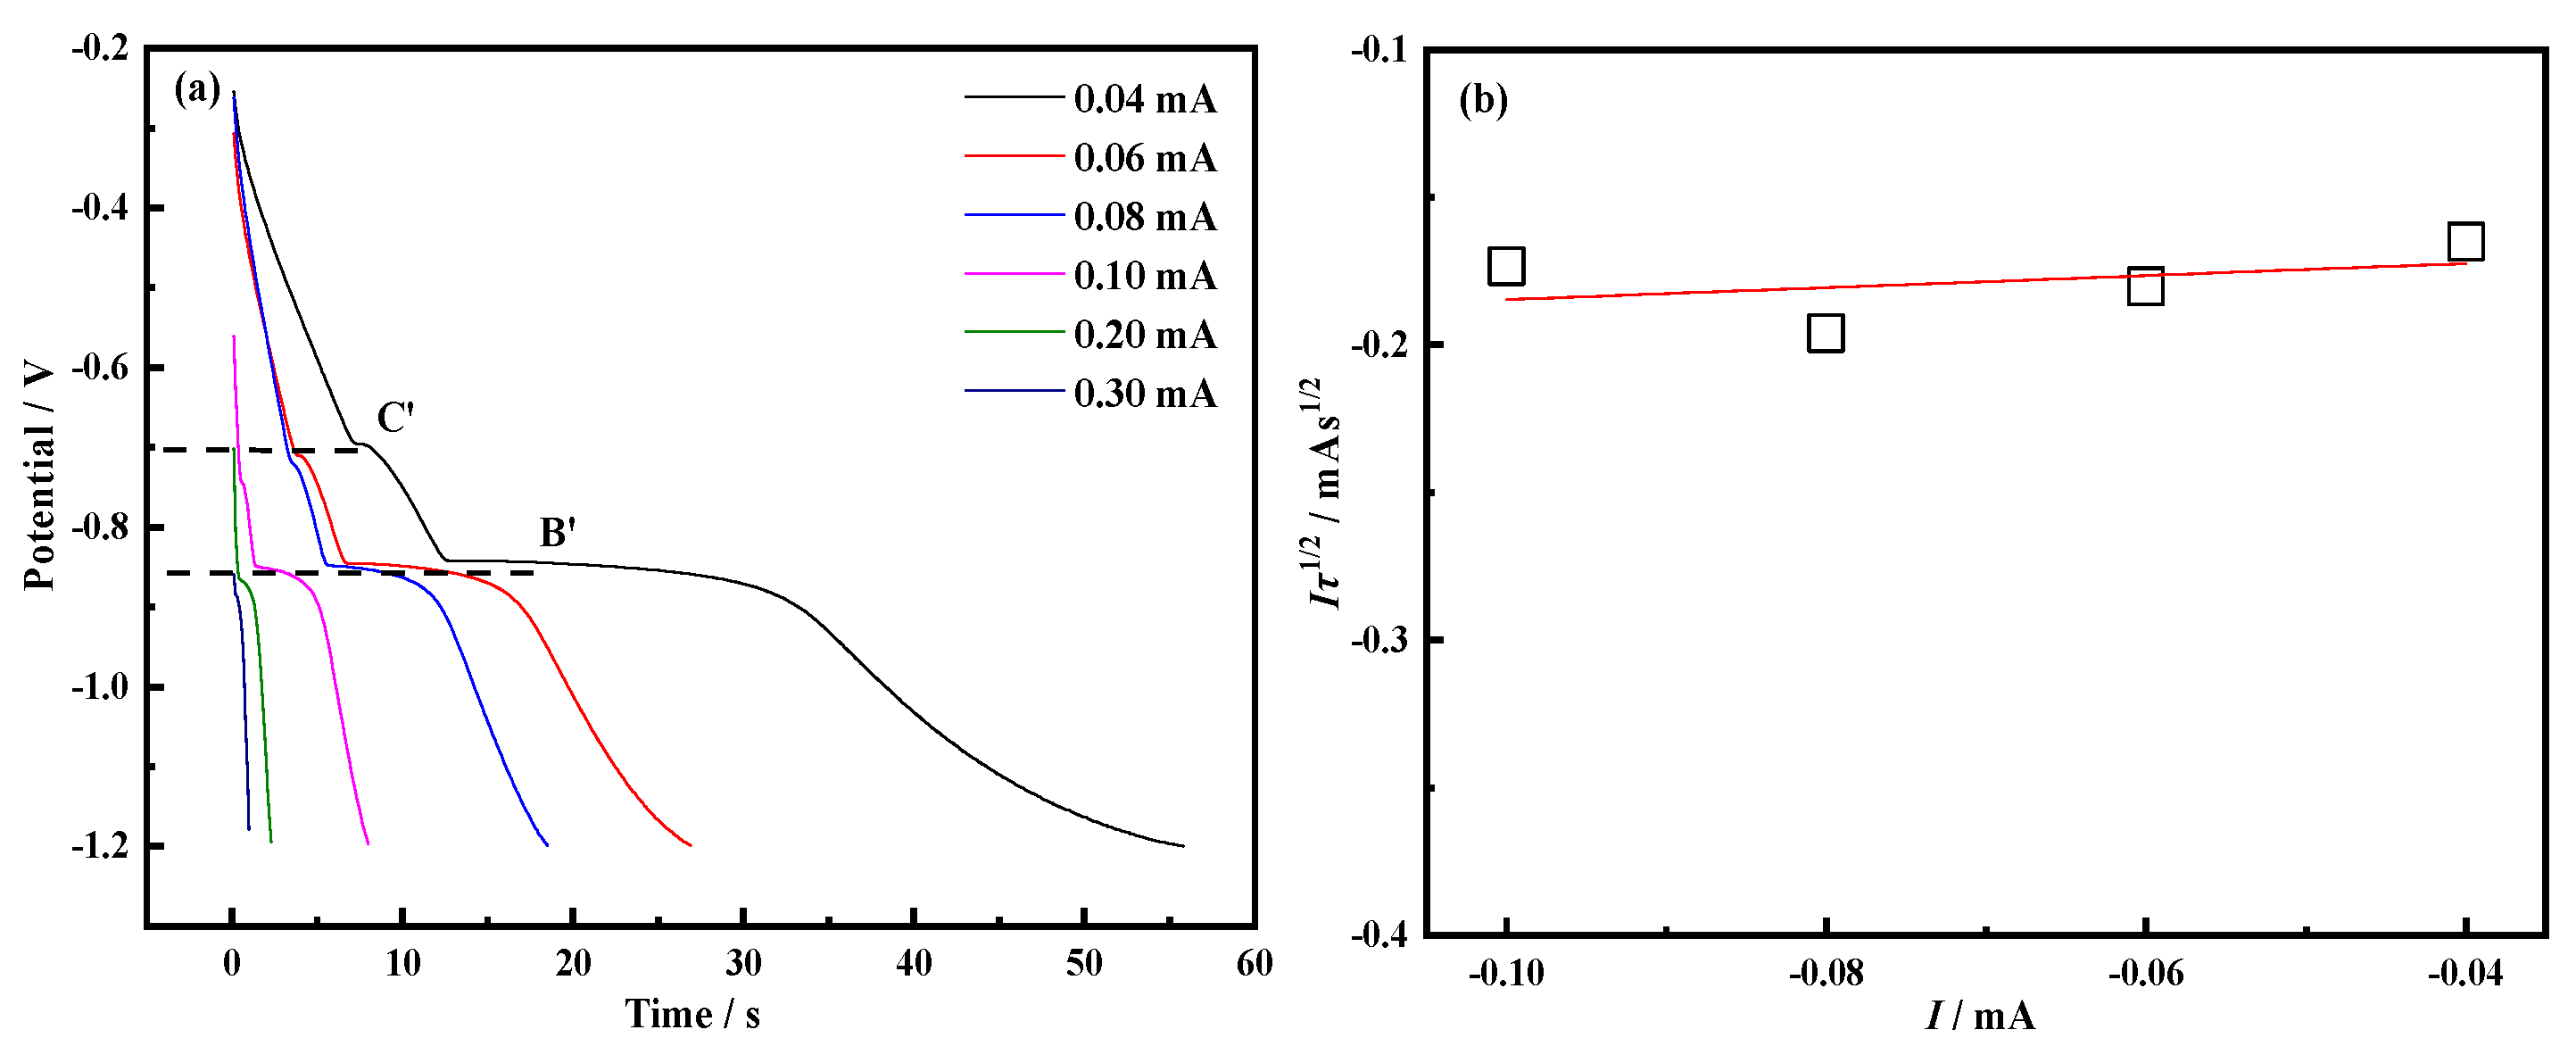
In order to determine whether the electrode process is controlled by diffusion, a chronopotentiometric test was performed under different applied currents. Figure 5 shows the chronopotential curve of the zinc suboxide leaching solution recorded at 30 °C. When it reaches the reduction potential of the first step reaction, a large number of electrons participate in the reduction reaction and the potential decreases. As the electrochemical reaction progresses, the potential reaches a relatively balanced state, platform C′ is formed. As time increases, the active ions in the solution diffuse slowly around the electrode, the concentration of active ions on the electrode surface decreases, and the reaction speed slows down. When the diffusion of ions in the solution makes it difficult to maintain the ions consumed by the electrode, the generation of concentration polarization makes electrons continue to accumulate on the cathode, and the potential continues to increase negatively. When the reduction potential of cadmium is reached, a plateau B′ is formed. It can be seen from the Figure that the larger the given current condition, the larger the starting potential of the curve, which is caused by the different accumulation degrees of electrons at the electrodes. As the applied current increases, the electron energy level transitions faster, and the transition time between platforms is significantly shortened. Select the platform B′ to restore the data and plot the relationship between Iτ1/2 and the applied current I. It can be observed that the measured Iτ1/2 has nothing to do with I and closely matches the horizontal straight line within the required accuracy. Therefore, it can be determined that the reduction in this step is a diffusion control process in solution [17].
3.1.5. Potentiostatic Deposition
Figure 6a shows the XRD of the product of electrodeposited at different potentials for 30 min. When the potential was −0.5 V, there was a diffraction peak of iron; when the potential reached−0.7 V, elemental lead appeared on the surface of the cathode; when the potential reached−0.9 V, cadmium appeared; when the potential reached−1.2 V, there was elemental zinc. The above phenomenon shows that higher overpotential conditions can promote the progress of the reaction, and the reduction process of each metal ion in the leaching solution of zinc hypoxide conforms to the results of thermodynamic and electrochemical analysis. When the potential is positive, the complex ion of lead in the zinc suboxide was reduced first. When the overpotential increases and reaches the reduction potential of cadmium, the reduction behaviors of both exist simultaneously. Since the reduction potential of zinc ions is the most negative, to ensure that the zinc ions are not reduced, the products of different deposition times were analyzed under the condition of −0.9 V, and the results are shown in Figure 6b. The Figure shows that there is a small amount of lead on the cathode after 5 min. At 30 min, cadmium and lead were detected on the surface of the cathode. After 120 min, the diffraction peak of cadmium is obviously enhanced, which indicates that lead and cadmium were deposited on the cathode plate in stages. However, the copper content in the solution was low, and the deposited copper was not enough to form elemental copper with a certain crystal structure, so there was no elemental copper in XRD.
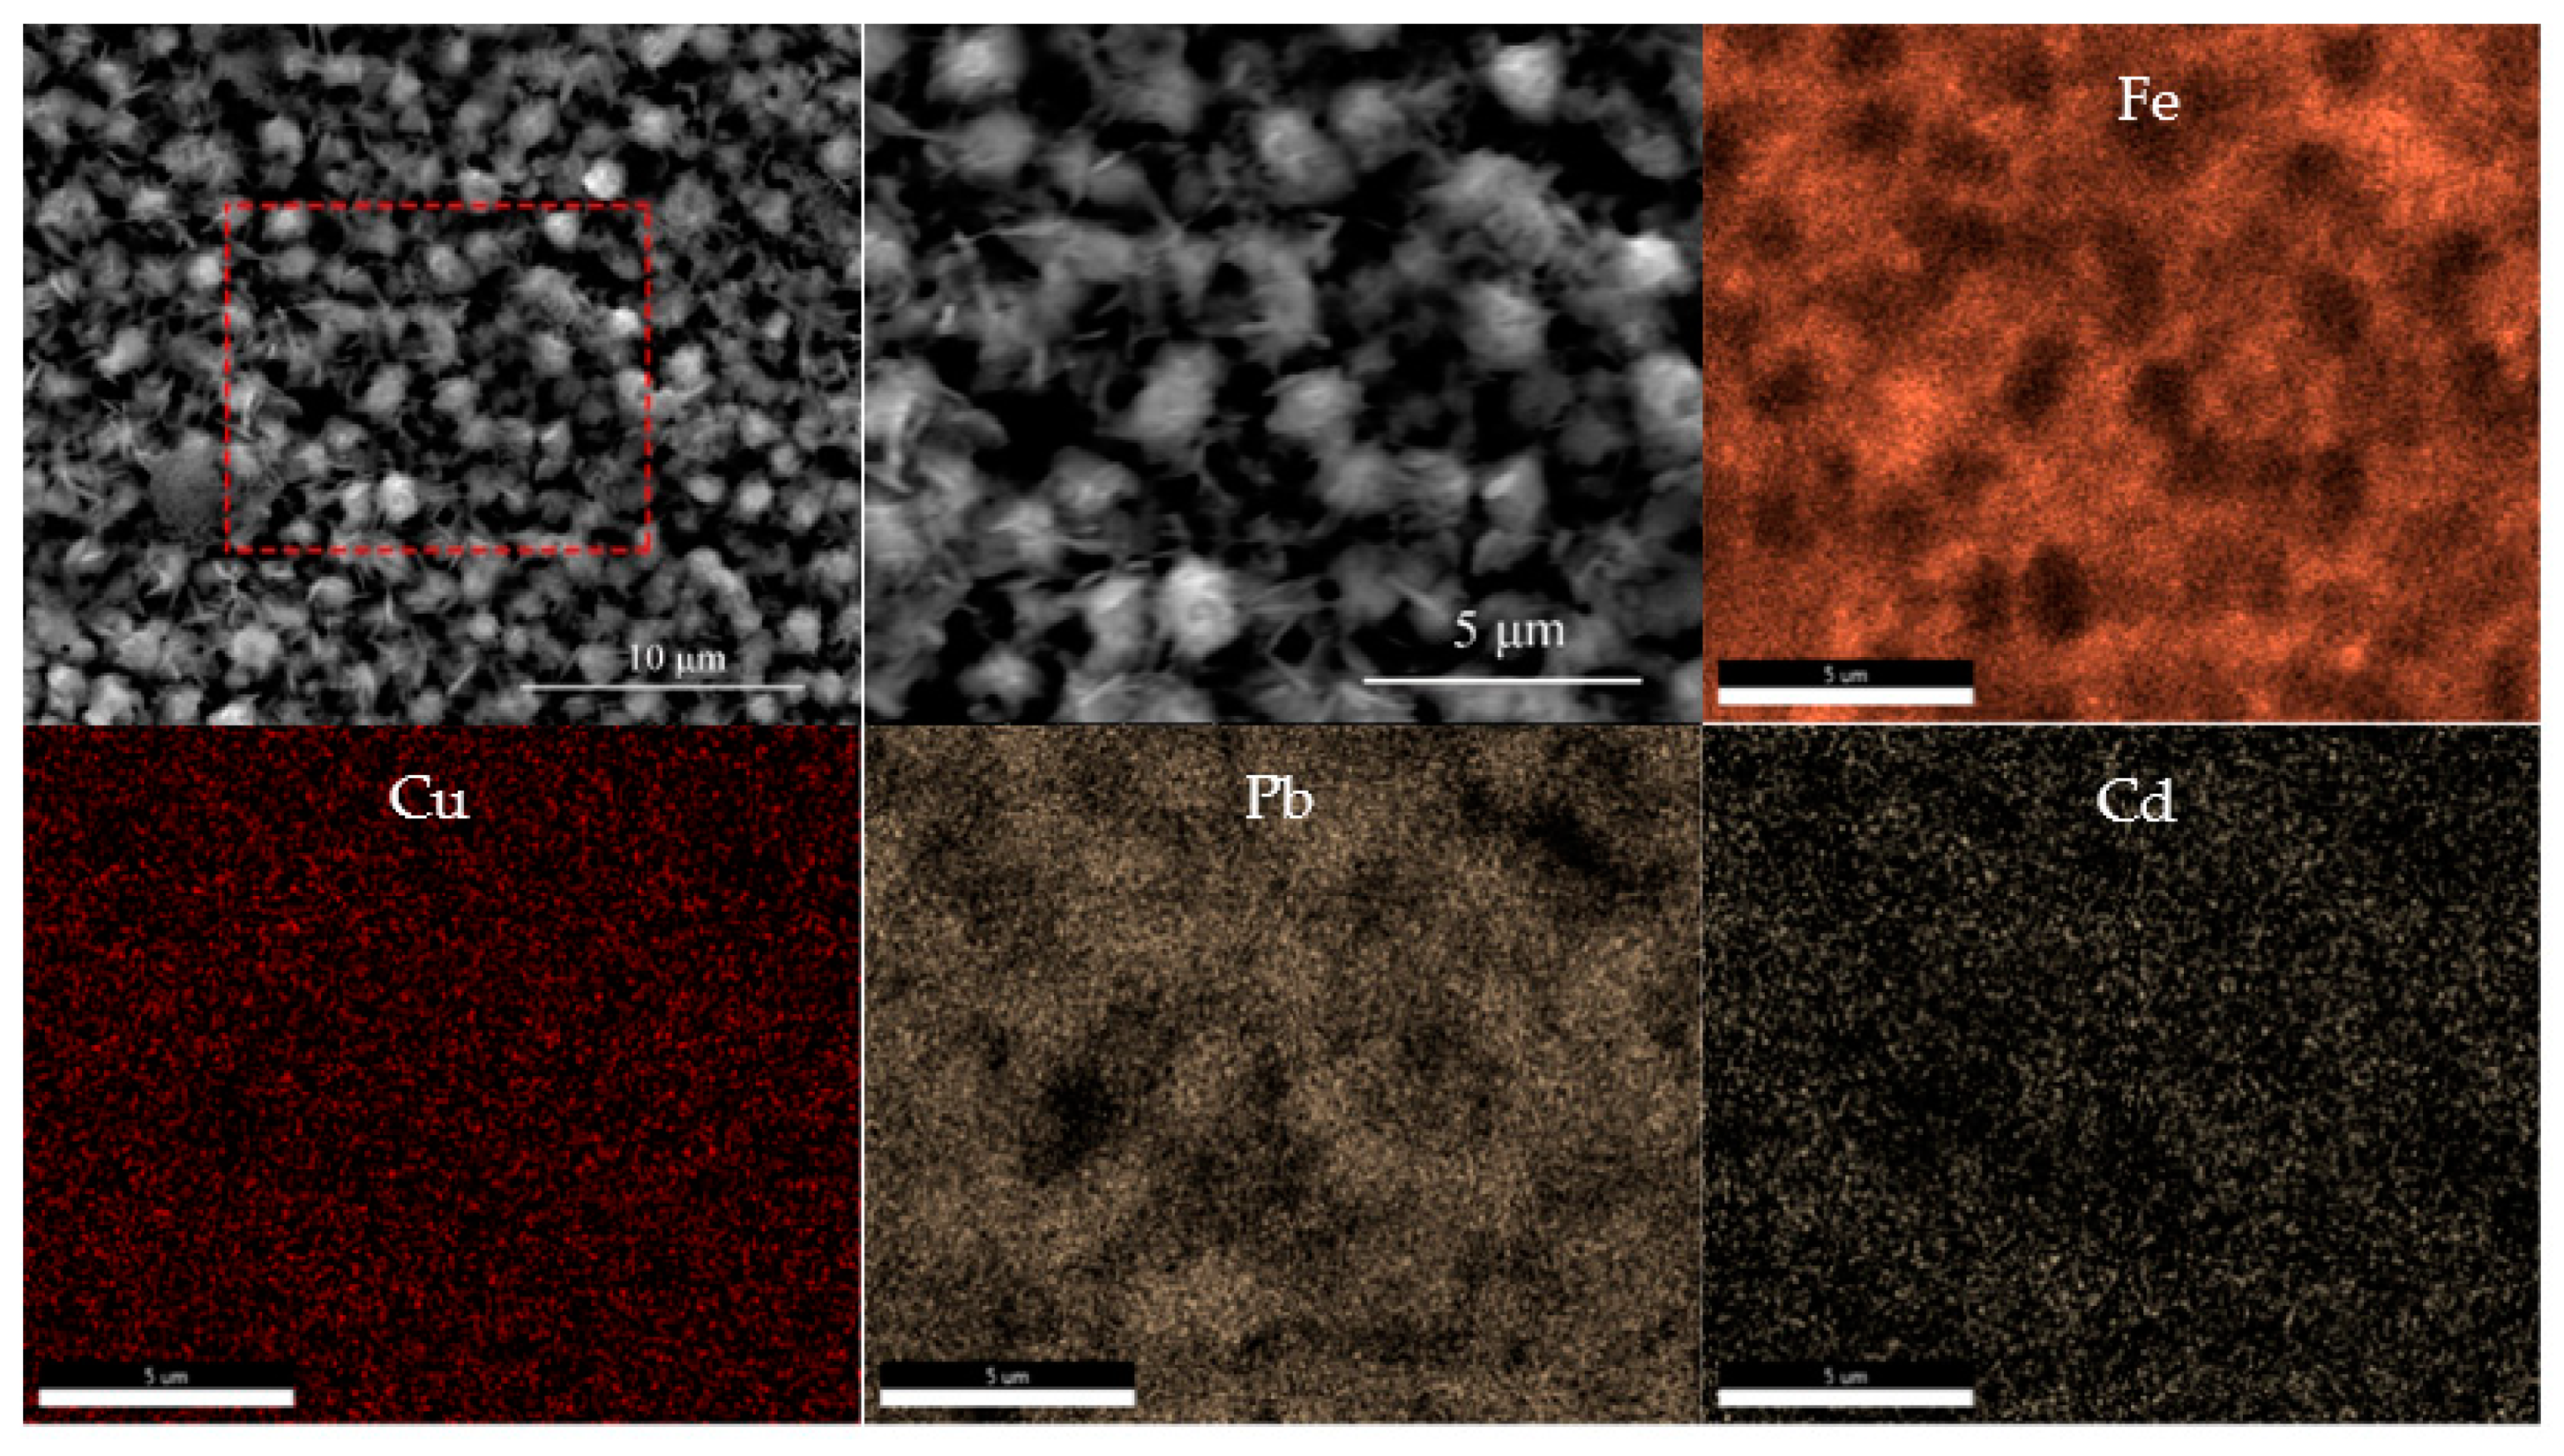
The SEM image in Figure 7 shows the cathode surface deposited at −0.9 V for 120 min. The surface layer of the iron cathode contains copper, lead, and cadmium. Particles with a surface size of about 1 μm were observed. These particles were mainly composed of cadmium and lead, while the distribution of copper on the surface of the iron cathode was relatively uniform. This indicates that in the process of stepwise removal of impurities, copper was first deposited on the surface of the cathode. Then, due to the large ion concentrations of lead and cadmium in the solution, lead and cadmium successively deposit on the surface of the cathode and gradually nucleate and grow.
The ion concentration in the solution obtained by the constant potential electrodeposition experiment under different deposition conditions was detected by ICP, and the results are shown in Table 4. Most of the impurity elements lead, cadmium, and copper in the leaching solution of zinc hypoxide were removed after 5 min constant potential electrodeposition experiment. With the increase of electrodeposition time, the content of the three elements in the solution gradually decreased. After 120 min, compared with the solution before impurity removal, the removal rate of lead reached 99.56%, the removal rate of cadmium reached 94.95%, and the removal rate of copper reached 99.61%.
3.2. Preparation of Zinc Oxide
3.2.1. Drying of the Purification Fluid
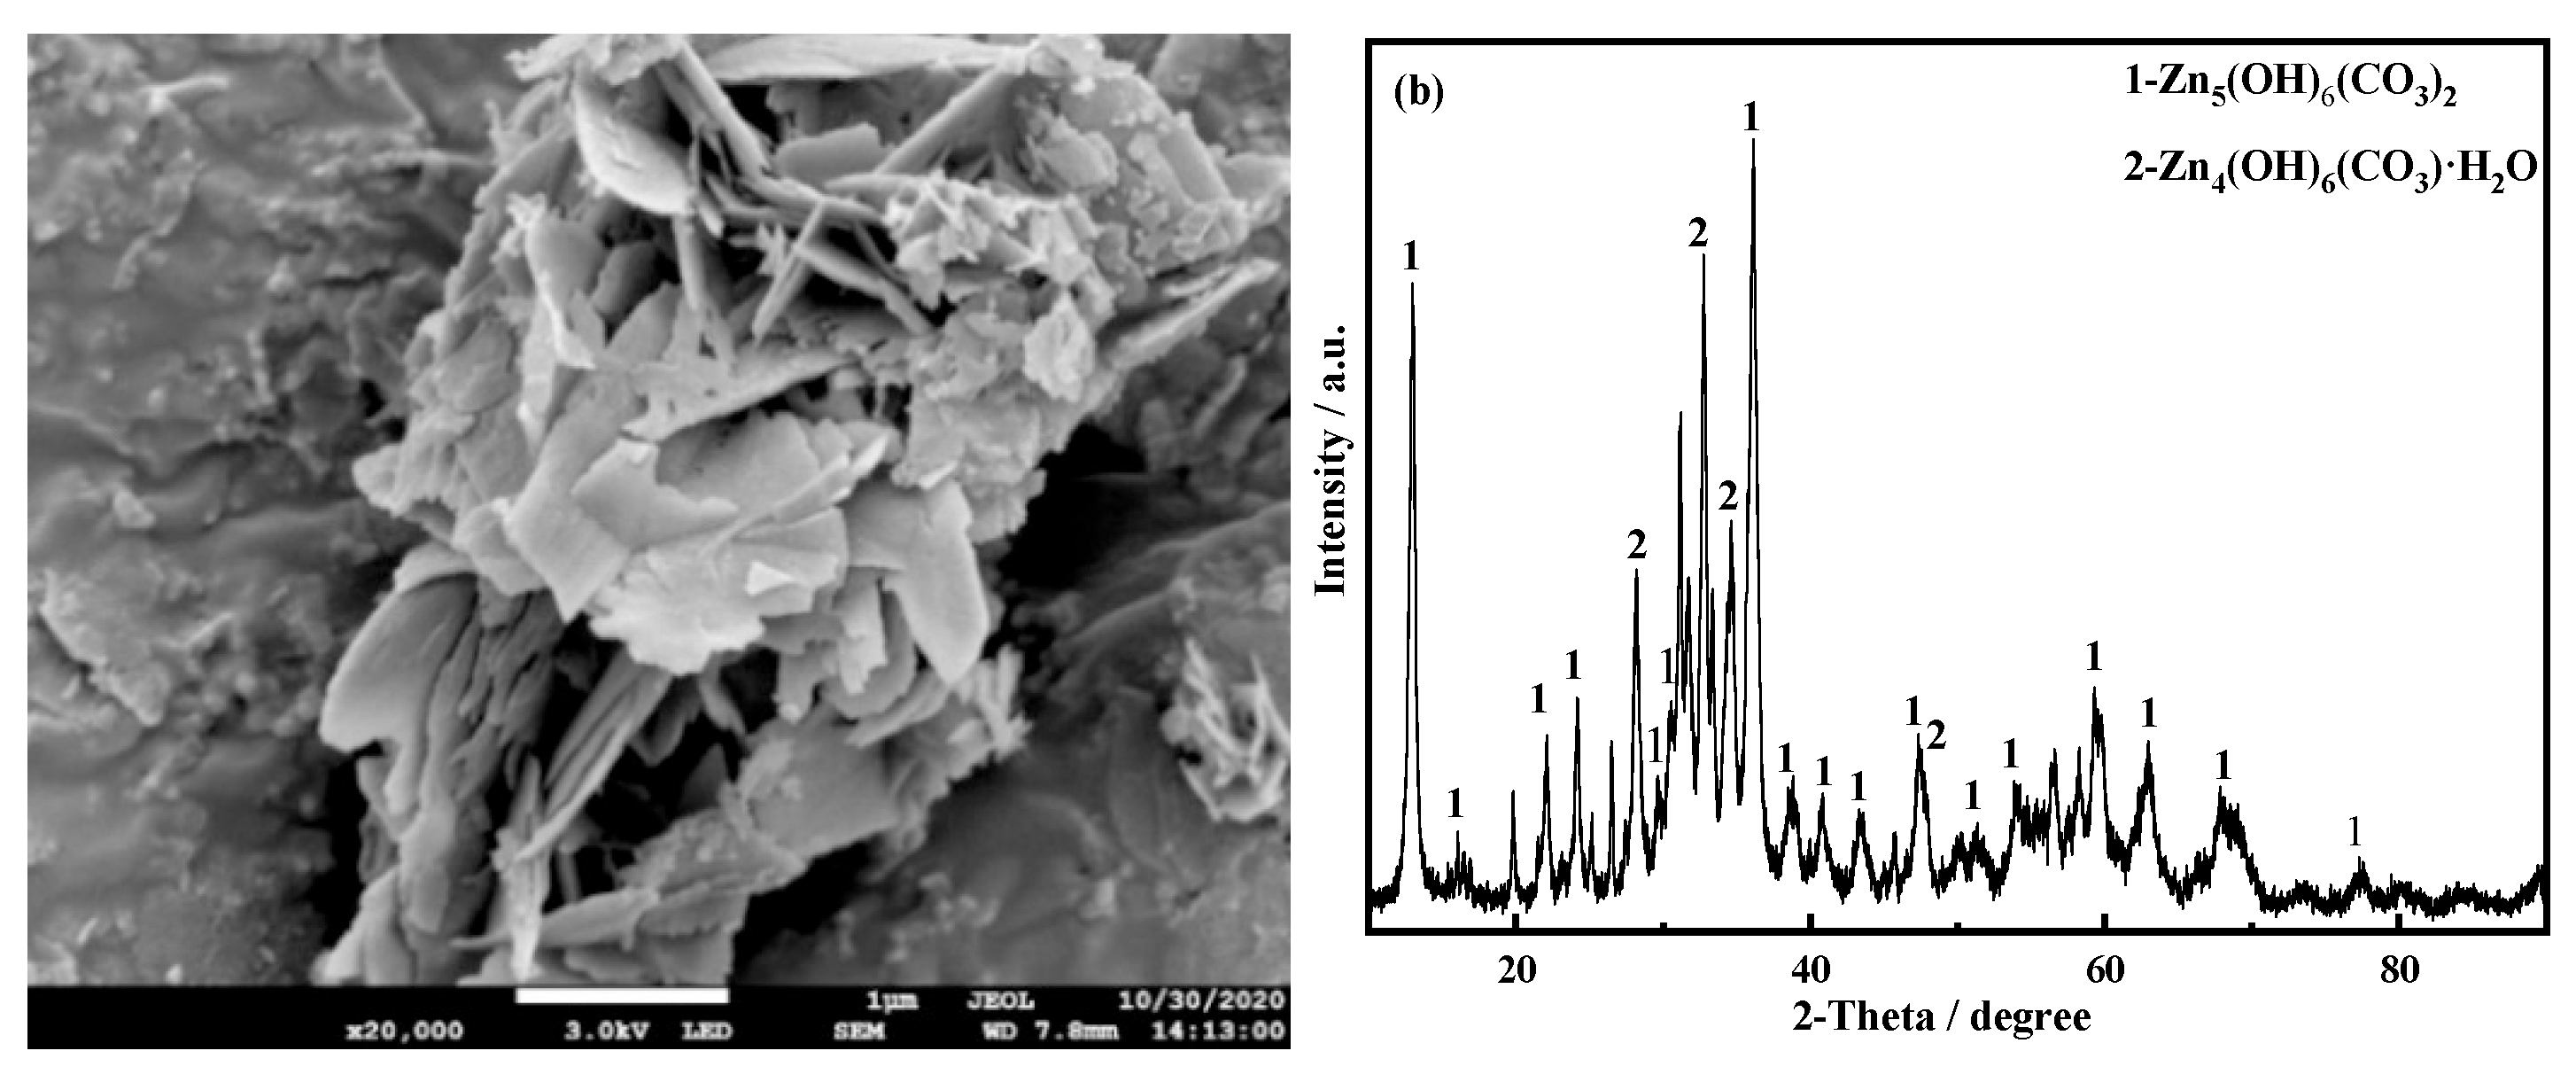
Take 40 mL of the de-impurity solution in a container and heat it at 90 °C for 25 min. As the amount of free ammonia combined with zinc is reduced during the heating process, zinc generates basic zinc carbonate precipitation in an alkaline environment. After filtration, it is dried in a vacuum drying oven at 100 °C to obtain basic zinc carbonate powder. The result is shown in Figure 8. The XRD pattern of basic zinc carbonate is shown in Figure 8a, and its morphology is a flaky structure. Figure 8b is the XRD pattern of basic zinc carbonate.
The chemical reaction in the process of ammonia distillation is:
3.2.2. Calcination of Basic Zinc Carbonate
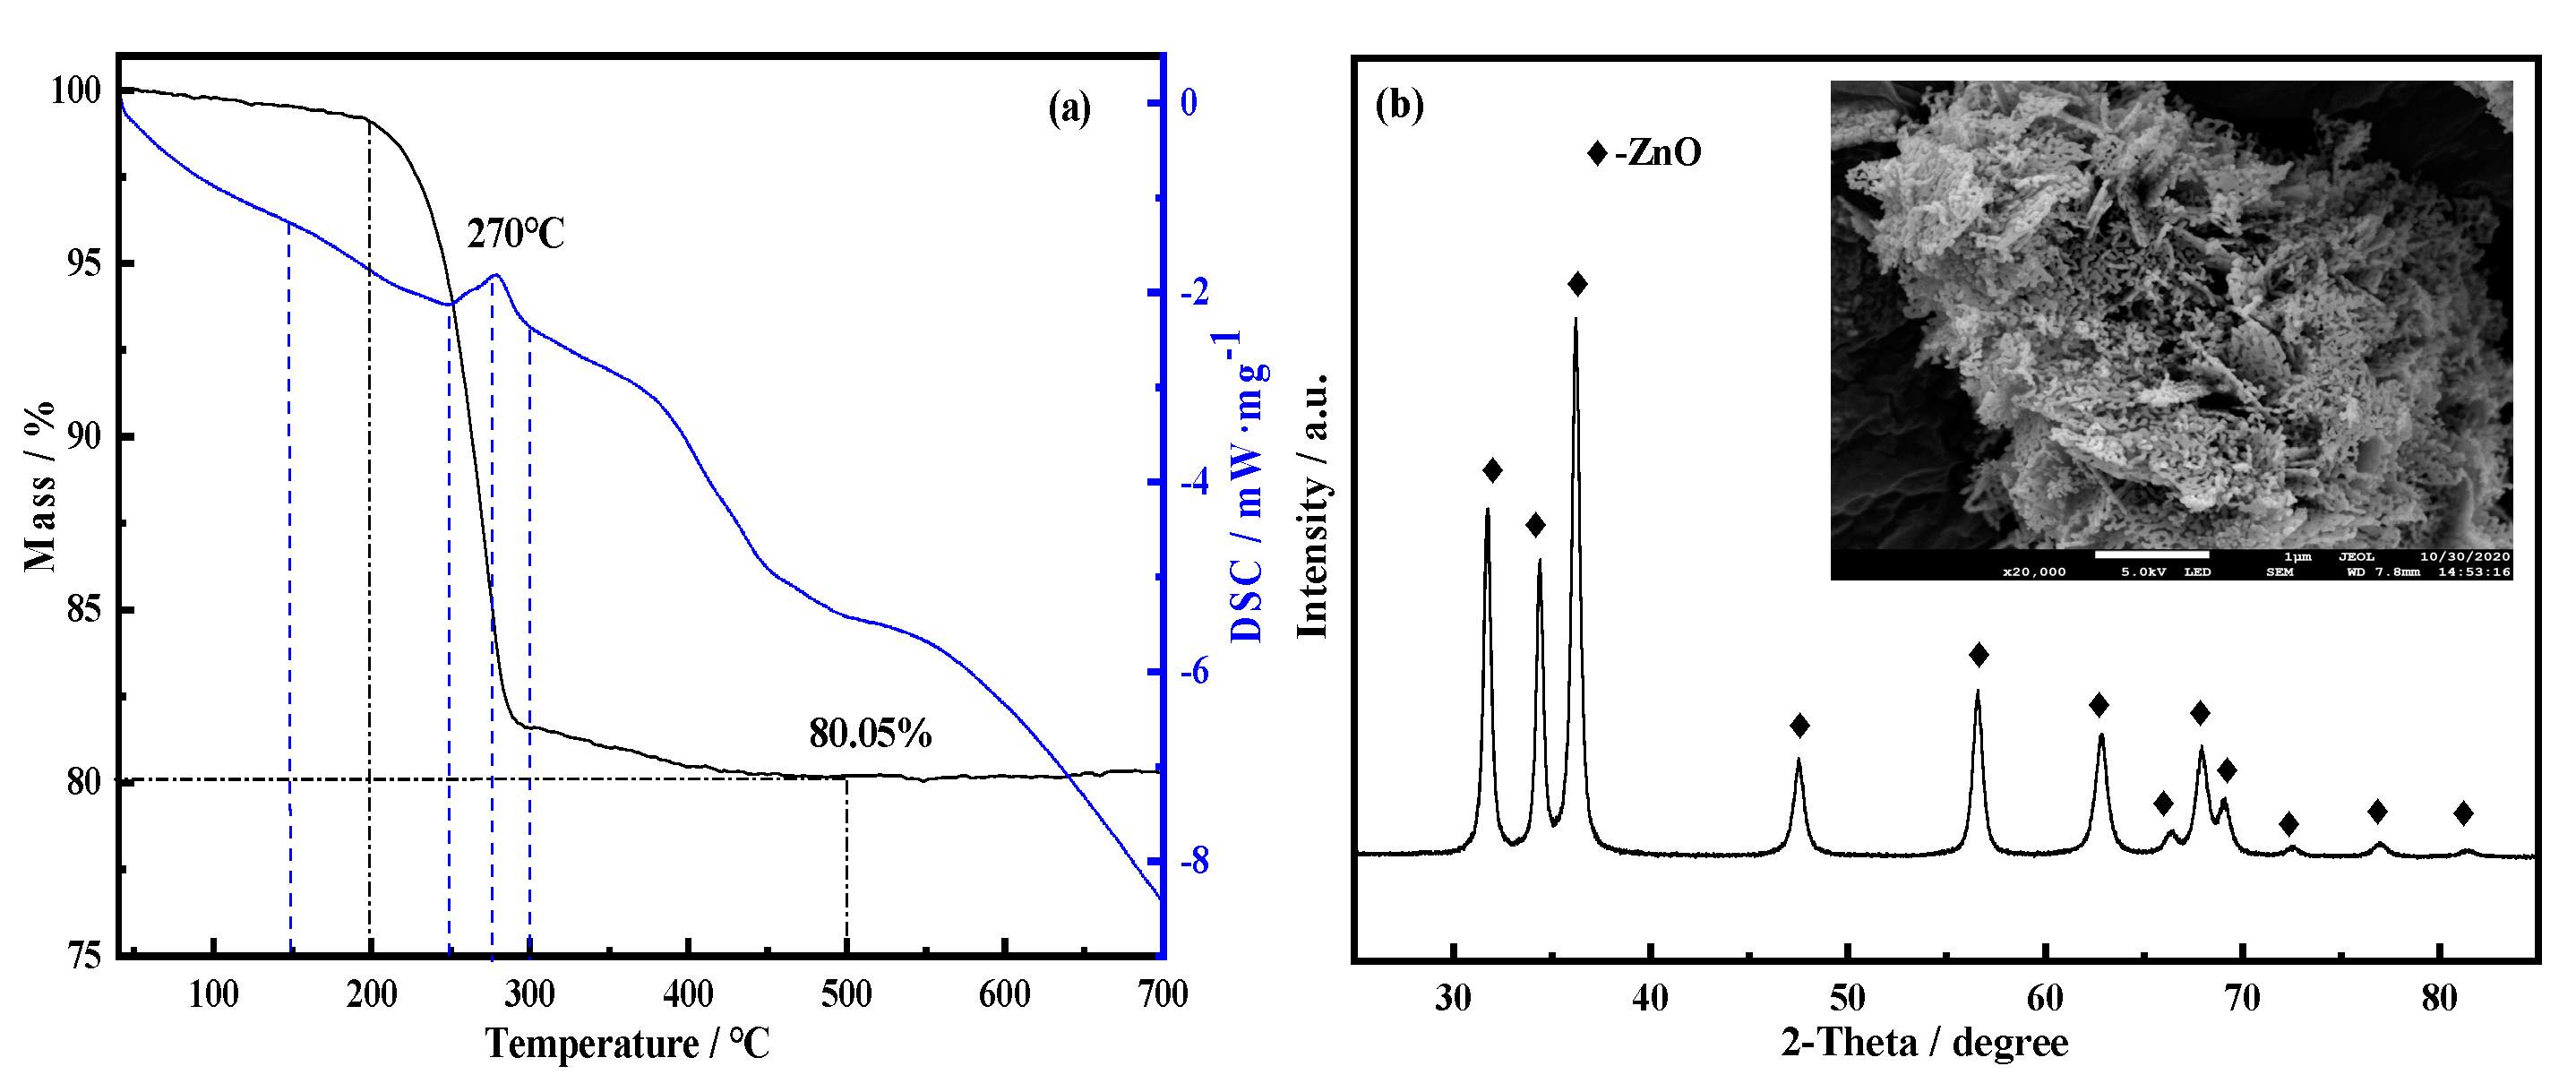
A thermogravimetric analyzer was used to study the mass loss and heat loss that occurred during this process, and the results are shown in Figure 9. The decomposition of basic zinc carbonate at high temperature is an endothermic reaction. When the temperature is about 150 °C, there is a small endothermic interval, which represents the removal process of crystal water, which reduces the mass; when the temperature reaches In the range of 250–300 °C, there is a second endothermic zone, which corresponds to the process of thermal decomposition of basic zinc carbonate into zinc oxide. At this time, as the temperature rises, the quality drops sharply, and the mass loss is about 19.95%, which is basically the same as the theoretical mass loss rate of zinc oxide produced by the decomposition of basic zinc carbonate.
When the temperature rises to 500 °C, there is no significant change; at this time, basic zinc carbonate has been basically converted into zinc oxide. The basic zinc carbonate was calcined at a temperature of 500 °C in an argon atmosphere for a reaction time of 60 min. The morphology and XRD analysis results of the product obtained are shown in Figure 9b. The combined analysis shows that the product is ZnO with a sheet-like porous structure.
The chemical reaction equation for the decomposition of basic zinc carbonate to zinc oxide is:
3.3. Separation of PbCO3 in Ammonia Leaching Residue of Zinc Hypoxide and Enrichment of Zinc Ferrite
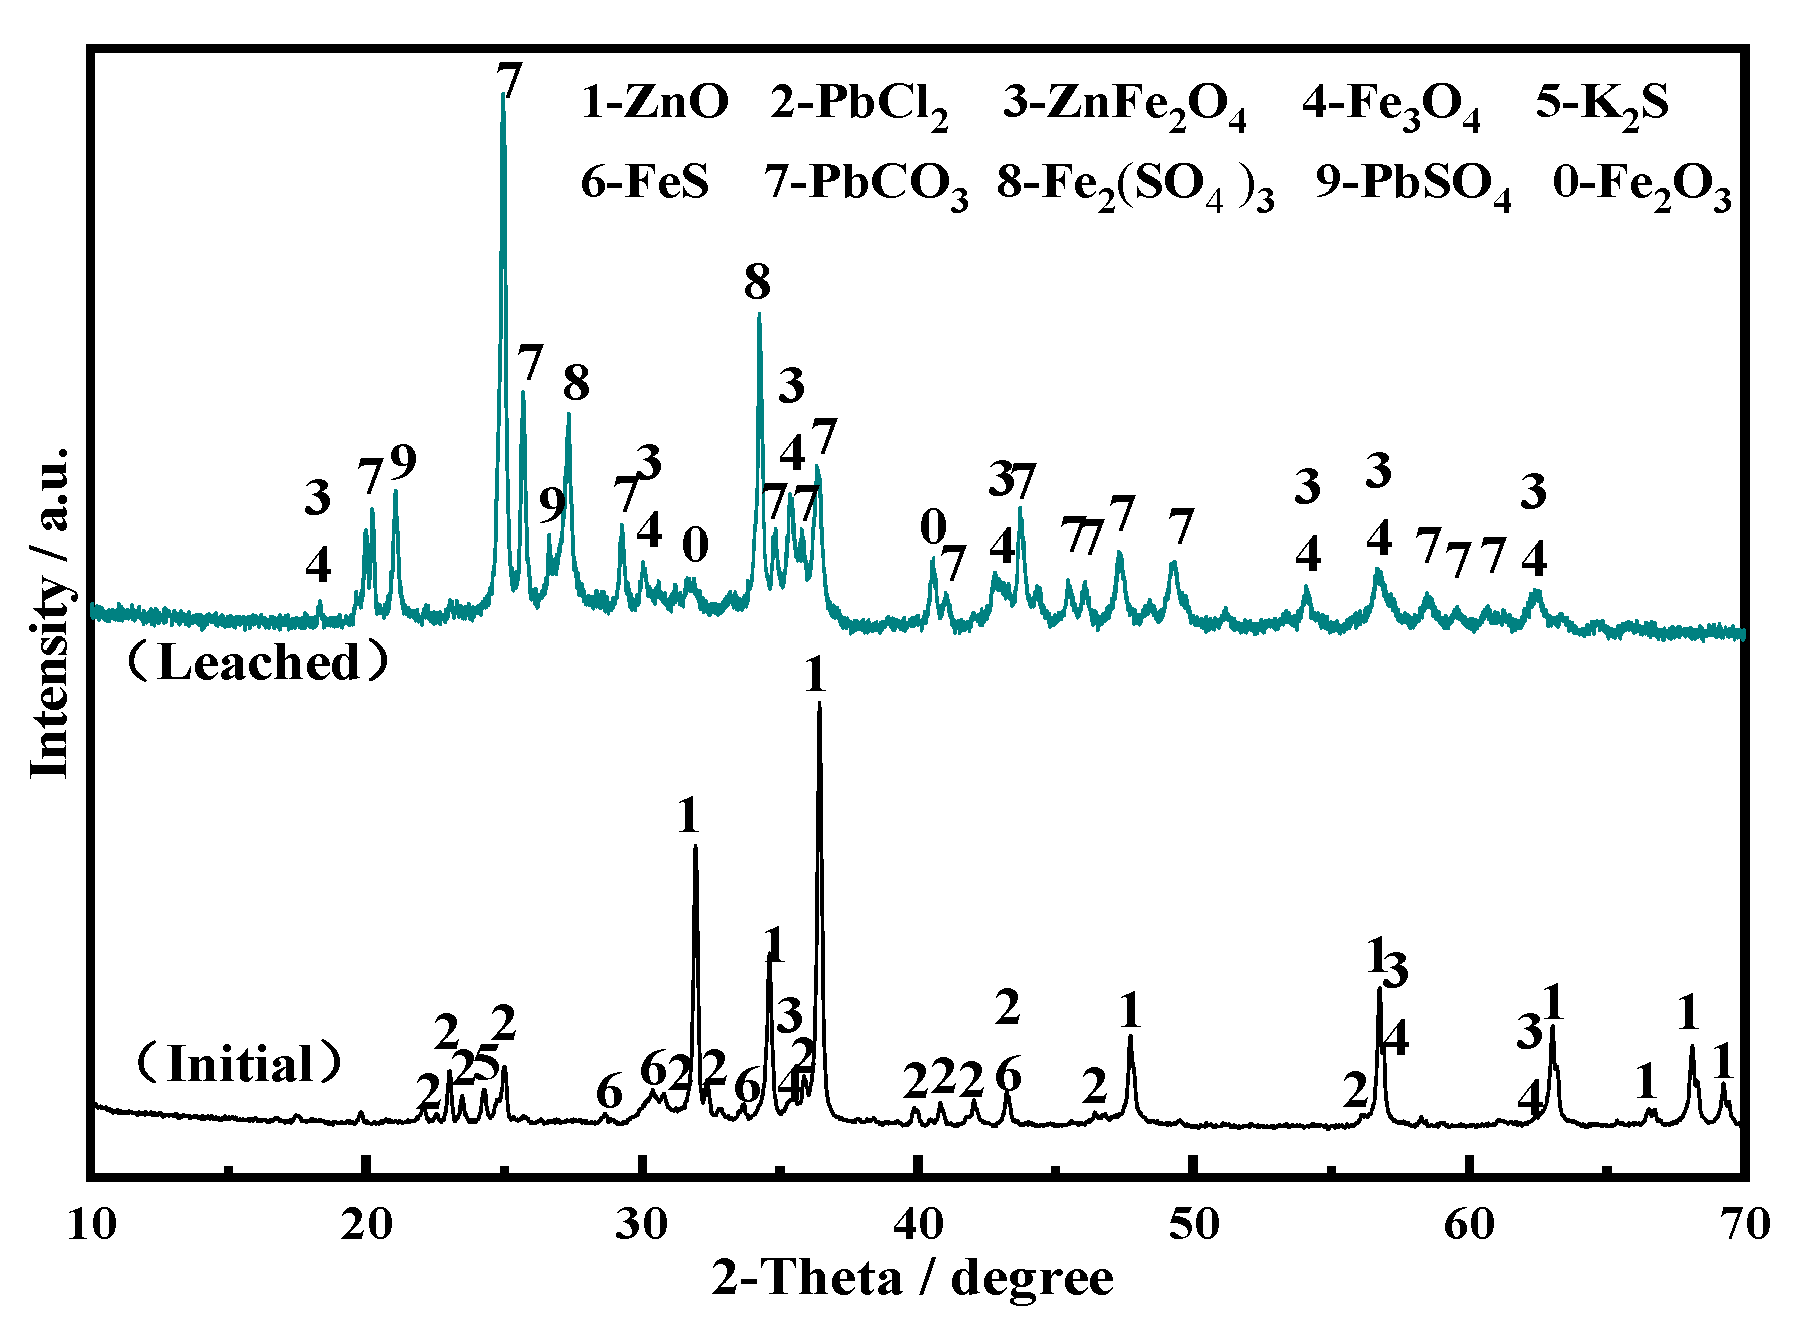
Figure 10 and Table 5, respectively, show the XRD patterns and element content of the leaching residue. The main elements of the leaching residue are lead, iron, and zinc. However, part of the zinc still exists in the ammonia leaching slag in the form of zinc ferrite, and the main impurity phase is PbCO3.
At the same time, combined with chemical composition analysis, the content of ZnFe2O4 was 42.45% and the content of PbCO3 was 51.23%, so it is very important to achieve the removal of PbCO3.
3.3.1. Separation of PbCO3 from Slag
Using acetic acid to remove PbCO3, the reaction method is a complex reaction, which mainly leaches the lead in the lead carbonate into the solution in the form of a complex. The reaction equation is:
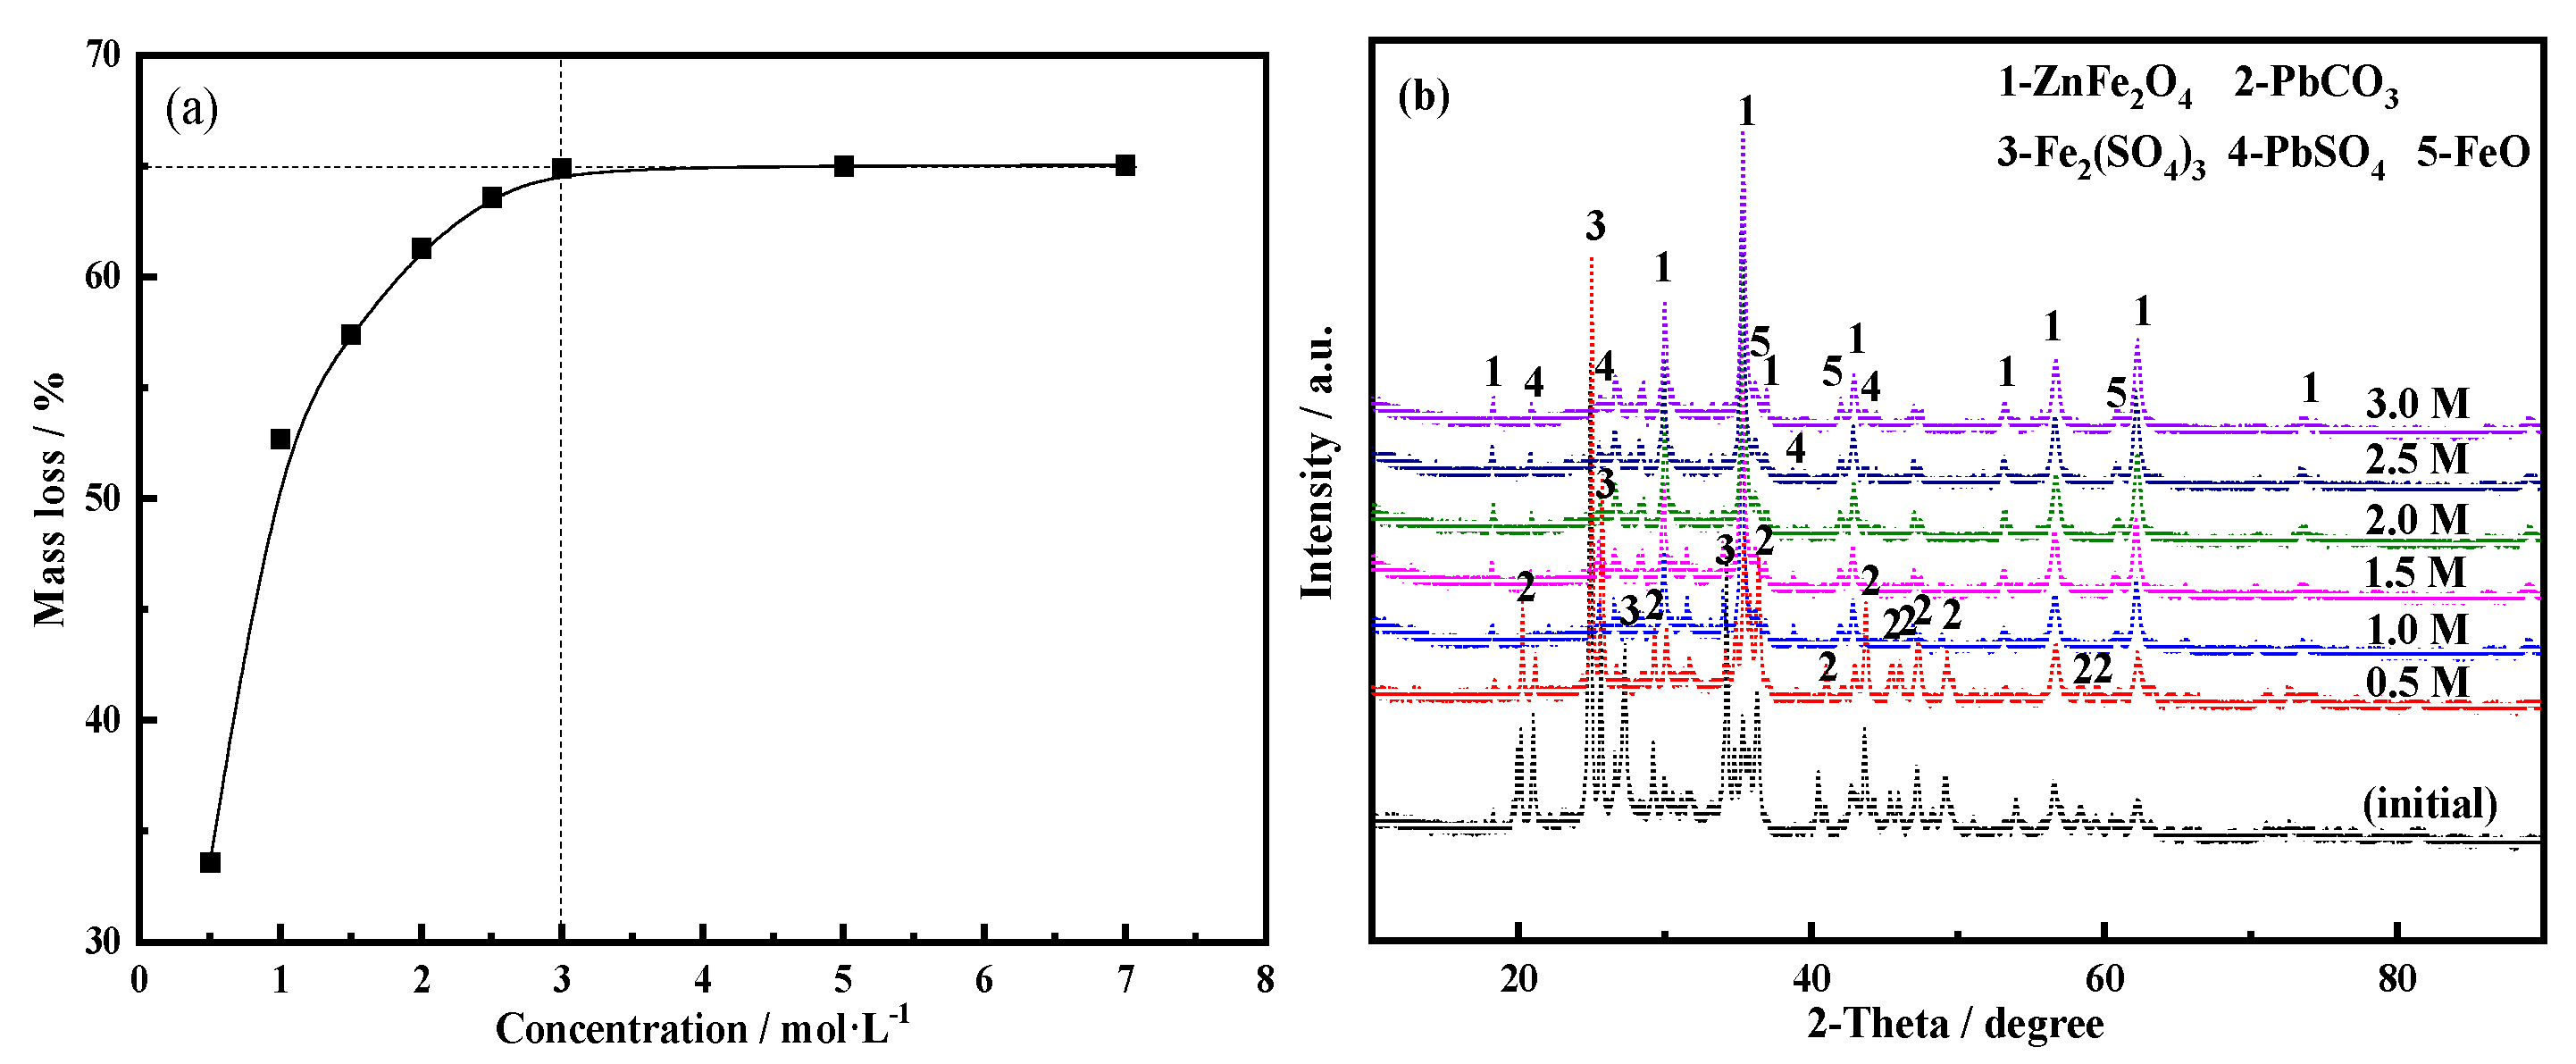
The ammonia leaching residue of zinc hypoxide was leached with different concentrations of acetic acid solution. Figure 11a shows that when the acetic acid concentration is less than 3 mol·L−1, the mass loss rate of the slag gradually increases with the increase of the acetic acid concentration; when the acetic acid concentration is greater than 3 mol·L−1, the mass loss of the slag The rate no longer changes significantly. This phenomenon indicates that PbCO3 has basically been leached out and entered the solution. At this time, the mass loss of the slag reaches 65.05%. Figure 11b shows the XRD of leaching residues with different acetic acid concentrations. As the acetic acid concentration increases, the PbCO3 diffraction peak disappears, and most of the PbCO3 has been leached when the acetic acid concentration is 1 mol·L−1. According to the above analysis, 3 mol·L−1 acetic acid is selected in the process of removing PbCO3.
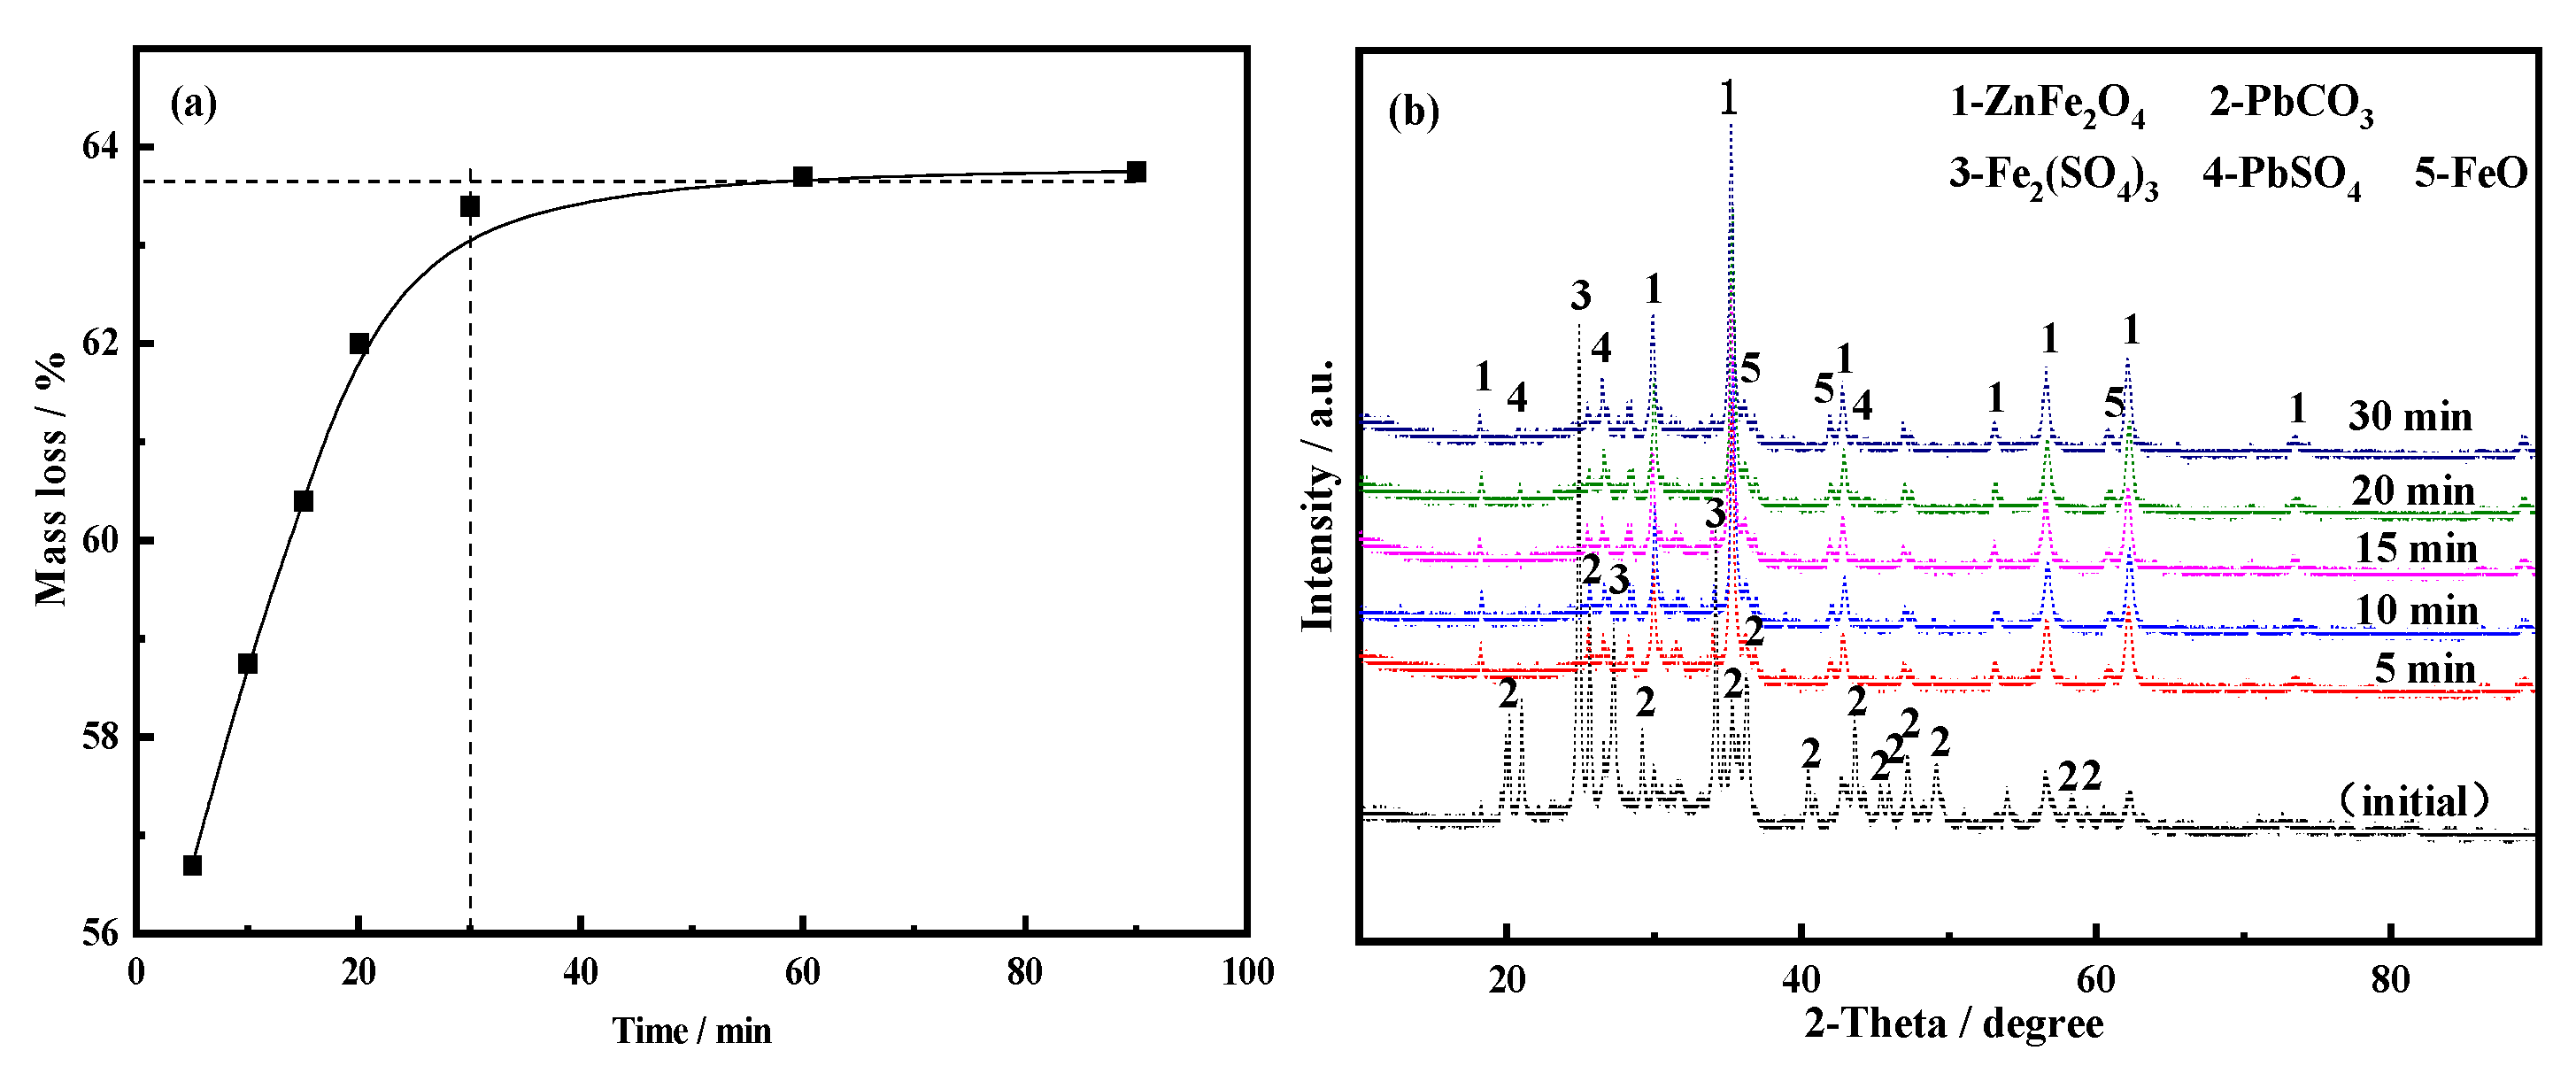
In order to study the influence of acetic acid leaching time on the leaching of PbCO3 and keeping other experimental conditions unchanged, 3 mol·L−1 acetic acid was selected to study different leaching times (5 min, 10 min, 15 min, 20 min, 30 min, 60 min, and 90 min) the impact on the product. Figure 12a shows that the mass loss rate of the slag increased significantly with the extension of the leaching time. When the leaching time was greater than 30 min, the mass loss rate of the slag tended to balance. According to the XRD results of the leaching residue obtained at each leaching time in Figure 12b, it can be seen that PbCO3 is almost completely dissolved after 5 min. According to the above analysis, the leaching time of 30 min was selected for the process of removing PbCO3.
The chemical composition of the leaching residue is shown in Table 6. The main elements in the slag are iron and zinc, and the lead removal rate reaches 94.08%. With reference to Figure 12b, the zinc in the leaching residue was in the form of ZnFe2O4. Combined with the results of the chemical composition analysis, the content of ZnFe2O4 was determined to be 63.96%. It can be further judged that the Fe content in ZnFe2O4 was 81.28%.
3.3.2. Enrichment of ZnFe2O4
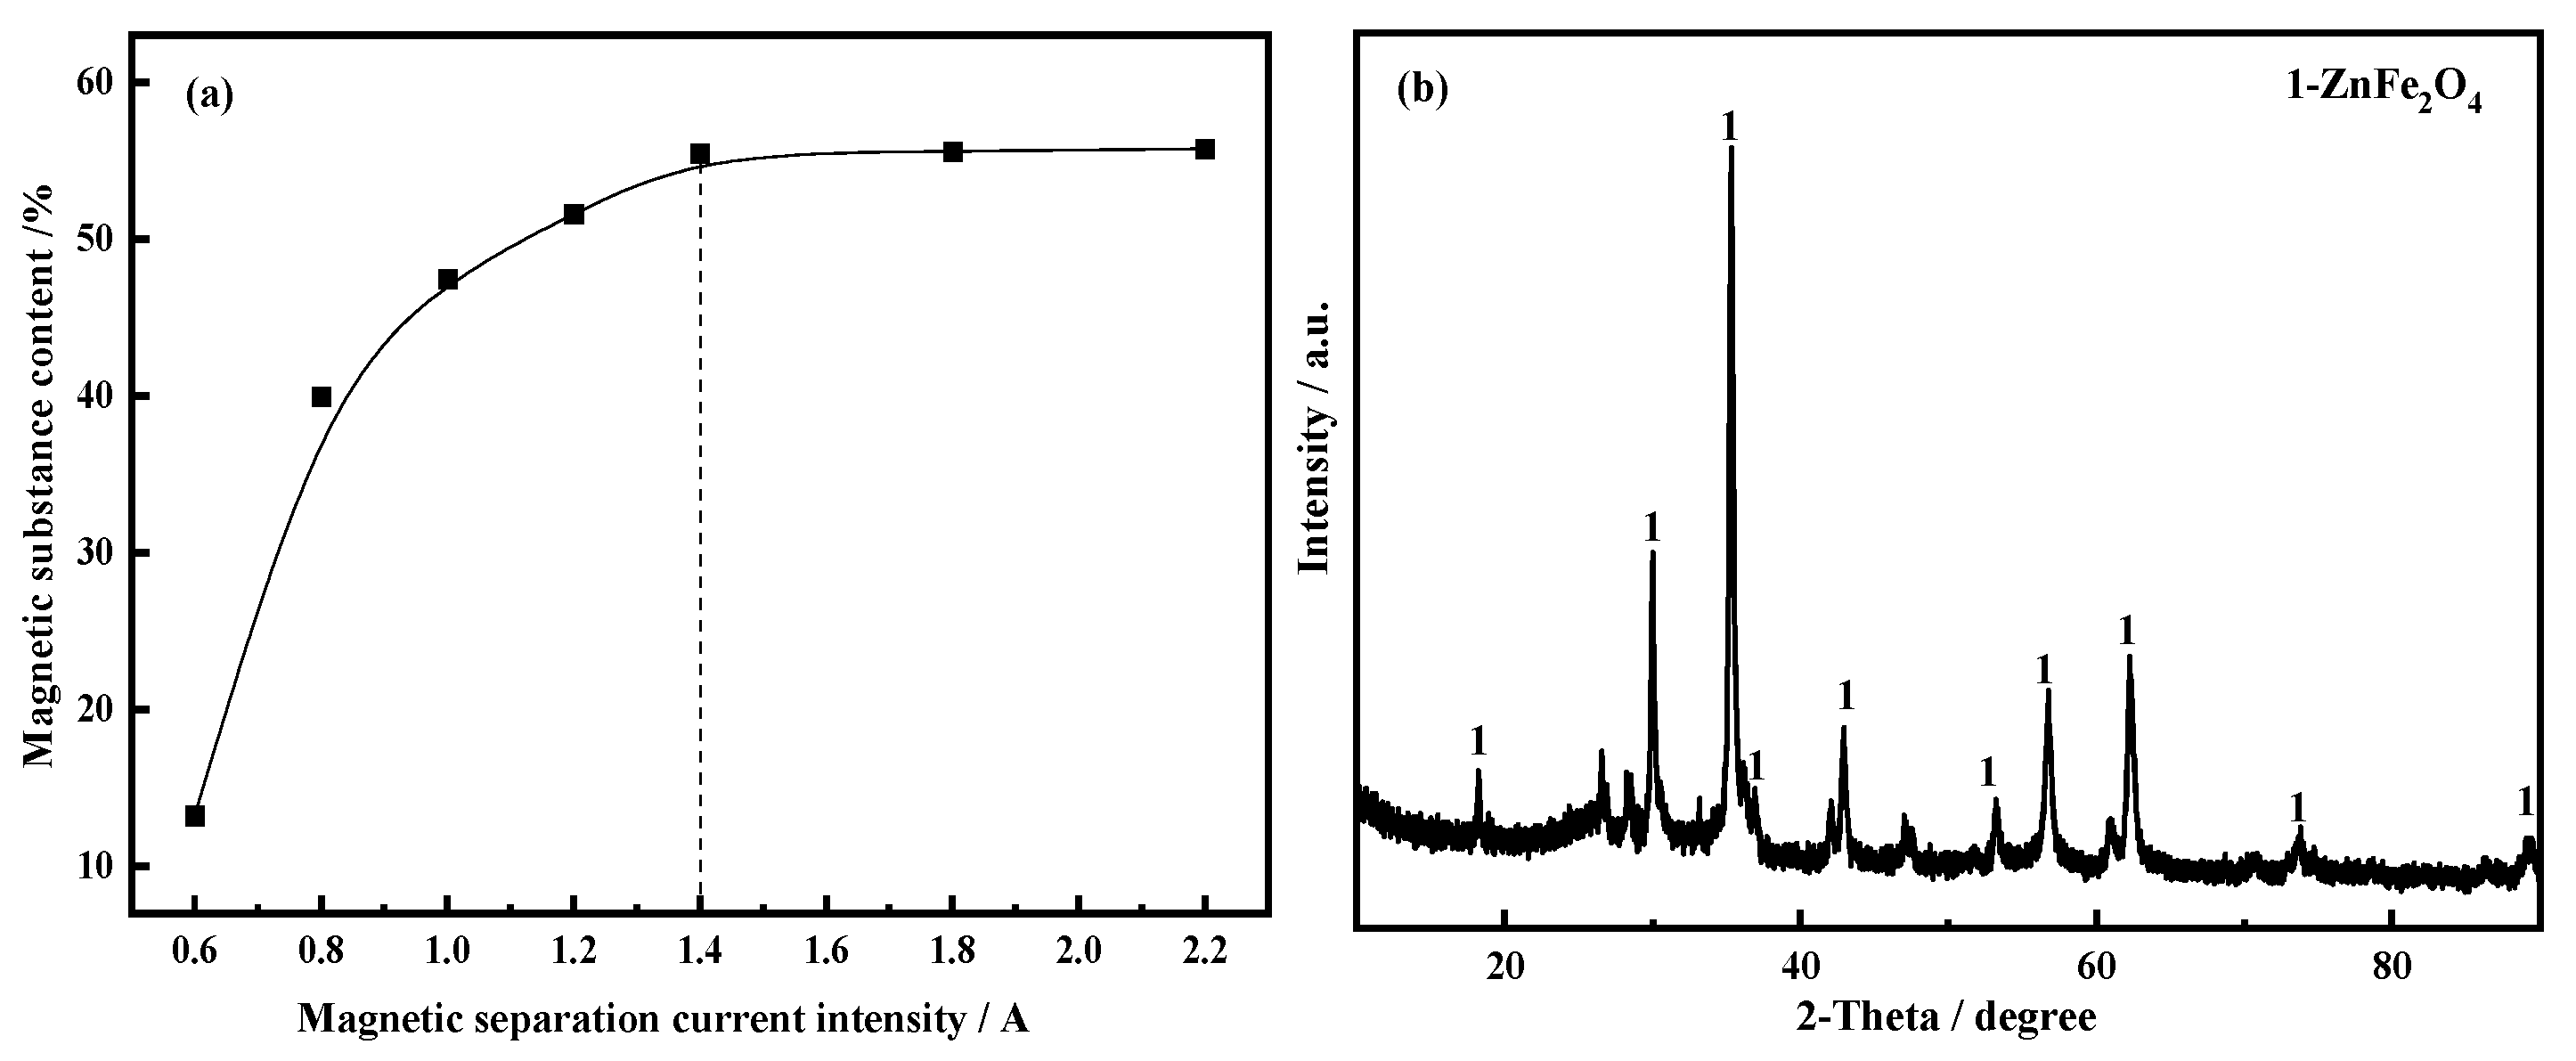
Zinc ferrite has weak magnetic properties, so the zinc ferrite in the acetic acid leaching residue is separated from impurities by magnetic separation to achieve the enrichment of zinc ferrite. The acetic acid leaching residue is magnetically separated in the current intensity range of 0.6 to 2.2 A. Figure 13a shows that as the current intensity increased, the magnetic substance content gradually increased. When the current intensity reached1.4 A, the magnetic substance content tended to balance. The XRD analysis of the magnetic substance obtained under the condition of current intensity of 1.4 A is shown in Figure 13b. It can be seen that the magnetic separation material was mainly ZnFe2O4. The chemical composition analysis results of the magnetic substance are shown in Table 7. The calculated content of ZnFe2O4 in the magnetic substance was 83.83%, which effectively realizes the enrichment of zinc ferrite.
4. Conclusions
The ammonia leaching solution obtained after ammonia leaching can be purified to remove impurities, evaporating ammonia, and calcined to prepare zinc oxide. The ammonia leaching residue is leached with acetic acid and magnetic separation and enrichment to obtain zinc ferrite. XRD and SEM are used to test the experiment. The results are analyzed and the conclusions are as follows:
- (1)
- Through the electrochemical test of the ammonia leaching solution, the results show that the reduction process of zinc, cadmium, lead, and copper in the solution is carried out in stages, and the reduction potentials of the four are respectively −1.3 V, −0.94 V, −0.82 V, and−0.76 V. The results of potentiostatic electrodeposition removal confirmed the graded reduction process of impurity elements. Compared with the replacement removal method, the removal rate of lead and copper reached more than 99%, and the removal rate of cadmium under the two methods was 94.95% and 98.73%, respectively.
- (2)
- The ammonia leaching solution after purification and impurity removal can be evaporated for 25 min under the temperature condition of 90 °C to obtain the basic zinc carbonate precursor with a higher yield. The basic zinc carbonate body is calcined at 500 °C for 120 min to obtain the hexagonal crystal. The purity of ZnO with a series structure is 96.31%.
- (3)
- Using acetic acid with a concentration of 3 mol·L−1, after 30 min of pickling, the PbCO3 impurity phase in the slag can be effectively removed, and the non-magnetic impurities, ferric acid, are further removed under the magnetic separation conditions of 1.4 A. The zinc content is 83.83%.
Author Contributions
Conceptualization, H.L. and Y.F.; methodology, J.L. and H.L.; software, L.Z. and J.L.; validation, L.Z. and L.W.; formal analysis, H.L. and L.Z.; investigation, L.Z. and J.L.; resources, Y.F. and J.L.; data curation, L.Z. and H.L.; writing—original draft preparation, Y.F. and L.Z.; writing—review and editing, H.L. and J.L.; visualization, L.W.; supervision, H.Y.; project administration, H.L; funding acquisition, H.L. All authors have read and agreed to the published version of the manuscript.
Funding
This study is financially supported by the National Natural Science Foundation of China (No. 51874141).
Conflicts of Interest
The authors declare no conflict of interest.
References
- Kukurugya, F.; Vindt, T.; Havlík, T. Behavior of zinc, iron and calcium from electric arc furnace (EAF) dust in hydrometallurgical processing in sulfuric acid solutions: Thermodynamic and kinetic aspects. Hydrometallurgy 2015, 154, 20–32. [Google Scholar] [CrossRef]
- Tang, J.F.; Steenari, B.-M. Solvent extraction separation of copper and zinc from mswi fly ash leachates. Waste Manag. 2015, 44, 147–154. [Google Scholar] [CrossRef] [PubMed]
- He, W.; Wang, H.; Wang, C.; Gao, H. Leaching of zinc from zinc oxide slag by sodium hydroxide. J. Environ. Chem. Eng. 2017, 11, 4337–4342. [Google Scholar]
- Peng, B.; Lin, D.H.; Liu, H.; Peng, N.; Chen, D.; Li, Y.C.; Yuan, Y.Z. Alkaline leaching zinc from high iron-bearing zinc calcine after reduction roasting. Chin. J. Nonferrous. Met. 2017, 27, 423–429. [Google Scholar]
- Gargul, K.; Boryczko, B. Removal of zinc from dusts and sludges from basic oxygen furnaces in the process of ammoniacal leaching. Arch. Civ. Mech. Eng. 2015, 15, 179–187. [Google Scholar] [CrossRef]
- Ma, A.Y.; Zhang, L.B.; Peng, J.H.; Zheng, X.M.; Li, S.W.; Yang, K.; Chen, W.H. Extraction of zinc from blast furnace dust in ammonia leaching system. Green Process. Synth. 2016, 5, 23–30. [Google Scholar] [CrossRef]
- Zhang, D.C.; Zhang, X.W.; Yang, T.Z.; Rao, S.; Hu, W.; Liu, W.F.; Chen, L. Selective leaching of zinc from blast furnace dust with mono-ligand and mixed-ligand complex leaching systems. Hydrometallurgy 2017, 169, 219–228. [Google Scholar] [CrossRef]
- Chairaksa-Fujimoto, R.; Maruyama, K.; Miki, T.; Nagasaka, T. The selective alkaline leaching of zinc oxide from electric arc furnace dust pre-treated with calcium oxide. Hydrometallurgy 2016, 159, 120–125. [Google Scholar] [CrossRef]
- Wang, H.G.; Li, Y.; Gao, J.M.; Zhang, M.; Guo, M. A novel hydrothermal method for zinc extraction and separation from zinc ferrite and electric arc furnace dust. Int. J. Min. Met. Mater. 2016, 23, 146–155. [Google Scholar] [CrossRef]
- Mady, A.H.; Baynosa, M.L.; Tuma, D.; Shim, J.-J. Facile microwave-assisted green synthesis of Ag-ZnFe2O4 @rGo nanocomposites for efficient removal of organic dyes under uv-and visible-light irradiation. Appl. Catal. B-Environ. 2017, 203, 416–427. [Google Scholar] [CrossRef]
- Wang, J.N.; Yang, G.R.; Wang, L.; Yan, W. Fabrication of the ZnFe2O4 fiber-in-tube and tubular mesoporous nanostructures via single-spinneret electrospinning: Characterization, mechanism and performance as anodes for li-ion batteries. Electrochim. Acta 2016, 222, 1176–1185. [Google Scholar] [CrossRef]
- Yang, J.L.; Xu, M.; Liu, M.X.; Ma, S.J.; Liu, P. Research of preparation zinc ferrite from leaching zinc calcine. Multipurp. Util. Miner. Resour. 2017, 97–101. [Google Scholar]
- Li, F.L. Study on Wet Recovery of Zinc from Electric Furnace Dust. Master’s Thesis, Jiangsu University of Science and Technology, Zhenjiang, China, 2015. [Google Scholar]
- Gang, Y.; Ning, P.; Lan, Z.; Liang, Y.J.; Zhou, X.Y.; Bing, P.; Chai, L.Y.; Yang, Z.H. Selective reduction process of zinc ferrite and its application in treatment of zinc leaching residues. T. Nonferr. Metal. Soc. 2015, 25, 2744–2752. [Google Scholar]
- Chairaksa, F.R.; Inoue, Y.; Umeda, N.; Itoh, S.; Nagasaka, T. New pyrometallurgical process of eaf dust treatment with cao addition. Int. J. Min. Met. Mater. 2015, 22, 788–797. [Google Scholar] [CrossRef]
- Liu, B.C.; Dai, S.H.; Shen, F.M.; Yu, A.B. Metallurgical characteristic of carbon-proportioning pellets mixed with zn-bearing electric arc furnace dust. J. Northeast. Univ. 2004, 25, 431–434. [Google Scholar]
- Hu, H.B.; Gao, Y.M.; Lao, Y.G.; Qin, Q.W.; Li, G.Q.; Chen, G.Z. Yttria-stabilized zirconia aided electrochemical investigation on ferric ions in mixed molten calcium and sodium chlorides. Metall. Mater. Trans. B 2018, 49, 2794–2808. [Google Scholar] [CrossRef]
Figure 1.
XRD pattern of zinc hypoxide.

Figure 2.
Cyclic voltammetry graph (T = 30 °C; WE: Glassy Carbon Electrode; CE: Platinum; RE: Hg/HgO (0.098 V) scan rate: 0.1 V/s).
Figure 2.
Cyclic voltammetry graph (T = 30 °C; WE: Glassy Carbon Electrode; CE: Platinum; RE: Hg/HgO (0.098 V) scan rate: 0.1 V/s).

Figure 3.
Cyclic voltammetry curves at different scanning speeds (T = 30 °C; WE: glassy carbon electrode; CE: platinum; RE: Hg/HgO (0.098 V); scan rate: 0.02–0.3 V/s).
Figure 3.
Cyclic voltammetry curves at different scanning speeds (T = 30 °C; WE: glassy carbon electrode; CE: platinum; RE: Hg/HgO (0.098 V); scan rate: 0.02–0.3 V/s).

Figure 4.
(a) Square wave volt-ampere curves under different scanning frequencies; (b) I–f1/2 relationship diagram of peak B′; (c) peak shape fitting graph of 15 Hz peak B′ (T = 30 °C).
Figure 4.
(a) Square wave volt-ampere curves under different scanning frequencies; (b) I–f1/2 relationship diagram of peak B′; (c) peak shape fitting graph of 15 Hz peak B′ (T = 30 °C).

Figure 5.
(a) The chronopotential curve under different currents; (b) the correlation between the cathodic current I–Iτ1/2 (τ: transition time) value for the reduction plateau.
Figure 5.
(a) The chronopotential curve under different currents; (b) the correlation between the cathodic current I–Iτ1/2 (τ: transition time) value for the reduction plateau.

Figure 6.
(a) The XRD pattern of the cathode plate after 30 min of electrodeposition at different potentials. (b) The XRD pattern of deposition products at different deposition times at −0.9 V (T = 30 °C).
Figure 6.
(a) The XRD pattern of the cathode plate after 30 min of electrodeposition at different potentials. (b) The XRD pattern of deposition products at different deposition times at −0.9 V (T = 30 °C).

Figure 7.
SEM of the cathode surface deposited at −0.9 V for 120 min.

Figure 8.
SEM (a) and XRD (b) of the purified solution dried at 90 °C for 25 min.

Figure 9.
(a) Thermogravimetric-differential thermal curve of basic zinc carbonate (b) XRD and SEM of the product calcined at 500 °C for 60 min.
Figure 9.
(a) Thermogravimetric-differential thermal curve of basic zinc carbonate (b) XRD and SEM of the product calcined at 500 °C for 60 min.

Figure 10.
XRD pattern of leaching residue and zinc hypoxide.

Figure 11.
Mass loss and XRD pattern of pickling residue with different concentrations of acetic acid; (a)-mass loss; (b)-XRD pattern (25 °C, liquid–solid ratio: 10 mL·g−1, stirring speed: 400 r·min−1, dissolution time: 90 min).
Figure 11.
Mass loss and XRD pattern of pickling residue with different concentrations of acetic acid; (a)-mass loss; (b)-XRD pattern (25 °C, liquid–solid ratio: 10 mL·g−1, stirring speed: 400 r·min−1, dissolution time: 90 min).

Figure 12.
Mass loss and XRD pattern of acetic acid pickling residue at different times; (a) mass loss; (b) XRD pattern (25 °C, liquid–solid ratio: 10 mL·g−1, stirring speed: 400 r·min−1, concentration: 3 mol·L−1).
Figure 12.
Mass loss and XRD pattern of acetic acid pickling residue at different times; (a) mass loss; (b) XRD pattern (25 °C, liquid–solid ratio: 10 mL·g−1, stirring speed: 400 r·min−1, concentration: 3 mol·L−1).

Figure 13.
The percentage of magnetic substance and XRD pattern; (a) Proportion of substance; (b) XRD pattern.
Figure 13.
The percentage of magnetic substance and XRD pattern; (a) Proportion of substance; (b) XRD pattern.


Table 1.
Sample element composition analysis.
| Elements | Content/wt.% | Elements | Content/wt.% |
|---|---|---|---|
| Zn | 54.9 | Mg | 0.132 |
| O | 19.9 | I | 0.125 |
| Pb | 9.83 | F | 0.098 |
| Cl | 5.54 | Mn | 0.0959 |
| Fe | 3.23 | Sn | 0.0822 |
| K | 2.07 | Ru | 0.0755 |
| S | 1.83 | Bi | 0.0694 |
| Ca | 0.632 | Rb | 0.0425 |
| Cd | 0.496 | Cu | 0.0369 |
| Si | 0.369 | Ta | 0.0259 |
| Al | 0.208 | P | 0.0132 |
| Br | 0.171 | Ti | 0.011 |
Table 2.
The impurity ion content in the leaching solution.
| Element | Cu | Pb | Cd |
|---|---|---|---|
| Concentration/mg·L−1 | 25.6 | 236.0 | 442.5 |
Table 3.
Standard electrode potential for different reactions.
| Reaction(T = 30 °C) | ΔGΘ(kJ/mol) | EΘ/V(vs. SHE) |
|---|---|---|
| Zn2+ + 2e− = Zn | 147.148 | −0.763 |
| Cd2+ + 2e− = Cd | 77.74 | −0.403 |
| Pb2+ + 2e− = Pb | 24.657 | −0.128 |
| Cu2+ + 2e− = Cu | −65.043 | 0.337 |
Table 4.
The content of impurity elements in the solution after electrochemical impurity removal.
| Electrodeposition Time/min | Impurity Element Concentration/mg·L−1 | |||
|---|---|---|---|---|
| Pb | Cd | Cu | ||
| 5 | 3.58 | 36.17 | 0.36 | |
| 30 | 2.63 | 23.61 | 0.18 | |
| 120 | 1.05 | 22.34 | 0.1 | |
Table 5.
Element content in ammonia leaching residue.
| Elements | Pb | Fe | Zn | Others |
|---|---|---|---|---|
| Content/wt.% | 39.72 | 21.17 | 11.45 | 27.66 |
Table 6.
The element content in acetic acid leaching residue.
| Elements | Pb | Fe | Zn | Others |
|---|---|---|---|---|
| Content/wt.% | 2.35 | 36.57 | 17.25 | 49.86 |
Table 7.
The element content in magnetic substance.
| Elements | Fe | Zn | Others |
|---|---|---|---|
| Content/wt.% | 51.82 | 22.61 | 25.27 |
Publisher’s Note: MDPI stays neutral with regard to jurisdictional claims in published maps and institutional affiliations. |
© 2021 by the authors. Licensee MDPI, Basel, Switzerland. This article is an open access article distributed under the terms and conditions of the Creative Commons Attribution (CC BY) license (https://creativecommons.org/licenses/by/4.0/).
Share and Cite
MDPI and ACS Style
Li, H.; Fu, Y.; Liang, J.; Wang, L.; Yan, H.; Zhao, L. Preparation of Zinc Oxide and Zinc Ferrite from Zinc Hypoxide by Wet Process and Electrochemistry. Crystals 2021, 11, 1133. https://0-doi-org.brum.beds.ac.uk/10.3390/cryst11091133
AMA Style
Li H, Fu Y, Liang J, Wang L, Yan H, Zhao L. Preparation of Zinc Oxide and Zinc Ferrite from Zinc Hypoxide by Wet Process and Electrochemistry. Crystals. 2021; 11(9):1133. https://0-doi-org.brum.beds.ac.uk/10.3390/cryst11091133
Chicago/Turabian StyleLi, Hui, Yutian Fu, Jinglong Liang, Le Wang, Hongyan Yan, and Linfei Zhao. 2021. "Preparation of Zinc Oxide and Zinc Ferrite from Zinc Hypoxide by Wet Process and Electrochemistry" Crystals 11, no. 9: 1133. https://0-doi-org.brum.beds.ac.uk/10.3390/cryst11091133
Note that from the first issue of 2016, this journal uses article numbers instead of page numbers. See further details here.