
Crystalline S-Layer Protein Monolayers Induce Water Turbulences on the Nanometer Scale


1
Department for Biotechnology, Institute of Bioprocess Science and Engineering, University of Natural Resources and Life Sciences, 1190 Vienna, Austria
2
Department for Nanobiotechnology, Institute for Biophysics, University of Natural Resources and Life Sciences, 1190 Vienna, Austria
3
Department of Nanobiotechnology, Institute of Synthetic Bioarchitectures, University of Natural Resources and Life Sciences, 1190 Vienna, Austria
*
Author to whom correspondence should be addressed.
Crystals 2021, 11(9), 1147; https://0-doi-org.brum.beds.ac.uk/10.3390/cryst11091147
Submission received: 9 August 2021
/
Revised: 8 September 2021
/
Accepted: 14 September 2021
/
Published: 20 September 2021
(This article belongs to the Special Issue Biomolecular Crystals Characterization by Powder Diffraction)
Abstract
:Bacterial surface layers (S-layers) have been observed as the outermost cell envelope component in a wide range of bacteria and most archaea. They are one of the most common prokaryotic cell surface structures and cover the cells completely. It is assumed that S-layers provide selection advantages to prokaryotic cells in their natural habitats since they act as protective envelopes, as structures involved in cell adhesion and surface recognition, as molecular or ion traps, and as molecular sieves in the ultrafiltration range. In order to contribute to the question of the function of S-layers for the cell, we merged high-resolution cryo-EM and small-angle X-ray scattering datasets to build a coarse-grained functional model of the S-layer protein SbpA from Lysinibacillus sphaericus ATCC 4525. We applied the Navier–Stokes and the Poisson equations for a 2D section through the pore region in the self-assembled SbpA lattice. We calculated the flow field of water, the vorticity, the electrostatic potential, and the electric field of the coarse-grained model. From calculated local changes in the flow profile, evidence is provided that both the characteristic rigidity of the S-layer and the charge distribution determine its rheological properties. The strength of turbulence and pressure near the S-layer surface in the range of 10 to 50 nm thus support our hypothesis that the S-layer, due to its highly ordered repetitive crystalline structure, not only increases the exchange rate of metabolites but is also responsible for the remarkable antifouling properties of the cell surface. In this context, studies on the structure, assembly and function of S-layer proteins are promising for various applications in nanobiotechnology, biomimetics, biomedicine, and molecular nanotechnology.
1. Introduction
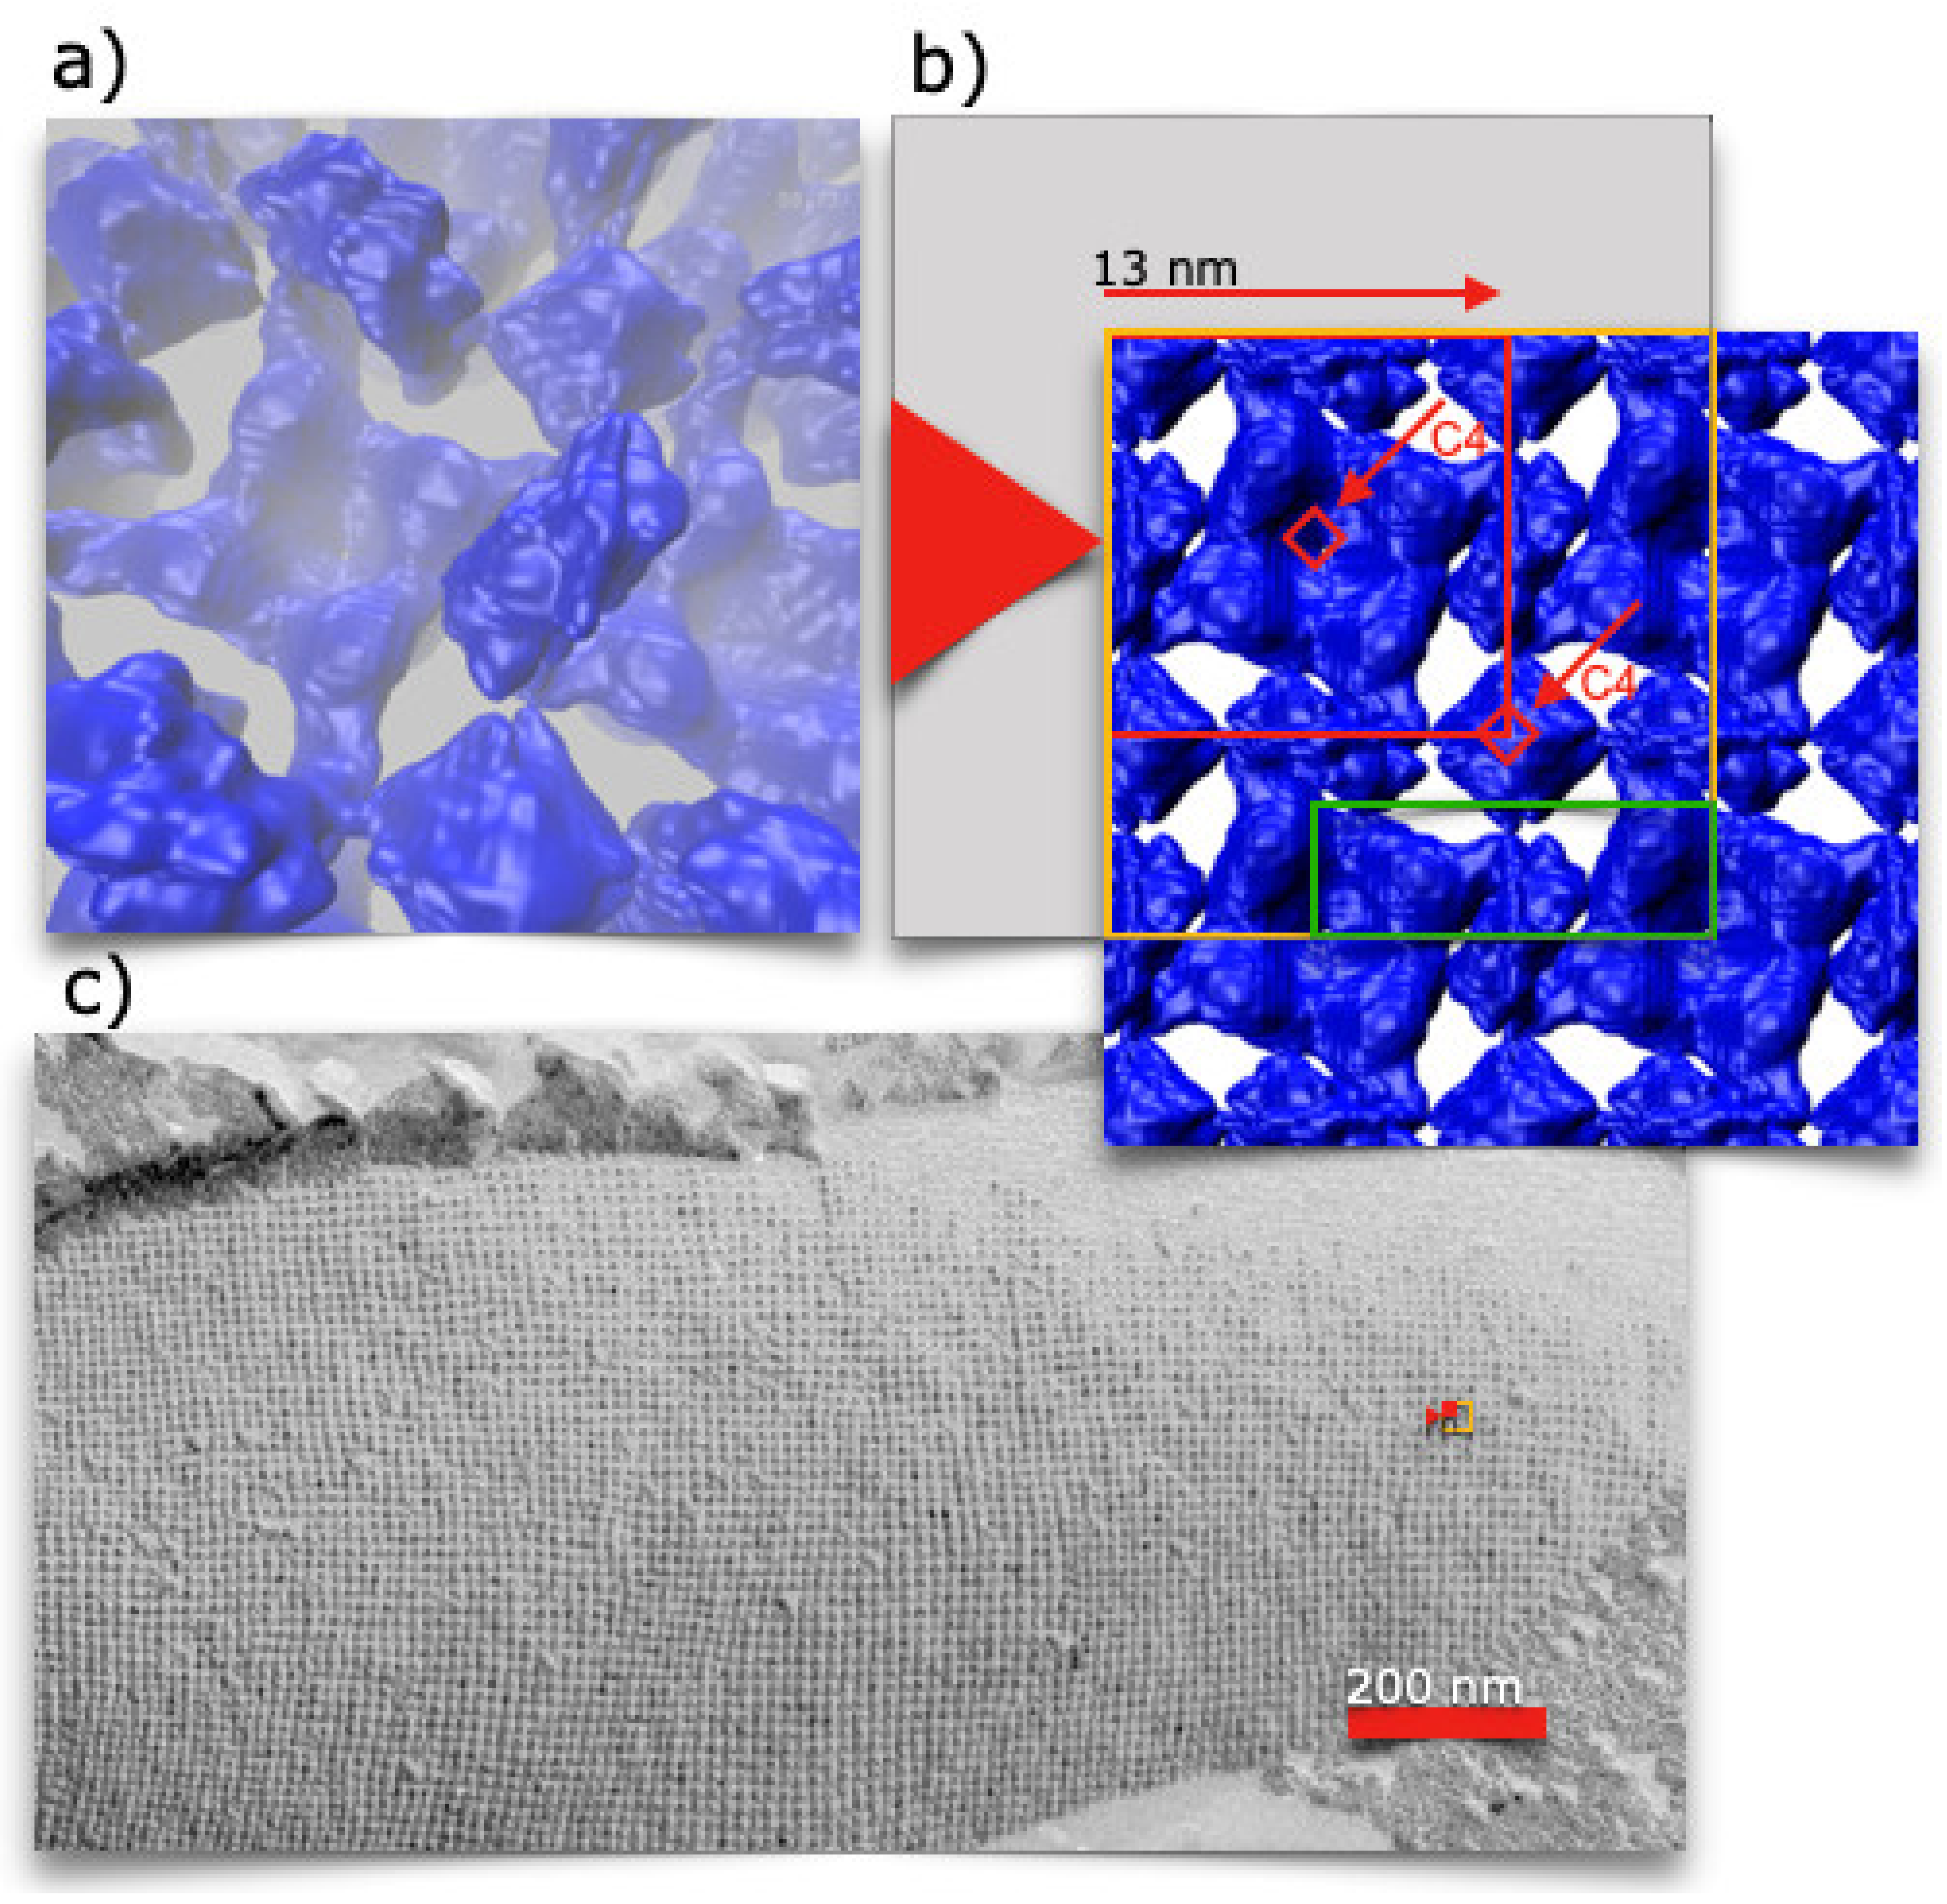
Crystalline bacterial surface layers (called S-layers) are known to be one of the most common cell surface structures in archaea and bacteria [1,2,3,4,5]. S-layers are monomolecular arrays of a single protein or glycoprotein species (Mw 40 to 200 kDa) and completely cover the archaeal or bacterial cell (Figure 1). Furthermore, S-layer proteins can be considered one of the most abundant biopolymers on earth since the biomass of prokaryotic organisms exceeds that of eukaryotic organisms [6]. S-layers exhibit either oblique (p1, p2), square (p4) or hexagonal (p3, p6) lattice symmetry. Accordingly, a unit cell (morphological unit) consists of one, two, four, three, or six identical monomers. Figure 1 shows a transmission electron microscopy (TEM) image of a bacterial cell with an S-layer with square lattice symmetry. The unit cell dimensions of S-layers range from 3 to 30 nm, while the thickness is between 5 and 10 nm (up to 70 nm in archaea). Due to their crystalline nature, S-layers are porous protein networks (30–70% porosity) with pores of uniform size (2–8 nm) and morphology [7,8].
The widespread occurrence and high physiological cost of forming S-layer proteins raises the question of the selection advantage of S-layer carrying organisms in their natural and often highly competitive habitats. This is because approximately 500,000 S-layer monomers are required to completely cover a rod-shaped bacterial cell. Assuming a generation time of 20 min, this means more than 400 copies of a single protein or glycoprotein species are synthesized per second [10]. In this context, it is interesting to recall that under optimal growth conditions for bacteria (in continuous laboratory cultures), S-layer deficient mutants, or variants possessing S-layers composed of (glyco)protein subunits with lower molecular mass, often outgrow of wild-type strains. Since the S-layer covers the entire cell surface, it has been inferred that many biological functions may depend on the completeness in the coverage and on the repetition of the ultrastructure and chemical groups on the surface down to the sub nanometer range [4]. Furthermore, the surfaces of many S-layer carrying bacteria show excellent antifouling properties. It may serve as model system for the development of ecologically benign and long-lasting marine antifouling coatings in the maritime sector [11]. This surface property was first observed in TEM images of freeze-etched and metal-shadowed samples where intact cells were vitrified (30,000 K/s) [2]. Even when cells were harvested from complex environments or growth media containing a variety of macromolecular components, the S-layer lattices were never covered by adsorbed molecules. In this context, it should be borne in mind that the self-cleaning ability of biological surfaces depends not only on the wettability but also on the water structure close to the substrate. It can be speculated that glycosylation of the S-layer may even enhance this effect [12]. Detailed studies on molecular interactions and permeability of S-layers confirmed that the outer S-layer surface is usually charge-neutral, caused by an equal amount of carboxyl- and amino groups, which prevents non-specific binding of molecules and blocking of pores [12]. S-layers were adjusted by nature and outperform chemical polymer modification, resulting in amphiphilic marine antifouling/fouling-release coatings by tuning the ratio of hydrophilic and hydrophobic side chains [13].
In contrast, the inner surface is either net positively or negatively charged, caused by an excess of one of the two groups. In this context, the permeability properties of S-layers should also be considered, which have been intensively studied and characterized over several decades [8]. Using S-layers from Bacillaceae as a model system, it was clearly shown that the S-layer lattices have well-defined exclusion limits in the range of 30–40 kDa, indicating a limiting pore diameter in the range of 3–4.5 nm [7]. In another approach, impedance spectroscopy was used to investigate the ion gating of S-layers, e.g., for calcium ions [14]. The ion current through the pores was driven by an electrical gradient within the pores, most likely caused by the difference between the charge-neutral outer and the negatively charged inner S-layer surface.
In vivo and in vitro studies elucidating the dynamic assembly process of S-layer proteins from Gram-positive bacteria during cell growth revealed that S-layers maintain an equilibrium with lowest free energy during the reassembly process [4]. Although most of the functions assigned to S-layers are still hypothetical, the supramolecular concept of a closed, isoporous protein lattice must represent a specific adaptation to different ecological and environmental conditions. Synthetic superhydrophobic (SH) surfaces were developed starting in the 1990s and have been the subject of nearly 13,500 publications. The approaches, some of which were very innovative, found no industrial application. The water-repellent properties of SH surfaces fall prey to weak mechanical properties as well as to contamination, which reduces or even destroys the original SH properties [15]. Consequently, we develop techniques to access the biomechanical properties and link them to integral models.
Considering the combination of antifouling properties [16,17] and the transport of nutrients and metabolites through the pores of the S-layer, the central question of how bacteria and archaea can overcome the diffusion limit (based on Brownian motion) to bring nutrients into the cell and remove waste products from the cell is still open. This question was raised more than thirty years ago by E. M. Purcell in a pioneering lecture in which he studied life at low Reynolds numbers, particularly the locomotion of flagellum-driven bacterial cells [18]. For such small objects, the viscosity of water dominates their life. Since bacterial cells have an extremely low Reynolds number R, typically of 10−4, they entrain the dense environment, which decreases only slowly. The viscous forces dominate, and inertia is entirely irrelevant. To overcome the local diffusion-limited transport of nutrients into the cell and waste away from its surface, flagellated prokaryotes swim certain distances before stopping or changing their direction. This is the only way for the bacterial cell to find a difference in the environment or induce local turbulence and, in this way, take the opportunity to increase the exchange rate. Since bacteria are not constantly moving and are sedentary to some extent, the turbulences generated by the S-layer could be an evolutionary solution to overcome the diffusion limit in nutrient supply, especially for non-mobile cells bound to surfaces or trapped in a biofilm.
Based on preliminary drag experiments with an optical trap, which indicated that micrometer-sized S-layer coated microbeads have a slightly higher flow resistance than blank beads (data not shown), we decided to calculate the water flow across S-layers in silico and to try to develop a theoretical model that will allow us to better understand the S-layer–water interface. As a model system, we used high-resolution cryo-TEM tomography data of the S-layer protein SbpA from Lysinibacillus sphaericus ATCC 4525 (identical to Lysinibacillus sphaercius CCM2177, see [19]) [9,20].
The combination of SAXS data and cryo-EM data is completely new in the field and will later serve as a basis for more detailed investigations. To the best of our knowledge, no previous study has combined two orthogonal techniques, here SAXS (reciprocal space) and cryo-EM tomography (real space), using a linear programming technique. By this approach, we create a high-resolution model and consider the biophysics of the S-layer. We solve the Navier–Stokes and Poisson equations and determine the size of a simulation box required to examine the impacts of the S-layer on the water matrix.
2. Methods
The S-layer protein SbpA from Bacillus sphaericus CCM2177 was isolated by default, as stated in Refs. [20,21,22]. All small angle X-ray experiments were carried out at Beamline 12.3.1 at the Advanced Light Source (ALS) at the Lawrence Berkeley National Laboratory. Details on sample preparation for cryo-EM tomography are given in [20], whereas all small angle X-ray experiments were carried out at Beamline 12.3.1 at the Advanced Light Source (ALS) at the Lawrence Berkeley National Laboratory. Here, details on the preparation of samples and experimental methods are described in [23,24,25,26]. SAXS captures complete distance information on a protein’s structure. This enables one to enforce restrictions and guide computational structure predictions of proteins. In fact, for ab initio protein structure prediction, experimental data provides powerful constraints. These restrictions are used to select similarly scoring models or, more forcefully, inside optimization functions toward ab initio protein structure predictions. In the present model, we combined two orthogonal experimental methods: SAXS and cryo-EM tomography. SAXS is an experimental method for measuring the spatial distribution of pairs of amino acids in reciprocal space. The experiment is performed in situ. Cryo-EM tomography, in contrast, is a quasi-in situ experimental method that scans the protein electron shell at temperatures as low as 4 degrees Celsius in real space. We link both experimental approaches’ data, mathematically. This coupling enables the identification of probable scattering sites inside the enclosing shell, and we establish a coarse model of the SbpA S-layer.
2.1. The Preparation of the Recombinant Truncated form rSbpA1-1068
However, we must note, at this point, that the SAXS data were generated with the native protein, but the cryo-tomography data were obtained from a truncated form. The full length of SbpA 31-1268 comprises 1238 amino acids (aa), while the C-terminally truncated form rSbpA1-1068 is 1068 aa long. For this work, we rely on the self-similarity of the two versions but will discuss this inconsistency in the experimental data in a separate paper. The S-layer protein SbpA reassembles into extended monolayer lattices with square (p4) lattice symmetry and a lattice spacing of 13.1 nm. The thickness of the SbpA S-layer is in the range of 11 to 13 nm [20,21]. Thus, each unit cell consists of four SbpA monomers.
2.2. The Integral Approach
The atomic resolution is unknown to date because no crystallographic data are available. Nevertheless, we combined the cryo-EM data with small-angle X-ray scattering data to develop a box model, to which we then applied the Navier–Stokes and the Poisson equations [20,27]. Indeed, we find induced turbulences due to nanometric corrugations in the S-layer topography. These extend a few tens of nanometers into the medium flowing above and can prevent the accumulation of molecules near the S-layer surface.
The reduced transient Navier–Stokes equation and the Poisson equation were solved in 2D in Mathematica. The reduced Navier–Stokes equation equals:
with:
All parameters are reduced accordingly, the density is normalized by the density of water at 20°C, the velocity is normalized to , while the pressure is normalised by . The time is normalised, too. However, we here solve the transient Navier–Stokes equation in order to impose periodic boundary conditions. Herein, equals the density, the applied velocity, d the characteristic distances, and the dynamic viscosity. We set = 1 mNs/m2 and = 997 kg/m3 and applied a = 10−6 m/s; the characteristic length was a0 = 13 nm. Consequently, the Reynolds number was calculated with
and resulted in a value of Re = 1.3 × 10⁻⁸. Due to the multiple and different contacts with the liquid and charges decorating the S-layers surface, the solvation properties and electrostatic interactions are of particular importance among the other molecular energy components, i.e., hydrophobic hydrophilic interactions. Although the Poisson–Boltzmann equation would be the more appropriate approach to describe interactions between S-layer and fluid in integral form much better, we restricted first considerations and solved the Poisson equation only. It represents the distribution of the electric potential in solution with respect to a charged surface normal to the surface of the S-layer. In the approach, a random distribution of charges was placed onto the film and the Poisson equation, given by:
where was solved. There is hardly any dispute about this simplification of S-layers, given the fact that the Poisson–Boltzmann (PB) equation is the most popular implicit model for representing solvent effects using the Boltzmann distribution. Ultimately, however, it is a model, and at this stage, our goal was to analyze the influence of film periodicity on the electric field that the film exerts on the fluid. Our interest was to estimate how deep the charges would reach into the liquid before being balanced by mobile charges. The latter could have been described by the PB equation, but we proposed a different route.
In the last step, our model is refined by a lattice Boltzmann approach, which we combined with coarse-grained molecular modeling. All charges are mobile. This approach was the more spatial and dynamically resolved option.
3. Results and Discussion
To our knowledge, this is the first time, in the literature, that cryo-EM and small-angle X-ray scattering datasets have been combined to obtain a high-resolution model of the SbpA S-layer protein. The cryo-EM data were taken from a previous publication [20]. The morphological unit of SbpA with its p4 lattice symmetry was assembled in silico in Figure 1. Thus, the blue colored hull consists of 16 protein monomers. The four-fold axes are marked by red upright squares. In addition to the pair densities within the unit cell, pair densities from neighboring unit cells are also included. The green rectangle marks the simulation box for the Navier–Stokes and Poisson equations, which are solved at the end of this paper.
The core model in Figure 2a was discriminated from the hull model in Figure 2b. In the core model, all potential scattering sites were placed within the hull of the cryo-EM data, while in the hull model, they were placed on the hull of the cryo-EM data. Pair densities were computed thereof and are indicated in the inserts by full and dashed blue lines.
At ease, the form factor, P(Q), was computed. It is the Fourier transform, of the individual pair density distributions:
It was computed and is shown by the solid and dashed blue lines in Figure 2. Both deviated significantly from the experimental scattering data, I(Q). Standard small-angle X-ray scattering approaches [21,28] relate these discrepancies between the two curves to the apparent structure factor of the SbpA self-assembly:
This approach has already been used in earlier work [21]. There, the small-angle X-ray scattering signal was also divided into two factors. One corresponded to the form factor, while the second factor corresponded to the structure factor of the primitive unit cell. Although this approach is justifiable, we can show that it is no longer necessary from now on [21]. The small-angle X-ray scattering signal can be recovered by the Fourier transform of a pair density distribution from the S-layer model. Pair densities calculated from cryo-EM data were used as initial configuration, and hypothetical pair densities were calculated by a linear programming algorithm:
Parameter α = 1, and Equation (2) was optimized by the use of the L2 Norm. The constants c1 and c2 were introduced due to experimental uncertainties. The results obtained by applying the linear programming algorithm were remarkable. In Figure 2, computed pair densities and the corresponding hypothetical scattering intensities are given by red lines. By the use of the linear programming approach, hypothetical scattering intensities matched the experimental data perfectly. The chosen unit cell already had enough information about the periodicity of self-assembled array to explain the scattering pattern. The computed pair density shows small protrusions at identical positions independent of the pair density distributions. These protrusions are interpreted as high populations of relative distances within the primitive p4 unit cell.
It is not shown here, but increasing the number of unit cells would not affect the quality of the fit. It is obvious because, for larger distances, the calculated pair densities scale with the power of 2 of the relative distances, and consequently, the Fourier transform falls to zero:
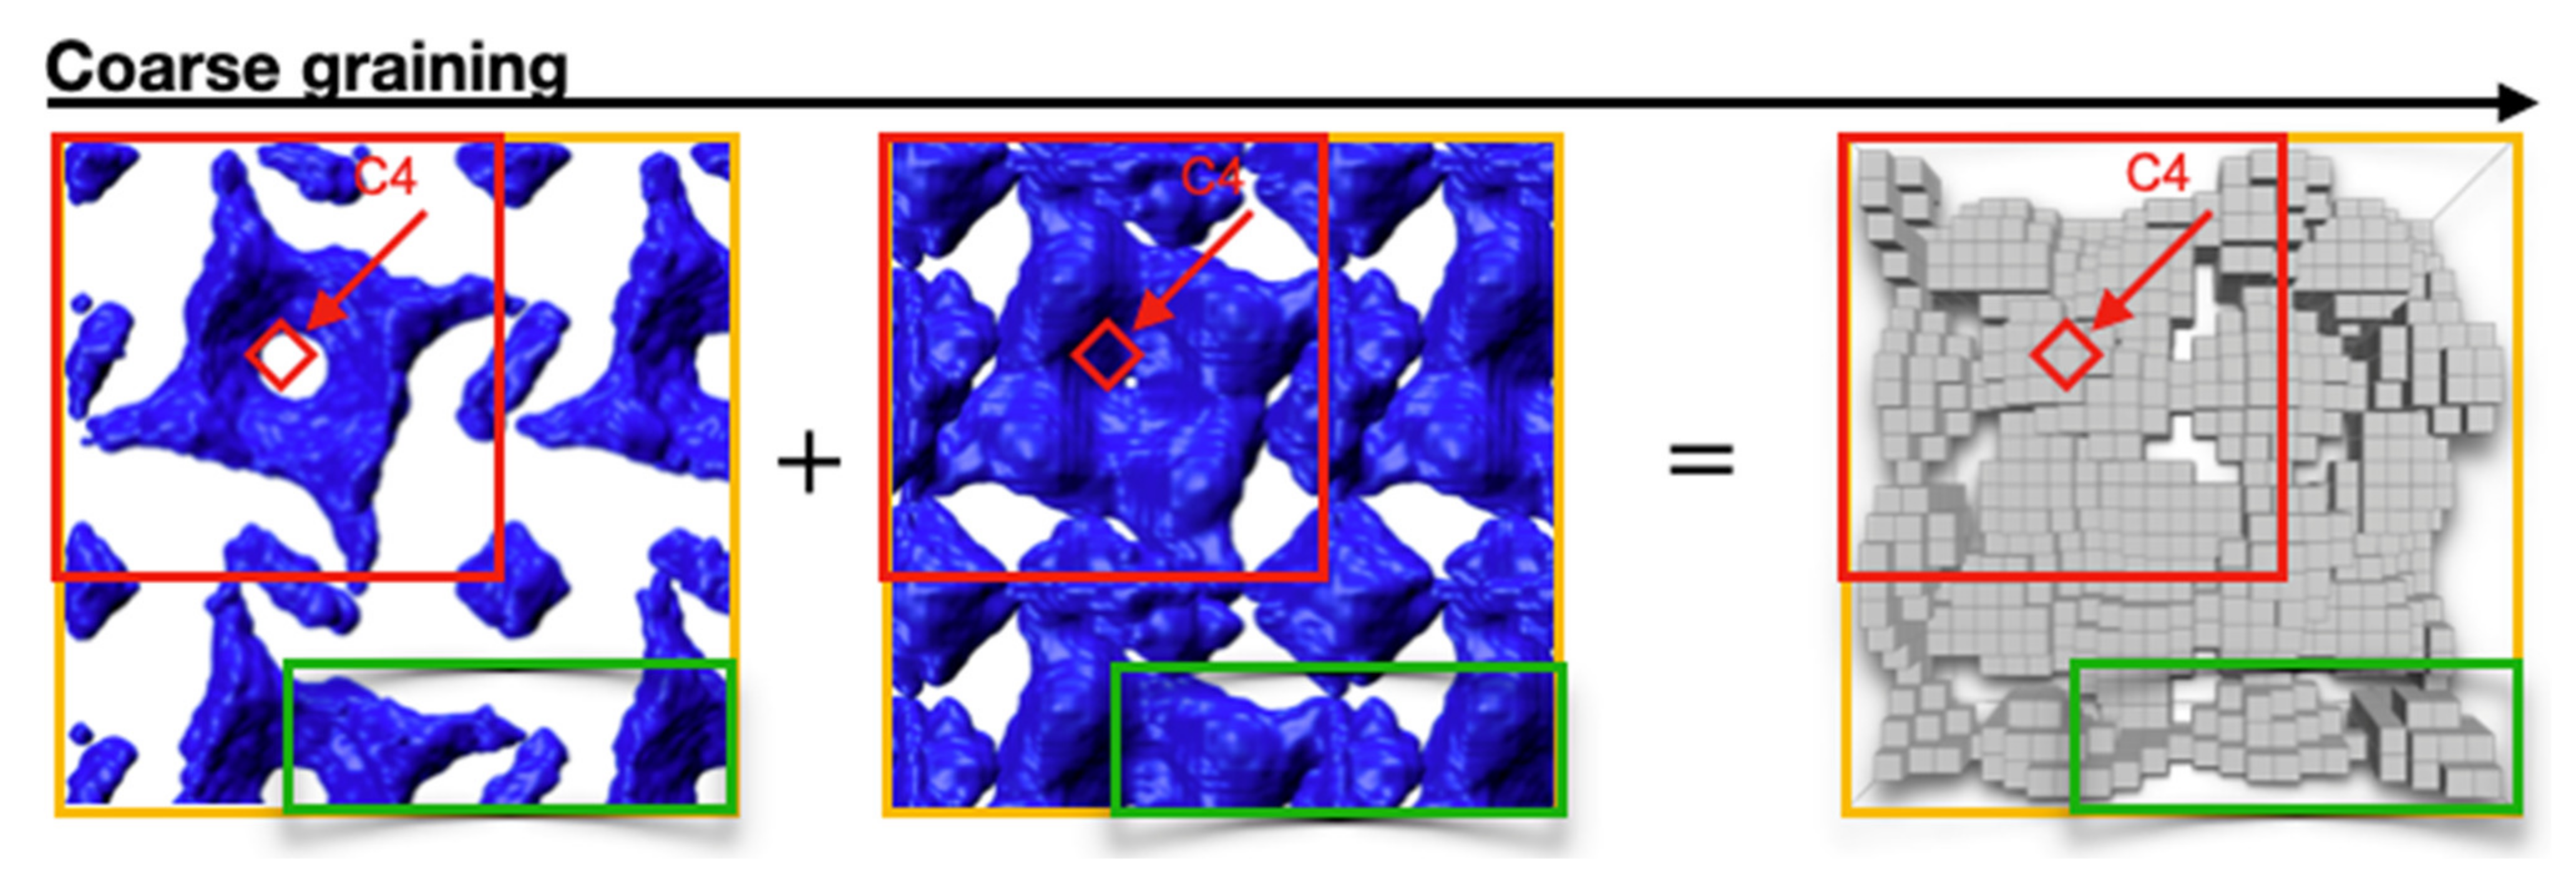
Since the core and hull models give similar results, both were combined, and a final coarse-grained box model was designed, which is introduced in Figure 3. The core and hull models were superimposed. The resulting model was rasterized, leaving only volumes that enclosed potential scattering sites. This approach reduced the resolution to approximately 1 nm, which is the approximate side length of an individual grain.
Next, the grey line in the upper panel in Figure 4c indicates the pair density of the grey box model. This pair density was chosen as an initial pair density distribution. Again, we applied the linear programming algorithm of Equation (7) to compute the best hypothetical scattering function. This is the dashed grey line in the lower panel of Figure 4c. The mismatch between the pair density calculated from the box model and the pair density that provided the best hypothetical scattering function was balanced by introducing weights. Each box was given a weight between 0 and 1. Here, again, we have applied a linear programming algorithm:
The weights were continued until the pair densities computed from the weighted box model matched the pair densities calculated from the experimental scattering data (Figure 4c, upper and lower panel). Boxes that have received a rating of less than 0.3 are not shown in the colored box model. While light red boxes weigh 0.3, boxes in darker red have been colored because their weighting is closer to 1. The consequences can be interpreted in two ways: The boxes could be volumes of high electronic contrast, indicating the electronic morphology of the unit cell. We emphasize the following interpretation: darker boxes are entities within the SbpA layer that do not move, and thus their probability of contributing to the scattering signal is higher than the lighter boxes, which had a lower probability of scattering coherently within the S-layer. The dark boxes are then the pillars spanning the S-layer. The lighter boxes on the other side comprise scattering sites that are weaklier bound within the SbpA lattice. They could move, they could open or close the S-layer, and they could form selective pores.
We chose the idea that darker volumes represent regions of lower mobility within the S-layer. These darker volumes act like pillars and span the SbpA self-assembly as described above. We apply a simple Navier–Stokes computation to calculate the flow profile that the S-layer exerts on the fluid around it. We will investigate the impact of the S-layer on the water matrix at a later stage in a 3D lattice Boltzmann molecular dynamics simulation. Instead, we explored the question of whether, at low Reynolds numbers, a particular distribution of rigid regions in the S-layer could influence the flow of the fluid above. We simplified our approach and argued that the flow over a unit cell is unidirectional due to the high viscosity, and any lateral contributions within one unit cell are small.
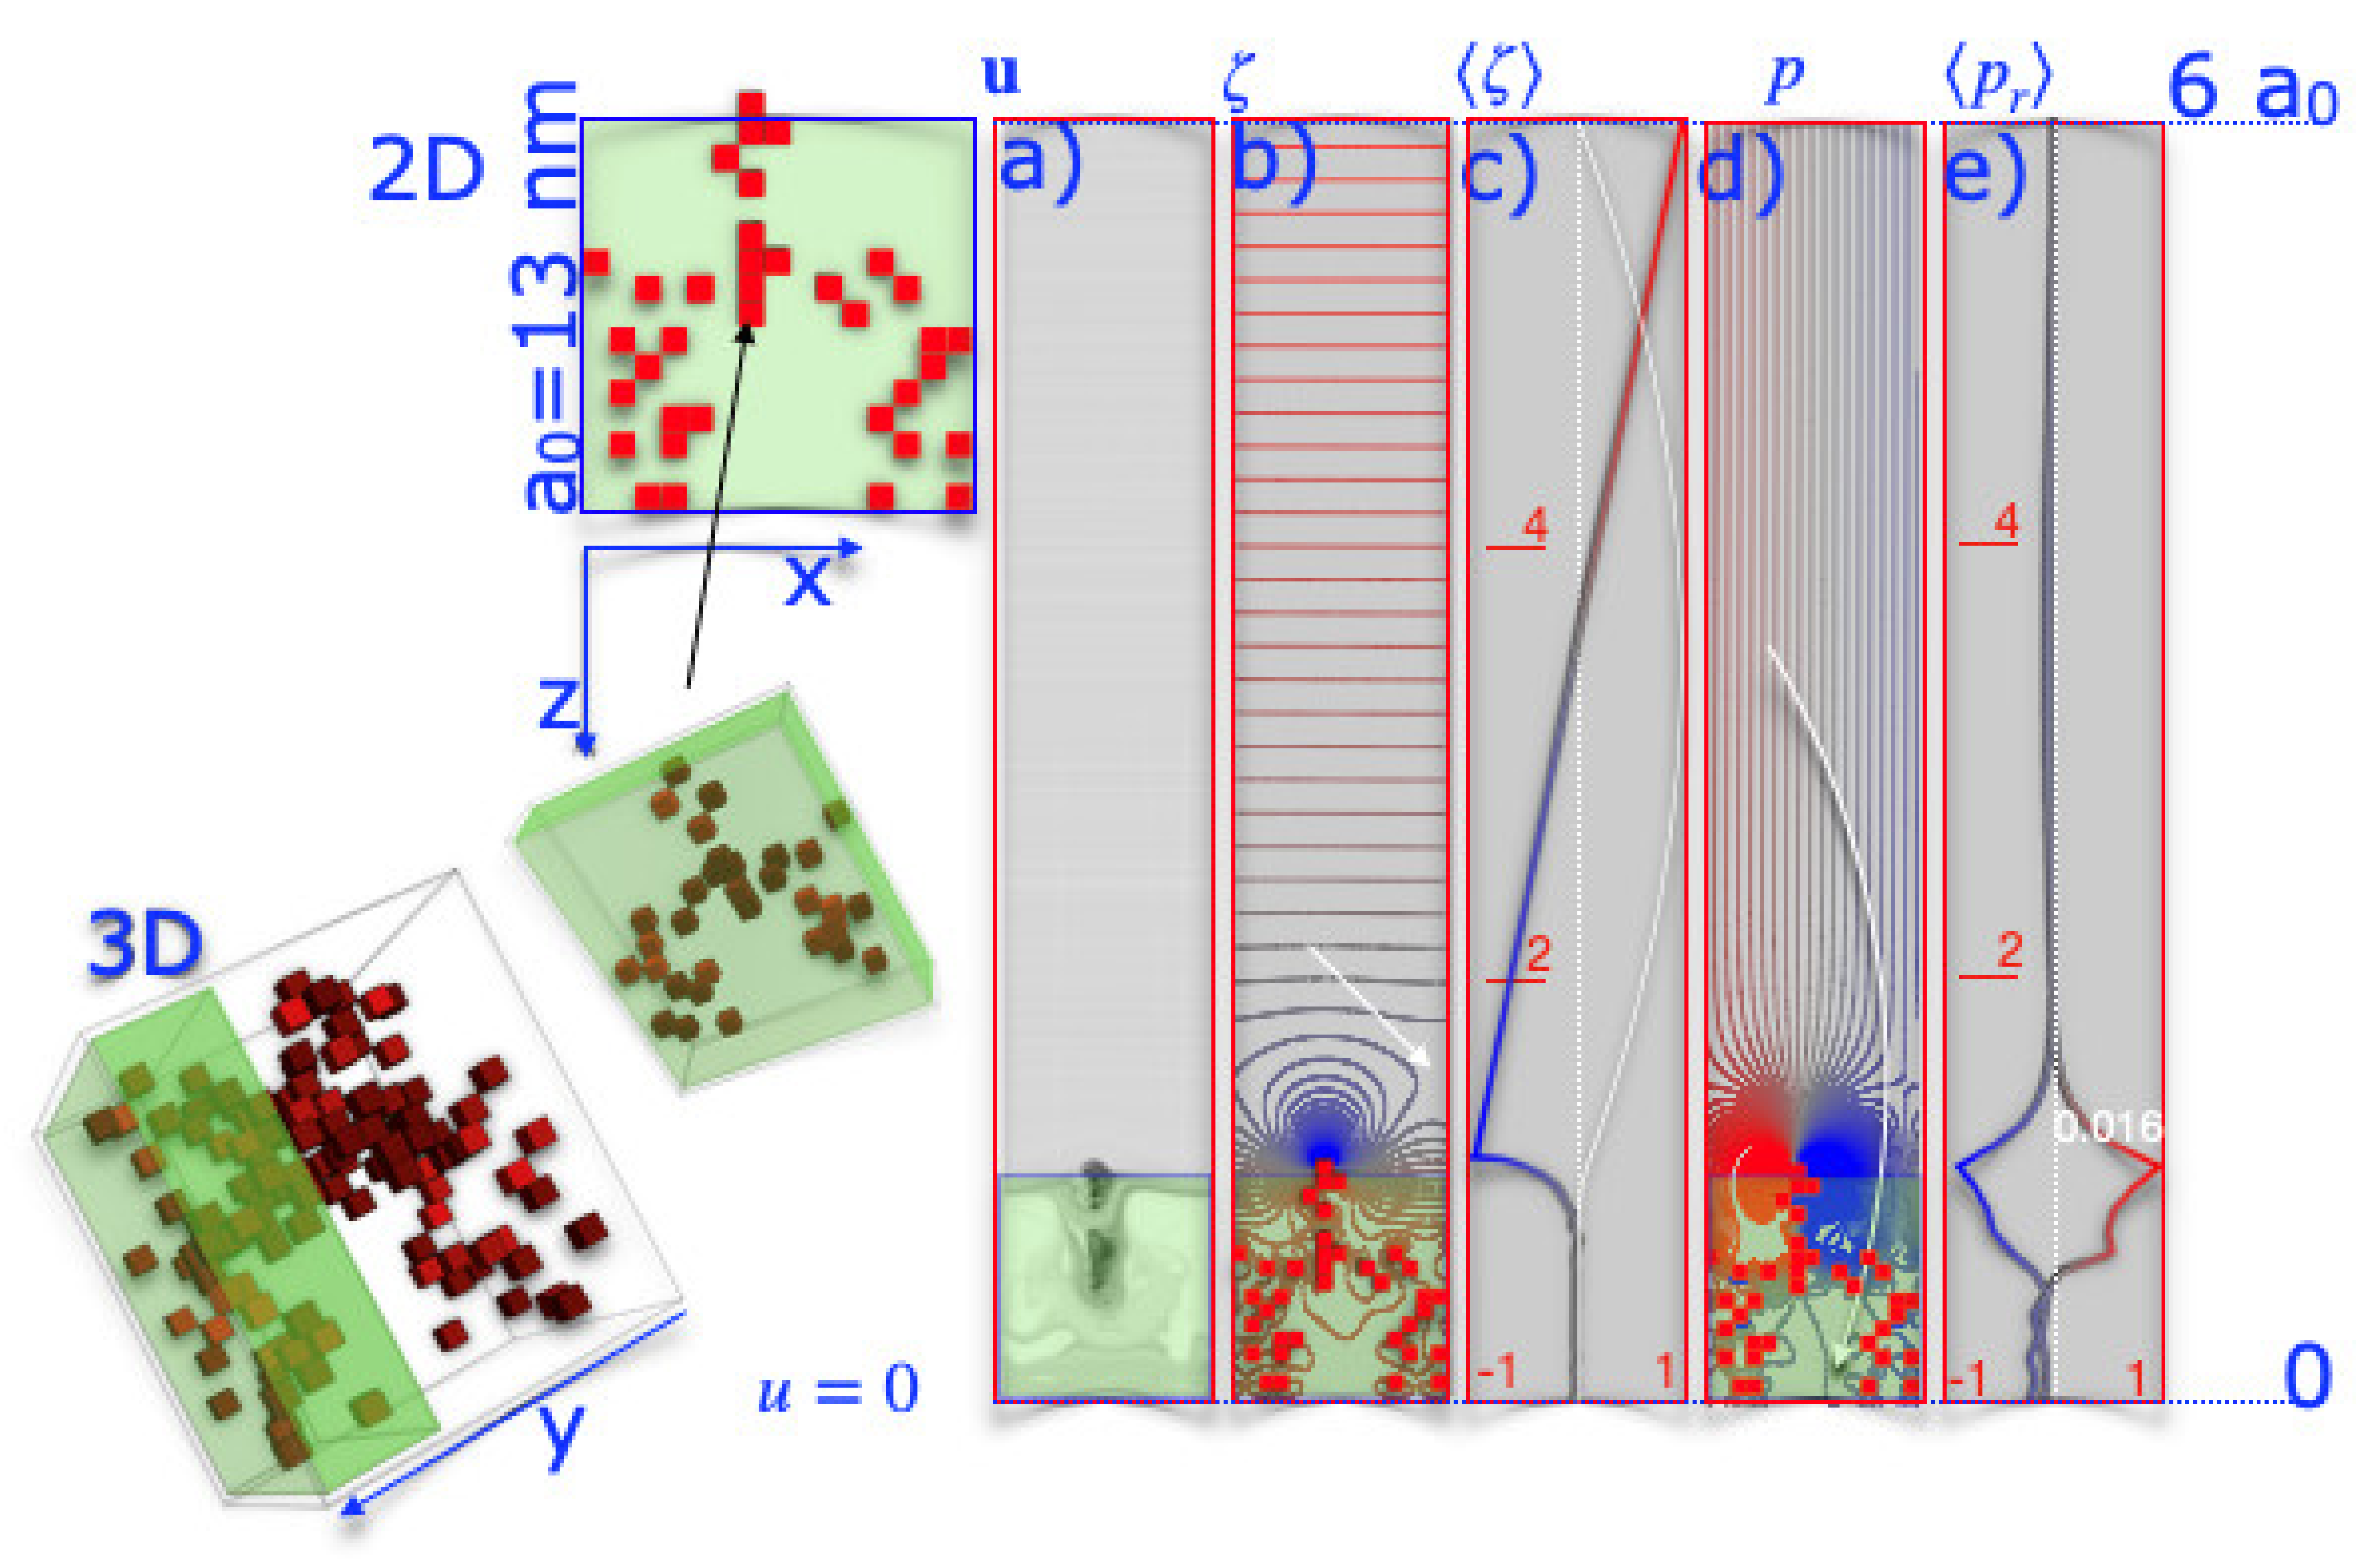
This raises the question of what the overall flow field looks like when the rigid volumes act as obstacles. The graphs in Figure 5 show the velocity, vorticity, and pressure of the fluid in a slit. The boundary conditions are periodic in the x-direction. The S-layer is located at the bottom edge, while the top edge remains untouched. Non-slipping boundary conditions are introduced at z = 0 and z = 6 a0. There, the velocity is kept equal to zero. The flow field, as shown in Figure 5a, is hardly disturbed. It was to be expected, as the viscosity was set high. The obstacles presented by the rigid regions strongly disturb the flow field only in their vicinity. In the S-layer, we find curved trajectories, which can be interpreted as an indication that the periodic structure of the S-layer imprints a flow field that triggers transport through the S-layer.
Again, the flow field is hardly disturbed near the S-layer, and even at distances of less than one lattice constant, it is laminar. From the trajectories, we then calculated the vorticity, which is more structured. A high vorticity is found near the surface of the S-layer (blue, red), and due to the periodicity of the S-layer, the vorticity is structured next to it. Near the SbpA S-layer surface, where the vorticity (blue) is high, the trajectories of molecules suspended in the liquid can be affected, leading to their out-of-plane transport. In the present calculation, the SbpA S-layer induced vorticity profiles of 10–20 nm deep into the liquid. In regions to the left and right of this, the vorticity was close to zero.
The trajectories of proteins or nanoparticles (Figure 5, white arrow) would not be affected there. According to the pore size, particles with spatial dimensions smaller than a0 would rest above the pore and could thus stay long enough near the pores to pass the S-layer lattice towards the cell. On the other hand, it could be seen as an indication of a Lotus leaf effect, as particles larger than the repeating distance of the S-layer would be transported parallel to the S-layer [29]. On average, the vorticity was very different near the S-layer compared to a blank surface. Pressure is a variable that changes the most when the nanostructured surface is compared to a blank surface. Areas with lower pressure are marked in blue, and areas with higher pressure are marked in red. The pressure differences are small in total. These low-pressure differences could have translated into lower and higher resistance probabilities of water near the protein stabilizing the protein conformation. Could it be that the protein is more flexible in regions with lower pressure and therefore changes its conformation so molecules and particles can pass the S-layer?
In a final step, possible electrostatic effects are calculated and outlined in Figure 6. Periodic boundary conditions were set in the z-direction. At the boundaries at z = 0 and z = 6 a0, the potential was set to zero. Charges randomly decorated the rigid obstacles, and the net charge was balanced to zero. The Poisson equation was solved for the fluid. Differences in dielectricity of the two regions (protein and fluid) or the Poisson–Boltzmann equation were considered. Of course, this is a gross simplification, but the following question is still worth discussing: Does the periodic distribution of charges influence the electric field and affect the water structure? Additionally, how far does it reach in? While the potential and the averaged potential does not change significantly throughout the pore, the electric field does, as shown in Figure 5. Field lines reaching deep into the fluid are found, which may orient and drag charged nanoparticles. It is surprising that, again, in comparison to the Naiver Stokes equation, the structured surface is, on average, comparable to the unstructured one. However, they deviate significantly at the nanoscale for distances close to the size of the unit cell. At the characteristic distances of the S-layer, the mean electrostatic field is highest at the top of the S-layer and lowest near the pores. This pattern developed even though the charges were randomly distributed. It is the morphology of the S-layer alone that causes differences on small scales. Charges in the liquid would be influenced and, in this way, water would be structured, which happens solely due to the repeating morphology of the S-layer.
4. Summary
Based on preliminary studies and ongoing work, we selected the S-layer protein SbpA from Lysinibacillus sphaericus ATCC 4525, which is identical to the also often investigated L. sphaericus CCM2177 [9,19]. In the presence of calcium ions, SbpA is able to reassemble in suspension, on solid supports (e.g., silicon surfaces, metals, polymers, glass), at the air–water interface, on planar lipid S-layers, on liposomes, nano-capsules, and carbon nanotubes, following a non-classical crystallization pathway [30,31,32,33,34,35]. Furthermore, the formation of an S-layer lattice with p4 lattice symmetry (as in SbpA) was also investigated in a theoretical approach by assuming both unspecific attractive and specific directional bonds between the monomers [36]. The results were in excellent agreement with the experimental findings, showing, for example, that liquid-like cluster formation precedes crystallization.
In the first part of our work, high-resolution cryo-TEM data were linked with SAXS data. A model was constructed that considered the pair densities of the primitive unit cell and the pair densities coming from the nearest neighbors. The pair densities of this model were calculated and served as initial values for solving linear programming. It must be emphasized that it was possible for the first time in the literature to reconstruct hypothetical scattering data from the primitive unit cell. The approach eliminates the approximation, in which the scattering signal is divided into shape and structure factor. Grooves were found in the pair densities at characteristic intervals. These spacings could be associated with the self-assembled S-layer. Both the core and shell models gave similar results in terms of the best fit and minimized the discrepancies between hypothesized and experimental scattering data. Hull and core model were simplified to a box model.
The resulting box model was refined by choosing the weight assigned to each volume so that the hypothetical and experimental pair densities calculated from it resembled each other. Volumes with high weight were distinguished from those with low weight. Low weight volumes were interpreted as flexible areas in the S-layer lattice, while high weight volumes represented more rigid regions in the S-layer lattice. Navier–Stokes calculations with these volumes showed that these volumes significantly affect the fluid and the electrostatics near the S-layer lattice when electric charges decorated the volumes. The Navier–Stokes equations, as well as the Poisson equation, were solved for a limited region. The flow was assumed to be two-dimensional. The idea was not to give a comprehensive picture, but to push open a door of thought. Both the strength of the turbulences and the pressure near the S-layer surface in the 10 to 50 nm range support our hypothesis that the S-layer increases the exchange rate of metabolites and is responsible for the antifouling properties of the cell surface. The uptake of matter, such as molecules, particles, or any material compounds in this size range, is no longer limited by diffusion. Their removal from the surface leads to a clean S-layer surface. The S-layer thus justifies the high energy consumption in its production in the bacterial cell. In previous work, we sought to predict ab initio structure using reverse-steered molecular dynamics simulations [21,37]. The Jarzinsky equation [38] and later work by Schulten influenced our approach. The disadvantage of our strategy was the absence of a method to link our models to experimental evidence to back up our findings. They were challenged by the crystallographic work of [39] for Sbsb. In contrast, in this study, we integrate in situ experimental data to construct a coarse model of SbpA. We discuss and establish the concept to deduce this model and sketch an application for which the model may be employed. In subsequent work, the model and application will be refined.
Author Contributions
Conceptualization, R.T., A.B.; methodology, R.T.; software, R.T.; validation, R.T., D.P. and U.B.S.; formal analysis, R.T.; investigation, R.T.; resources, R.T., D.P., U.B.S.; data curation, R.T., A.B.; writing—original draft preparation, R.T., D.P.; writing—review and editing, R.T., A.B., D.P., U.B.S.; visualization, R.T.; supervisor and project administration, D.P. and U.B.S.; funding acquisition, D.P. and U.B.S. All authors have read and agreed to the published version of the manuscript.
Funding
This research was funded by the Austrian Science Fund (FWF) [project P 31927-N28 (to D.P.)]. Financial support provided from Avalon GloboCare Corp. is gratefully acknowledged. SAXS data was collected at SIBYLS which is supported by the DOE-BER IDAT DE-AC02-05CH11231 and NIGMS ALS-ENABLE (P30 GM124169 and S10OD018483).
Data Availability Statement
The data presented in this study are available on request from the corresponding author Rupert Tscheliessnig upon request.
Acknowledgments
We are grateful to L. R. Comolli, who gave us access to high-resolution cryo-TEM data used in Ref. [20].
Conflicts of Interest
The authors declare no conflict of interest.
References
- Pum, D.; Breitwieser, A.; Sleytr, U.B. Patterns in Nature—S-Layer Lattices of Bacterial and Archaeal Cells. Crystals 2021, 11, 869. [Google Scholar] [CrossRef]
- Sleytr, U.B. Regular Arrays of Macromolecules on Bacterial Cell Walls: Structure, Chemistry, Assembly, and Function. Int. Rev. Cytol. 1978, 53, 1–62. [Google Scholar] [CrossRef]
- Albers, S.-V.; Meyer, B.H. The Archaeal Cell Envelope. Nat. Rev. Microbiol. 2011, 9, 414–426. [Google Scholar] [CrossRef] [PubMed]
- Sleytr, U.B.; Schuster, B.; Egelseer, E.-M.; Pum, D. S-Layers: Principles and Applications. FEMS Microbiol. Rev. 2014, 38, 823–864. [Google Scholar] [CrossRef]
- Khursigara, C.M.; Koval, S.F.; Moyles, D.M.; Harris, R.J. Inroads through the Bacterial Cell Envelope: Seeing Is Believing. Can. J. Microbiol. 2018, 64, 601–617. [Google Scholar] [CrossRef] [PubMed]
- Whitman, W.B.; Coleman, D.C.; Wiebe, W.J. Prokaryotes: The Unseen Majority. Proc. Natl. Acad. Sci. USA 1998, 95, 6578–6583. [Google Scholar] [CrossRef] [Green Version]
- Sára, M.; Sleytr, U.B. Molecular Sieving through S Layers of Bacillus Stearothermophilus Strains. J. Bacteriol. 1987, 169, 4092–4098. [Google Scholar] [CrossRef] [Green Version]
- Schuster, B.; Sleytr, U.B. S-Layer Ultrafiltration Membranes. Membranes 2021, 11, 275. [Google Scholar] [CrossRef]
- Ilk, N.; Völlenkle, C.; Egelseer, E.M.; Breitwieser, A.; Sleytr, U.B.; Sára, M. Molecular Characterization of the S-Layer Gene, SbpA, of Bacillus Sphaericus CCM 2177 and Production of a Functional S-Layer Fusion Protein with the Ability To Recrystallize in a Defined Orientation While Presenting the Fused Allergen. Appl. Environ. Microbiol. 2002, 68, 3251–3260. [Google Scholar] [CrossRef] [Green Version]
- Sleytr, U.B.; Beveridge, T.J. Bacterial S-Layers. Trends Microbiol. 1999, 7, 253–260. [Google Scholar] [CrossRef]
- Xie, C.; Guo, H.; Zhao, W.; Zhang, L. Environmentally Friendly Marine Antifouling Coating Based on a Synergistic Strategy. Langmuir 2020, 36, 2396–2402. [Google Scholar] [CrossRef]
- Schuster, B.; Sleytr, U.B. Relevance of Glycosylation of S-Layer Proteins for Cell Surface Properties. Acta Biomater. 2015, 19, 149–157. [Google Scholar] [CrossRef] [PubMed] [Green Version]
- Park, D.; Weinman, C.J.; Finlay, J.A.; Fletcher, B.R.; Paik, M.Y.; Sundaram, H.S.; Dimitriou, M.D.; Sohn, K.E.; Callow, M.E.; Callow, J.A.; et al. Amphiphilic Surface Active Triblock Copolymers with Mixed Hydrophobic and Hydrophilic Side Chains for Tuned Marine Fouling-Release Properties. Langmuir 2010, 26, 9772–9781. [Google Scholar] [CrossRef] [PubMed]
- Sotiropoulou, S.; Mark, S.S.; Angert, E.R.; Batt, C.A. Nanoporous S-Layer Protein Lattices. A Biological Ion Gate with Calcium Selectivity. J. Phys. Chem. C 2007, 111, 13232–13237. [Google Scholar] [CrossRef]
- Erbil, H.Y. Practical Applications of Superhydrophobic Materials and Coatings: Problems and Perspectives. Langmuir 2020, 36, 2493–2509. [Google Scholar] [CrossRef]
- Rothbauer, M.; Ertl, P.; Theiler, B.A.; Schlager, M.; Sleytr, U.B.; Küpcü, S. Anisotropic Crystalline Protein Nanolayers as Multi-Functional Biointerface for Patterned Co-Cultures of Adherent and Non-Adherent Cells in Microfluidic Devices. Adv. Mater. Interfaces 2015, 2, 1400309. [Google Scholar] [CrossRef]
- Rothbauer, M.; Küpcü, S.; Sticker, D.; Sleytr, U.B.; Ertl, P. Exploitation of S-Layer Anisotropy: PH-Dependent Nanolayer Orientation for Cellular Micropatterning. ACS Nano 2013, 7, 8020–8030. [Google Scholar] [CrossRef] [PubMed]
- Purcell, E.M. Life at Low Reynolds Number. Am. J. Phys. 1977, 45, 3–11. [Google Scholar] [CrossRef] [Green Version]
- Pavkov-Keller, T.; Howorka, S.; Keller, W. Chapter 3—The Structure of Bacterial S-Layer Proteins. In Progress in Molecular Biology and Translational Science; Howorka, S., Ed.; Molecular Assembly in Natural and Engineered Systems; Academic Press: Cambridge, MA, USA, 2011; Volume 103, pp. 73–130. [Google Scholar] [CrossRef]
- Comolli, L.R.; Siegerist, C.E.; Shin, S.-H.; Bertozzi, C.; Regan, W.; Zettl, A.; De Yoreo, J. Conformational Transitions at an S-Layer Growing Boundary Resolved by Cryo-TEM. Angew. Chem. Int. Ed. 2013, 52, 4829–4832. [Google Scholar] [CrossRef] [PubMed]
- Horejs, C.; Gollner, H.; Pum, D.; Sleytr, U.B.; Peterlik, H.; Jungbauer, A.; Tscheliessnig, R. Atomistic Structure of Monomolecular Surface Layer Self-Assemblies: Toward Functionalized Nanostructures. ACS Nano 2011, 5, 2288–2297. [Google Scholar] [CrossRef] [PubMed]
- Shin, S.-H.; Comolli, L.R.; Tscheliessnig, R.; Wang, C.; Nam, K.T.; Hexemer, A.; Siegerist, C.E.; De Yoreo, J.J.; Bertozzi, C.R. Self-Assembly of “S-Bilayers”, a Step Toward Expanding the Dimensionality of S-Layer Assemblies. ACS Nano 2013, 7, 4946–4953. [Google Scholar] [CrossRef]
- Dyer, K.N.; Hammel, M.; Rambo, R.P.; Tsutakawa, S.E.; Rodic, I.; Classen, S.; Tainer, J.A.; Hura, G.L. High-Throughput SAXS for the Characterization of Biomolecules in Solution: A Practical Approach. In Structural Genomics; Methods in Molecular Biology; Humana Press Inc.: Totowa NJ, USA, 2014; pp. 245–258. [Google Scholar] [CrossRef] [Green Version]
- Classen, S.; Hura, G.L.; Holton, J.M.; Rambo, R.P.; Rodic, I.; McGuire, P.J.; Dyer, K.; Hammel, M.; Meigs, G.; Frankel, K.A.; et al. Implementation and Performance of SIBYLS: A Dual Endstation Small-Angle X-Ray Scattering and Macromolecular Crystallography Beamline at the Advanced Light Source. J. Appl. Crystallogr. 2013, 46, 1–13. [Google Scholar] [CrossRef]
- Hura, G.L.; Menon, A.L.; Hammel, M.; Rambo, R.P.; Poole, F.L., II; Tsutakawa, S.E.; Jenney, F.E., Jr.; Classen, S.; Frankel, K.A.; Hopkins, R.C.; et al. Robust, High-Throughput Solution Structural Analyses by Small Angle X-Ray Scattering ({SAXS)}. Nat. Methods 2009, 6, 606–612. [Google Scholar] [CrossRef] [PubMed]
- Putnam, C.D.; Hammel, M.; Hura, G.L.; Tainer, J.A. X-ray Solution Scattering ({SAXS)} Combined with Crystallography and Computation: Defining Accurate Macromolecular Structures, Conformations and Assemblies in Solution. Q. Rev. Biophys. 2007, 40, 191–285. [Google Scholar] [CrossRef]
- Elgeti, J.; Winkler, R.G.; Gompper, G. Physics of Microswimmers—Single Particle Motion and Collective Behavior: A Review. Rep. Prog. Phys. 2015, 78, 056601. [Google Scholar] [CrossRef]
- Kotlarchyk, M.; Chen, S. Analysis of Small Angle Neutron Scattering Spectra from Polydisperse Interacting Colloids. J. Chem. Phys. 1983, 79, 2461–2469. [Google Scholar] [CrossRef]
- Genzer, J.; Marmur, A. Biological and Synthetic Self-Cleaning Surfaces. MRS Bull. 2008, 33, 742–746. [Google Scholar] [CrossRef] [Green Version]
- Chung, S.; Shin, S.-H.; Bertozzi, C.; Yoreo, J. Self-Catalyzed Growth of S Layers via an Amorphous-to-Crystalline Transition Limited by Folding Kinetics. Proc. Natl. Acad. Sci. USA 2010, 107, 16536–16541. [Google Scholar] [CrossRef] [PubMed] [Green Version]
- Shin, S.-H.; Chung, S.; Sanii, B.; Comolli, L.R.; Bertozzi, C.R.; Yoreo, J.J.D. Direct Observation of Kinetic Traps Associated with Structural Transformations Leading to Multiple Pathways of S-Layer Assembly. Proc. Natl. Acad. Sci. USA 2012, 109, 12968–12973. [Google Scholar] [CrossRef] [PubMed] [Green Version]
- Rad, B.; Haxton, T.K.; Shon, A.; Shin, S.-H.; Whitelam, S.; Ajo-Franklin, C.M. Ion-Specific Control of the Self-Assembly Dynamics of a Nanostructured Protein Lattice. ACS Nano 2015, 9, 180–190. [Google Scholar] [CrossRef]
- Breitwieser, A.; Iturri, J.; Toca-Herrera, J.-L.; Sleytr, U.B.; Pum, D. In Vitro Characterization of the Two-Stage Non-Classical Reassembly Pathway of S-Layers. Int. J. Mol. Sci. 2017, 18, 400. [Google Scholar] [CrossRef] [PubMed] [Green Version]
- Stel, B.; Cometto, F.; Rad, B.; Yoreo, J.J.D.; Lingenfelder, M. Dynamically Resolved Self-Assembly of S-Layer Proteins on Solid Surfaces. Chem. Commun. 2018, 54, 10264–10267. [Google Scholar] [CrossRef] [PubMed]
- Pum, D.; Sleytr, U.B. Reassembly of S-Layer Proteins. Nanotechnology 2014, 25, 312001. [Google Scholar] [CrossRef] [PubMed]
- Whitelam, S. Control of Pathways and Yields of Protein Crystallization through the Interplay of Nonspecific and Specific Attractions. Phys. Rev. Lett. 2010, 105, 088102. [Google Scholar] [CrossRef] [Green Version]
- Horejs, C.; Pum, D.; Sleytr, U.B.; Tscheliessnig, R. Structure Prediction of an S-Layer Protein by the Mean Force Method. J. Chem. Phys. 2008, 128, 65106. [Google Scholar] [CrossRef]
- Jarzynski, C. Nonequilibrium Equality for Free Energy Differences. Phys. Rev. Lett. 1997, 78, 2690–2693. [Google Scholar] [CrossRef] [Green Version]
- Baranova, E.; Fronzes, R.; Garcia-Pino, A.; Van Gerven, N.; Papapostolou, D.; Péhau-Arnaudet, G.; Pardon, E.; Steyaert, J.; Howorka, S.; Remaut, H. SbsB Structure and Lattice Reconstruction Unveil Ca2+ Triggered S-Layer Assembly. Nature 2012, 487, 119–122. [Google Scholar] [CrossRef] [PubMed]
Figure 1.
(a) 3D rendered cryo-TEM image of SbpA the S-layer protein of Lysinibacillus sphaericus ATCC 4525 [9] seen from outside the cell. The S-layer shows square (p4) lattice symmetry. (b) The red square marks the primitive unit cell. The yellow square indicates the model cell and the green rectangle marks the simulation box used in the fluid dynamic simulations. The four-fold symmetry (rotation) axis is drawn as a red upright square. (c) TEM image of a freeze-etched and metal shadowed preparation of a bacterial cell. The S-layer, which is the outermost cell envelope component, shows square lattice symmetry.

Figure 2.
Experimental scattering data, the corresponding pair densities, hull and core models. (a,b) grey lines, Iexp(Q) resemble experimental scattering data of a native SbpA S-layer. Red lines, Ifit(Q) mark best fits. For better visibility, grey lines (raw data) were shifted a little. The corresponding pair densities, p(r), are given by red lines in the inserts. Solid blue and dashed blue lines, P(Q), indicate form factors calculated from the core and hull model via their pair density, p(r), shown in the inserts.

Figure 3.
Coarse graining concept, the box model: Core and hull models are superimposed and then rasterized. The coarse-grained model is given by grey boxes of 1 nm side length.
Figure 3.
Coarse graining concept, the box model: Core and hull models are superimposed and then rasterized. The coarse-grained model is given by grey boxes of 1 nm side length.

Figure 4.
The coarse-grained box model’s refinement. (a) Coarse-grained box model, top (top panel) and side view (lower panel). (b) Each box is weighted by a factor between 0 and 1. The higher the value, the more the individual box contributes to the pair density distribution. Only boxes with weights higher than 0.3 (light red) are shown. Dark red corresponds to weights close to 1. (c) Top panel: pair density (grey line) of the box model (see insert). Bottom panel: pair density (red line) of the weighted box model. The dashed grey line represents pair density that gives the best fits to the experimental scattering data.

Figure 5.
The Navier–Stokes flow profile. The 3D model of SbpA was collapsed to 2D. Red squares mark stiff regions within the S-layer placed at the bottom of a 1 by 6 a0 simulation box, a0=13 nm. Velocities were kept zero at z = 0 and z = 6 a0. Periodic boundary conditions were imposed in the x-direction. (a–e) The results of the Navier–Stokes equation are summarized. (a) Line integrals represent the velocity field u; (b) blue and red lines mark low and high vorticity, ; (c) the color-coded line gives the average vorticity over a unit cell; and (d) the pressure, , and (e) the average pressure, , are given.

Figure 6.
Negative (blue) and positive (red) charges are distributed at the edges of red squares. Based on the distribution, the Poisson equation is solved. At the edges of the red squares and the edges at z = 0 and z = 6∙a0, the potential is set to zero. Periodic boundary conditions are specified in the x-direction. (a) The potential, and (b) the average potential, are calculated. (c) Line integrals represent the electric field, , (d) absolute value of the electric field, , and (e) the average total weight of the electric field, .

Publisher’s Note: MDPI stays neutral with regard to jurisdictional claims in published maps and institutional affiliations. |
© 2021 by the authors. Licensee MDPI, Basel, Switzerland. This article is an open access article distributed under the terms and conditions of the Creative Commons Attribution (CC BY) license (https://creativecommons.org/licenses/by/4.0/).
Share and Cite
MDPI and ACS Style
Tscheliessnig, R.; Breitwieser, A.; Sleytr, U.B.; Pum, D. Crystalline S-Layer Protein Monolayers Induce Water Turbulences on the Nanometer Scale. Crystals 2021, 11, 1147. https://0-doi-org.brum.beds.ac.uk/10.3390/cryst11091147
AMA Style
Tscheliessnig R, Breitwieser A, Sleytr UB, Pum D. Crystalline S-Layer Protein Monolayers Induce Water Turbulences on the Nanometer Scale. Crystals. 2021; 11(9):1147. https://0-doi-org.brum.beds.ac.uk/10.3390/cryst11091147
Chicago/Turabian StyleTscheliessnig, Rupert, Andreas Breitwieser, Uwe B. Sleytr, and Dietmar Pum. 2021. "Crystalline S-Layer Protein Monolayers Induce Water Turbulences on the Nanometer Scale" Crystals 11, no. 9: 1147. https://0-doi-org.brum.beds.ac.uk/10.3390/cryst11091147
Note that from the first issue of 2016, this journal uses article numbers instead of page numbers. See further details here.