1. Introduction
Stationary gas turbines, as used in gas power plants, can be started from cold to a maximum output in less than 30 min [
1]. Due to this short start-up time, gas power plants are able to react to shortages in the electricity supply caused by volatile feed in of renewables energies and can stabilize the electricity grid in times of high demand. Due to frequent start-up, shut down and load changes, the components in the hot gas section, especially the turbine blades and vanes undergo high mechanical and thermal loads, which has to be considered in the design process. Current design paradigms are based on deterministic lifetime approaches, which lead to conservative designs and inefficient component geometries caused by high safety factors. In recent years, these deterministic approaches were successfully replaced by probabilistic approaches, which are based on the statistical distribution of factors, which affects the high temperature fatigue life of the considered materials [
2,
3,
4].
Polycrystalline nickel-based superalloys are widely used in the rear hot gas section as blades and vanes. Due to the casting manufacturing process and the component geometries, large grains with diameters up to 3–4 mm can form in areas where high loads appear during operations. Experimental strain controlled high temperature fatigue tests of nickel-base superalloys with large grains, i.e., low grain numbers in the gauge sections, show significantly large scatter in the lifetime as well as in the mechanical properties. As shown by several authors, the scatter in fatigue life and mechanical properties can be mainly attributed to two characteristics, the local grain orientation and the low amount of grains. Nickel-based superalloys show a high elastic anisotropy factors up to 2.7 [
5]; therefore, the local orientation distribution of the grains within the gauge section have a significant influence on the elastic response of the component. This leads, in combination with the low amount of grains, to a non-averaging of mechanical properties as known for isotropic materials. For example, some austenitic steels show higher elastic anisotropies [
6,
7], but due to significantly smaller grains known for stainless steels, mechanical properties are averaging over the high amount of grains, and the macroscopic material behaviour can be classified as isotropic.
Furthermore, the local grain orientation influences the local plastic behaviour. If a critical shear stress within the slip systems of the grain is exceeded, dislocations start moving within the slip systems, which represents plastic deformation. For a face-centred crystal structure (fcc), such as nickel, slip mainly occurs preferably in one of the 12 slip systems of the type {111}[110], which are composed of four closed packed planes together with three close packed directions. As proposed by Schmid [
8], the resulting shear stress within a slip system can be calculated by the product of the cosines of slip system direction and slip system plane (the so-called Schmid factor m) related to the loading direction and the applied normal load. Numerical investigations showed for 100,000 randomly orientated fcc single crystals, the minimum possible Schmid factor under normal loading is 0.28, which occurs only with a probability of 0.032%. The highest and also most frequently occurring Schmid factor is 0.5, which occurs with a probability of 16.4%. On average, the Schmid factor is calculated to 0.45 ± 0.041 for a single grain under uniaxial loading [
9]. Seibel, Schmitz et al. [
10,
11] could significantly decrease the occurring scatter in a total strain Wöhler diagram for polycrystalline nickel-based superalloy Rene80, by determining the Schmid factor of the crack initiating grains using electron backscatter diffraction (EBSD), estimating the resulting shear stress and representing it over the lifetime. Further experimental and analytical investigations showed that with the usage of the product of the Young’s moduli (E) and the Schmid factor (m) the so-called E∙m value, predictions can be made in which grains plastic deformations concentrates. These grains tends to form persistent slip bands and provide crack initiations as shown in [
12]. With the usage of polycrystalline finite element models and calculations of resulting shear stresses within the slip system, it could be proven that different orientation distribution within the materials can lead to improvements of the mechanical properties [
13]. For smooth specimen made of random orientated coarse grain nickel-based superalloy Rene80 Young’s moduli were in general higher compared to smooth specimen made from the same material batch but with a determined crystallographic texture (resulting from the casting process). In addition to lower Young’s moduli and therefore lower stresses for tests under total strain control (compared to the random orientated material), the texture of the grains also leads to a shift of the Schmid factor distribution to lower values. This leads to lower resulting shear stresses in the slip systems and therefore to a delay in crack initiation and therefore longer lifetimes. Based on these findings, a probabilistic lifetime models for both variants of the material could be developed with a great accordance to observed experimental results. The same material batch, as discussed before, was investigated in [
14] but for notched specimen. Contrary to all expectations, the material with the crystallographic texture didn’t show any improvements in lifetime or mechanical properties. This can be attributed to the interaction of varying stress states along the notch with the crystallographic texture, which lead to high stiffness along the notch area, which increases the local stresses and shear stresses [
15].
All above mentioned numerical researches were conducted using anisotropic elastic material models were calculated up to the point where the elastic resulting shear stress within the slip systems reaches a critical value and plastic deformation starts. The following paper investigates how local grain orientation also affects the plastic behaviour of polycrystalline nickel-based superalloys by numerical simulation. Specifically, the influence of different orientation distributions on the local and global onset of plasticity as well as the interaction of grains will be investigated.
3. Results
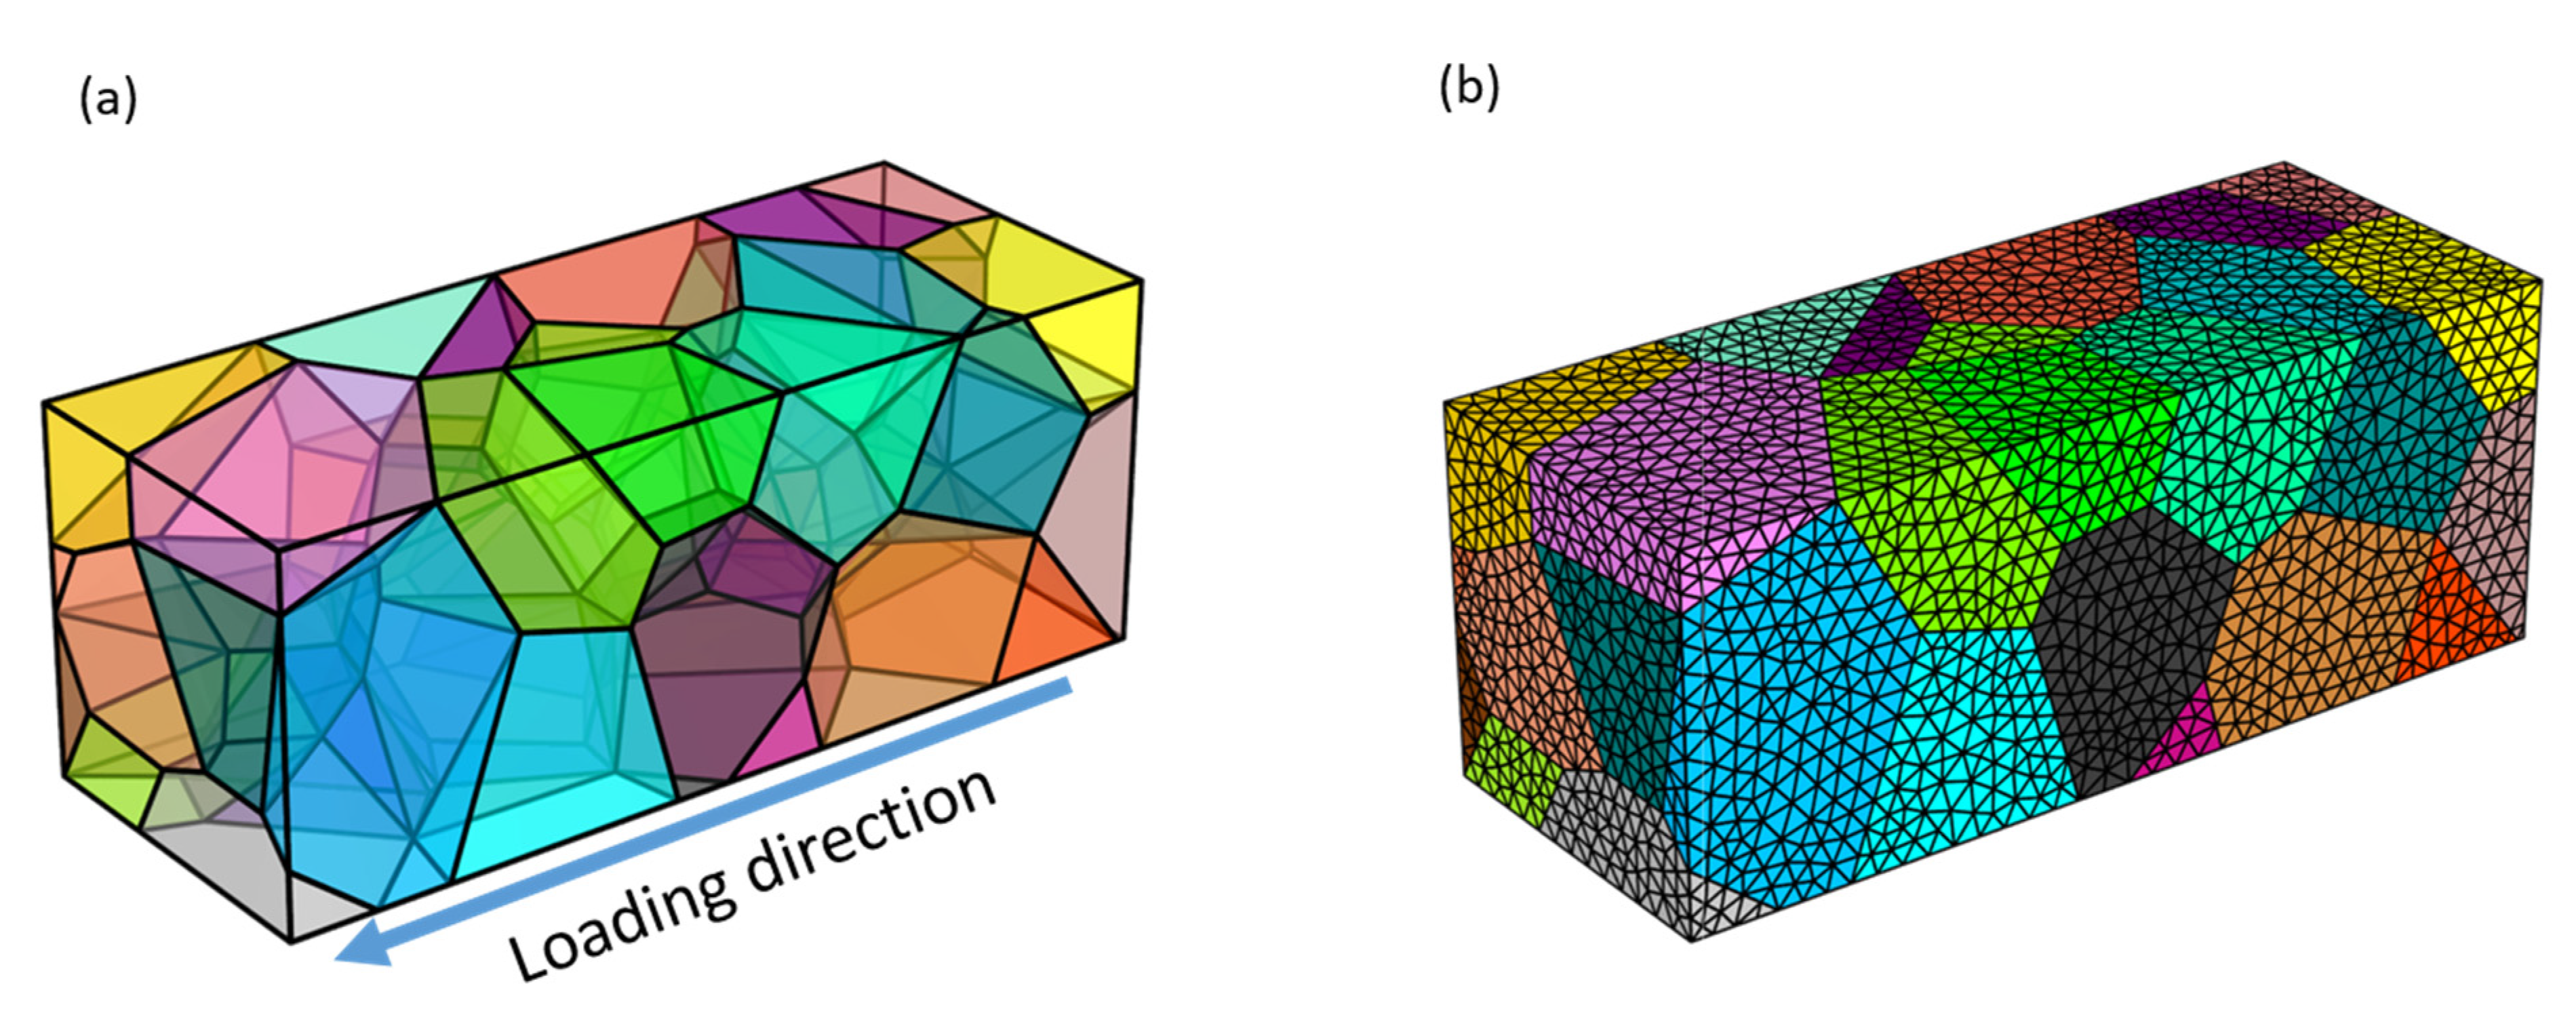
Figure 4 shows the macroscopic stress-strain curves, i.e., the mechanical response of the whole model (see
Figure 2) for a uniaxial load in dependence of the different orientation distributions. The yield point is indicated with
x for each curve whereby it was defined as the point at which the simulated elastic stress (based on the Hooke’s law) differs by more than 5% from the simulated elastic-plastic results.
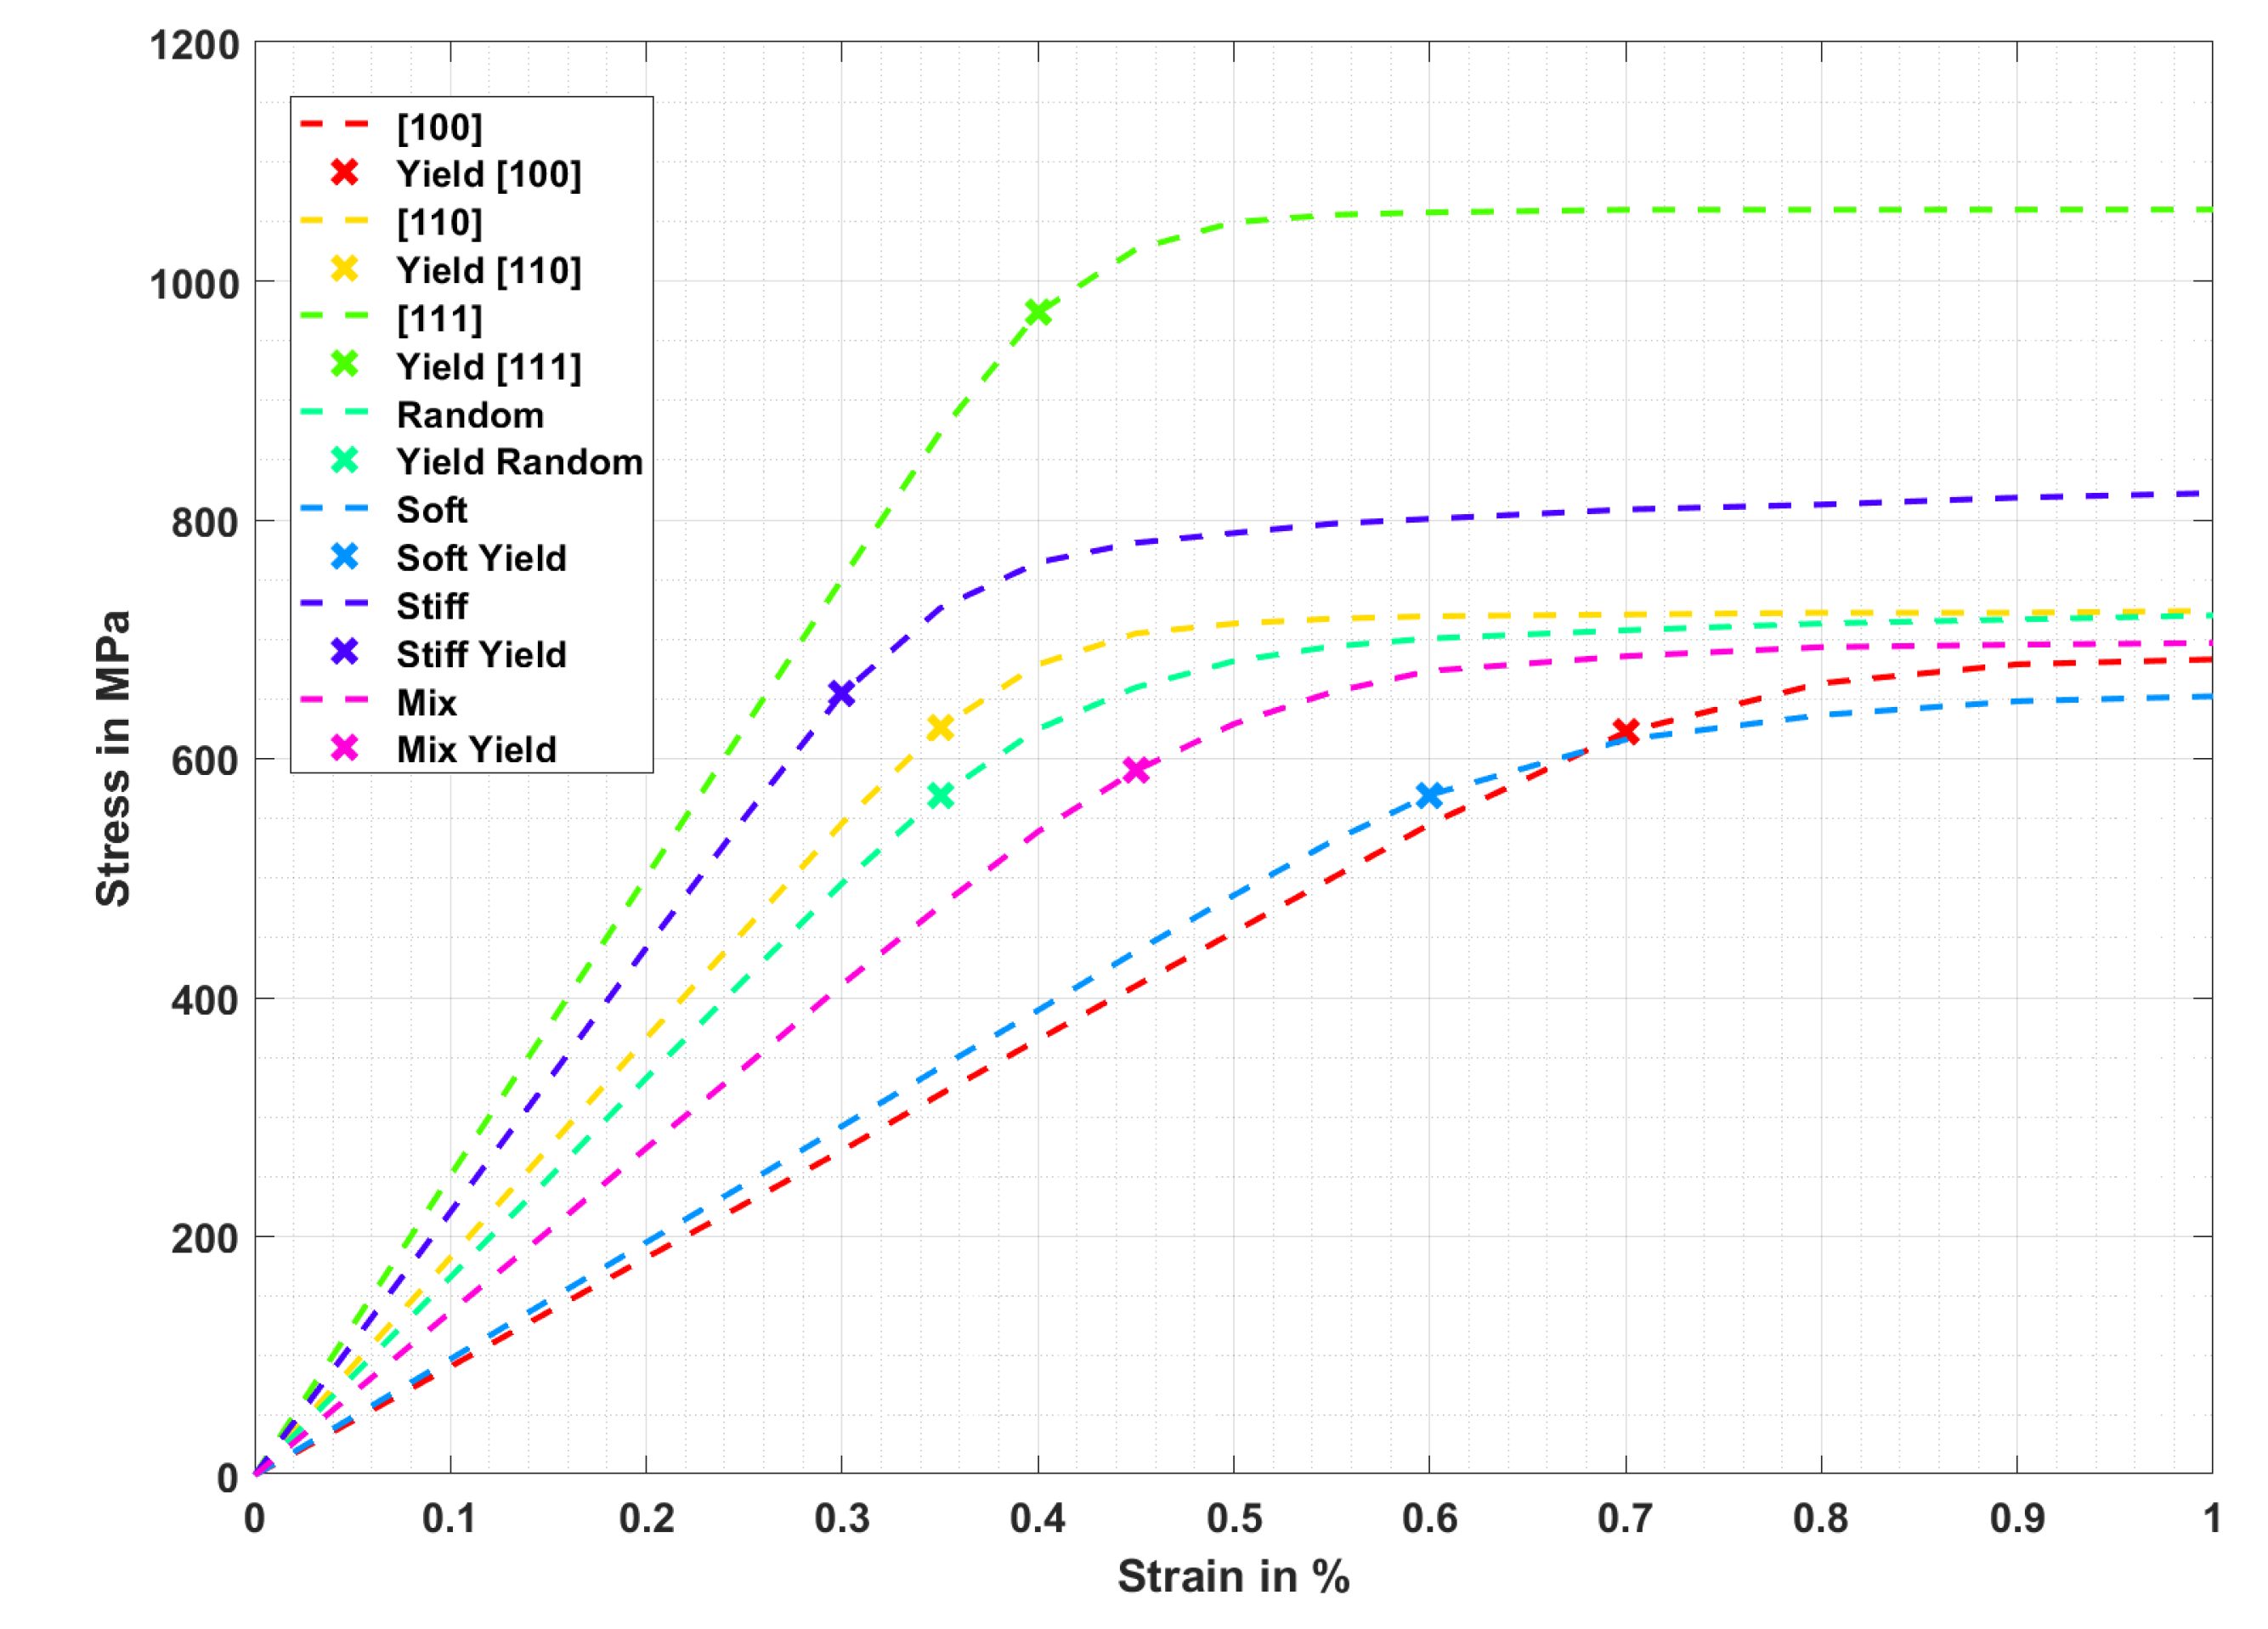
The overall stress-strain curves comparison shown in
Figure 4 shows a significant scatter within the elastic regions. The detailed results for each curve is listed below:
For the [100] orientation distribution the lowest Young’s moduli of 91.19 GPa can be found. The yield point is reached at 622 MPa with an elastic strain of 0.7%.
For the soft orientation distribution, which slightly differs from the [100] orientation distribution (see
Figure 3), the Young’s moduli is marginal higher with 97.58 GPa. However, yield is distinct lower and reached at 568 MPa and a related elastic strain of 0.6%.
Highest Young’s moduli is reached for the [111] orientation distribution with 250.45 GPa and yield at 973 MPa with an elastic strain of 0.4%.
The stiff orientation distribution reaches yield first, i.e., shows lowest elastic strain compared to all other investigated orientation distributions. Besides a quite high Young’s modulus of 220.37 GPa, yield is reached at 0.3% with a yield stress of 655 MPa.
The [110] orientation distribution as well as the random orientation distribution show same elastic strains at the yield point with 0.35%. But due to slightly higher Young’s modulus for the [110] orientation distribution with 182.67 GPa, the yield stress is also slightly higher with 625 MPa.
In order to consider the influence of random orientation distributions and the resulting scatter, six simulations were statistically evaluated, where the average stress-strain curve is shown in
Figure 4. For the random orientation distribution, the Young’s modulus is 163.8 ± 4.8 GPa and yield stress is reached at 561.63 ± 15.17 MPa.
The mix orientation distribution shows a Young’s modulus of 136.37 GPa and yields at 590 MPa and 0.45% total strain.
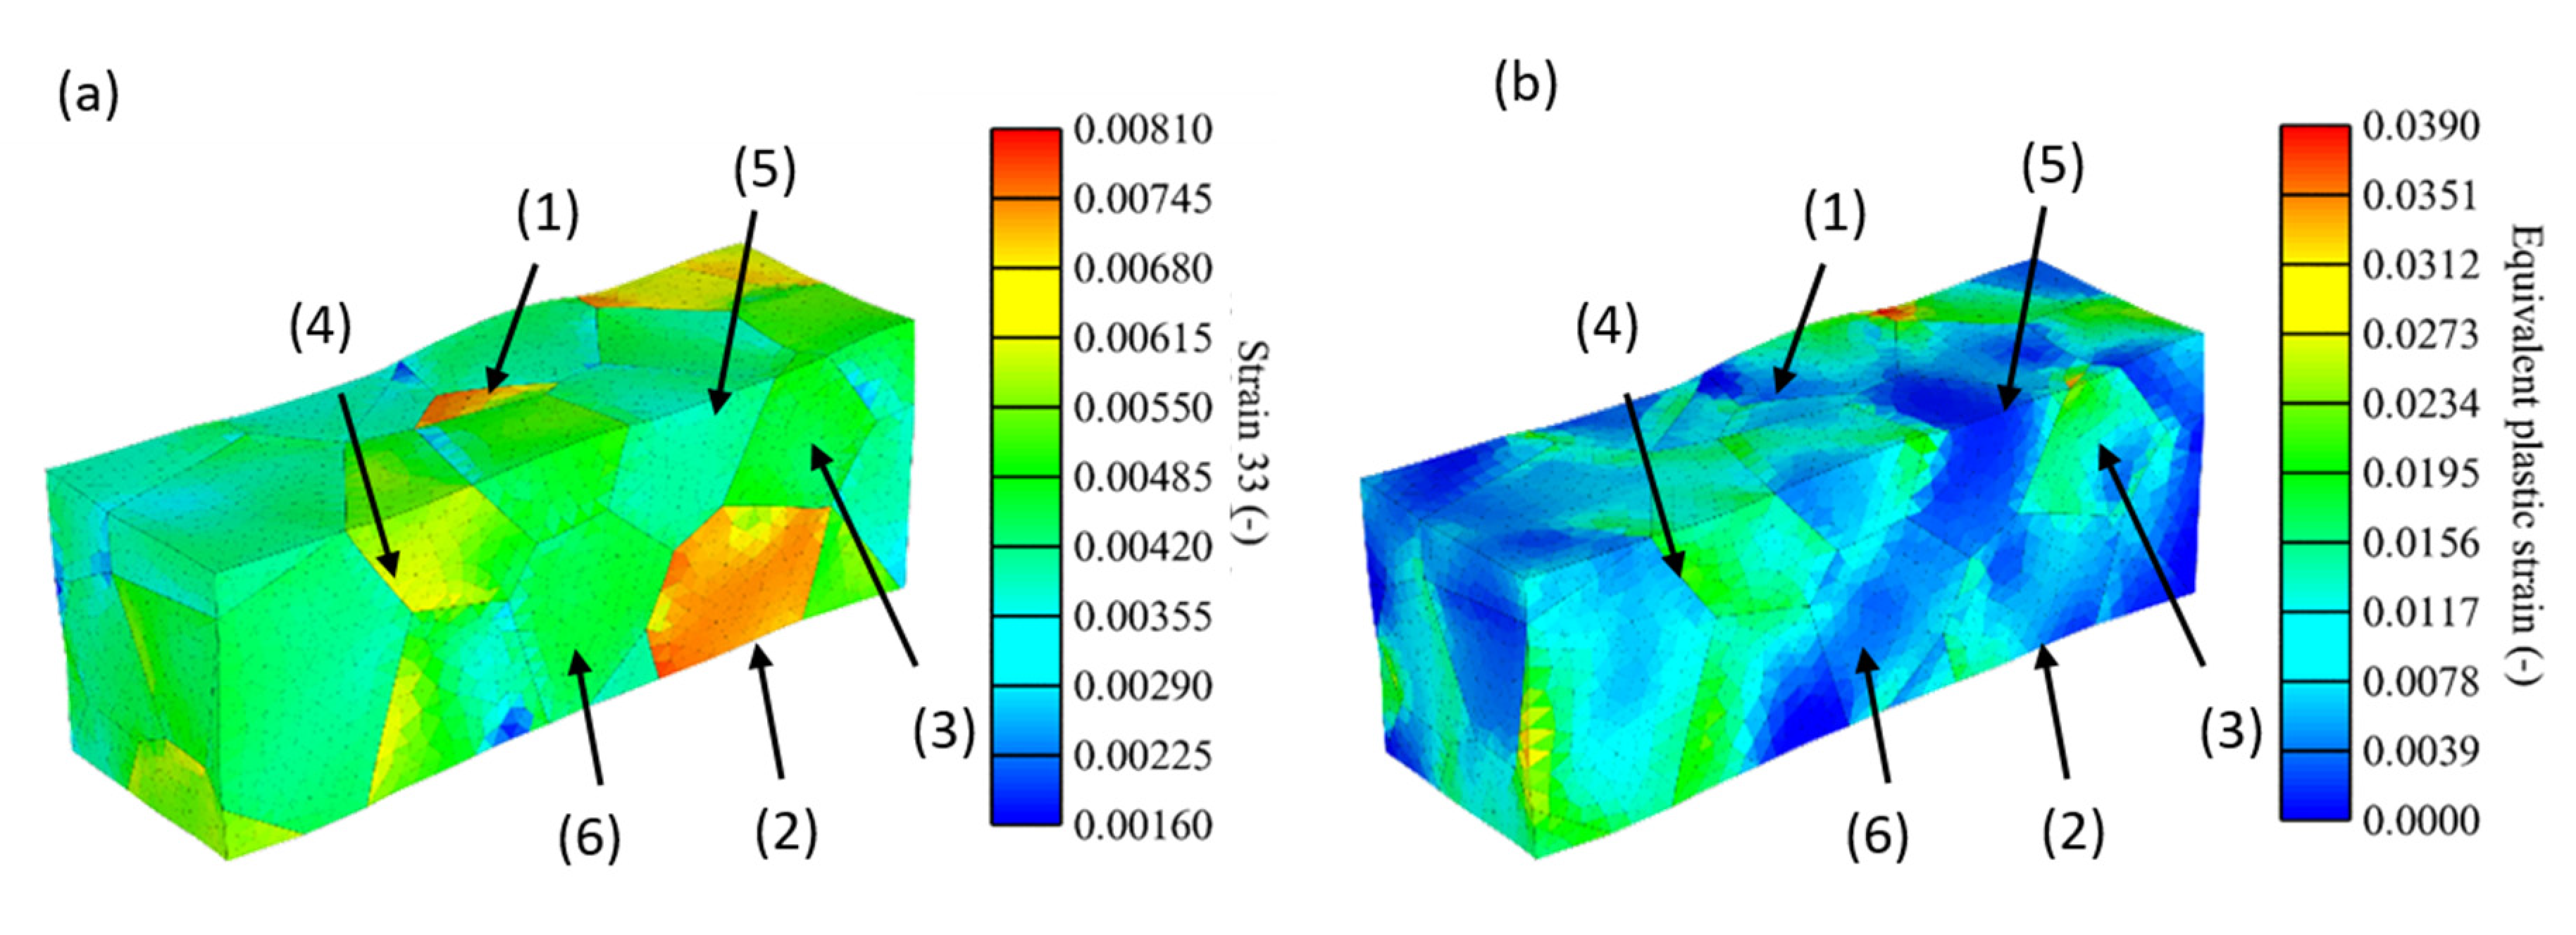
Figure 5 shows the local elastic strain in the loading direction as well as the equivalent plastic strain for a simulated specimen with a random grain orientation at 1% total strain (turquoise curve, see
Figure 4).
The elastic strain distributions in loading direction are inhomogeneous, where some grains show significantly higher elastic strains compared to others. Interestingly, these high elastic strain grains show low equivalent plastic strains as seen at grain (1) and (2) in
Figure 5b. Higher plastic strains have been observed in grains that show intermediate elastic strains, as demonstrated by grain (3). Grain (4) shows both, high local elastic strain as well as high equivalent plastic strain, whereas grain (5) and (6) see intermediate elastic strains, but almost negligible equivalent plastic strain.
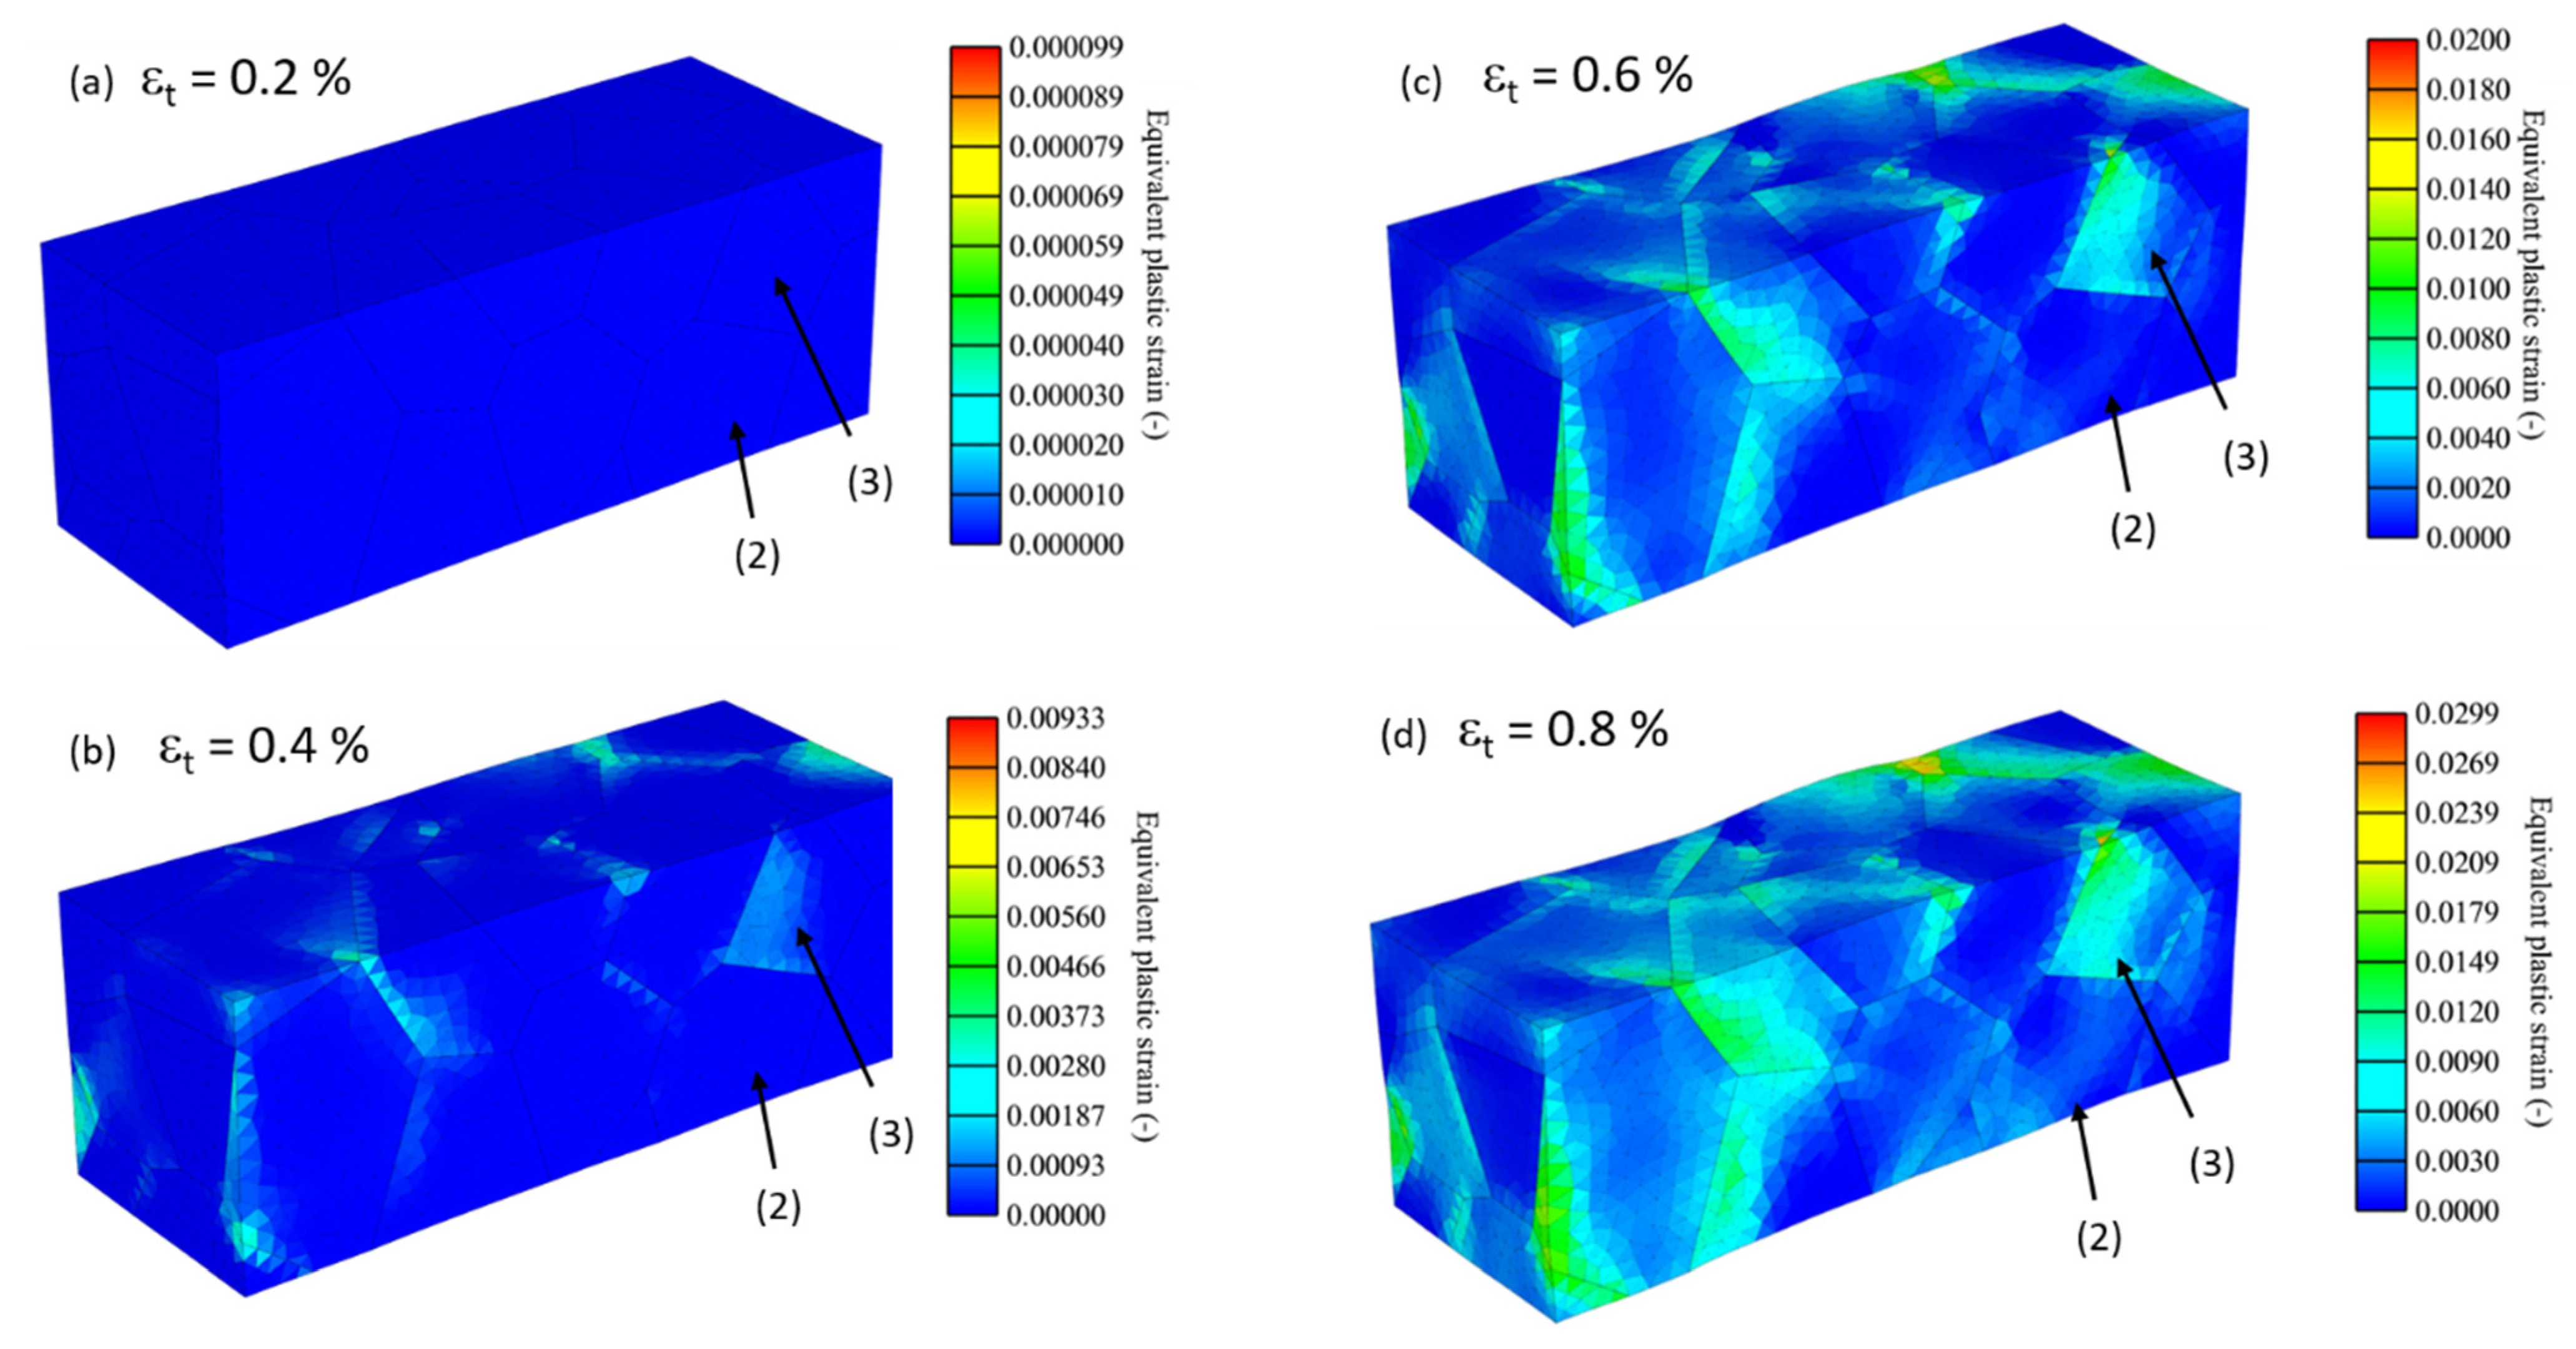
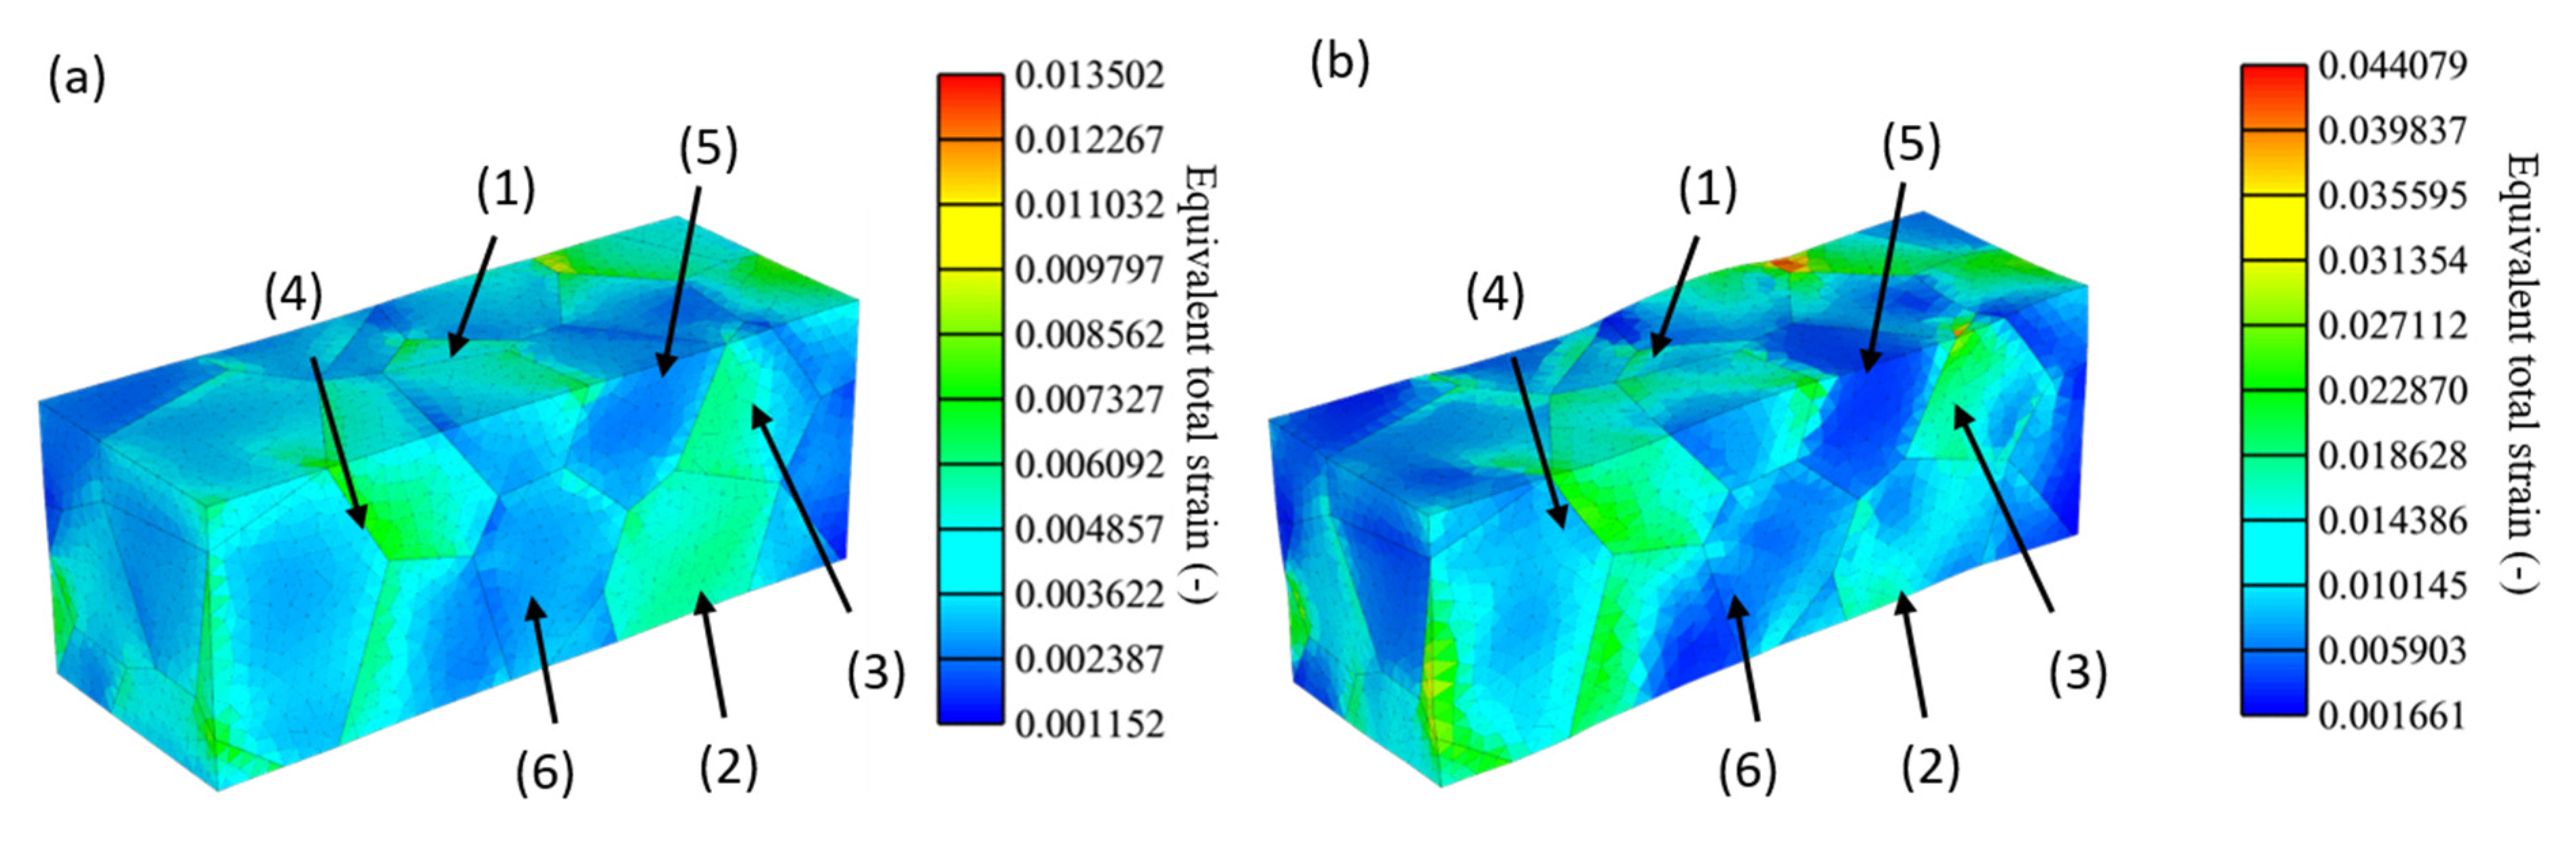
Figure 6 shows the distribution and development of equivalent plastic strain for the specimen shown in
Figure 5, at 0.2%, 0.4%, 0.6% and 0.8% of total strain.
For a total strain of 0.2%, no plastic strain within the whole material can be determined. At a total strain of 0.4% some plastic deformation can be seen to occur at some grain boundaries. At this strain, the previously discussed grain (2) displays no plastic deformation, whereas grain (3) already does. Plastic deformation continues to increase as the total strain increases to 0.6% and grain (2) still shows only minor plastic deformation. For a total strain of 0.8% grain (2) show slightly increased plastic deformation whereas for grain (3) plastic strain is significantly increased.
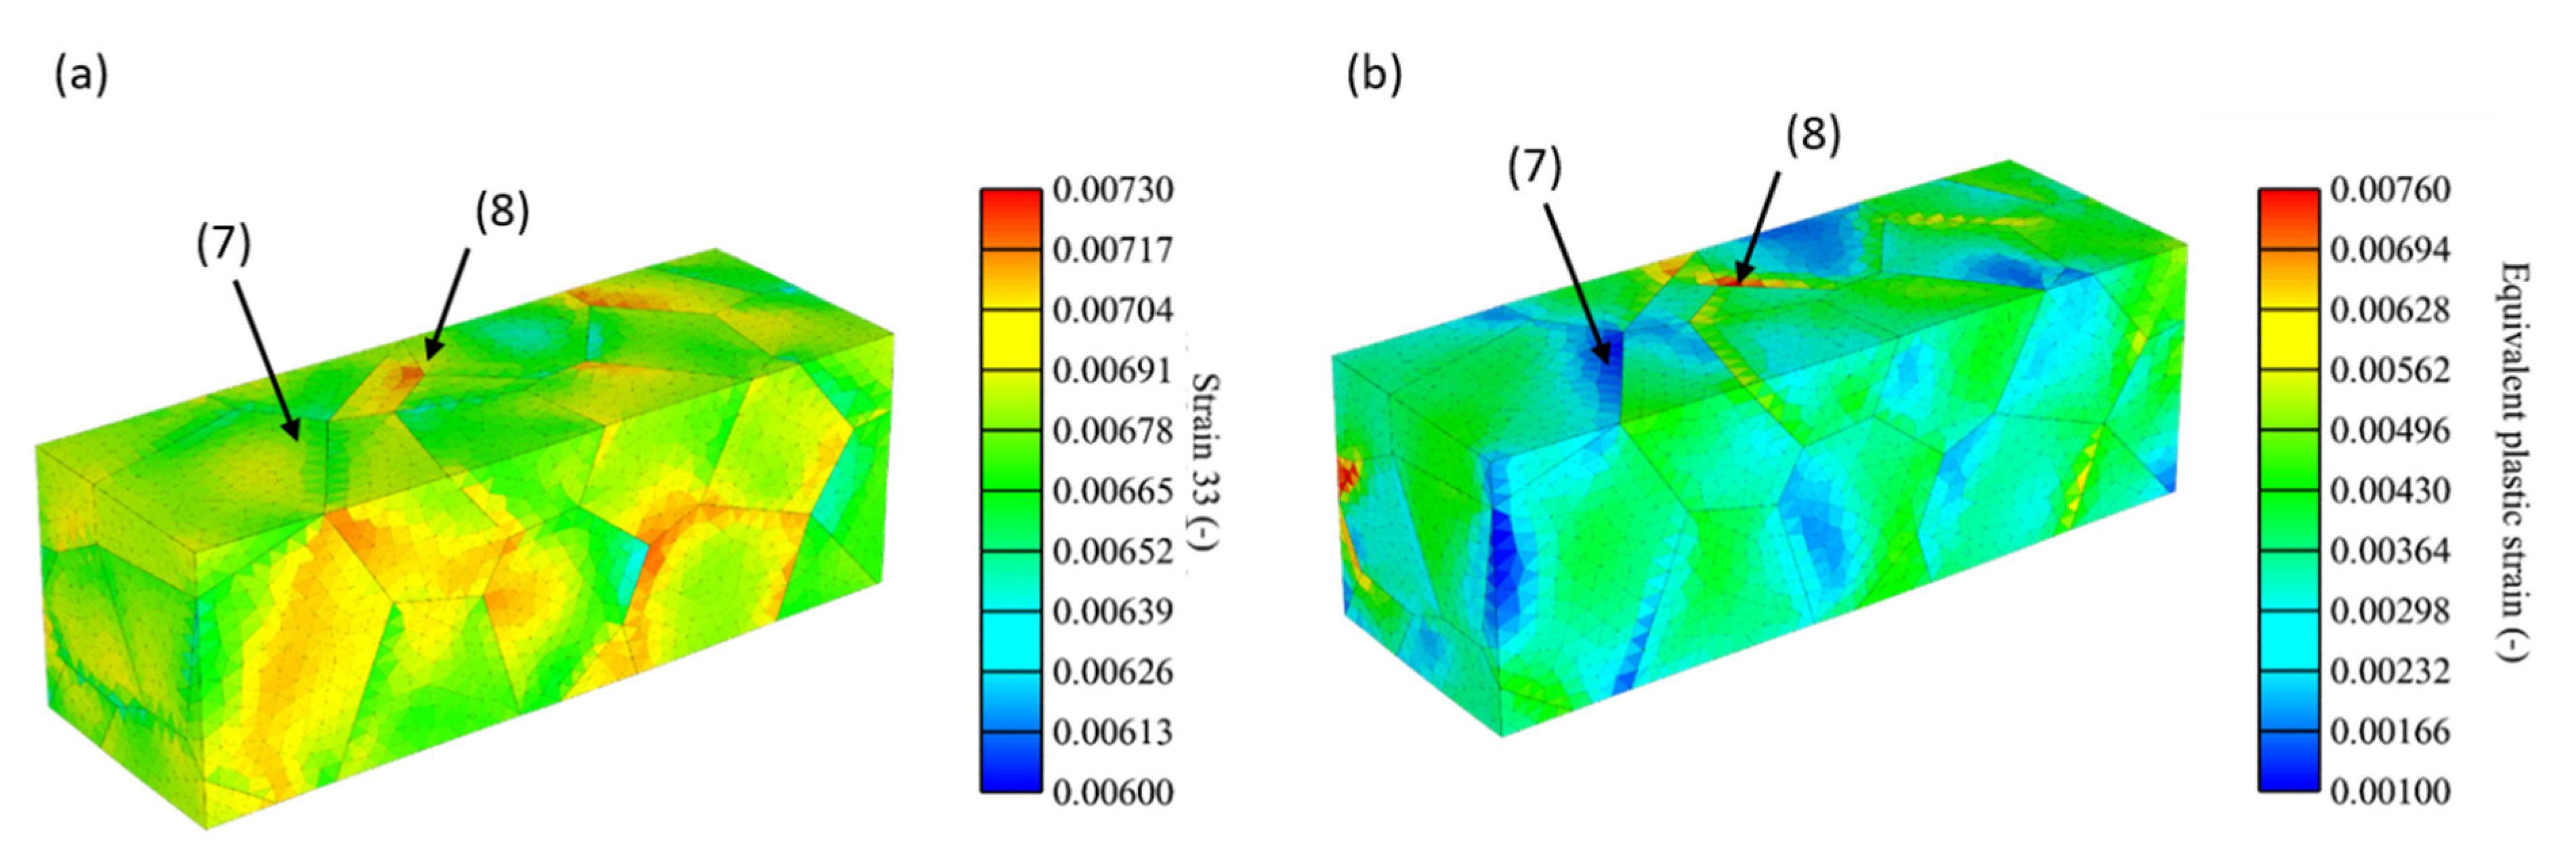
Figure 7 shows the distribution of elastic strain in the loading direction and the equivalent plastic strain for a simulated specimen with the soft orientation distribution at 1% of total strain (light blue curve, see
Figure 4).
The results shown in
Figure 7 for a specimen with soft orientation distribution, show a much more homogeneous distribution of high elastic strains within the material (see scale range), compared with the previous shown specimen. This leads to an approximately uniform distribution of equivalent plastic strains with small areas of slightly increased equivalent plastic strain (see grain (8)) or slightly decreased equivalent plastic strain (see grain (7)). The small deviations arise from similar but not equal grain orientations (see pole figure in
Figure 3a).
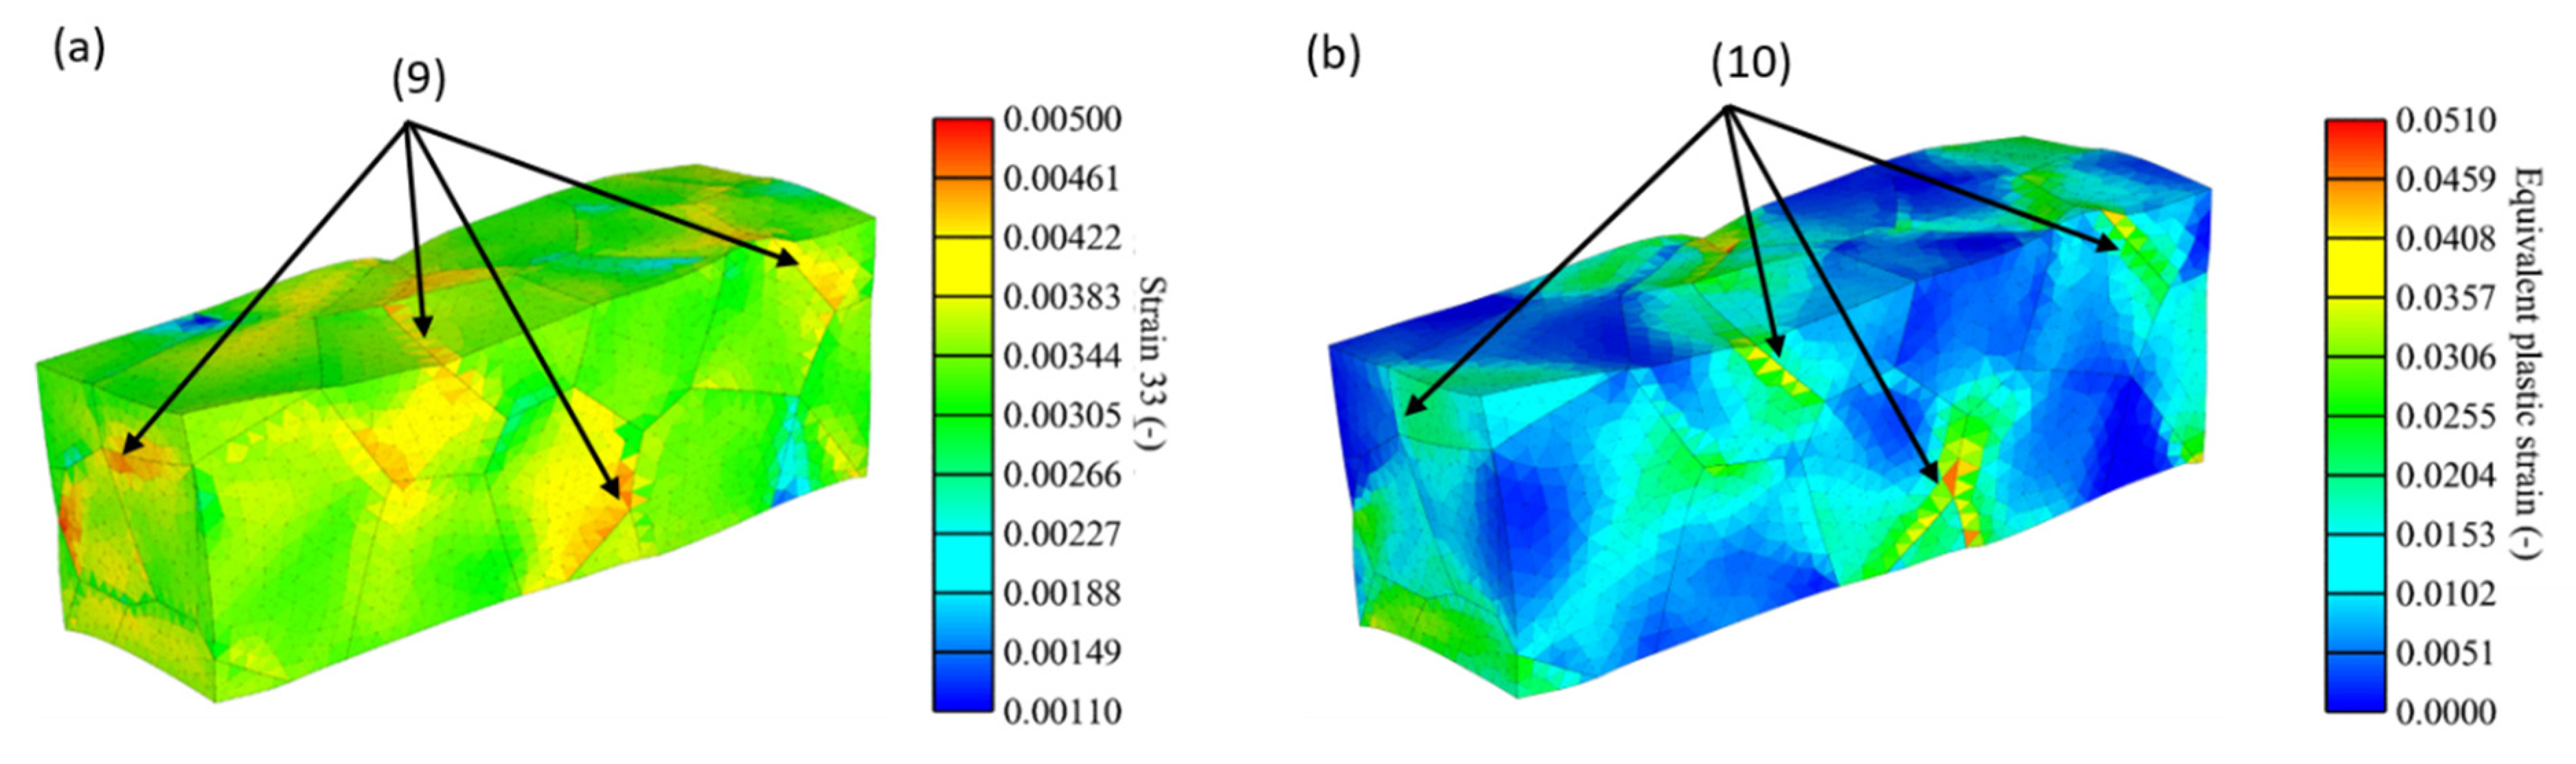
A contrary behaviour can be seen for the stiff orientation distribution in
Figure 8 (see blue curve in
Figure 4). The elastic strains are in general much smaller compared to the soft orientation distribution and high values are occasionally located at grain boundaries as the grains (9) shows.
According to
Figure 8b and the grains indicated with (10), it appears that highest plastic deformations mostly occur close to grain boundaries and decline into the grain. Areas which show high elastic strains also show high equivalent plastic strains. As the simulation also shows, high multi-axial deformation is added to the stiff specimen during a simulated uniaxial test.
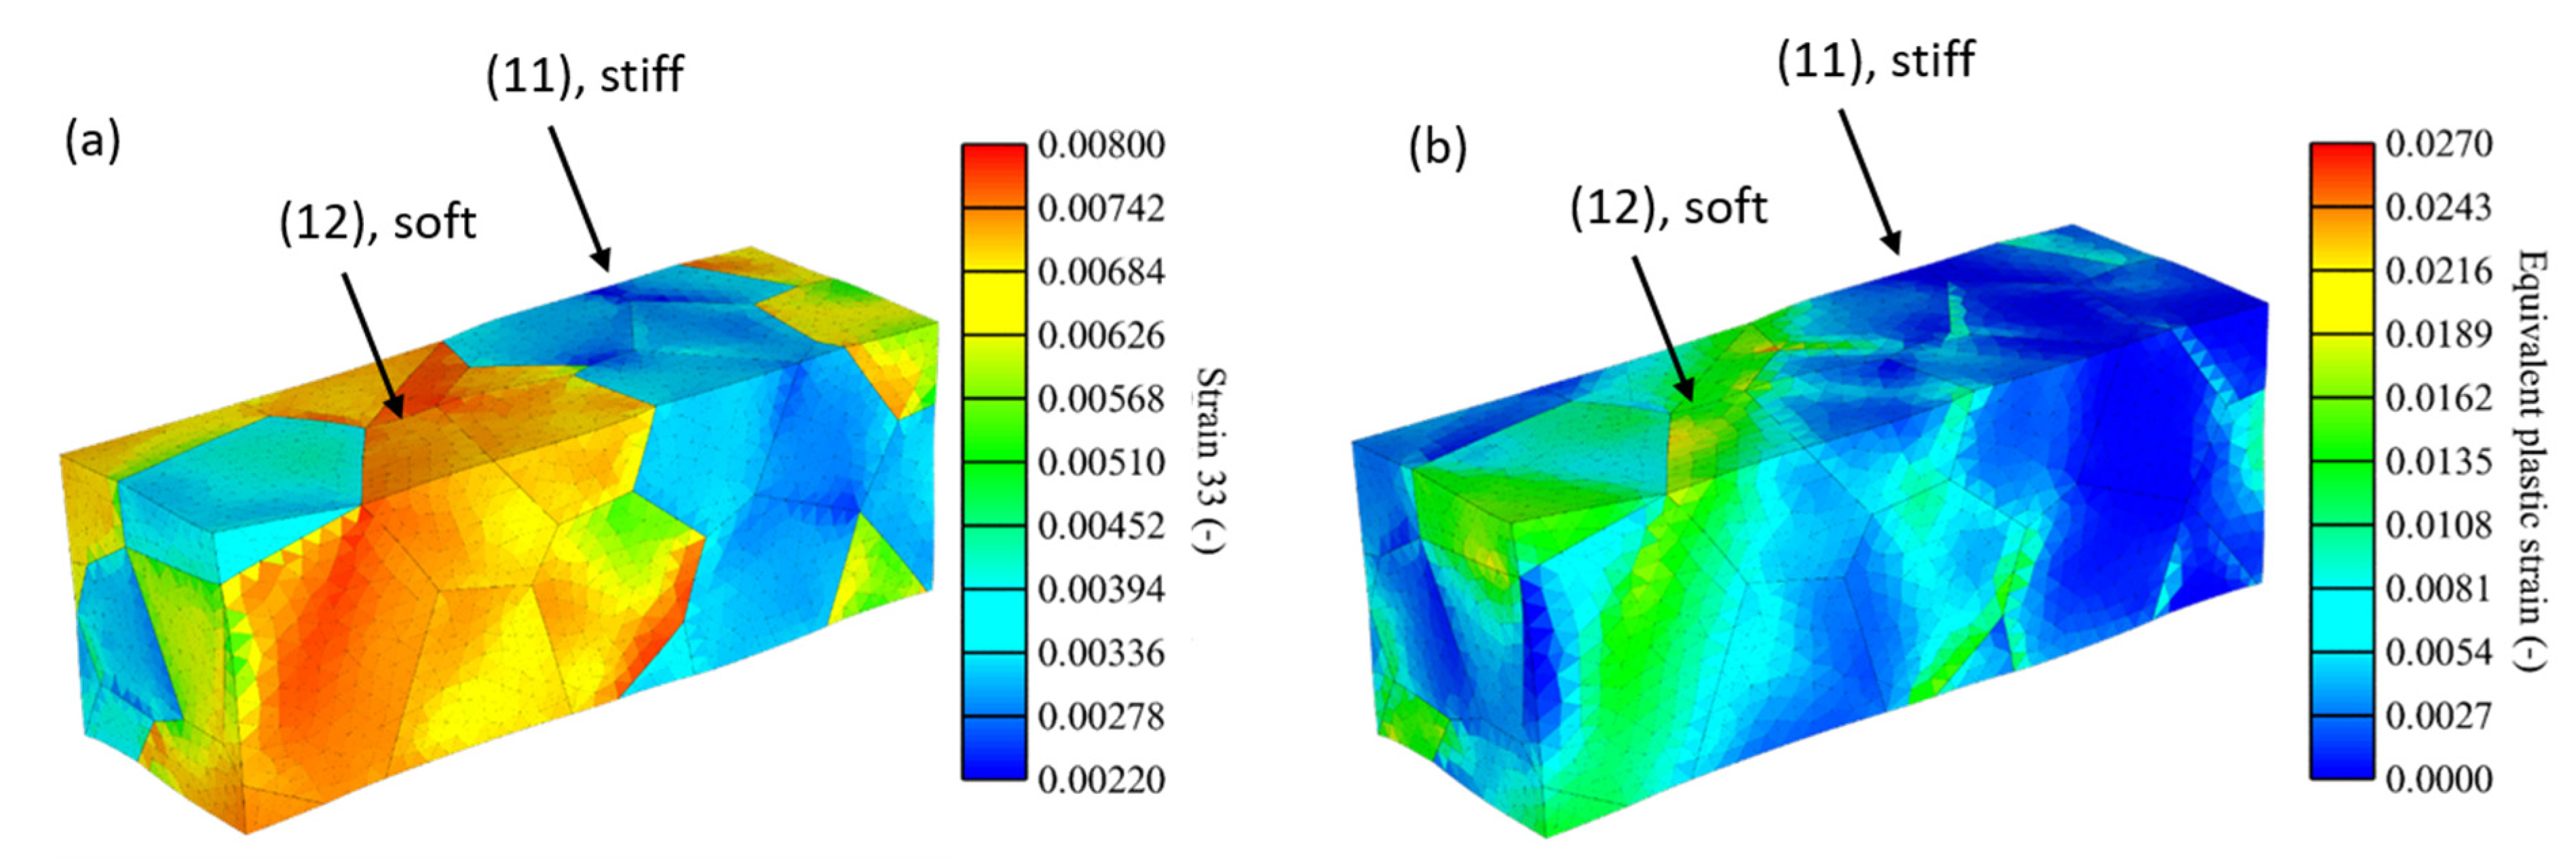
Figure 9 shows the results for the mix specimen under a total strain of 1%. It should be noted here that the first 25 grains have a stiff orientation distribution whereas the last 24 show a soft orientation distribution (if counted from the right).
The elastic strains in the soft part of the specimen (12) are significantly higher compared to the stiff orientated part (11), which is caused by the grain orientation and their associated low Young’s moduli. However, the soft part shows significantly larger equivalent plastic strains as compared to the stiff part.
4. Discussion
The stress-strain curves, shown in
Figure 4, represent what was already assumed in the
model. Even if the [100] and the soft orientation distribution show similar Young’s moduli (see
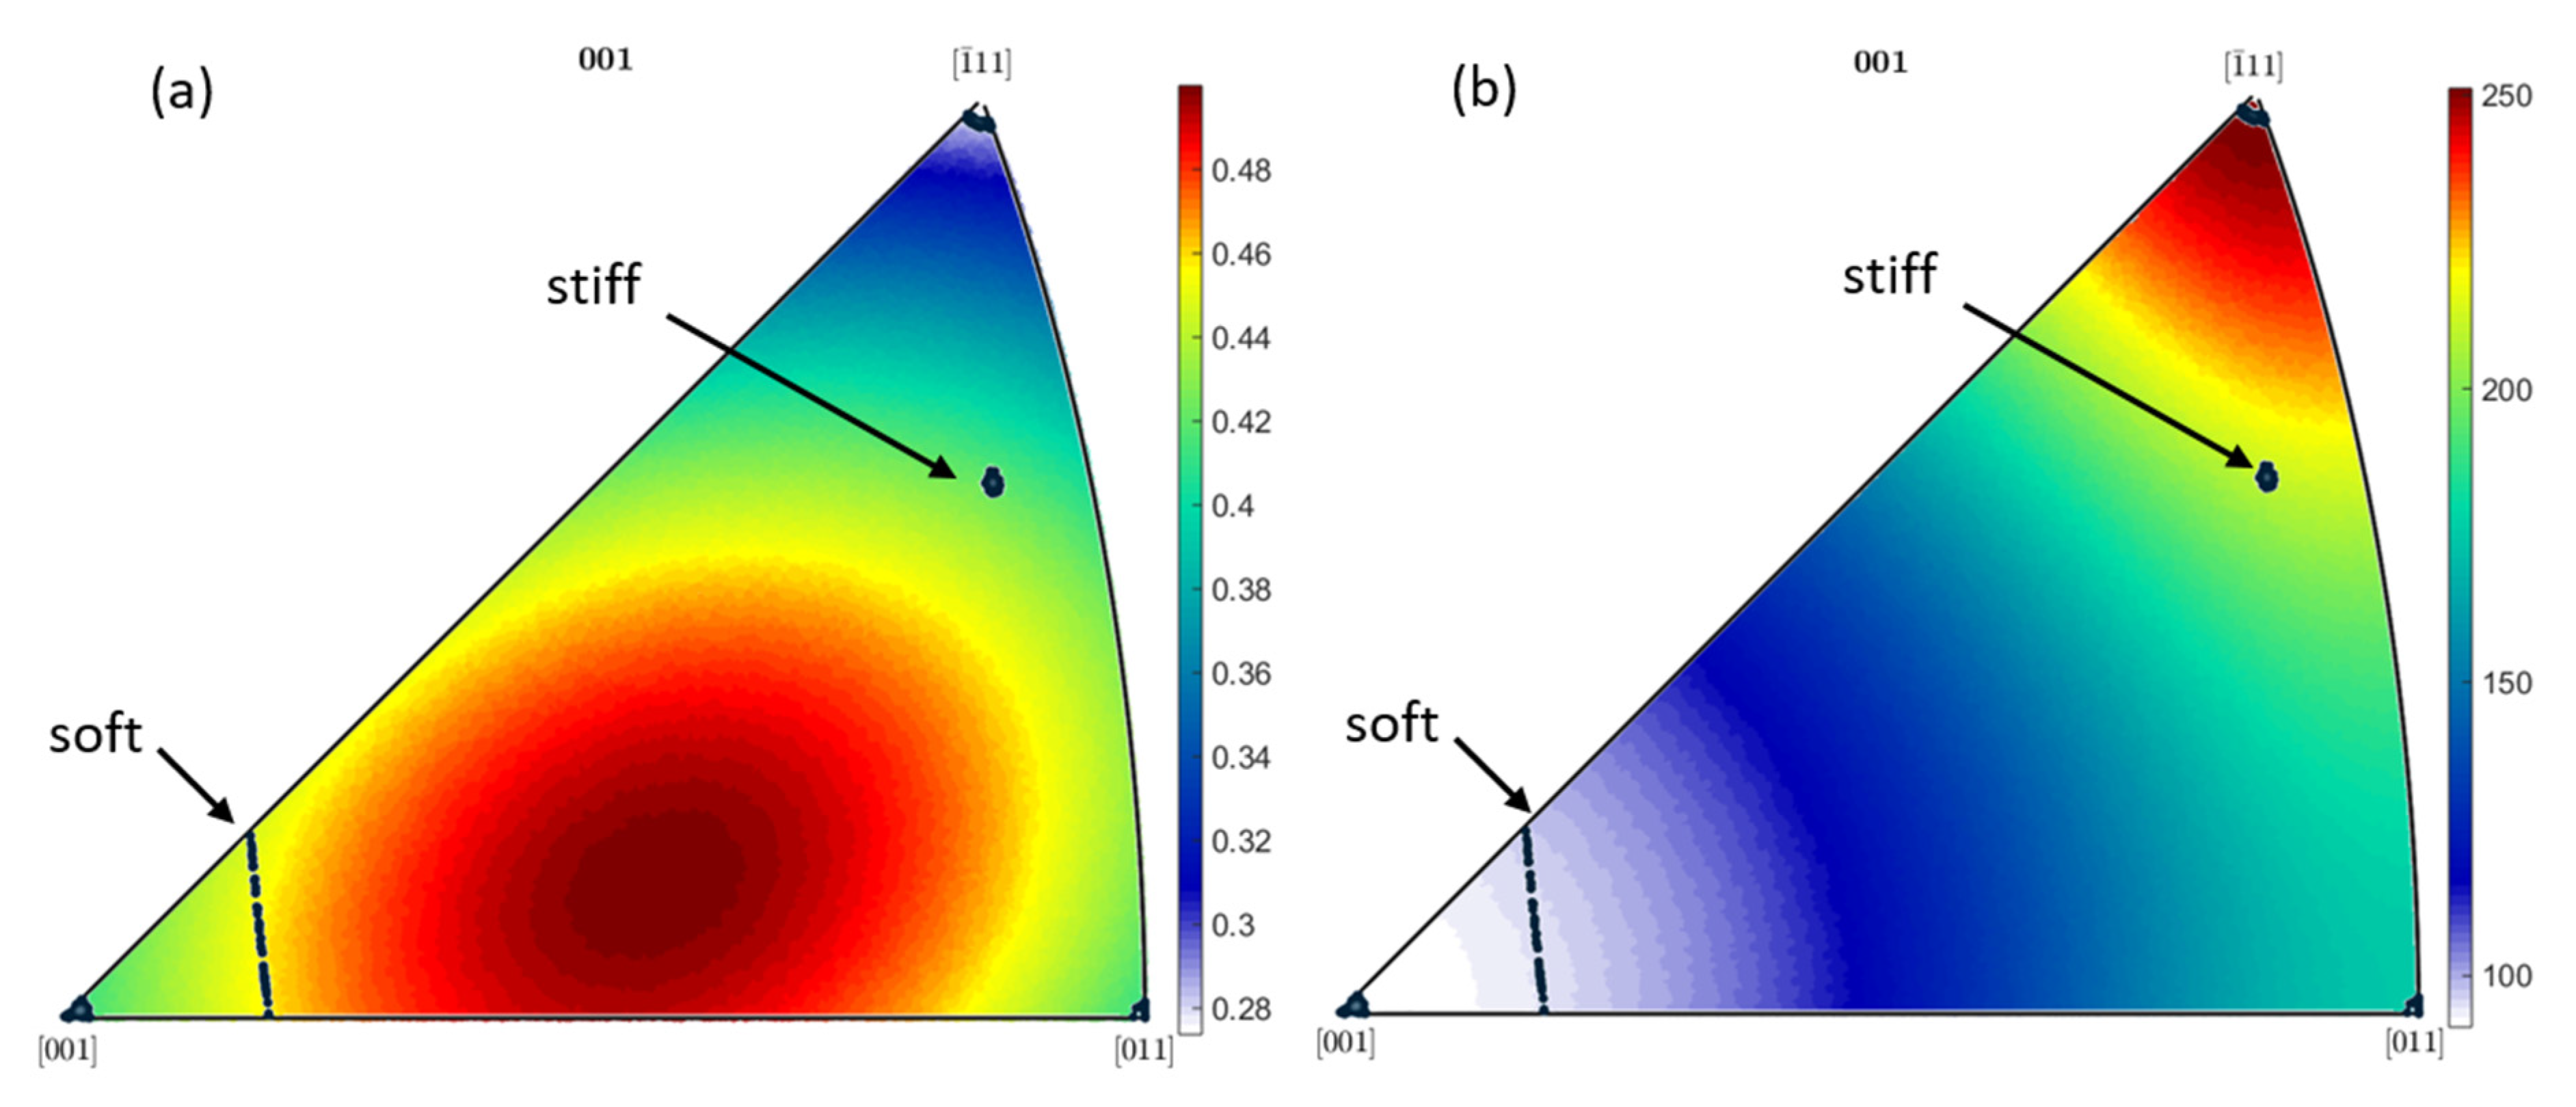
Figure 10b), their yielding behaviour is different. This is due to the case that the [100] close orientations show average Schmid factors of 0.412 ± 0.0019, whereas the soft orientation distribution shows distinct higher average value for the Schmid factor of 0.455 ± 0.0036, as
Figure 10a represents. The slightly increased Young’s moduli together with higher Schmid factors for the soft orientation distribution leads to average
values of 43.57 ± 0.023 and thus leads to earlier plastic deformation at the same strains as for the [100] orientation distribution with average
values of 37.65 ± 0.1834.
Comparing the stiff and the [111] orientations distributions also shows an interesting behaviour. For the [111] orientation the space diagonal of a unit cell of the investigated nickel-based superalloy aligns with the loading direction and shows a global maximum in Young’s moduli with about 250 GPa. Despite the fact that the stiff orientation has a lower Young’s moduli of 220 GPa it yields at significantly lower strains (see blue curve,
Figure 4). Also in this case the Schmid factor distribution is the important factor. For orientations close to the [111] direction, Schmid factor shows a global minimum with average Schmid factors of 0.284 ± 0.0015, whereas the stiff orientation distribution shows average Schmid factors of 0.421 ± 0.0016. However, if both Young’s moduli and Schmid factor are considered in combination within the
model, it becomes apparent that the stiff orientation distribution leads to a global maximum in
with 88.09 ± 0.038 as shown in
Figure 3.
Thus, it follows that the stiff orientation distribution globally shows lowest elastic strain, i.e., start to plastic deform as first, compared to other orientation distributions, although this distribution doesn’t show maxima in Schmid factor neither in Young’s modulus. First as a combination in the model, it becomes obvious why the stiff orientation distribution shows the explained behaviour. A comparison of the stiff orientation distribution and its Schmid factor distribution with 0.421 ± 0.0016 and the soft orientation distribution and its Schmid factor distribution with 0.455 ± 0.0036 also reveal the fact that a higher Schmid factor doesn’t necessarily lead to higher shear stresses, as it could possibly be assumed. Moreover, the Young’s moduli has also to be considered to make reliable statements about the occurring shear stress within the slip systems.
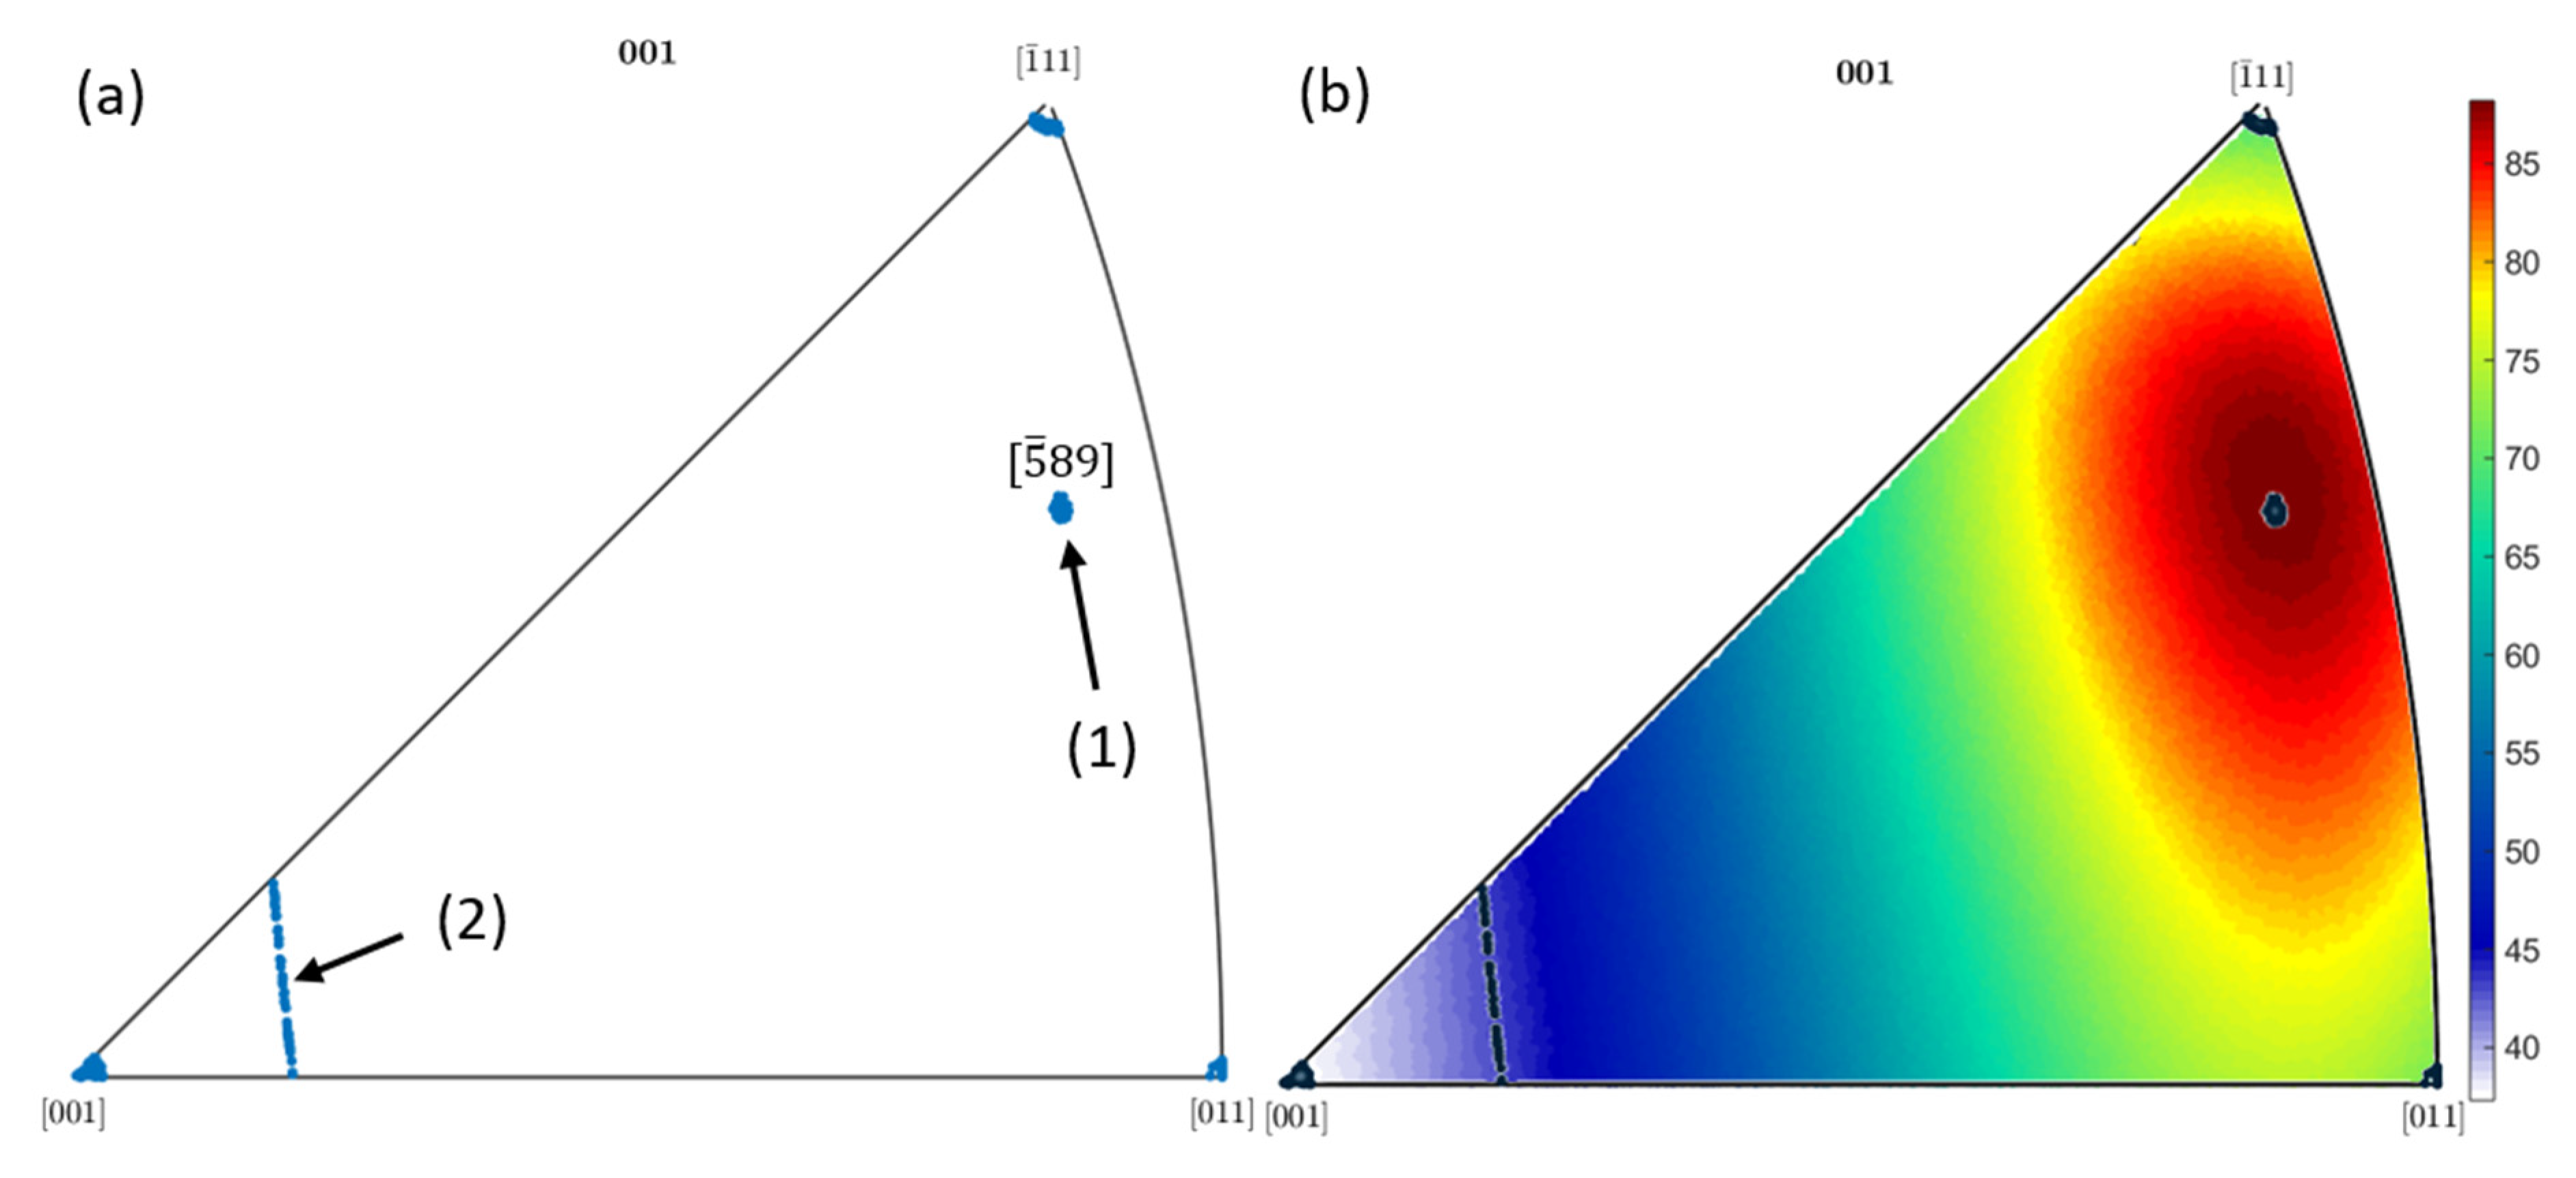
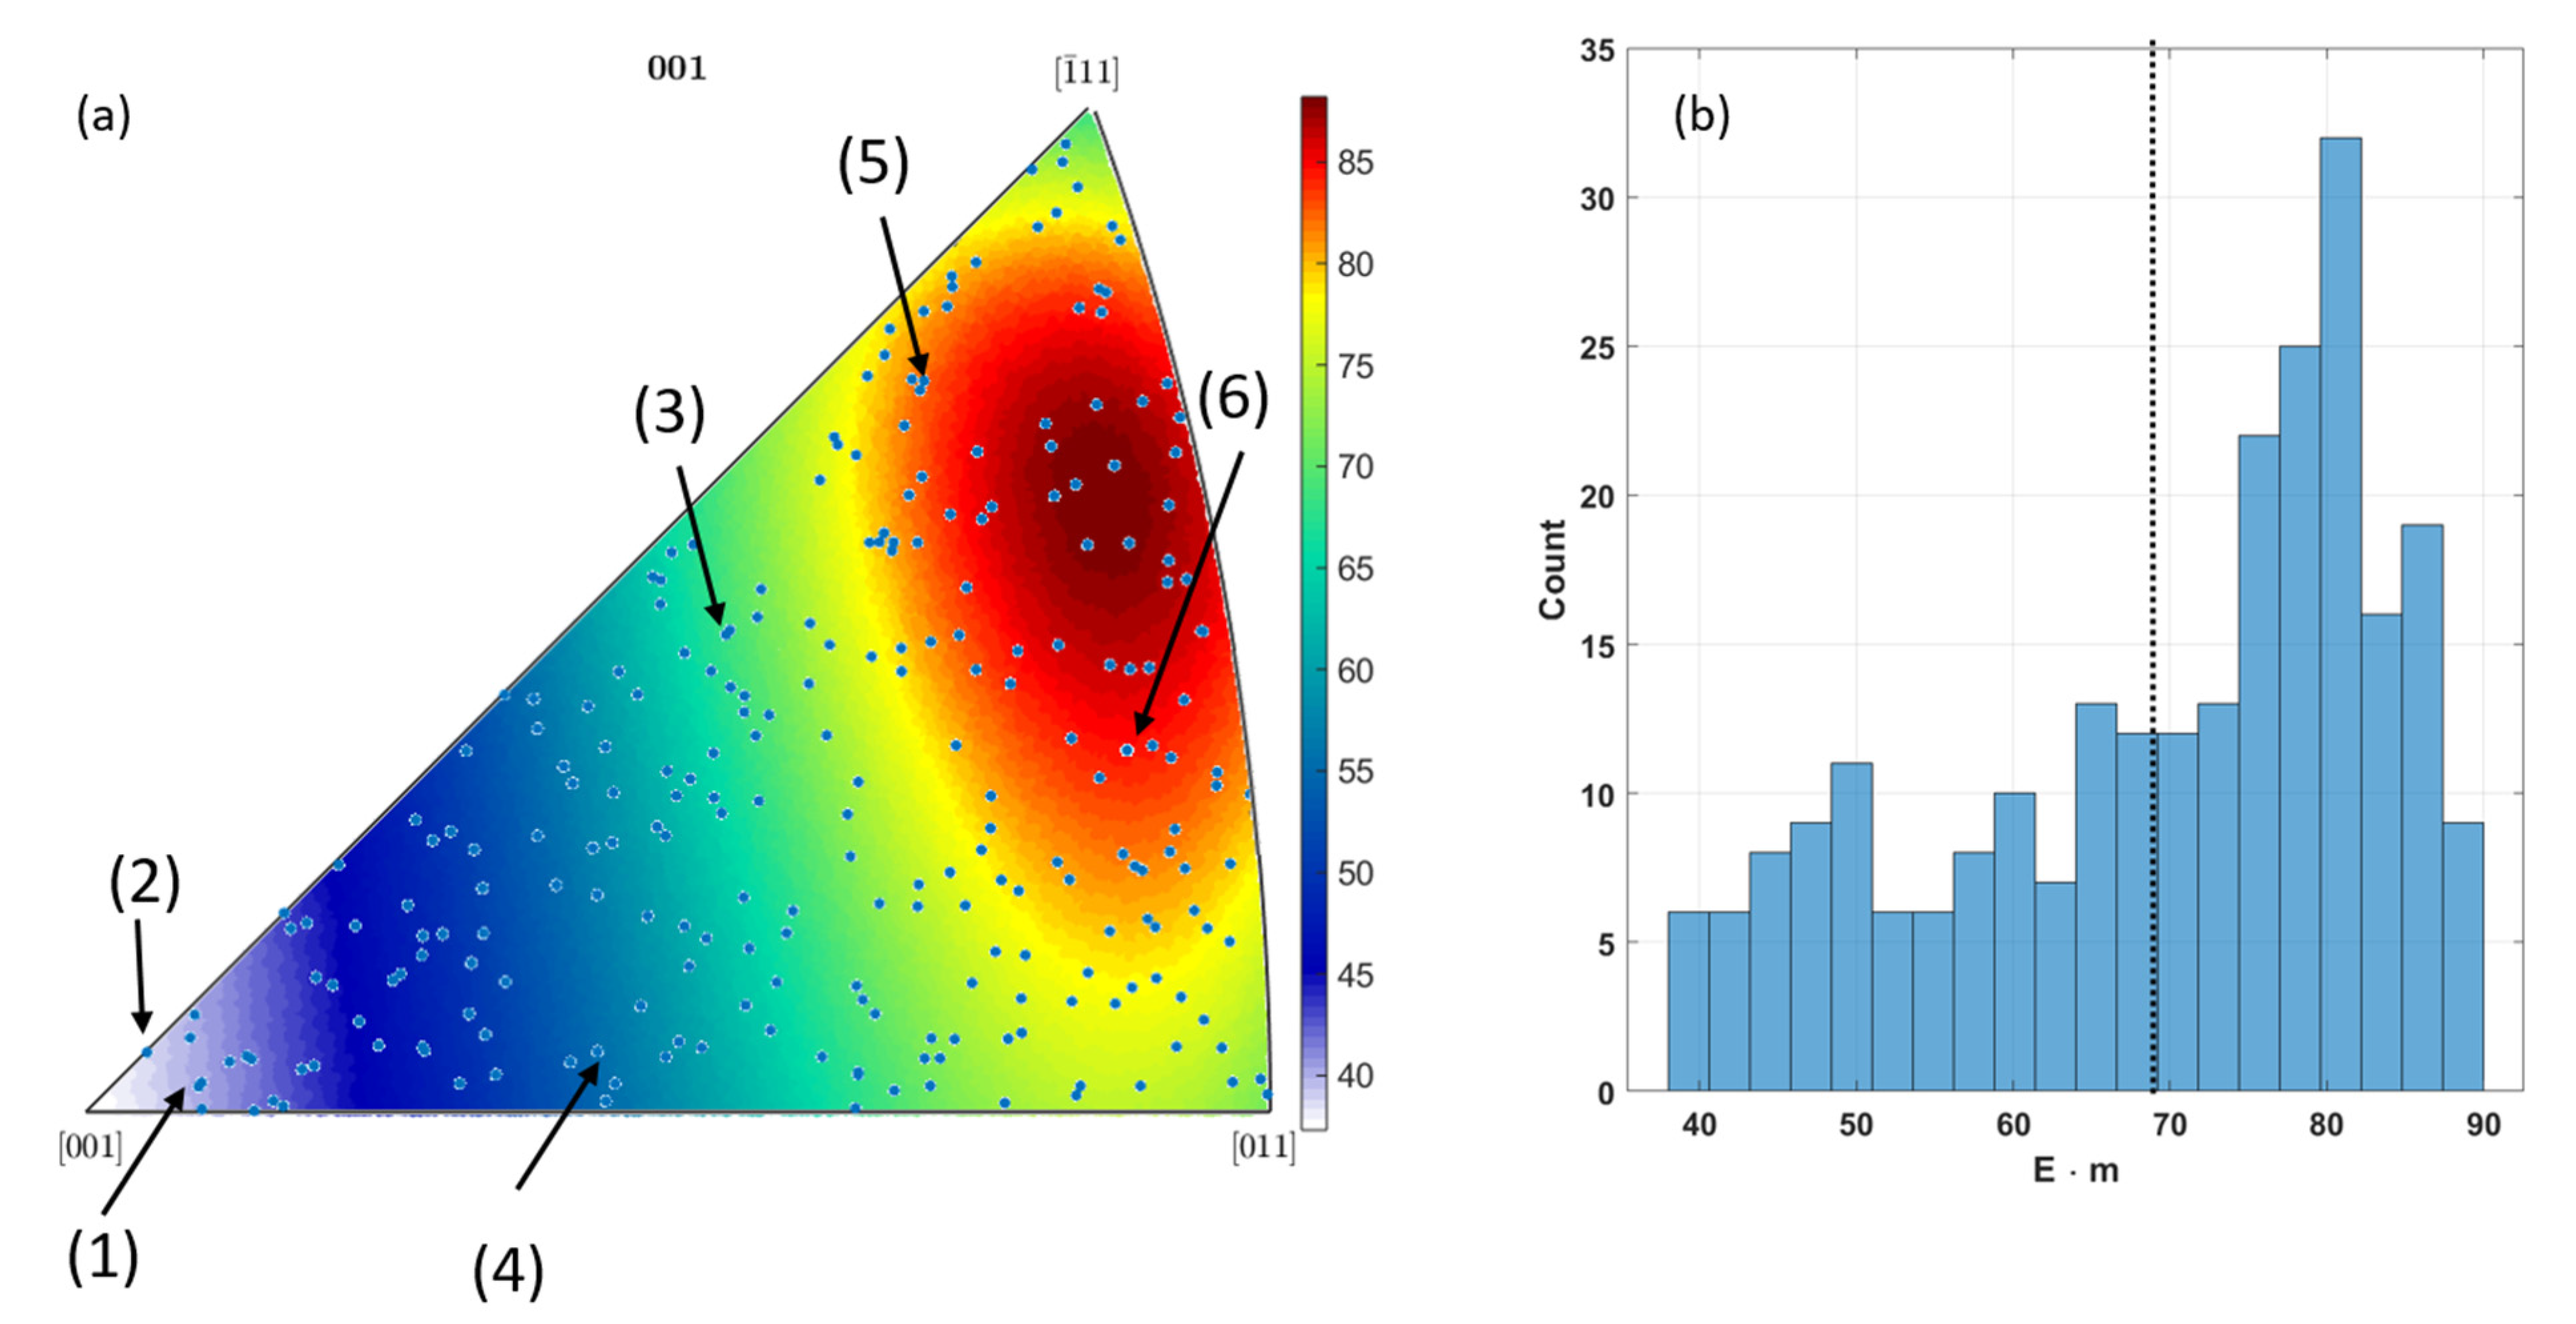
Since the individual orientations for the distributions [100], [110], [111], stiff and soft are all very close to each other, no large scatter in local mechanical properties were expected and proven by the finite element results. However, for the random orientation distribution, a statistical analysis has been carried out because of a large occurring scatter in local and global mechanical properties (see
Figure 5). The following
Figure 11 shows the distribution of the random grain orientations for all five simulated specimen within an inverse
pole plot; additionally, the grains (1)–(6) from
Figure 5 are highlighted.
It can be clearly seen at the inverse pole plot that the orientations are randomly distributed, whereas on average the
value is calculated to 69.57 ± 13.89 (see
Figure 11b). The histogram also shows a shift of the distribution to higher
values, which underline the fact that for a random orientation, a high
value (> 70) is more likely than a low one. It should be noted for the random specimen, since the orientations and therefore the mechanical properties differ over a wide range, the strain distributions also are not homogeneously distributed compared to the specimen where orientation just differs slightly. As grain (2) in
Figure 5 shows, large elastic strains in loading direction evolve, but only minor plastic strains are generated. This is caused by its orientation, as
Figure 11a shows. The orientation is close to [100] and allows due to lowest
values high elastic strains before plastic deformations starts at a total strain of 0.6%, as the stress-strain curve in
Figure 4 shows. In comparison grain (3) has an intermediate
value, which leads to lower elastic strains and more equivalent plastic strains. For the mentioned cases of grain (2) and (3) in
Figure 5, the
approach works well to estimate the onset of plasticity, which is due to the case that both grains show total strains of same magnitude until yield is reached as the following
Figure 12a shows.
But within the random orientated specimen, grains appear that show remarkably low total strain, and therefore there is nearly no plastic deformation as grain (5) indicates. Even with an
value of 82.16, the amount of strain that is generated within the grain is not sufficient enough to reach yield and to generate plastic deformation, even at a global total strain of 1%. The same behaviour can be found for grain (6), which has a calculated
value of 83.5 but only show low equivalent plastic deformation. It appears that the grains (2) and (3), both with much lower
value, generate much more local equivalent total strain as the connected grains (5) and (6). A similar behaviour can be observed in the mix specimen. The stiff part with an average
value of 88.1 ± 0.038 shows distinct lower equivalent total strains and therefore lower equivalent plastic strains compared to the soft part with an average
of 43.57 ± 0.023. Due to the higher local strains, the soft part of the specimen generates the majority of the plastic deformation. These results lead to the hypothesis that if grains with a low
value are interacting with grains with high
value, the softer grains will see higher local total strains and therefore more potential plastic deformation compared to stiff grains. This behaviour could already be observed in [
9,
12] during fatigue testing, where cracks either initiate in grains with high
value or in grains with a low
value, which are interacting and surrounded with grains with a high
.
5. Conclusions
The presented work could clearly demonstrate by means of numerical simulations the influences of different grain orientation distributions on the local and global mechanical behaviour of IN-738 LC. It could be shown that grain orientations close to the [100] direction provide lowest Young’s moduli and additionally highest elastic strains before yielding. It could be also shown that orientation distributions close to the [111] direction generates highest Young’s moduli, but interestingly not the lowest elastic strains before yielding. This could be attributed to lowest Schmid factors associated with the [111] direction. Using the model, which considers both Young’s moduli and Schmid factor in dependence of the orientation, it could be found that orientations close to the [89] direction show a global maximum in the model and therefore lowest elastic strains before yielding. Since the model is only able to predict the onset of plasticity if a uniform and homogeneous strain distribution is considered, random grain orientation distribution were simulated. Due to a high range of possible mechanical properties of the grains caused by elastic and plastic anisotropies, the total strain distribution is highly inhomogeneous. For regions in the material where the total strain is evenly distributed, the allows for the indication of which grains show plastic deformation first. But, if grains with high and low value interact, most of the total strain is taken by grains with low value (due to low stiffness), which therefore show more plastic deformation compared to surrounding grains with a high value.
The presented results were derived from modeling a specific nickel-based superalloy. But the determined elastic plastic behaviour in dependence of the grain orientation, i.e., the value, can be applied to all cubic fcc metals as long the plastic deformation occurs within the {111}[110] slip systems. Extensions of the model to bcc metals as well as other slip systems are also possible. The shown approach is particularly interesting because almost all metallic materials show an anisotropic elastic behaviour on the microscale. Future investigations should focus on the application of the shown procedure to more complex geometries and multi-axial stress states.


