Article

Synthesis, Crystal Structure, Hirshfeld Surface Analysis and Docking Studies of a Novel Flavone–Chalcone Hybrid Compound Demonstrating Anticancer Effects by Generating ROS through Glutathione Depletion

1
Department of Biological Sciences, Konkuk University, Seoul 05029, Korea
2
Division of Bioscience and Biotechnology, BMIC, Konkuk University, Seoul 05029, Korea
3
Division of Chemistry and Bio-Environmental Sciences, Seoul Women’s University, Seoul 01797, Korea
4
Department of Applied Chemistry, Dongduk Women’s University, Seoul 02748, Korea
*
Authors to whom correspondence should be addressed.
Submission received: 17 December 2021 / Revised: 7 January 2022 / Accepted: 12 January 2022 / Published: 14 January 2022
(This article belongs to the Special Issue Feature Papers in Organic Crystalline Materials)

Abstract

:
The flavone–chalcone hybrid compound, (E)-6-bromo-3-(3-(2-methoxyphenyl)-3-oxoprop-1-enyl)-4H-chromen-4-one (3), was synthesized and its three dimensional structure was identified by X-ray crystallography. The compound 3, C19H13BrO4, was crystallized in the triclinic space group P-1 with the following cell parameters: a = 8.2447(6) Å; b = 8.6032(6) Å; c = 11.7826(7) Å; α = 92.456(2)°; β = 91.541(2)°; γ = 106.138(2)°; V = 801.42(9) Å3 and Z = 2. In an asymmetric unit, two molecules are packed by a pi–pi stacking interaction between two flavone rings that are 3.790 Å apart from each other. In the crystal, two hydrogen bonds form inversion dimers and these dimers are extended along the a axis by another hydrogen bond. Hirshfeld analysis revealed that the H–H (34.3%), O–H (19.2%) and C–H (16.7%) intermolecular contacts are the major dominants, while the C–O (6.7%) and C–C (6.5%) are minor dominants. When HCT116 cells were treated with various concentrations of hybrid compound 3, reduced cell viability and induced apoptosis in HCT116 cells were observed in a dose-dependent manner. The treatment of HCT116 colon cancer cells with compound 3, decreased the intracellular glutathione (GSH) levels and generated a reactive oxygen species (ROS). In silico docking experiments between the compound 3 and glutathione S-transferase (GST) containing glutathione were performed to confirm whether the compound 3 binds to glutathione. Their binding energy ranged from −6.6 kcal/mol to −5.0 kcal/mol, and the sulfur of glutathione is very close to the Michael acceptor regions of the compound 3, so it is expected that they would easily react with each other. Compound 3 may be a promising novel anticancer agent by ROS generation through glutathione depletion.

1. Introduction

Reactive oxygen species (ROS) are highly reactive chemical species that are formed as products of the normal aerobic metabolism. The major components of ROS include radicals of superoxide, hydroxyl and neutral compound, such as hydrogen peroxide and singlet oxygen [1,2,3]. Environmental stress and exogenous sources are considered to be the main causes of ROS generation. ROS has the advantage of acting as a signaling factor in vivo, as well as harmful factors, such as damage to DNA [4,5,6,7,8]. Since normal cells have relatively low basal ROS levels, an increase in ROS is generally a signal of the expression of antioxidant action to decrease ROS [1,7]. However, cancer cells have a higher basal ROS level than normal cells [9,10]. When ROS is increased above the threshold by external factors, it can induce extreme oxidative stress and kill cancer cells [11,12,13]. Therefore, the uncontrolled production of ROS leads to oxygen toxicity and an appropriate level of intracellular ROS is essential [14,15,16]. According to recent reports, ROS increase in cancer cells undergoes apoptosis along with chronic oxidative stress. Increasing ROS in cancer cells can only selectively kill cancer cells [17,18,19,20,21,22,23].
Natural product piperlongumine and its derivative compounds induce cell death by ROS generation in cancer cells [24]. Piperlongumine derivatives are a chalcone-type compound, which contain conjugate carbonyl (α, β-unsaturated carbonyl) groups as Michael reaction acceptors. Other small molecules as well as Piperlongumine derivatives remove glutathione (GSH) in cancer cells and cause an increase in intracellular ROS [25,26,27,28,29]. Our previous studies demonstrated that the compounds containing the conjugate carbonyl group, such as flavones and chalcones, are essential for GSH removal [30,31,32,33]. The molecular hybridization provides a multi-pharmacophore and becomes a tool more useful than the original compound, for realizing a synergistic drug effect [34]. In order to develop a compound with more effective ROS production ability, flavone and chalcone are combined to furnish the flavone–chalcone hybrid compound 3 presented in this study. Based on the tertiary structure of compound 3 obtained from X-ray experiments, the anti-cancer properties and anti-cancer mode of action of compound 3 were confirmed through in vitro and in silico experiments.

2. Experimental

2.1. General

The reaction progress of the synthesis was determined by thin-layer chromatography (TLC), and TLC plate was purchased from Merck (Darmstadt, Germany). Nuclear magnetic resonance (NMR) spectra were obtained in deuterated dimethyl sufoxide (DMSO-d6) and were recorded on a Bruker Avance 400 MHz spectrometer (Bruker, Billerica, MA, USA). The detailed NMR experimental method followed the previous report [35].

2.2. Crystal Structure Determination

The single crystal used for the X-ray analysis was prepared by recrystallization from ethanol, and a size of 0.42 × 0.26 × 0.09 mm3 was selected. Data were collected with a Bruker PHOTON 100 CMOS diffractometer (Bruker, Billerica, MA, USA) supported with graphite monochromatic Mo Kα radiation (λ = 0.71073 Å at 223(2) K). The data were processed with the APEX2 suite [36]. SHELXT was used to solve the structure, and Bruker SAINT was applied for the cell refinement and data reduction [36,37]. The OLEX2 software was used as a graphical interface [38]. The calculation of the intermolecular interactions and molecular graphics were generated using Mercury [39]. The details of structural refinement and crystal data are reported in Table 1. The Crystallographic Information File (CIF) was reported to the Cambridge Crystallographic Data Center as CCDC deposition number 2121492. Supplementary crystallographic data for this paper can be obtained at http://www.ccdc.cam.ac.uk/products/csd/request (accessed on 11 November 2021).

2.3. In Silico Docking with Glutathione S-Transferase (GST)

Dozens of three dimensional (3D) structures of glutathione S-transferase (GST) have been deposited in the protein data bank. The 1gne.pdb is a crystallographic structure of Schistosoma japonicum glutathione S-transferase containing glutathione in the binding site [40]. Its 3D structure consists of a single polypeptide. In silico docking was performed using AutoDock Vina (The Scripps Research Institute, La Jolla, SD, USA) [41]. To merge GST protein with compound 3 obtained from the docking experiments, the UCSF Chimera visualization system was used [42].

2.4. Analysis of the Intracellular Reduced Glutathione (GSH)

The GSH contents were analyzed with cell-permeable maleimide derivative VitaBright-48TM (VB-48; ChemoMetec, Lillerød, Denmark), which immediately reacts with reduced thiols (GSH), forming a blue fluorescent product. HCT116 cells were treated with 20 and 40 μM compound 3 for 18 h. After that, cells were detached with trypsin and added a reaction mixture solution containing VB-48, propidium iodide and acridine orange, according to the manufacturer’s instructions (ChemoMetec, Lillerød, Denmark). The stained cells were analyzed using the fluorescence image cytometer NucleoCounter NC-3000 (ChemoMetec, Lillerød, Denmark). NucleoView NC-3000 (ChemoMetec, Lillerød, Denmark) was applied to obtain the scatter plots and histograms.

2.5. Analysis of Intracellular ROS

The HCT116 cells were incubated with 10 μM 2′,7′-dichlorofluorescin diacetate (DCF-DA; Merck, Darmstadt, Germany) for 60 min, followed by treatment with 40 μM compound 3 or 100 μM menadione (Sigma-Aldrich, St. Louis, MO, USA) as a reference compound for 1 h. DCF-DA interacts with free radicals to form the fluorogenic DCF product. DCF fluorescence was analyzed using the fluorescence image cytometer NucleoCounter NC-3000 (ChemoMetec, Lillerød, Denmark) and visualized using an EVOSf1® fluorescence microscope (Advance Microscopy Group, Bothell, WA, USA).

2.6. Cell Viability Assay

The cell viability was determined using a Cell Counting Kit-8 (CCK-8), according to the manufacturer’s instructions (Dojindo Molecular Technologies, Gaithersburg, MD, USA). HCT116 cells cultured in 96-well microplates were treated with compound 3 (10–80 μM) for 24 h and added to CCK-8 solution. After 3 h of incubation, absorbance was measured at 450 nm using a Emax Endpoint ELISA Microplate Reader (Molecular Devices, Sunnyvale, CA, USA). The vehicle (dimethyl sulfoxide)-treated controls were normalized to 100% for each assay, and compound 3-treated groups were expressed as the % of the controls.

2.7. Apoptosis Assay

The apoptosis was analyzed by detecting phosphatidylserine on the outer leaflet of the plasma membrane using a fluorescein isothiocyanate (FITC)-conjugated Annexin V Apoptosis Detection Kit (BD Pharmingen; San Diego, CA, USA), according to the manufacturer’s instructions. The HCT116 cells (5 × 10⁵ cells/sample) were treated with 40 μM compound 3 for 24 h. The dead cells were analyzed by previously reported methods [43].

2.8. Western Blot Analysis

The HCT116 cells treated with compound 3 were harvested, and whole-cell lysates (10–20 μg) were prepared, separated via electrophoresis by SDS-polyacrylamide gels and then transferred to nitrocellulose membranes (Bio-Rad, Hercules, CA, USA). The details of Western blot experiments followed the previous report [44].

3. Results and Discussion
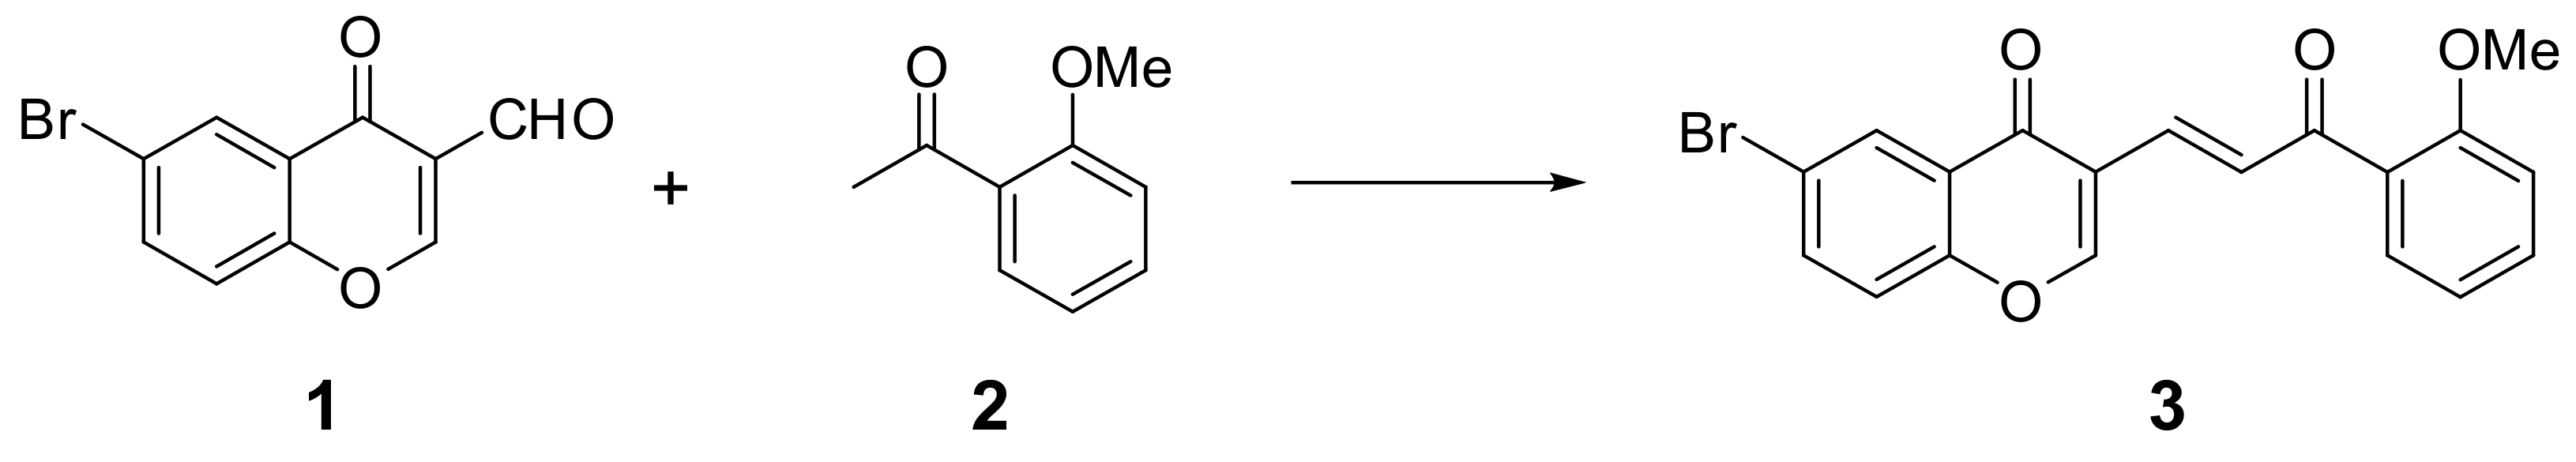
3.1. Synthesis

The flavone–chalcone hybrid compound 3 was prepared by the Claisen–Schmidt condensation reaction between 6-bromo-4-oxo-4H-chromene-3-carbaldehyde (1) and 1-(2-methoxyphenyl)ethanone (2), as shown in Scheme 1.

Synthesis (E)-6-Bromo-3-(3-(2-methoxyphenyl)-3-oxoprop-1-enyl)-4H-chromen-4-one (3)

Both 2-methoxyacetophenone (2, 2 mmol, 300 uL; d: 1.09 g/mL) and 6-bromo-3-formylchromone (1, 2 mmol, 506 mg) were added to a solution of 10 mL acetic acid containing sodium acetate (2 mmol, 164 mg). The reaction mixture was heated at 100 °C for 6 h. An additional 2 mmol of 2-methoxyacetophenone (2) was added to the reaction mixture to completely consume 6-bromo-3-formylchromone (1), and the completion of the reaction was confirmed by TLC. The reaction mixture was cooled to room temperature and poured into an ice water (150 mL) to obtain the precipitates. The resulting solid was filtered and washed with cold ethanol to provide the compound 3. Analytically pure compound 3 was obtained by recrystallization from ethanol. 1H NMR (400 MHz, dmso) δ 8.95 (s, J = 2.1 Hz, 1H), 8.20 (d, J = 2.4 Hz, 1H), 8.04 (d, J = 15.9 Hz, 1H), 8.00 (dd, J = 8.9, 2.5 Hz, 1H), 7.72 (d, J = 8.8 Hz, 1H), 7.55 (ddd, J = 8.4, 7.3, 1.8 Hz, 1H), 7.48 (dd, J = 7.6, 1.8 Hz, 1H), 7.34 (dd, J = 15.9, 0.6 Hz, 1H), 7.20 (dd, J = 8.5, 0.6 Hz, 1H), 7.06 (td, J = 7.4, 0.9 Hz, 1H), 3.87 (s, 3H). 13C NMR (100 MHz, dmso) δ 192.46, 174.11, 160.58, 157.72, 154.06, 137.08, 134.07, 133.10, 129.47, 129.24, 128.67, 127.54, 125.00, 121.24, 120.58, 118.62, 118.50, 112.41, 55.83. HR/MS (m/z): calcd. for (M + H)+: 385.0997; found: 385.0332.

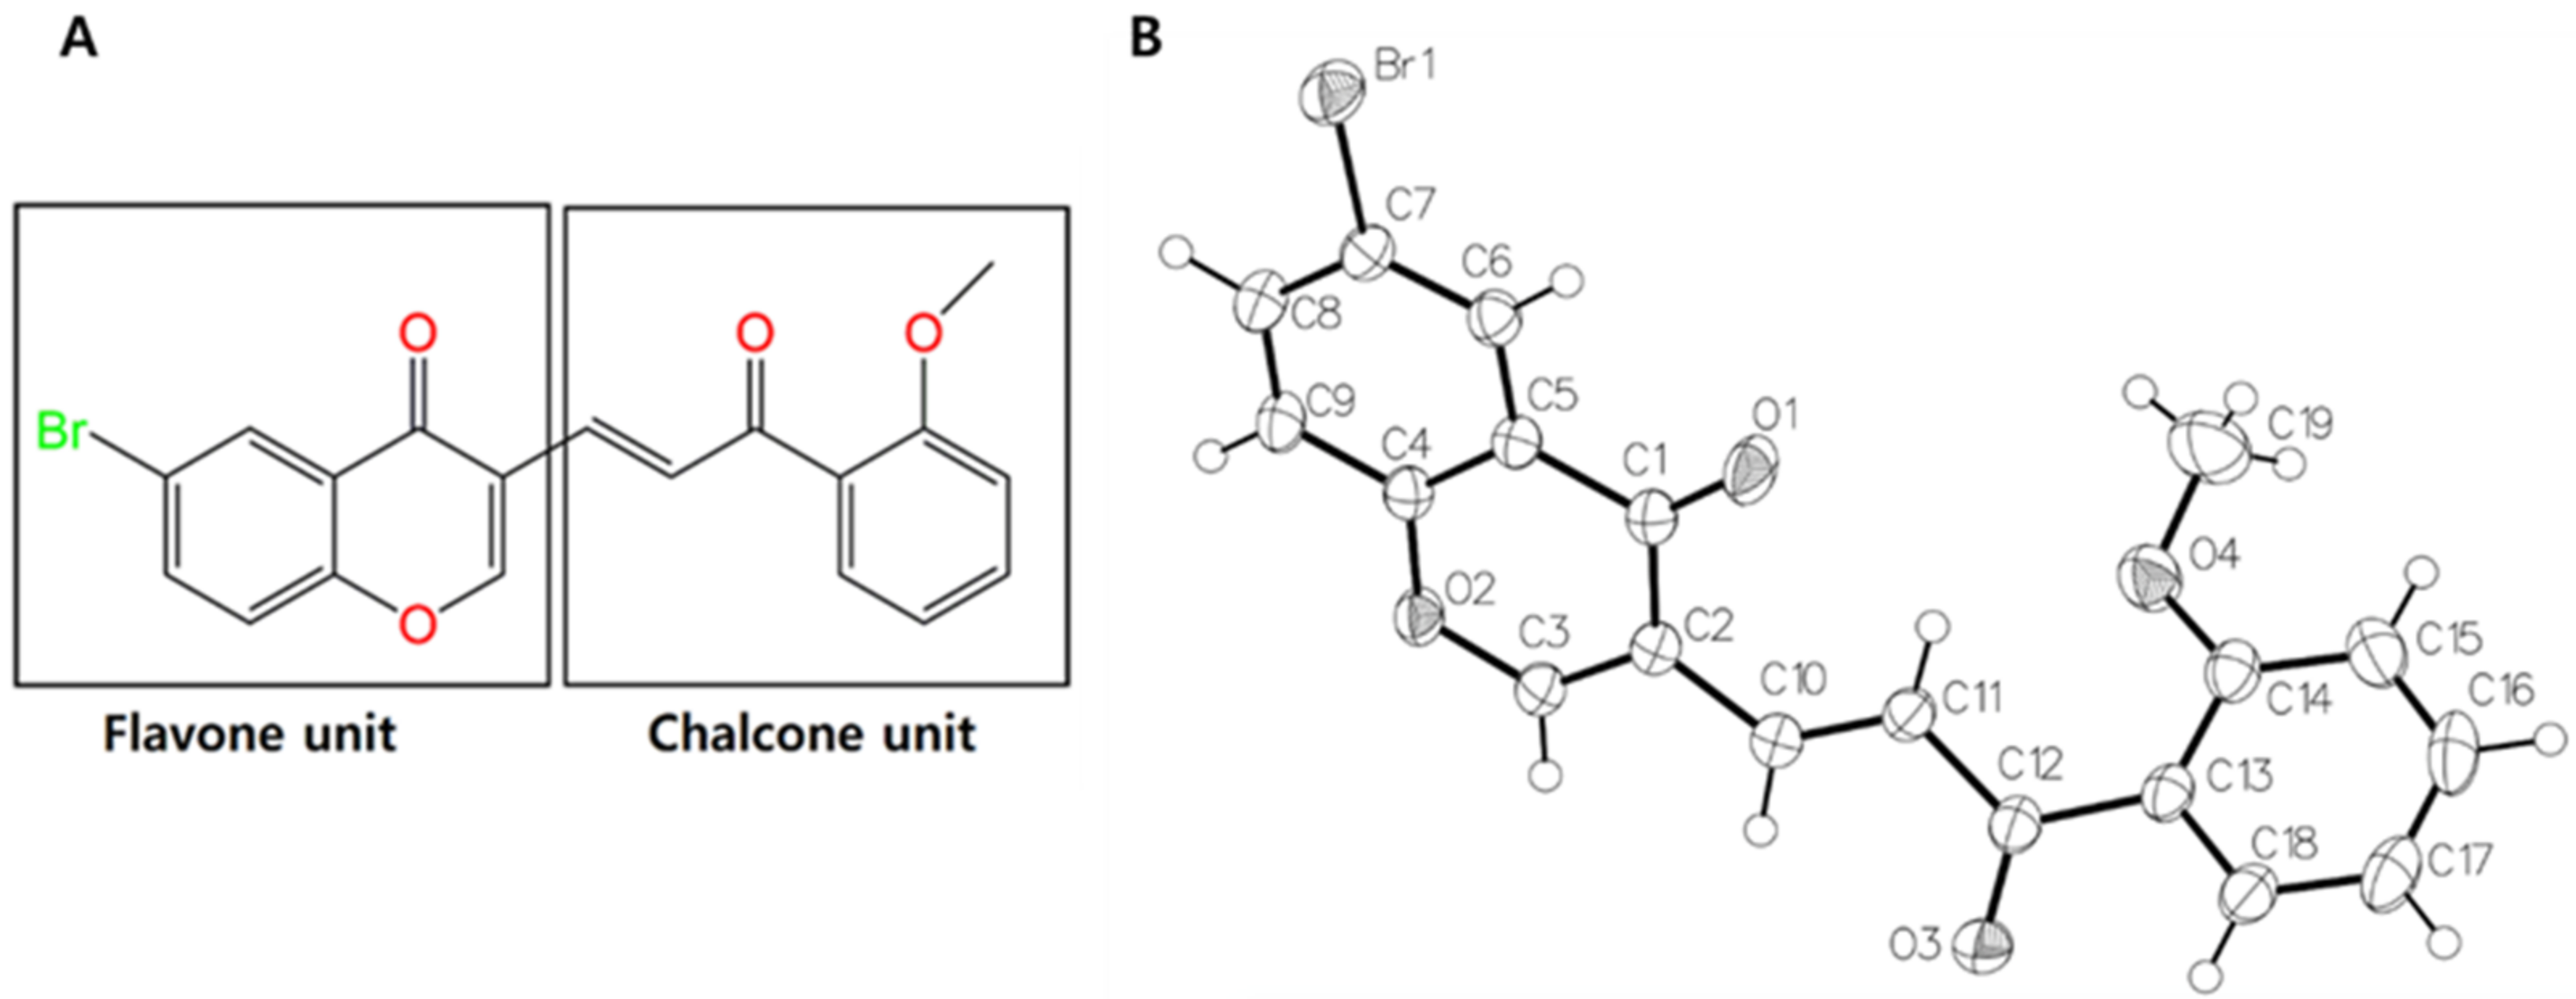
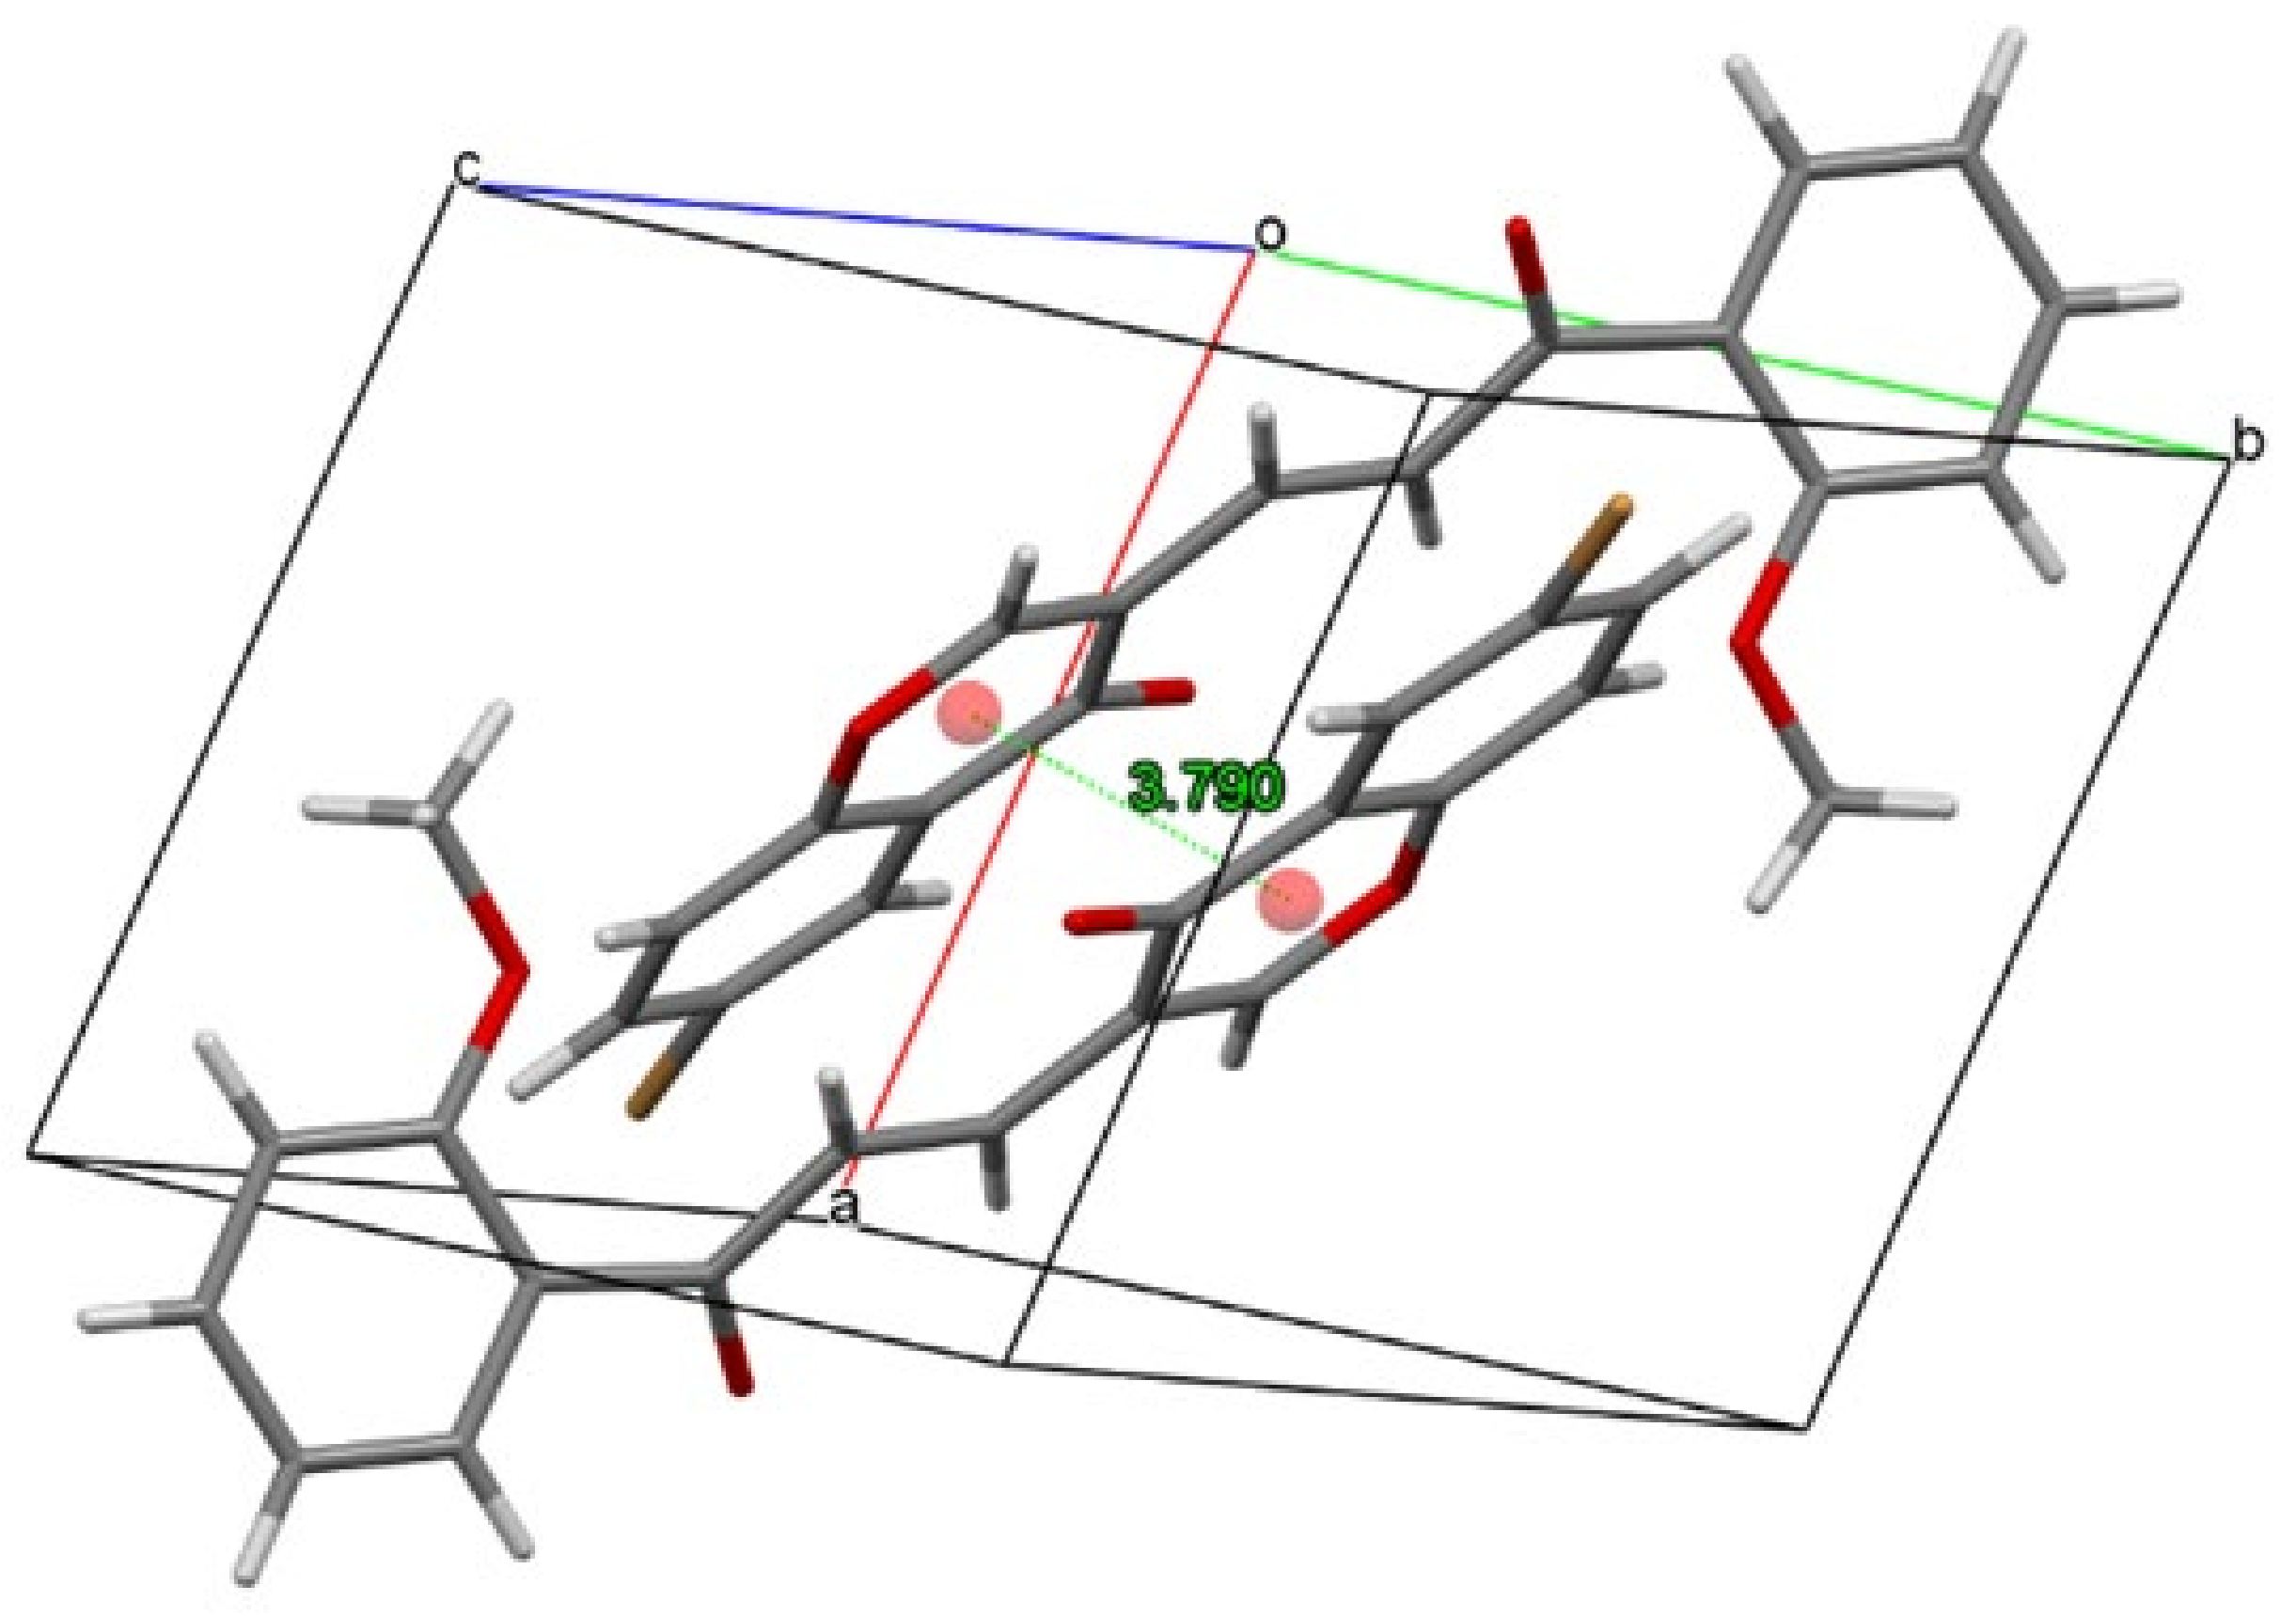
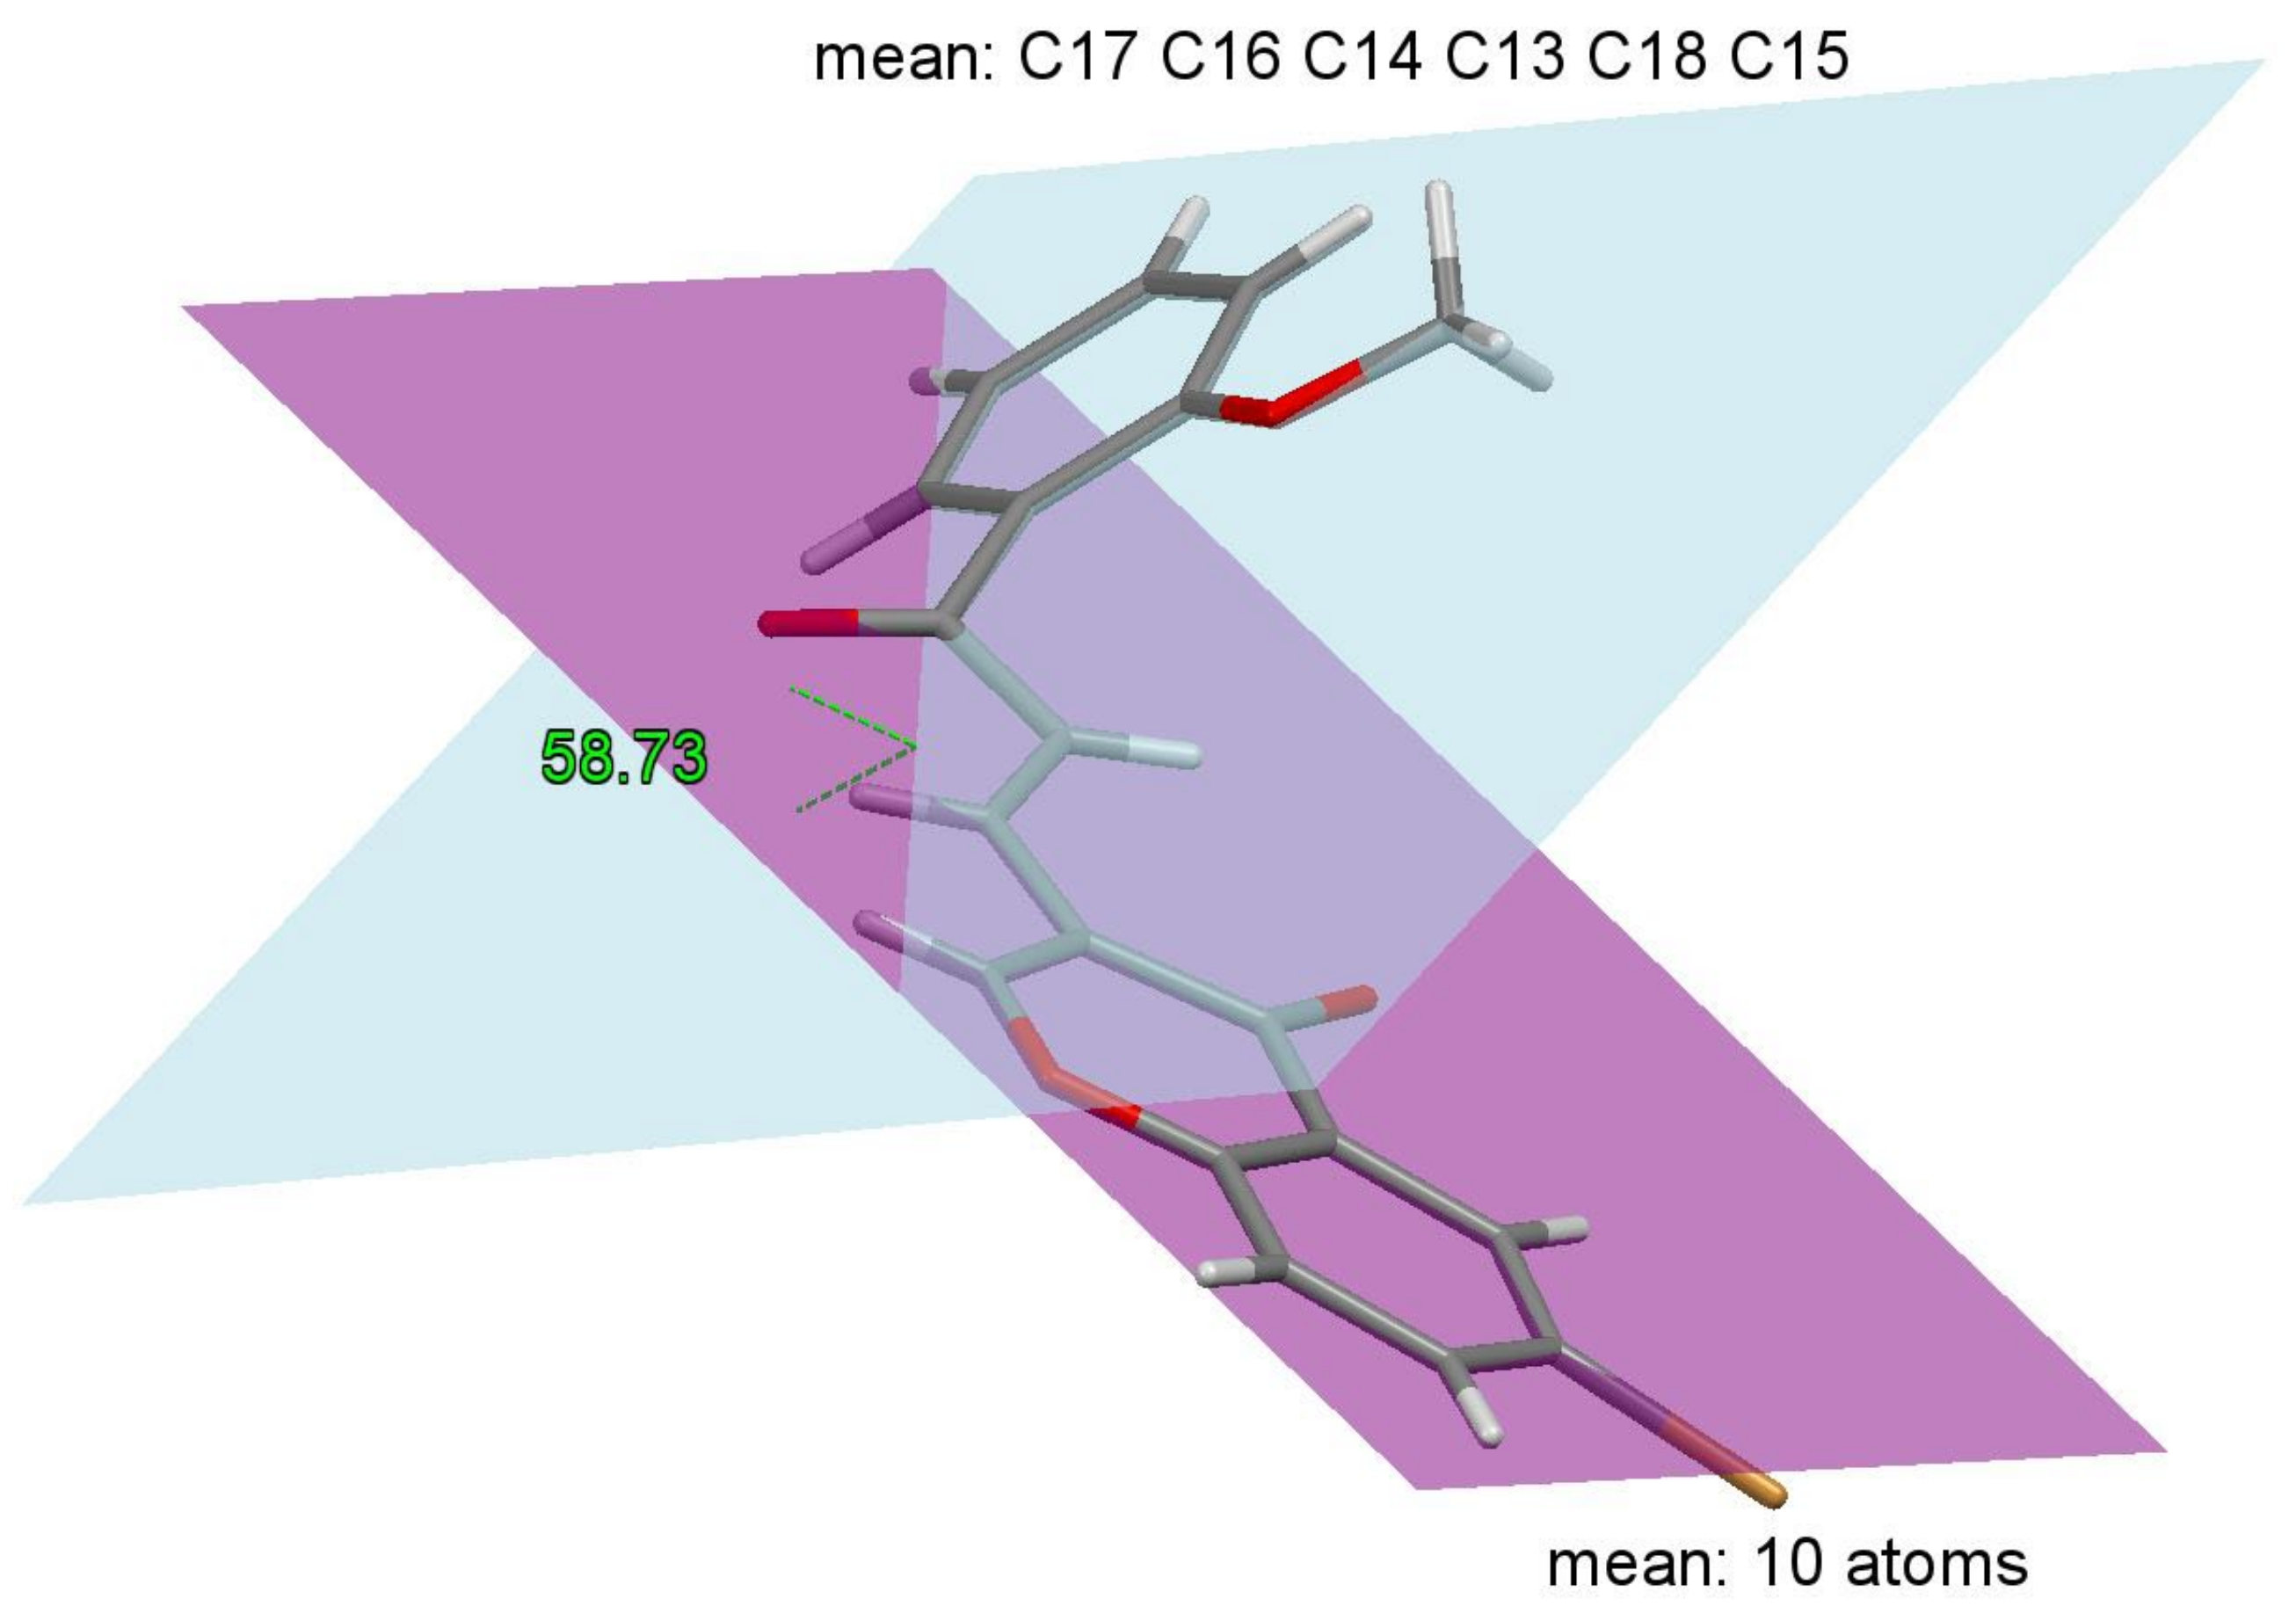
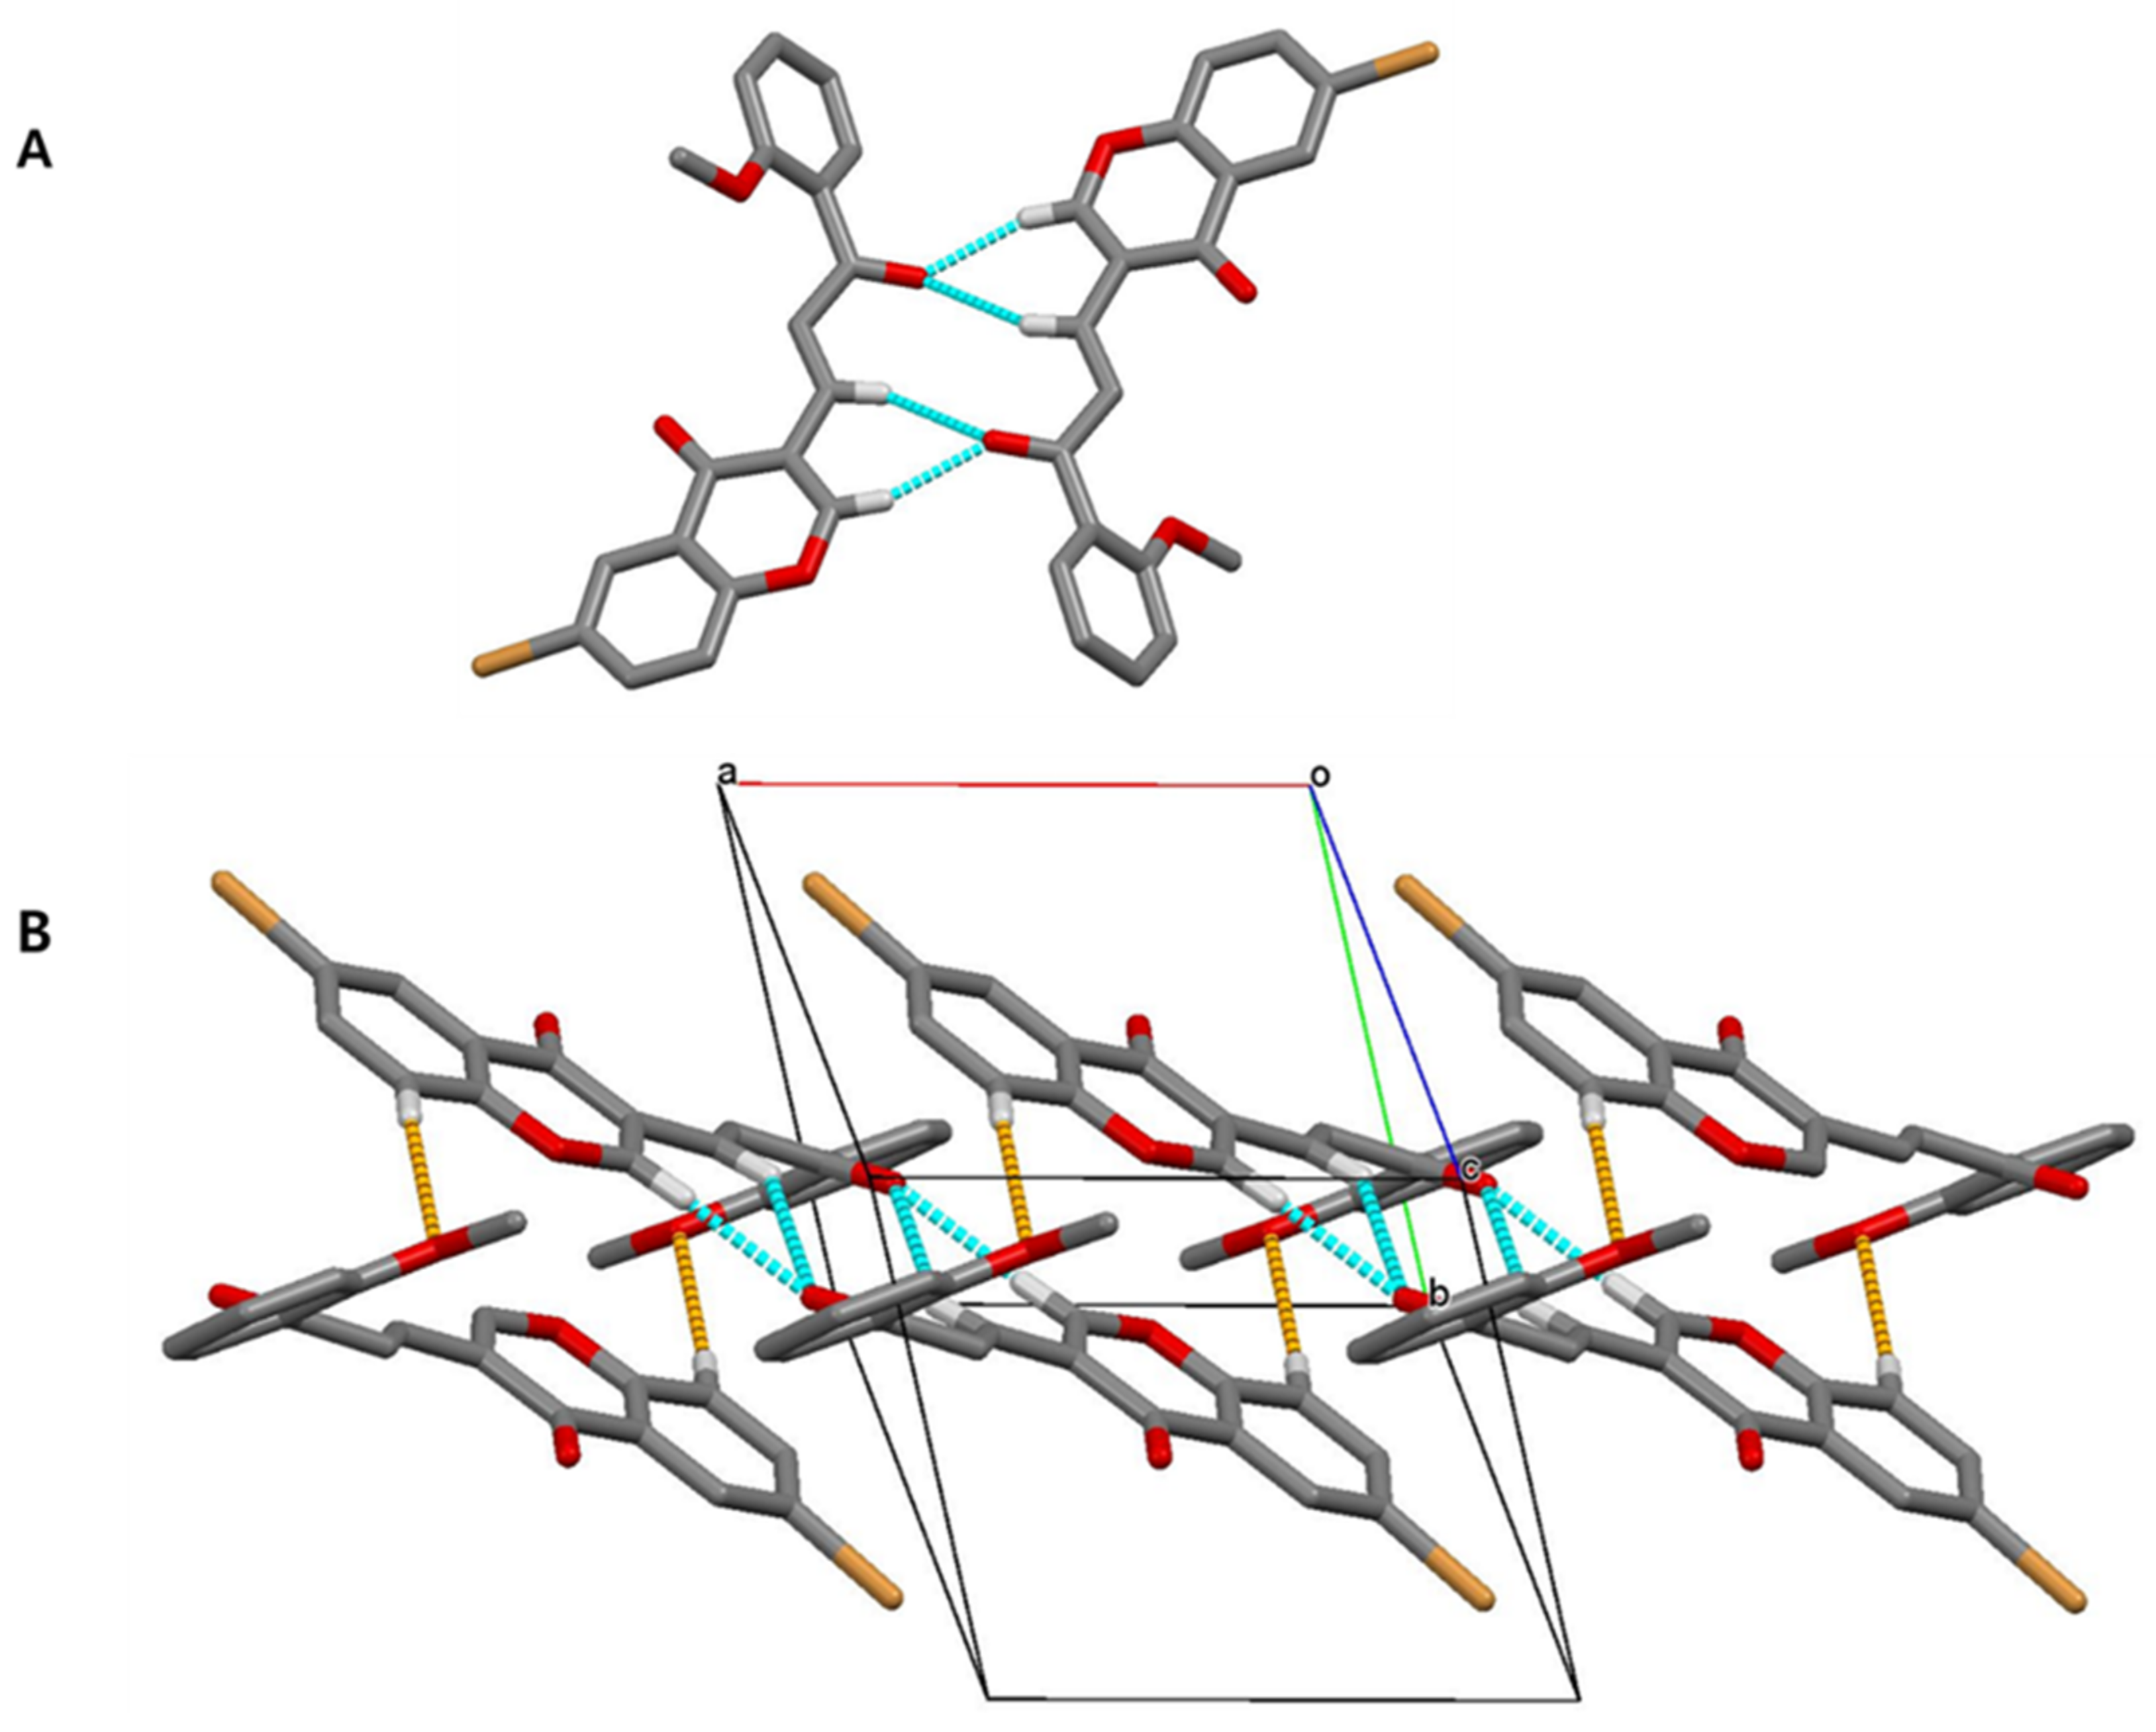
3.2. Crystal Structure of Flavone–Chalcone Hybrid Compound 3

The chemical structure of the title compound is shown in Figure 1A. It is composed of a flavone unit and a chalcone unit, and both units each have an α, β-unsaturated carbonyl group that exhibits a ROS enhancing effect in cancer cells [24]. The 3D structure of compound 3 is shown in Figure 1B, along with its atomic labels. The title compound 3 crystallized in the triclinic with space group P-1. In the asymmetric unit, two molecules are packed by the pi–pi stacking interactions between two flavone rings (C1-C5/O2) that are 3.790 Å apart from each other (Figure 2).
In the title molecule, there are two conjugated enone groups, one for the chalcone unit (C10=C11–C12=O3) and one for the flavone unit (C3=C2–C1=O1). In the chalcone unit, the central C10=C11 double bond showed trans configuration, which was confirmed by the dihedral angle of 179.4(3)° (C(2)-C(10)-C(11)-C(12)). The two double bonds, C10=C11 and C12=O3, are in s-cisoid with a torsion angle of −12.6(5)° for C10–C11–C12–O3. In contrast, C2=C3 double bond in the flavone unit is the cis configuration (1.7(5)° for C1–C2–C3–O2) and the two double bonds O1=C1 and C2=C3 is in s-transoid (−179.0(3)° for O1–C1–C2–C3). Two carbon–carbon double bonds, C1=C2 and C10=C11, are in the s-transoid conformation (167.4(3)° for C3–C2–C10–C11), which keeps them away from each other. The methoxy group on the benzene ring is tilted in the ring (−8.9(5)° for C19–O4–C13–C14). The typical dihedral angles are presented in Table 2.
In the title compound 3, the flavone ring system (C1–C9/O1) is slightly warped in plane, with a maximum deviation of 0.053 Å at C-7 (r.m.s. deviation = 0.032 Å), and the benzene ring (C13–C18) is planar (r.m.s. deviation = 0.008 Å). The dihedral angle formed between the planes of the flavone ring and benzene ring is 58.73o (Figure 3).
In the crystal, two hydrogen bonds (C(3)-H(3)⋯O(3)#1 (symmetry transformations #1; 1 − x, −y + 1, −z + 1) and C(10)-H(10)⋯O(3) #1 (symmetry transformations #1; 1 − x, −y + 1, −z + 1)) form the inversion dimer (Figure 4A, Table 3). The dimers are extended along the a-axis by additional C(9)-H(9)⋯O(4) #2 (#2; −x + 1, −y + 1, −z + 1) hydrogen bonds (Figure 4B, Table 3).

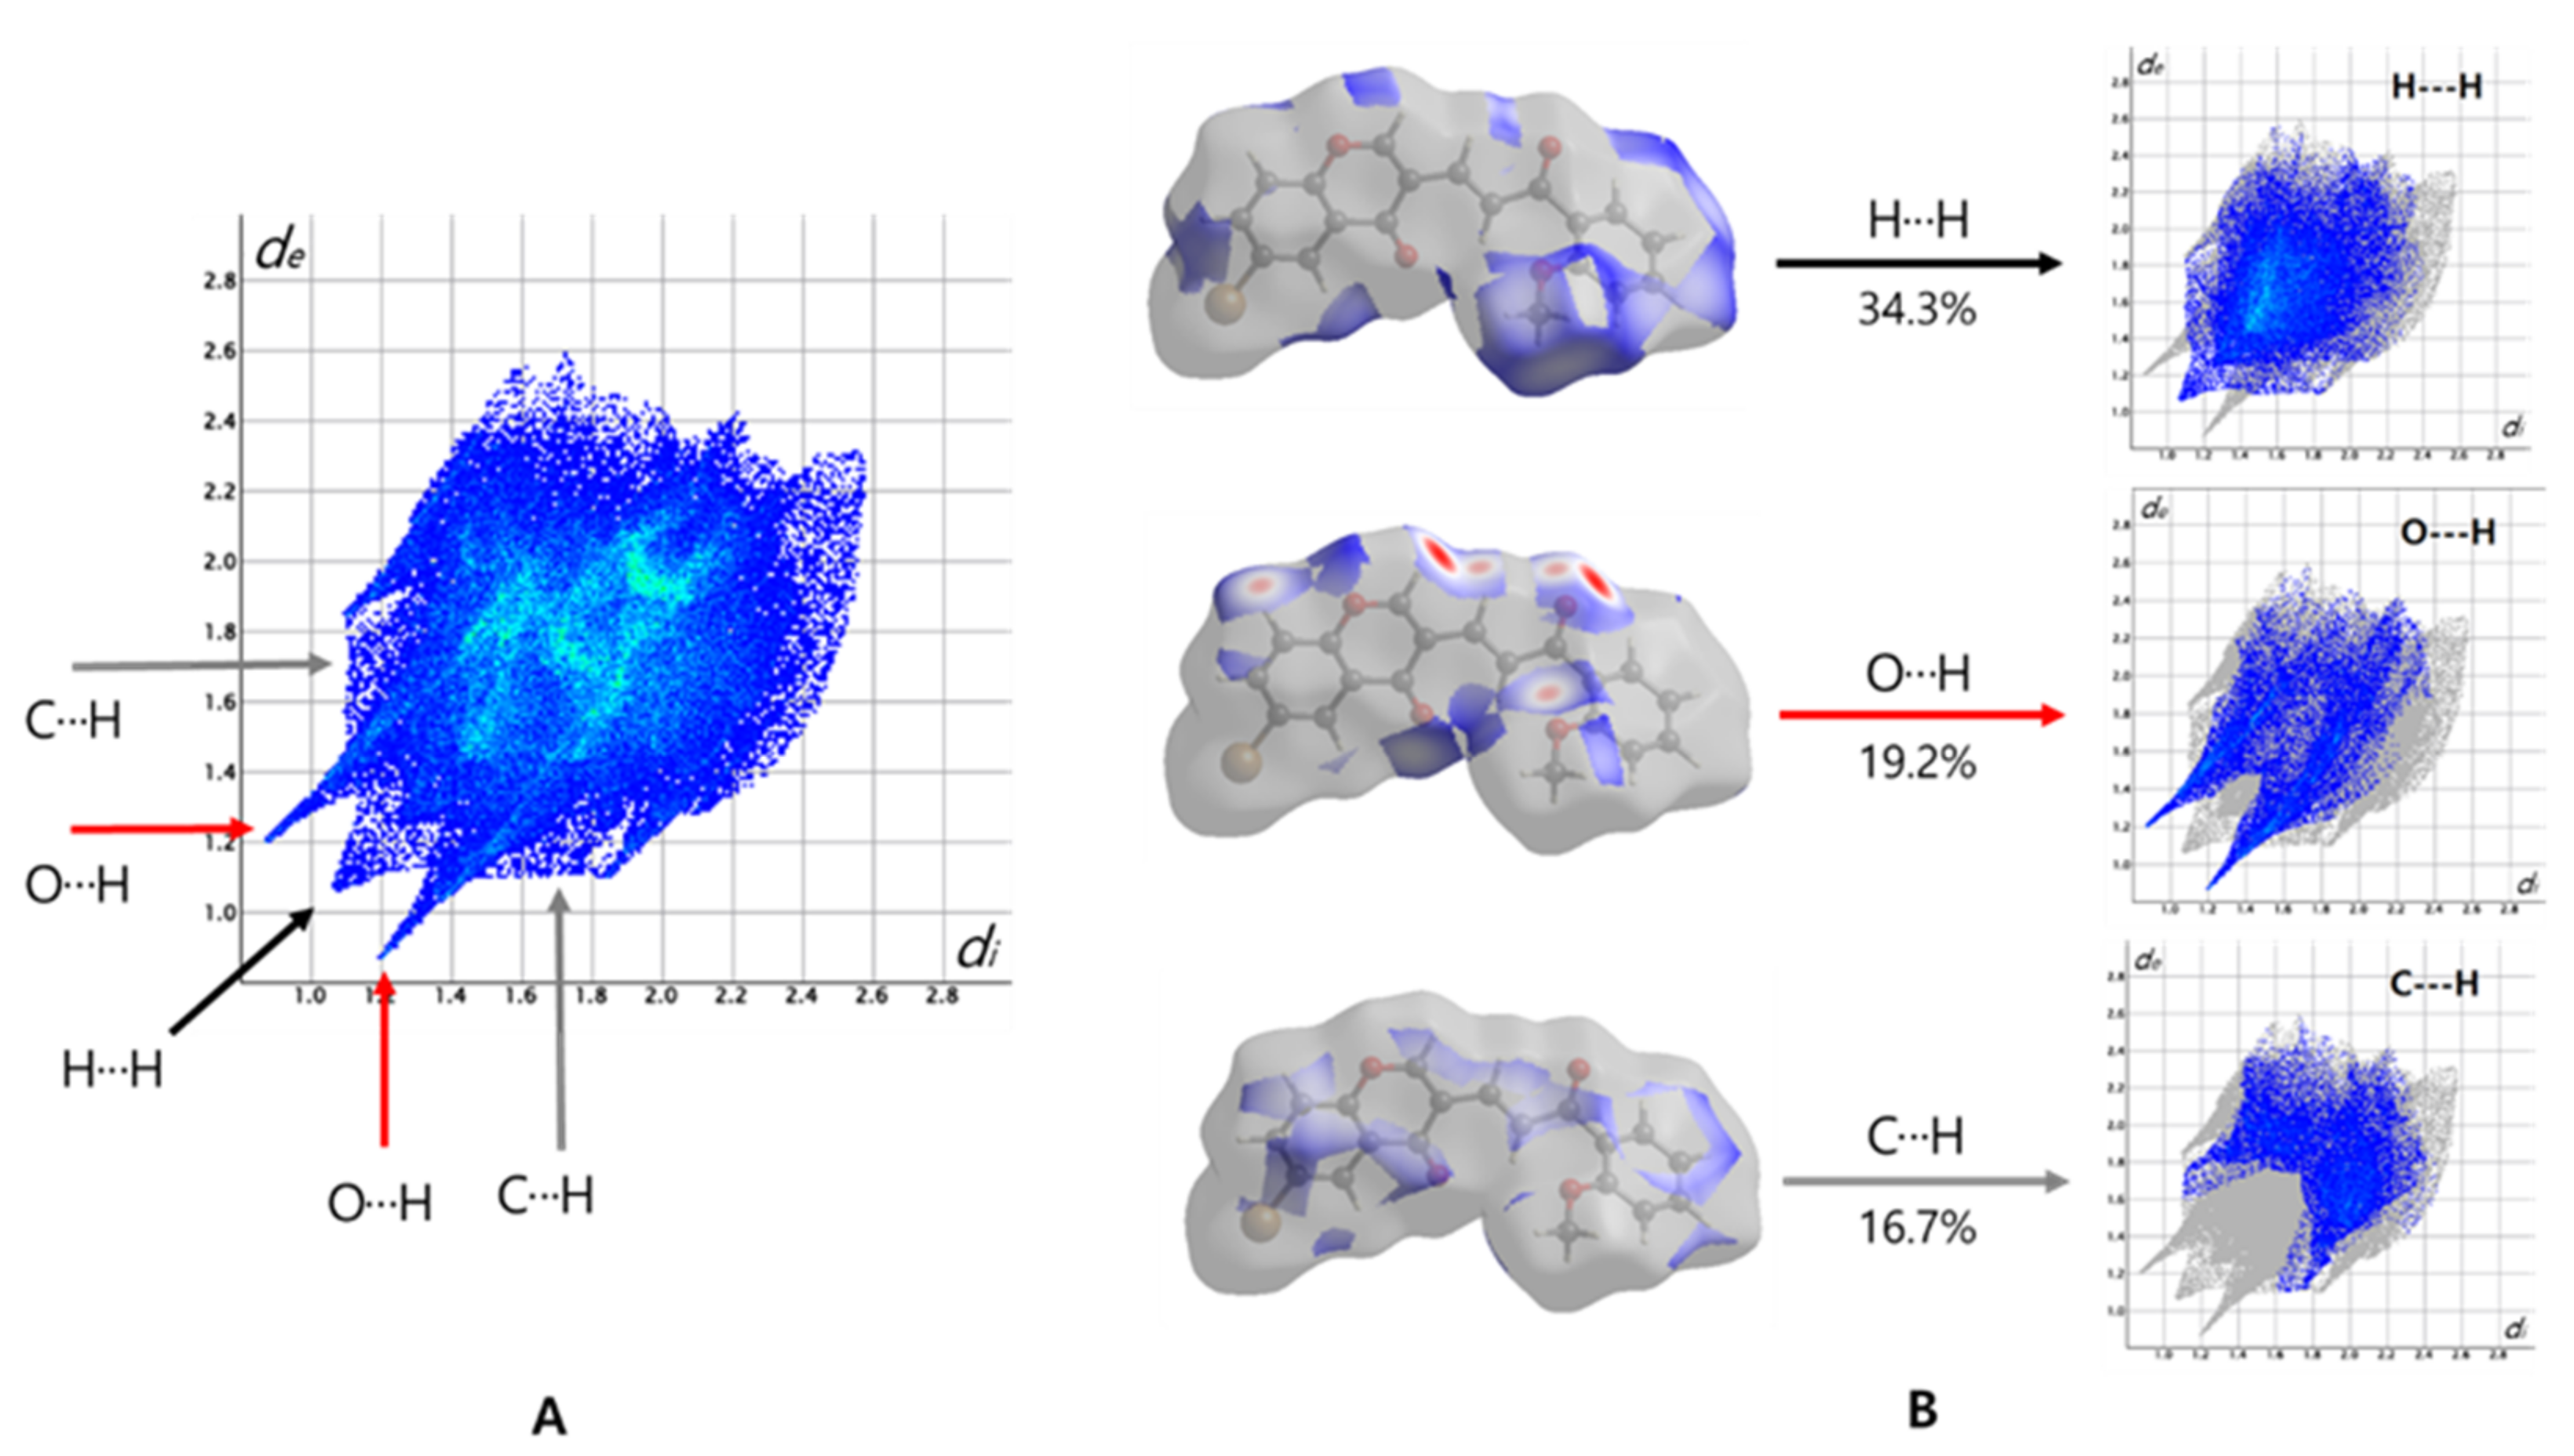
3.3. Hirshfeld Surface Analysis

Hirshfeld surface analysis (HSA) [45] expresses the chemistry of the intermolecular interactions within crystals, and the important interactions can be determined by using Crystal Explorer 17.5 [46]. A two-dimensional fingerprint plot from the Hirshfeld analysis was used to quantize the contribution of each contact to the crystal packing [47,48,49].
The complete 2D fingerprint plot and key interactions are illustrated in Figure 5A and Figure 5B, respectively.
Of the three major contributors to the entire Hirshfeld surface, the most important H⋯H/H⋯H interaction has a 34.3% contribution, and is accounted for by the point at di = de = 1.1 Å. A pair of sharp spikes indicates the strong O⋯H/H⋯O hydrogen bond interaction and its contribution is 19.2%. A pair of characteristic wings in the fingerprint plot is represented by the C⋯H/H⋯·C contacts (di + de = 2.9 Å) with 16.7% contribution. The complete contribution to the entire Hirshfeld surface is illustrated in the supplementary information (Figure S4, see in Supplementary Materials).
The Hirshfeld surfaces represent the regions of space in which molecules are in contact with each other. The three-dimensional Hirshfeld surfaces of the molecules 3 are illustrated in Figure S5, which map the dnorm, shape index and curvedness. The dark red spots on the dnorm Hirshfeld surface indicate close contact interactions due to significant C–H⋯O hydrogen bonds (Figure S5A). The shape index of molecule 3 shows the acceptor atoms in the red concave regions on the surface, and the donor H atoms in the blue regions. Couples of C–H⋯O hydrogen bonds form an inversion dimer through the dark red spots on the dnorm surface (Figure S5B).

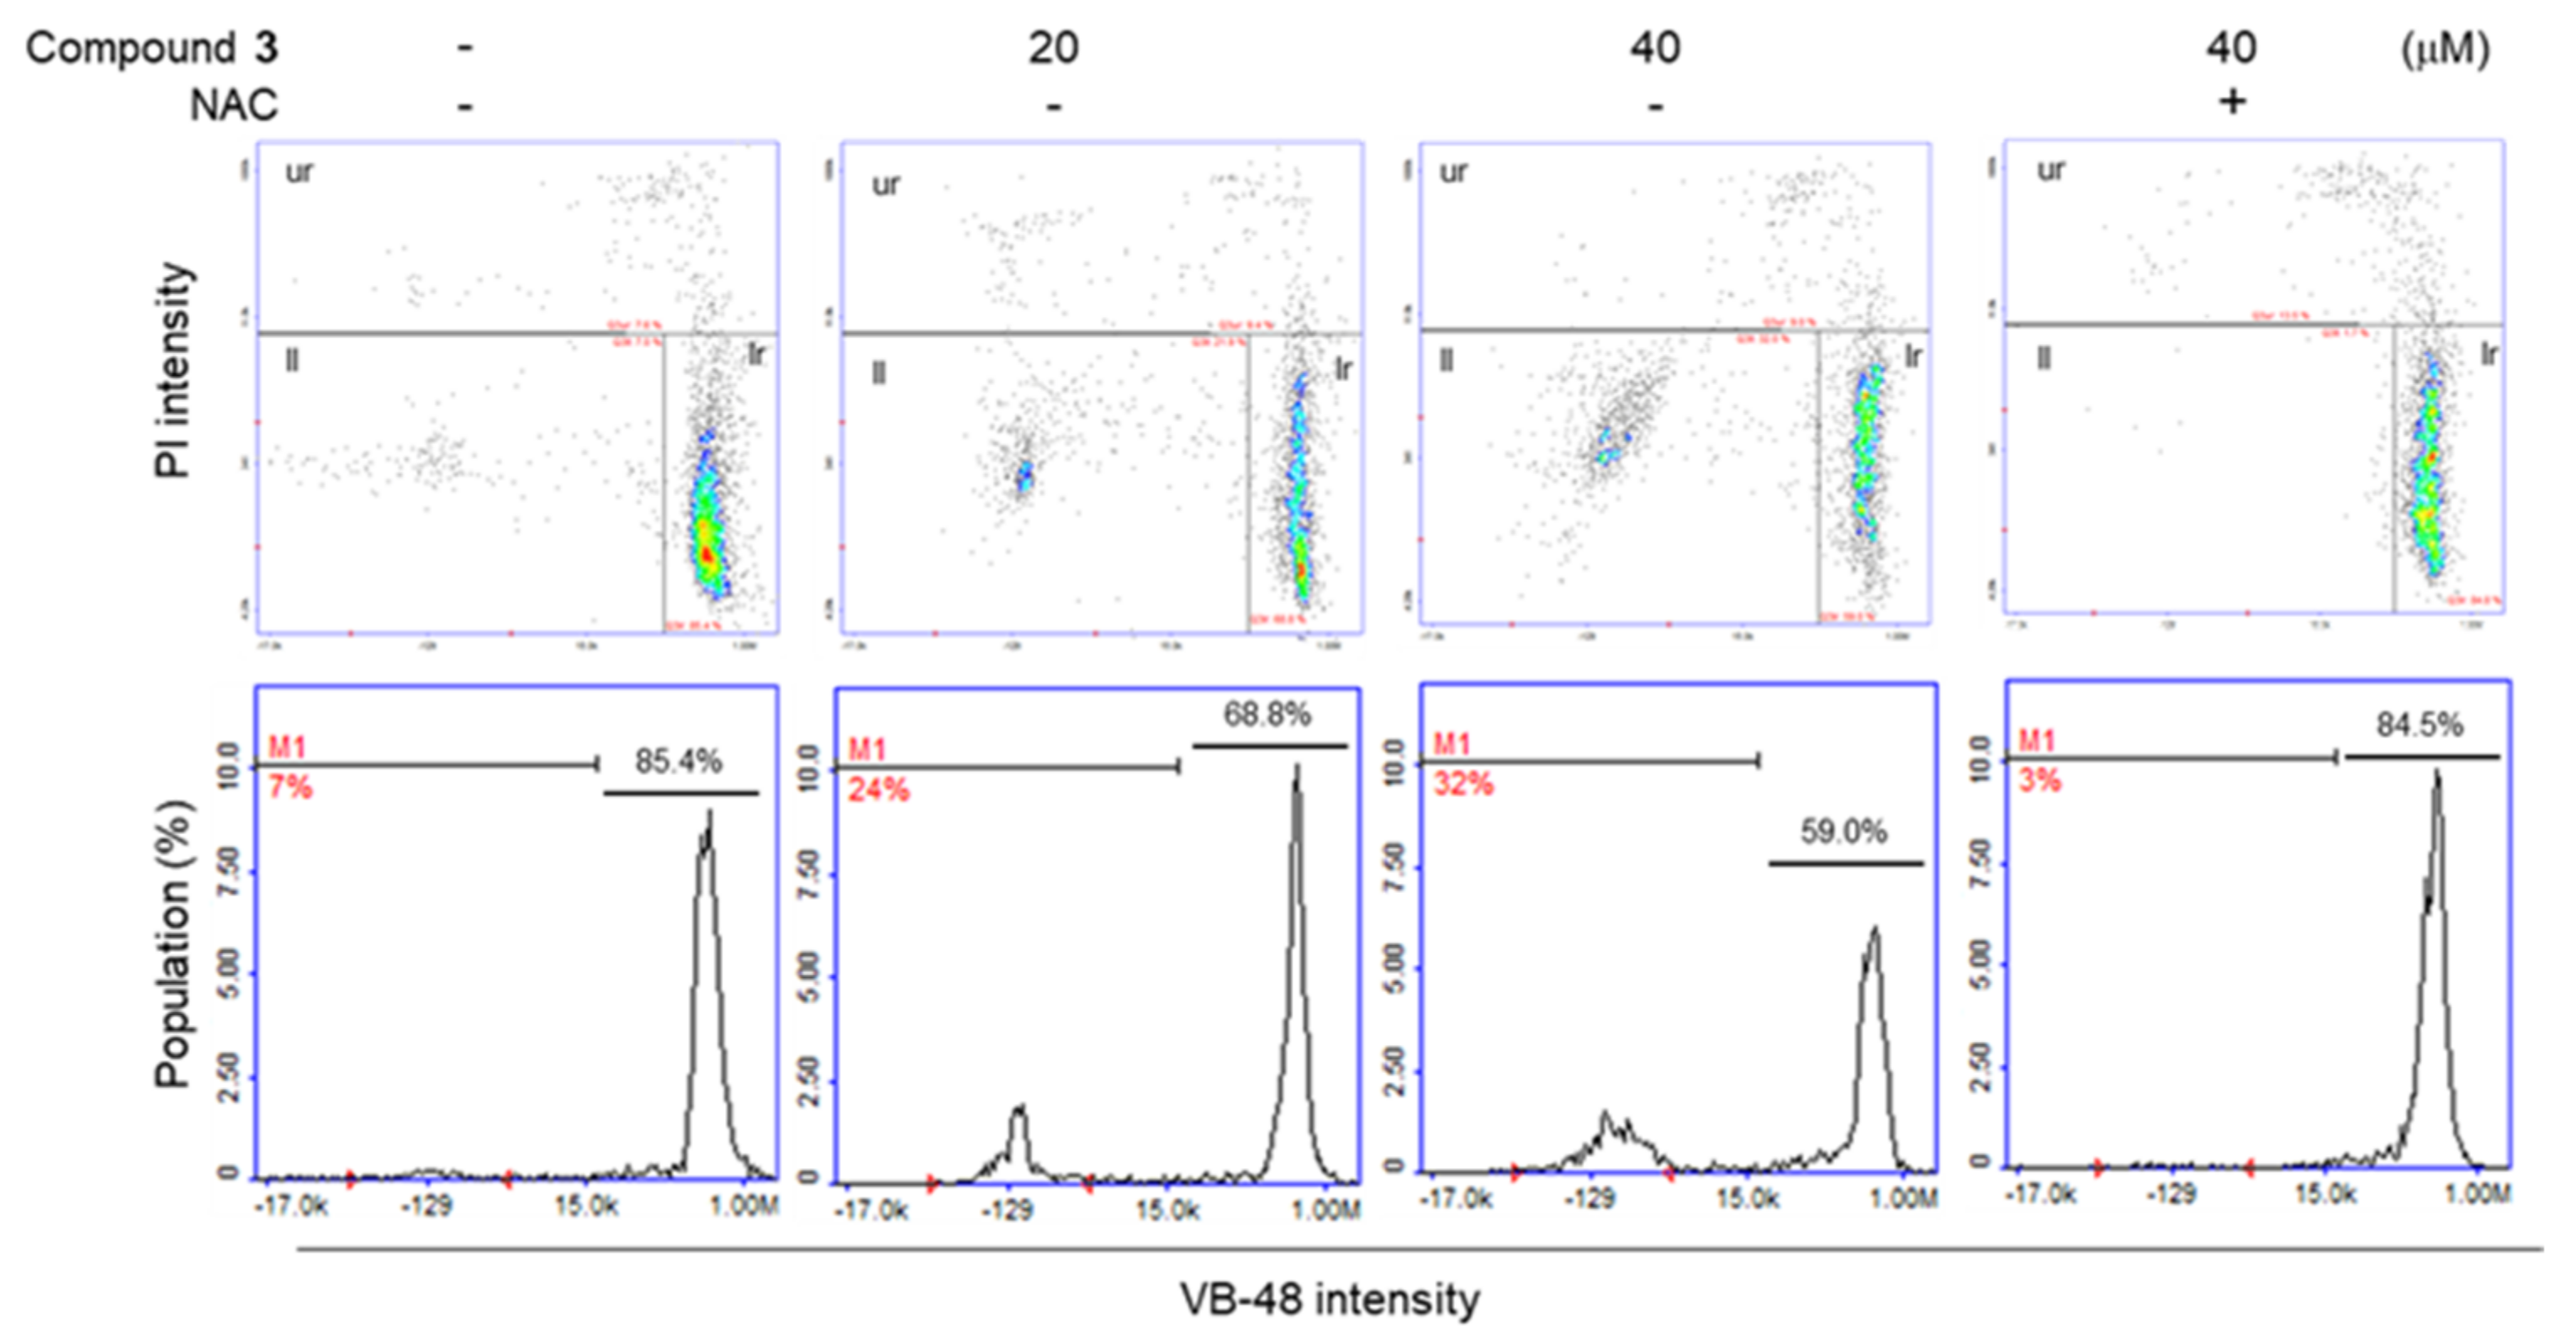
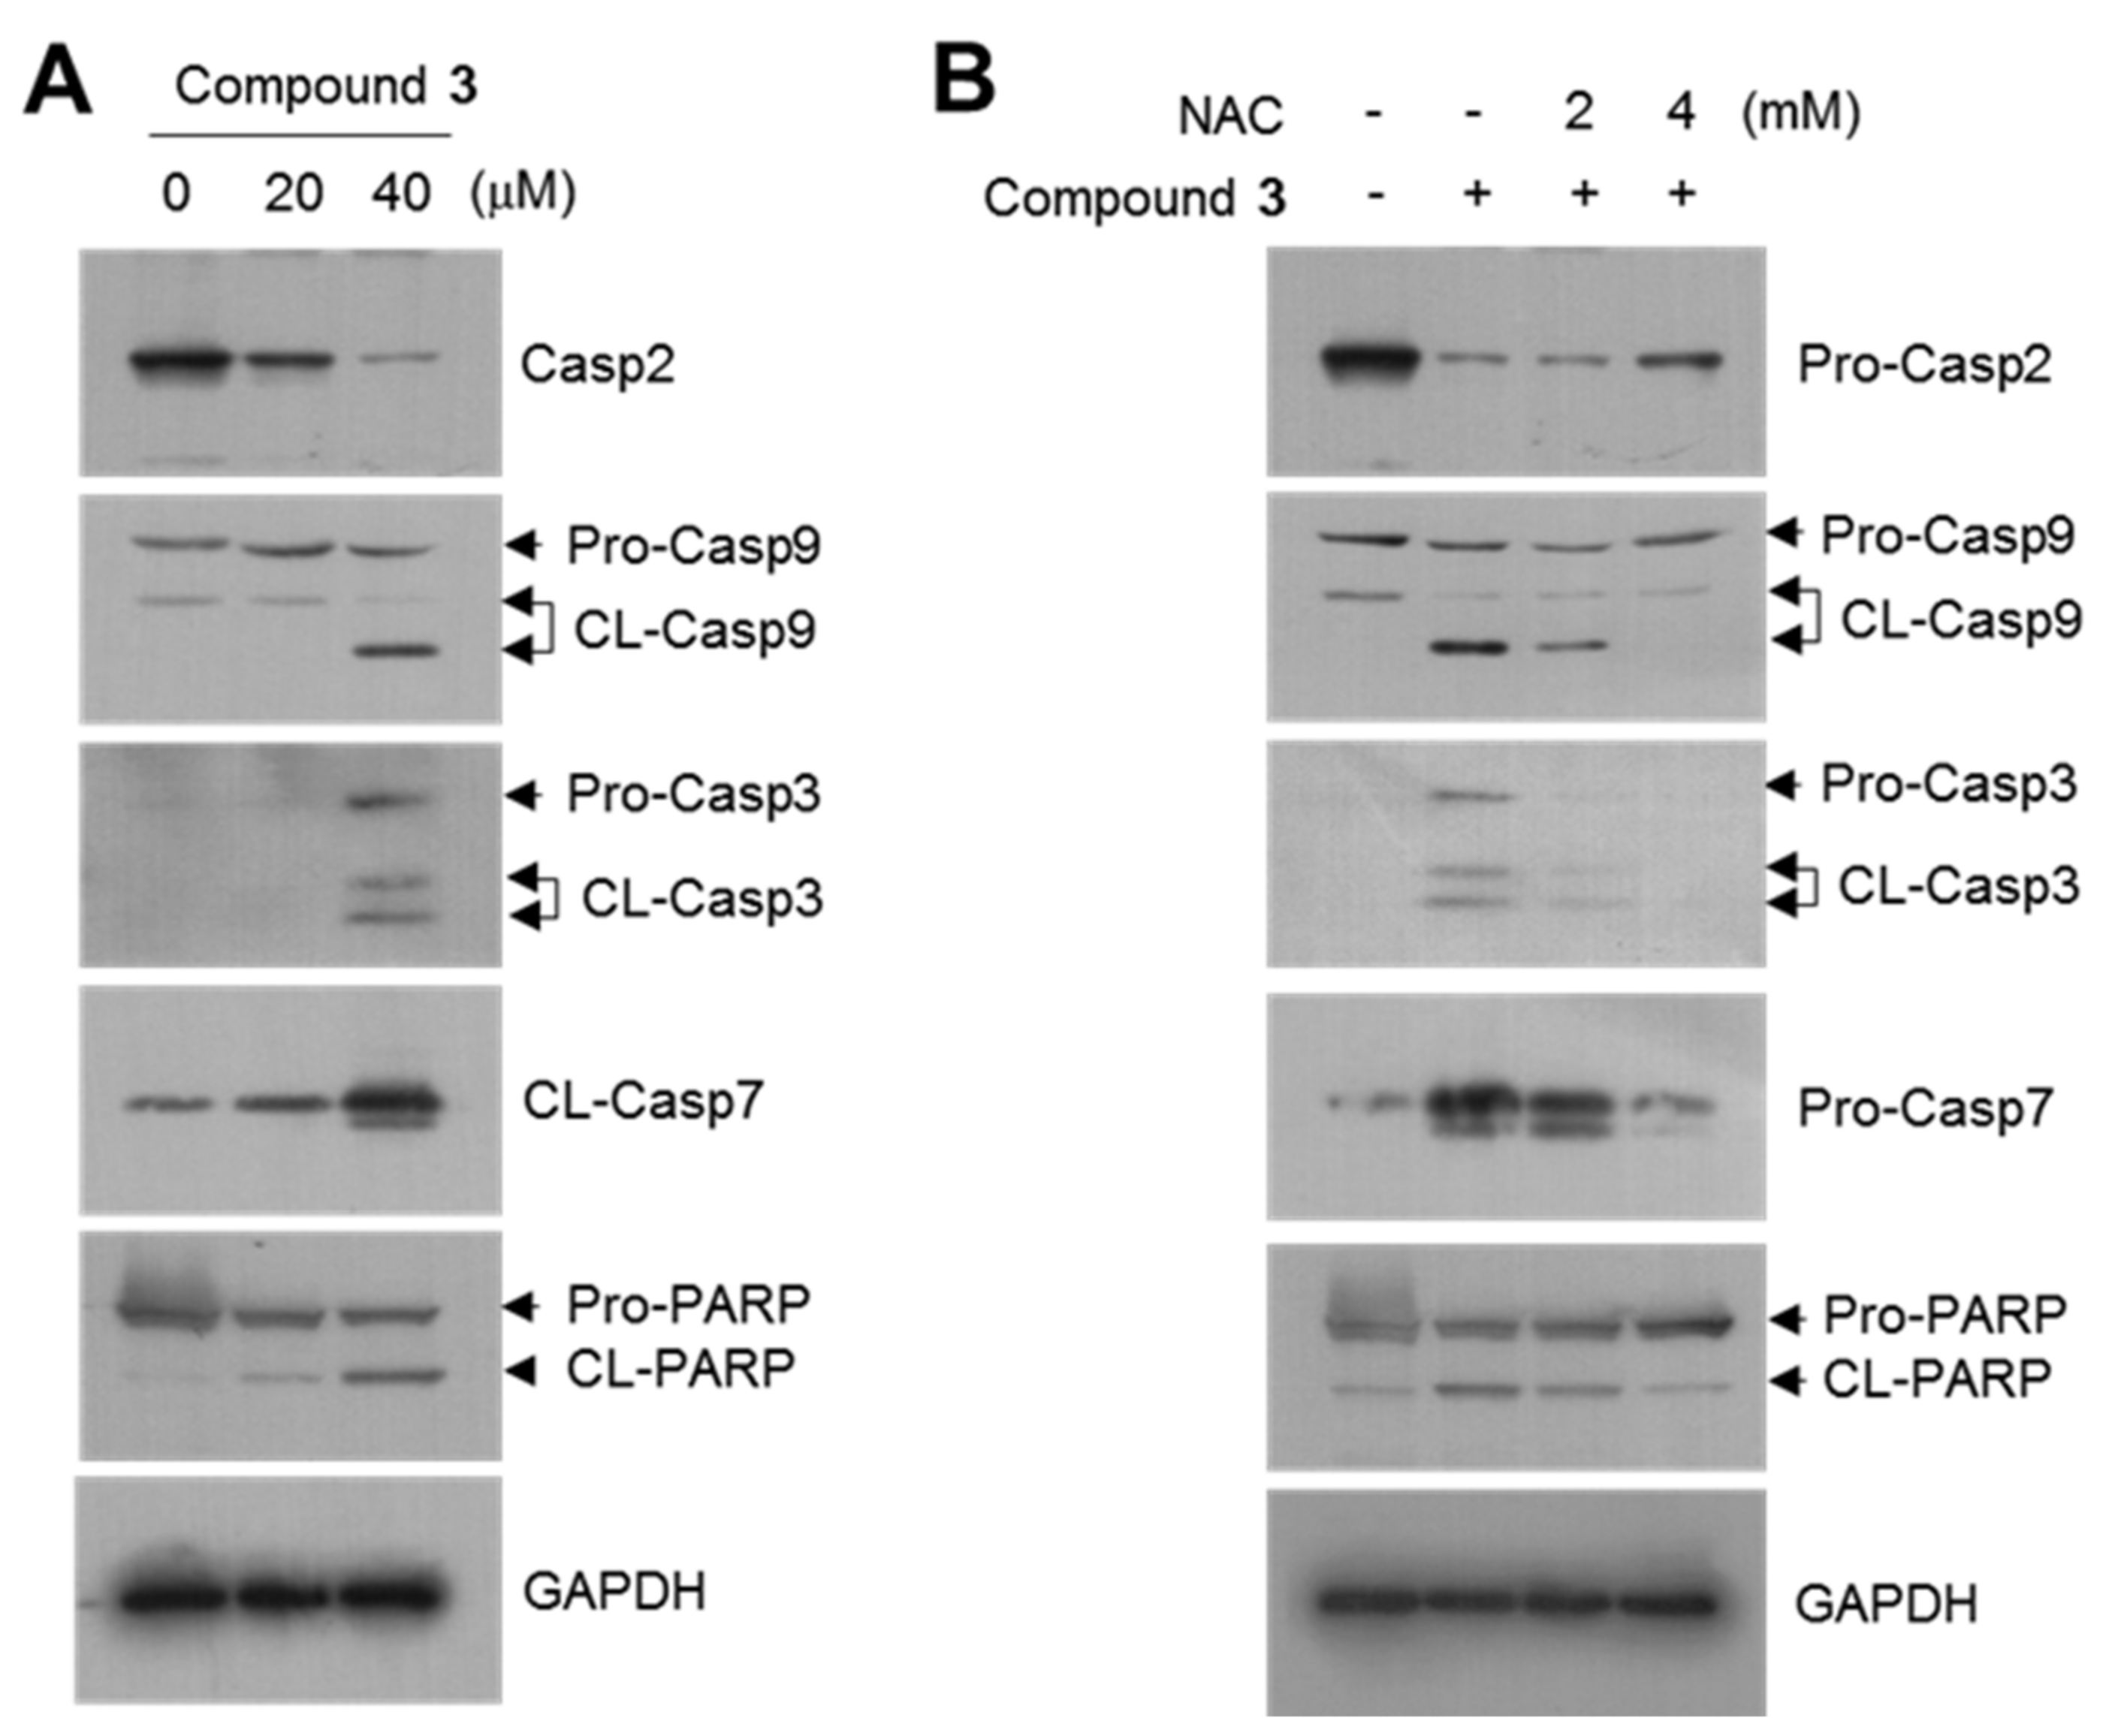
3.4. GSH Depletion by Compound 3 in HCT116 Human Colon Cancer Cells

We next determined whether compound 3 induces the depletion of intracellular GSH (Figure 6). Intracellular GSH content was analyzed using VitaBright-48TM dye that reacts with GSH, forming fluorescent products. Fluorescence cytometry shows that the treatment of HCT116 cells with 20 and 40 μM compounds 3 led to a decrease in cell population containing high GSH levels; 20 μM: from 85.4 to 68.8%; 40 μM: from 85.4 to 59.0% with concomitant increases in the unhealthy cell populations containing low GSH levels (M1). Notably, treatment with N-acetyl cysteine (NAC), a thiol-containing ROS scavenger, abrogated the compound 3-induced decrease in GSH levels.

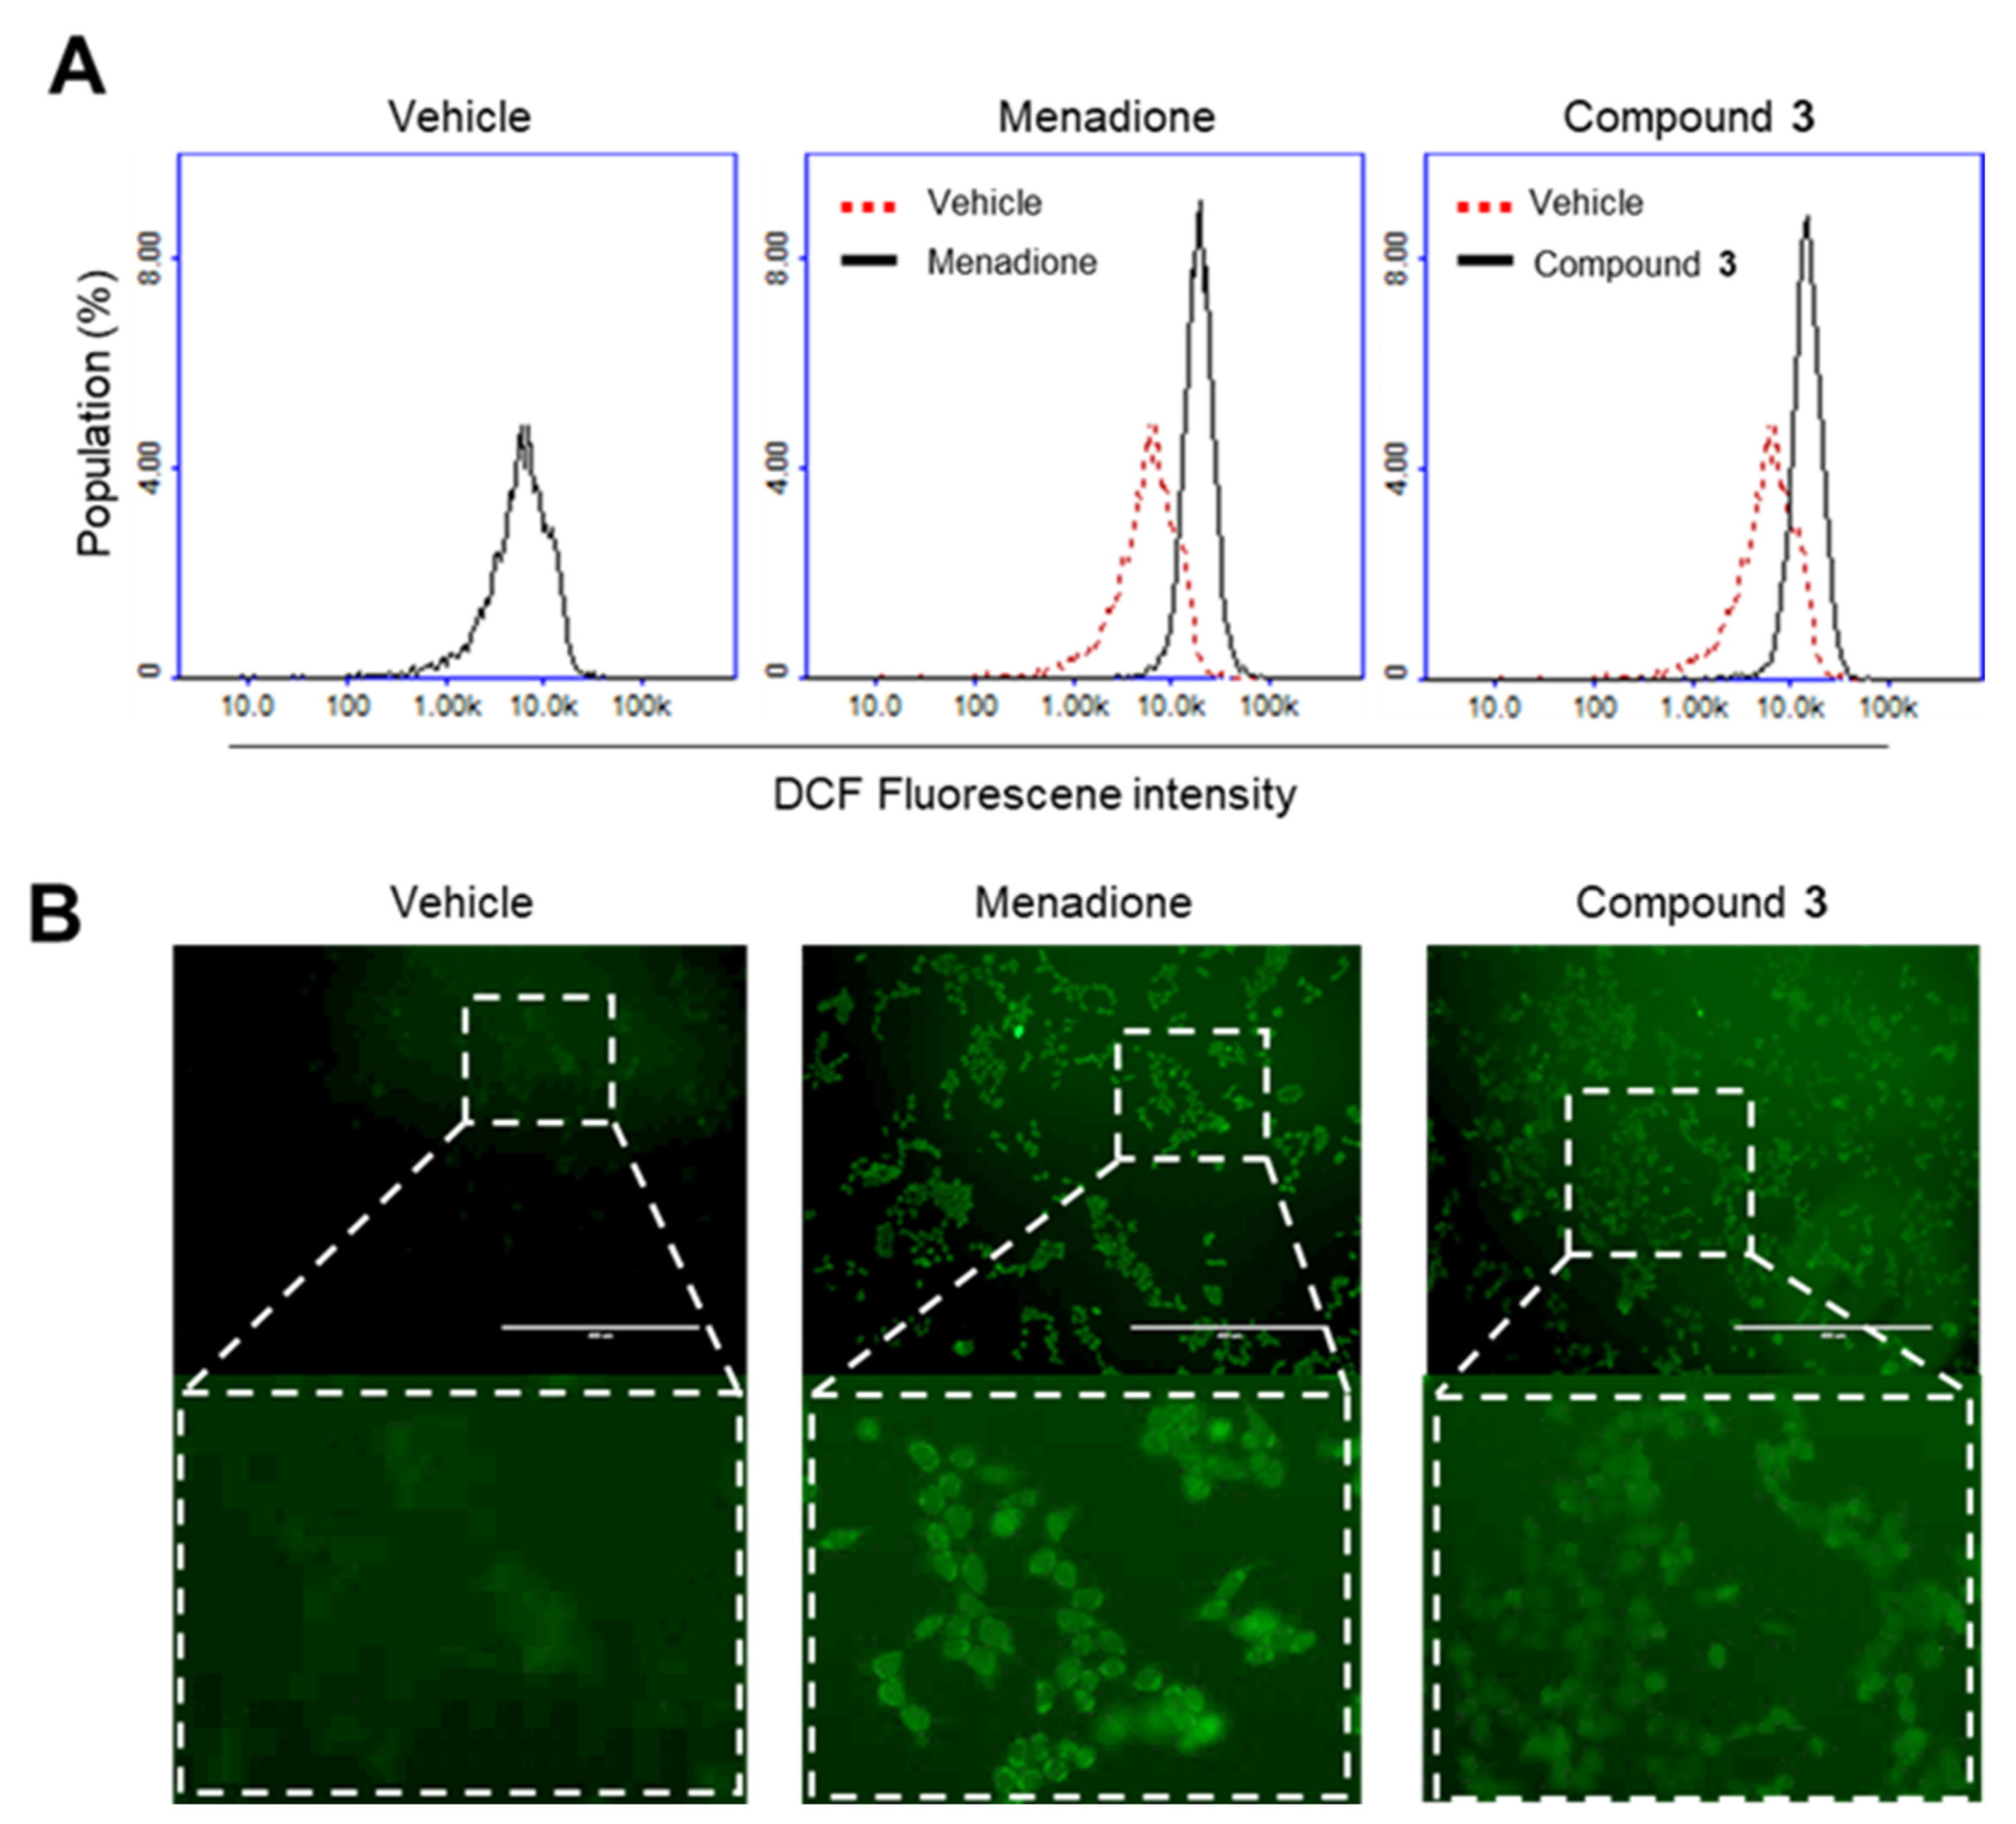
3.5. ROS Generation by Compound 3 in HCT116 Cells

The loss of intracellular GSH in cancer cells causes an increase in intracellular ROS [25,26,27,28,29,33]. To test the possibility that compound 3 generates ROS in HCT116 cells, we used a cell-permeant 2’,7’-dichlorofluorescein diacetate (DCF-DA) as a ROS-sensitive fluorescent probe. Menadione, a quinone molecule capable of catalyzing the singlet electron reduction in diatomic oxygen to superoxide [50], was used as a reference compound. The flow cytometry showed that compound 3 increased the DCF fluorescence, which is comparable to menadione (Figure 7A). An increase in the DCF fluorescence by compound 3 was visualized by fluorescence microscopy (Figure 7B). These data suggest that compound 3 produces intracellular ROS in HCT116 cells.

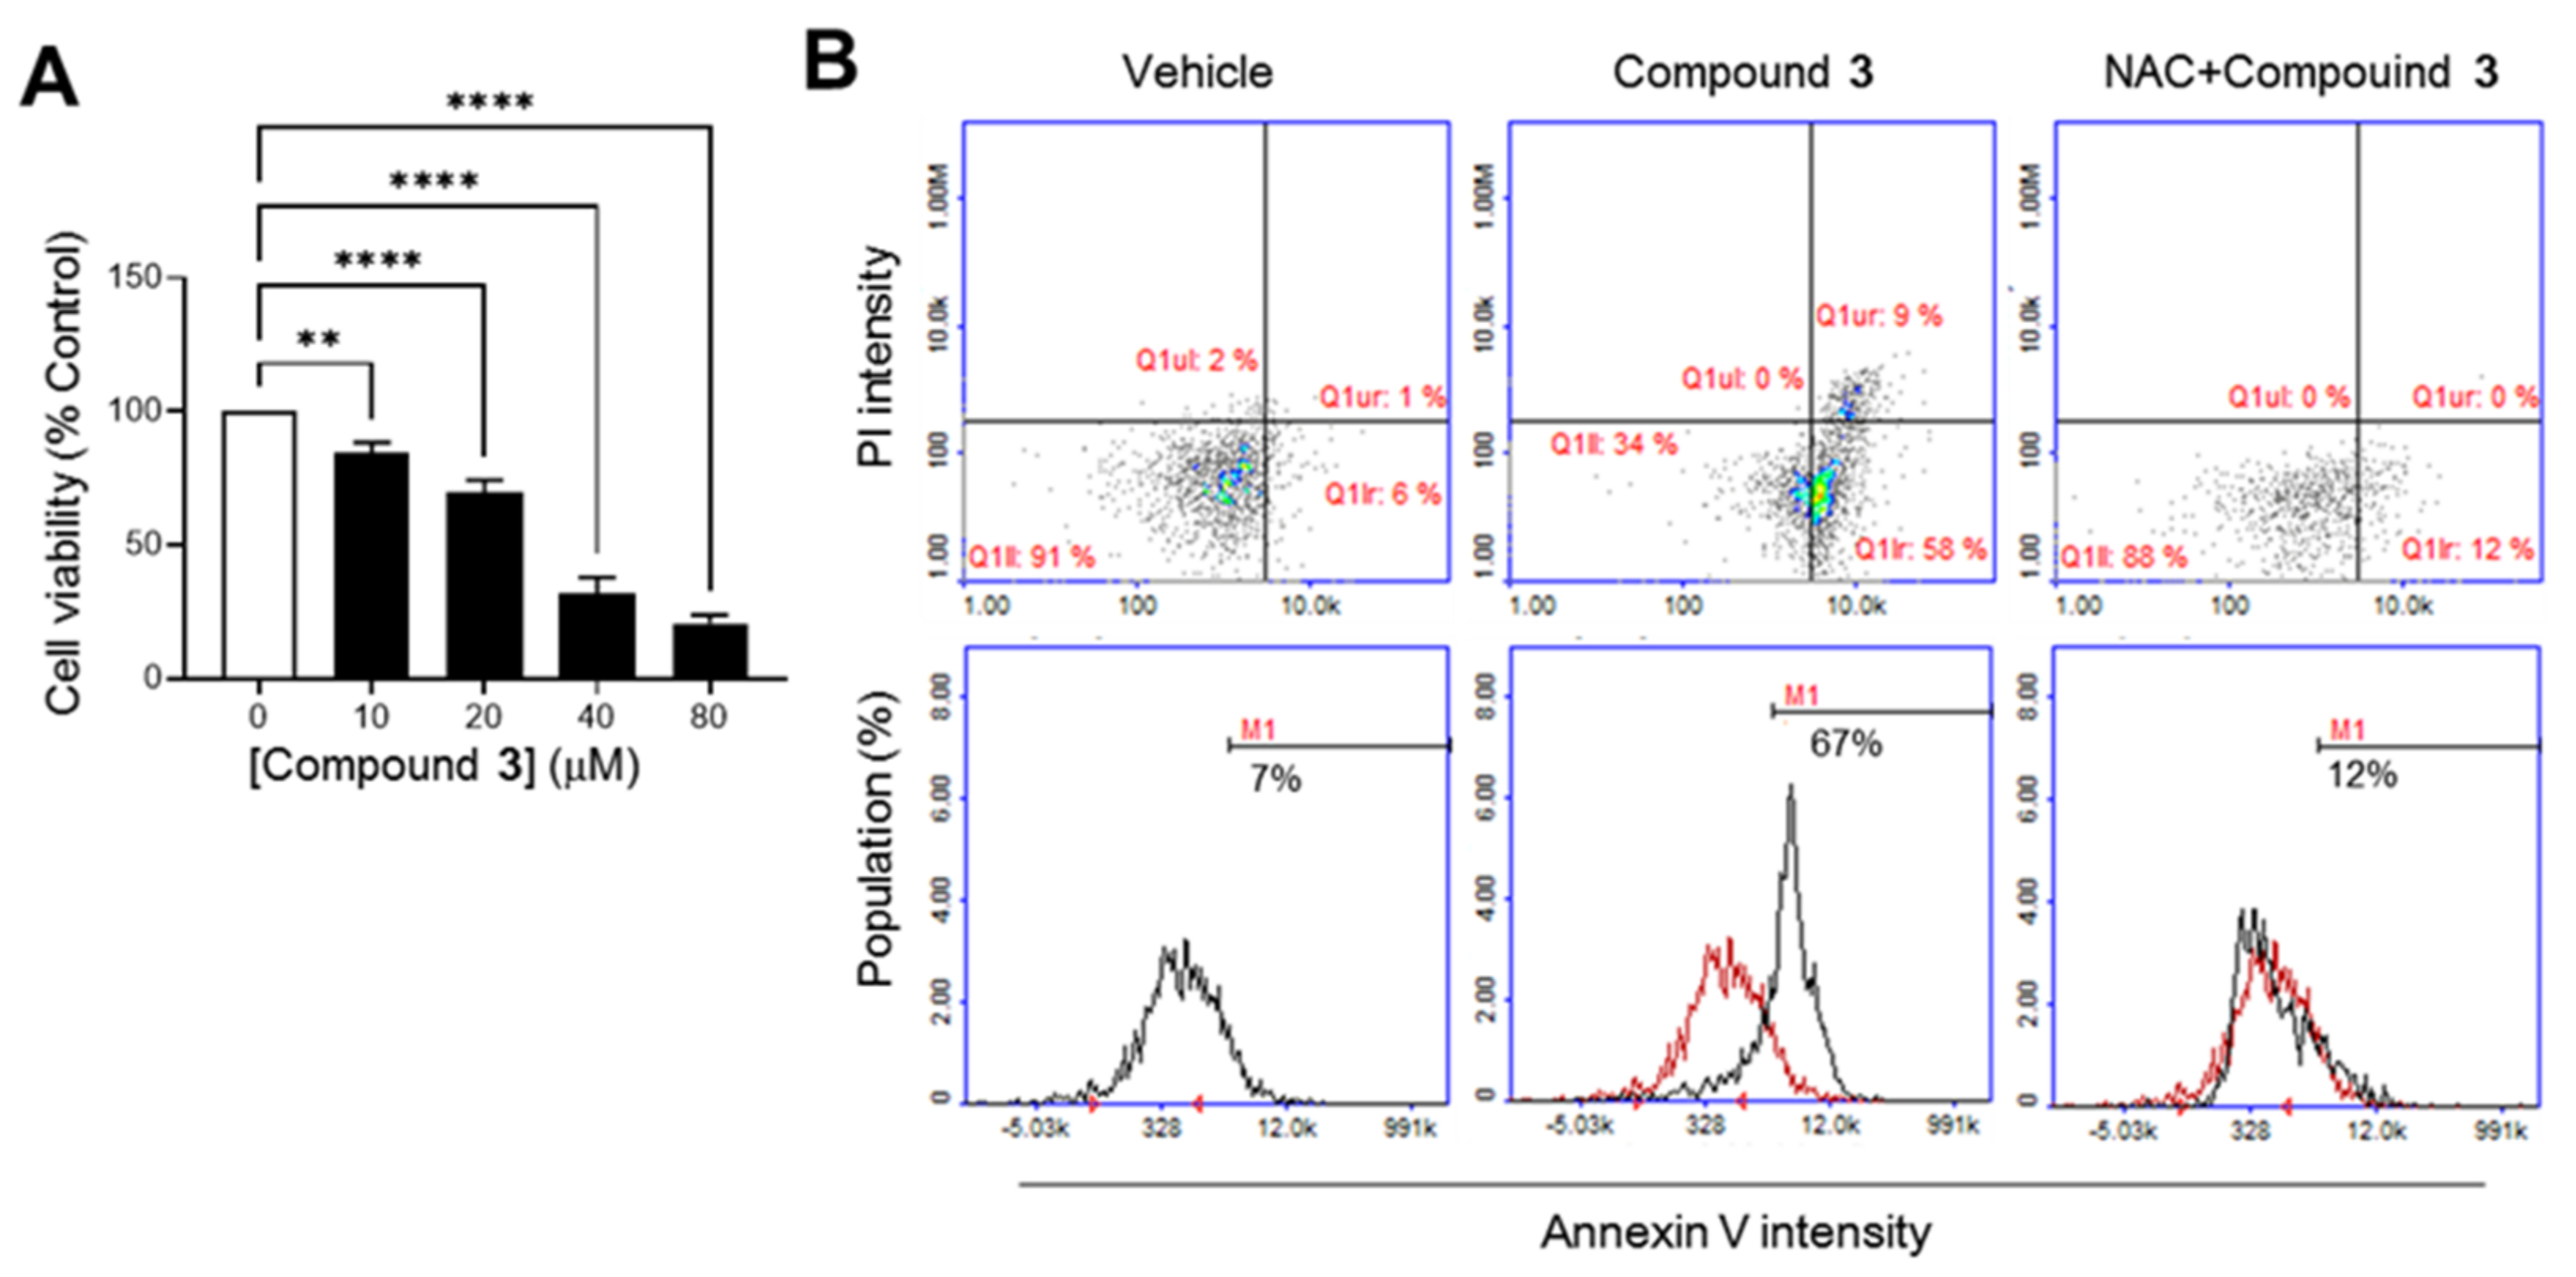
3.6. Apoptosis Activity of Compound 3

The elevation of ROS in the cancer cells triggers apoptosis [25,26,27,28,29,33]. We tested for the concentrations of compound 3 triggering cytotoxicity using a CCK-8 assay. Treatment with compound 3 decreased the cell viability in a dose-dependent manner (Figure 8A). We next investigated whether compound 3 triggers apoptosis by analyzing the presence of phosphatidylserine on the surface of the plasma membrane, a typical marker of apoptotic cells. As Annexin V preferentially binds to, such as phosphatidylserine [51], we analyzed the fluorescent staining of FITC-coupled Annexin V on the cells treated with compound 3 (Figure 8B). Cell-impermeant PI was used to detect the late apoptotic and/or necrotic dead cells. Annexin V-positive cells (AV+) are either early apoptotic (AV+/PI−) or late apoptotic/necrotic (AV+/PI+). Treatment with compound 3 decreased the population of the viable cells (lower left quadrants; AV−/PI−) from 91% to 34%, while early apoptotic cells (lower right quadrants; AV+/PI−) increased from 6% to 58%. The late apoptotic and/or dead cells (upper right quadrants; AV+/PI+) increased from 1% to 9%. Thus, the apoptotic/dead cells were totally increased from 7% to 67%, which was abrogated in the presence of NAC (bottom panels). These data suggest that compound 3 triggered cell death through apoptosis in HCT116 cells.
Caspases are cysteine-dependent proteases that are crucial mediators in the apoptotic pathways [52]. Pro-initiator caspases, such as caspase-2 and -9, are proteolytically activated, which in turn activate effector caspases (caspase-3 and -7) from the cleavage of inactive pro-forms. Then, activated effector caspases eventually trigger the apoptosis. We thus determined whether compound 3-induced apoptosis is mediated by the caspase cascade. The HCT116 cells were treated with 20 and 40 μM concentrations of compound 3 for 24 h. Immunoblot analysis showed that compound 3 cleaved both the initiator (caspase-2 and -9) and effector caspases (caspase-3 and -7) in a dose-dependent manner (Figure 9A). We also observed that pro-poly(ADP-ribose) polymerase (PARP), a substrate of the effector caspases, was cleaved by compound 3. The pretreatment of HCT116 cells with NAC substantially abrogated compound 3-induced cleavages of caspases and PARP (Figure 9B). These results suggest that compound 3 triggers apoptotic cell death through the activation of the caspase pathway.

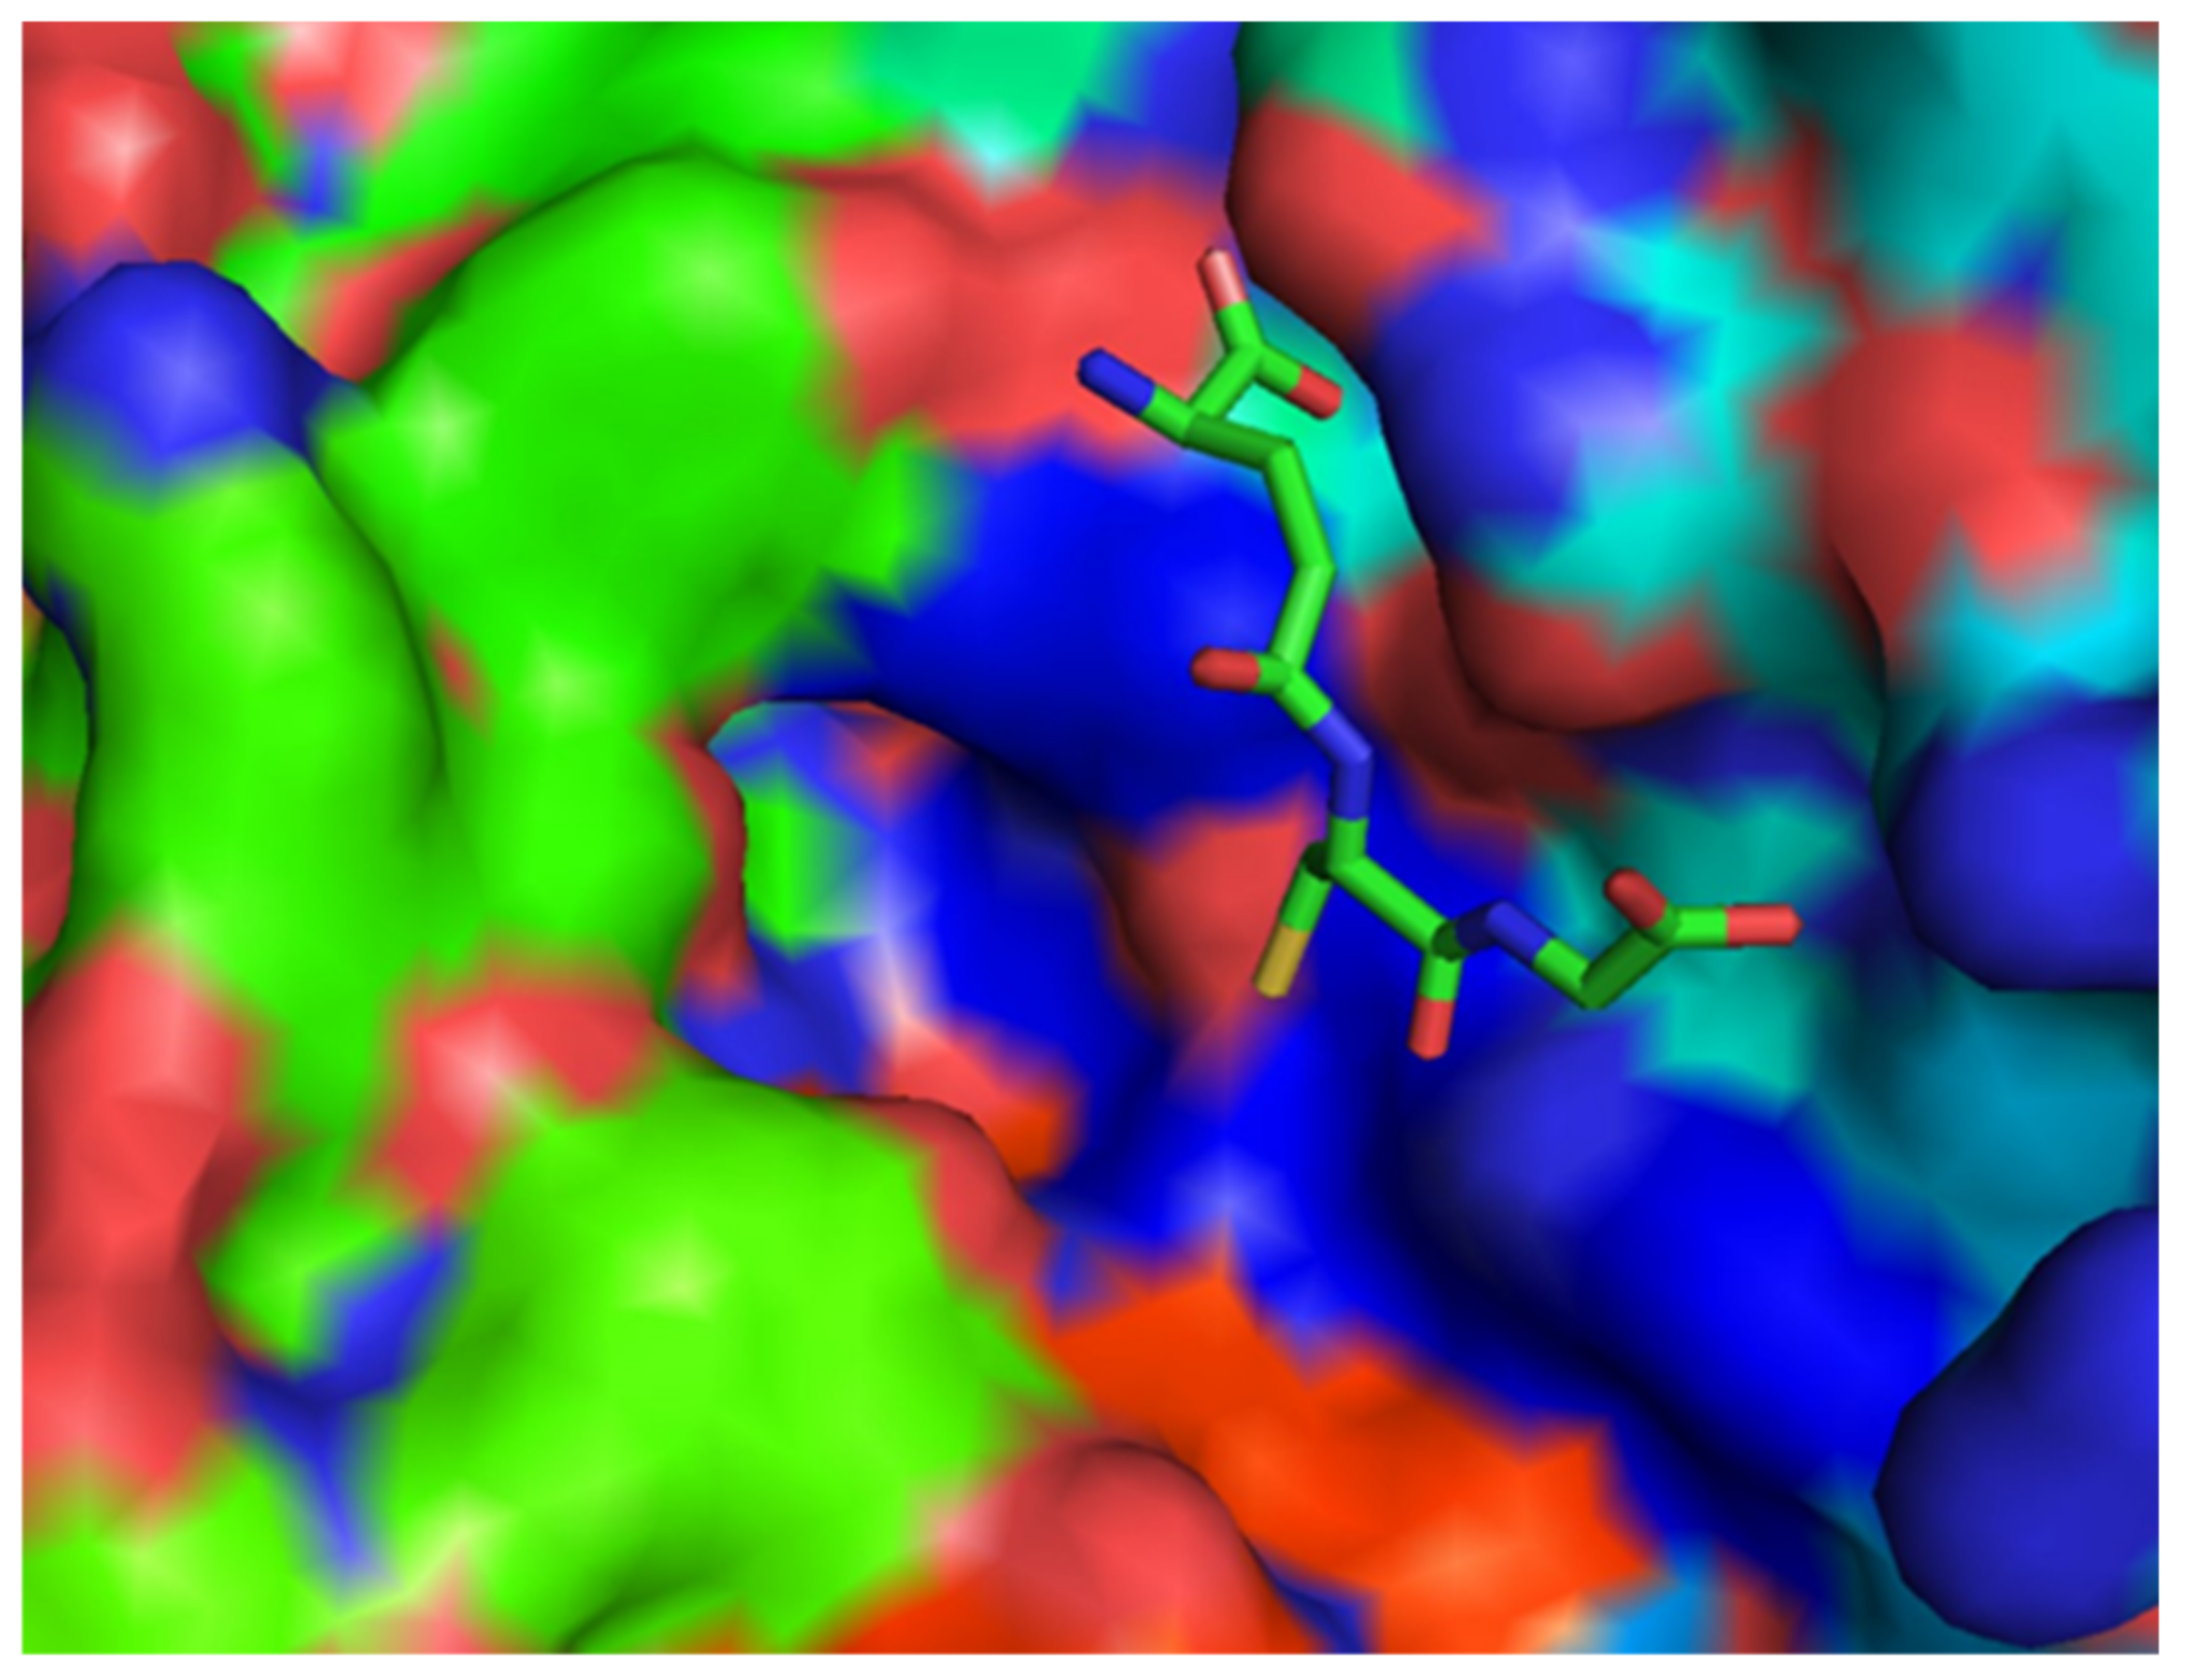
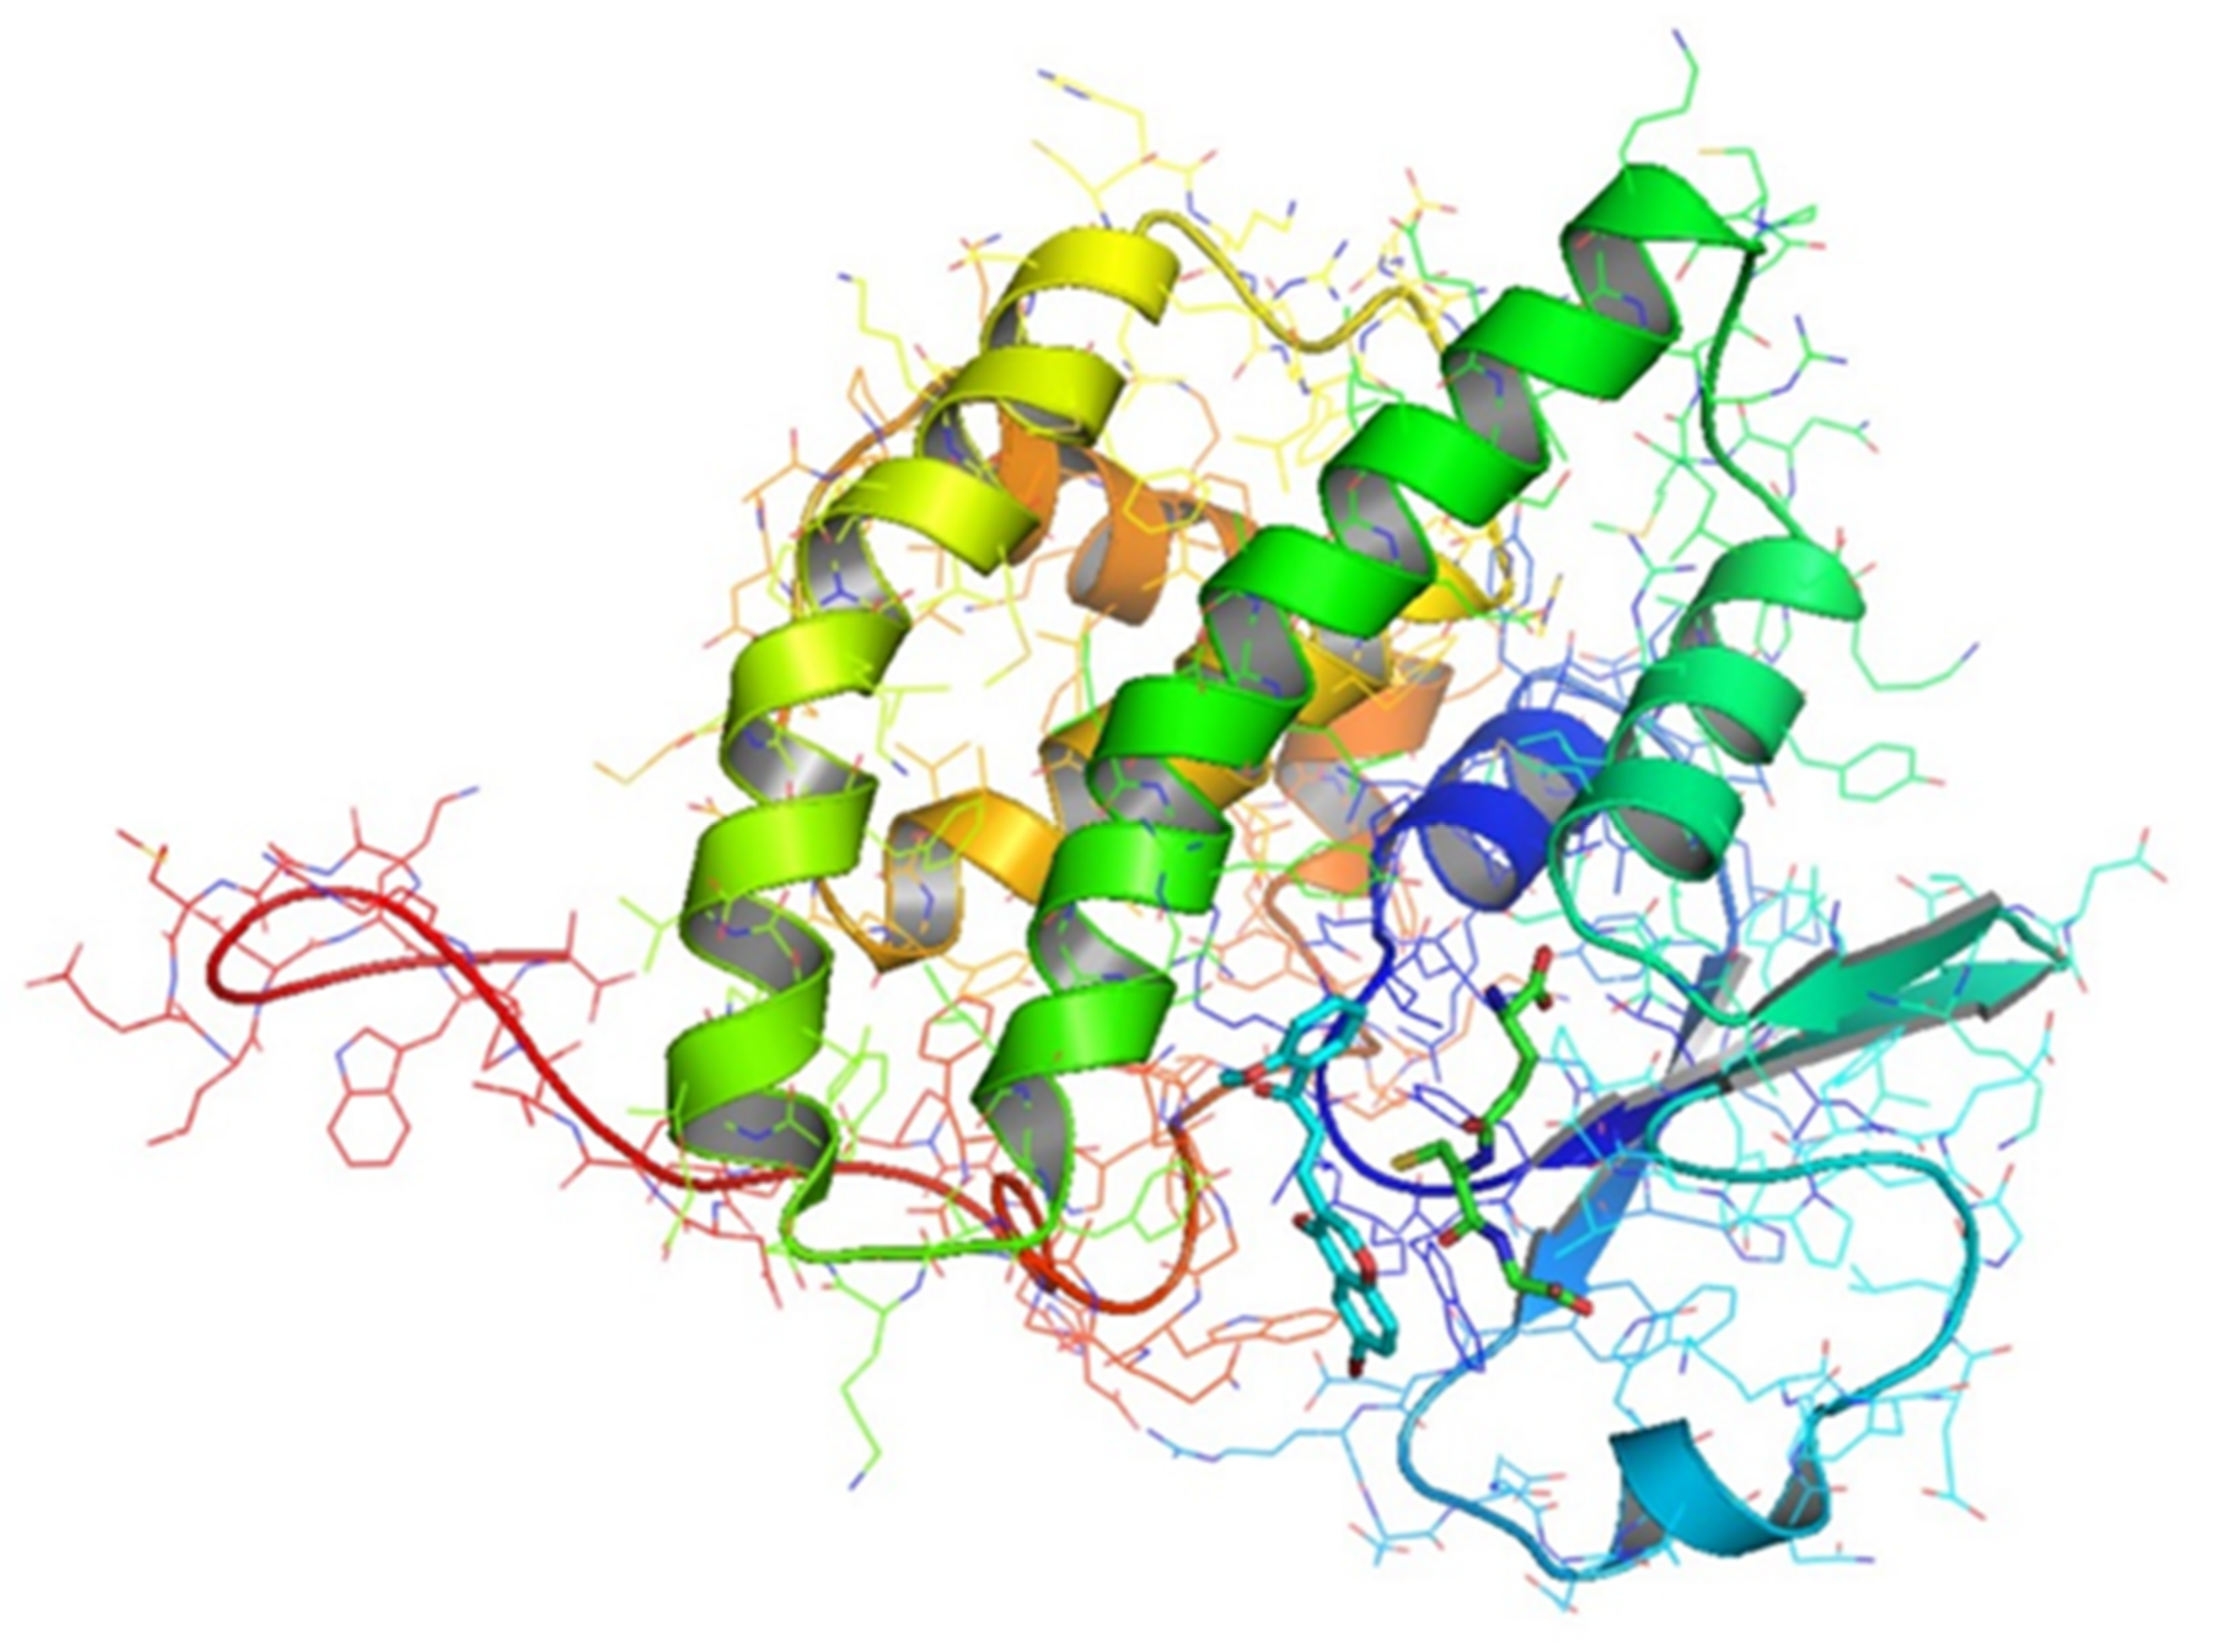
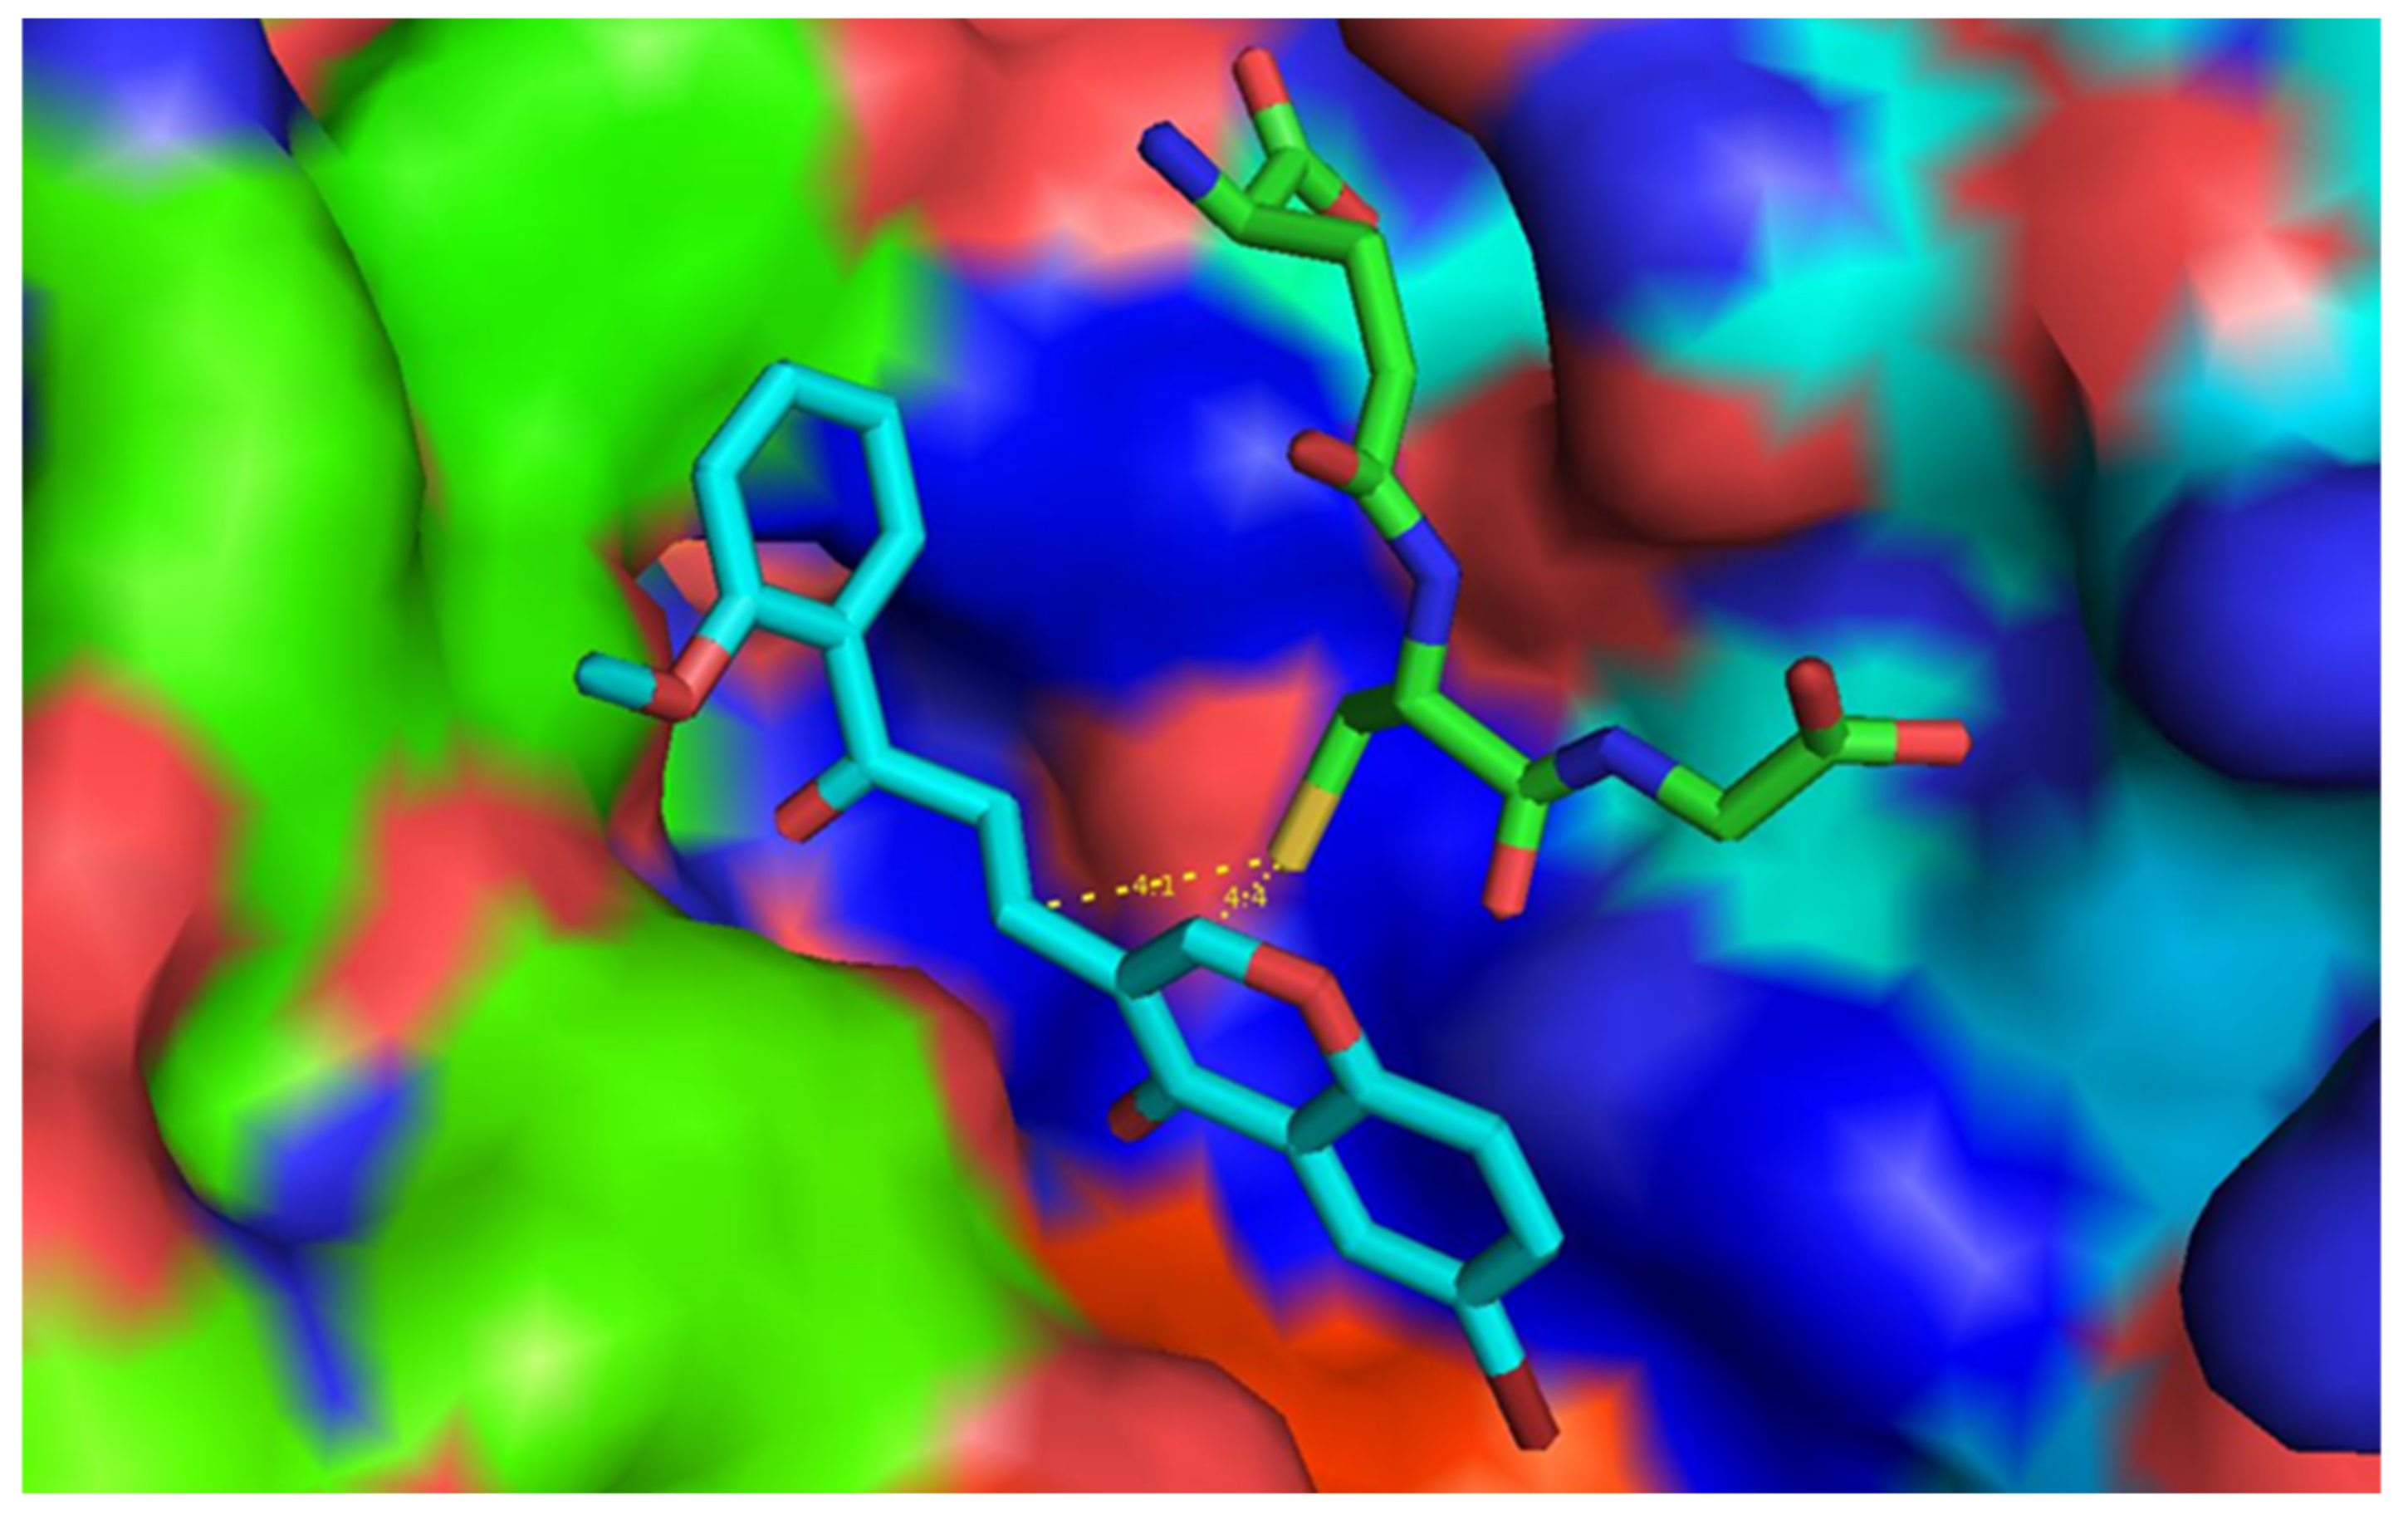
3.7. In Silico Docking with Glutathione S-Transferase (GST)

A compound containing the Michael acceptor is suggested to be critical for ROS elevation via glutathione depletion, based on the connection between the Michael acceptor and sulfur of glutathione bound to glutathione S-transferase (GST) [24]. Since compound 3 contains two Michael acceptor sites, the binding potential of compound 3 and glutathione was confirmed through the in silico docking experiments. Among the GST structures deposited on the protein data bank, 1gne.pdb was selected because it contains glutathione. The binding site was named as the glutathione binding site (G-site). Even though glutathione is contained in 1gne.pdb as a ligand, since our study aims to confirm whether compound 3 binds to glutathione, the pocket in which glutathione resides cannot be used for the binding site for compound 3 to be docked into the protein. As shown in Figure 10, the GST protein has a pocket next to glutathione.
Therefore, in this study, we attempted to dock compound 3 into the pocket next to glutathione. The crystallographic structure of compound 3 was used for in silico docking after energy minimization. The grid box for in silico docking was prepared as follows: the centers of x, y and z were −19.714, 16.028 and 27.483, respectively, and the sizes of x, y and z were 24, 22 and 24, respectively. Since AutoDock vina provides nine iteration results, nine docking complexes between GST–glutathione and compound 3 were generated (Figure S6). Their binding energy ranged from −6.6 kcal/mol to −5.0 kcal/mol. The first docking mode was selected based on its lowest binding energy and docking pose. Compound 3 is located side-by-side in glutathione (Figure 11).
The title molecule 3 has two conjugated enone (α, β-unsaturated carbonyl) groups that act as Michael acceptors; one for chalcone unit [C10=C11–C12=O3] and one for flavone unit (C3=C2–C1=O1). β-Carbons C10 or C3 in the Michael acceptors are critical for ROS elevation via glutathione depletion based on the connection between the Michael acceptor and the sulfur of glutathione [24]. The distances between C10 and the sulfur of glutathione and C3 and sulfur, are 4.1 Å and 4.4 Å, respectively (Figure 12).
The flavone–chalcone hybrid compound 3 can be considered to affect glutathione, which may result in ROS elevation via glutathione depletion. Therefore, in vitro ROS generation caused by compound 3 can be explained based on the in silico docking results.

4. Conclusions

ROS production in cancer cells is an attractive strategy for developing therapeutic approaches that selectively kill cancer cells. Compounds with conjugate carbonyl groups act as Michael reaction acceptors and have the effect of removing GSH from within cancer cells. As a result, they play a key role in killing cancer cells by increasing the concentration of ROS. A novel flavone–chalcone hybrid compound 3 was designed and synthesized by combining flavone and chalcone, which have conjugate carbonyl groups in each molecule. The 3D structure of compound 3 was identified by X-ray analysis. In the crystal, two hydrogen bonds formed inversion dimers and these dimers were extended along the a axis by another hydrogen bond. The 2D fingerprint plots of Hirshfeld surface analyses revealed that H⋯H, O⋯H and C⋯H interactions are the major contributions to overall crystal packing.
The treatment of HCT116 cells with compound 3, led to a decrease in cell population containing high GSH levels, which was verified by fluorescence cytometry. The loss of intracellular GSH in cancer cells caused an increase in intracellular ROS. An increase in the ROS-sensitive DCF fluorescence by compound 3, suggested that compound 3 produced intracellular ROS in HCT116 cells. When the HCT116 cells were treated with different concentrations of compound 3, the cell viability decreased in a dose-dependent manner. The mode of action by compound 3 was elucidated by its effect on the ROS generation which was confirmed by decreasing the GSH levels. It was also unveiled that compound 3-induced ROS triggered caspase-mediated apoptosis in the HCT116 cells. In silico experiments confirmed that compound 3 is present at a sufficiently close distance to glutathione bound to GST, reacts with glutathione and enhances ROS by removing glutathione. Compound 3 may represent a promising novel anticancer agent for ROS generation through glutathione depletion in human colon cancer cells.

Supplementary Materials

The following supporting information can be downloaded at: https://0-www-mdpi-com.brum.beds.ac.uk/article/10.3390/cryst12010108/s1, CIF file and NMR spectra and mass spectrum for compound 3. Figure S1: 1H NMR spectrum of compound 3; Figure S2: 13C-NMR spectrum of compound 3; Figure S3: mass spectrum of compound 3; Figure S4: all possible intermolecular interactions and their contribution to the overall molecular packing interactions; and Figure S5: Hirshfeld surfaces mapped with dnorm, shape index and curvedness (A). The Hirshfeld surface mapped over dnorm highlighting the area of intermolecular C–H⋯O contacts, where two molecules formed inversion dimer linkage through the dark red spots on the dnorm Hirshfeld surface (B); Figure S6: The 3D image obtained from nine iterated docking results between compound 3 and glutathione S-transferase containing glutathione (red color) generated by PyMol.

Author Contributions

Conceptualization, D.K., S.A. and S.Y.S.; investigation, S.A., J.H.R., E.J. and M.Y.; validation, H.-J.L. and Y.L.; writing—original draft, S.A., D.K.; writing—review and editing, S.Y.S. All authors have read and agreed to the published version of the manuscript.

Funding

The authors acknowledge financial support from the Basic Science Research Program (award No. NRF-2021R1F1A1052699). S.Y. Shin was supported by the KU Research Professor Program of Konkuk University.

Data Availability Statement

Not applicable.

Conflicts of Interest

The authors declare no conflict of interest.

References

  1. Sies, H.; Jones, D.P. Reactive oxygen species (ROS) as pleiotropic physiological signalling agents. Nat. Rev. Mol. Cell. Biol. 2020, 21, 363–383. [Google Scholar] [CrossRef] [PubMed]
  2. Collin, F. Chemical Basis of Reactive Oxygen Species Reactivity and Involvement in Neurodegenerative Diseases. Int. J. Mol. Sci. 2019, 20, 2407. [Google Scholar] [CrossRef] [PubMed] [Green Version]
  3. Auten, R.; Davis, J. Oxygen Toxicity and Reactive Oxygen Species: The Devil Is in the Details. Pediatr. Res. 2009, 66, 121–127. [Google Scholar] [CrossRef] [Green Version]
  4. Rodriguez, R.; Redman, R. Balancing the generation and elimination of reactive oxygen species. Proc. Natl. Acad. Sci. USA 2005, 102, 3175–3176. [Google Scholar] [CrossRef] [PubMed] [Green Version]
  5. Finkel, T. Signal transduction by reactive oxygen species. J. Cell Biol. 2011, 194, 7–15. [Google Scholar] [CrossRef] [PubMed] [Green Version]
  6. Ray, P.D.; Huang, B.W.; Tsuji, Y. Reactive oxygen species (ROS) homeostasis and redox regulation in cellular signaling. Cell. Signal. 2012, 24, 981–990. [Google Scholar] [CrossRef] [Green Version]
  7. Valko, M.; Leibfritz, D.; Moncol, J.; Cronin, M.T.; Mazur, M.; Telser, J. Free radicals and antioxidants in normal physiological functions and human disease. Int. J. Biochem. Cell Biol. 2007, 39, 44–84. [Google Scholar] [CrossRef]
  8. Kim, J.; Kim, J.; Bae, J.-S. ROS homeostasis and metabolism: A critical liaison for cancer therapy. Exp. Mol. Med. 2016, 48, e269. [Google Scholar] [CrossRef] [PubMed] [Green Version]
  9. Szatrowski, T.P.; Nathan, C.F. Production of large amounts of hydrogen peroxide by human tumor cells. Cancer Res. 1991, 51, 794–798. [Google Scholar] [PubMed]
  10. Lee, A.C.; Fenster, B.E.; Ito, H.; Takeda, K.; Bae, N.S.; Hirai, T.; Yu, Z.X.; Ferrans, V.J.; Howard, B.H.; Finkel, T. Ras proteins induce senescence by altering the intracellular levels of reactive oxygen species. J. Biol. Chem. 1999, 274, 7936–7940. [Google Scholar] [CrossRef] [Green Version]
  11. Trachootham, D.; Alexandre, J.; Huang, P. Targeting cancer cells by ROS-mediated mechanisms: A radical therapeutic approach? Nat. Rev. Drug Discov. 2009, 8, 579–591. [Google Scholar] [CrossRef]
  12. Teppo, H.R.; Soini, Y.; Karihtala, P. Reactive oxygen species-mediated mechanisms of action of targeted cancer therapy. Oxid. Med. Cell Longev. 2017, 2017, 1485283. [Google Scholar] [CrossRef] [PubMed]
  13. Rigas, B.; Sun, Y. Induction of oxidative stress as a mechanism of action of chemopreventive agents against cancer. Br. J. Cancer 2008, 98, 1157–1160. [Google Scholar] [CrossRef] [PubMed] [Green Version]
  14. Diehn, M.; Cho, R.W.; Lobo, N.A.; Kalisky, T.; Dorie, M.J.; Kulp, A.N.; Qian, D.; Lam, J.S.; Ailles, L.E.; Wong, M.; et al. Association of reactive oxygen species levels and radioresistance in cancer stem cells. Nature 2009, 458, 780–783. [Google Scholar] [CrossRef] [PubMed]
  15. Schumacker, P.T. Reactive oxygen species in cancer cells: Live by the sword, die by the sword. Cancer Cell 2006, 10, 175–176. [Google Scholar] [CrossRef] [Green Version]
  16. Fruehauf, J.P.; Meyskens, F.L., Jr. Reactive oxygen species: A breath of life or death? Clin. Cancer Res. 2007, 13, 789–794. [Google Scholar] [CrossRef] [PubMed] [Green Version]
  17. Perillo, B.; Di Donato, M.; Pezone, A.; Di Zazzo, E.; Giovannelli, P.; Galasso, G.; Castoria, G.; Migliaccio, A. ROS in cancer therapy: The bright side of the moon. Exp. Mol. Med. 2020, 52, 192–203. [Google Scholar] [CrossRef]
  18. Bauer, D.; Werth, F.; Nguyen, H.A.; Kiecker, F.; Eberle, J. Critical role of reactive oxygen species (ROS) for synergistic enhancement of apoptosis by vemurafenib and the potassium channel inhibitor TRAM-34 in melanoma cells. Cell Death Dis. 2017, 8, e2594. [Google Scholar] [CrossRef]
  19. Raj, L.; Ide, T.; Gurkar, A.; Gurkar, A.U.; Foley, M.; Schenone, M.; Li, X.; Tolliday, N.J.; Golub, T.R.; Carr, S.A.; et al. Selective killing of cancer cells by a small molecule targeting the stress response to ROS. Nature 2011, 475, 231–234. [Google Scholar] [CrossRef] [PubMed]
  20. Trachootham, D.; Zhou, Y.; Zhang, H.; Demizu, Y.; Chen, Z.; Pelicano, H.; Chiao, P.J.; Achanta, G.; Arlinghaus, R.B.; Liu, J.; et al. Selective killing of oncogenically transformed cells through a ROS-mediated mechanism by beta-phenylethyl isothiocyanate. Cancer Cell 2006, 10, 241–252. [Google Scholar] [CrossRef] [Green Version]
  21. Shaw, A.T.; Winslow, M.M.; Magendantz, M.; Ouyang, C.; Dowdle, J.; Subramanian, A.; Lewis, T.A.; Maglathin, R.L.; Tolliday, N.; Jacks, T. Selective killing of K-ras mutant cancer cells by small molecule inducers of oxidative stress. Proc. Natl. Acad. Sci. USA 2011, 108, 8773–8778. [Google Scholar] [CrossRef] [PubMed] [Green Version]
  22. Brenneisen, P.; Reichert, A.S. Nanotherapy and reactive oxygen species (ROS) in cancer: A novel perspective. Antioxidants 2018, 7, 31. [Google Scholar] [CrossRef] [Green Version]
  23. Huang, P.; Feng, L.; Oldham, E.A.; Keating, M.J.; Plunkett, W. Superoxide dismutase as a target for the selective killing of cancer cells. Nature 2000, 407, 390–395. [Google Scholar] [CrossRef]
  24. Adams, D.J.; Dai, M.; Pellegrino, G.; Wagner, B.K.; Stern, A.M.; Shamji, A.F.; Schreiber, S.L. Synthesis, cellular evaluation, and mechanism of action of piperlongumine analogs. Proc. Natl. Acad. Sci. USA 2012, 109, 15115–15120. [Google Scholar] [CrossRef] [PubMed] [Green Version]
  25. Franco, R.; Cidlowski, J.A. Apoptosis and glutathione: Beyond an antioxidant. Cell Death Differ. 2009, 16, 1303–1314. [Google Scholar] [CrossRef] [Green Version]
  26. Yue, P.; Zhou, Z.; Khuri, F.R.; Sun, S.Y. Depletion of intracellular glutathione contributes to JNK-mediated death receptor 5 upregulation and apoptosis induction by the novel synthetic triterpenoid methyl-2-cyano-3,12-dioxooleana-1,9-dien-28-oate (CDDO-Me). Cancer Biol. Ther. 2006, 5, 492–497. [Google Scholar] [CrossRef] [Green Version]
  27. Chakravarthi, S.; Jessop, C.E.; Bulleid, N.J. The role of glutathione in disulphide bond formation and endoplasmic-reticulum-generated oxidative stress. EMBO Rep. 2006, 7, 271–275. [Google Scholar] [CrossRef] [PubMed] [Green Version]
  28. Simon, H.U.; Haj-Yehia, A.; Levi-Schaffer, F. Role of reactive oxygen species (ROS) in apoptosis induction. Apoptosis 2000, 5, 415–418. [Google Scholar] [CrossRef] [PubMed]
  29. Shan, F.; Shao, Z.; Jiang, S.; Cheng, Z. Erlotinib induces the human non-small-cell lung cancer cells apoptosis via activating ROS-dependent JNK pathways. Cancer Med. 2016, 5, 3166–3175. [Google Scholar] [CrossRef]
  30. Lee, J.Y.; Ahn, S.S.; Jeong, Y.J.; Choi, J.; Ahn, S.; Koh, D.; Lee, Y.H.; Lim, Y.; Shin, S.Y. A Synthetic Pan-Aurora Kinase Inhibitor, 5-Methoxy-2-(2-methoxynaphthalen-1-yl)-4H-chromen-4-one, Triggers Reactive Oxygen Species-Mediated Apoptosis in HCT116 Colon Cancer Cells. J. Chem. 2020, 2020, 3025281. [Google Scholar] [CrossRef]
  31. Kim, J.Y.; Jeon, Y.J.; Cho, J.; Shin, J.I.; Baek, C.Y.; Lim, Y.; Koh, D.; Shin, S.Y.; Lee, Y.H.; Lee, K. A novel synthetic chalcone derivative promotes caspase-dependent apoptosis through ROS generation and activation of the UPR in MH7A cells. Genes Genom. 2015, 37, 1051–1059. [Google Scholar] [CrossRef]
  32. Lee, K.; Lee, D.H.; Kim, J.-H.; Shin, S.Y.; Lee, Y.H.; Koh, D. The Chalcone Derivative HymnPro Generates Reactive Oxygen Species through Depletion of Intracellular Glutathione. Appl. Biol. Chem. 2016, 59, 391–396. [Google Scholar] [CrossRef]
  33. Shin, S.Y.; Lee, J.M.; Lee, M.S.; Koh, D.; Jung, H.; Lim, Y.; Lee, Y.H. Targeting Cancer Cells via the Reactive Oxygen Species-Mediated Unfolded Protein Response with a Novel Synthetic Polyphenol Conjugate. Clin. Cancer Res. 2014, 20, 4302–4313. [Google Scholar] [CrossRef] [Green Version]
  34. Hosseini-Zare, M.S.; Sarhadi, M.; Zarei, M.; Thilagavathi, R.; Selvam, C. Synergistic effects of curcumin and its analogs with other bioactive compounds: A comprehensive review. Eur. J. Med. Chem. 2021, 210, 113072. [Google Scholar] [CrossRef] [PubMed]
  35. Ahn, S.; Sung, J.; Lee, J.H.; Yoo, M.; Lim, Y.; Shin, S.Y.; Koh, D. Synthesis, Single Crystal X-ray Structure, Hirshfeld Surface Analysis, DFT Computations, Docking Studies on Aurora Kinases and an Anticancer Property of 3-(2,3-Dihydrobenzo[b][1,4]dioxin-6-yl)-6-methoxy-4H-chromen-4-one. Crystals 2020, 10, 413. [Google Scholar] [CrossRef]
  36. Bruker. APEX2, SAINT and SADABS; Bruker AXS Inc.: Madison, WI, USA, 2012. [Google Scholar]
  37. Sheldrick, G.M. Crystal structure refinement with SHELXL. Acta Cryst. C 2015, 71, 3–8. [Google Scholar] [CrossRef] [PubMed]
  38. Dolomanov, O.V.; Bourhis, L.J.; Gildea, R.J.; Howard, J.A.K.; Puschmann, H. OLEX2: A Complete Structure Solution, Refinement and Analysis Program. J. Appl. Crystallogr. 2009, 42, 339–341. [Google Scholar] [CrossRef]
  39. Macrae, C.F.; Sovago, I.; Cottrell, S.J.; Galek, P.T.A.; McCabe, P.; Pidcock, E.; Platings, M.; Shields, G.P.; Stevens, J.S.; Towler, M.; et al. Mercury 4.0: From visualization to analysis, design and prediction. J. Appl. Cryst. 2020, 53, 226–235. [Google Scholar] [CrossRef] [PubMed] [Green Version]
  40. Lim, K.; Ho, J.X.; Keeling, K.; Gilliland, G.L.; Ji, X.; Rüker, F.; Carter, D.C. Three-Dimensional structure of schistosoma japonicum glutathione s-transferase fused with a six-amino acid conserved neutralizing epitope of gp41 from HIV. Protein Sci. 1994, 3, 2233–2244. [Google Scholar] [CrossRef] [PubMed] [Green Version]
  41. Trott, O.; Olson, A.J. AutoDock Vina: Improving the speed and accuracy of docking with a new scoring function, efficient optimization, and multithreading. J. Comput. Chem. 2010, 31, 455–461. [Google Scholar] [CrossRef] [Green Version]
  42. Pettersen, E.F.; Goddard, T.D.; Huang, C.C.; Couch, G.S.; Greenblatt, D.M.; Meng, E.C.; Ferrin, T.E. UCSF Chimera—A visualization system for exploratory research and analysis. J. Comput. Chem. 2004, 25, 1605–1612. [Google Scholar] [CrossRef] [Green Version]
  43. Shin, S.Y.; Yoon, H.; Ahn, S.; Kim, D.-W.; Kim, S.H.; Koh, D.; Lee, Y.H.; Lim, Y. Chromenylchalcones showing cytotoxicity on human colon cancer cell lines and in silico docking with aurora kinases. Bioorg. Med. Chem. 2013, 21, 4250–4258. [Google Scholar] [CrossRef] [PubMed]
  44. Shin, S.Y.; Lee, K.S.; Choi, Y.-K.; Lim, H.J.; Lee, H.G.; Lim, Y.; Lee, Y.H. The antipsychotic agent chlorpromazine induces autophagic cell death by inhibiting the Akt/mTOR pathway in human U-87MG glioma cells. Carcinogenesis 2013, 34, 2080–2089. [Google Scholar] [CrossRef] [Green Version]
  45. Spackman, M.A.; Jayatilakaa, D. Hirshfeld surface analysis. CrystEngComm 2009, 11, 19–32. [Google Scholar] [CrossRef]
  46. Turner, M.J.; McKinnon, J.J.; Wolff, S.K.; Grimwood, D.J.; Spackman, P.R.; Jayatilaka, D.; Spackman, M.A. Crystal Explorer Version 17; University of Western Australia: Crawley, Australia, 2017. [Google Scholar]
  47. McKinnon, J.J.; Jayatilaka, D.; Spackman, M.A. Towards quantitative analysis of intermolecular interactions with Hirshfeld surfaces. Chem. Commun. 2007, 37, 3814–3816. [Google Scholar] [CrossRef]
  48. Abe, K.; Saito, H. Menadione Toxicity in Cultured Rat Cortical Astrocytes. Jpn. J. Pharmacol. 1996, 72, 299–306. [Google Scholar] [CrossRef] [Green Version]
  49. Alaşalvar, C.; Öztürk, N.; Abdel-Aziz, A.A.-M.; Gökce, H.; El-Azab, A.S.; El-Gendy, M.A.; Sert, Y. Molecular structure, Hirshfeld surface analysis, spectroscopic (FT-IR, Laser-Raman, UV–vis. and NMR), HOMO-LUMO and NBO investigations on N-(12-amino-9,10-dihydro-9,10-ethanoanthracen-11-yl)-4-methylbenzenesulfonamide. J. Mol. Struct. 2018, 1171, 696–705. [Google Scholar] [CrossRef]
  50. Douche, D.; Sert, Y.; Brandán, S.A.; Kawther, A.A.; Bilmez, B.; Dege, N.; Louzi, A.E.; Bougrin, K.; Karrouchi, K.; Himmi, B. 5-((1H-imidazol-1-yl)methyl)quinolin-8-ol as potential antiviral SARS-CoV-2 candidate: Synthesis, crystal structure, Hirshfeld surface analysis, DFT and molecular docking studies. J. Mol. Struct. 2021, 1232, 130005. [Google Scholar] [CrossRef]
  51. Andree, H.A.; Reutelingsperger, C.P.; Hauptmann, R.; Hemker, H.C.; Hermens, W.T.; Willems, G.M. Binding of vascular anticoagulant alpha (VAC alpha) to planar phospholipid bilayers. J. Biol. Chem. 1990, 265, 4923–4928. [Google Scholar] [CrossRef]
  52. Danial, N.N.; Korsmeyer, S.J. Cell Death: Critical Control Points. Cell 2004, 116, 205–219. [Google Scholar] [CrossRef] [Green Version]
Scheme 1. Synthetic scheme for the title compound 3.
Crystals 12 00108 sch001
Figure 1. Molecular structure of the title compound 3 (A) and 3D structure with atomic labeling (B).
Crystals 12 00108 g001
Figure 2. In the unit cell, there are two molecules that show week pi–pi interactions between two chromenone rings (C1-C5/O1) that are 3.790 Å apart from each other.
Crystals 12 00108 g002
Figure 3. Dihedral angle formed between the benzene ring (grey) and the chromenone ring (purple).
Crystals 12 00108 g003
Figure 4. Part of the crystal structure is shown. Two molecules form the inversion dimer by two strong pairs of hydrogen bonds, as indicated by the blue dotted lines (A). Additional hydrogen bonds (orange dotted lines) connect the chain along a-axis (B). For clarity, only H atoms involved in hydrogen bonding are shown.
Crystals 12 00108 g004
Figure 5. The complete two-dimensional fingerprint plots for compound 3 (A), and delineated into a major contribution of H⋯H/H⋯H (34.3%), O⋯H/H⋯O (19.2%) and C⋯H/H⋯C (16.7%) interactions (B).
Crystals 12 00108 g005
Figure 6. The analysis of the cell population containing the reduced glutathione (GSH) after compound 3 exposure in HCT116 cells. The HCT116 cells were exposed to 20 and 40 μM of compound 3 in the presence (+) or absence (-) of 2 mM N-acetyl cysteine (NAC). After 18 h, the cells were stained with VB-48, acridine orange and propidium iodide (PI). The stained cells were analyzed using the fluorescence image cytometer NucleoCounter NC-3000. The scatter plots (top panels) show that cell populations fluoresce VB-48 versus propidium iodide (PI). Dead cells were gated out based on the PI uptake (horizontal lines). The unhealthy cells were gated out based on the VB-48 intensities (vertical lines). The histograms (bottom panels) present the GSH level changes in healthy cells, PI-positive dead cells; ll, PI-negative unhealthy cells with a low GSH level; lr, PI-negative live cells with high a GSH level and M1, unhealthy cells with a decreased level of GSH.
Crystals 12 00108 g006
Figure 7. The effect of compound 3 on the generation of ROS in HCT116 cells. HCT116 cells were incubated with 10 μM DCF-DA for 60 min, followed by treatment with 40 μM of compound 3 or 100 μM of menadione as a reference compound for 1 h. DCF fluorescence was assessed using the fluorescence image cytometer NucleoCounter NC-3000 (A) and visualized using an EVOSf1® fluorescence microscope (B). Scale bar, 400 μm.
Crystals 12 00108 g007
Figure 8. Effect of compound 3 on caspase-mediated apoptosis in HCT116 cells. (A) HCT116 cells were treated with different concentrations of compound 3. After 24 h, cell viability was measured using the CCK-8 assay. Data are presented as the mean ± standard deviation (SD). Statistical analysis was conducted using one-way analysis of variance (ANOVA) followed by Dunnett’s multiple comparisons test using GraphPad Prism version 8.4.2. **, p < 0.01; ****, p < 0.0001 (n = 9). A p value of less than 0.05 indicated a statistically significant difference. (B) HCT116 cells were incubated with FITC-labeled Annexin V (AV) and propidium iodide (PI) after treatment with vehicle (DMSO) or 40 μM compound 3 for 24 h. Annexin V staining was analyzed using a fluorescence image cytometer NucleoCounter NC-3000. Q1ll, AV−/PI−;/Q1ul, AV−/PI+; Q1lr, AV+/PI−; Q1ur, AV+/PI+; M1, cell population of AV+/PI+.
Crystals 12 00108 g008
Figure 9. The effect of compound 3 on caspase-mediated apoptosis in HCT116 cells. HCT116 cells were treated with 20 and 40 μM of compound 3 for 24 h (A) or 40 μM of compound 3 for 24 h in the absence or presence of 2 or 4 mM N-acetyl cysteine (NAC) (B).
Crystals 12 00108 g009
Figure 10. The 3D image of a pocket next to glutathione in the glutathione S-transferase, 1gne.pdb generated by PyMol.
Crystals 12 00108 g010
Figure 11. The 3D image of compound 3 (cyan color) docked into the glutathione S-transferase and glutathione (green color) generated by PyMol.
Crystals 12 00108 g011
Figure 12. The distances between C10 and the sulfur of glutathione, and C3 and sulfur are 4.1 Å and 4.4 Å, respectively. The distances were measured using the PyMol program.
Crystals 12 00108 g012
Table 1. Crystal data and structure refinement for compound 3.
Compound 3
Chemical FormulaC19H13BrO4
Molecular Weight385.20
Wavelength0.71073 Å
Temperature243(2) K
Crystal SystemTriclinic
Space GroupP-1
Unit Cell Dimensionsa = 8.2447(6) Å
b = 8.6032(6) Å
c = 11.7826(7) Å
α= 92.456(2)°.
β= 91.541(2)°.
γ = 106.138(2)°.
Volume801.42(9) Å3
Z2
Absorption Coefficient2.585 mm−1
Density (Calculated)1.596 Mg/m3
F(000) 388
Crystal Size0.42 × 0.26 × 0.09 mm3
Theta Range for Data Collection2.468 to 28.272°.
Index Ranges−10 ≤ h ≤ 10, −11 ≤ k ≤ 11, −15 ≤ l ≤ 15
Reflections Collected22,878
Independent Reflections3953 [R(int) = 0.0904]
Completeness to Theta = 25.242°99.6%
Refinement MethodFull-matrix least-squares on F2
Goodness-of-Fit on F21.038
Data/Restraints/Parameters3953/0/218
Final R Indices (I > 2sigma(I))R1 = 0.0709, wR2 = 0.1803
R Indices (all data)R1 = 0.0774, wR2 = 0.1859
Largest Diff. Peak and Hole0.672 and −0.775 e·Å−3
Table 2. Selected dihedral angles (°) for compound 3.
Selected Dihedral AnglesDegree (°)
C(2)-C(10)-C(11)-C(12)179.4(3)
H(10)-C(10)-C(11)-H(11)179.4
C(10)-C(11)-C(12)-O(3)−12.6(5)
C(1)-C(2)-C(3)-O(2)1.7(5)
O(1)-C(1)-C(2)-C(3)167.4(3)
C(3)-C(2)-C(10)-C(11)179.1
H(11)-C(11)-C(12)-O(3)167.5
C(19)-O(4)-C(13)-H(15)
O(3)-C(12)-C(13)-C(14)
−8.9(5)
141.4(3)
O(3)-C(12)-C(13)-C(18)−36.1(4)
Table 3. Intermolecular hydrogen bonds for compound 3 (Å and °).
D-H⋯Ad(D-H)d(H⋯A)d(D⋯A)<(DHA)
C(3)-H(3)⋯O(3)#10.942.233.133(4)161.9
C(10)-(10)⋯O(3)#10.942.543.343(4)143.5
C(9)-H(9)⋯O(4)#20.942.573.482(4)163.8
Symmetry transformations:
#1 − x, −y + 1, −z + 1; #2 −x + 1, −y + 1, −z + 1
Publisher’s Note: MDPI stays neutral with regard to jurisdictional claims in published maps and institutional affiliations.

