Article

Spectroscopic and Surface Crystallization Characterizations of Yttrium-Doped Phosphate Glasses

1
Fundamental Science on Nuclear Wastes and Environmental Safety Laboratory, Southwest University of Science and Technology, Mianyang 621010, China
2
Science and Technology on Combustion and Explosion Laboratory, Xi’an Modern Chemistry Research Institute, Xi’an 710065, China
*
Authors to whom correspondence should be addressed.
Submission received: 20 December 2021 / Revised: 7 January 2022 / Accepted: 8 January 2022 / Published: 14 January 2022
(This article belongs to the Section Inorganic Crystalline Materials)

Abstract

:
The composition, structure, and thermal behaviors of yttrium-containing phosphate glasses were studied in this work, and the glass-ceramics were prepared via the two-step crystallization method. The XRD and SEM-EDS results show the forming range of the phosphate glass system and the formation of YPO4 (xenotime) due to the addition of excessive Y2O3. The spectroscopic characterization of these glasses presented shifts of the infrared and Raman bands, demonstrating the depolymerization of the glass network and the formation of novel P–O–Y bonds, and the deconvoluted Raman spectra also exhibited the occurrence of the disproportionation reaction in the glass melting process. The content of non-bridging oxygen (NBOs) from the UV–vis spectra first increased and then decreased with increasing Y2O3. The thermal behaviors show that the Y2O3 reduced the crystallization peak temperature and the thermal stability of the glasses. The crystalline behaviors of the phosphate glass matrix were investigated at different crystallization times of 2–10 h, and a transformation of the crystallization mechanism from surface to volume crystallization was found. The yttrium phosphate glass-ceramics crystallized for 10 h exhibited transformation of the main crystalline phases with increasing Y2O3, and the grain-oriented crystalline surface became irregular.

Graphical Abstract

1. Introduction

Iron phosphate glasses as a potential matrix for high-level radioactive nuclear waste disposal have been studied for over two decades, due to the fact that the glass systems have excellent chemical stability, a high thermal expansion coefficient, high crystallization temperature, and nuclide storage capacity. Some researchers found that the presence of hydration-resistant Fe–O–P bonds in the iron phosphate glass structure improved the structural stability [1]. Additionally, it was also demonstrated that calcium iron phosphate glass had superior performance such as good chemical stability, high glass transition temperature, and density [2,3]. This is due to the addition of calcium to the iron phosphate glass resulting in the formation of the P–O–Ca linkage and (P–O Ca2+ −O–P) chains as shown by spectroscopic analysis, further increasing the cross-linking of the phosphate glass network [4]. Therefore, structural studies of glass matrices are essential to their application for the immobilization of nuclear wastes, which can build the relationship between the structures and properties of waste forms.
The stability of nuclear waste forms involves their thermal, chemical, and radiation properties, etc., which are extremely important for the safe storage of radioactive nuclear wastes. The rare earth elements such as yttrium and neodymium have similar ionic radii to highly radioactive nuclides (Am, Cm, Cf, etc.), so rare earth elements were used to simulate these nuclides for nuclear waste disposal in previous studies. The study of aluminum (iron) phosphate glasses containing 16 rare earth (Y, La, and Ce, etc.) and 3 transuranium (Np, Pu, and Am) elements demonstrated that the glasses presented good water-resistant performance, fulfilling the requirements of high-level radioactive waste storage [5]. Besides this, the rare earth (Y, La, Sm, Nd, Gd) iron phosphate glasses also exhibited excellent physical properties [2,6].
Due to the decay and radiation of nuclides, the temperature of waste forms increases, causing crystallization behavior to easily occur. Besides this, radioactive nuclides as nucleating agents may accelerate the crystallization of the glass waste forms under high-temperature and high-pressure conditions. This may affect the stability of the waste form and damage the glass structure. Wang et al. found that iron borophosphate glasses containing excessive Nd2O3 (above 6 mol%) produced the monazite NdPO4 phase, and the glass-ceramic had similar chemical durability when compared to the glass. The studies of the glass crystallization properties presented three crystalline phases: FePO4, Fe4(PO4)2O, and NdPO4 [7]. Stefanovsky et al. studied the crystallization behaviors and chemical durability of sodium aluminum (iron) phosphate glass-ceramics, and the major crystalline phases contained monazite and Na-Al-Fe orthophosphate [8]. Some studies also showed that the crystallization of iron phosphate glass forms containing simulated nuclides led to the formation of monazite-based glass-ceramics, which does not degrade their chemical durability [9,10].
Glass-ceramics have been widely reported and are generally obtained by using heat treatment techniques to control the crystallization of glass samples. The literature indicates that glass-ceramics possess better mechanical performance and higher chemical and thermal stability than the parent glasses; in particular, the presence of regular nano-crystals is helpful to improving the properties of glass-ceramics [11,12,13]. However, iron phosphate glass-ceramics containing rare earth elements have received less attention [7,10,14]. In this work, the structures of a calcium iron phosphate glass matrix containing yttrium were studied by spectroscopic techniques. Importantly, these glasses were heat-treated based on the results of their thermal behaviors, and the composition and morphology of the surface crystalline phases for the phosphate glass-ceramics were also characterized. This study on phosphate glasses and glass-ceramics containing simulated nuclides (yttrium) provides a better understanding of their composition, structures, heat stability, and crystalline behaviors, and it may also accelerate the application of novel iron phosphate glass and glass-ceramics for nuclear waste immobilization.

2. Experimental Procedure

2.1. Preparation of Glass and Glass-Ceramic Samples

Glasses with molar composition x Y2O3–(100−x)(12CaO–20Fe2O3–68P2O5), x = 0, 2, 4, 6, 8, 10, 12 mol%, were prepared from CaO, Fe2O3, NH4H2PO4, and Y2O3 at a temperature of 1250 °C. The reagents were mixed well and introduced into alumina crucibles, then placed into the furnace, which was preheated at 220 °C for 2 h to prevent the boiling and consequent spillage of H2O and NH3 from NH4H2PO4; the melting temperature of 1250 °C was then maintained for 3 h. After that, the melts were put into an annealing furnace at 475 °C for 2 h, followed by cooling to room temperature. The obtained glass samples containing 0, 2, 4, 6, 8, 10, and 12 mol% Y2O3 were named G0, G2, G4, G6, G8, G10, and G12, respectively.
The annealed glasses were cut into small blocks (Figure 1a), ultrasonically cleaned in ethanol, and air-dried. Under otherwise specified, each sample was first soaked at 50 °C above the glass transition temperature (Tg) for 2 h (nucleation stage), and then the furnace temperature was increased at a heating rate of 10 °C∙min−1. The sample was kept at 10 °C below the crystallization peak temperature (Tp1) for 2–10 h (crystal growth stage), and the furnace was then shut down. Phosphate glass-ceramic samples containing 0, 2, 4, 6, 8, and 10 mol% Y2O3 were thus obtained, and they were named GC0, GC2, GC4, GC6, GC8, and GC10, respectively.

2.2. Characterization Techniques

XRD analysis of all glasses and thermally treated bulk samples was performed on samples by employing a PANalytical X’Pert PRO X-ray diffractometer with Cu Kα radiation (λ = 1.5405 Å). The infrared spectra of all phosphate glass powders were recorded from 400 to 2000 cm1 using a Spectrum One FTIR spectrometer by the KBr standard pellet method. Raman spectra excited by 514.5 nm light from an argon ion laser were collected from glass powders in the range from 400 to 1600 cm1 using the Renishaw InVia Raman Microscope at room temperature. The compute deconvolution of Raman spectra was performed by the ORIGIN 7.5 program using a Gaussian-type function. The diffuse reflectance spectra of all glass powders (particle size of <150 μm) were recorded at room temperature in the 200–800 nm range up to a resolution of 0.3 nm using a UV-3150 UV–Vis near-infrared spectrometer with an ISR-3100 integrating sphere attachment. The band gap Eg of glass powders can be obtained by using the F R   h ν 2 = C 2 h ν E g equation [15]. Each sample was measured six times.
The thermal behaviors of all glass powders (particle size of <150 μm) were measured via DSC by utilizing a SDT Q600 instrument (TA, USA) in a flowing air atmosphere at a heating rate of 10 °C∙min−1. The surface morphologies of the glass-ceramic samples were analyzed using an Ultra 55 Scanning Electron Microscope (SEM) with an accelerating voltage of 0.1~30 kV.

3. Results and Discussion

3.1. Composition and Structure of Glasses

The XRD patterns of calcium iron phosphate glass matrices containing 0–12 mol% yttrium are shown in Figure 1a. The glass matrices doped with below 10 mol% Y2O3 present a non-crystalline structure, while the sample containing 12 mol% Y2O3 presents a crystalline phase of YPO4 (PDF No.11-0254). The Y3+ cations have smaller field strength than the Fe3+ cations, which results in the excessive Y2O3 acting as a nucleating agent in the phosphate glass, forming YPO4. Besides this, the addition of excessive Y2O3 improves the O/P ratio of the glass system, causing the depolymerization of the glass network and a reduction of the glass-forming range. As shown in Figure 1b, the crystal structure of YPO4 (xenotime) consists of a YO8 decahedron and PO4 tetrahedra [16], and xenotime has been studied extensively for the immobilization of nuclides. The SEM-EDS results show that the Y:P atomic ratio is 1:1. This indicates that the xenotime is located inside of the glass block, and the composition of the crystalline phase from the EDS is consistent with the XRD results.
The FTIR and Raman spectra of the yttrium phosphate glasses are depicted in Figure 2a,b. The FTIR spectra for all samples exhibit seven typical bands at ~1734, ~1621, ~1256, ~1061, ~920, ~778, and ~484 cm1. The high-frequency bands at ~1734 and ~1621 cm1 can be assigned to the bending vibrations of P–OH and water molecules [2,3,4,7]. The band at ~484 cm−1 in the FTIR spectrum of the G0 sample is due to the O=P–O linkages of Q3 units, and the band at ~553 cm1 is assigned to the bending vibration of O–P–O bonds in Q1 units [2,3,4]. As the Y2O3 content increases, the band at ~484 cm−1 increases gradually to the high-frequency band at ~519 cm−1, and the band at ~553 cm1 disappears as a result of the transformation from Q3 to Q0 units in the glass structures [3,4]. This indicates that the O=P–O linkages are replaced by (PO4)3−, and the phosphate chains in the Y-doped phosphate glasses gradually become shorter with increasing Y2O3 content. Besides this, the shape of the absorption bands in 900~1300 cm−1 for the G0 sample shows two well-separated peaks, and the width is reduced with increasing Y2O3 content; the strongest peak at ~1061 cm−1 moves to ~1091 cm−1, and only a broad and plain band for the G10 sample is observed. This is due to the change in the O/P ratio of the yttrium glass system from 3.02 to 3.27, leading to glass network depolymerization and a transformation from Q0 to Q1 units, demonstrating the replacement of (PO4)3− by P–O–P bonds [2,3,4]. The frequency of the band at ~920 cm1 increases and the strength at ~1256 cm1 decreases, which indicates that yttrium cations as a glass modifier form P–O–Y bonds by breaking the P=O bonds in the glass structures [17].
The Raman spectra of all glass samples in the range of 400~1600 cm1 only present four peaks, and the bands at ~1197, ~1075, ~958, and ~715 cm1 correspond to the symmetric stretching vibrations of the ‘strained’ (PO2) in Q2 units [3], the symmetric vibrations of (PO3)2 in Q1 units [3,17], the asymmetric vibrations of the P–O–P bonds, and the symmetric vibrations of the P–O–P bonds in- Q1 units [3,4,17], respectively. An increase in the Y2O3 content results in a shift of the Raman frequencies, as shown in Figure S1 (Supplementary Materials). The low-frequency band at ~703 cm1 in the Raman spectrum of the G0 sample shifts and increases to ~719 cm1 in the G10 sample, which is due to the addition of Y2O3 reducing the bond angle of P–O–P linkages. This may shorten the phosphate chain length, resulting in the depolymerization of the glass network. Additionally, a band at ~958 cm1 appears and its strength increases, while the frequency for the band at ~1197 cm1 decreases and that for the band at ~1075 cm1 increases; this phenomenon affects the shape of the Raman spectra and may be attributed to the formation of P–O–Y bonds replacing the P–O–P bonds. Similar bands in La-Fe-phosphate glasses have been reported [18].
The Raman spectra of yttrium phosphate glasses exhibit more complex and asymmetric bands in the high-frequency range of 800–1400 cm1. Gaussian fitting was used for each spectrum. In Figure 2c,d, the new band at ~1132 cm1 may be due to P–O stretching vibrations in terminator units of Q1 chains [4,18]. Another new band at ~1289 cm1 is associated with the asymmetric stretching vibrations of P=O bonds [4,19]. The relative area dependence of five different bands was obtained. With increasing Y2O3 content, the relative areas of (PO3)2− in Q1 units increased, while the relative areas of P=O reduced. This is attributed to rearrangement of the phosphate glass network, wherein P–O–Y bonds were formed by replacing P=O bonds; a similar result was observed in the FTIR spectra of another glass system [18]. However, the differences in the relative areas of (PO3)2 between the G0 and G10 samples are larger than those of P=O. Previous studies found that the formation of excess Q1 units was due to the occurrence of the disproportionation reaction in the glass melting process, 2Q1 ↔ Q2 + Q0, resulting in a reduction of the relative areas for the Q2 and Q0 units [3]. Additionally, as Y2O3 increases, the decrease in the relative areas for P–O in Q1 chains in Figure 2d may be due to the P–O terminal species bonding with the Y cations to form the P–O–Y bonds of pyrophosphate structures, strengthening the cross-linking of the glass network. In the literature, by using Extended X-ray Absorption Fine Structure (EXAFS), it was indicated that Y3+ cations were coordinated by 6–8 oxygen ions in glass structures [20]. Meanwhile, it was found that the coordination numbers of Y cations in meta- and ultraphosphate glasses were ~6.5 and ~8.0, respectively [21]. The increasing Y2O3 improved the O/P ratio of the yttrium glass system from 3.02 to 3.27, so the coordination number of the Y3+ cations increased, forming more cross-linked glass structures.
In order to further obtain the structural information of the glass system, the diffuse reflectance UV–vis spectra of the yttrium phosphate glasses were investigated and are presented in Figure 3a. Compared to the G0 sample, the glasses containing Y2O3 exhibit higher reflectivity in the visible region, and the reflectivity of the G6 sample is the largest. The diffuse reflectance spectra for the glass system do not show a linear dependence on the content of Y2O3; this is attributed to the color of black phosphate glasses becoming shallower when a few Y2O3 (≤6% Y2O3) replaced Fe2O3 in the glass system, while the color of the disordered yttrium phosphate glasses became darker when more than 6% Y2O3 was added. The reflectivity edge near 350 nm is about where one expects absorption from ferric ions. The Kubelka–Munk transformed reflectance spectra of all glass samples are depicted in Figure 3b. The linear portion of these spectra was extrapolated to determine the band gap values (Eg) of the glass samples. Numerous studies in the literature found that a larger Eg for the glasses corresponds to fewer non-bridging oxygen (NBOs) [4,22,23]. The Eg value of the G0 glass matrix is smaller than those of the glasses containing Y2O3, which may be due to the Y3+ cations having smaller cationic field strength compared to Fe3+ cations. The G6 sample has the largest Eg value, demonstrating the smallest NBO content.

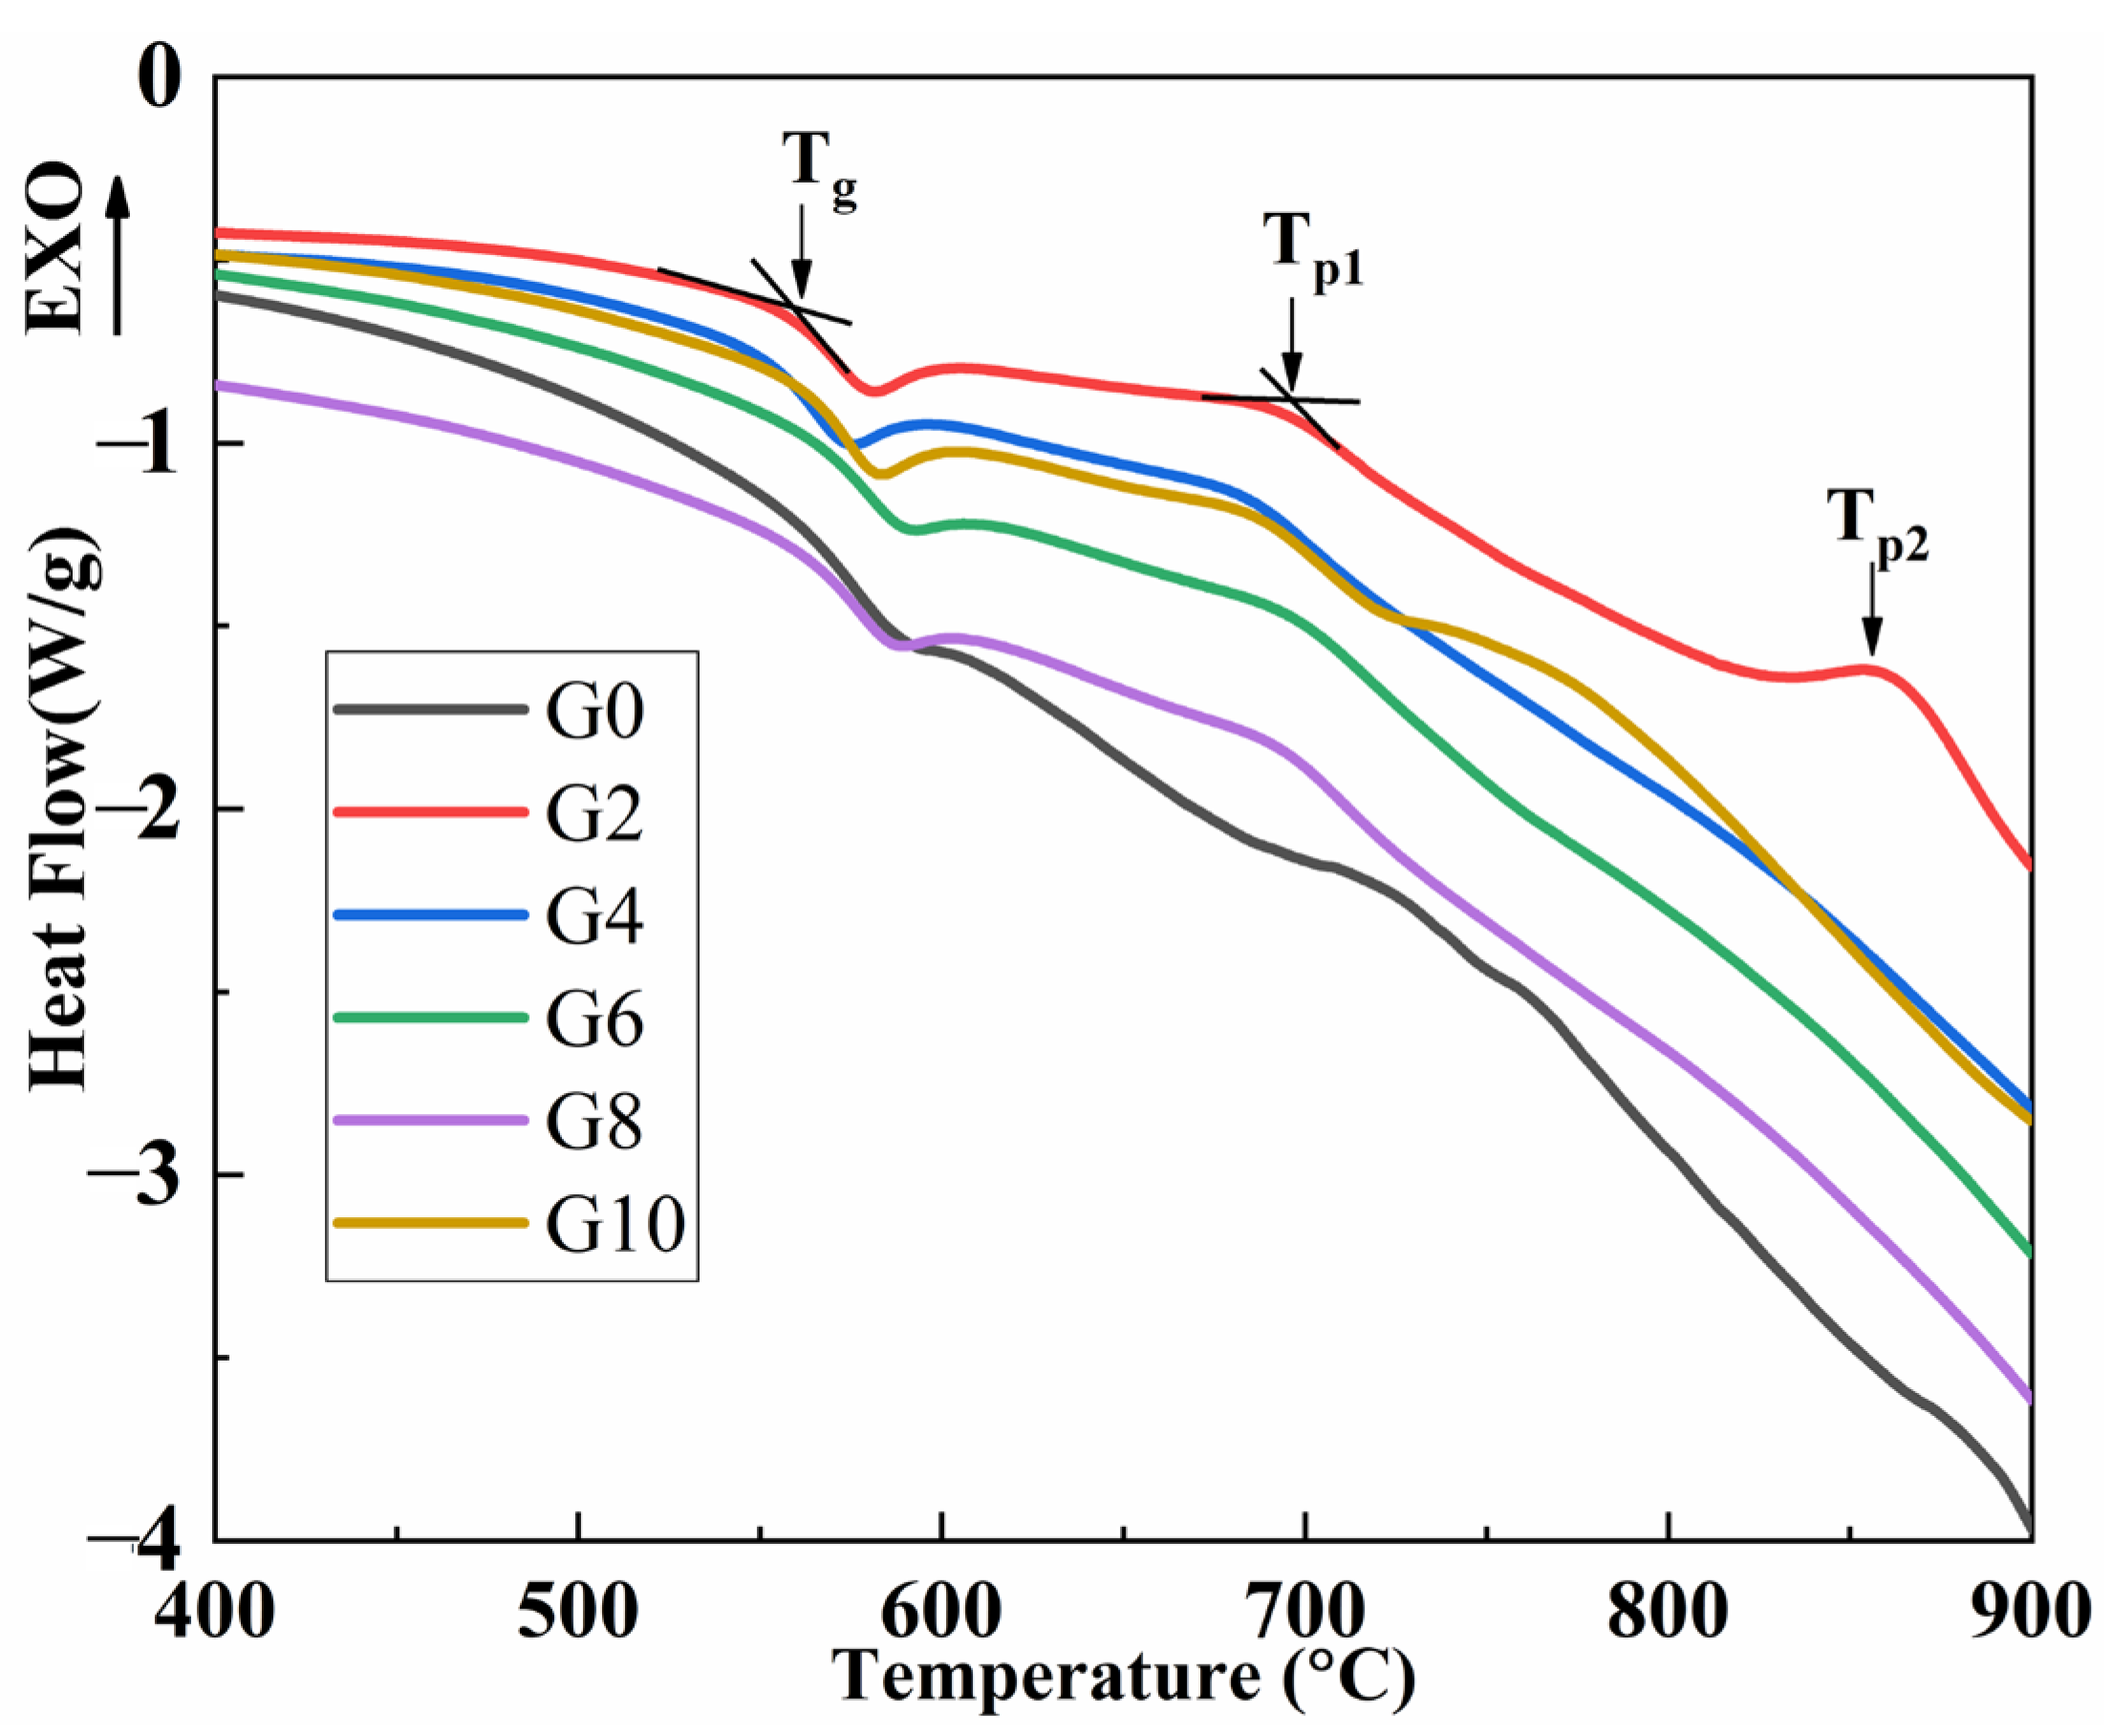
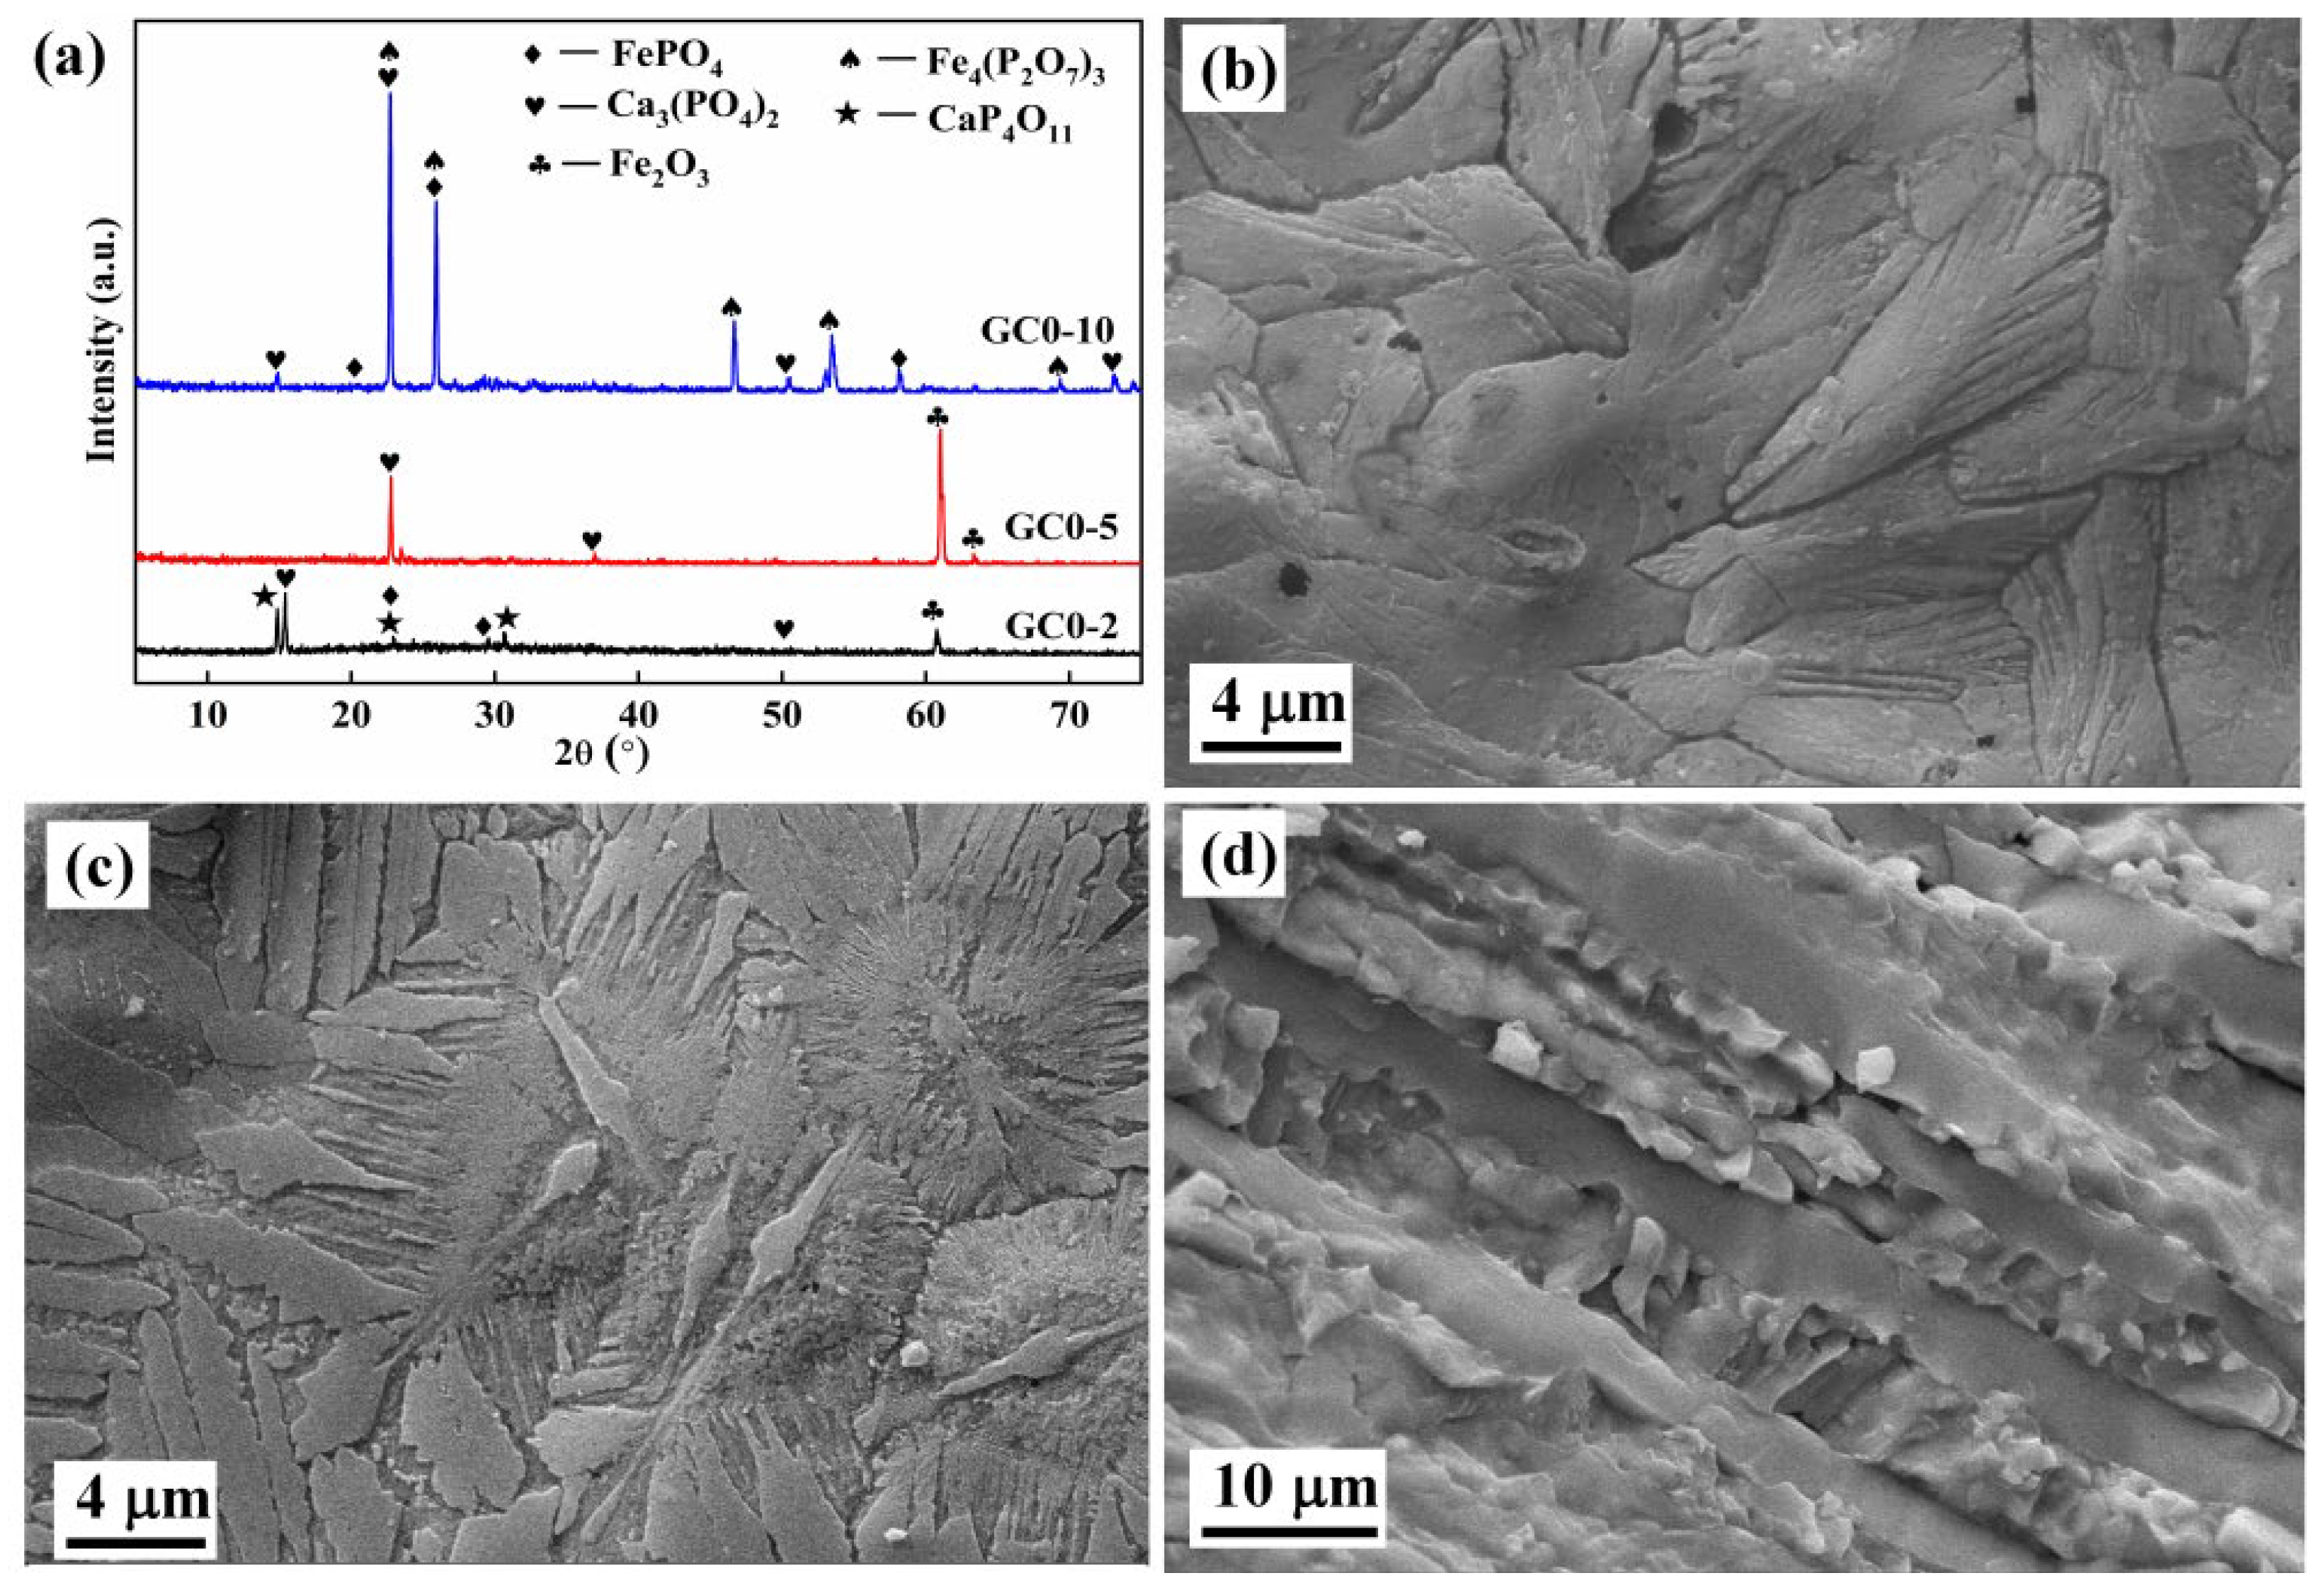
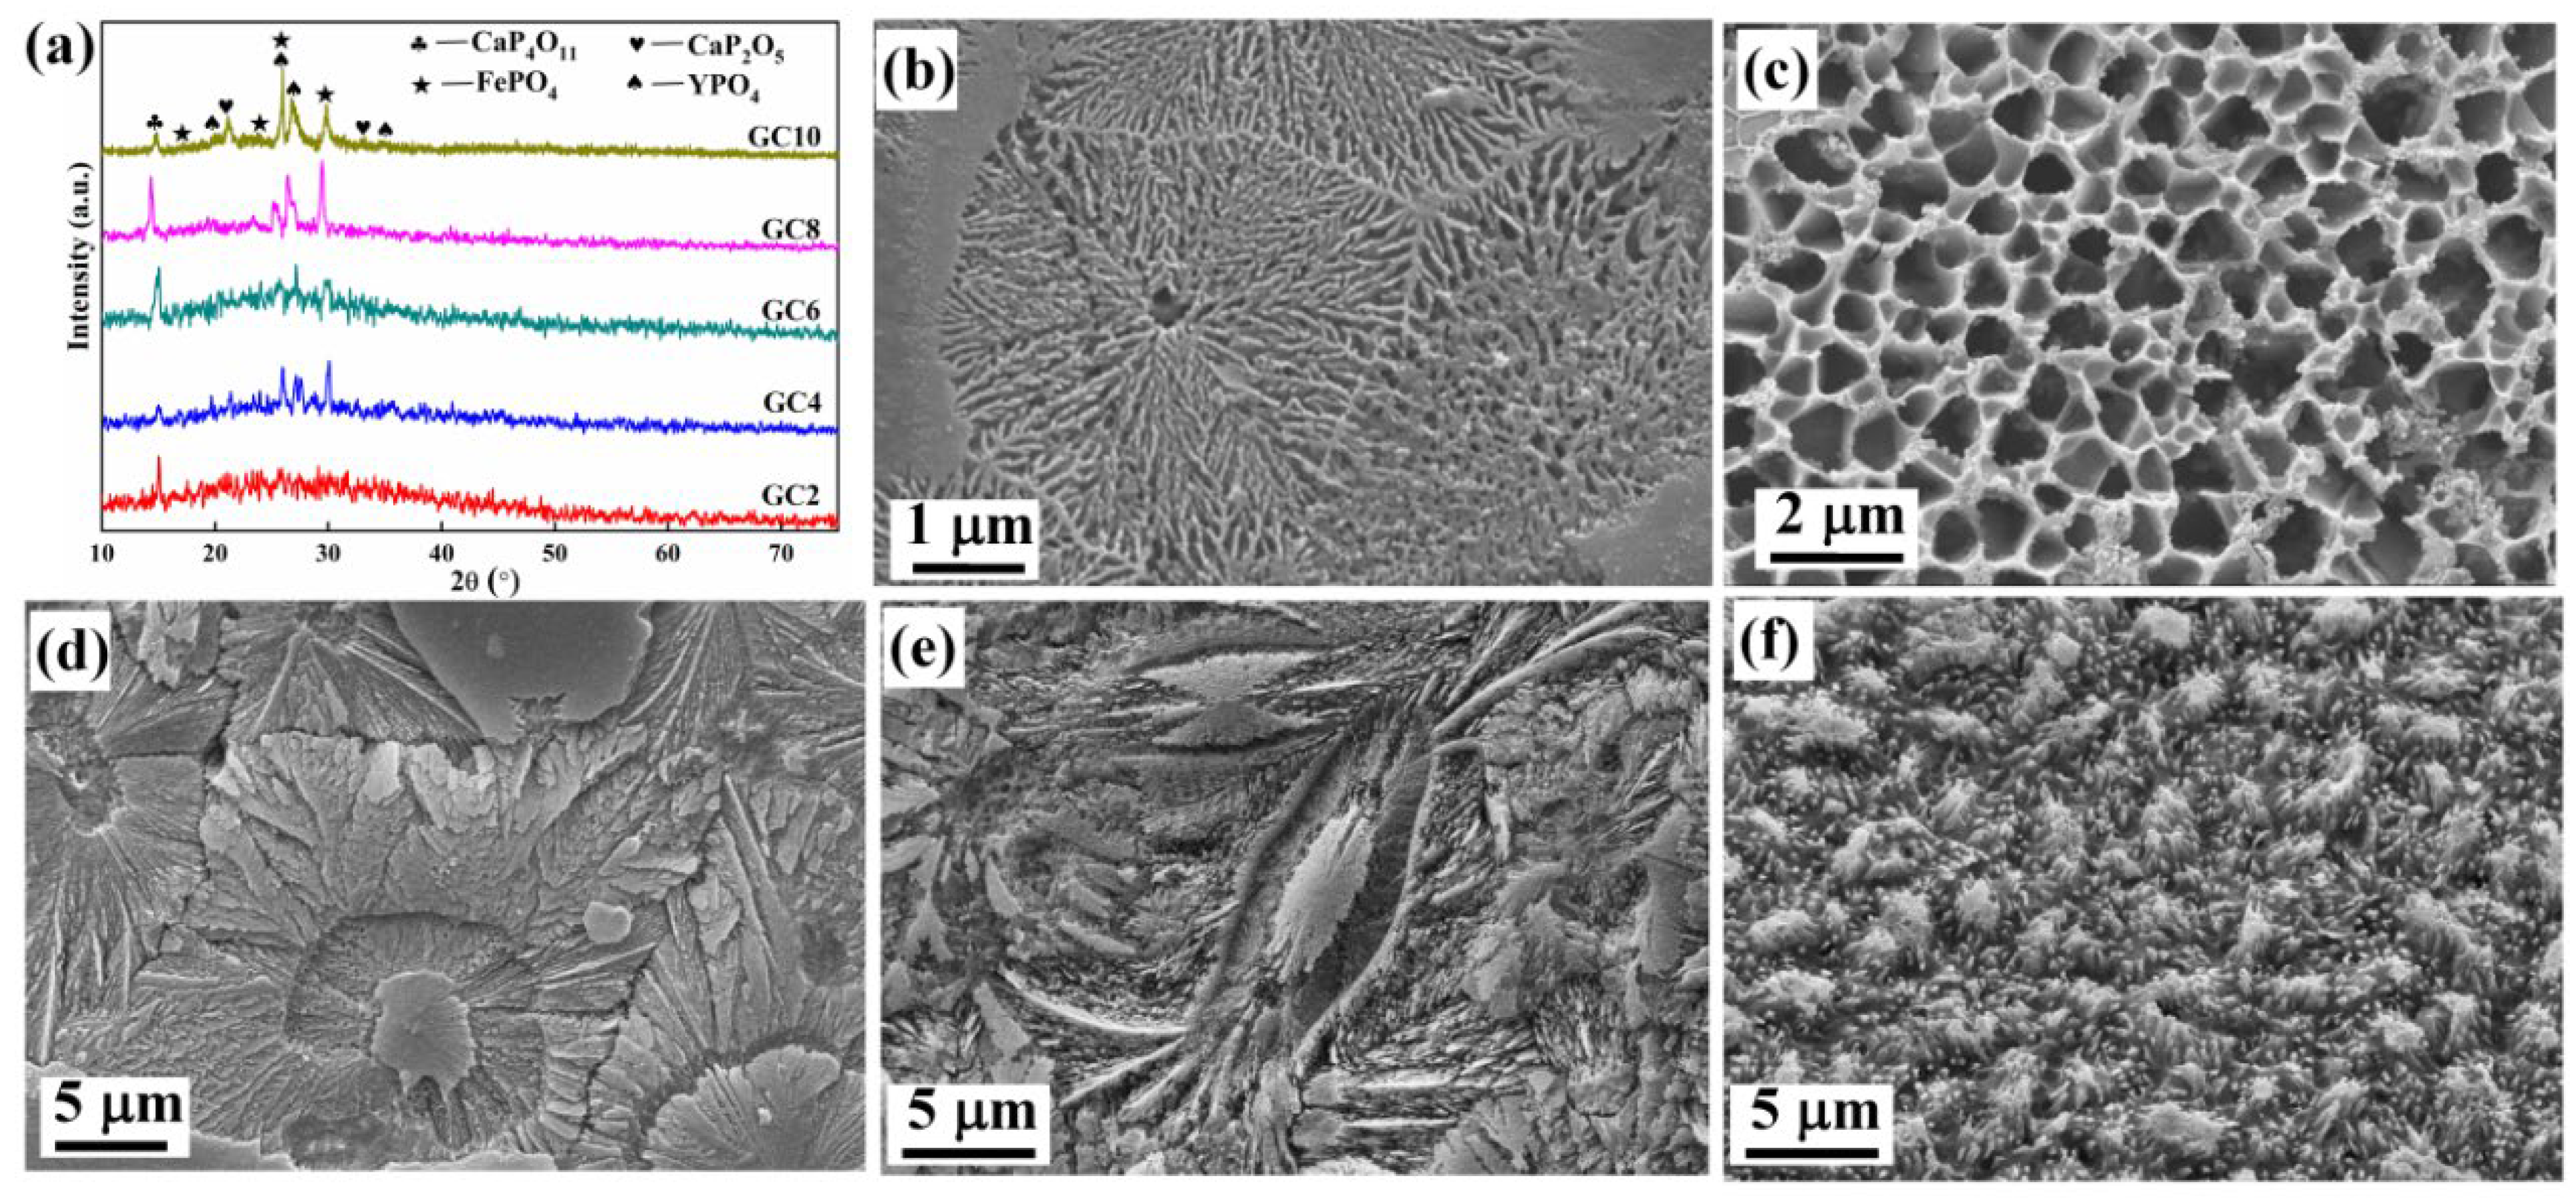
3.2. Surface Crystallization Characterization

The thermal behaviors of the yttrium phosphate glasses were studied by the DSC technique, and the DSC curves and parameters of these glasses are shown in Figure 4 and Table S1 (Supplementary Materials). Compared to that of the G0 glass matrix, the glass transition temperature (Tg) of the G10 sample increased slightly, which may be attributed to the addition of Y cations improving the cross-linking of the glass network. As the Y2O3 content increases, the crystallization peak temperature (Tp1) of the yttrium phosphate glass system is reduced. This can be explained by the cationic field strength of Y3+ being smaller than that of Fe3+, so the addition of Y2O3 resulted in easier crystallization of the yttrium glasses. Normally, the thermal stability of glasses is evaluated by determining the difference between Tp1 and Tg from the DSC curves [24]. For the G0 glass matrix, the temperature difference (ΔT = Tp1 − Tg) of 127 °C indicates good stability. The ΔT values show a decreasing trend with increasing Y2O3 in Table S1, demonstrating that the Y2O3 reduced the thermal stability of the glasses. Additionally, the NBO content of the glasses shows a similar trend to their thermal stability.
The XRD patterns and SEM images of the GC0 bulk sample at different crystallization times are depicted in Figure 5. The GC0 sample after crystallization for 2 h presents four crystalline phases of FePO4 (PDF No.17-0837), CaP4O11 (PDF No.15-0198), Ca3(PO4)2 (PDF No.06-0200), and Fe2O3 (PDF No.15-0615). As the crystallization time increases to 5 h, the strength of the diffraction peaks improves, and the main crystalline phase only exhibits Ca3(PO4)2 and Fe2O3. As the crystallization time increases to 10 h, the main crystalline phases transform to Fe4(P2O7)3 (PDF No.03-0124), FePO4, and Ca3(PO4)2.
As illustrated in Figure 5 and Table S2 (Supplementary Materials), the surface of the crystallized bulk sample has a fuzzy microstructure as observed by SEM. HF (40%) was used to etch the glass-ceramic samples for 15~20 s. The GC0-2 sample (crystallization time of 2 h for the GC0 sample) exhibits small and regular needle-shaped micro-crystals embedded in the glass phase. For a crystallization time of 5 h, the surface crystalline degree becomes higher, while the fine crystalline grains are regular and their diameters increase, which improves the compactness and integrity of the GC0 glass-ceramics. It can be seen from the cross-section of the G0-10 sample in Figure 5d that the sample tended to intensive volume crystallization, and a large number of ceramic phases were obtained from the glass sample after crystallization for 10 h.
Since the yttrium phosphate glass samples were poor to crystallize compared to the G0 glass matrix, the Y2O3-containing glasses were crystallized for 10 h. The XRD patterns are shown in Figure 6a. The GC2 glass-ceramic sample mainly contained CaP4O11 phase, the SEM image presents some small and interlocking needle-shaped crystals, and the grain-oriented crystalline surface is homogeneous and compact. As the Y2O3 content increases further, the main crystalline phases shift to YPO4 and FePO4. The micro-morphology of the GC4 sample exhibits the formation of pore structures with a diameter of about 1.5 μm in Figure 6c. For the GC6 sample, the crystallization peaks are not obvious, which may be due to the low grain-oriented surface crystallization tendency of glass. For the GC8 sample, the morphology of the sample surfaces tended to be irregular, which may be due to the formation of a large amount of YPO4. The crystalline peak of the GC10 sample is the strongest among all the yttrium glass-ceramics. It also can be seen from the SEM image of the GC10 sample that fine crystalline grains were located on the surface.

4. Conclusions

The composition, structures, and surface crystallization behaviors of phosphate glasses containing yttrium (simulating a nuclide) were studied and discussed herein. The excessive Y2O3 in the glass system resulted in the formation of YPO4 (xenotime), reducing the glass-forming range. It was found that the addition of yttrium as a glass modifier formed P–O–Y bonds by breaking P=O bonds and led to the transformation of phosphate units in the glass structures. The content of non-bridging oxygen (NBOs) obtained by the UV–vis spectra of the glasses was affected by the addition of Y2O3. The addition of yttrium reduced the thermal stability of the glasses. As the crystallization time increased from 2 h to 10 h, the main crystalline phases for the glass matrix were changed, and a transformation of the crystallization mechanism from surface to volume crystallization occurred. Importantly, the microstructures of the yttrium phosphate glass-ceramics featured homogeneous grain-oriented crystalline morphology. The main crystal phase type of the glass-ceramics transformed to xenotime with increasing content of Y2O3. This study provides significant guidance to explore phosphate glasses and glass-ceramics for nuclear waste immobilization.

Supplementary Materials

The following supporting information can be downloaded at: https://0-www-mdpi-com.brum.beds.ac.uk/article/10.3390/cryst12010109/s1, Figure S1: The frequencies of Raman spectra for all Y-doped glass samples; Figure S2: SEM images of the GC0 sample at different crystallization times of (a,b) 2 h, (c,d) 5 h, 5 and (e,f) 10 h. The samples (b,d,f) were etched in 40% HF for 15~20 s; Table S1: The DSC parameters of all glass samples.

Author Contributions

Methodology, H.Z. and Y.X.; software, Y.X.; formal analysis, H.L. and J.Y.; investigation, H.Z. and Y.X.; resources, Z.S. and C.W.; data curation, H.Z., C.W. and X.X.; writing—original draft preparation, H.L.; writing—review and editing, X.X. and F.Z.; visualization, Z.S. and C.W.; supervision, J.Y. and F.Z.; project administration, H.L.; funding acquisition, H.Z. All authors have read and agreed to the published version of the manuscript.

Funding

This research was funded by the Fundamental Science on Nuclear Wastes and Environmental Safety Laboratory at Southwest University of Science and Technology, grant number 19kfhk05.

Institutional Review Board Statement

Not applicable.

Informed Consent Statement

Not applicable.

Data Availability Statement

Not applicable.

Acknowledgments

This work was supported by the Fundamental Science on Nuclear Wastes and Environmental Safety Laboratory (19kfhk05), the National Natural Science Foundation of China (21473130, 21905224, 22075226), and the Natural Science Foundation of Shannxi Province, China (2020JQ-984).

Conflicts of Interest

The authors declare that they have no conflict of interest.

References

  1. Pavić, L.; Skoko, Ž.; Gajović, A.; Su, D.S.; Moguš-Milanković, A. Electrical transport in iron phosphate glass-ceramics. J. Non-Cryst. Solids 2018, 502, 44–53. [Google Scholar] [CrossRef]
  2. Shi, Q.S.; Yue, Y.L.; Qu, Y.; Liu, S.Q.; Khater, G.A.; Zhang, L.L.; Zhao, J.L.; Kang, J.F. Structure and chemical durability of calcium iron phosphate glasses doped with La2O3 and CeO2. J. Non-Cryst. Solids 2019, 516, 50–55. [Google Scholar] [CrossRef]
  3. Qian, B.; Liang, X.F.; Wang, C.L.; Yang, S.Y. Structure and properties of calcium iron phosphate glasses. J. Nucl. Mater. 2013, 443, 140–144. [Google Scholar] [CrossRef]
  4. Li, H.J.; Liang, X.F.; Yu, H.J.; Yang, D.Q.; Yang, S.Y. Studies of structure of calcium–iron phosphate glasses by infrared, Raman and UV–Vis spectroscopies. Indian J. Phys. 2015, 90, 693–698. [Google Scholar] [CrossRef]
  5. Danilov, S.S.; Stefanovsky, S.V.; Stefanovskaya, O.I.; Vinokurov, S.E.; Myasoedov, B.F.; Teterin, Y.A. Aluminum (Iron) Phosphate Glasses Containing Rare Earth and Transuranium Elements: Phase Composition, Oxidation State of Np and Pu, and Hydrolytic Durability. Radiochemistry 2018, 60, 434–439. [Google Scholar] [CrossRef]
  6. Liang, X.F.; Li, H.J.; Wang, C.L.; Yu, H.J.; Li, Z.; Yang, S.Y. Physical and structural properties of calcium iron phosphate glass doped with rare earth. J. Non-Cryst. Solids 2014, 402, 135–140. [Google Scholar] [CrossRef]
  7. Wang, Y.L.; Wang, F.; Wang, Q.; Zhu, H.Z.; Xiang, G.H.; Liao, Q.L.; Zhu, Y.C. Effect of neodymium on the glass formation, dissolution rate and crystallization kinetic of borophosphate glasses containing iron. J. Non-Cryst. Solids 2019, 526, 119726. [Google Scholar] [CrossRef]
  8. Stefanovsky, S.V.; Stefanovsky, O.I.; Kadyko, M.I.; Nikonov, B.S. Sodium aluminum-iron phosphate glass-ceramics for immobilization of lanthanide oxide wastes from pyrochemical reprocessing of spent nuclear fuel. J. Nucl. Mater. 2018, 500, 153–165. [Google Scholar] [CrossRef]
  9. He, Y.; Lü, Y.J.; Zhang, Q. Characterization of monazite glass–ceramics as wasteform for simulated α-HLLW. J. Nucl. Mater. 2008, 376, 201–206. [Google Scholar] [CrossRef]
  10. Stefanovsky, S.V.; Stefanovsky, O.I.; Danilov, S.S.; Kadyko, M.I. Phosphate-based glasses and glass ceramics for immobilization of lanthanides and actinides. Ceram. Int. 2019, 45, 9331–9338. [Google Scholar] [CrossRef]
  11. Rodríguez-López, S.; Pascual, M.J. Sintering/Crystallization and Viscosity of Sealing Glass-Ceramics. Crystals 2021, 11, 737. [Google Scholar] [CrossRef]
  12. Maeda, K.; Akatsuka, K.; Okuma, G.; Yasumori, A. Mechanical Properties of CaO–Al2O3–SiO2 Glass-Ceramics Precipitating Hexagonal CaAl2Si2O8 Crystals. Crystals 2021, 11, 393. [Google Scholar] [CrossRef]
  13. Lai, F.; Leng, M.; Li, J.; Liu, Q. The Crystallization Behaviors of SiO2-Al2O3-CaO-MgO-TiO2 Glass-Ceramic Systems. Crystals 2020, 10, 794. [Google Scholar] [CrossRef]
  14. Hsu, J.H.; Bai, J.C.; Kim, C.W.; Brow, R.K.; Szabo, J.; Zervos, A. The effects of crystallization and residual glass on the chemical durability of iron phosphate waste forms containing 40 wt% of a high MoO3 Collins-CLT waste. J. Nucl. Mater. 2018, 500, 373–380. [Google Scholar] [CrossRef]
  15. Morales, A.E.; Mora, E.S.; Pal, U. Use of diffuse reflectance spectroscopy for optical characterization of un-supported nanostructures. Rev. Mexic. Física S 2007, 53, 18–22. [Google Scholar]
  16. Vance, E.R.; Zhang, Y.; McLeod, T.; Davis, J. Actinide valences in xenotime and monazite. J. Nucl. Mater. 2011, 409, 221–224. [Google Scholar] [CrossRef]
  17. Stefanovsky, S.V.; Prusakov, I.L.; Stefanovsky, O.I.; Kadyko, M.I.; Averin, A.A.; Makarenkov, V.I.; Trigub, A.L.; Nikonov, B.S. The structure of rhenium-containing sodium alumino (iron) phosphate glasses. Int. J. Appl. Glass Sci. 2019, 10, 479–487. [Google Scholar] [CrossRef]
  18. Qian, B.; Yang, S.Y.; Liang, X.F.; Lai, Y.M.; Gao, L.; Yin, G.F. Structural and thermal properties of La2O3-Fe2O3-P2O5 glasses. J. Mol. Struct. 2012, 1011, 153–157. [Google Scholar] [CrossRef]
  19. Łagowska, B.; Wacławska, I.; Sitarz, M.; Szumera, M. Spectroscopic studies of structural interactions in silicate-borate-phosphate glass. J. Mol. Struct. 2018, 1171, 110–116. [Google Scholar] [CrossRef]
  20. Cole, J.M.; Eck, E.R.H.V.; Mountjoy, G.; Anderson, R.; Brennan, T.; Bushnell-Wye, G.; Newport, R.J.; Saunders, G.A. An x-ray diffraction and 31P MAS NMR study of rare-earth phosphate glasses, (R2O3)x(P2O5)1-x, x = 0.175–0.263, R = La, Ce, Pr, Nd, Sm, Eu, Gd, Tb, Dy, Ho, Er. J. Phys. Condens Mat. 2001, 13, 4105. [Google Scholar] [CrossRef] [Green Version]
  21. Hoppe, U.; Brow, R.K.; Ilieva, D.; Jóvári, P.; Hannon, A.C. Structure of rare-earth phosphate glasses by X-ray and neutron diffraction. J. Non-Cryst. Solids 2005, 351, 3179–3190. [Google Scholar] [CrossRef]
  22. Bachvarova-Nedelcheva, A.; Iordanova, R.; Ganev, S.; Dimitriev, Y. Glass formation and structural studies of glasses in the TeO2–ZnO–Bi2O3–Nb2O5 system. J. Non-Cryst. Solids 2019, 503, 224–231. [Google Scholar] [CrossRef]
  23. Gajek, M.; Leśniak, M.; Sitarz, M.; Stodolak-Zych, E.; Rapacz-Kmita, A. The crystallization and structure features of glass within the K2O–MgO–CaO–Al2O3–SiO2-(BaO) system. J. Mol. Struct. 2020, 1220, 128747. [Google Scholar] [CrossRef]
  24. Zhao, Z.; Zhang, B.; Gong, Y.; Ren, Y.; Huo, M.; Wang, Y. Concentration effect of Yb3+ ions on the spectroscopic properties of high-concentration Er3+/Yb3+ co-doped phosphate glasses. J. Mol. Struct. 2020, 1216, 128322. [Google Scholar] [CrossRef]
Figure 1. (a) XRD patterns of yttrium phosphate samples. (b) Crystal structure of YPO4 (xenotime, I41/amd) along the a axis. The YO8 decahedrons and PO4 tetrahedra are shown in yellow and green color, respectively. (c) SEM micrograph of the G12 sample and its EDS results (d).
Crystals 12 00109 g001
Figure 2. (a) IR and (b) Raman spectra of yttrium phosphate glasses. (c,d) Relative area dependence of bands in the Raman spectra of glass samples. The lines are drawn as guides for the eyes.
Crystals 12 00109 g002
Figure 3. (a) The diffuse reflectance spectra of yttrium phosphate glasses. (b) The Kubelka–Munk transformed reflectance spectra of all glass samples.
Crystals 12 00109 g003
Figure 4. The DSC curves of yttrium phosphate glasses.
Crystals 12 00109 g004
Figure 5. (a) The XRD patterns of the GC0 bulk sample at different crystallization times of 2 h (GC0-2), 5 h (GC0-5), and 10 h (GC0-10). SEM images of the surface of the GC0 sample at different crystallization times of (b) 2 h, (c) 5 h, and (d) 10 h after 40% HF etching for 15~20 s.
Crystals 12 00109 g005
Figure 6. (a) The XRD patterns of yttrium phosphate glass samples for a crystallization time of 10 h. SEM images of (b) GC2, (c) GC4, (d) GC6, (e) GC8, and (f) GC10 samples after 40% HF etching for 15~20 s.
Crystals 12 00109 g006
Publisher’s Note: MDPI stays neutral with regard to jurisdictional claims in published maps and institutional affiliations.

