Communication

Secondary Structure and X-ray Crystallographic Analysis of the Glideosome-Associated Connector (GAC) from Toxoplasma gondii

1
Department of Life Sciences, Imperial College London, South Kensington, London SW7 2AZ, UK
2
Department of Microbiology & Molecular Medicine, University of Geneva, 1 Rue Michel-Servet, 1211 Geneva, Switzerland
*
Author to whom correspondence should be addressed.
Submission received: 27 December 2021 / Revised: 10 January 2022 / Accepted: 12 January 2022 / Published: 15 January 2022
(This article belongs to the Special Issue Crystallographic Studies of Enzymes (Volume II))

Abstract

:
A model for parasitic motility has been proposed in which parasite filamentous actin (F-actin) is attached to surface adhesins by a large component of the glideosome, known as the glideosome-associated connector protein (GAC). This large 286 kDa protein interacts at the cytoplasmic face of the plasma membrane with the phosphatidic acid-enriched inner leaflet and cytosolic tails of surface adhesins to connect them to the parasite actomyosin system. GAC is observed initially to the conoid at the apical pole and re-localised with the glideosome to the basal pole in gliding parasite. GAC presumably functions in force transmission to surface adhesins in the plasma membrane and not in force generation. Proper connection between F-actin and the adhesins is as important for motility and invasion as motor operation itself. This notion highlights the need for new structural information on GAC interactions, which has eluded the field since its discovery. We have obtained crystals that diffracted to 2.6–2.9 Å for full-length GAC from Toxoplasma gondii in native and selenomethionine-labelled forms. These crystals belong to space group P212121; cell dimensions are roughly a = 119 Å, b = 123 Å, c = 221 Å, α = 90°, β = 90° and γ = 90° with 1 molecule per asymmetric unit, suggesting a more compact conformation than previously proposed

1. Introduction

There are more than 5000 species of apicomplexan parasites and many are etiological agents of major diseases that are a threat to global human and animal health, particularly in low-resource settings [1]. Most significant are malaria (Plasmodium), cryptosporidiosis (Cryptosporidium) and toxoplasmosis (Toxoplasma). The lifestyle of these obligate intracellular parasites involves crucial steps that depend on gliding motility such as host cell invasion, egress from infected cell and crossing of biological barriers [2].
These processes are dependent upon the orchestrated release of proteins from apical secretory organelles: micronemes and rhoptries. Following initial apical organelle secretion, a moving junction is formed that participates in the active penetration of host cells. In addition to invasion, parasites also use gliding motility to actively exit infected host cells during egress or migrate across biological surfaces, and in all cases, motility appears to be powered by the glideosome [3,4,5].
Current understanding broadly agrees upon a molecular architecture for the glideosome and explains how an actomyosin-motor drives motility in apicomplexan parasites. In this model, the TRAP/MIC family of adhesins targets ligands on the surface of the host cell to mediate apical attachment [6]. At the cytoplasmic side of the plasma membrane these adhesins are connected to the parasite actin filament network, while myosin motors drag adhesins through the plane of the plasma membrane towards the parasite posterior, and consequently pull the host cell membrane around the parasite. Myosin A (MyoA), a small divergent class XIV myosin, together with and glideosome-associated proteins (GAPs), act as the motor powering gliding motility [7]. MyoA is situated between the inner membrane complex (IMC) and parasite plasma membrane, and, together with the GAPs, it spans the two membranous structures.
The molecular component that bridges the adhesin to F-actin is a large novel protein termed the glideosome associated connector protein (GAC), which translocates with the moving junction from the parasite apex to the basal pole during gliding motility [8]. GAC is highly conserved across the entire Apicomplexa phylum and forms complexes with three binding partners (Figure 1A). The C-terminal region of GAC interacts with phosphatidic acid (PA) enriched membranes and its deletion results in a defective lytic-cycle phenotype. It has been suggested that GAC localisation is dependent upon PA generated by the lipid signalling cascade that regulates the apicomplexan Pleckstrin-homology domain protein (APH) to control microneme secretion [9,10]. PA signalling may ensure GAC is appropriately recruited only when a productive interaction can occur with adhesins during gliding motility. GAC also binds to microneme adhesin C-terminal tails at the plasma membrane’s cytoplasmic face and therefore serves as the link to the surface adhesins. Thirdly, a direct connection to the glideosome is made via an interaction between GAC and the parasite actin filaments (F-actin). It has also been shown that proper connection of actin to the adhesins (via GAC) is more important for efficient motility and invasion than motor operation itself [11].
We set out to solve the structure of GAC from T. gondii. Initial efforts to generate high-resolution diffracting crystals of TgGAC proved challenging. Eventually, after optimisation of the purification conditions together with secondary structure analyses and extensive crystallization screening, we generated high quality crystals that diffract to 2.67 Å resolution. This represents a key breakthrough in providing the first structural insight into the GAC architecture and function within the glideosome.

2. Materials and Methods

2.1. Protein Expression and Purification

Full-length TgGAC genes with TEV cleavable N-terminal 6xHis-tag has been cloned into the pET28a vector as previously described [8]. For selenomethionine labeling, the methionine auxotrophic E. coli strain B834(DE3) was transformed with the above mentioned vector. Cells were grown in the standard M9 minimal media containing the 50 µg/mL of methionine until the OD600nm~1. The cells were harvested and resuspended in fresh M9 media without methionine, and incubated for 4 h at 37 °C. Seleno-L-Methionine (50 µg/mL) was subsequently added and incubated for a further 30 min. The GAC expression was started with 1 mM IPTG and further incubated overnight at 22 °C.
Cells were harvested and resuspended in 50 mM Tris (pH 8), 300 mM NaCl, 10 mM Imidazole and 5 mM TCEP, followed by lysis by sonication and centrifugation at 18,000 rpm for 60 min (Ti45 rotor, Beckman, Brea, CA, USA). TgGAC was then purified by nickel chromatography followed by gel filtration using a Sephecryl S-300 HR column (GE Healthcare, Chicago, IL, USA).

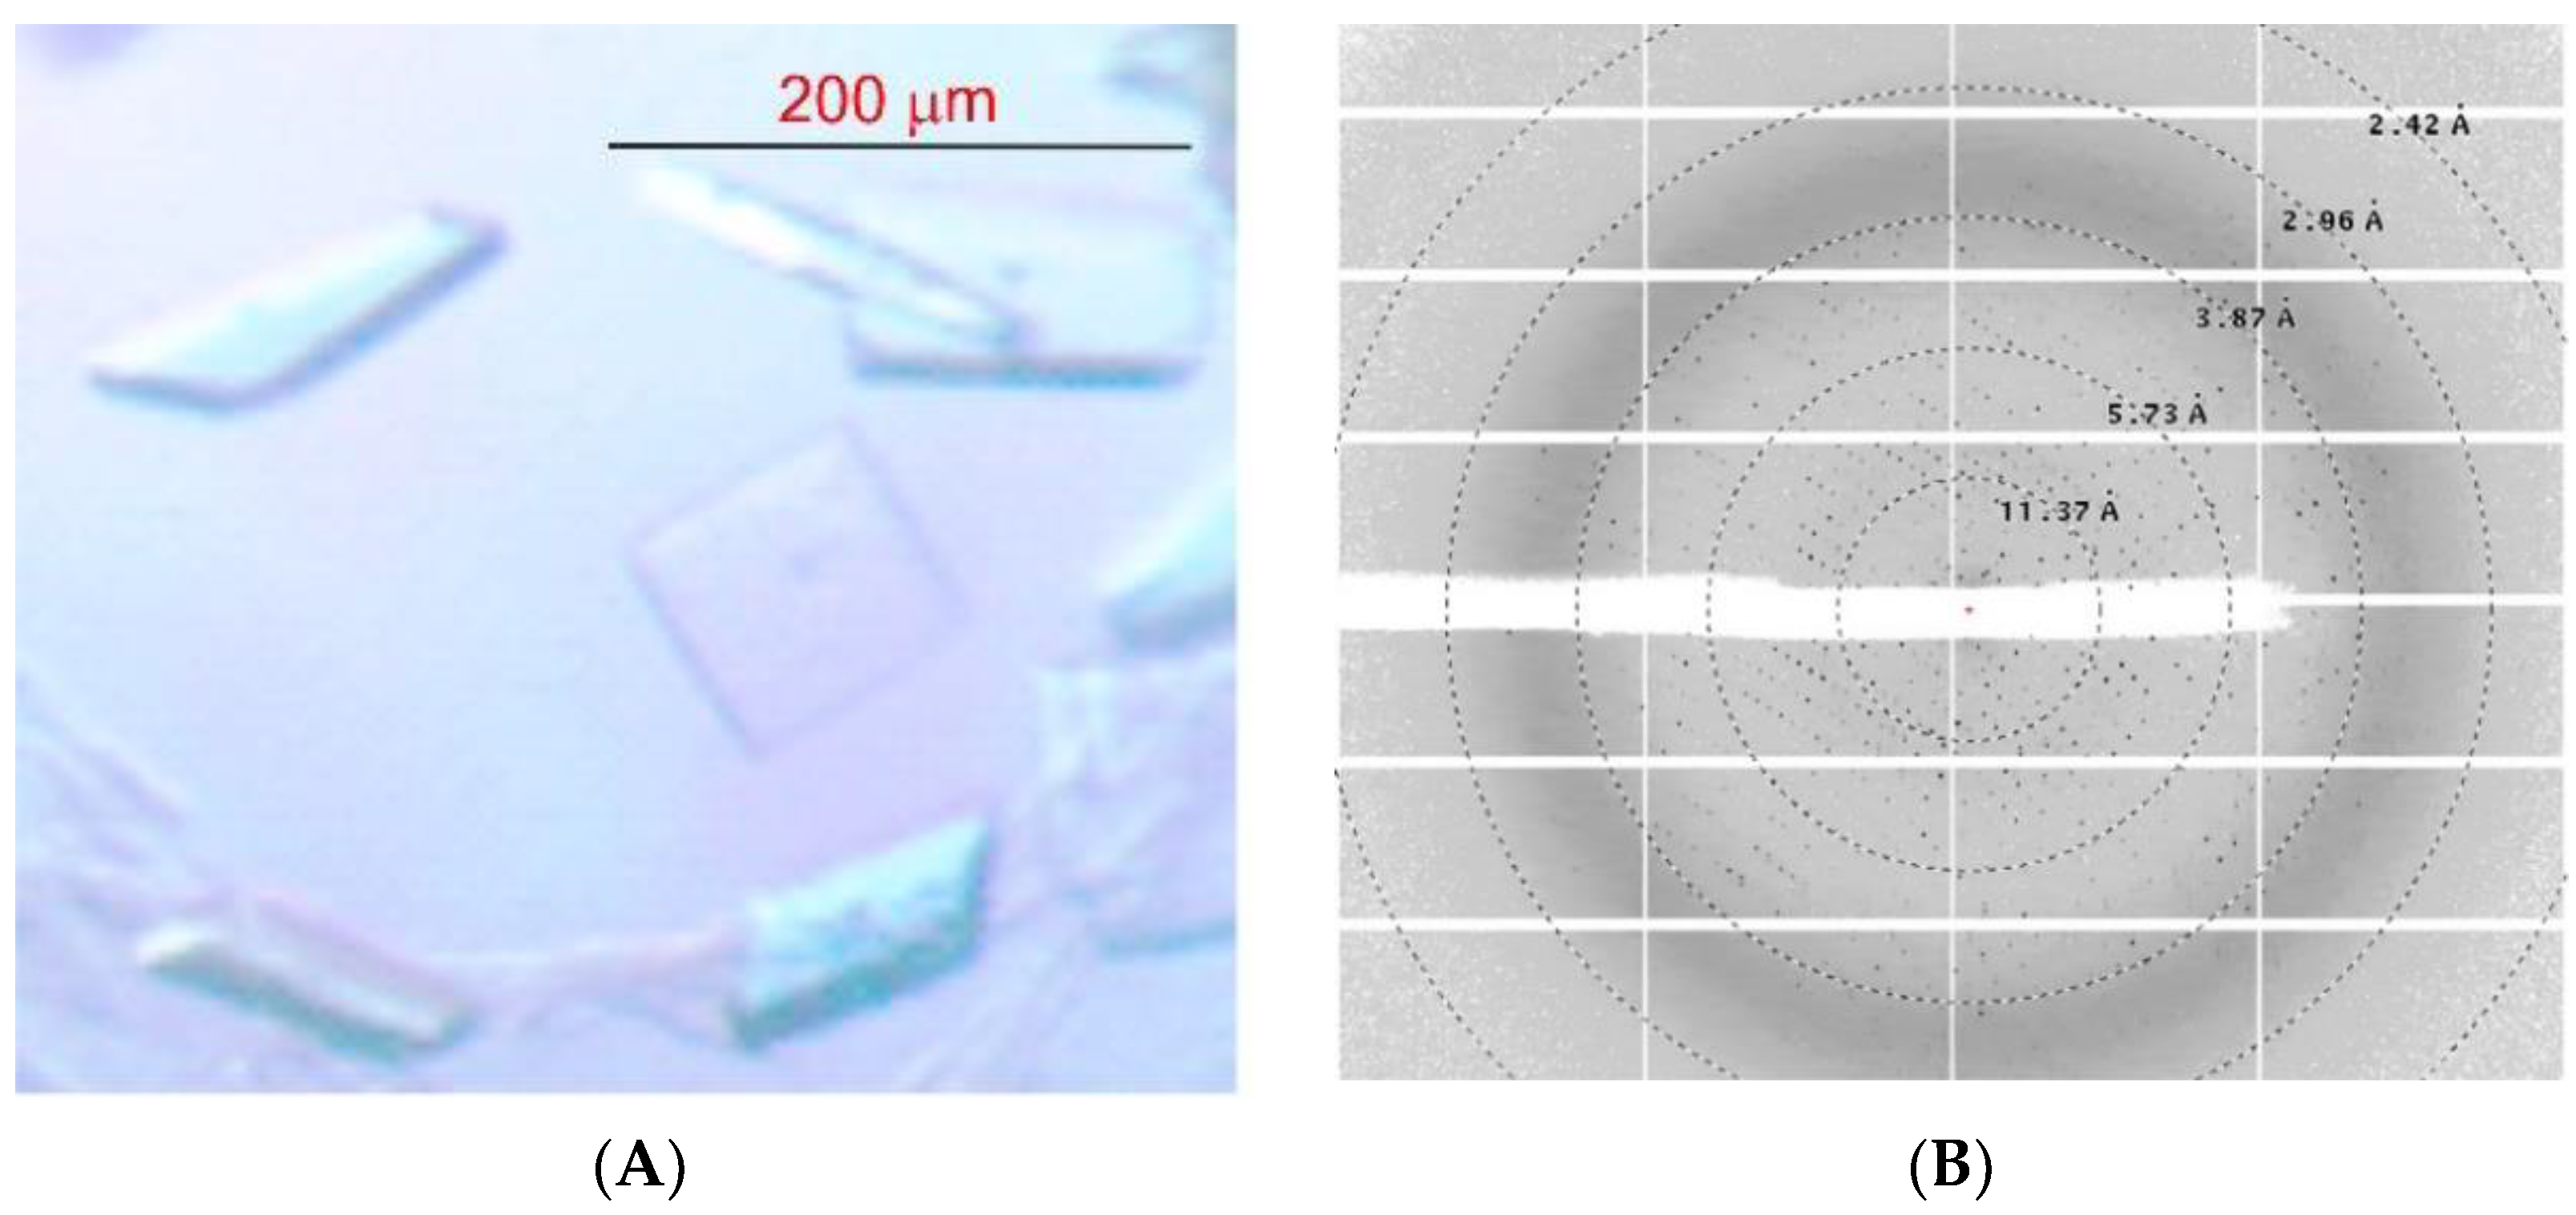
2.2. TgGAC Crystallization

Conditions for crystallization were initially screened by the sitting drop method of vapour diffusion at 20 °C and 4 °C using sparse matrix crystallization kits (Hampton research and Molecular Dimensions). MRC 96-well optimization plates (Molecular Dimensions) were utilised. Each drop was set with 100 nL protein solution and 100 nL reservoir solution using a Mosquito nanolitre high-throughput robot (TTP Labtech, Melbourn, UK). Reproducible protein crystals were obtained in 100 mM magnesium acetate, 100 mM sodium acetate, 6% PEG8000 and pH 5.0. These were manually optimised by screening over sodium acetate pH ranges of 4.0 to 5.0 in one dimension and a PEG8000 concentration gradient of 4%–10% in the second dimension. Crystallization was set-up at a concentration of 5–60 mg mL−1.

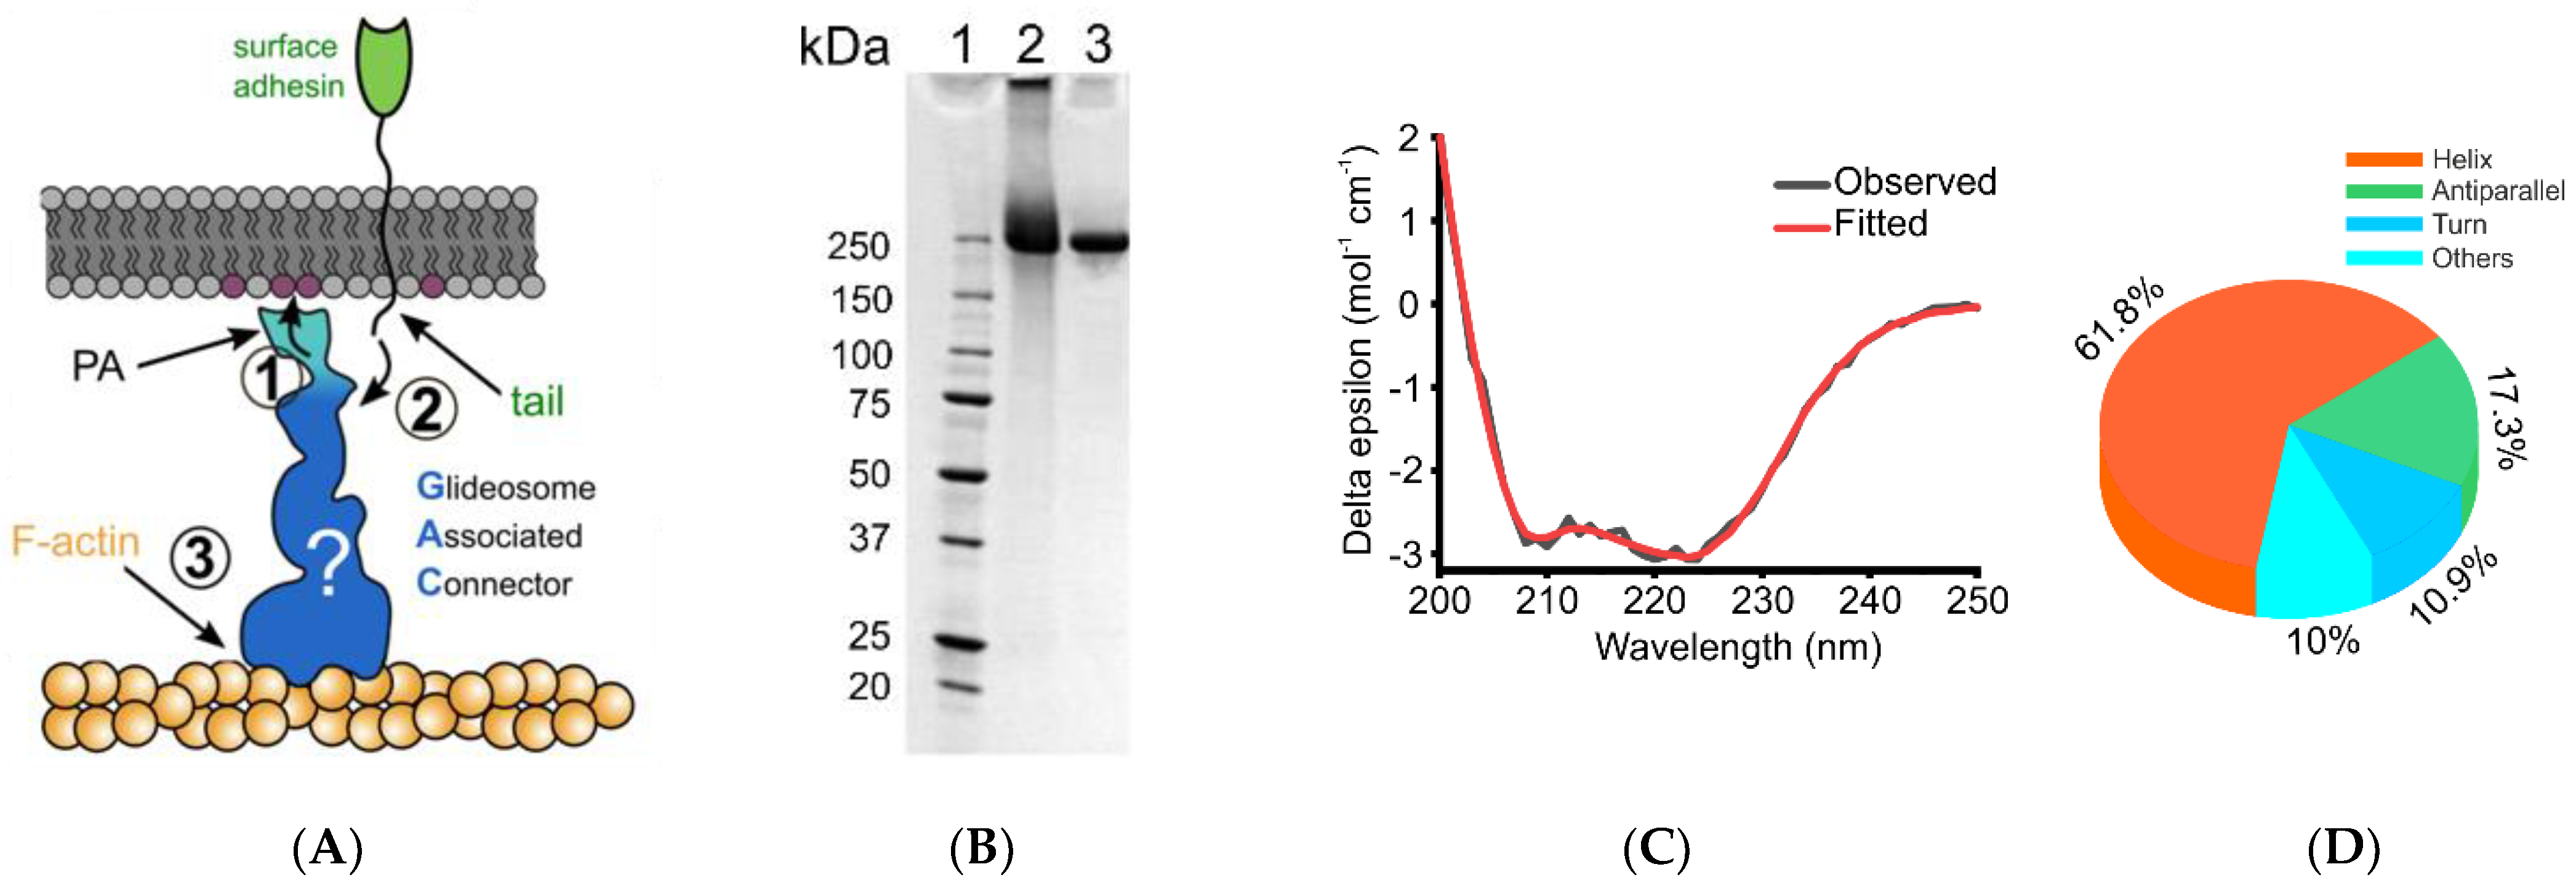
2.3. Circular Dichroism (CD) Spectroscopy

CD spectra of GAC was recorded at a concentration of 0.8 mg mL−1 in a variety of solution conditions, in which buffer, pH and temperature were changed. Spectra were recorded in the wavelength range of 200–260 nm, with a scan length of 2 s per point. Four repeats were collected and averaged. Optimal spectra were recorded for TgGAC at 298 K in 25 mM Tris.HCl, pH 8.0. Data were collected and processed by Chirascan CD Spectrometer (Applied Photophysics Limited, Leatherhead, UK).

2.4. X-ray Data Collection and Processing

Crystals were mounted in a MicroLoop (MiTeGen), cryoprotected with 30% ethylene glycol for 5 s and immediately flash frozen in liquid nitrogen. Diffraction data from native crystals were collected on beamline I04 of the Diamond Light Source (DLS), UK. Data were processed with CCP4, dials [12,13,14,15] and scaled using dials.scale [16] within the Xia2 package [17]. Multiple-wavelength anomalous diffraction (MAD) data from a single SeMet labelled crystal were collected on beamline I04 of the Diamond Light Source at the following wavelengths: peak = 0.9795 Å, inflection = 0.9796 Å and remote = 0.9722 Å. Data were processed initially by AutoProc [18]. Substructure definition and initial model building were performed using AutoSHARP [19]. This was followed by manual building in Coot [20] and further refinement using Phenix Refine [21].
Data collection statistics are shown in Table 1. The content of the unit cell was analysed using the Matthews coefficient [22]. Molecular replacement (MR) attempts were carried out using computationally derived structures using the following servers: RaptorX, Alphafold and iTasser [23,24,25].

3. Results and Discussion

While the identity and function of crucial genetic components of the T. gondii life cycle and infectivity are known, a detailed mechanistic understanding of parasite motility and invasion remains limited. Despite GAC’s essential role in efficient motility and invasion, no high-resolution experimental structural information is available. A small-angle X-ray scattering (SAXS) study presented TgGAC as a ~27 nm club-shaped molecule that stretches across the space between the parasitic plasma membrane and F-actin [8] (Figure 1A). However, this model is inconsistent with the latest understanding of the glideosome, as GAC would be unable to fit lengthways across this space together with the other essential components. To fully understand how GAC carries out its role, new experimental structural insight is required. We therefore isolated and purified the full-length TgGAC (Figure 1B). TgGAC contains 75 cysteines residues that are predicted not to participate in disulphide bonds. After assessment of structure and stability of GAC with CD spectroscopy (Figure 1C,D), we found that maintaining strict reducing conditions throughout purification was a crucial step in maintaining GACs full secondary structure (61.8% α-helix, 17.3% β-sheet, 10.8% turn and 10% others). Under these experimental conditions, crystals reliably grew to 100–200 μm3 in size over the course of 5–7 days (Figure 2A). For the highest resolution, it was essential to acquire X-ray diffraction images immediately after harvesting and freezing. Frozen crystals stored for any longer than a few days showed a progressive deterioration in resolution. Crystals could be stored at room temperature in crystallisation wells for many weeks without loss in the number of high-resolution crystals, if diffraction data were acquired directly after harvesting.
Native diffraction data were collected to 2.92 Å (Figure 2B) and indexed in space group P212121. Analysis of the crystal content indicated cell dimensions are a = 119 Å, b = 123 Å, c = 221 Å, α = 90°, β = 90° and γ = 90° with 1 molecule per asymmetric unit with a solvent content of 56%. This suggests that GAC adopts a more compact conformation than the ~27 nm (270 Å) long, club-shape measured from SAXS analysis, which would be better matched to the confined space between the plasma membrane and F-actin. Data-collection and processing statistics are listed in Table 1.
Molecular replacement attempts were made using structures based on various prediction algorithms as search models: RaptorX, Alphafold and iTasser. No solutions were found. We subsequently prepared selenomethionine-substituted and heavy-atom derivatives to provide phases using anomalous dispersion techniques. A single crystal of selenomethionine-labelled TgGAC was successfully obtained in the same conditions as native protein. Incorporation of heavy atoms was monitored by fluorescence scan screening of crystals on the beamline prior to data collection. Successful incorporation was validated by detection of a distinct peak corresponding to the X-ray absorption edge for Selenium (0.9795 A or 12.6578 keV). The crystals of native and SeMet-derivatized TgGAC protein diffracted to 2.92 Å and 2.67 Å resolution, respectively. Matthews coefficient (VM = 2.70 Å3 Da−1) and solvent-content (VS = 56.8%) calculations indicated that one molecule was present in the asymmetric unit. The multiple-wavelength anomalous dispersion method was used to determine the initial phases of the SeMet-substituted TgGAC protein. The autoSHARP processing pipeline obtained 73 Se sites. The structure solution is currently under way and will be reported elsewhere with full statistics.

Author Contributions

Conceptualization, S.M. and D.S.-F.; methodology, A.K., O.V., S.L.R. and M.L.M.; formal analysis, A.K. and M.L.M.; investigation, A.K., X.Z., F.A.S., N.D.S.P.; writing—original draft preparation, S.M.; writing—review and editing, A.K., X.Z., F.A.S., S.L.R. and D.S.-F.; supervision, S.M. and D.S.-F.; project administration, S.M. and D.S.-F.; funding acquisition, S.M. and D.S.-F. All authors have read and agreed to the published version of the manuscript.

Funding

Leverhulme Trust awards to SJM (RPG_2018_107); SNSF funding to DSF (310030_185325).

Acknowledgments

The crystallization facility at Imperial College London which is supported by the Biotechnology and Biological Sciences Research Council (BB/D524840/1) and Wellcome Trust (202926/Z/16/Z). We are grateful to staff at Diamond Light Source beamline I04 for their help with data collection.

Conflicts of Interest

The authors declare no conflict of interest.

References

  1. Meissner, M. The asexual cycle of apicomplexan parasites: New findings that raise new questions. Curr. Opin. Microbiol. 2013, 16, 421–423. [Google Scholar] [CrossRef] [Green Version]
  2. Heintzelman, M.B. Gliding motility in apicomplexan parasites. Semin. Cell Dev. Biol. 2015, 46, 135–142. [Google Scholar] [CrossRef]
  3. Frenal, K.; Dubremetz, J.F.; Lebrun, M.; Soldati-Favre, D. Gliding motility powers invasion and egress in Apicomplexa. Nat. Rev. Microbiol. 2017, 15, 645–660. [Google Scholar] [CrossRef] [Green Version]
  4. Boucher, L.E.; Bosch, J. The apicomplexan glideosome and adhesins—Structures and function. J. Struct. Biol. 2015, 190, 93–114. [Google Scholar] [CrossRef] [PubMed] [Green Version]
  5. Cowman, A.F.; Tonkin, C.J.; Tham, W.H.; Duraisingh, M.T. The Molecular Basis of Erythrocyte Invasion by Malaria Parasites. Cell Host Microbe 2017, 22, 232–245. [Google Scholar] [CrossRef] [PubMed]
  6. Carruthers, V.B.; Tomley, F.M. Microneme proteins in apicomplexans. Subcell. Biochem. 2008, 47, 33–45. [Google Scholar] [CrossRef] [PubMed]
  7. Powell, C.J.; Ramaswamy, R.; Kelsen, A.; Hamelin, D.J.; Warshaw, D.M.; Bosch, J.; Burke, J.E.; Ward, G.E.; Boulanger, M.J. Structural and mechanistic insights into the function of the unconventional class XIV myosin MyoA from Toxoplasma gondii. Proc. Natl. Acad. Sci. USA 2018, 115, E10548–E10555. [Google Scholar] [CrossRef] [Green Version]
  8. Jacot, D.; Tosetti, N.; Pires, I.; Stock, J.; Graindorge, A.; Hung, Y.F.; Han, H.; Tewari, R.; Kursula, I.; Soldati-Favre, D. An Apicomplexan Actin-Binding Protein Serves as a Connector and Lipid Sensor to Coordinate Motility and Invasion. Cell Host Microbe 2016, 20, 731–743. [Google Scholar] [CrossRef] [Green Version]
  9. Darvill, N.; Dubois, D.J.; Rouse, S.L.; Hammoudi, P.M.; Blake, T.; Benjamin, S.; Liu, B.; Soldati-Favre, D.; Matthews, S. Structural Basis of Phosphatidic Acid Sensing by APH in Apicomplexan Parasites. Structure 2018, 26, 1059–1071.e1056. [Google Scholar] [CrossRef] [Green Version]
  10. Bullen, H.E.; Jia, Y.; Yamaryo-Botte, Y.; Bisio, H.; Zhang, O.; Jemelin, N.K.; Marq, J.B.; Carruthers, V.; Botte, C.Y.; Soldati-Favre, D. Phosphatidic Acid-Mediated Signaling Regulates Microneme Secretion in Toxoplasma. Cell Host Microbe 2016, 19, 349–360. [Google Scholar] [CrossRef] [Green Version]
  11. Whitelaw, J.A.; Latorre-Barragan, F.; Gras, S.; Pall, G.S.; Leung, J.M.; Heaslip, A.; Egarter, S.; Andenmatten, N.; Nelson, S.R.; Warshaw, D.M.; et al. Surface attachment, promoted by the actomyosin system of Toxoplasma gondii is important for efficient gliding motility and invasion. BMC Biol. 2017, 15, 1–23. [Google Scholar] [CrossRef] [Green Version]
  12. Beilsten-Edmands, J.; Winter, G.; Gildea, R.; Parkhurst, J.; Waterman, D.; Evans, G. Scaling diffraction data in the DIALS software package: Algorithms and new approaches for multi-crystal scaling. Acta Crystallogr. D Struct. Biol. 2020, 76, 385–399. [Google Scholar] [CrossRef] [Green Version]
  13. Winn, M.D.; Ballard, C.C.; Cowtan, K.D.; Dodson, E.J.; Emsley, P.; Evans, P.R.; Keegan, R.M.; Krissinel, E.B.; Leslie, A.G.; McCoy, A.; et al. Overview of the CCP4 suite and current developments. Acta Crystallogr. D Biol. Crystallogr. 2011, 67, 235–242. [Google Scholar] [CrossRef] [Green Version]
  14. Winter, G. xia2: An expert system for macromolecular crystallography data reduction. J. Appl. Crystallogr. 2010, 43, 186–190. [Google Scholar] [CrossRef]
  15. Winter, G.; Waterman, D.G.; Parkhurst, J.M.; Brewster, A.S.; Gildea, R.J.; Gerstel, M.; Fuentes-Montero, L.; Vollmar, M.; Michels-Clark, T.; Young, I.D.; et al. DIALS: Implementation and evaluation of a new integration package. Acta Crystallogr. D Struct. Biol. 2018, 74, 85–97. [Google Scholar] [CrossRef] [PubMed] [Green Version]
  16. Evans, P. Scaling and assessment of data quality. Acta Crystallogr. D Biol. Crystallogr. 2006, 62, 72–82. [Google Scholar] [CrossRef] [PubMed]
  17. Winter, G.; Lobley, C.M.; Prince, S.M. Decision making in xia2. Acta Crystallogr. D Biol. Crystallogr. 2013, 69, 1260–1273. [Google Scholar] [CrossRef] [Green Version]
  18. Vonrhein, C.; Flensburg, C.; Keller, P.; Sharff, A.; Smart, O.; Paciorek, W.; Womack, T.; Bricogne, G. Data processing and analysis with the autoPROC toolbox. Acta Crystallogr. D Biol. Crystallogr. 2011, 67, 293–302. [Google Scholar] [CrossRef] [Green Version]
  19. Vonrhein, C.; Blanc, E.; Roversi, P.; Bricogne, G. Automated structure solution with autoSHARP. Methods Mol. Biol. 2007, 364, 215–230. [Google Scholar] [CrossRef]
  20. Emsley, P.; Lohkamp, B.; Scott, W.G.; Cowtan, K. Features and development of Coot. Acta Crystallogr. D Biol. Crystallogr. 2010, 66, 486–501. [Google Scholar] [CrossRef] [PubMed] [Green Version]
  21. Adams, P.D.; Afonine, P.V.; Bunkoczi, G.; Chen, V.B.; Davis, I.W.; Echols, N.; Headd, J.J.; Hung, L.-W.; Kapral, G.J.; Grosse-Kunstleve, R.W.; et al. PHENIX: A comprehensive Python-based system for macromolecular structure solution. Acta Crystallogr. D Biol. Crystallogr. 2010, 66, 213–221. [Google Scholar] [CrossRef] [PubMed] [Green Version]
  22. Matthews, B.W. Solvent content of protein crystals. J. Mol. Biol. 1968, 33, 491–497. [Google Scholar] [CrossRef]
  23. Senior, A.W.; Evans, R.; Jumper, J.; Kirkpatrick, J.; Sifre, L.; Green, T.; Qin, C.; Žídek, A.; Nelson, A.W.R.; Bridgland, A.; et al. Improved protein structure prediction using potentials from deep learning. Nature 2020, 577, 706–710. [Google Scholar] [CrossRef]
  24. Källberg, M.; Wang, H.; Wang, S.; Peng, J.; Wang, Z.; Lu, H.; Xu, J. Template-based protein structure modeling using the RaptorX web server. Nat. Protoc. 2012, 7, 1511–1522. [Google Scholar] [CrossRef] [PubMed] [Green Version]
  25. Yang, J.; Yan, R.; Roy, A.; Xu, D.; Poisson, J.; Zhang, Y. The I-TASSER Suite: Protein structure and function prediction. Nat. Methods 2015, 12, 7–8. [Google Scholar] [CrossRef] [Green Version]
Figure 1. TgGAC interactions, purification and characterisation. (A) Schematic representation of GAC interactions with (1) the plasma membrane, (2) surface adhesins and (3) F-actin (B) SDS–PAGE of purified full-length TgGAC used for the crystallization trials. Lane 1: molecular-weight markers (kDa), lane 2: Ni-NTA eluted fraction and lane 3: eluted fraction from a Sephecryl S-300 HR SEC column. (C) CD spectrum of purified TgGAC measured at 298 K. Black spectrum showed the observed spectrum in 25 mM Tris.HCl, pH 8.0. Red spectrum indicated the fitted line for secondary structure analysis. (D) Secondary structure analysis based upon the CD spectrum as indicated in (C). Orange indicated the percentage helical content, green is beta-sheet, turn as blue and cyan as other contents in the GAC.
Crystals 12 00110 g001
Figure 2. TgGAC full length crystallography. (A) Representative native crystals of TgGAC. Scale bar represents 200 μm. (B) Diffraction image from a TgGAC crystal. Resolution rings are annotated.
Crystals 12 00110 g002
Table 1. X-ray diffraction data collection statistics.
CrystalNativeSeMet
Space groupP212121P212121
Cell dimensions (Å)a = 120.63, b = 123.96, c = 221.86a = 119.08, b = 123.60, c = 221.51
Angles (°)α = 90.00, β = 90.00, γ = 90.00α = 90.00, β = 90.00, γ = 90.00
Resolution (Ǻ)82.66–2.92 (2.97–2.92) *110.75–2.67 (2.67–2.72) *
Wavelength (Ǻ)0.979500.97950
Total reflections2,899,820 (140,928)904,519 (44214)
Unique observations72,969 (3564)92,922 (4581)
Completeness (%)100 (99–100)100 (99.7–100)
Multiplicity39.7 (39.5)9.7 (9.7)
Rpim0.045 (1.486)0.039 (0.861)
<I>/σI13.1 (88–0.5)14 (47.2–0.8)
Molecules per asymmetric unit 11
Solvent content (%)56.856.8
* Values in parentheses correspond to the highest resolution shell. Rmerge = Σhkl Σi|Ii(hkl)– <I(hkl)>|/Σhkl Σi Ii(hkl) where <I(hkl)> is the mean intensity of the observations Ii(hkl) of reflection hkl. Most probable value.
Publisher’s Note: MDPI stays neutral with regard to jurisdictional claims in published maps and institutional affiliations.

