
Microwave Roasting Characteristics of Cuprous Chloride Residue from Zinc Hydrometallurgy

1
Henan Institute of Technology, Xinxiang 453003, China
2
College of Material and Chemical Engineering, Tongren University, Tongren 554300, China
*
Authors to whom correspondence should be addressed.
Crystals 2022, 12(1), 116; https://0-doi-org.brum.beds.ac.uk/10.3390/cryst12010116
Submission received: 19 November 2021
/
Revised: 12 January 2022
/
Accepted: 13 January 2022
/
Published: 17 January 2022
(This article belongs to the Special Issue Metallurgical Slag)
Abstract
:High-efficiency dechlorination processes are crucial for the clean utilization of CuCl waste residue from zinc hydrometallurgical processes. A new method of oxygen-enriched microwave roasting has been proposed to improve the dechlorination process. The cavity perturbation method was used in this paper to measure the permittivity of a CuCl residue at various temperatures and apparent densities. The results show that temperature had a more significant effect on the loss tangent when it exceeded 400 °C more than that of apparent densities. The degree of dechlorination of CuCl residue exceeded 93% after 90 min of microwave roasting at 450 °C and 150 mL/min oxygen flow, which was 12% higher than that of conventional calcination. The elemental distribution in samples was studied using single-point, linear, and lateral scans at the microscale, and the microstructure and phase changes of the CuCl residue under a microwave field were characterized by XRD and SEM-EDS. This study shows that microwaves can promote the dechlorination reaction by decreasing the activation energy from 52.69 kJ/mol to 42.36 kJ/mol.
1. Introduction
Dechlorination is essential during zinc hydrometallurgy to ensure that the zinc sulfate solution meets the electrolysis requirements [1]. The copper slag dechlorination method is widely used in the industry due to the availability of raw materials, simplicity of operation, low production costs, and high initial dechlorination rate in zinc sulfate solution dechlorination processes [2]. However, in the process of copper slag dechlorination, a kind of residue with CuCl and Cu2O precipitation as the main phase is produced. At present, there is no reasonable and efficient treatment method for this part of the residue, resulting in a large waste of copper and zinc resources [3]. As a result, it is critical that new technology is developed to treat CuCl residue in an economical, effective, and environmentally friendly manner.
High-temperature roasting is one of the most commonly used methods for chlorine-containing waste residue [4]. Melting, volatilization, and oxidation are the main reactions of CuCl in the residue at high temperatures and in an oxygen atmosphere. CuCl can react with O2 at a certain temperature to form CuO and Cl2, allowing metal and chlorine to be recovered simultaneously [5]. Microwaves are widely used in various industries because of their fast heating speed, selective heating, which can speed up the chemical reaction and reduce the reaction temperature, among other characteristics [6,7,8]. According to the literature, CuCl in slag has stronger absorption of waves than other components in the microwave field [9]. As a result, the advantage of microwave selective internal heating and the combination of oxygen can strengthen the oxidation dechlorination reaction of the impurity component—chloride. Liu et al. [10] studied the effect of microwave roasting on the removal of F and Cl from zinc oxide fumes by taking advantage of the different microwave absorption characteristics of halides, lead oxide, and zinc oxide, as well as the benefit of microwave selective heating. The results show that the efficiency of fluoride and chlorination was 92.8% and 90.3%, respectively. Lu [11,12] demonstrated the feasibility of using microwave roasting to remove chlorine from copper chloride slag, discovering that the chlorine content of the material decreased from 14.27% to 1.35% after 2 h of microwave roasting. However, neither the material’s dielectric properties nor the mechanism of microwave-enhanced dechlorination was investigated.
The dielectric properties are the key parameters for microwave heating because they determine how the microwave energy is absorbed, transmitted, reflected, or concentrated inside a material; knowledge of the dielectric properties of the residue plays a major role in the microwave design and simulation for any process [13]. Composition, temperature, microwave frequency, and other factors all have an impact on dielectric properties. However, the dielectric properties of CuCl residue have rarely been reported, particularly at high temperatures, although there have been a few studies on the dielectric properties of materials at room temperature [14]. Ma et al. [15] used a cavity perturbation method to measure the dielectric properties of zinc oxide dust with various apparent densities at room temperature and discussed the feasibility of removing fluoride and chlorine from zinc oxide dust using microwave roasting. The effects of sample mass and microwave power on the heating characteristics were also studied, and the results reveal that zinc oxide dust has high microwave absorption, allowing it to be heated quickly. Hence, it is important to know how the dielectric properties of CuCl residue change with the temperature and apparent density.
In this study, the dielectric properties of CuCl residue were measured using the cavity perturbation method at various temperatures and apparent densities, and the loss tangent (tanδ) was calculated based on the measured values. It is hypothesized that the obtained data regarding the dielectric properties can provide useful guidelines in designing and simulating the microwave heating system of CuCl residue. Furthermore, based on the properties of CuCl residue, a new high-efficiency dechlorination technology based on microwave oxidation roasting was proposed. The mechanism by which microwave roasting improves dechlorination was investigated using chemical reaction process analysis in conjunction with XRD, SEM-EDS, and other analysis and testing methods.
2. Materials and Methods
2.1. Materials
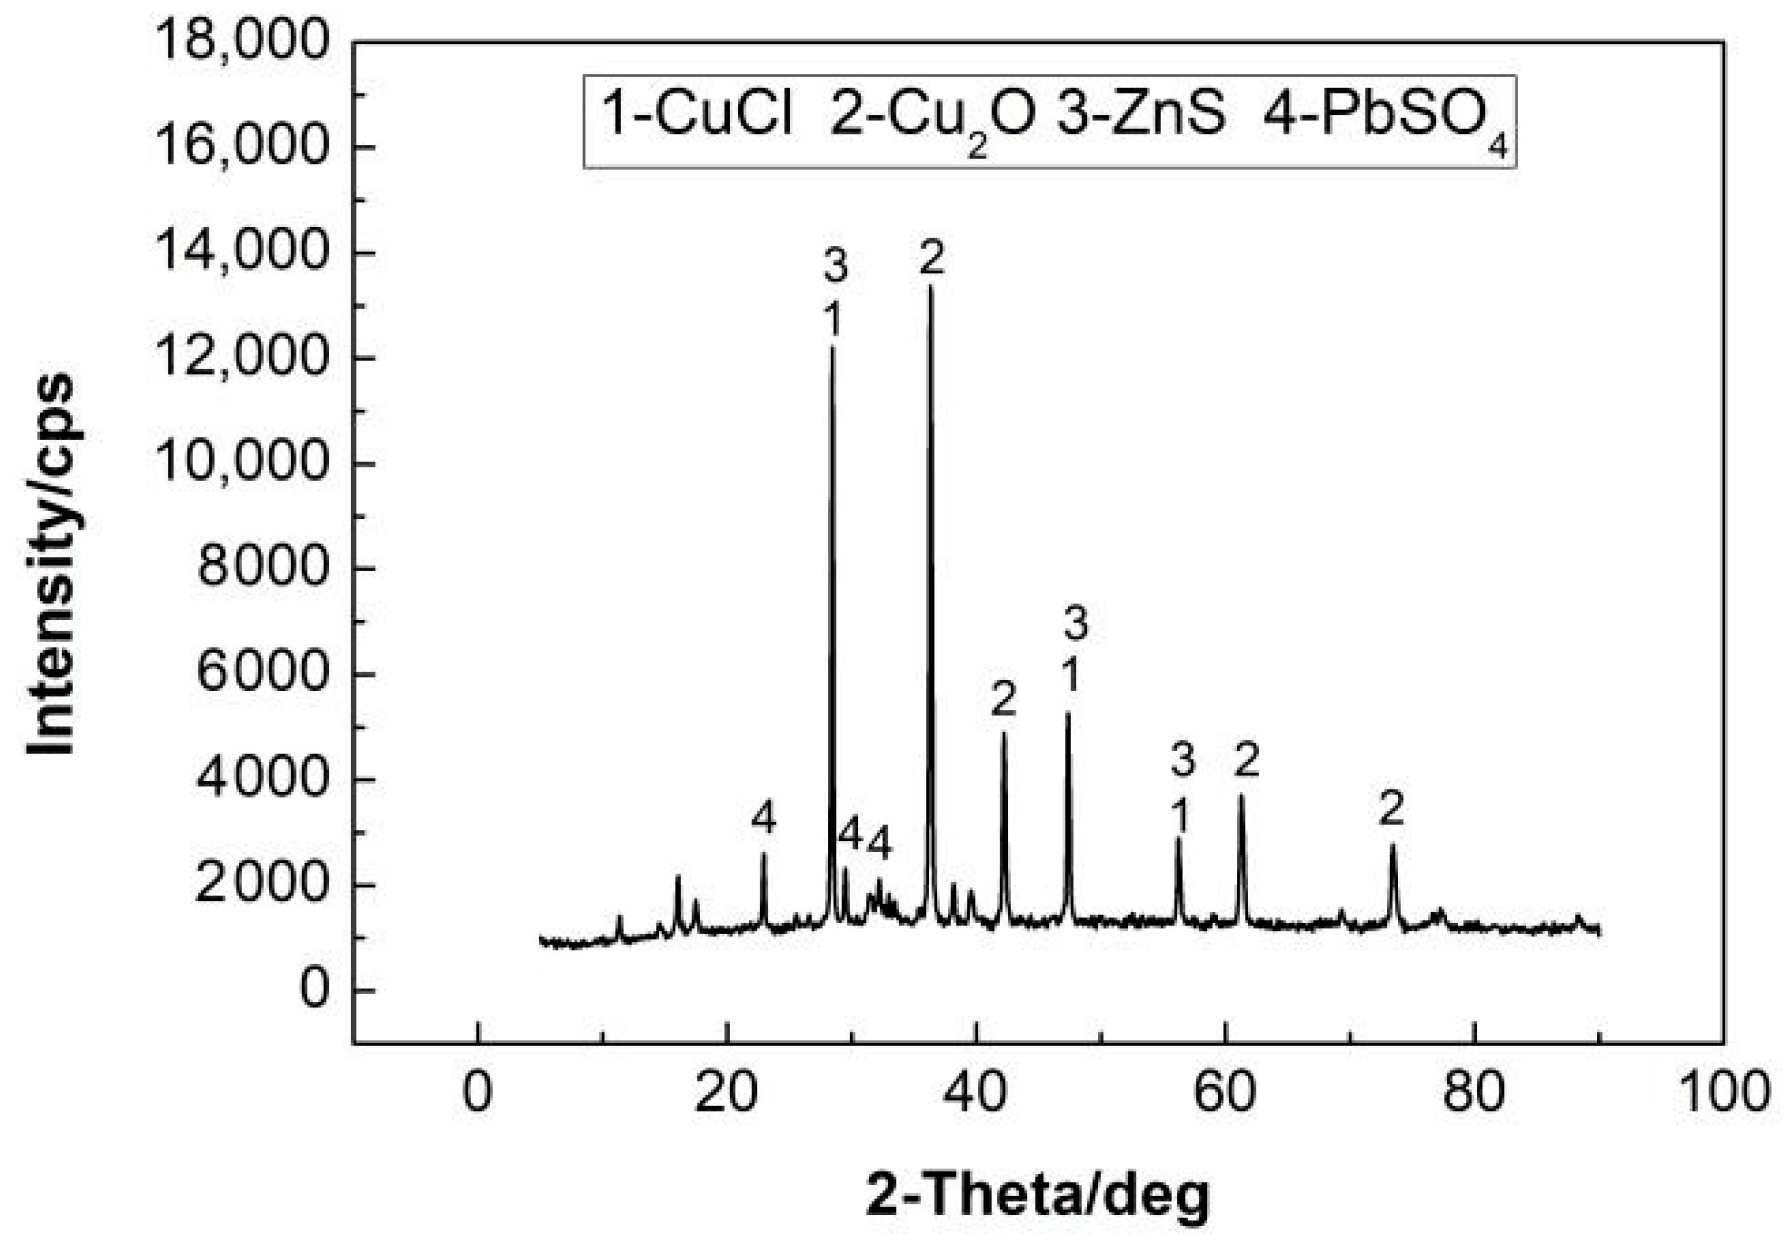
The CuCl residue was obtained from a zinc hydrometallurgical plant in Yunnan Province, China. The elemental composition of the residue was measured by inductively coupled plasma optical emission spectrometry (ICP-OES, Agilent5100, Agilent Technologies, Palo Alto, USA), and phases of the completely dried CuCl residue were determined by XRD (XRD-7000S/L, Shimadzu, Kyoto, Japan), and the results are shown in Table 1 and Figure 1.
It can be seen from Figure 1 that cuprous chloride (CuCl) and cuprous oxide (Cu2O) are the main phase components of CuCl residue, and a small amount of ZnS and PbSO3 also exists.
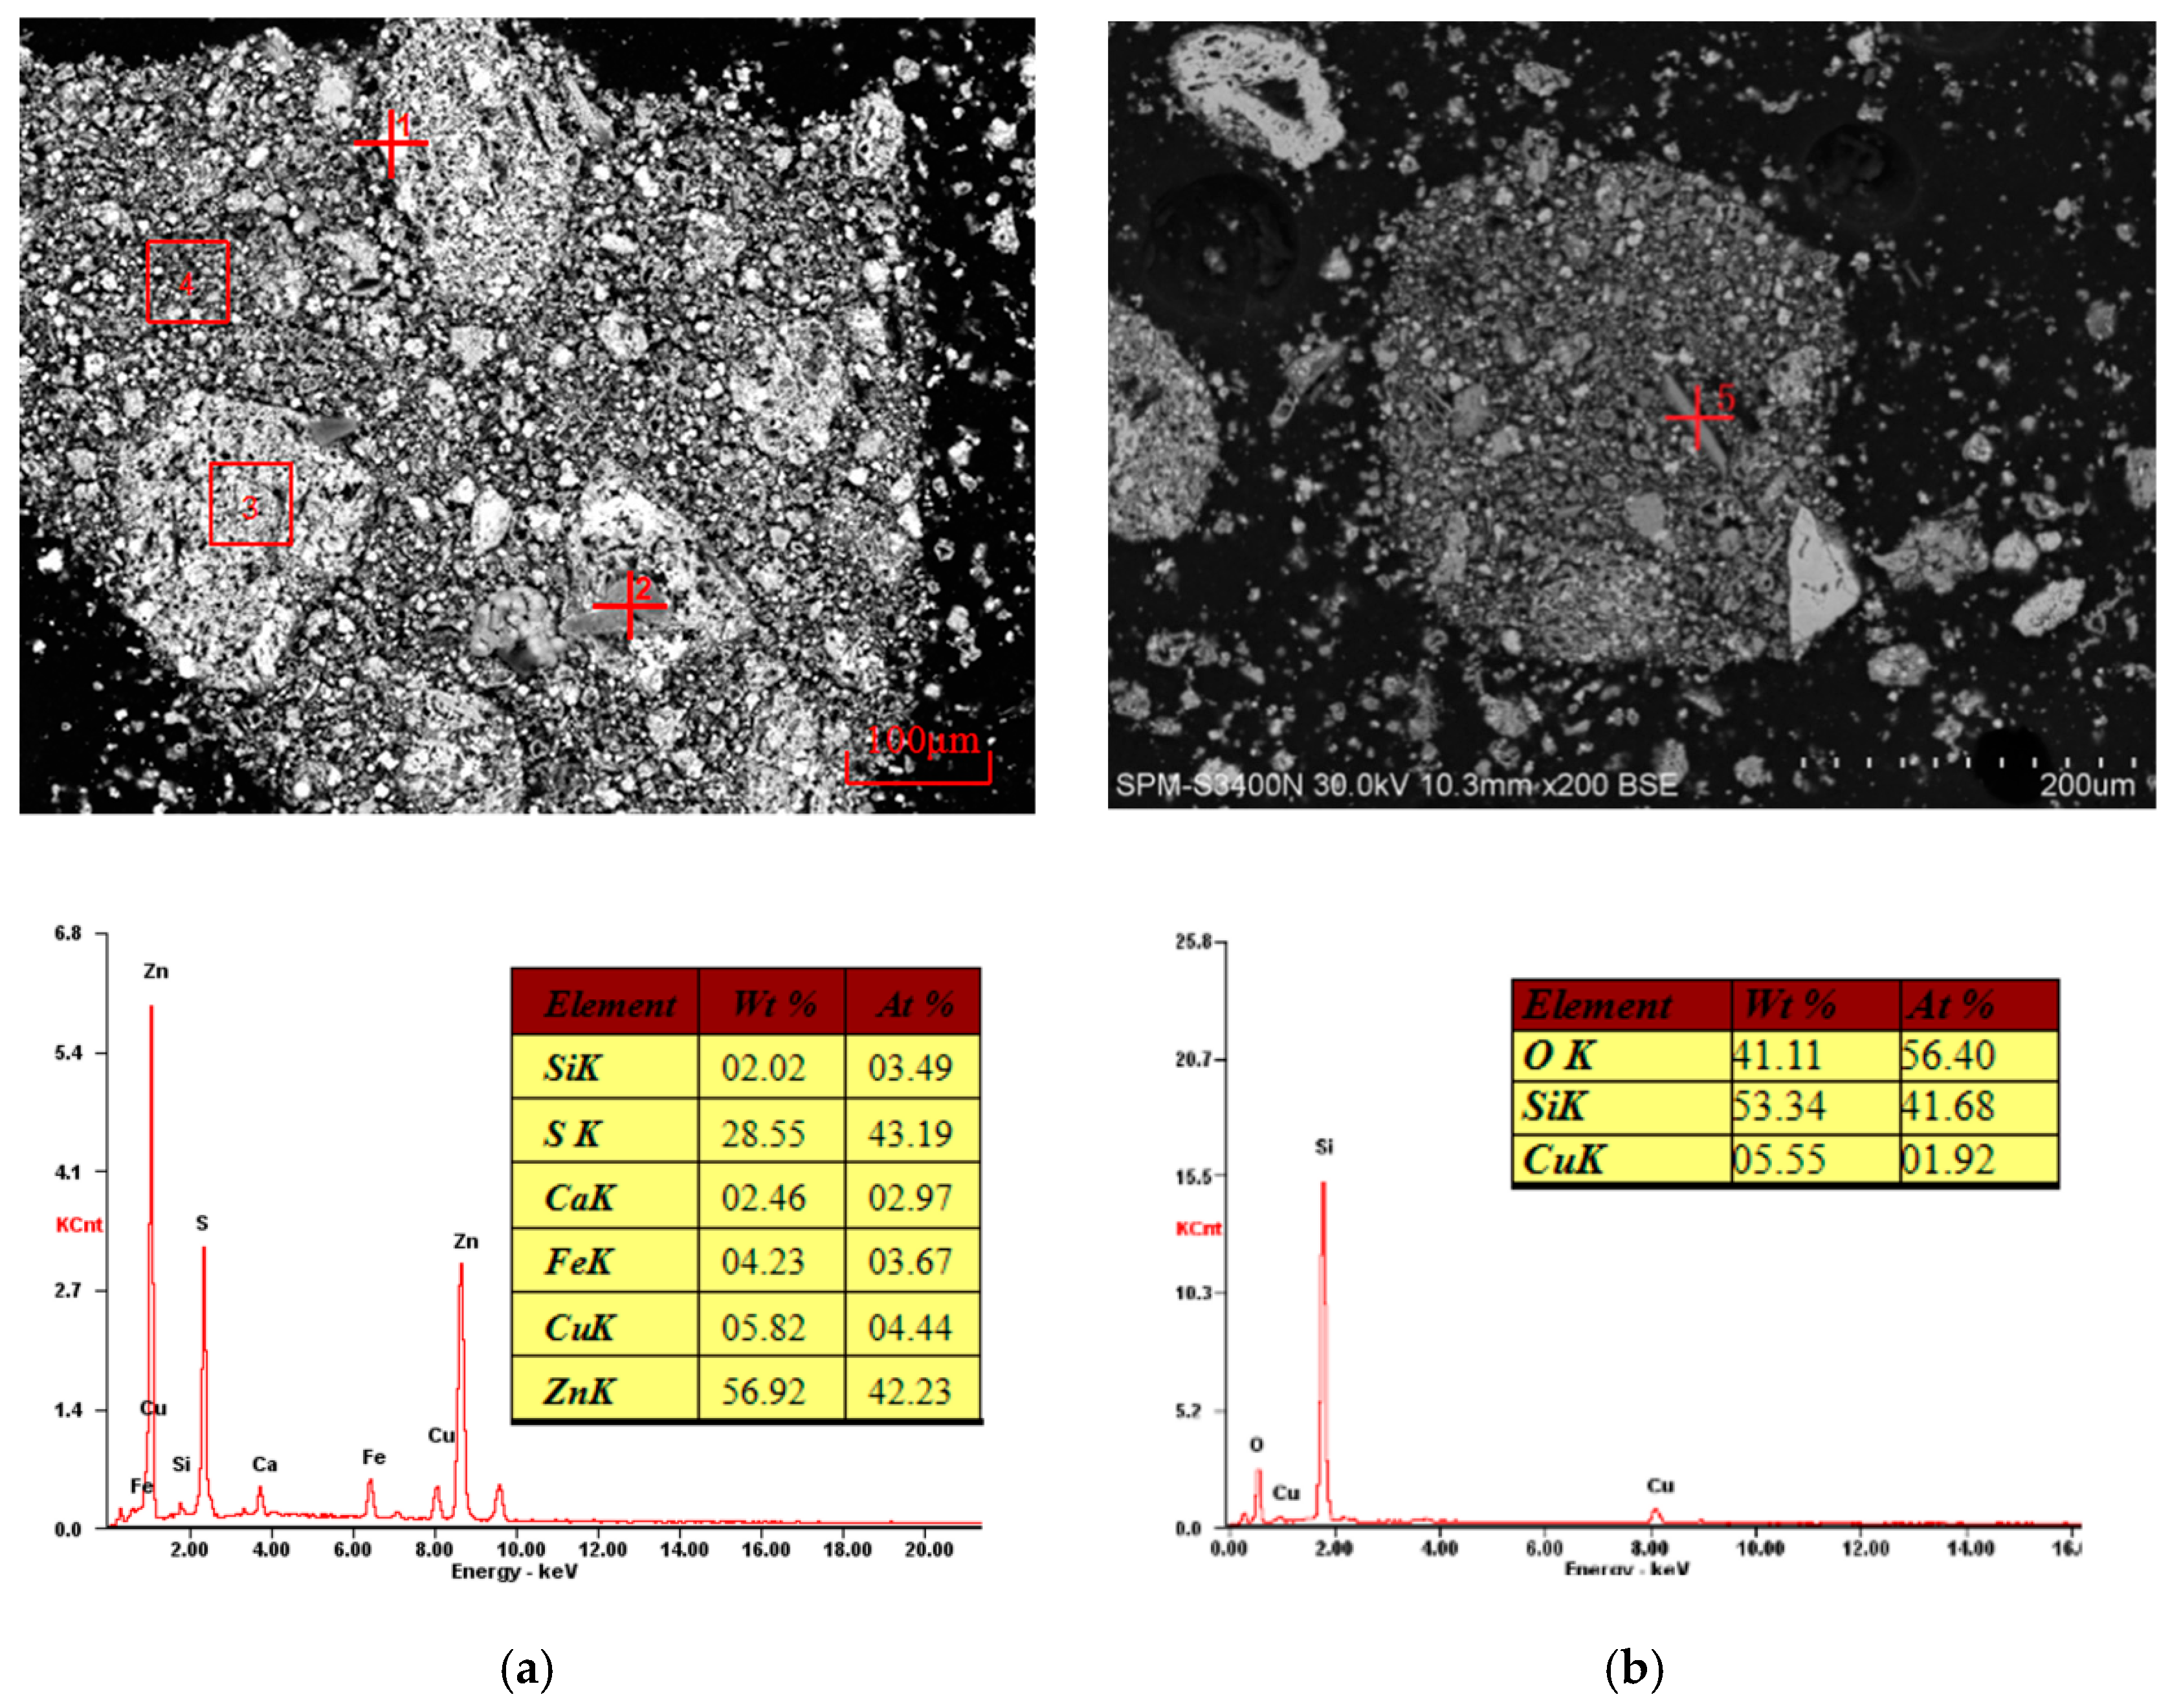
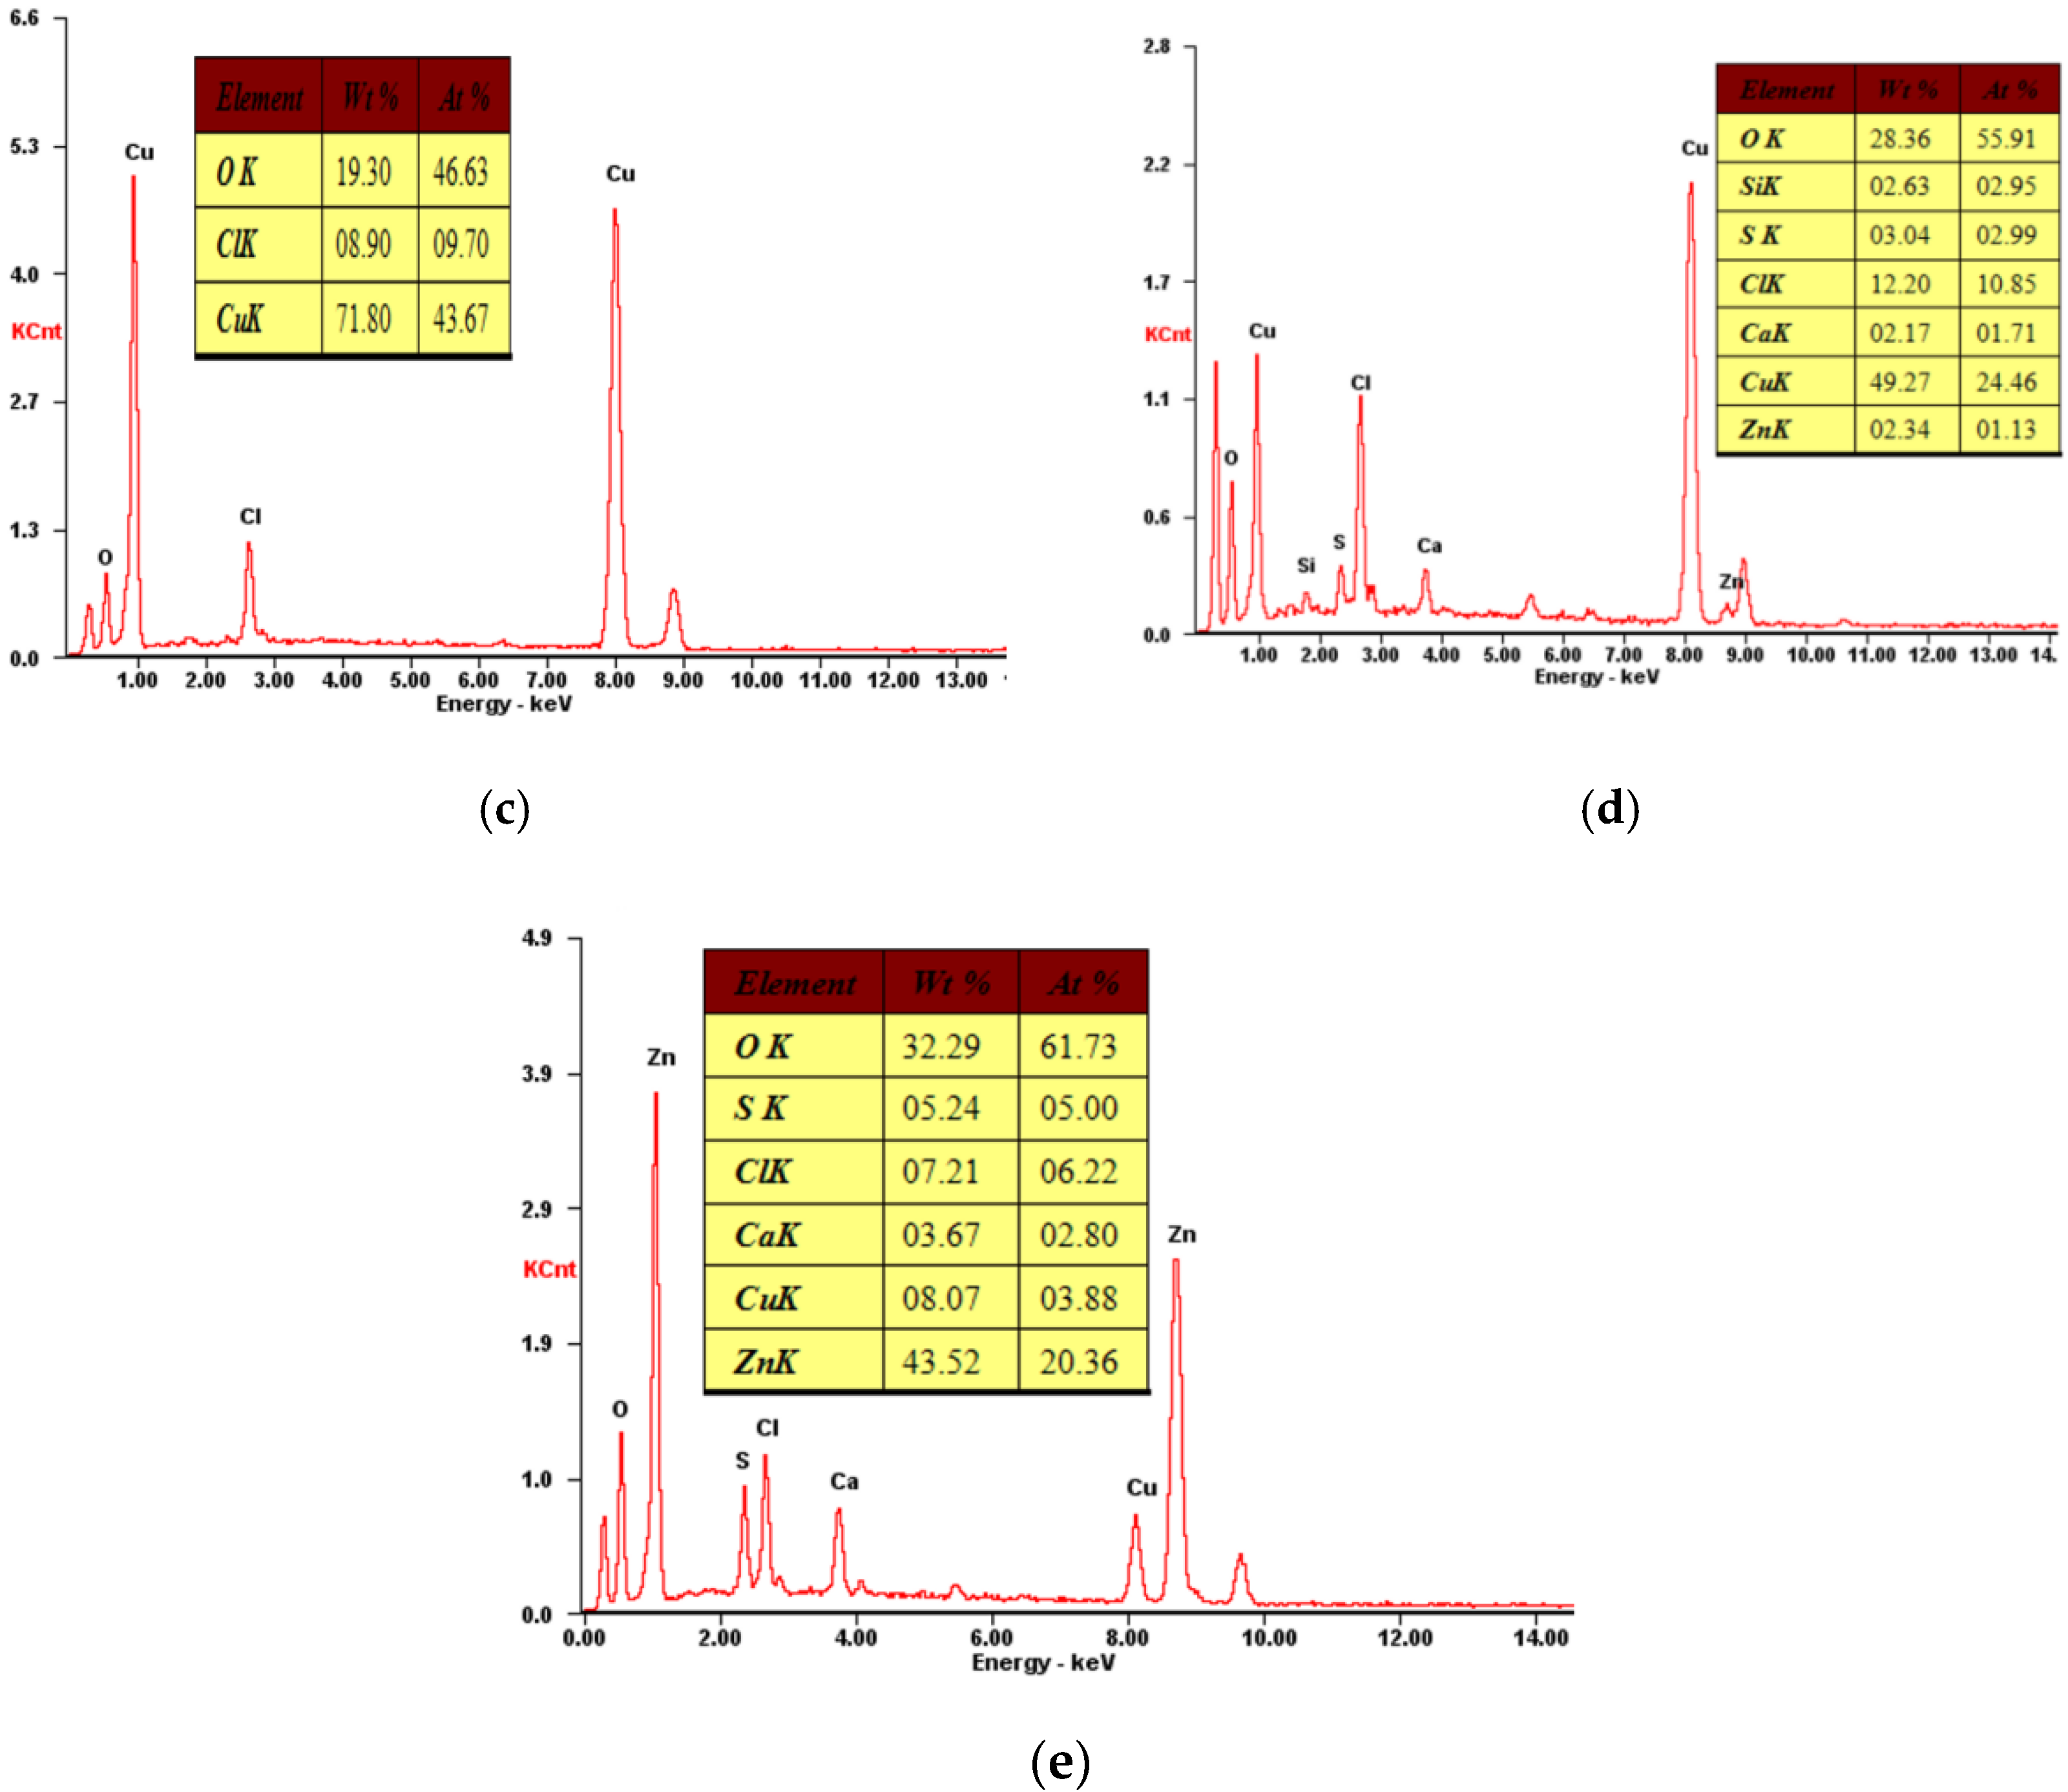
The morphology of the ground samples was examined using SEM-DES (SPM-S3400N, Hitachi, Tokyo, Japan) at various magnifications, and the results are shown in Figure 2. CuCl agglomerates were made up of bright, white independent particles (Spot 1), flocculant gray aggregates (Spot 2), large tightly bonded honeycomb particles (Spot 3), relatively dispersed small gray particles (Spot 4), and regular rod-shaped particles (Spot 5).
According to the energy spectrum analysis of the residue in Figure 2, ZnS was found to be the main component of the bright, white independent particles (Spot 1). The main component of the flocculent gray aggregates (Spot 2) was SiO2, and the large tightly bonded honeycomb particles (Spot 3) were Cu2O and CuCl. Cu2O, CuCl, and some ZnO and ZnS were the main components of the small gray particles (Spot 4), while the rod-shaped particles (Spot 5) were mainly made up of ZnO. The energy spectrum analysis corresponded well to the XRD patterns.
2.2. Experimental Device
2.2.1. Permittivity Measurement System
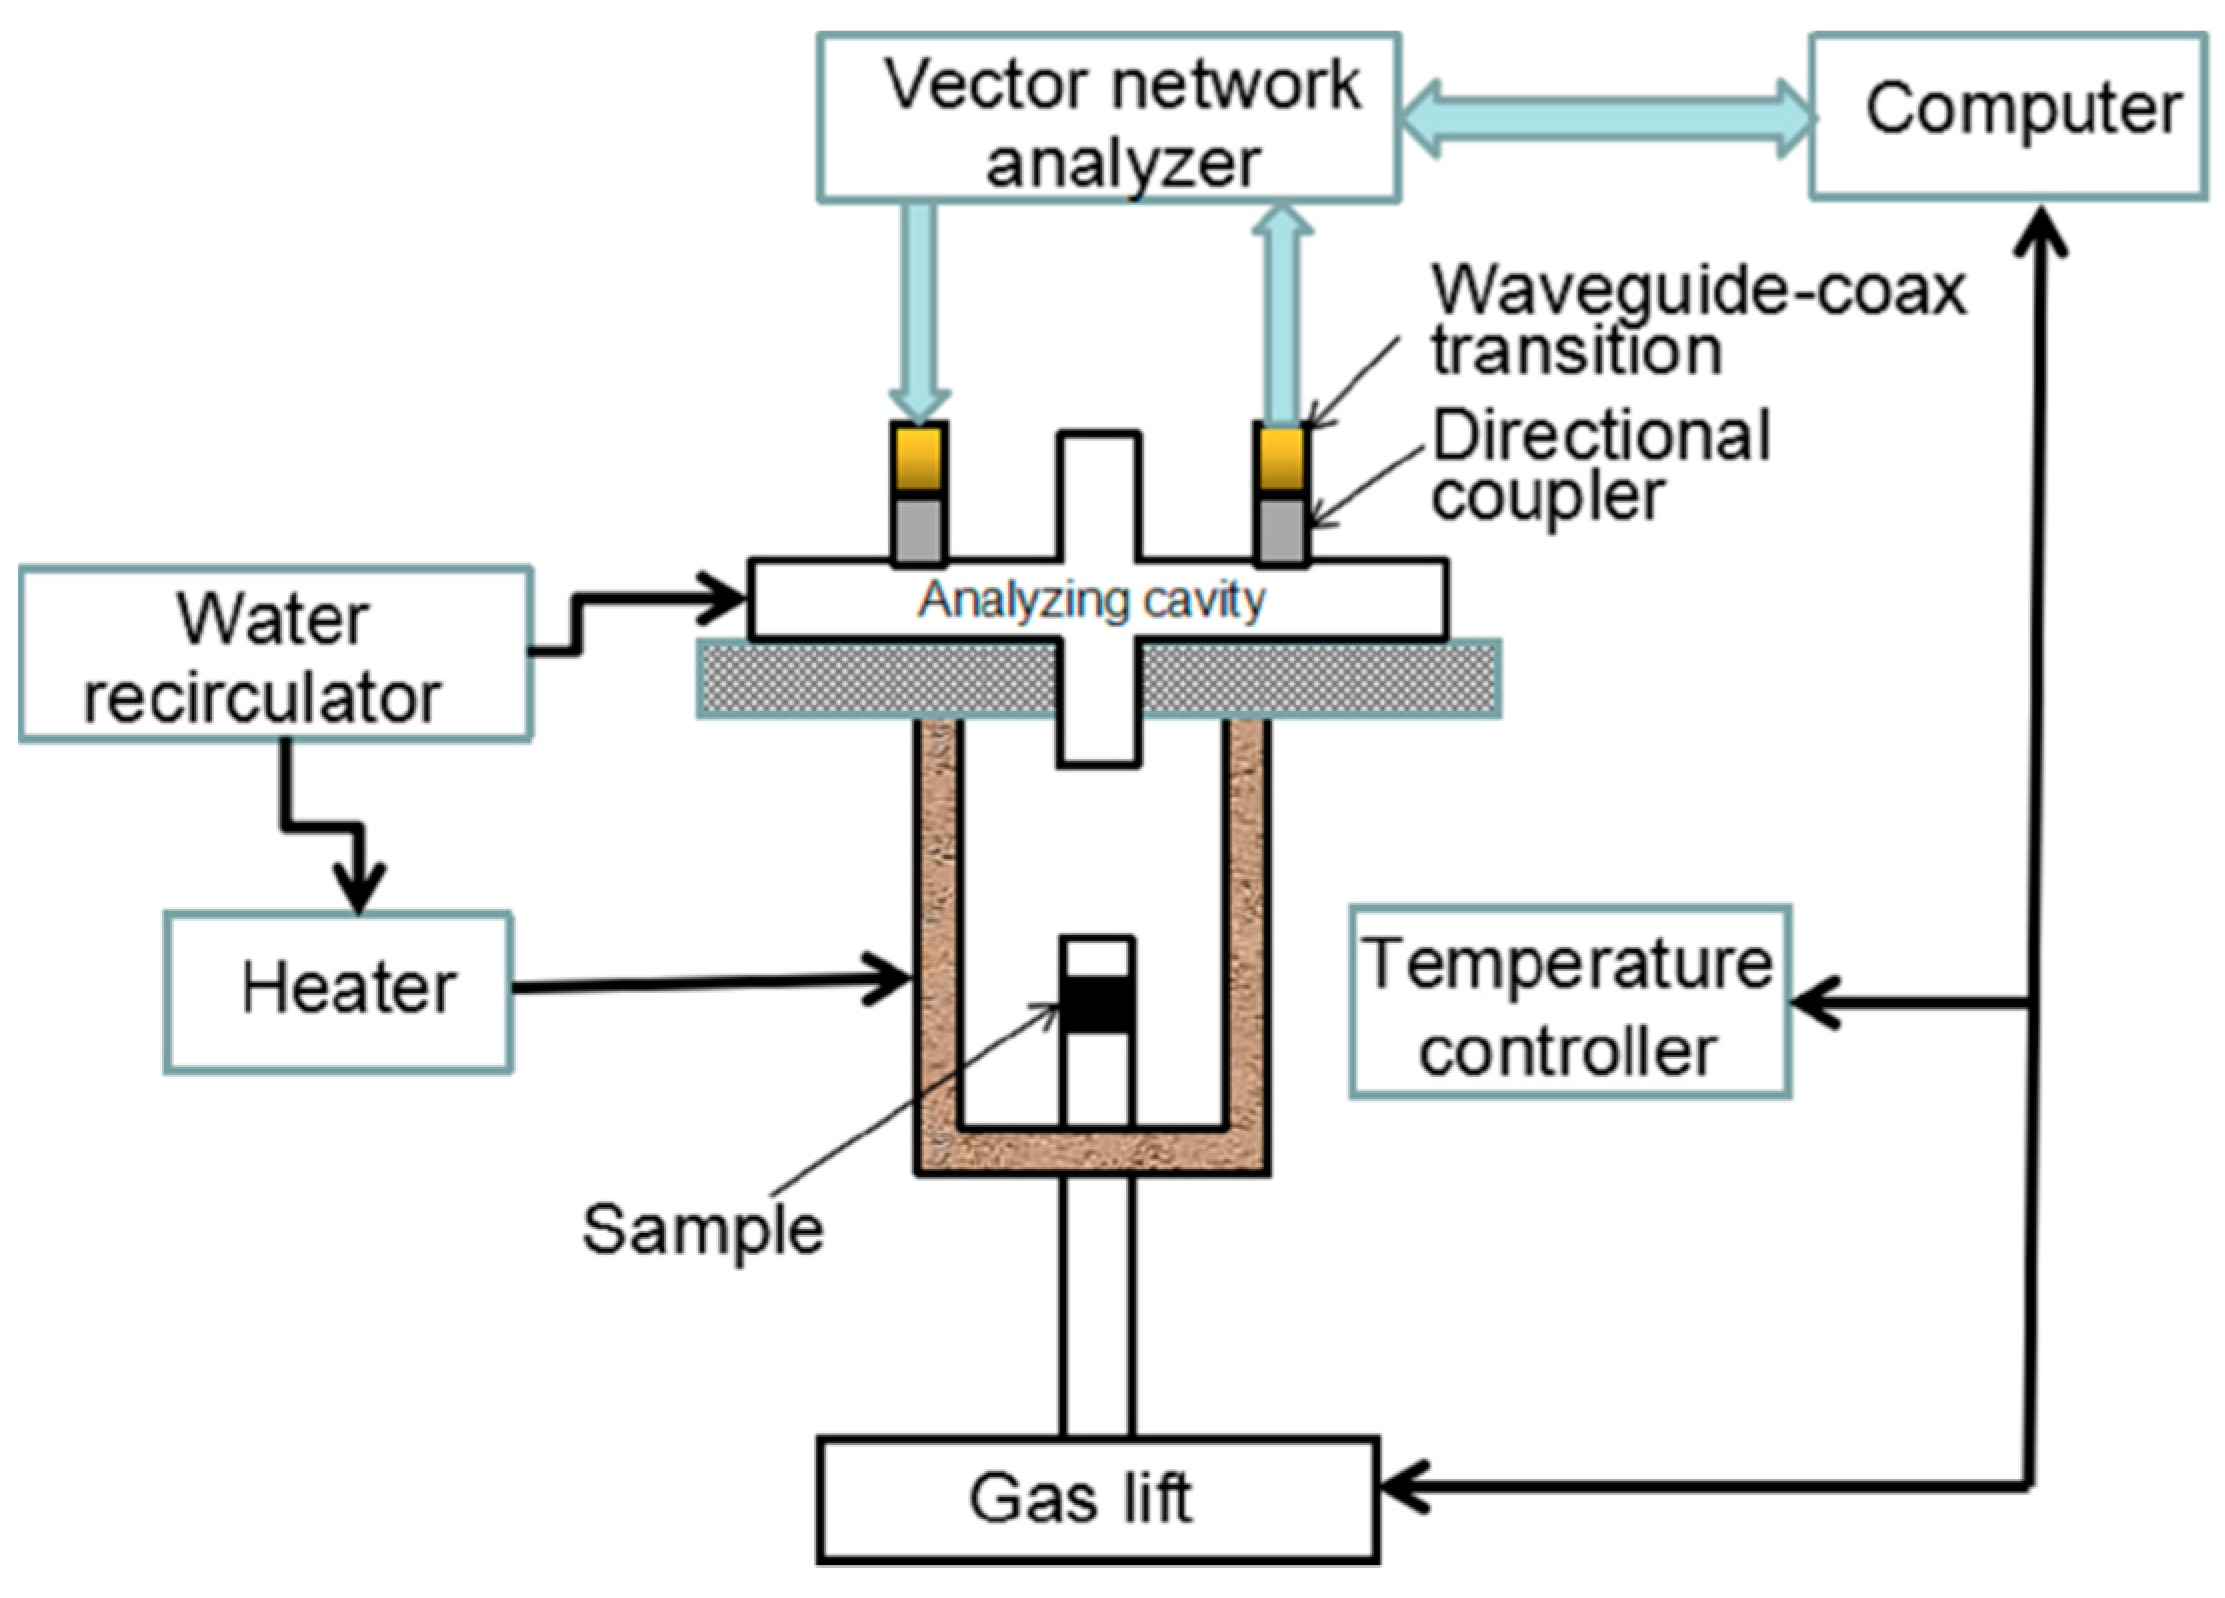
Because of its accurate data measurement and simplicity of operation, the cavity perturbation method is widely used to measure the high-temperature dielectric properties of solid materials [16]. This method was used in this study to determine the dielectric properties of the residue at different apparent densities and temperatures. The equipment used in this experiment was developed by the Key Laboratory of Unconventional Metallurgy, Ministry of Education in Kunming University of Science and Technology. It has been widely used to assess the dielectric properties of materials [17,18]. A schematic diagram of the system is shown in Figure 3.
The device consists of a vector network analyzer (E5071C Agilent), a waveguide–coax transition, a directional coupler, an electromagnetic induction heater, a water recirculation, a gas lift, and a cylindrical cavity resonator (TM0N0) with an internal height of 190 mm and diameter of 200 mm. A computer connected via a USB cable controlled all test control units. The software was used to determine the permittivity of the residue based on the data transmitted by the equipment. By comparing permittivity data from a known medium, the dielectric constant measurement error was found to be approximately 3%, and the dielectric loss factor measurement error was determined to be approximately 10%. For example, taking the dielectric constant of deionized water as 78 F/m and the dielectric constant and loss factor of molybdenite [18] at 300 °C as 5.47 F/m and 0.478, respectively, the measured data obtained by the system were 76.77 F/m, 5.34 F/m, and 0.442. The corresponding measurement errors were 1.58%, 2.37%, and 7.53%.
A test sample was loaded into a small quartz tube with an inner diameter of 4.0 mm and a height of 52 mm during the experiment. After that, the quartz tube was placed in the permittivity measurement system’s heater. The quartz tube was quickly lifted into the cavity resonator by a gas lift after the CuCl residue was heated to the set temperature, and the dielectric parameters were quickly calculated by computer using the test cavity perturbation theory. Following the completion of a test, the quartz tube containing the residue was replaced in the electromagnetic induction heater and heated to a higher temperature to measure the dielectric constant. Each sample was measured three times, and the average value was used to determine the final value. If the error of the three measurements was greater than 10%, a fourth measurement was also conducted.
2.2.2. Microwave Reactor
The experiments used a microwave reactor with a power of 3 kW and frequency of 2.450 GHz developed by the Key Laboratory of Unconventional Metallurgy, Ministry of Education, Kunming University of Science and Technology, as shown in Figure 4.
The microwave heating system consisted of a temperature control unit, two magnetrons, a multimode cavity, a quartz tube container, and a data acquisition computer. A high-temperature thermocouple with a metal shielding layer and a temperature regulator constituted the temperature control unit. A thermocouple was inserted into the material’s center point to regulate the temperature during microwave roasting. During the experiment, it was determined that the systematic error was 3 °C by comparing the data obtained from infrared temperature measurements. After microwave heating, the temperature measured by the system was 445 °C, the surface temperature of the material measured by an infrared thermometer was 442 °C, and the temperature measured by the system after the microwave power turned off was 438 °C; therefore, the microwave heating system used in this experiment is reliable.
A total of 20 g of CuCl residue was placed as a 15 mm thin layer in a mullite boat container for the microwave heating experiment. The container was then placed in a microwave heating system and roasted for 120 min at temperatures ranging from 300 to 500 °C with an oxygen flow rate of 150 mL/min. Lye was used in a gas absorption bottle to treat the chlorine-containing exhaust gas produced by the reaction system.
2.3. Data Analysis
2.3.1. Roasting Kinetics
High-temperature metallurgical processes involving heterogeneous gas–solid reactions are common. The experimental data were analyzed using commonly used kinetic models to determine the main kinetic parameters and reaction control steps of the oxidation dechlorination of CuCl.
The kinetics of interface-controlled reactions was described using the Spencer and Topley equation [19]:
If the dechlorination reaction was controlled by internal diffusion, then Ginstling-Broushtein, Jander, and Zhuralev equations were applied to describe the gaseous diffusion through the product layer [20]:
where kd is the reaction rate equilibrium constant, t is the roasting time (min), and x is the degree of dechlorination, which is calculated using the following equation:
where W0 and Wt denote the Cl content in the raw material and sample roasted for t minutes, respectively.
The Arrhenius equation is as follows:
where A is a frequency factor (min−1); Ea is the activation energy of the reaction (J.mol−1); R is the ideal gas constant (8.314 J mol−1 K−1); and T is the temperature (K).
2.3.2. Complex Permittivity
Complex permittivity (ε*) is usually composed of a real part (ε’, dielectric constant) and an imaginary part (ε’’, dielectric loss factor) and is one of the fundamental parameters affecting the wave absorption properties of materials in a microwave field. The dielectric constant expresses a material’s ability to store electromagnetic energy within its structure. The dielectric loss factor represents a material’s ability to convert stored electromagnetic energy into thermal energy. The loss tangent (tanδ = ε”/ε’) describes the ability of a material to store electromagnetic energy and dissipate it as heat at a given microwave frequency and temperature. The permittivity measurements experiments were carried out from room temperature to a specific temperature using a microwave frequency of 2.45 GHz. The apparent density of the material was adjusted based on the weight of the sample and the volume of the quartz tube (small quartz tube with an internal diameter of 4.0 mm and a height of 52 mm).
3. Results and Discussion
3.1. Measurement of Permittivity
The effect of the temperature and apparent densities on the dielectric properties of CuCl residue at a frequency of 2.45 GHz is shown in Figure 5 and Figure 6.
As shown in Figure 5a,b, when the temperature increased from 20 to 550 °C at an apparent density of 1.70 g/cm3, ε’ increased remarkably from 2.471 to 2.916, and ε’’ also rapidly increased from 0.0270 to 0.1180. This could be because the energy of molecules increases with temperature increases, so the response to the external electric field is faster, and the dielectric constant of CuCl residue concentrate increases immediately [13]. The trend of the dielectric constant of CuCl residue with temperature was observed in other ores and minerals [17,18]. ε’’ increased significantly above 400 °C because the number of active ions and electrons in the CuCl residue sharply increased since the melting point of CuCl is about 427 °C [21]. There are many ions and electrons at the interfaces of various compounds, and the majority of these ions and electrons will relax in the presence of a microwave field. The loss factor of a material is directly proportional to its conductivity, making the loss factor increase with increasing temperature [13]. In addition, the dielectric properties of the CuCl residue with an apparent density of 1.9 g/cm3 were mostly greater than 1.7 g/cm3 at the same temperature. This is because the higher the apparent density, the better the ability to reduce the internal clearance of the residue, increase the number of raw materials, multiply the number of polar molecules per unit volume space, and reduce the air content in the material. Additionally, because air is a low-loss medium, it reduces the material’s overall dielectric properties. Similarly, the higher the water content of a material, the higher the measured dielectric constant and dielectric loss factor. Overall, the microwave absorption characteristics of the CuCl residue improved as temperature increased.
The loss tangent of the CuCl residue at different temperatures is shown in Figure 6, which shows the same trend as the loss factor in Figure 5b. The values of loss tangent changed slightly between 20–400 °C. When the temperature exceeded 400 °C, the loss tangent increased rapidly from 0.0131 to 0.0440 at an apparent density of 1.70 g/cm3. By comparing Figure 5, it was discovered that as the temperature exceeded 400 °C, the apparent density’s influence on the loss tangent gradually decreased, and the temperature became a significant factor affecting the material’s microwave absorption. Because a high apparent density can interfere with oxygen adsorption and chlorine diffusion during the oxidative dechlorination process, the apparent density naturally stored at 1.70 g/cm3 was chosen for the dechlorination process.
3.2. Microwave Heating Curves
Dry and ground CuCl slag was placed in microwave fields with powers of 1200 W, 1400 W, and 1600 W, and its heating curve is shown in Figure 7. When the rest of the conditions were constant, the heating rate of the material increased significantly upon increasing the microwave power, and increasing the microwave power eventually increases the electric field intensity. As a result of increasing the electric field intensity, the microwave power dissipated by CuCl residue increased, and the material’s temperature also increased. As a result, during microwave oxidation roasting dechlorination, the microwave power can be adjusted to speed up the heating process. At a microwave power of 1200 W, the temperature of the material reached more than 500 °C after 15 min, which met the thermodynamic conditions of oxidation roasting and dechlorination of CuCl residue.
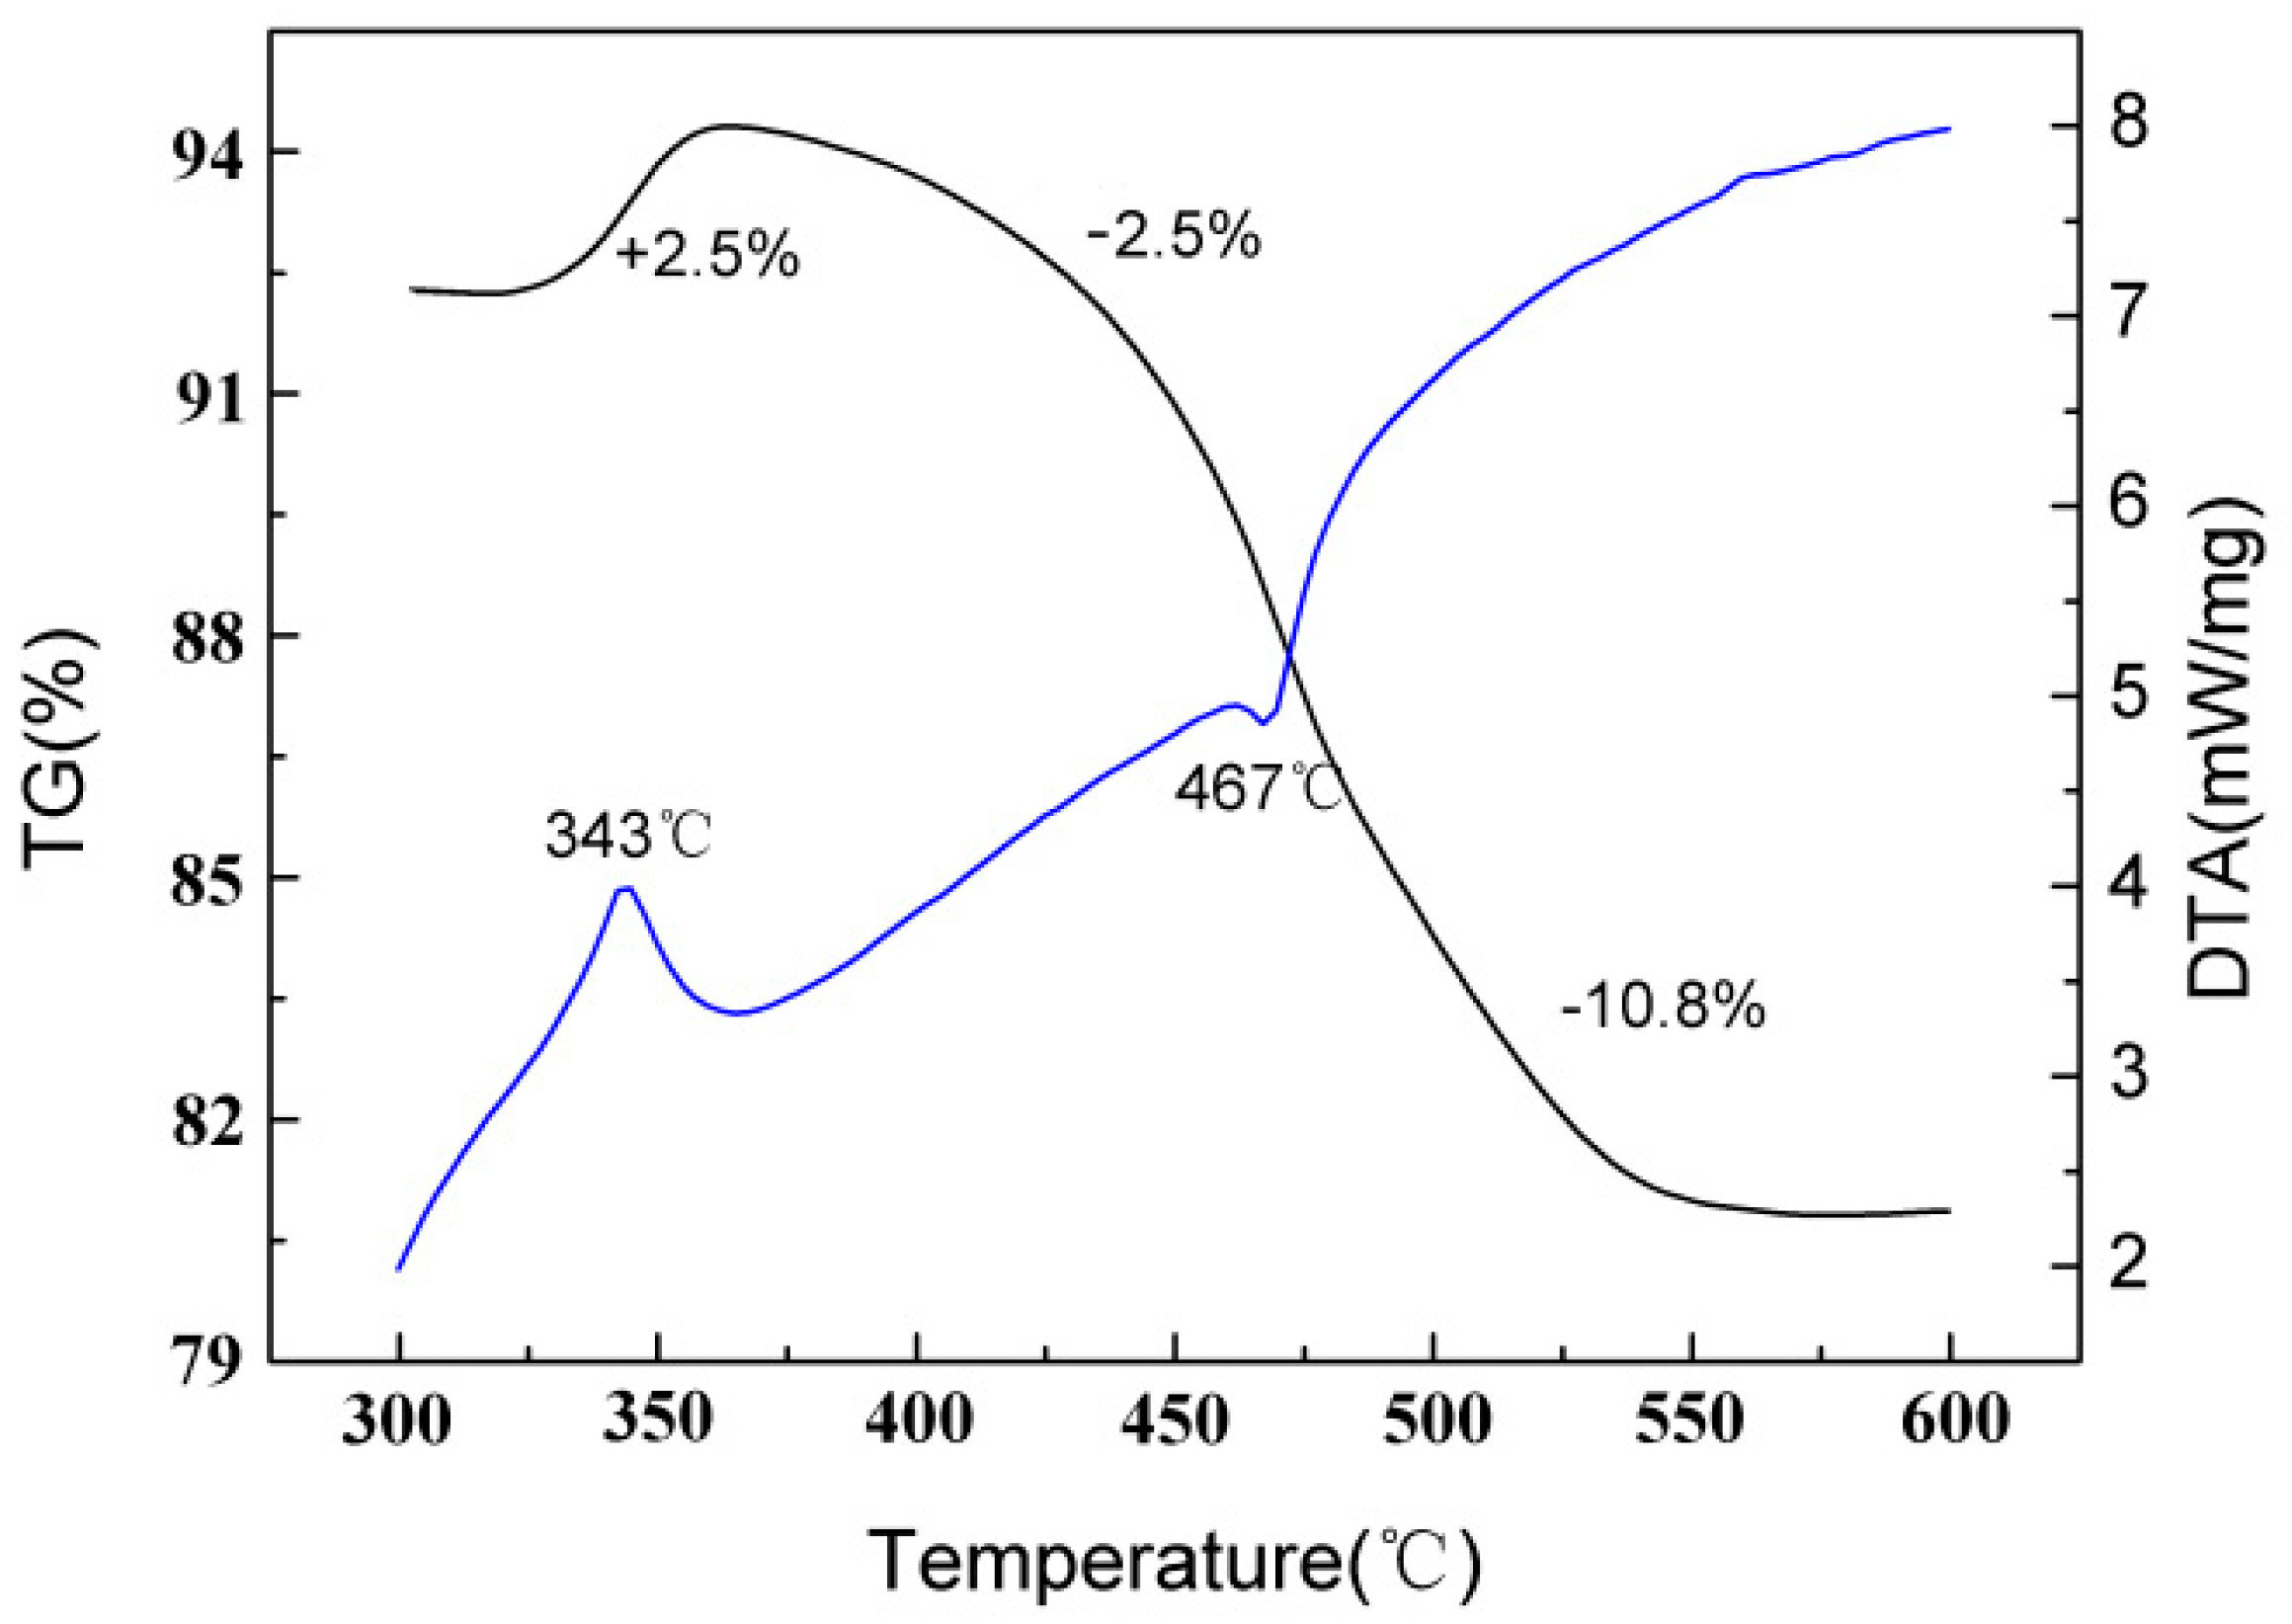
3.3. TG-DTA Analysis
Figure 8 shows the TG -DTA (SAT 449F5 NETZSCH, Selb, Germany) curves under an air atmosphere at a 10 °C/min heating rate from 300 to 600 °C. The weight of CuCl residue concentrate increases by approximately 2.5% from 310 to 361 °C in the TG curve but then decreases by approximately 10.8% when the temperature exceeds 540 °C. The DTA curve shows two peaks during the temperature change. The first peak at 343 °C represents an exothermic reaction, indicating the oxidation of CuCl into Cu2OCl2, as previously reported by Näther [22] and Nixon [23]. The second peak at 467 °C represents an exothermic reaction. As Sharkey [24] reported, the main changes at this stage can be described as the reaction of Cu2OCl2 (s) with O2 (g) to form CuO (s) and Cl2 (g). The experimental weight loss was highly consistent with the literature weight loss shown in Table 2.
3.4. Microwave Roasting
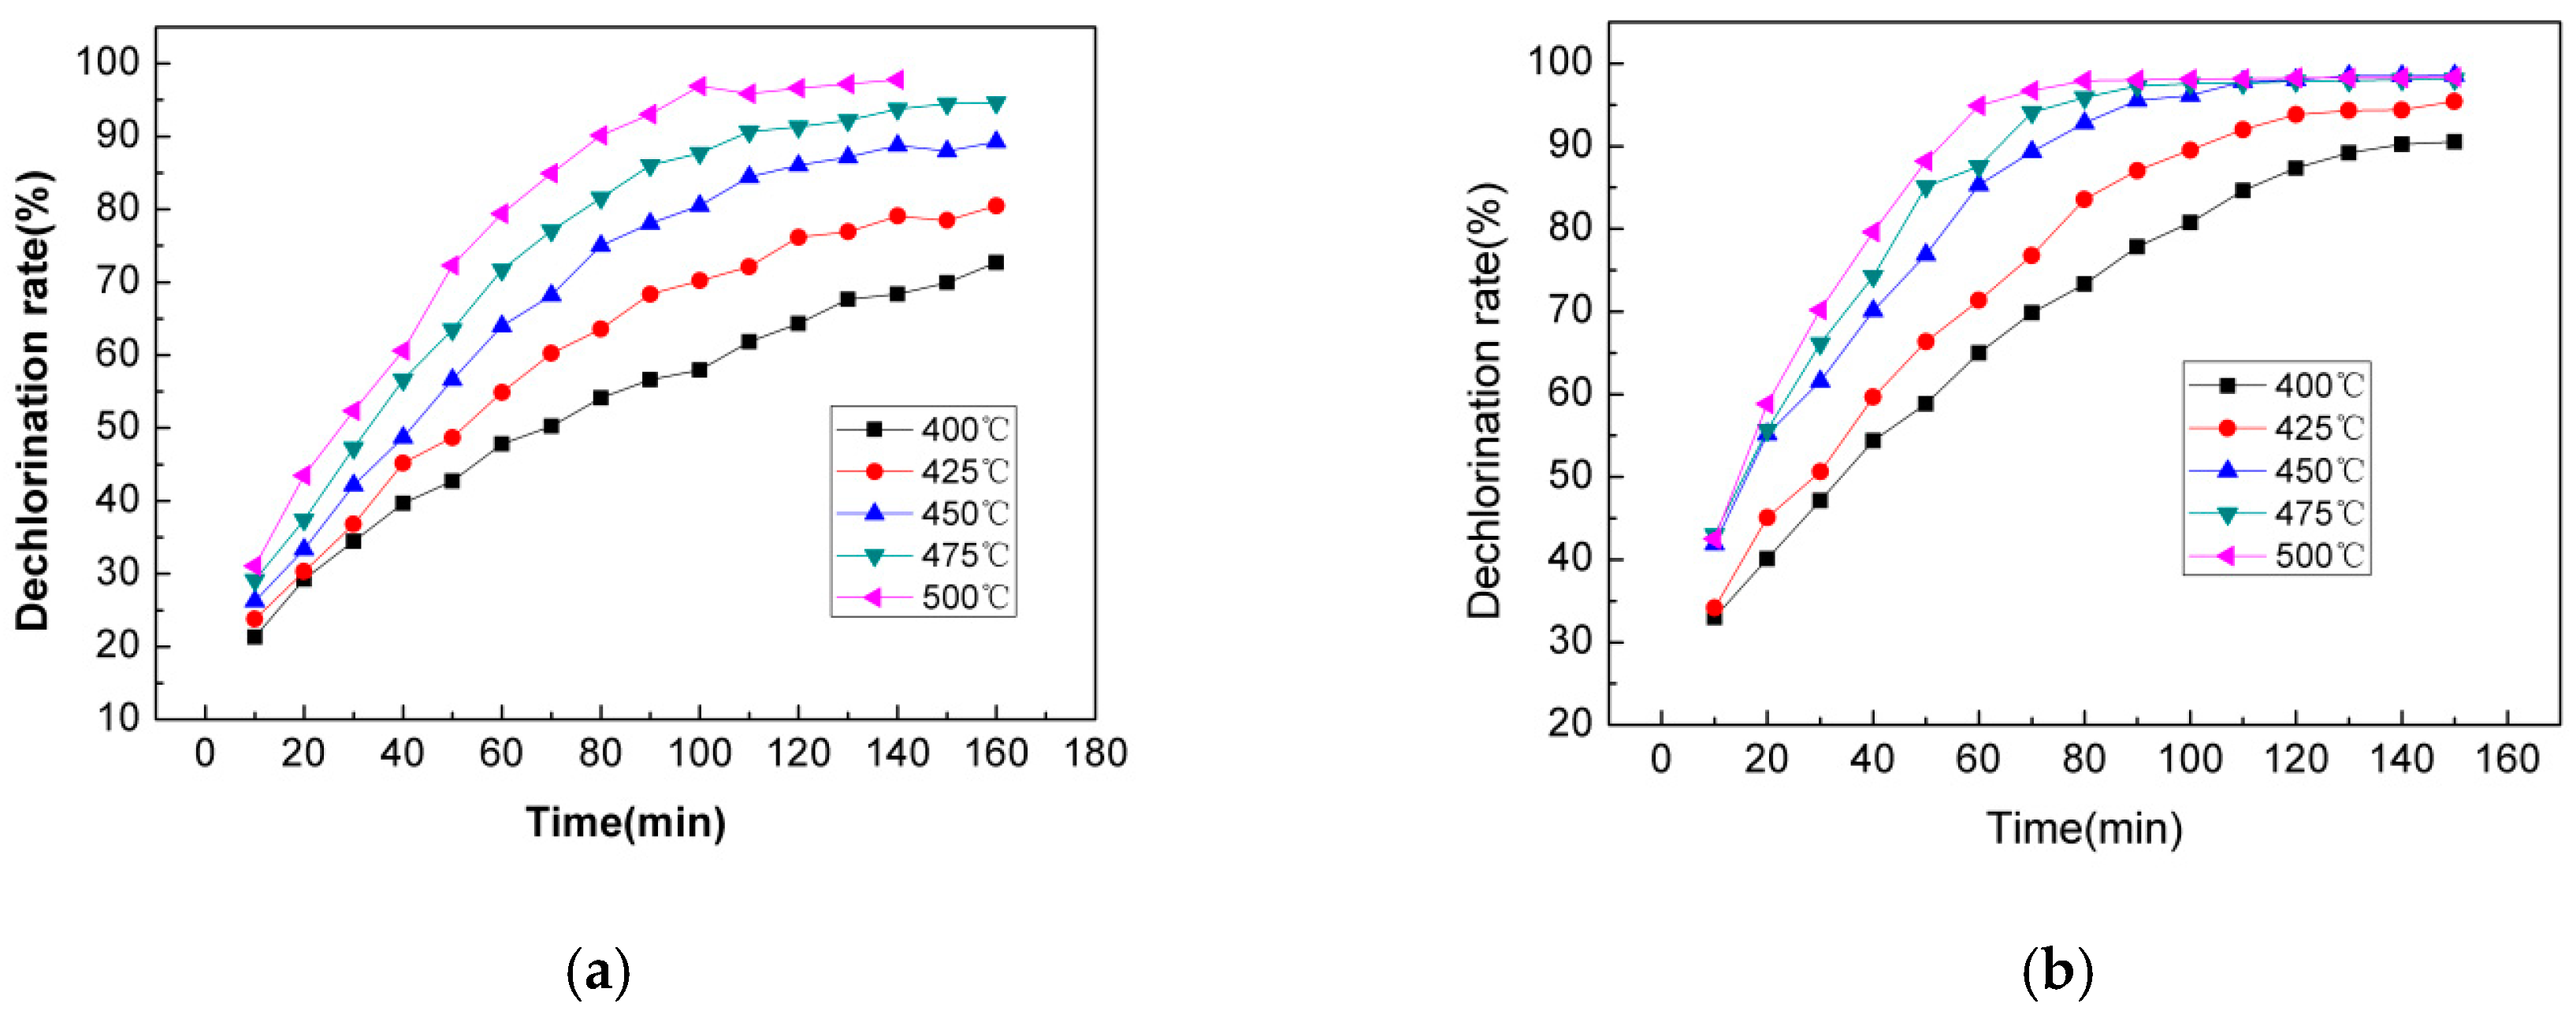
The effect of roasting temperature and holding time on the chlorine removal rate of CuCl residue was investigated under the conditions of an oxygen flow of 150 mL/min, microwave power of 1200 W, and particle size of 120 μm. The experimental results are shown in Figure 9.
Figure 9 reveals that the degree of dechlorination of CuCl residue increased with the temperature for both microwave roasting and conventional roasting processes; however, the microwave heating method achieved the same effect as conventional heating in a shorter time, as shown in Figure 10a,b. For instance, when the temperature reached 500 °C, the degree of dechlorination exceeded 94% within 60 min of the microwave roasting processes. Under the same conditions, the degree of dechlorination after roasting in conventional heating was only ~80% and required an extra 30 min to obtain the same result. Furthermore, when the roasting temperature exceeded 450 °C, the effect of temperature on the chlorine removal rate was significantly weaker under microwave roasting than it was under conventional heating. The main reason is that microwave heating has both bulk and selective heating characteristics, and the CuCl residue is a strong microwave absorber, causing it to be heated faster than other components in the residue [9]. The optimal experimental conditions were determined by the process characteristics, which were 450 °C and 90 min of holding time.
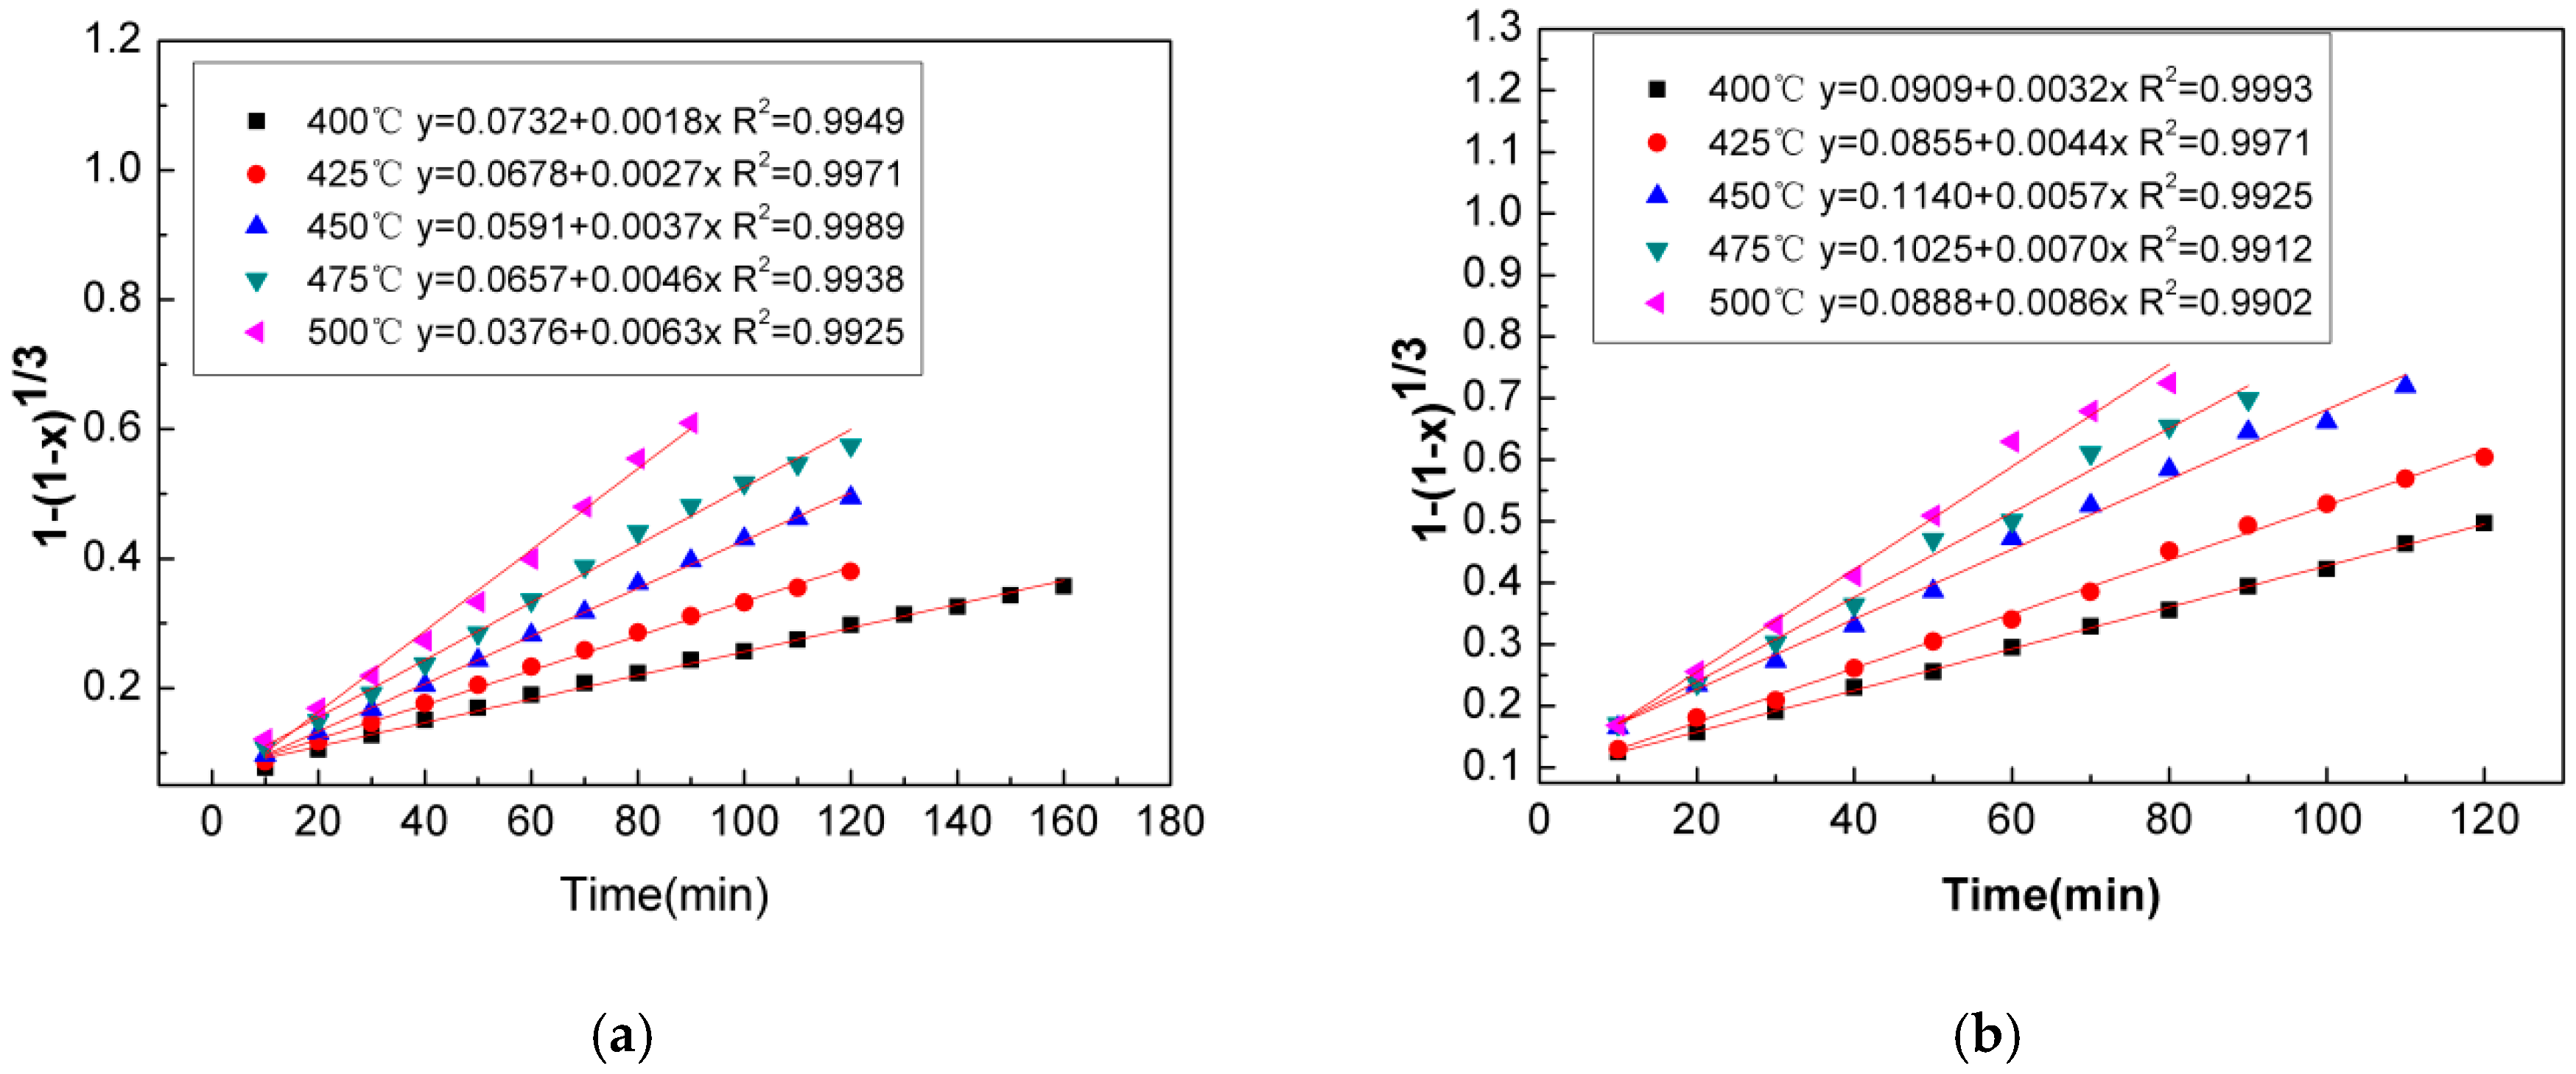
To study the control steps of the dechlorination process, all collected data from microwave heating and conventional heating processes were fitted with Equations (1) and (2). The fitting results of microwave heating and conventional heating by various dynamics models are shown in Figure 10. The rate constant k for each of the temperatures is also listed in Table 3.
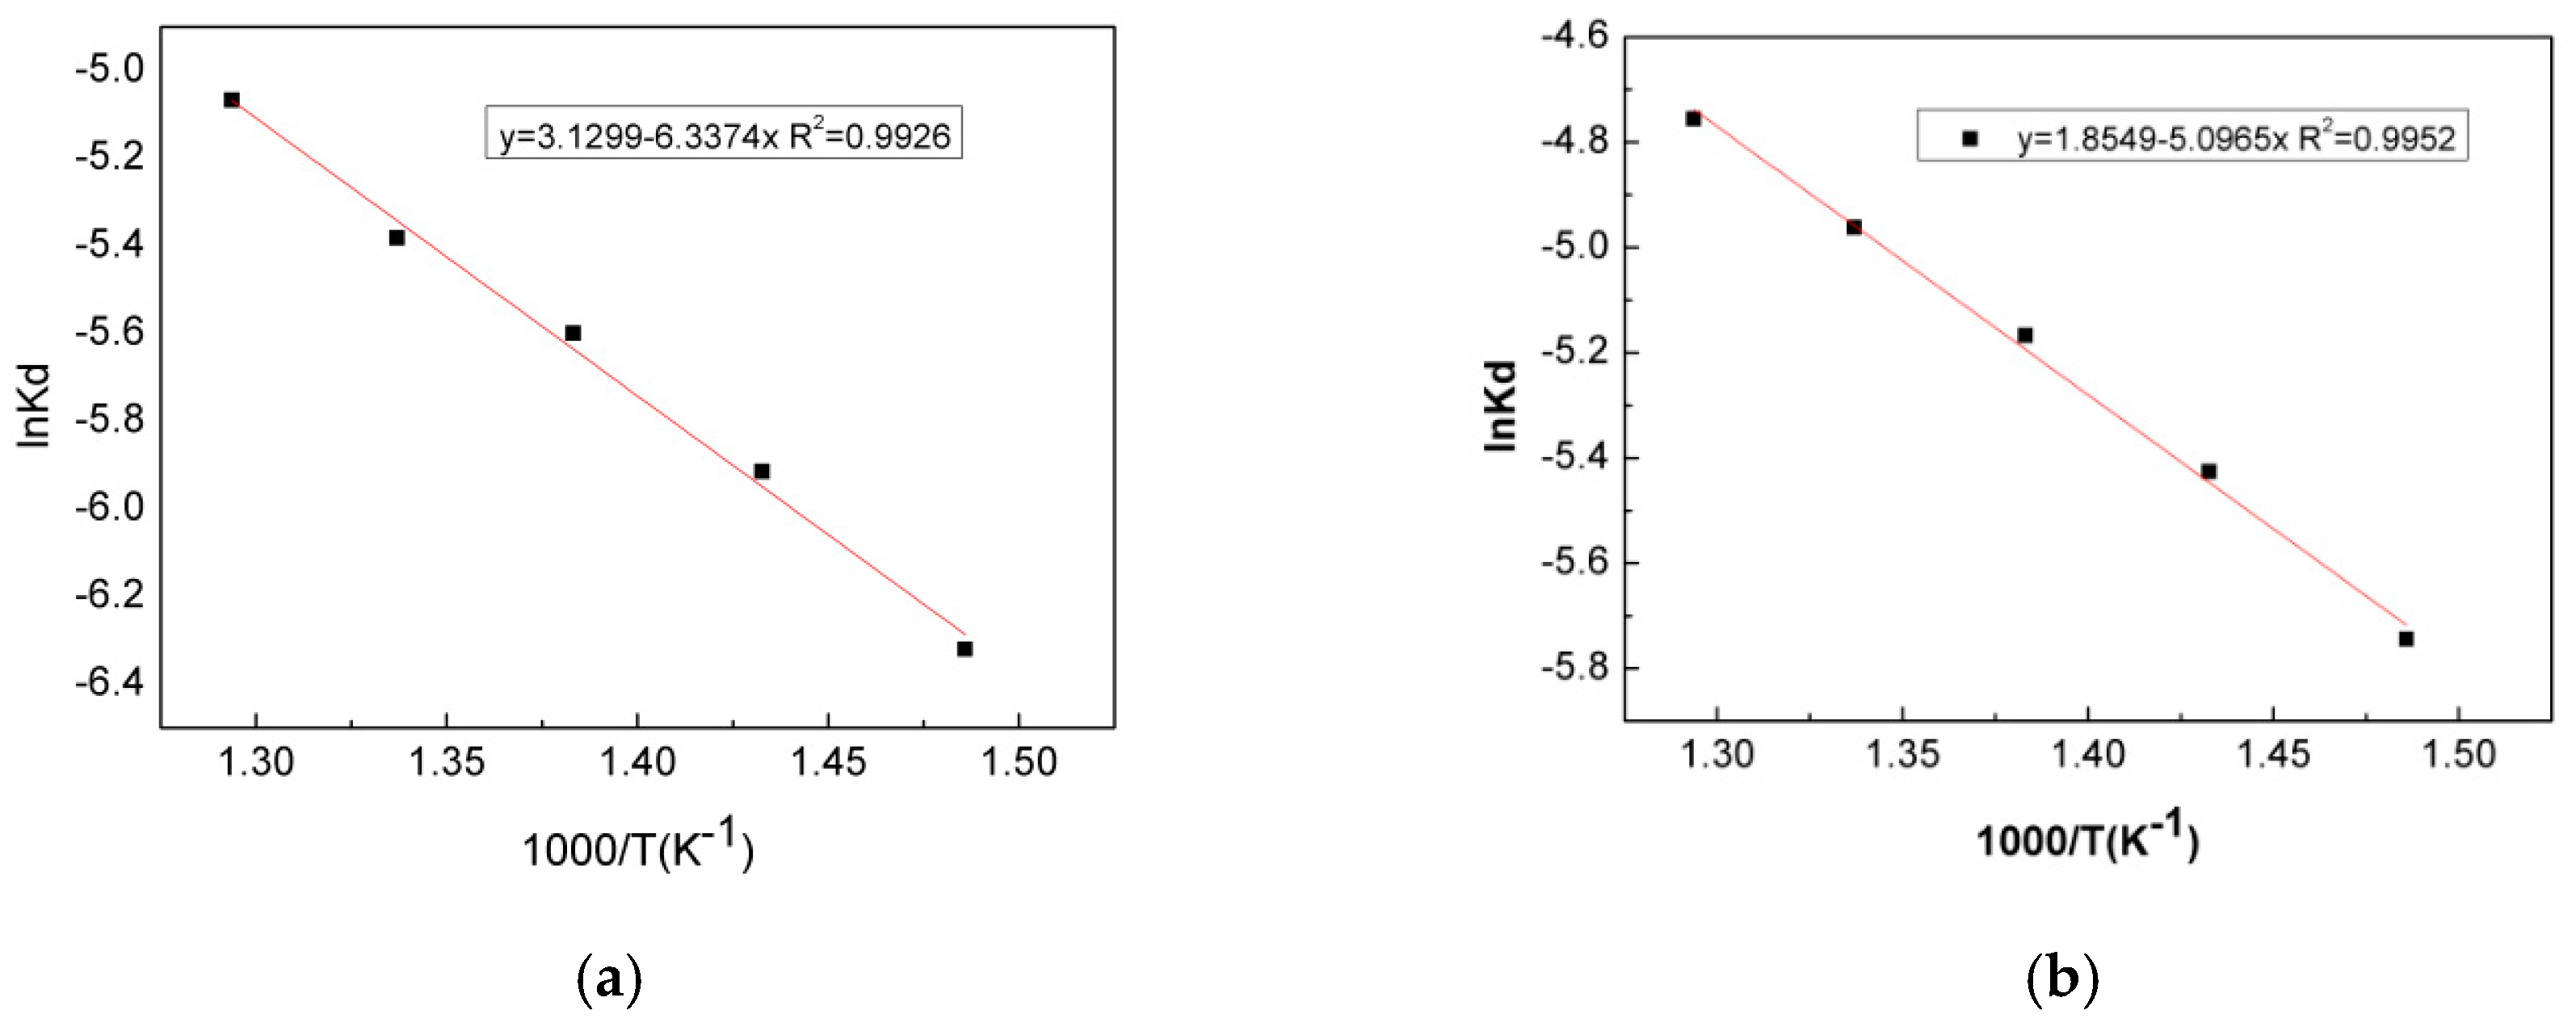
The results in Figure 10a,b demonstrate that the R2 values of >0.99 for the linear fit of both microwave heating and conventional heating process are higher than other models in Table 3. Thus, the chemical reaction on the surface control model is an appropriate model, which was utilized to estimate the activation energy and pre-exponential factor for the reactions. The results are shown in Figure 11 and Table 4.
The apparent activation energy of the dechlorination of the CuCl residue was calculated to be 42.36 kJ/mol and 52.39 kJ/mol for microwave roasting and conventional roasting, respectively. The apparent activation energy for the dechlorination reaction by microwave roasting was 19.61% lower, indicating that microwave roasting improved the reactions between O2 and CuCl to form Cl2.
3.5. XRD Analyses
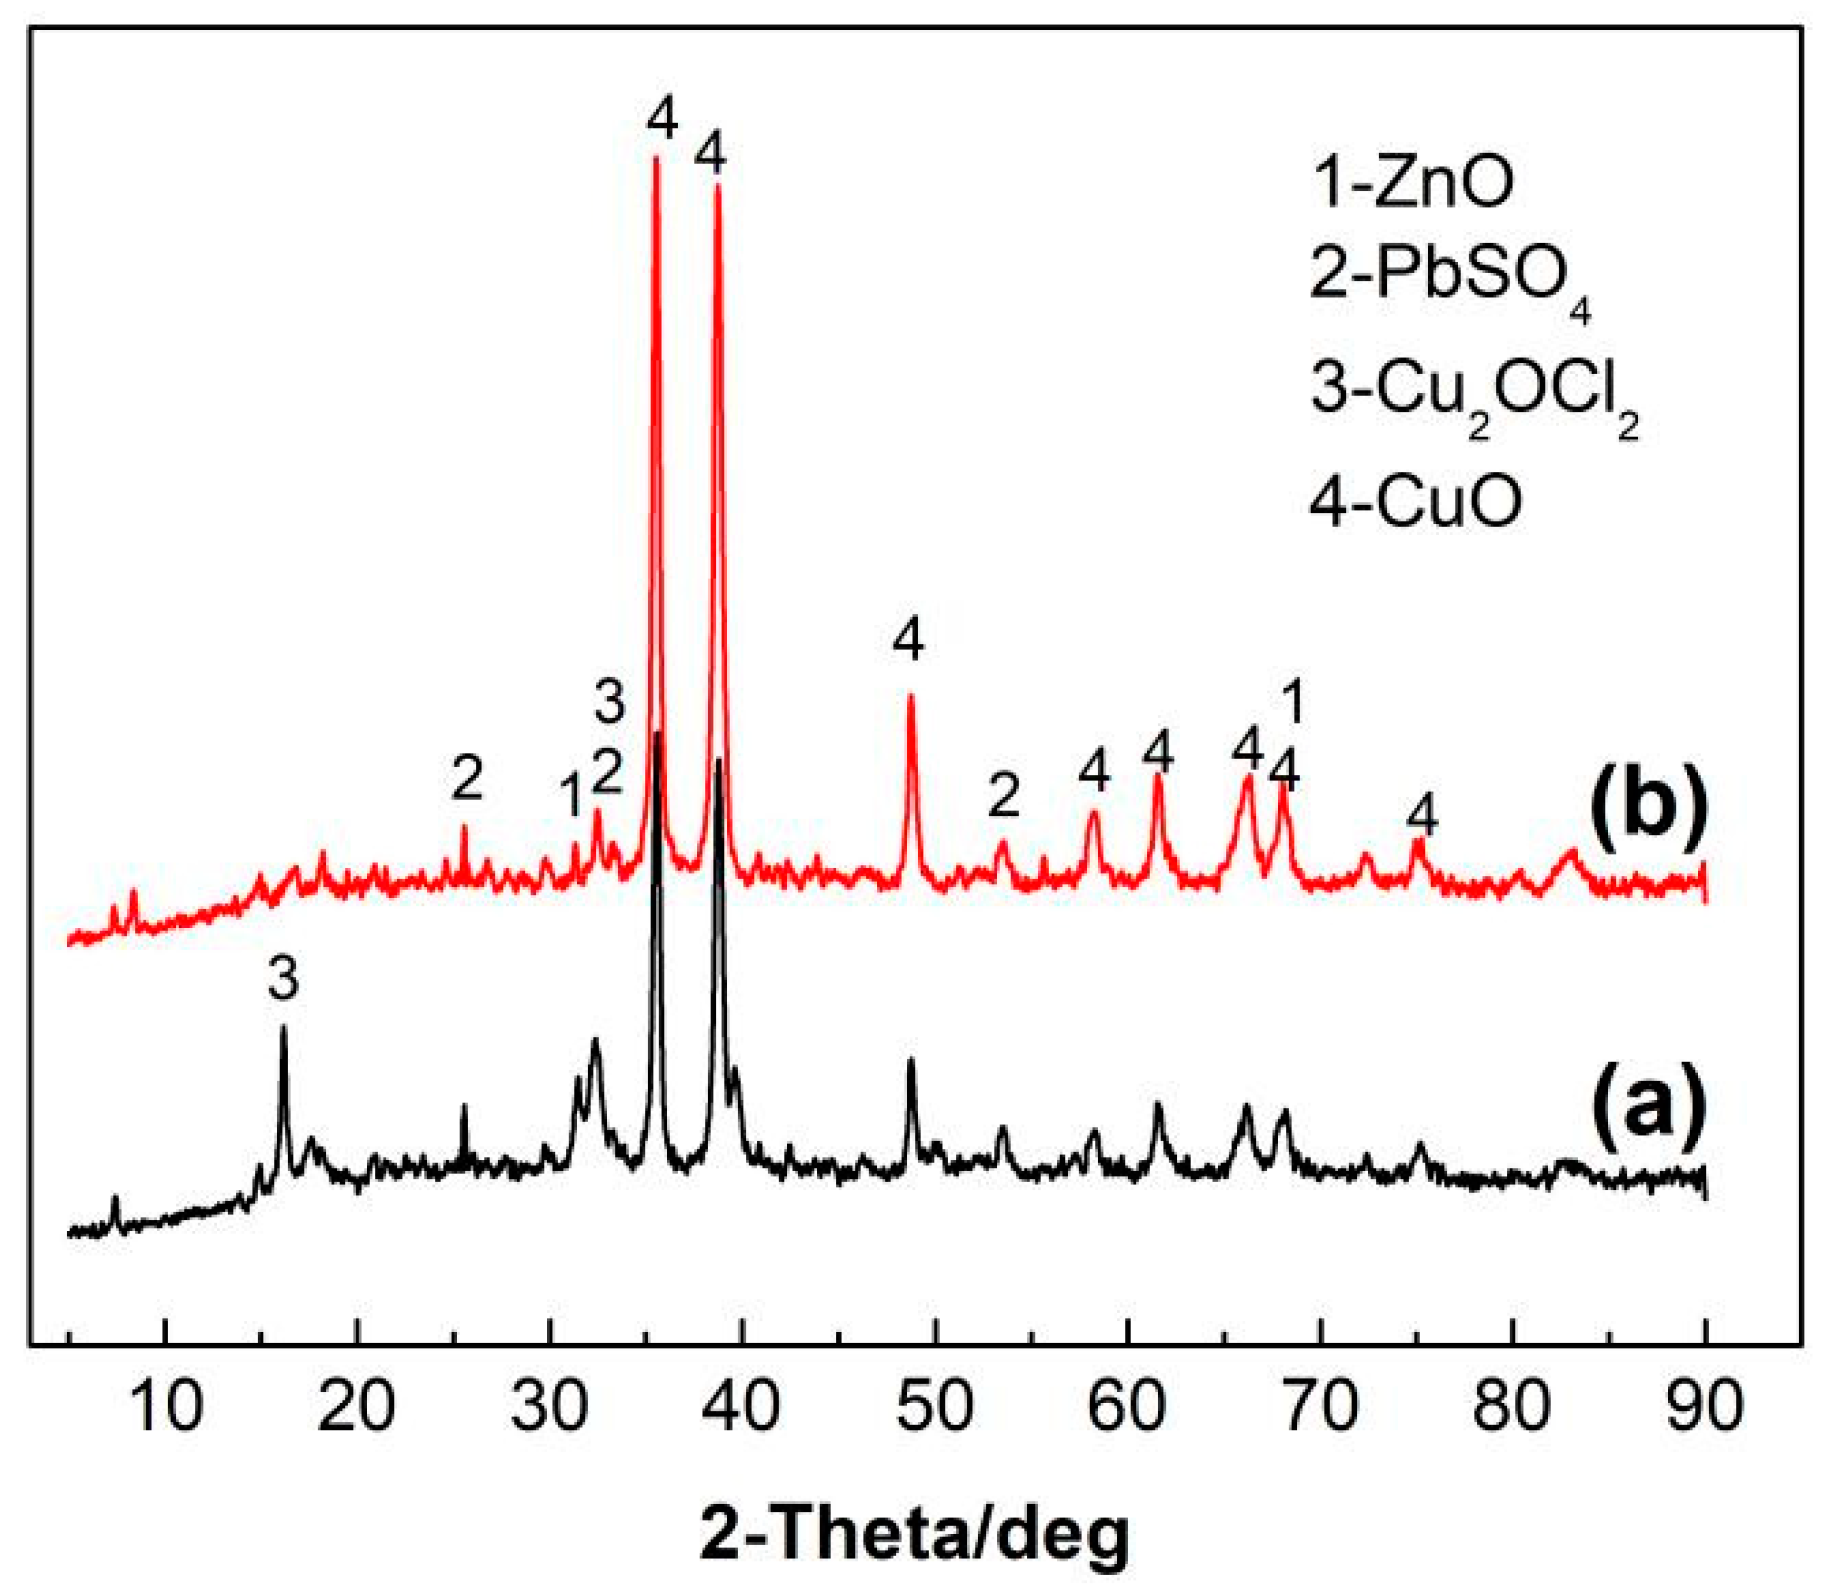
As shown in Figure 12, the main phase of the material changed significantly after conventional and microwave oxidative roasting. When the products of microwave roasting are compared to those of conventional roasting, it is clear that microwave roasting has a better dechlorination effect than conventional roasting. The new chlorine-containing phase (Cu2OCl2) formed during conventional roasting was not completely removed, negatively impacting the dechlorination effect. Thus, under the same conditions, microwave roasting yielded better results. In addition, ZnS in the raw material was converted to ZnO after oxidizing roasting.
3.6. SEM-EDS
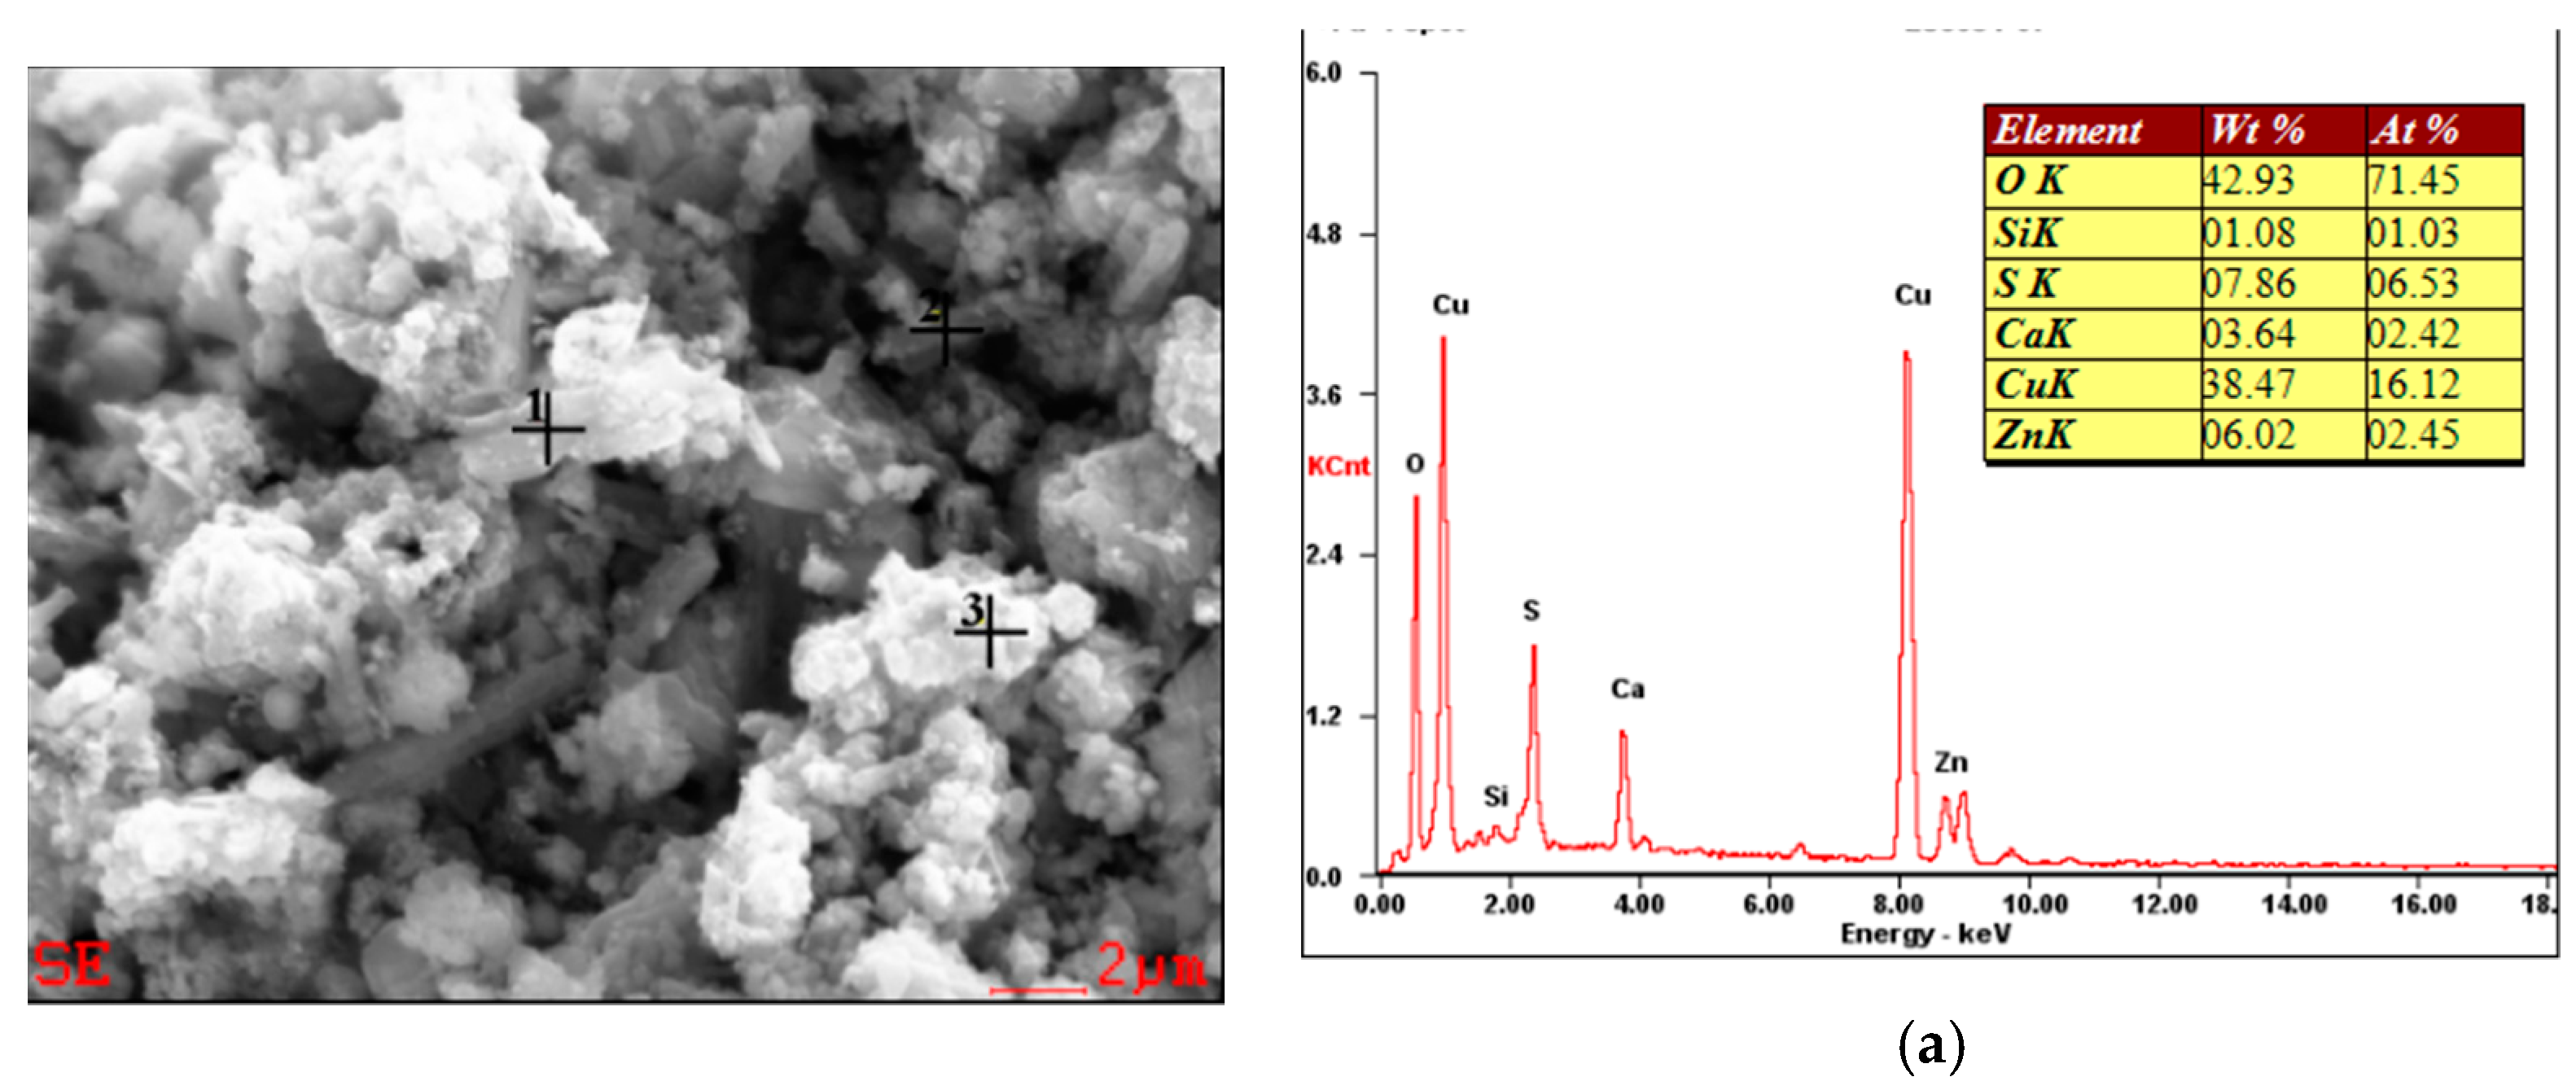
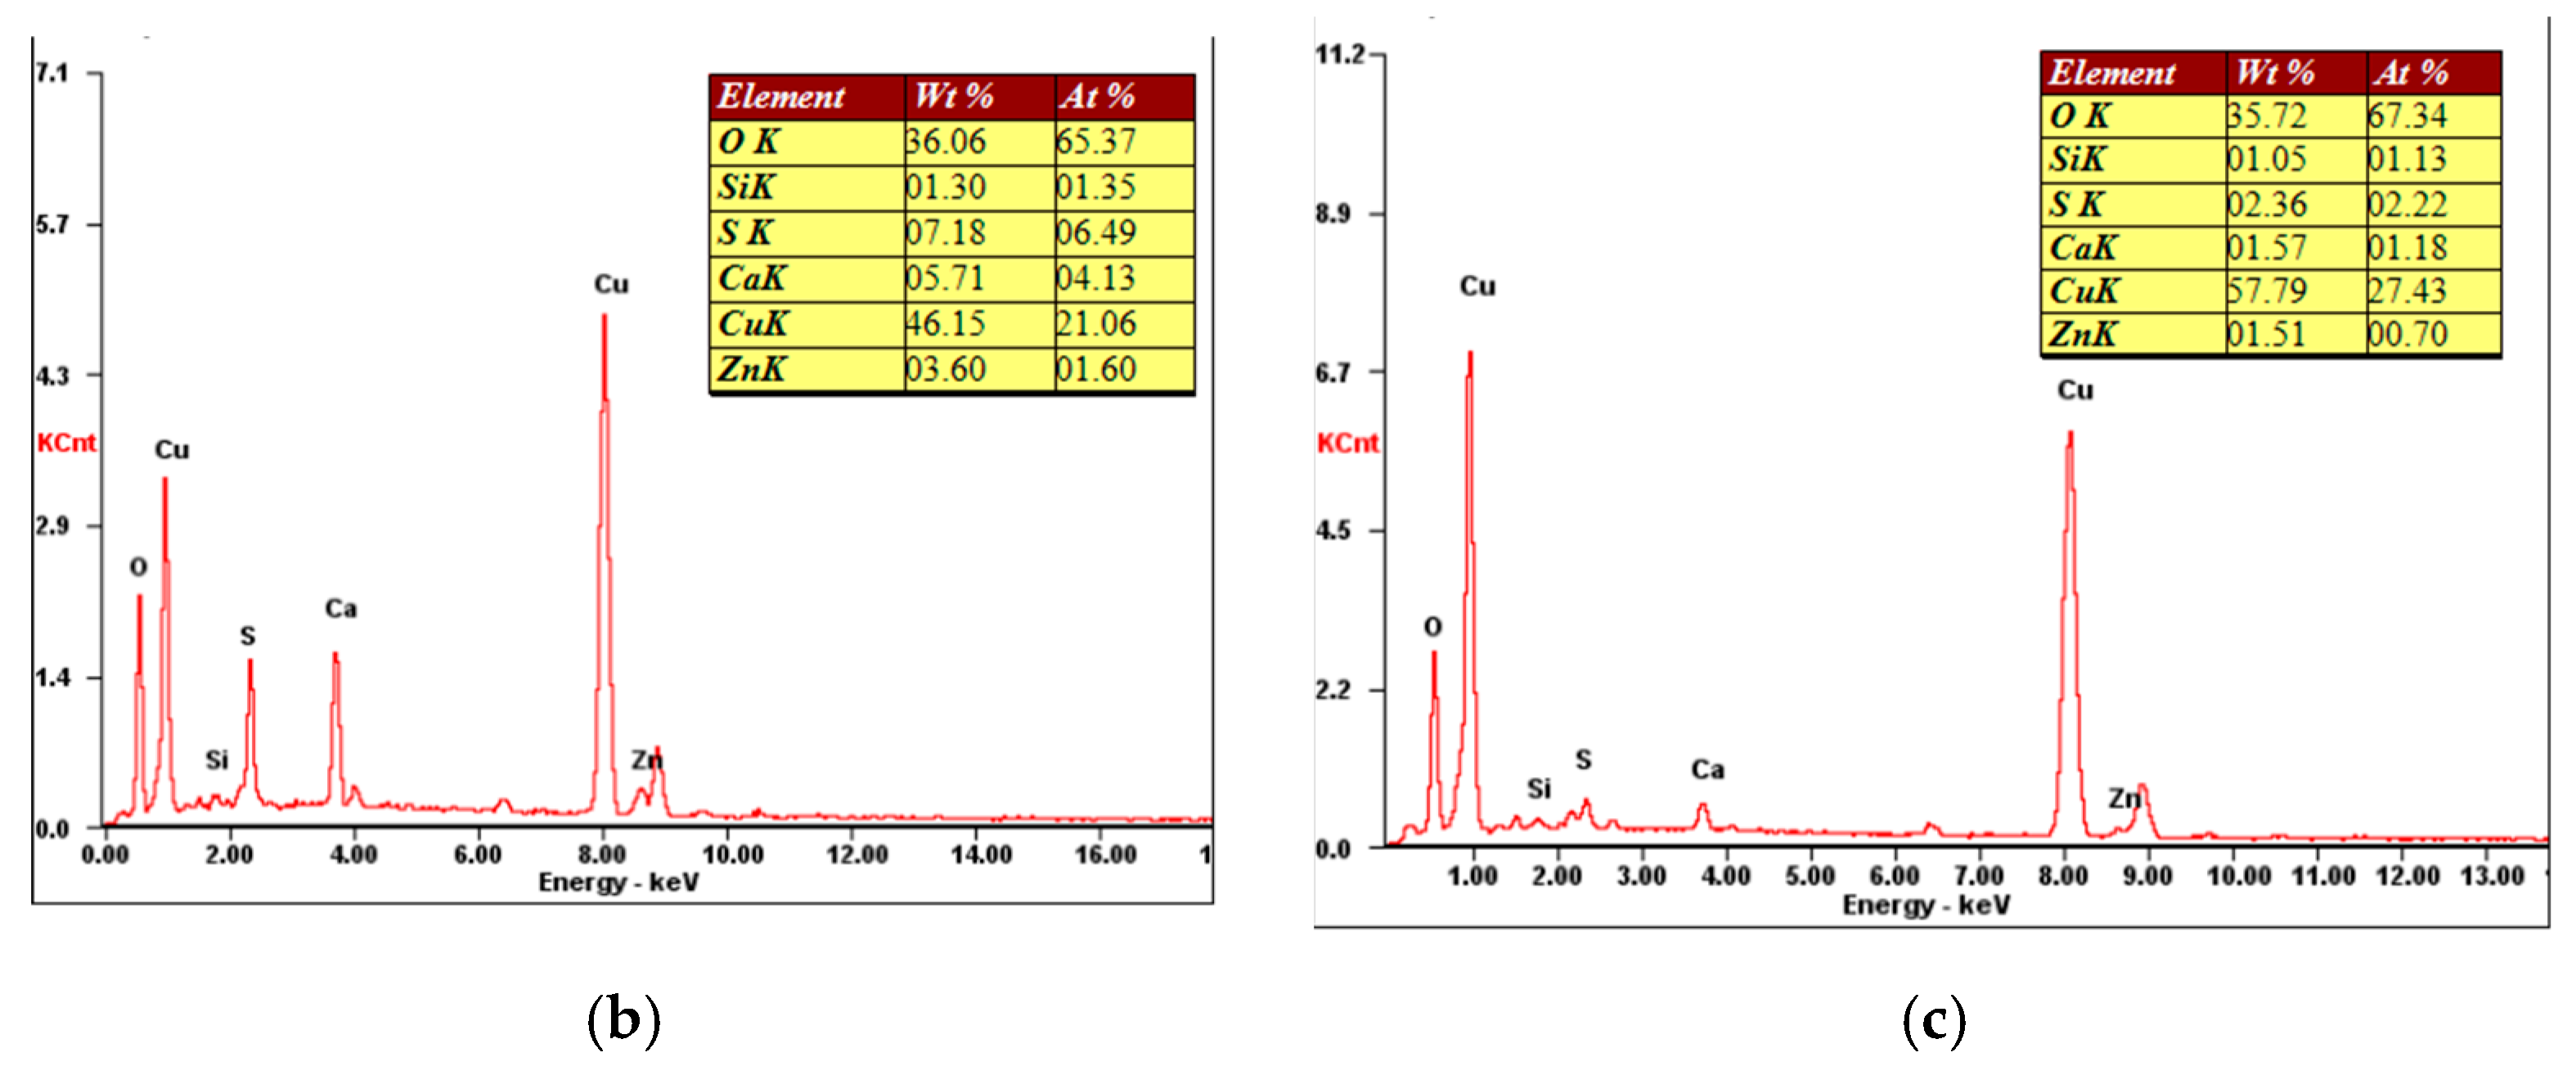
As shown in Figure 13, all products after microwave roasting were composed of bright, white particles, accompanied by a small number of regular rectangular crystals. When compared to the SEM image of the raw materials (Figure 2), more burrs and convex parts formed on the particle surface, mainly due to the evaporation of chlorine when the chloride in the material was oxidized. Based on the EDS analysis, the regular rectangular crystal (Spot 1 and Spot 2) was mainly composed of Cu and O. The bright particles with burrs and protrusions (Spot 3) were also mainly composed of Cu and O, and a small amount of S and Ca, which were determined by XRD analysis to be mainly CuO.
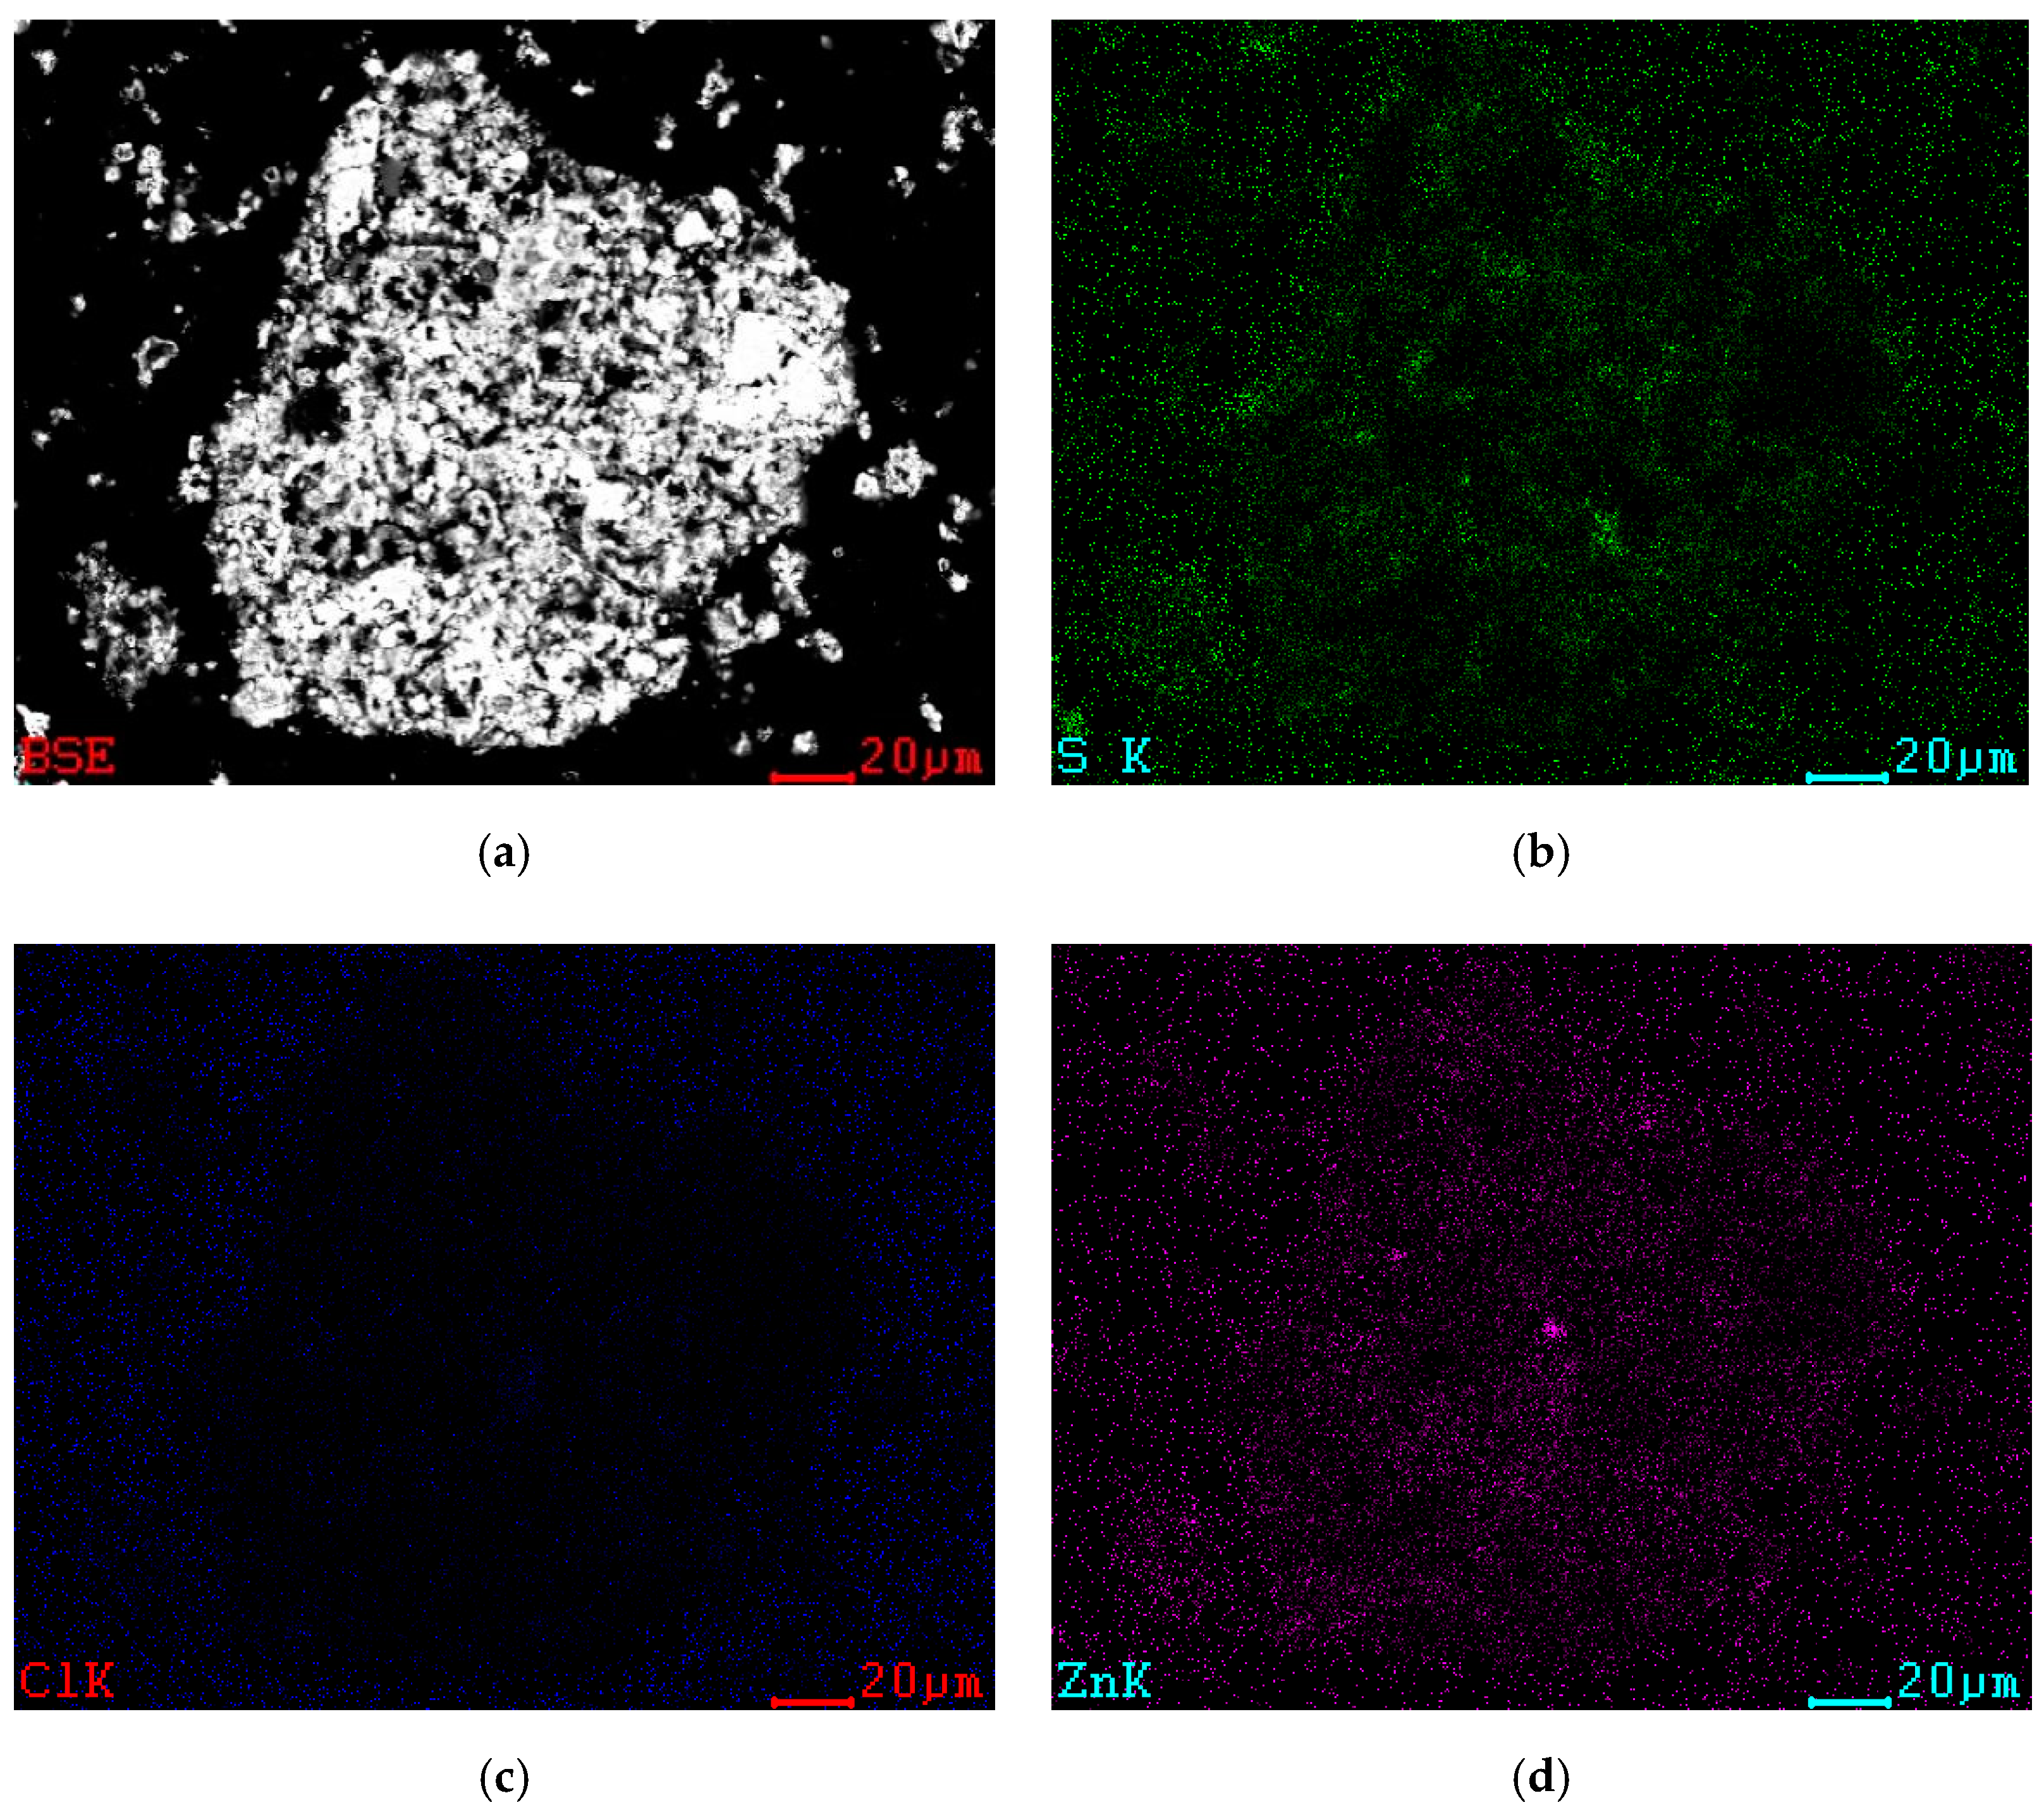
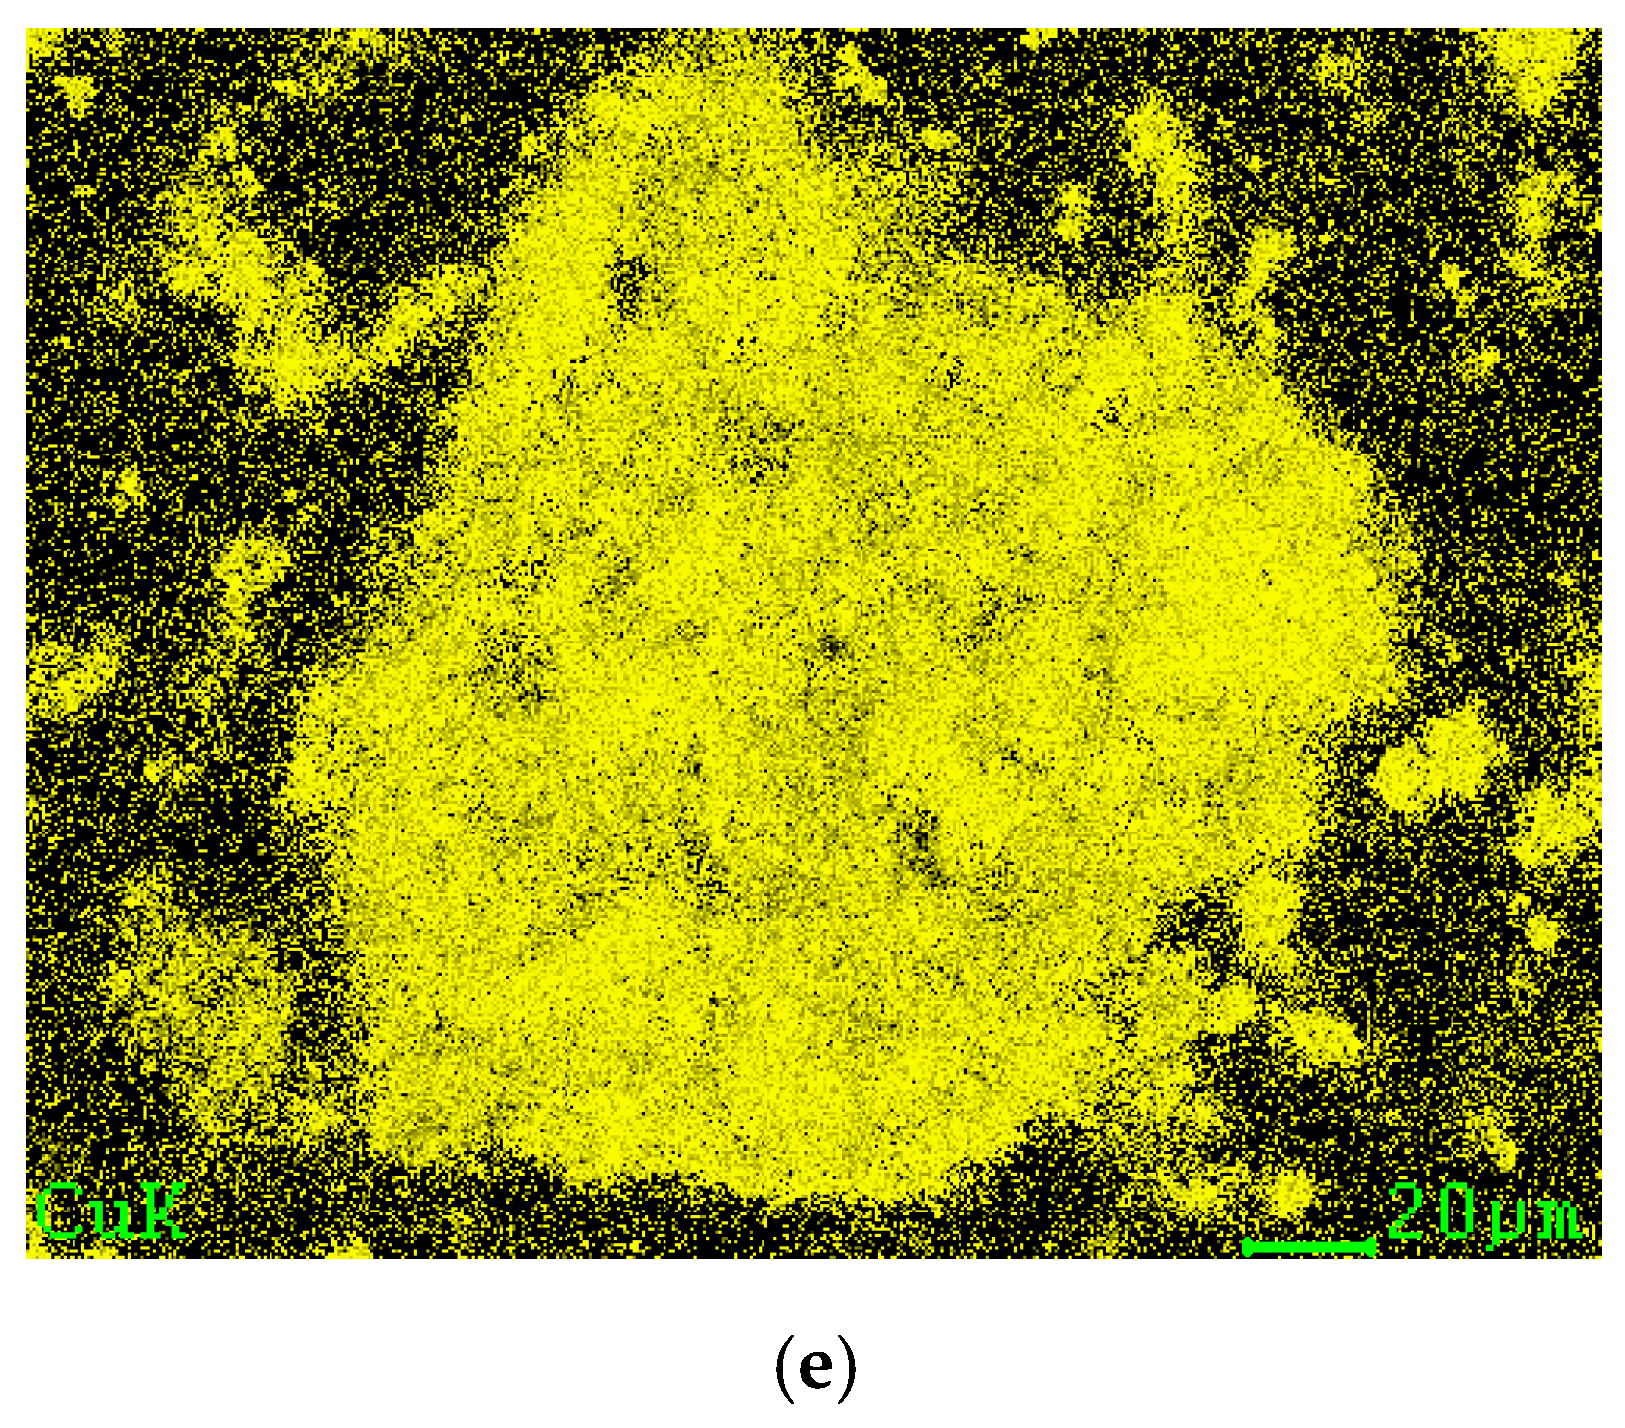
According to Figure 14, after microwave roasting, the product was primarily composed of Cu, Zn, and S elements, with a very small amount of Cl, which is consistent with the results shown in Figure 12; Figure 13; thus, the product was primarily composed of CuO, with a minor amount of zinc and silicon.
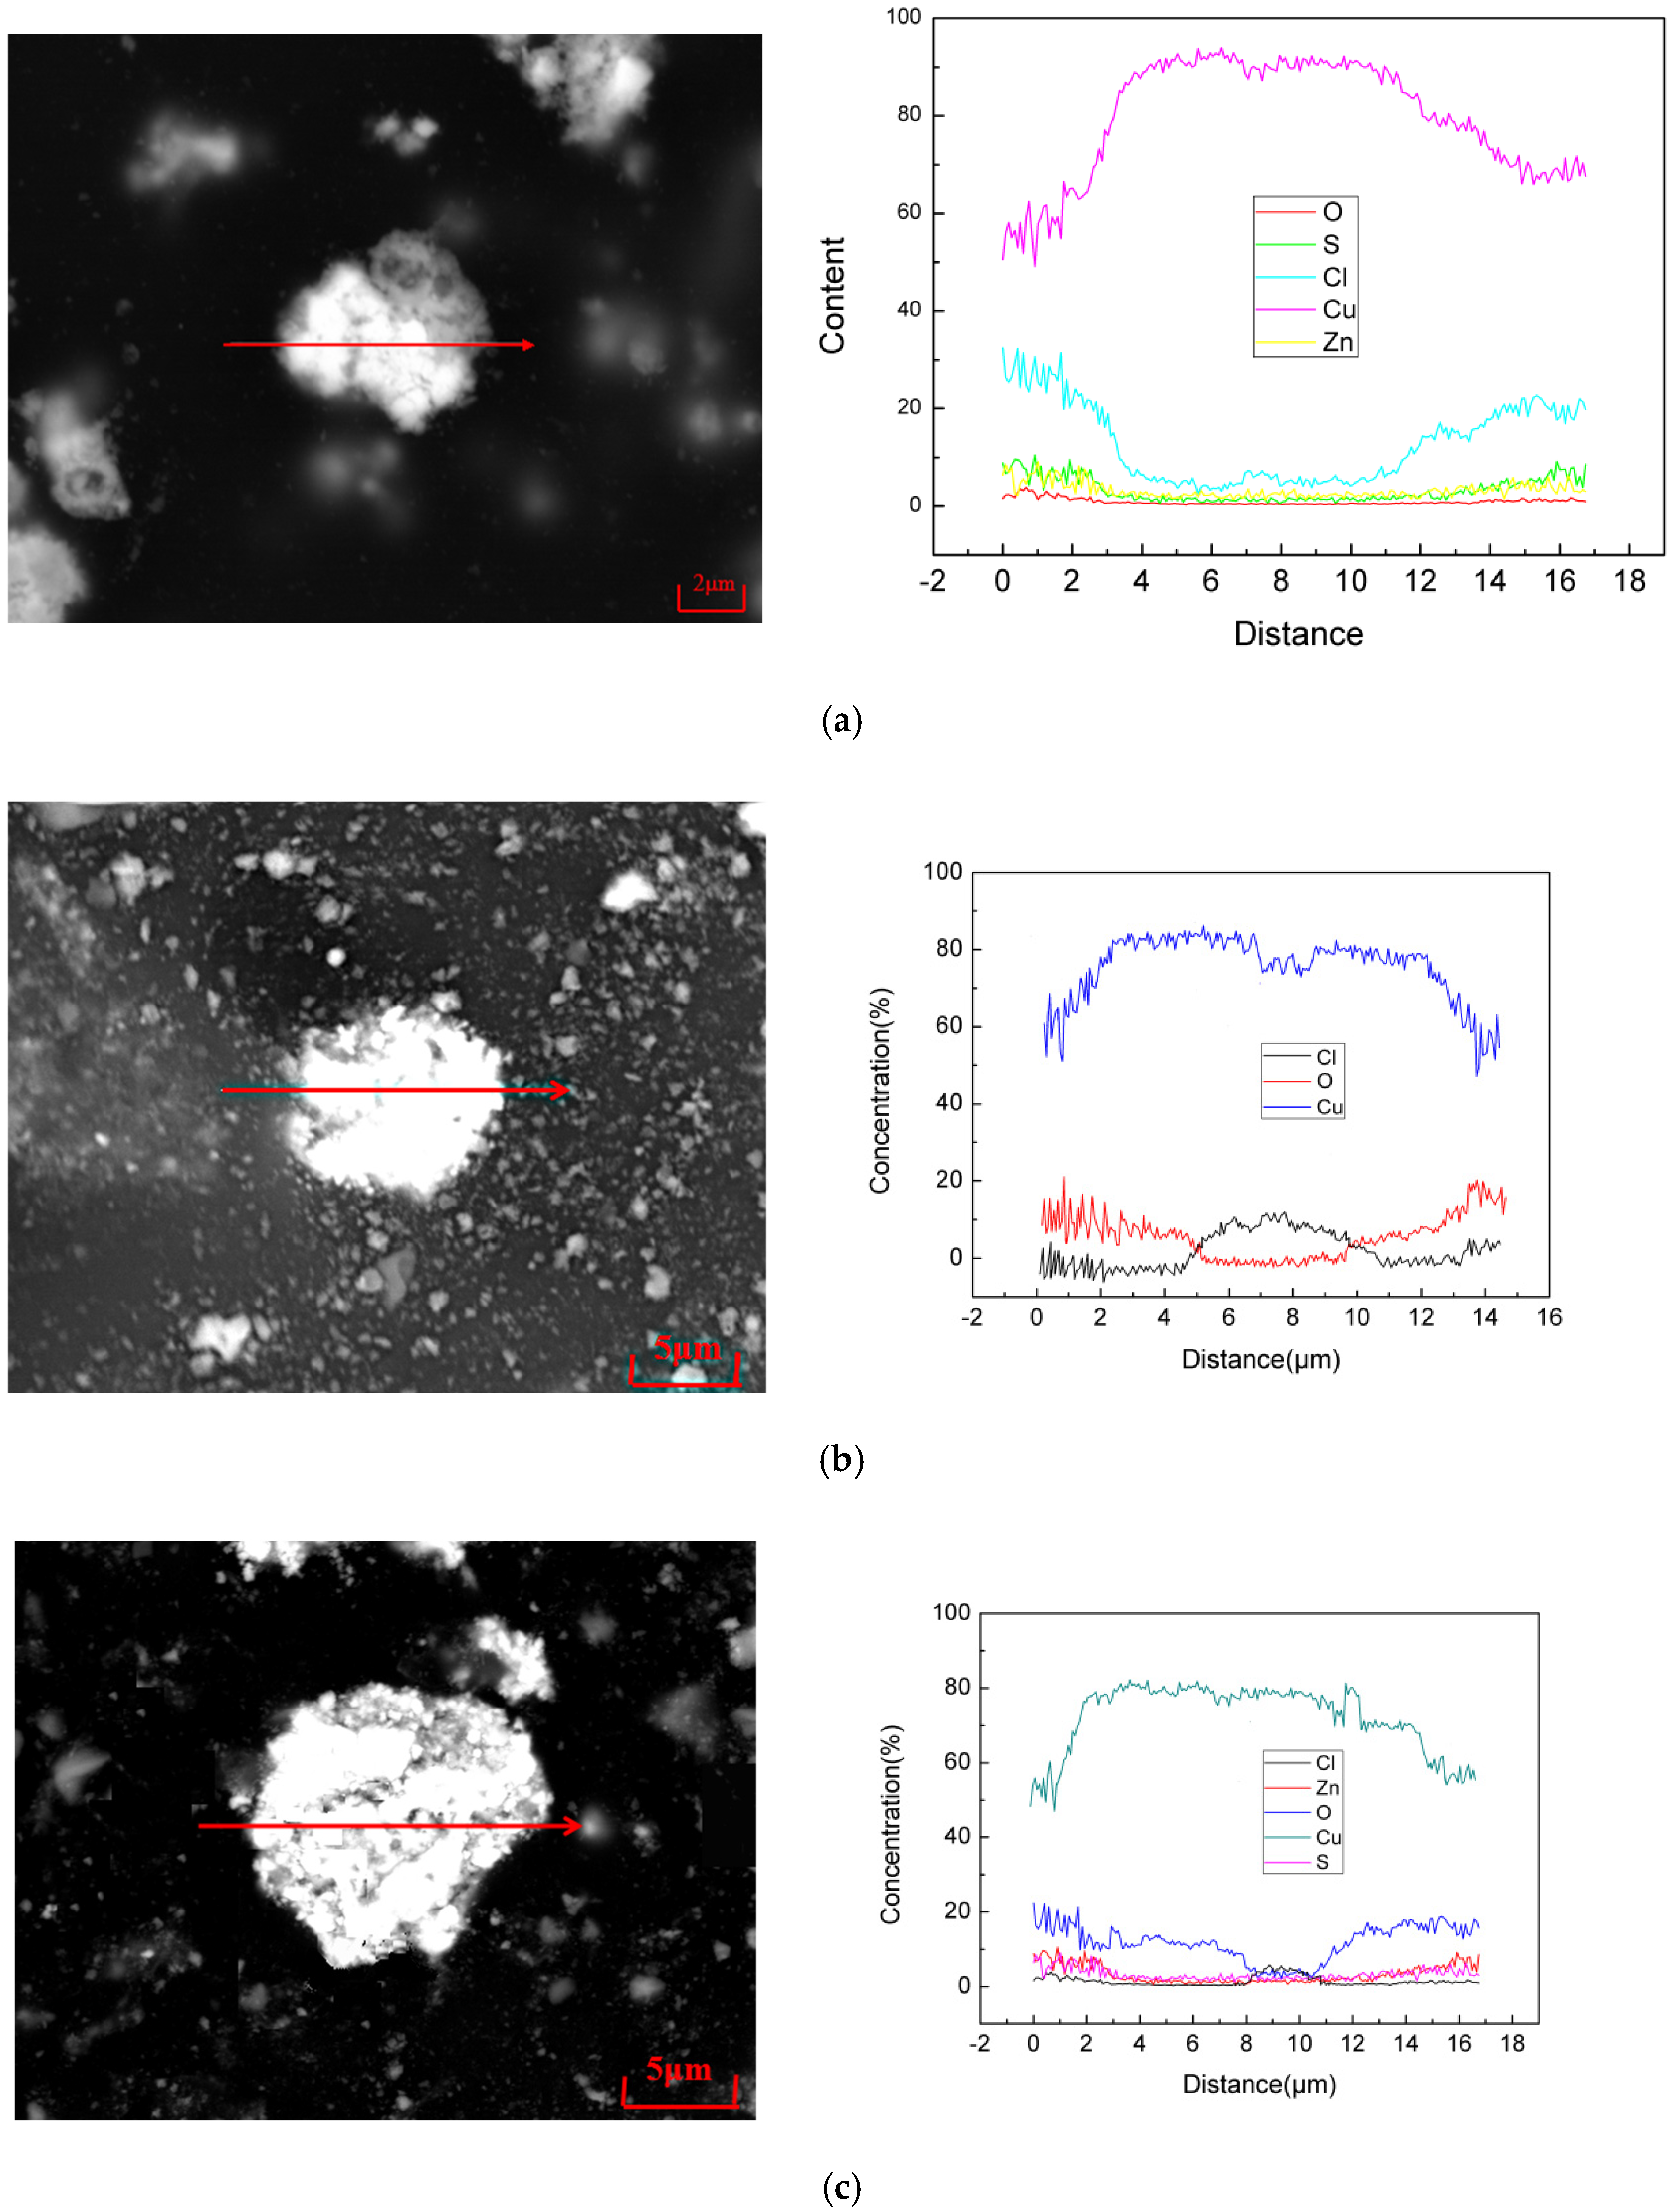
As can be seen from Figure 15, Cu accounted for most of the atoms in the granules during roasting, and the Cl content in the granule gradually decreased upon extending the holding time, while the O content gradually increased. The distribution of chlorine and oxygen in the particles was observed after 20 min of microwave roasting. The chlorine content was lower at particle boundaries and higher in the center of the particles, whereas oxygen distribution was reversed. CuO was formed in the material after 60 min of microwave roasting, along with a trace of Zn and S. The chlorine evaporated, leaving only a trace in the particle’s center, which was consistent with XRD and SEM findings.
3.7. Tail Gas Composition Analysis
During the microwave oxidation roasting experiment, an aluminum foil gas collection bag was used to collect the escaping gas over different time periods, and the Cl2 content analysis was conducted. The results are shown in Table 5.
As can be seen in Table 5, in addition to oxygen, there was high Cl2 content in the tail gas, indicating that the microwave oxidation roasting process is feasible. According to the SEM morphological analysis and experimental results, the chlorine in the material was oxidized and volatilized into Cl2 gas. The results in Table 5 show that when the material was heated for 20–40 min and 40–60 min, the dechlorination reaction of CuCl residue was the most intense. The main events between 0–20 min were the diffusion of oxygen in the material and the formation of a chlorine-containing phase.
3.8. Analysis of Microwave-Enhanced Dechlorination Process
According to the previous analysis, the main phase involved in the reaction during dechlorination included CuCl, Cu2O, CuO, ZnO, ZnS. The microwave roasting process is significantly influenced by the heating behavior of each phase of the residue in the microwave field. In the microwave field, the pure phase, according to Haque [9], can be classified into four types: hyperactive, active, difficult to heat, and inactive. Table 6 shows the phase classification of the materials.
Among them, Cu2O was easily oxidized to CuO and was not measured separately. The chlorine in the CuCl residue is predominantly in the form of CuCl, which is an excellent microwave absorber. Because the other components of the material have relatively weak microwave absorption, the material can be selectively heated internally, allowing CuCl to combine with oxygen via the chloride oxidation reaction, releasing chlorine that can be recycled.
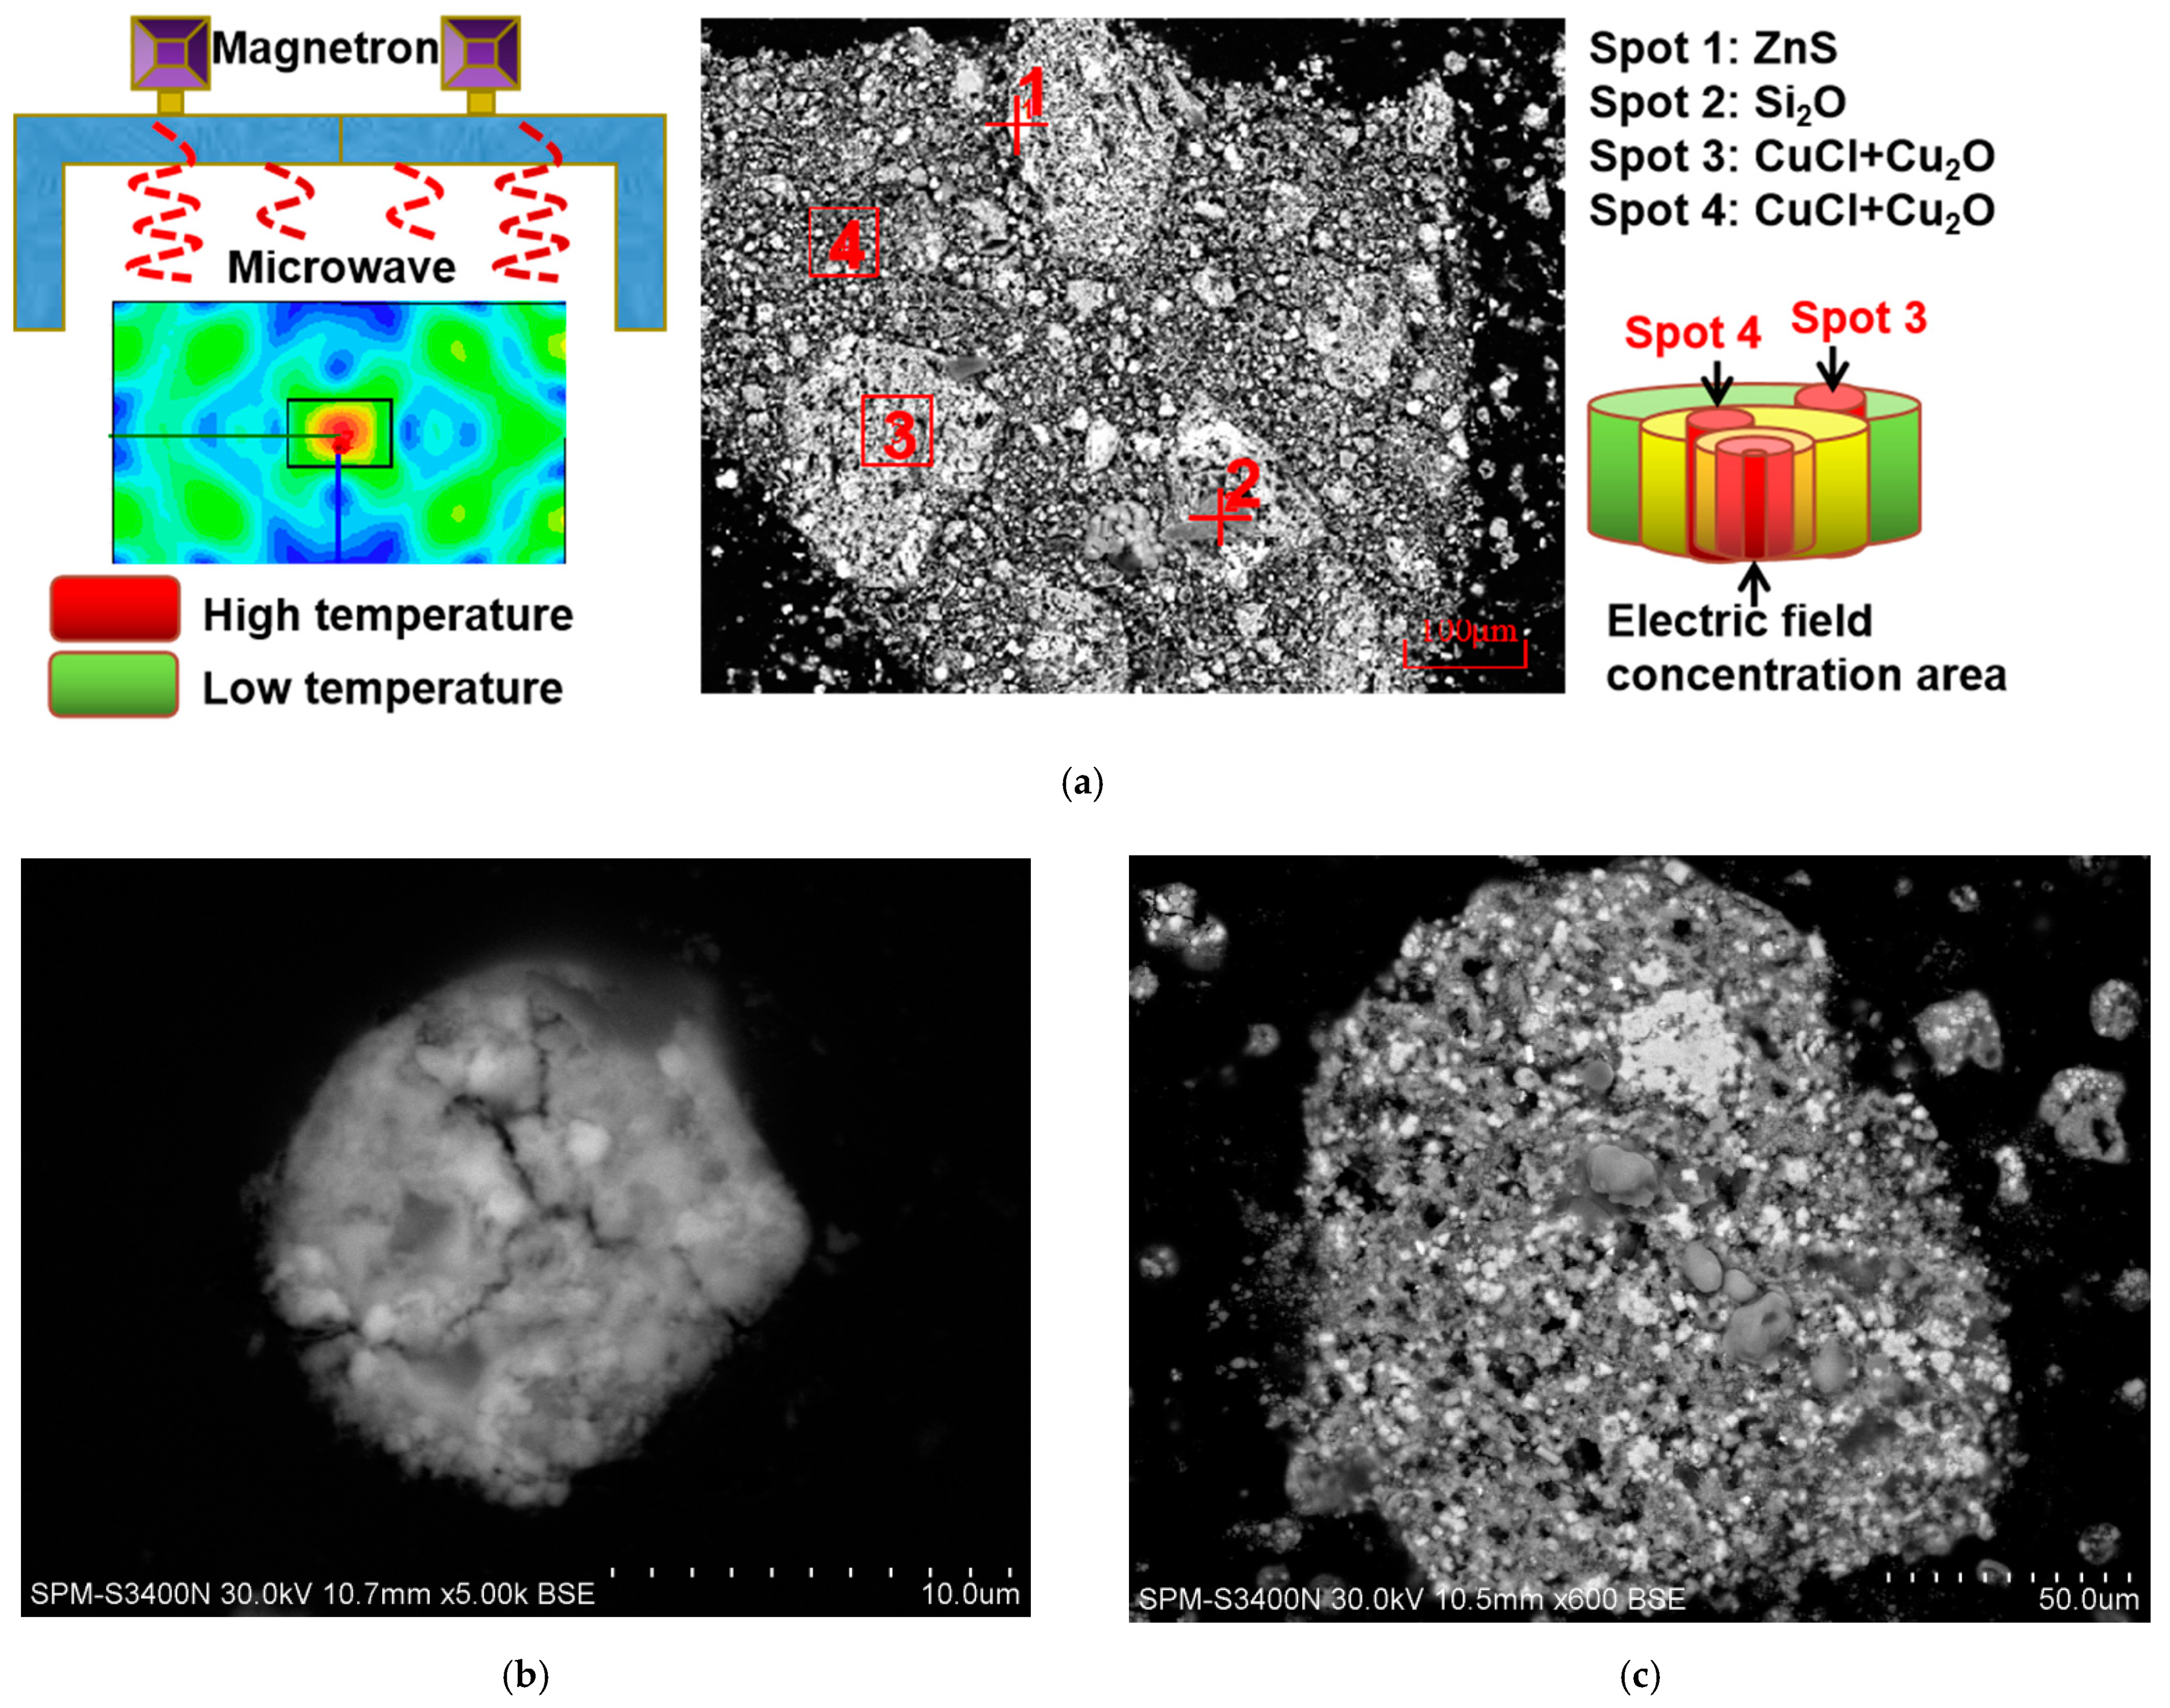
Because the loss of electromagnetic energy in minerals is relatively small at low temperatures, the penetration depth of microwaves is higher. As a result, flash heating occurred inside the material’s interior because the electric field was concentrated in areas with highly absorbing CuCl, as shown in Figure 16a. At the same time, rapid heat transfer occurs between different phases in the material. With an increase in the overall temperature of the material, the microwave absorption of the material gradually increases, as shown in Figure 5, which depicts the dielectric constant and loss factor.
As the temperature of the electric field concentration area and the strong absorbing material concentration area reached the temperature required for the oxidation and dechlorination reactions, the CuCl in the material underwent a reaction with the surrounding oxygen. CuCl exists as a floating liquid during the dechlorination process due to its melting point of approximately 427 °C, which significantly increases the number of polar molecules in the material. The microwave field changes at a frequency of 2.45 GHz, causing the reactant molecules to always lag behind the field’s effect, causing them to constantly move or rotate to achieve a state of dynamic equilibrium, greatly increasing the effective collision frequency. Macroscopically, it reduces the apparent activation energy of the reaction and strongly promotes the oxidation of CuCl into CuO. This mechanism is consistent with the observed trend of sharp increases in the loss factor and loss tangent values of CuCl residue at temperatures above 400 °C.
In addition, microwave preferentially heats CuCl in the material, and cracks caused by uneven temperature distribution provide a new channel for gas diffusion, as shown in Figure 16b, which promotes and intensifies the reaction between CuCl molecules and oxygen.
Additionally, because the physical properties of CuCl and Cu2O in the residue are different from those in the product, such as hardness and density, the shrinkage surface or reaction layer forms in the residue. Simultaneously, the dechlorination process produces a large number of gaseous by-products, resulting in a large number of pores of various sizes. These particles are not uniform, have a loose structure, and have a large number of pores, which allow microwave penetration and multiple reflections in residue and improve microwave heating efficiency.
Furthermore, as illustrated in Figure 16c, these porous microstructures can act as mass transfer channels, promoting the reaction of CuCl molecules with oxygen within the particles.
4. Conclusions
1. In the measurement range, the dielectric properties of materials increased with the increase in temperature and apparent density. When the temperature exceeds 400 °C, temperature has a greater impact on the values of loss tangent than the apparent density. Meanwhile, CuCl residue in the microwave field could reach more than 500 °C after 15 min, and it was revealed that CuCl residue has high microwaves activity.
2. The removal rate of chlorine exceeded 93% when heated in the microwave at 450 °C for 90 min, with a microwave power of 1200 W and an oxygen flow rate of 150 mL/min. Microwave heating reduced treatment time by 30 min and increased the chlorine removal rate by 12%. Microwave roasting had a visible dechlorination effect on CuCl residue from zinc hydrometallurgy, and because of its high degree of dechlorination, rapid temperature increase, and low roasting temperature, it has a wide range of industrial applications.
3. The mechanism by which microwave roasting improves dechlorination was studied by analyzing the chemical reaction and combining the process with XRD and SEM-EDS. It was found that the selective heating property of microwave makes the material produce more holes and cracks, which can provide a new reaction channel for gas–solid reactions. According to the kinetics analysis, the apparent activation energy of conventional oxidation roasting and microwave oxidation roasting was 52.69 kJ/mol and 42.36 kJ/mol, respectively, and the rate-controlling steps were interfacial chemical reactions.
Author Contributions
Z.G.: Conceptualization, Methodology, Investigation, Data curation, Draft, Writing—review and editing. F.L.: Investigation, Resources. Q.Z.: Investigation, Resources. G.S.: Resources. J.C.: Investigation, Resources. H.Z.: Resources. All authors have read and agreed to the published version of the manuscript.
Funding
This research was funded by the National Natural Science Foundation of China (Grant No. 51864042 and 51804220), Youth Foundation of Natural Science Foundation of Henan Province (Grant No. 202300410100 and 212300410130), High-level Talents Start-up Fund of Henan Institute of Technology (Grant No. KY1706 and KQ1820) and Key Scientific and Technological Project of Henan Province (Grant No. 192102310499and 212102310521).
Institutional Review Board Statement
Not applicable.
Informed Consent Statement
Not applicable.
Data Availability Statement
Not applicable.
Conflicts of Interest
The authors declare that they have no known competing financial interests or personal relationships that could have appeared to influence the work reported in this paper.
References
- Liu, W.; Zhang, R.; Liu, Z.; Li, C. Removal of chloride from simulated zinc sulfate electrolyte by ozone oxidation. Hydrometallurgy 2016, 160, 147–151. [Google Scholar] [CrossRef]
- Zhang, X.; Hu, Y.; Xia, Z.; Zhao, X.; Zhou, Z.; Ye, L. Green and circular method for chloride separation from acid wastewater: Application in zinc smelter. Sep. Purif. Technol. 2022, 283, 120221. [Google Scholar] [CrossRef]
- Guo, Z.; Ju, S.; Peng, J.; Zhang, L.; Lei, T. Optimization of microwave roasting for dechlorination of CuCl residue under oxygen-enriched condition. High Temp. Mater. Process. 2016, 35, 135–143. [Google Scholar]
- Chu, G.; Wang, L.; Liu, W.; Zhang, G.; Luo, D.; Wang, L.; Liang, B.; Li, C. Indirect mineral carbonation of chlorinated tailing derived from Ti-bearing blast-furnace slag coupled with simultaneous dechlorination and recovery of multiple value-added products. Greenh. Gases 2019, 9, 52–66. [Google Scholar] [CrossRef] [Green Version]
- Lu, S.; Sun, S.; Lv, J.; Tu, G.; Srinivasakannan, C.; Ju, S.; Peng, J. Optimization of microwave roasting for dechlorination of CuCl residue from zinc hydrometallurgy. J. Microw. Power Energy 2014, 48, 61–70. [Google Scholar] [CrossRef]
- Raveendran, A.; Sebastian, M.T.; Raman, S. Applications of microwave materials: A review. J. Electron. Mater. 2019, 48, 2601–2634. [Google Scholar] [CrossRef] [Green Version]
- Fu, Y.; He, Y.; Yang, Y.; Qu, L.; Zhou, R. Microwave reduction enhanced leaching of valuable metals from spent lithium-ion batteries. J. Alloys Compd. 2020, 832, 154920. [Google Scholar] [CrossRef]
- Galeazzi Isasmendi, R.; Gonzalez Panzo, I.J.; Morales-Ruiz, C.; Romano Trujillo, R.; Rosendo, E.; García, I.; Coyopol, A.; García-Salgado, G.; Silva-González, R.; Oliva Arias, I.; et al. Copper oxide films deposited by microwave assisted alkaline chemical bath. Crystals 2021, 11, 968. [Google Scholar] [CrossRef]
- Haque, K.E. Microwave energy for mineral treatment processes—A brief review. Int. J. Miner. Process. 1999, 57, 1–24. [Google Scholar] [CrossRef]
- Liu, C.; Peng, J.; Li, Z.; Zhang, L.; Hu, T. Removal of F and Cl from zinc oxide fume from fuming furnace by microwave roasting. Arab. J. Sci. Eng. 2017, 42, 1413–1418. [Google Scholar]
- Lu, S.D.; Xia, Y.; Huang, C.Y.; Wu, G.Q.; Peng, J.H.; Ju, S.H.; Zhang, L.B. Removing chlorine of CuCl residue from zinc hydrometallurgy by microwave roasting. J. Cent. South Univ. 2014, 21, 1290–1295. [Google Scholar] [CrossRef]
- Lu, S.; Ju, S.; Peng, J.; Zhu, X.; Srinivasakannan, C.; Zhang, L.; Tu, G. Dechlorination mechanism of cucl residue from zinc hydrometallurgy by microwave roasting. High Temp. Mater. Process. 2015, 34, 147–154. [Google Scholar] [CrossRef]
- He, G.; Li, S.; Yang, K.; Liu, J.; Liu, P.; Zhang, L.; Peng, J. Dielectric Properties of Zinc Sulfide Concentrate during the Roasting at Microwave Frequencies. Minerals 2017, 7, 31. [Google Scholar] [CrossRef] [Green Version]
- Le, T.; Ju, S.; Lu, L.; Koppala, S.; Peng, J. Microwave drying of CuCl residue from hydrometallurgical zinc recovery process. Dry. Technol. 2019, 37, 47–58. [Google Scholar] [CrossRef]
- Ma, A.Y.; Zheng, X.M.; Peng, J.H.; Zhang, L.B.; Chandrasekar, S.; Li, J.; Wei, C.L. Dechlorination of zinc oxide dust derived from zinc leaching residue by microwave roasting in a rotary kiln. Braz. J. Chem. Eng. 2017, 34, 193–202. [Google Scholar]
- Zhang, L.B.; Ma, A.Y.; Liu, C.H.; Qu, W.W.; Peng, J.H.; Luo, Y.G.; Zuo, Y.G. Dielectric properties and temperature increase characteristics of zinc oxide dust from fuming furnace. Trans. Nonferrous Met. Soc. 2014, 24, 4004–4011. [Google Scholar] [CrossRef]
- Lin, G.; Liu, C.; Zhang, L.; Hu, T.; Peng, J.; Li, J.; Wang, S. High temperature dielectric properties of spent adsorbent with zinc sulfate by cavity perturbation technique. J. Hazard. Mater. 2017, 330, 36–45. [Google Scholar] [CrossRef]
- Jiang, Y.; Liu, B.; Liu, P.; Peng, J.; Zhang, L. Dielectric properties and oxidation roasting of molybdenite concentrate by using microwave energy at 2.45 GHz frequency. Metall. Mater. Trans. B 2017, 48, 3047–3057. [Google Scholar]
- Spencer, W.D.; Topley, B. Chemical kinetics of the system Ag2CO3 = Ag2O + CO2. J. Chem. Soc. 1929, 2633–2651. [Google Scholar] [CrossRef]
- Tathavadkar, V.D.; Jha, A.; Antony, M.P. The soda-ash roasting of chromite minerals: Kinetics considerations. Metall. Mater. Trans. B 2001, 32, 593–602. [Google Scholar] [CrossRef]
- Guo, Z.; Li, F.; Su, G.; Zhai, D.; Chen, F.; Ju, S.; Peng, J. Permittivity study of a CuCl Residue at 13–450 °C and elucidation of the microwave intensification mechanism for its dechlorination. High Temp. Mater. Process. 2018, 38, 135–142. [Google Scholar]
- Näther, C.; Jeß, I.; Greve, J. Synthesis and thermal properties of the inorganic–organic transition metal halogenides CuCl-pyrazine and Cu2Cl2-pyrazine. Polyhedron 2001, 20, 1017–1022. [Google Scholar] [CrossRef]
- Nixon, A.; Ferrandon, M.; Kaye, M.H.; Trevani, L. Thermochemical production of hydrogen: Synthesis, characterization, and decomposition of copper oxychloride. J. Herm. Anal. Calorim. 2011, 110, 1095–1105. [Google Scholar] [CrossRef]
- Sharkey, J.B.; Lewin, S.Z. Thermochemical properties of the copper hydroxychlorides. Thermochim. Acta 1972, 3, 189–201. [Google Scholar] [CrossRef]
Figure 1.
X-ray diffraction pattern of dried CuCl residue.

Figure 2.
The SEM-EDS of dried CuCl residue. (a) Spot 1; (b) Spot 2; (c) Spot 3; (d) Spot 4; (e) Spot 5.
Figure 2.
The SEM-EDS of dried CuCl residue. (a) Spot 1; (b) Spot 2; (c) Spot 3; (d) Spot 4; (e) Spot 5.


Figure 3.
Schematic of the permittivity measurement system.

Figure 4.
Schematic of the microwave roasting system.

Figure 5.
Permittivity of the CuCl residue. (a) Relative dielectric constant (ε’) at different temperatures at apparent densities of 1.7, 1.8, and 1.9 g/cm3, (b) relative loss factor (ε’’) for different temperatures at apparent densities of 1.7, 1.8, and 1.9 g/cm3.
Figure 5.
Permittivity of the CuCl residue. (a) Relative dielectric constant (ε’) at different temperatures at apparent densities of 1.7, 1.8, and 1.9 g/cm3, (b) relative loss factor (ε’’) for different temperatures at apparent densities of 1.7, 1.8, and 1.9 g/cm3.

Figure 6.
The loss tangent (tanδ) for different temperatures at apparent densities of 1.7, 1.8, and 1.9 g/cm3.
Figure 6.
The loss tangent (tanδ) for different temperatures at apparent densities of 1.7, 1.8, and 1.9 g/cm3.

Figure 7.
Heating rate curves of CuCl residue at different microwave powers.

Figure 8.
DTA and TG curves of CuCl residue.

Figure 9.
The effect of temperature on the degree of dechlorination of CuCl residue (oxygen flow: 150 mL/min; particle size: 120 μm). (a) Conventional heating; (b) microwave roasting.
Figure 9.
The effect of temperature on the degree of dechlorination of CuCl residue (oxygen flow: 150 mL/min; particle size: 120 μm). (a) Conventional heating; (b) microwave roasting.

Figure 10.
The variation of 1 − (1 − x)1/3 with time at various temperatures. (a) Conventional; (b) microwave.
Figure 10.
The variation of 1 − (1 − x)1/3 with time at various temperatures. (a) Conventional; (b) microwave.

Figure 11.
Relationship between lnk and T−1. (a) Conventional; (b) microwave.

Figure 12.
The XRD patterns of roasted products. a—Conventional heating; b—microwave roasting.

Figure 13.
The SEM-EDS spectra of the microwave-roasted sample. (a) Spot 1; (b) Spot 2; (c) Spot 3.


Figure 14.
The areal distribution of the elements of microwave roasting. (a) Microstructure of the product after microwave roasting; (b) results of the areal distribution of S in the product; (c) results of the areal distribution of Cl in the product; (d) results of the areal distribution of Zn in the product; (e) results of the areal distribution of Cu in the product.


Figure 15.
Chemical element line-scan of products microwave-roasted for 20 min and 60 min. (a) Chemical element line-scan of raw material; (b)chemical element line-scan of the product after microwave roasting for 20 min; (c) chemical element line-scan of the product after microwave roasting for 60 min.

Figure 16.
The SEM image of microwave roasting products after chlorine removal. (a) Microwave roasting process; (b) microstructure of the product; (c) microstructure of the product.
Figure 16.
The SEM image of microwave roasting products after chlorine removal. (a) Microwave roasting process; (b) microstructure of the product; (c) microstructure of the product.


Table 1.
Chemical composition of the nickel-containing residue.
| Composition | Element Composition (Measured by ICP) | |||||||
|---|---|---|---|---|---|---|---|---|
| Cu | Cl | Pb | Zn | S | Ca | Si | Mg | |
| Content (wt.%) | 48.62 | 15.12 | 5.44 | 6.25 | 5.54 | 1.34 | 0.79 | 0.71 |
Table 2.
The weight loss in this experiment compared with the literature value (CuCl was only half of the total mass of the residue in this experiment).
Table 2.
The weight loss in this experiment compared with the literature value (CuCl was only half of the total mass of the residue in this experiment).
| Experiment (the Weight of CuCl in the Residue Was about 50%) | Literature | ||||
|---|---|---|---|---|---|
| Temperature | Reaction | Weight Loss | Temperature | Reaction | Weight Loss |
| 310–361 ℃ | 4CuCl (s) + O2 (g) → 2Cu2OCl2 (s) | +2.5% | 325–400 ℃ | 4CuCl (s) + O2 (g) → 2Cu2OCl2 (s) | +4.8% |
| 361–500 ℃ | Cu2OCl2 (s) + O2 = 2CuO (s) + Cl2 (g) | −13.3% | 400–470 ℃ | 2Cu2OCl2 → CuCl2(s) + CuCl (s or l) + 2CuO (s) + Cl2 (g) | −12.8% |
| Cu2OCl2 (s) + O2 = 2CuO (s) + Cl2 (g) | −23.7% | ||||
Table 3.
Rate constant values at various roasting temperatures using different kinetic models.
| Models | Microwave Roasting | Conventional Roasting | ||||
|---|---|---|---|---|---|---|
| T (K) | kd | R2 | T (K) | kd | R2 | |
| 1 − (1 − x)1/3 = kdt | 673 | 0.0032 | 0.9993 | 673 | 0.0018 | 0.9949 |
| 698 | 0.0044 | 0.9971 | 698 | 0.0027 | 0.9971 | |
| 723 | 0.0057 | 0.9925 | 723 | 0.0037 | 0.9989 | |
| 748 | 0.0070 | 0.9912 | 748 | 0.0046 | 0.9938 | |
| 773 | 0.0086 | 0.9902 | 773 | 0.0063 | 0.9925 | |
| 1 − 2/3x − (1 − x)2/3 = kdt | 673 | 0.0006 | 0.9913 | 673 | 0.0014 | 0.9885 |
| 698 | 0.0009 | 0.9873 | 698 | 0.0019 | 0.9889 | |
| 723 | 0.0014 | 0.9891 | 723 | 0.0026 | 0.9890 | |
| 748 | 0.0018 | 0.9869 | 748 | 0.0030 | 0.9773 | |
| 773 | 0.0027 | 0.9786 | 773 | 0.0035 | 0.9635 | |
| [1 − (1 − x)1/3]2 = kdt | 673 | 0.0021 | 0.9687 | 673 | 0.0008 | 0.9871 |
| 698 | 0.0032 | 0.9678 | 698 | 0.0012 | 0.9846 | |
| 723 | 0.0050 | 0.9760 | 723 | 0.0021 | 0.9728 | |
| 748 | 0.0059 | 0.9701 | 748 | 0.0029 | 0.9757 | |
| 773 | 0.0075 | 0.9715 | 773 | 0.0039 | 0.9372 | |
| [(1 − x)−1/3 − 1]2 = kdt | 673 | 0.0078 | 0.8548 | 673 | 0.0018 | 0.9455 |
| 698 | 0.0185 | 0.8241 | 698 | 0.0031 | 0.9341 | |
| 723 | 0.0540 | 0.7571 | 723 | 0.0074 | 0.8940 | |
| 748 | 0.0585 | 0.7964 | 748 | 0.0143 | 0.8862 | |
| 773 | 0.0880 | 0.7985 | 773 | 0.0223 | 0.7850 | |
Table 4.
Kinetic parameters obtained for the conventional roasting and microwave roasting processes.
Table 4.
Kinetic parameters obtained for the conventional roasting and microwave roasting processes.
| Ea (kJ/mol) | lnA | R2 | |
|---|---|---|---|
| Microwave | 42.36 | 1.8549 | 0.9952 |
| Conventional | 52.69 | 3.1299 | 0.9926 |
Table 5.
The chlorine content in the off-gas.
| Time (min) | 0–20 | 20–40 | 40–60 | 60–90 |
|---|---|---|---|---|
| Cl2 content (mg/L) | 10.99 | 203.25 | 160.6 | 25.72 |
Table 6.
Properties of components in CuCl residue in a microwave field.
| Hyperactive | Active | Difficult to Heat | Inactive |
|---|---|---|---|
| CuCl | CuO | ZnO | SiO2 |
| ZnS |
Publisher’s Note: MDPI stays neutral with regard to jurisdictional claims in published maps and institutional affiliations. |
© 2022 by the authors. Licensee MDPI, Basel, Switzerland. This article is an open access article distributed under the terms and conditions of the Creative Commons Attribution (CC BY) license (https://creativecommons.org/licenses/by/4.0/).
Share and Cite
MDPI and ACS Style
Guo, Z.; Li, F.; Zhang, Q.; Su, G.; Chang, J.; Zhou, H. Microwave Roasting Characteristics of Cuprous Chloride Residue from Zinc Hydrometallurgy. Crystals 2022, 12, 116. https://0-doi-org.brum.beds.ac.uk/10.3390/cryst12010116
AMA Style
Guo Z, Li F, Zhang Q, Su G, Chang J, Zhou H. Microwave Roasting Characteristics of Cuprous Chloride Residue from Zinc Hydrometallurgy. Crystals. 2022; 12(1):116. https://0-doi-org.brum.beds.ac.uk/10.3390/cryst12010116
Chicago/Turabian StyleGuo, Zhanyong, Fachuang Li, Qian Zhang, Guang Su, Jun Chang, and Huilin Zhou. 2022. "Microwave Roasting Characteristics of Cuprous Chloride Residue from Zinc Hydrometallurgy" Crystals 12, no. 1: 116. https://0-doi-org.brum.beds.ac.uk/10.3390/cryst12010116
Note that from the first issue of 2016, this journal uses article numbers instead of page numbers. See further details here.