
The Chemical Composition of Trapiche-like Quartz from Huanggangliang Area, Inner Mongolia, China


1
School of Gemmology, China University of Geosciences, Beijing 100083, China
2
Bazhong Municipal Bureau of Culture, Radio, Television and Tourism, Bazhong 636000, China
*
Author to whom correspondence should be addressed.
Crystals 2022, 12(1), 122; https://0-doi-org.brum.beds.ac.uk/10.3390/cryst12010122
Submission received: 18 December 2021
/
Revised: 7 January 2022
/
Accepted: 12 January 2022
/
Published: 17 January 2022
(This article belongs to the Special Issue Gem Crystals)
Abstract
:Trapiche-like quartz, which is found in Huanggangliang area, Chifeng City, Inner Mongolia, China, has a short columnar euhedral shape. Arms of trapiche-like phenomena are formed by six radial dark bands located along the a-axis of crystals, and their cores are formed by color zones. Various methods were used to investigate the conventional gemological characteristics, trapiche pattern features, chemical compositions, and spectral characteristics of the trapiche-like quartz. CL images and EPMA results reveal they were formed at high temperature conditions and originated from pegmatite. The hexagonal darker zones with high FeO and very little TiO2 contents indicate the trapiche-like patterns are due to spatial distribution of color-inducing elements. According to the position and interpenetration relationship between inclusions, fibrous and spherical inclusions are identified as protogenetic inclusions, which were respectively identified to be ferro-actinolite and iron oxide by EPMA and Raman spectra.
1. Introduction
The trapiche phenomenon was first discovered in emeralds from the Muzo mining area, Columbia, where crystals were found with colorless hexagonal centers and green parts surrounding them [1]. At first, this kind of emerald was only considered a “special emerald” [2,3,4,5], until 1964, when Mckague [6], a researcher at the Gemmology Institute of America, published an article and used the word “trapiche” to name the unusual Columbia emerald. Now, not only emeralds, but also many other gemstones have been found to have trapiche phenomena, such as ruby [7,8,9,10,11,12,13], sapphire [14,15,16,17], tourmaline [18,19], and quartz [13,20,21,22,23].
With the discovery of trapiche phenomena in other gems, different classifications have been proposed [19,24]. The modified names of trapiche gems and trapiche-like gems are widely used now [23]. The main crystals of trapiche gems, such as emerald [24], ruby [12,25], and tourmaline [19], are separated into several equal parts by inclusion impurities. However, the patterns of trapiche-like gems are formed by alternating bands or inclusions in gemstone, including sapphire [14,15,16,17], aquamarine [26,27], and quartz [13,23].
The trapiche phenomena in quartz was first mentioned by Win [13]. Then, researchers found many trapiche-like quartz in different countries and places, such as Colombia [21,24], Brazil [22], Japan [28], and China [23,29]. Most trapiche-like quartz are found in transparent quartz or amethysts. Krzemincki and Laurs [20] observed a batch of trapiche crystals from Colombia and found many “fibrous” inclusions in the area separated by star lines, with intermittent and irregularly shaped substances. However, Kawasaki et al. [28] reported a Japanese light yellow trapiche quartz, which belongs to “trapiche-type” and is caused by the formation of dendrite growth and layer growth in stages. It is obvious there are limited studies on trapiche-like quartz and their formation mechanisms are not uniform.
To enrich the information of trapiche-like gems, detailed experiments on four trapiche-like quartz are performed. The conventional gemological characteristics, trapiche pattern features, inclusion characteristics, chemical compositions, and spectral characteristics of the samples are discussed by gemological microscopy, polarizing microscopy, scanning electron microscopy (SEM), cathodoluminescence spectra (CL), electron probe microanalysis (EPMA), energy dispersive X-ray spectroscopy (EDX), and Raman spectroscopy.
2. Materials and Methods
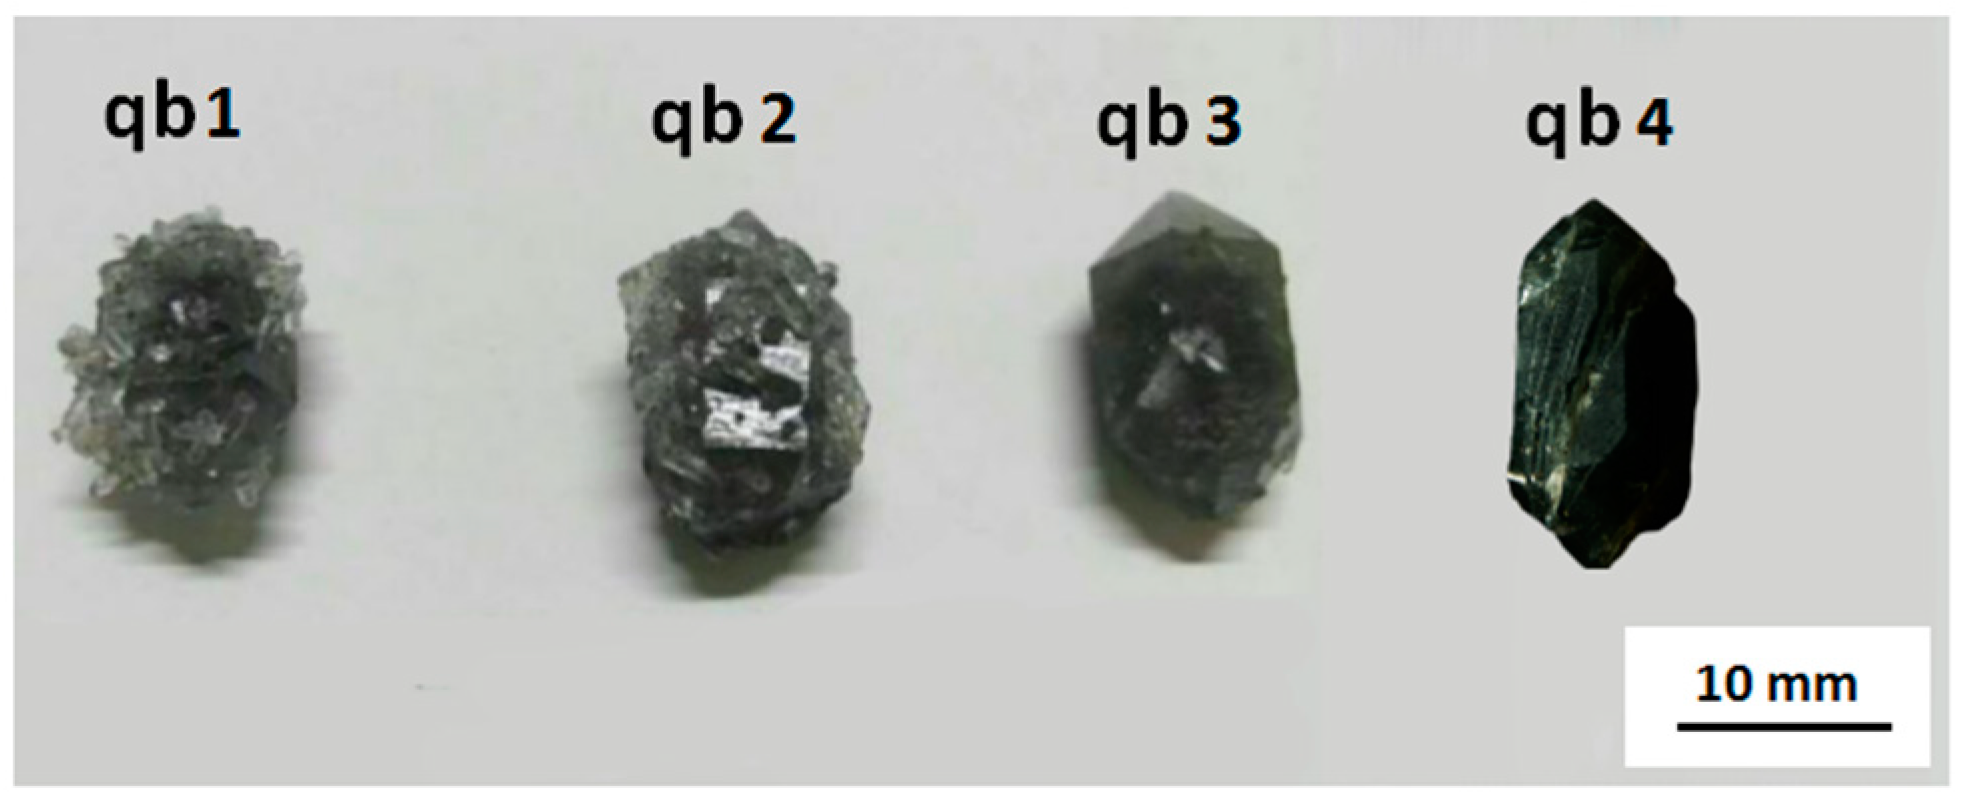
Four quartz samples, which are dark-green, short prisms with rhombohedron shape, are from Huanggangliang area of Keshiketengqi, Chifeng City, Inner Mongolia, China. They were labeled as qb1, qb2, qb3, and qb4, respectively (Figure 1). Samples of qb3 and qb4 were cut by diamond blade. Four slices were cut perpendicular to the c-axis below the terminating rhombohedral faces of qb3 crystal, and the qb4 sample was cut in half along the longitudinal direction of the c-axis. Water was used as lubricant during cutting. Chromium trioxide and alumina polishing solution was adopted to polish all sections, and alcohol with ultrasonic cleaning machine were used to clean for microscopic examination and other experiments. The qb32 (second slice of qb3) was carbon-coated for EPMA and CL analysis. Samples of qb1, qb4, and qb34 (the fourth slice of qb3) were prepared and polished for Raman spectra analysis. The fibrous inclusions exposed on the crystals’ surface and spherical inclusions on the qb1 surface is labeled as qbd1, small floating crystal on the qb1 is labeled as qbd2, and one cross-section of spherical inclusion on the qbd2 labeled as qbd3 were selected for SEM experiments.
Conventional gemological properties and structural characteristics were conducted in the Gem Testing Laboratory at school of Gemmology, China University of Geosciences, Beijing (CUGB).
Sample was sliced into 0.03 mm thickness sheets, which were observed under a polarized microscope (BX5, Olympus, Tokyo, Japan) in the mineral sheet observation room of the Ocean Building of CUGB.
EPMA experiments were carried out at the Electron Probe and Scanning Electron Microscope Laboratory of the Institute of Geology and Geophysics, Chinese Academy of Sciences (CAS) (JXA-8100 Electron Probe, JEOL Ltd., Tokyo, Japan), using a beam spot diameter of ~1 μm, beam current of 20 nA, and accelerating voltage of 15 kV. Before the experiment, the sample was uniformly plated with 20 nm thick carbon film. The measurement time of all element characteristic peaks is 20 s, and the measurement time of upper and lower background is half of the peak measurement time, respectively. All test data were processed by ZAF correction. The calculated detection limit for Ti, Fe, and Al were 100, 86, and 20 ppm, respectively.
The inclusions exposed on the crystals’ surface were stripped with tape and selected for SEM experiments, which were performed at the scanning electron microscope laboratory, Yifu Building, CUGB on ZEISS SUPRA 55 (ZEISS Ltd., Oberkochen, Germany) with an accelerating voltage of 10 kV, 10–15 mm. An EDX-7000 (Oxford Instruments Ltd., Oxford, Britain) was used to test the inclusions too. CL images were collected at the Cathode Luminescence Laboratory, CUGB, using a CL5-2 cathode luminometer (Cambridge Image Technology Ltd., Cambridge, Britain) installed on a Leica microscope stage, with a 240 μA beam current and 10–15 kV accelerating voltage.
Raman spectra were collected with a LabRAM HR (Jobin Yevon Ltd., Paris, France) visible micro confocal Raman spectrometer at the Laser Raman laboratory, Institute of Geology and Geophysics, CAS. The Raman spectra worked with a spot-size of approximately 1 µm, 532 nm wavelength laser, 44 mV output power, and 0.65 cm−1 spectral resolution. The transverse spatial resolution is better than 1 μm, while the vertical spatial resolution is better than 2 μm. All data were recorded between 100 and 4000 cm−1 range, where the collection time was 5 s and the accumulation was three scans. Before the test, the Raman spectrum was corrected with single crystal silicon wafer.
3. Results and Discussions
3.1. Gemological Properties
The quartz samples have “black core” under the transmitted light (Figure 2a). Hexagonal dark-green color zones are obvious to be seen from the cross section perpendicular to the c-axis, which indicates that the “black core” is caused by the color zones (Figure 2b). There are also many tiny quartz crystals and dark points formed at the surface and in the crystal, respectively (Figure 2a). The refractive indexes are 1.544–1.553, with a specific gravity of 2.64–2.61 and no dichroism.
3.2. Different Inclusions in Quartz Samples
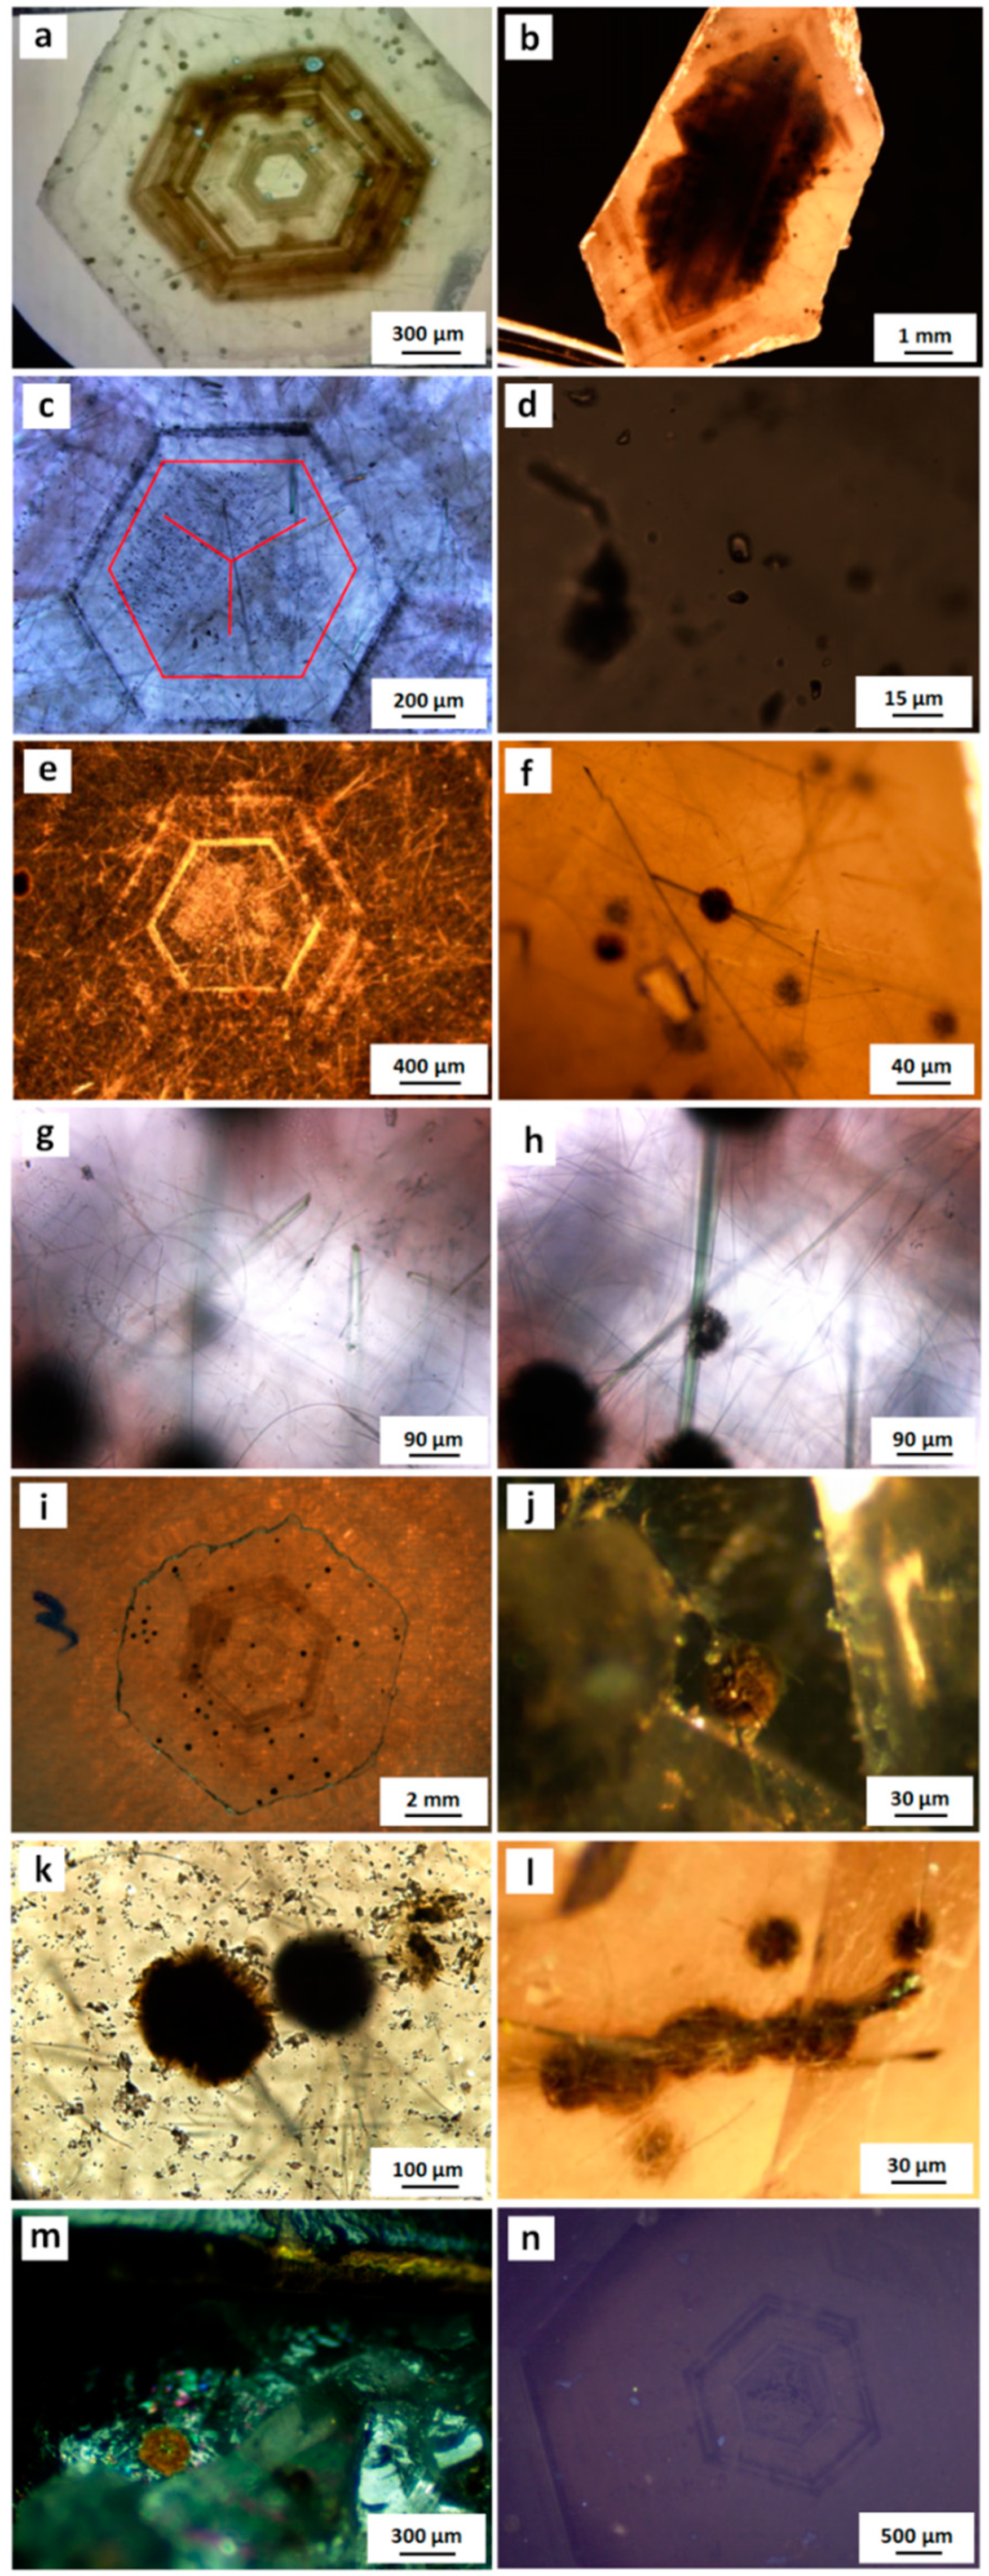
Different kinds of inclusions in our samples are presented in Figure 3. There are two categories, color zones (Figure 3a,b,e,i,n) and other inclusions. The latter can be further divided into gas-liquid, fibrous, and spherical inclusions.
3.2.1. Color Zones
Two obvious groups of hexagonal dark zones can be seen in the qb3 sample (Figure 3a), which are composed of narrower dark bands when observed from direction perpendicular to the c-axis of the crystal. The symmetry of hexagonal color zones is gradually weakened from the edge to the core. The innermost color zone is apparently formed of two different-size rhombohedra (Figure 3a). This is in good agreement with its symmetrical characteristic.
When the sample was cut longitudinally along the c-axis (Figure 3b), the outline of the black core can be clearly observed. The black core demonstrates the growth history of this crystal, that is, the core is composed of dark single crystals, which are formed in the earlier periods with opposite orientations and have a dumbbell shape. Then, more transparent quartz continues to crystal on the basis of the previous crystal to form a double-pointed appearance that is visible to the naked eye.
3.2.2. Gas-Liquid Inclusions
Gas-liquid inclusions mainly exist near the middle of the dark hexagonal color zones. They are distributed unevenly and form a shape similar to the logo of a Mercedes-Benz car (Figure 3c,d), which reveals one more time that the growth rates of the two rhombohedra are different.
3.2.3. Fibrous Inclusions
Fibrous inclusions are distributed randomly in the crystal (Figure 3e). Some of them extend to the surface, and some interpenetrate into spherical inclusions (Figure 3f). The thicker ones may be broken near the crystal’s surface and the thinner ones are obviously curved with obtuse angles (Figure 3h). When the fibrous inclusions are thick enough, they have a green color with a rhombic cross section (Figure 3g).
3.2.4. Spherical Inclusions
The distribution of spherical inclusions is also random (Figure 3i), both inside and outside of quartz (Figure 3f,h,j–l). They exist separately on their own, attach to fibrous inclusions (Figure 3h,k), or cluster around other sphericals (Figure 3l).
The relationship among different inclusions reveals that spherical inclusions were formed earlier than crystals but later than fibrous inclusions. The sphericals are black under transmitted light and their transparencies are not well (Figure 3j,h,l), with relatively uniform diameters (200–300 μm) (Figure 3i). Those sphericals exposed on the outer surface are yellow, earthy luster, and semi-metallic luster under strong reflected light (Figure 3j). Brownish color zones can be seen on qb2 sample’s cross section (Figure 3m).
3.3. Cathodoluminescence
The CL image of color zones in probe slice qb32 was shown in Figure 3n, which have different blue-purple color tones. Zinkernagel and Stuttgart [30] have proposed that the luminescent characteristics of quartz grains are dependent on their parent rocks’ formation temperatures. Furthermore, Boiron et al. [31] have deduced that CL of high-temperature quartz is stronger than that of low-temperature quartz. GöTzeet al. and Rusk [32,33] detected that pegmatite quartz crystallized at stable conditions of relatively high temperature and high pressure show blue CL. It is obvious that CL of qb32 sample is blue-purple, which indicates that qb3 sample crystalized at higher temperature condition. It has been reported that the genetic background of smoky quartz in Inner Mongolia is pegmatite type [34], which can be confirmed from the quartz morphologies, with short columns and developing equiaxed and similar crystal faces [35].
It is also interesting to note that the blue-purple bands under CL are incompletely coincident with color zones observed by the naked eye. The color of the darker zones observed with the naked eye is lighter in CL image, whereas the lighter zones observed with the naked eye have a deeper blue-purple color in CL (Figure 3n). Al and Ti cations are suggested to be the activator elements of CL [36]. Therefore, it is deduced that there are more Al and Ti cations in stronger blue-purple bands, which are lighter color zones when observed with the naked eye, and vice versa.
3.4. Electron Probe Microanalysis
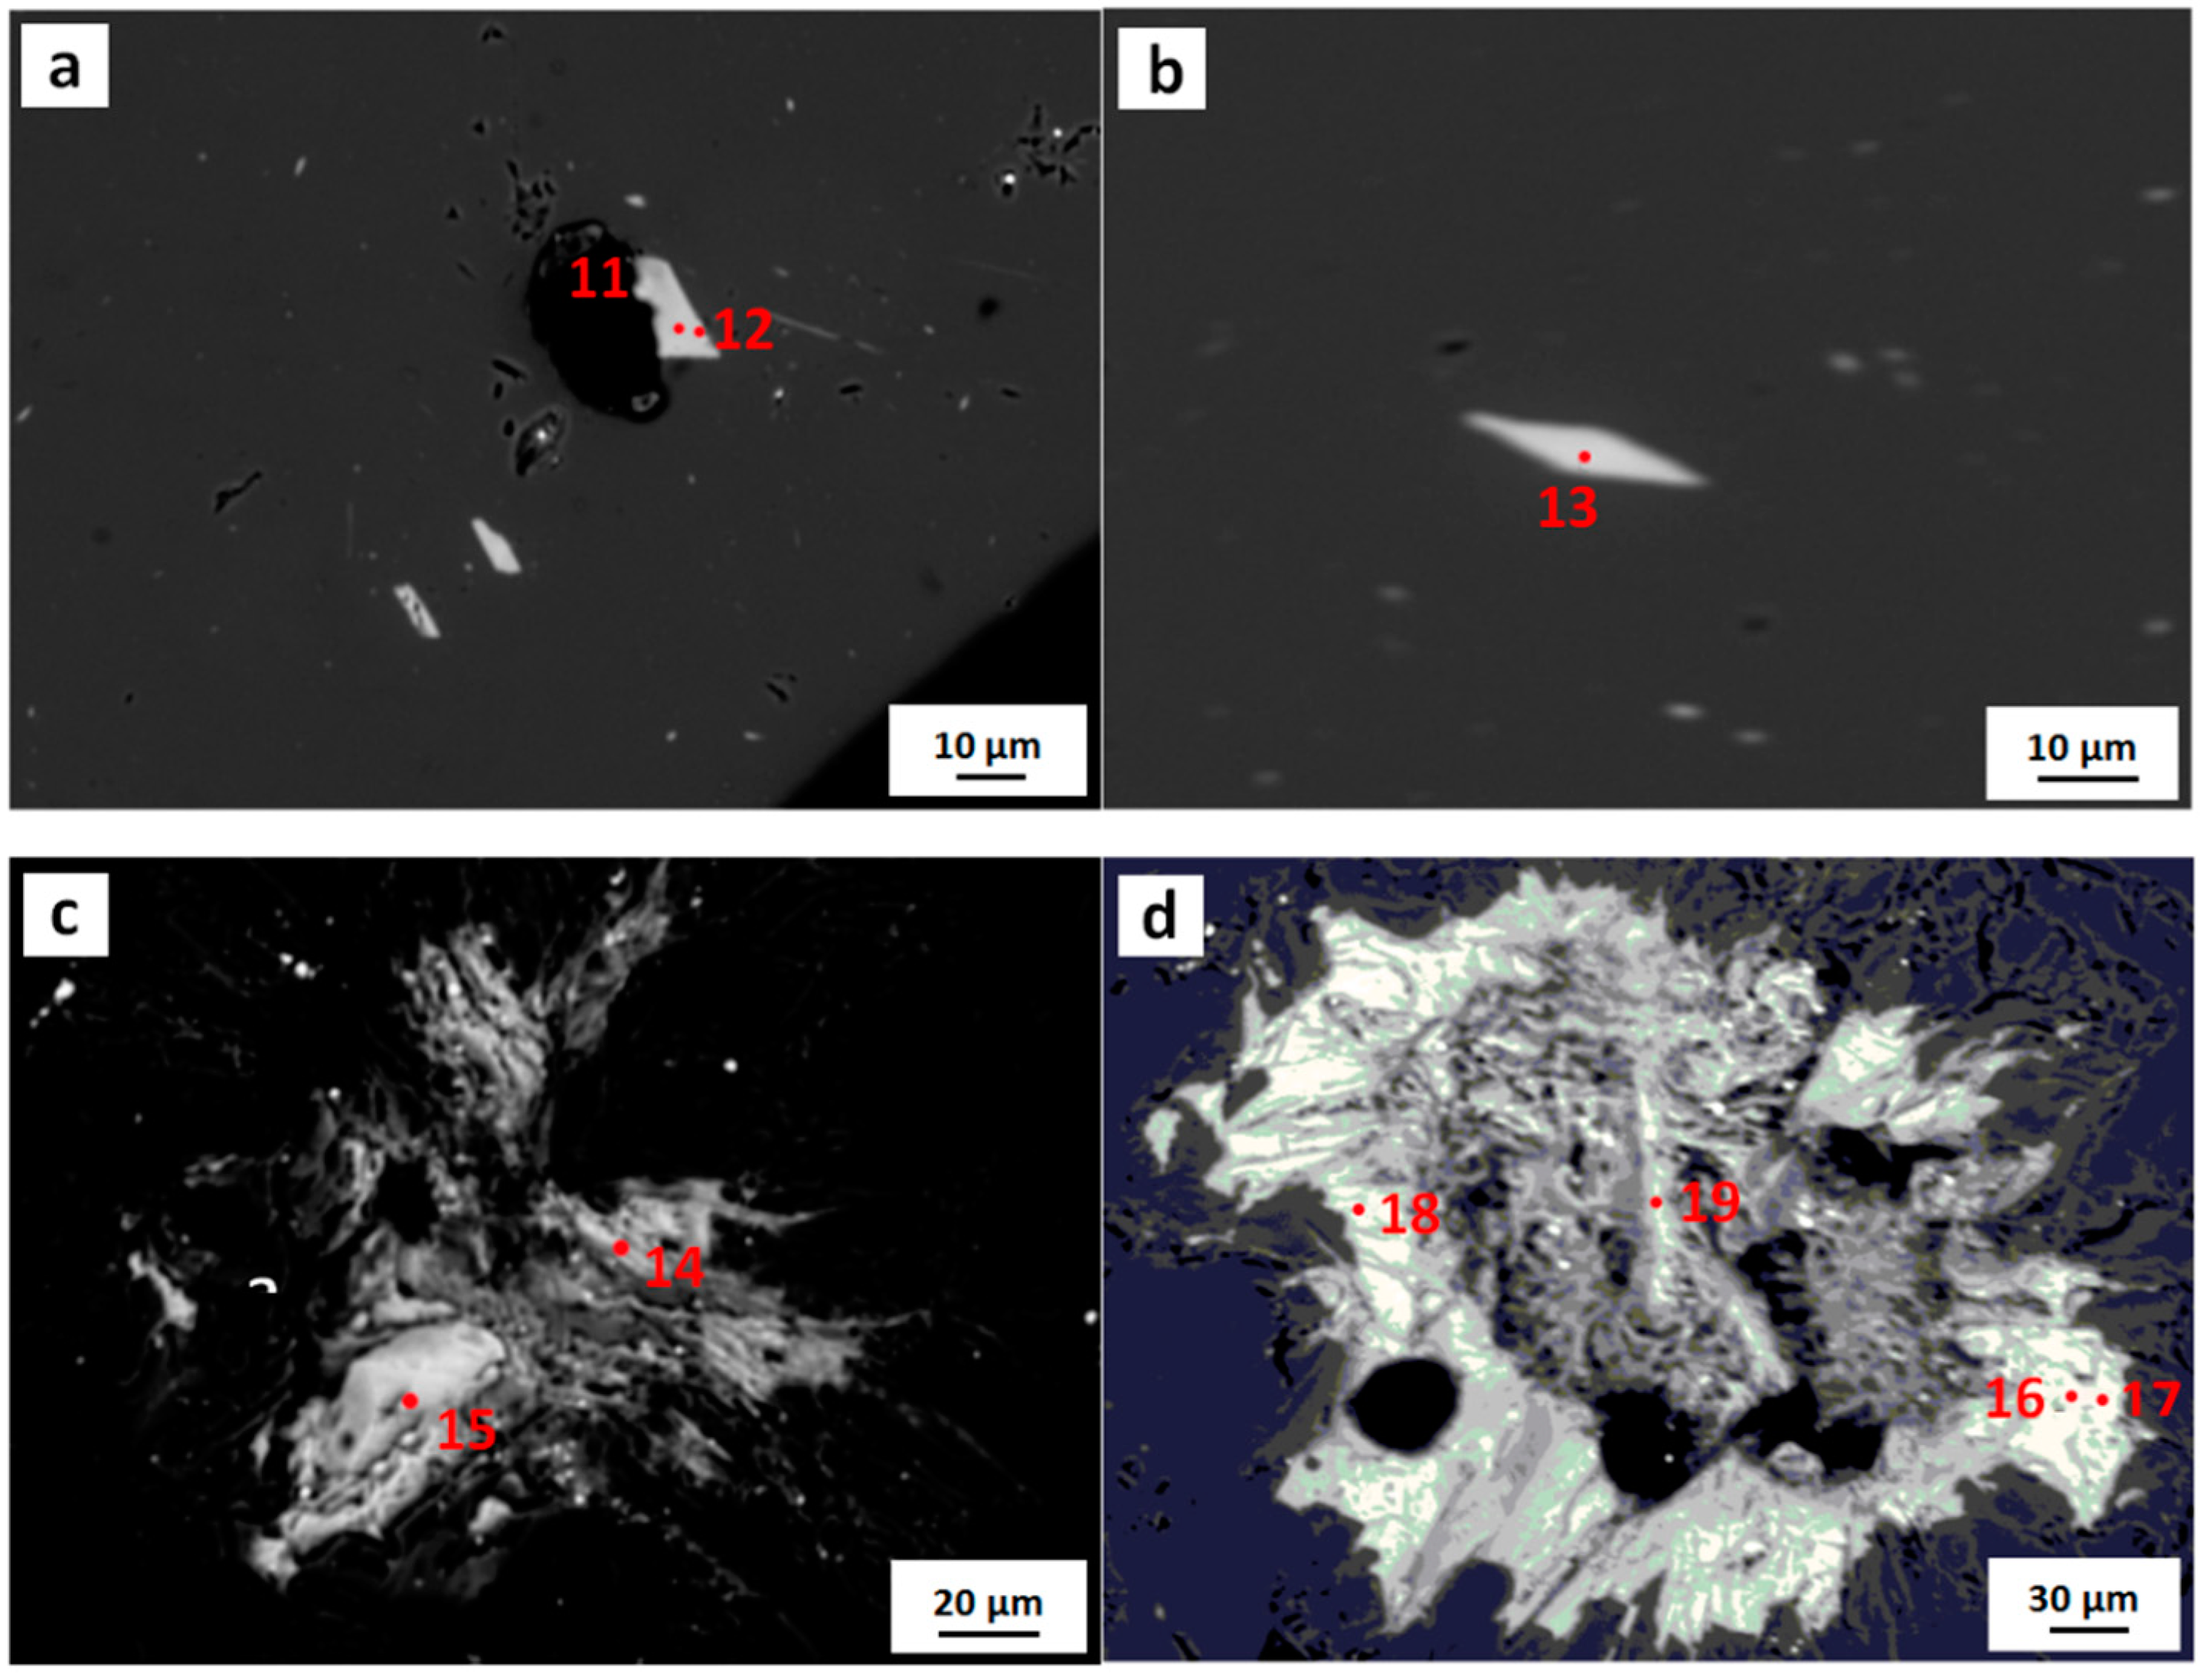
Figure 4 and Figure 5 illustrate the detailed spot positions (the red spots) where EPMA data were performed. Chemical compositions of the color zones and fibrous and spherical inclusions in qb32 slice are shown in Table 1.
3.4.1. EPMA Analysis of Fibrous Inclusions
EPMA points of the fibrous inclusions are shown in Figure 4a,b. It can be deduced from Table 1 that the fibrous inclusions belong to silicate minerals. The Fe2+/(Fe2++Mg2+) is about 88%, which indicates the fibrous inclusions are ferro-actinolite [37], with chemical formula (Na+0.060K+0.029Ca2+1.488)1.577(Mg2+0.315Fe2+1.927Mn2+0.261Ni2+0.001Al3+0.193Fe3+1.540Ti4+0.003Cr3+0.001)4.061[Si4.090O11]2(OH)2.
3.4.2. EPMA Analysis of Spherical Inclusions
EPMA points and results of spherical inclusions are shown in Figure 4c,d and Table 1, respectively. Fe is the main element of spherical inclusions. The highest concentrations in FeO and SiO2 are 656, 400, and 135,200 ppm, respectively. The spherical inclusions are brown-yellow or dark maroon, metallic, or earthy luster (Figure 3m). According to these experimental results and their surface morphology, those inclusions are deduced to be iron oxide, which has been observed in other quartz [38].
3.4.3. EPMA Analysis of Color Zones
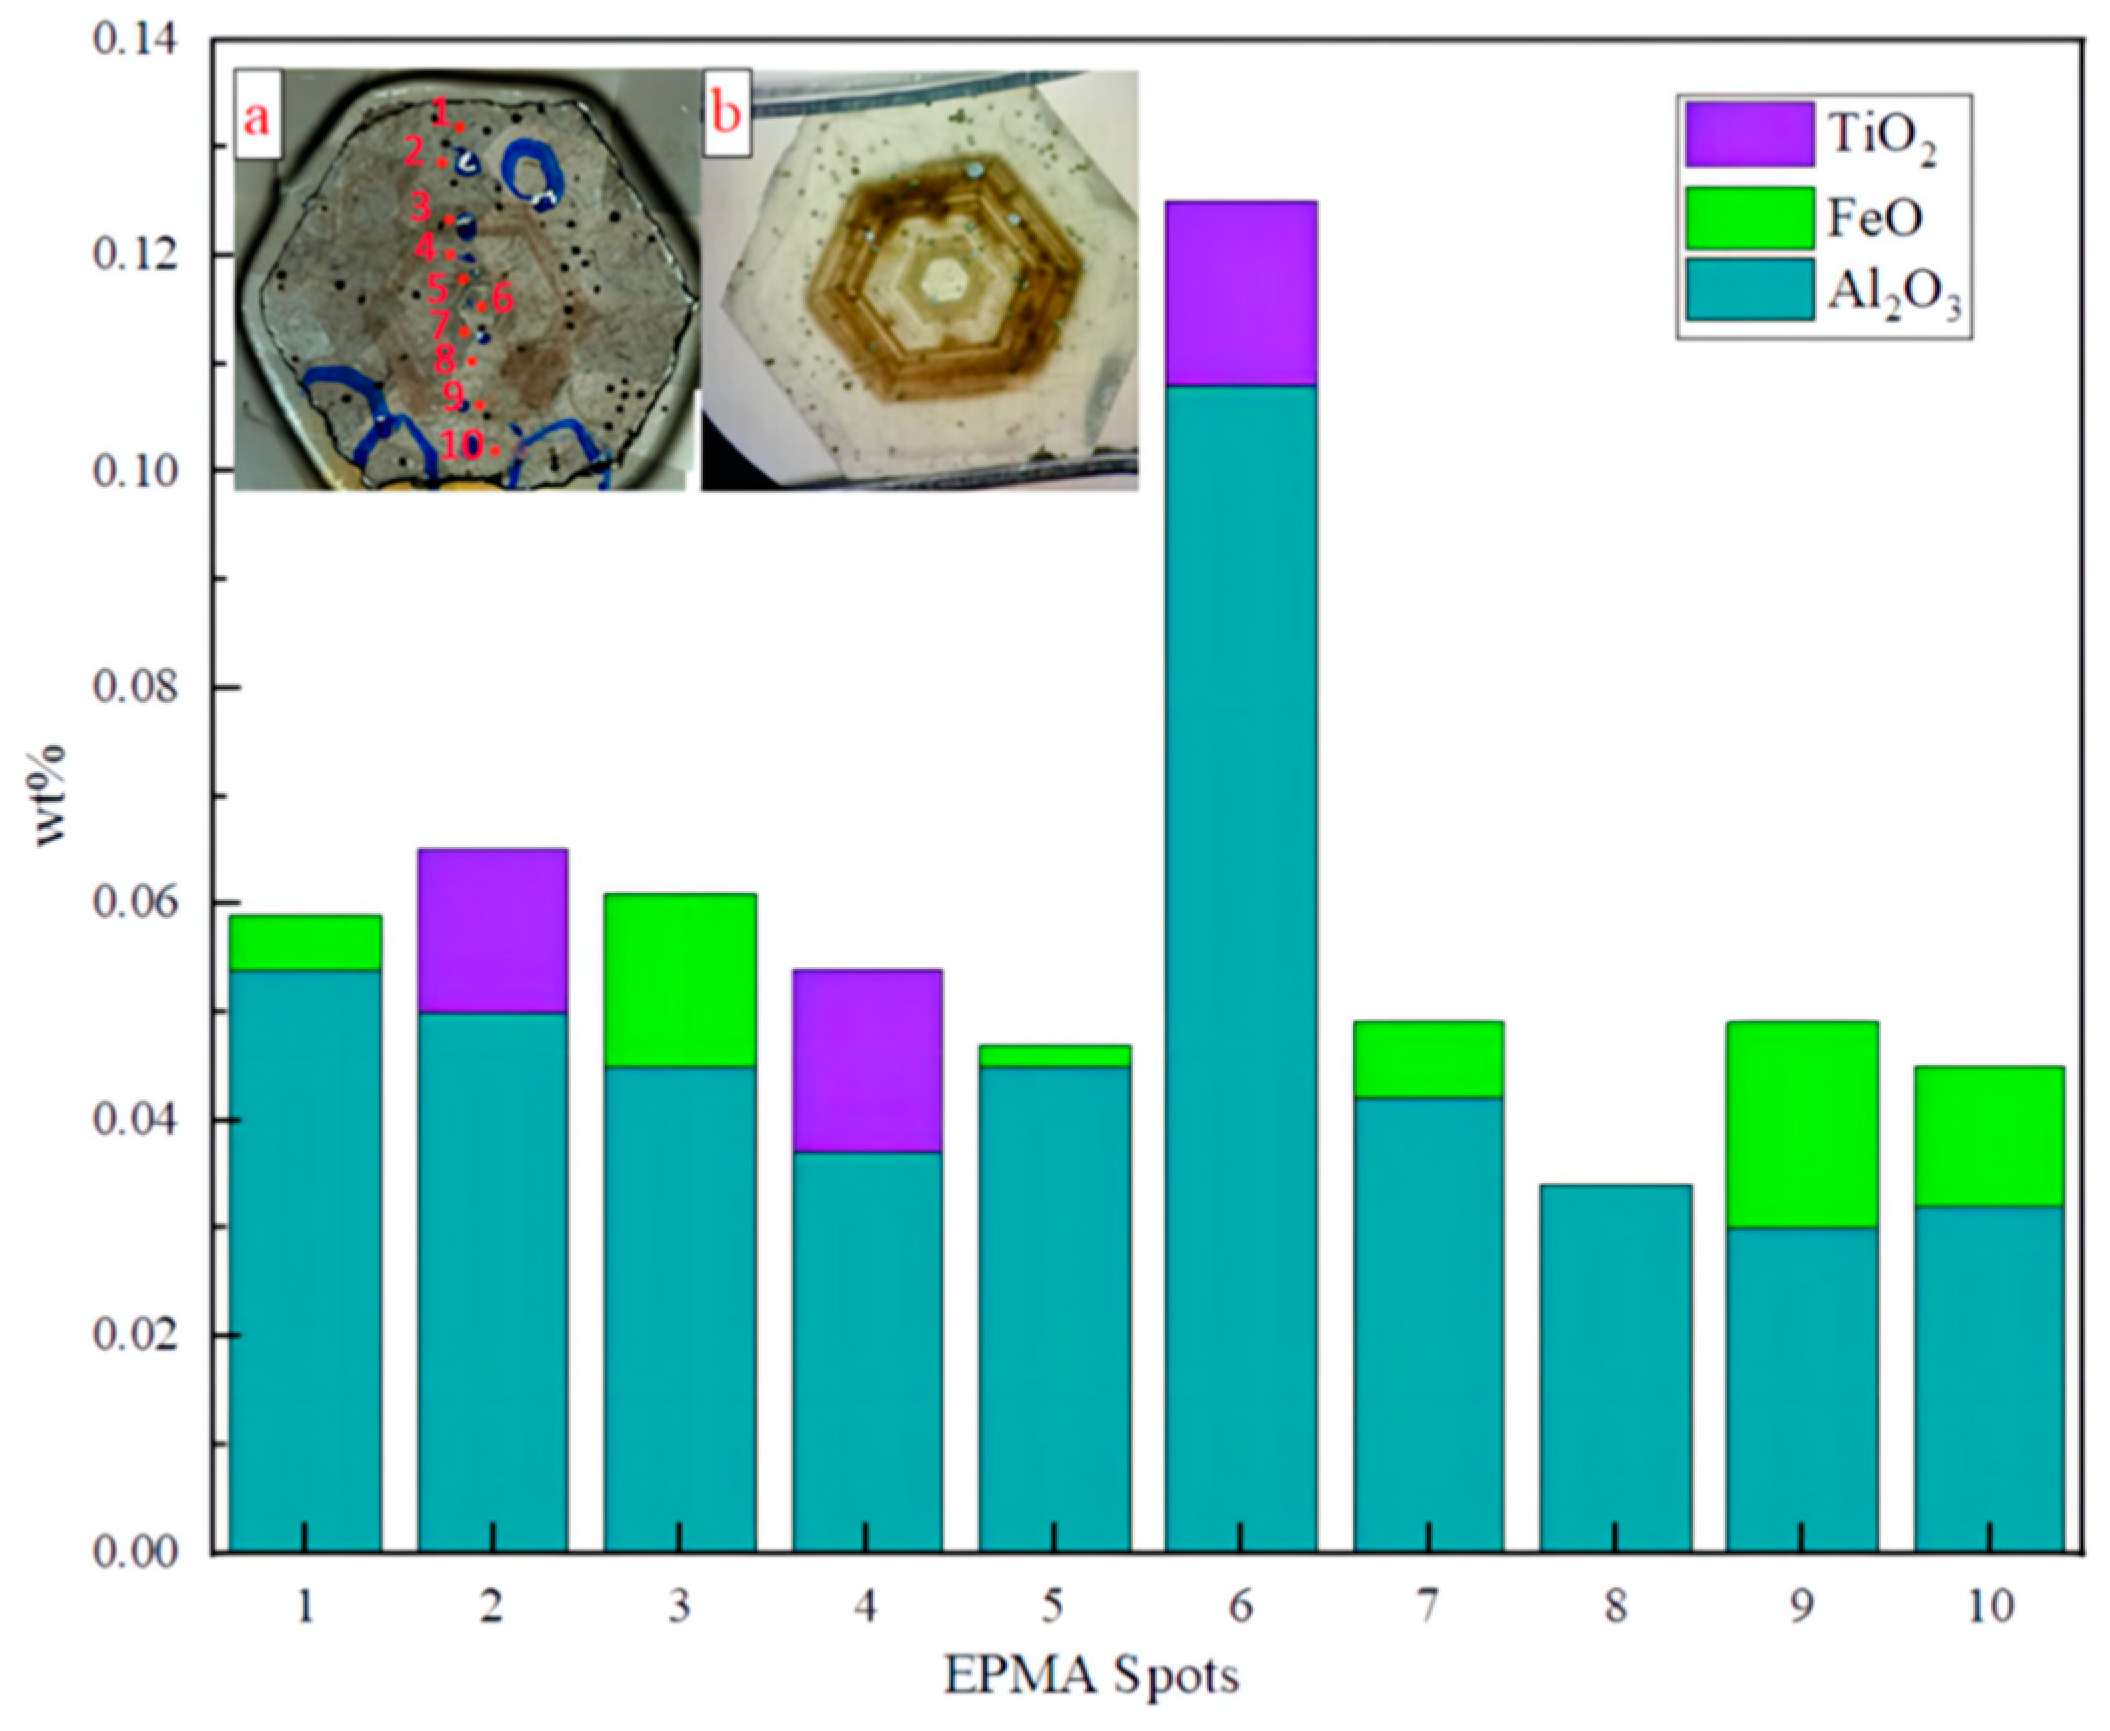
EPMA spot analyses are performed on different points (1 to 10), corresponding to the position that appears in the inset of Figure 5. It is obvious that contents of Al2O3, FeO, and TiO2 are more closely aligned with color zones (Table 1). Their detailed contents are illustrated in Figure 5. Most points of Fe content are below the 86 ppm detection limit. The concentrations of Al and Ti were above the 20 ppm and 100 ppm, respectively. The average concentrations in Al2O3, FeO, and TiO2 are 477 ppm, 160 ppm, and 163 ppm, respectively. This reveals Al2O3 is present at a higher concentration than FeO and TiO2, which agrees well with what was observed by Ruffini et al. [39]. The high TiO2 contents without FeO are distributed in the lighter color zones (Figure 5), which coincide with the deeper blue-purple color in CL image (Figure 3n). There are two abnormal points, point 1 and point 10, which are in a lighter color region and contain FeO without TiO2 content. This may be caused by the distribution of fibrous and spherical inclusions, which contain a large amount of FeO. Quartz crystals are formed later than these inclusions. Therefore, a small amount of FeO in these inclusions enters the light color region during the growth of quartz crystal due to differences in the elements’ concentration. The content of Al2O3 in point 6 is much higher than that at other points, which may be caused by residual polishing powder.
Many authors have used the Ti4+ content in quartz to calculate the formation temperature of magmatic quartz [40,41]. The expression of Titani Q is as follows:
where CTi is the content of Ti in quartz (10−6) and αTio2 is the activity of TiO2 relative to rutile in quartz (the activity of rutile is 1) [42]. If αTio2 is taken as 1, the calculated temperatures are 756 °C, 772 °C, and 772 °C (corresponding to the temperature of points 2, 4, and 6, respectively), with an average temperature of 766 °C, which represents a high crystallization temperature and agrees with their pegmatite origin.
3.5. Scanning Electron Microscopy and Energy Dispersive X-ray Spectroscopy
3.5.1. SEM of Fibrous and Spherical Inclusions
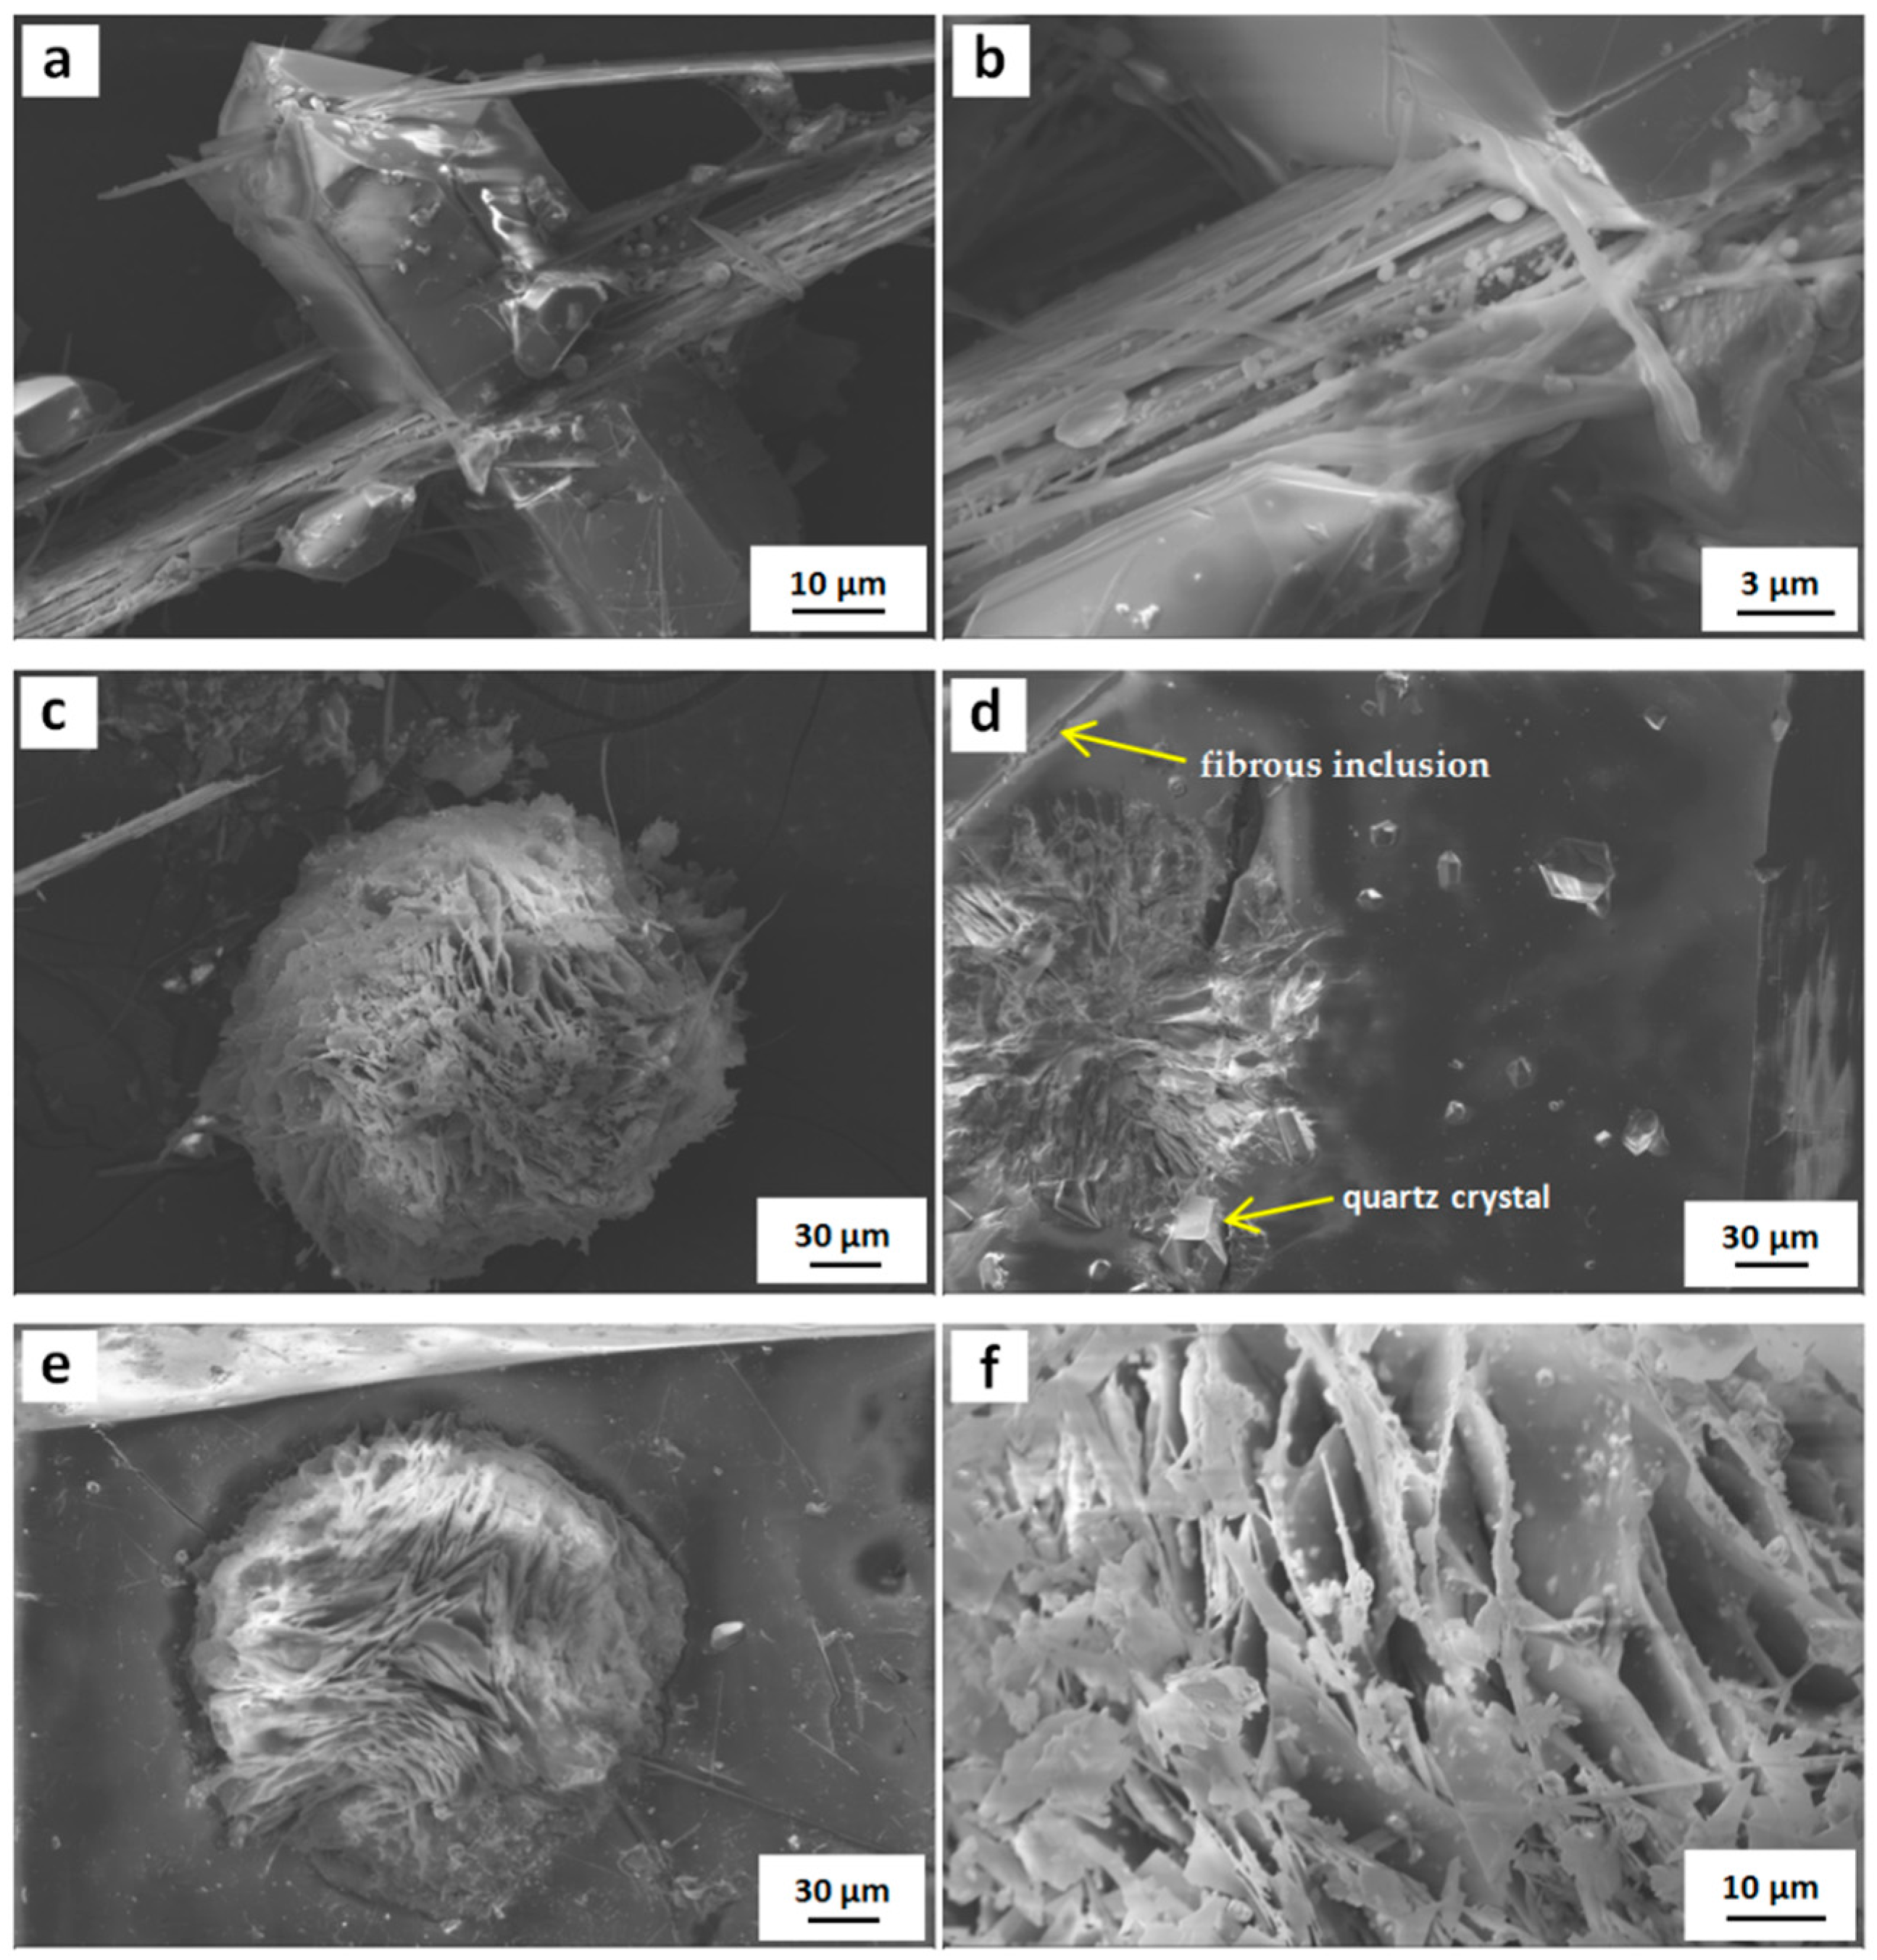
Fibrous inclusions exfoliated from crystal surface were observed under SEM. It can be clearly seen that fibrous inclusions are bundles of fibers, each of which is composed of many individual fibers (Figure 6a,b). Several fibrous inclusions penetrate the long quartz column (Figure 6a). This phenomenon may be attributed to the initial nucleation of quartz, of which the nucleus is located on the fibrous inclusion with the c-axis perpendicular to them. When quartz begin to grow, its crystal wraps the fibrous inclusions. If the c-axis of the nucleus is parallel to the fibrous, the quartz will grow with a longitudinal direction along the fibrous inclusions (Figure 6a,b).
Three spherical inclusions, qbd1, qbd2, and qbd3, stripped from different crystal surfaces, were also magnified under SEM. Remarkably, the spherical inclusions are aggregates of flaky minerals (Figure 6c–f) and have different microstructures. Spherical inclusion in qbd1 has more obvious hexagonal outline than that in qbd3 (Figure 6c,e). The quartz inclusions in qbd2 are surrounded by flaky minerals of the spherical inclusions and the latter is penetrated by fibrous inclusion (Figure 6d). Flaky minerals in the center of qbd3 spherical inclusion has more obvious triangular structure than the edges (Figure 6e). There are also many small particle minerals attached to those flaky ones (Figure 6f).
3.5.2. EDX Analysis of Spherical Inclusions
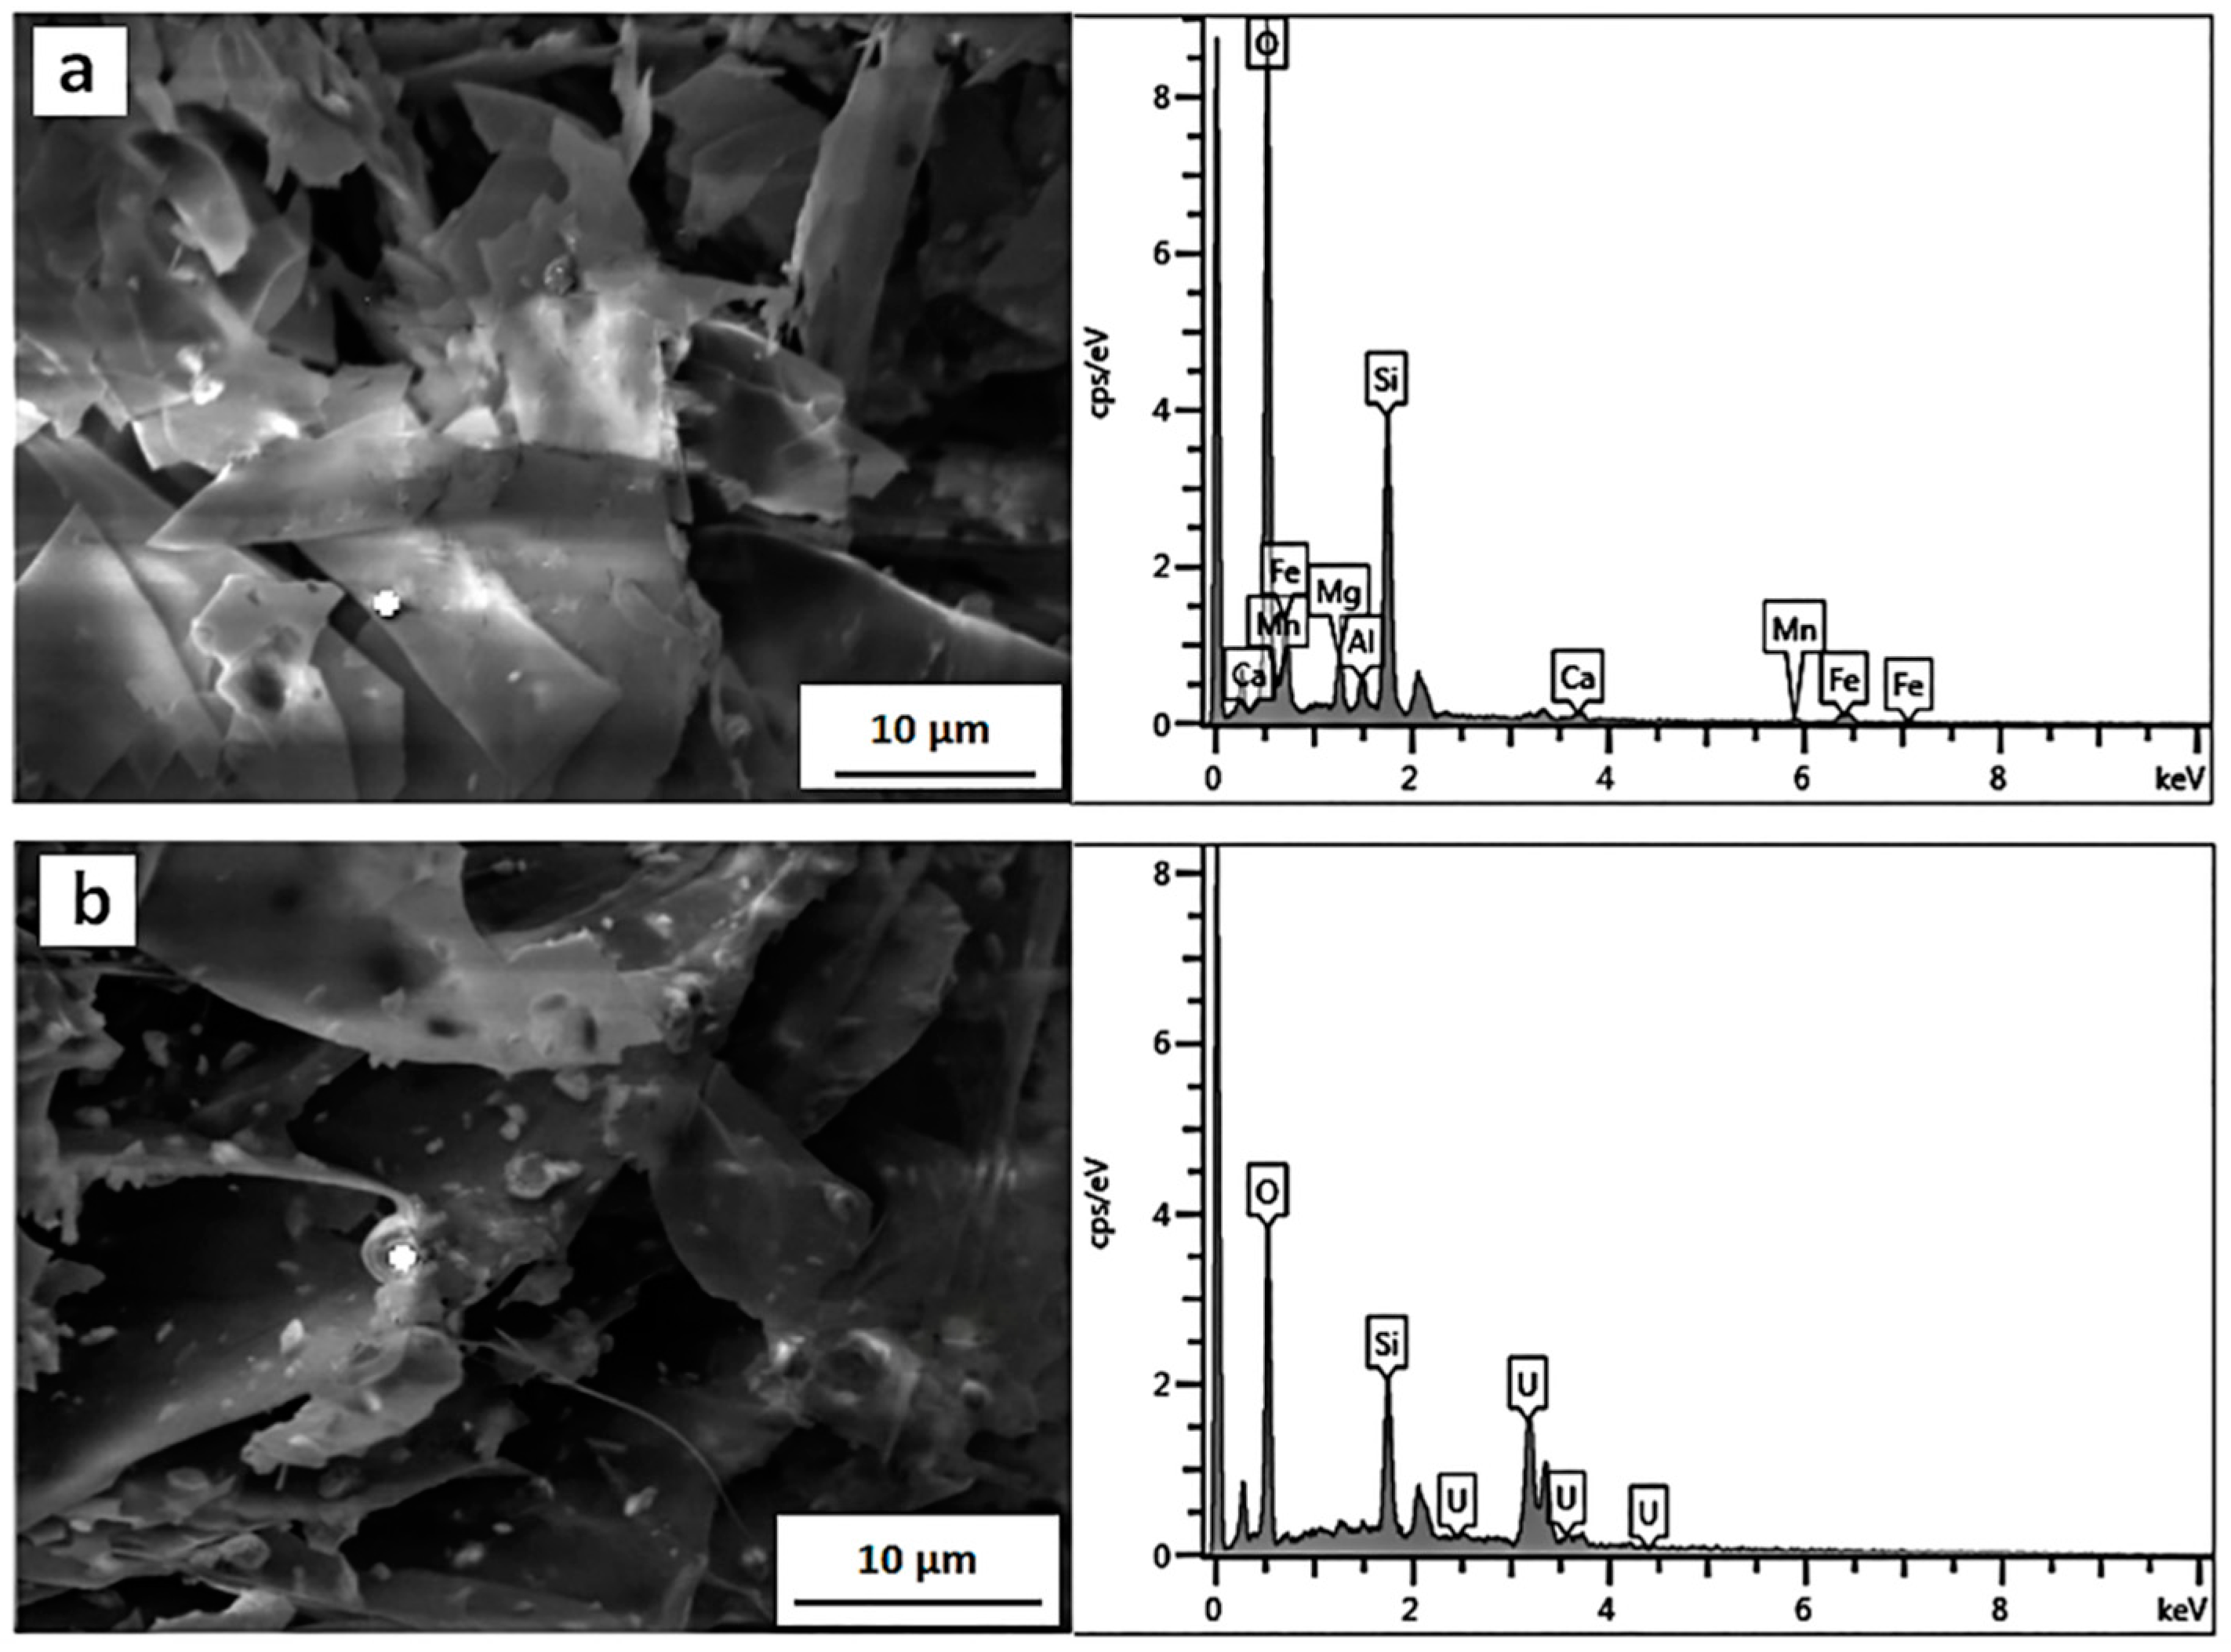
EDX of spherical inclusions was performed under SEM. EDX results of those flaky minerals reveal that they are composed of O, Si, Fe, Mn, Mg, Al, and Ca elements (Figure 7a), which is basically in accordance with the chemical composition of iron oxide. The relatively high Si content may come from quartz. It is found that the main elements of the particle minerals are U, O, and Si (Figure 7b). Because the particles are distributed on the flaky minerals’ surface, it is suspected that they are related to the geological environment, where uranium-molybdenum deposits had been found [43].
3.6. Raman Spectra
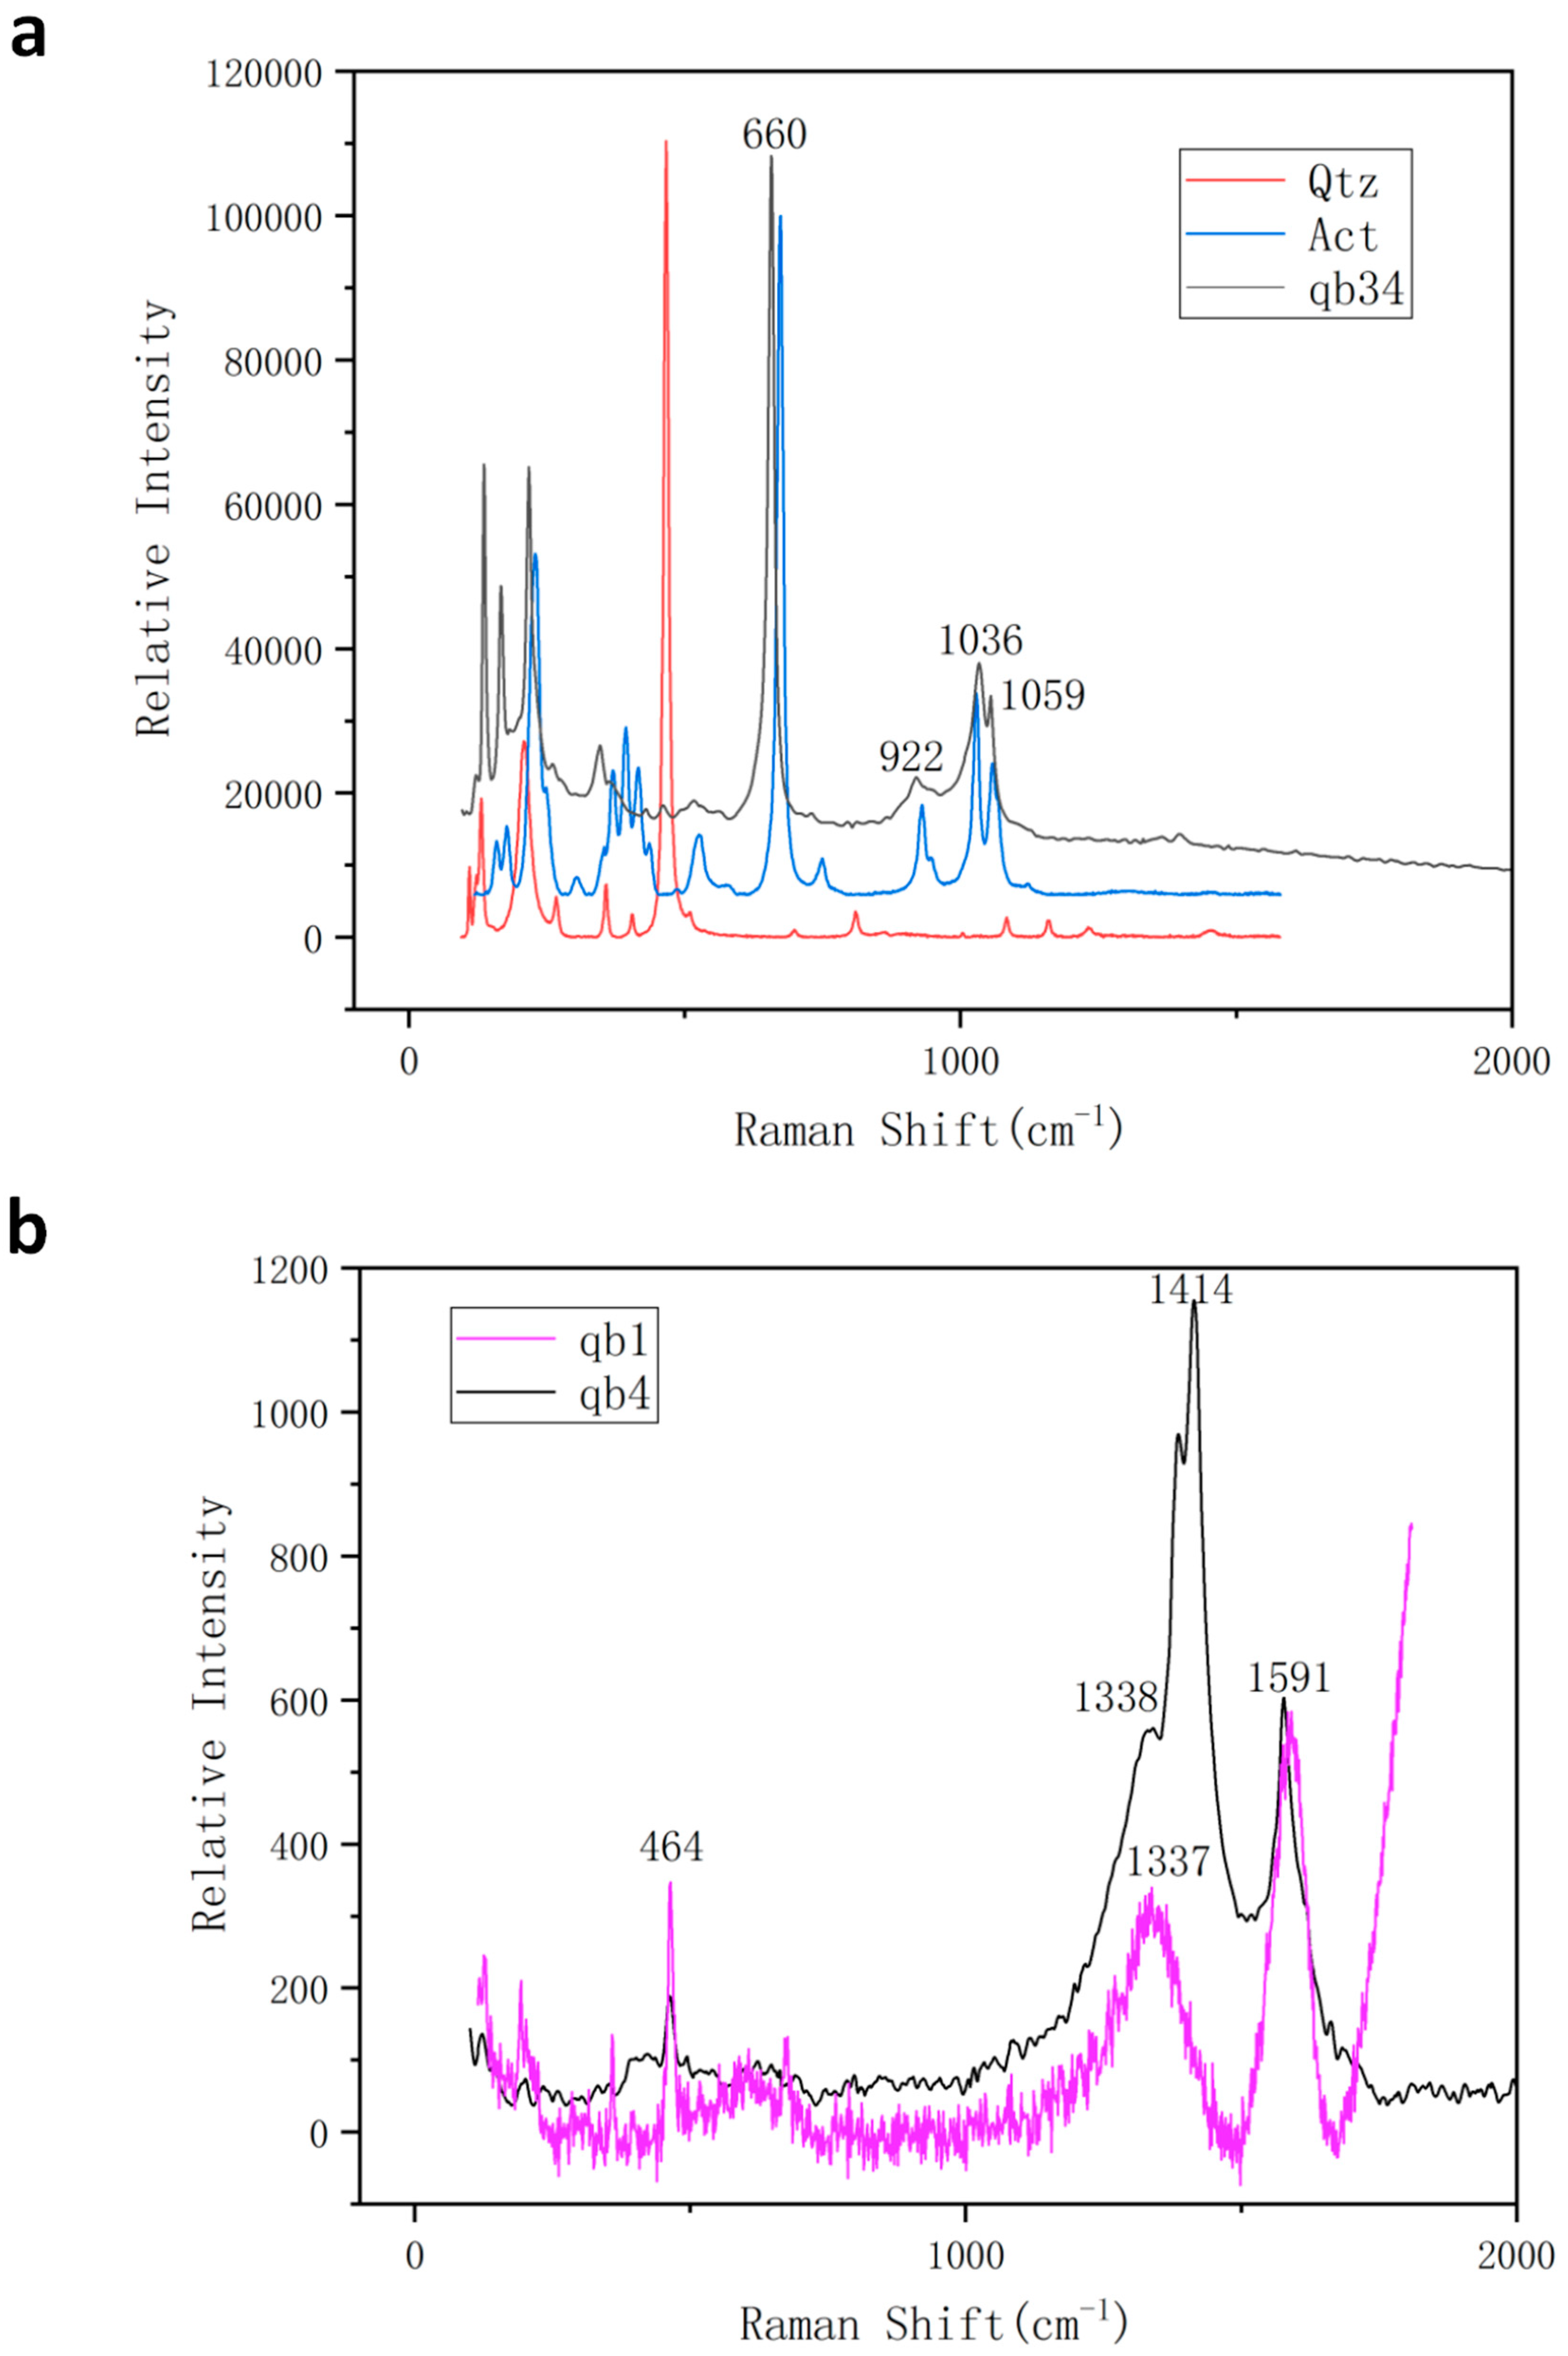
Raman spectra of fibrous inclusions were illustrated in Figure 8a. The characteristic peaks of actinolite are located at 221 cm−1, 660 cm−1, 922 cm−1, 1036 cm−1, and 1056 cm−1. Raman shifts at 221 cm−1 and 660 cm−1 are, respectively, caused by the lattice vibration of [SiO4] tetrahedra and the symmetric stretching vibration of Si-O-Si. Peaks at 922 cm−1, 1036 cm−1, and 1056 cm-1 are due to the antisymmetric stretching vibration of Si-O bonds [44]. Raman spectra of fibrous inclusions in qb34 section are in good agreement with the spectra of actinolite (RRUFFID: R040063), and do not coincide with those of quartz (RRUFF ID: R040031). Therefore, Raman results also confirm that these fibrous inclusions are actinolite, which were earlier determined by EPMA results.
Raman results of spherical inclusions in qb1 and qb4 are shown in Figure 8b. Because the surface of spherical inclusions is not flat, the intensities of some peaks are weaker and spectral line is rougher. It can be seen that both samples have 464 cm−1, 1337 cm−1, and 1591 cm−1 Raman shifts. However, the strongest Raman shift around 1414 cm−1 in qb1 is not obvious in the qb4 sample. According to previous reviews [45,46], the peaks are related to iron oxides, with the main bands at 464 cm−1 being assigned to the anti-shearing and shearing vibrations of single-bridging oxygen. The wide peak at 1300 cm−1 is a high-temperature Raman spectrum of iron oxide. The above analysis shows that the spherical inclusions are iron oxides, which coincide with the highest FeO content in EPMA.
4. Conclusions
Four trapiche-like quartz from Huanggangliang area are studied. Trapiche-like quartz is a single crystal and reveals a distinct core and six fixed radial dark bands. According to magnification and EPMA results, it can be deduced that trapiche-like patterns in quartz samples are caused by the color zones. Combined with the CL results, the color zones are attributed to the different distribution of TiO2 and FeO contents. According to the TiO2 content from EPMA, it was calculated that the average formation temperature of quartz samples is 766 °C, which is in good agreement with their crystal shapes and pegmatite origin.
Besides color zones, gas-liquid inclusions, fibrous inclusions, and spherical inclusions can be observed in quartz crystals. Gas-liquid inclusions are mainly distributed in the hexagonal color band. Fibrous inclusions are ferro-actinolite according to their EPMA data and Raman spectra, with calculated chemical formula (Na+0.060K+0.029Ca2+1.488)1.577(Mg2+0.315Fe2+1.927Mn2+0.261Ni2+0.001Al3+0.193Fe3+1.540Ti4+0.003Cr3+0.001)4.061[Si4.090O11]2(OH)2. Spherical inclusions are iron oxide, which have color zones on their cross section and are composed of many flaky minerals in the SEM images.
Combined with the position and complicated relationship among inclusions, it is obvious that fibrous inclusions were formed first, while spherical inclusions were formed later than fibrous inclusions but earlier than crystals. Both fibrous and spherical inclusions are determined as preformed inclusions.
Author Contributions
Conceptualization, Z.C. and Y.L; methodology, Z.C. and Y.L; validation, L.J., Z.C. and Y.L.; formal analysis, L.J. and Z.C.; investigation, Z.C.; resources, Z.C.; data curation, L.J.; writing—original draft preparation, L.J.; writing—review and editing, Y.L.; visualization, L.J. All authors have read and agreed to the published version of the manuscript.
Funding
This research was funded by Y.L. of the Fundamental Research Funds for the Central Universities, grant number 35832017033.
Institutional Review Board Statement
Not applicable.
Informed Consent Statement
Not applicable.
Data Availability Statement
The data presented in this study are available within the article.
Acknowledgments
We gratefully acknowledge the financial supports by Y.L. of the Fundamental Research Funds for the Central Universities under Grant number35832017033. We thank Ye Yuan and all the assistant management students of the Gem Testing Laboratory at the school of Gemmology, CUGB, for their help and support in the experiments and other aspects. Our thanks are also given to Di Zhang of the Electron Probe and Scanning Electron Microscope Laboratory of the Institute of Geology and Geophysics, Chinese Academy of Sciences (CAS) for his guidance in the electron probe experiments.
Conflicts of Interest
The authors declare no conflict of interest.
References
- Bertrand, E. Compte-rendu de la séance du 13 Février 1879. Bull. Société Française Minéralogie Crystallogr. 1879, 2, 31. [Google Scholar]
- Bergt, W. Die älteren Massengesteine, Kristalli nen Schieferund Sedimente. Ph.D. Dissertation, Verlag von Asher & Company, Berlin, Germany, 1899; pp. 199–221. [Google Scholar]
- Codazzi, R.L. Los Minerales de Muzo. Contribución al Estu dio de los Minerales de Colombia; Imprenta de la Cruzada: Bogotá, Colombia, 1915; pp. 3–7. [Google Scholar]
- Pogue, J.E. The emerald deposits of Muzo, Colombia. Trans. Am. Inst. Min. Eng. 1916, 55, 383–406. [Google Scholar]
- Bernauer, F. (Ed.) Las Llamadas Maclas Multiples de Esmeralda de Muzo y sus Anomalias Opticas; Compilación de los Estudios Geológicos Oficiales en Colombia-1917 a 1933; Imprenta Nacional: Bogotá, Colombia, 1933; pp. 199–221. [Google Scholar]
- McKague, H.L. Trapiche emeralds from Colombia. Gems Gemol. 1964, 11, 210–223. [Google Scholar]
- Müllenmeister, H.J.; Zang, J. Ein Trapiche-Rubin aus Myanmar (Burma). Lapis 1995, 20, 50. [Google Scholar]
- Henn, U.; Bank, H. Trapicheartige Korunde aus Myanmar. Gemmologie. Z. Dtsch. Gemmol. Ges. 1996, 42, 23–24. [Google Scholar]
- Schmetzer, K.; Hänni, H.A.; Bernhardt, H.J.; Schwarz, D. Trapiche rubies. Gems Gemol. 1996, 32, 242–250. [Google Scholar] [CrossRef] [Green Version]
- Schmetzer, K.; Beili, Z.; Yan, G.; Bernhardt, H.J. Element mapping of trapiche rubies. J. Gemmol. 1998, 26, 289–301. [Google Scholar] [CrossRef]
- Sunagawa, I.; Bernhardt, H.J.; Schmetzer, K. Texture formation and element partitioning in trapiche ruby. J. Cryst. Growth 1999, 206, 322–330. [Google Scholar] [CrossRef]
- Garnier, V.; Ohnenstetter, D.; Giuliani, G.; Blanc, P.; Schwarz, D. Trace-element contents and cathodoluminescence of “trapiche” rubies from Mong Hsu, Myanmar (Burma): Geological significance. Miner. Petrol. 2002, 76, 179–193. [Google Scholar] [CrossRef]
- Win, K.K. Trapiche of Myanmar. Aust. Gemmol. 2005, 22, 269–270. [Google Scholar]
- Koivula, J.I.; Kammerling, R.C.; Fritsch, E. Gem news: “Trapiche” purple-pink sapphire. Gems Gemol. 1994, 30, 197. [Google Scholar]
- Beaton, D. Lab Notes: A rare yellow trapiche sapphire. Gems Gemol. 2008, 44, 259–260. [Google Scholar]
- Khotchanin, K.; Thanasuthipitak, K.; Thanasuthipitak, T. The structure and chemical composition of trapiche blue sapphire from Southern Vietnam and Cambodia. J. Gemmol. Assoc. Hong Kong 2009, 30, 25–35. [Google Scholar]
- Kiefert, L. Unusual trapiche sapphire. Gems Gemol. 2012, 48, 229. [Google Scholar]
- Hainschwang, T.; Notari, F.; Anckar, B. Trapiche tourmaline from Zambia. Gems Gemol. 2007, 43, 36–46. [Google Scholar] [CrossRef]
- Schmetzer, K.; Bernhardt, H.J.; Hainschwang, T. Chemical and growth zoning in trapiche tourmaline from Zambia—A re-evaluation. J. Gemmol. 2011, 32, 151–173. [Google Scholar] [CrossRef]
- Krzemincki, M.S.; Laurs, B.M. Quartz with Radiating Fibres, sold as ‘Trapiche’ Quartz. J. Gemmol. 2014, 34, 296–298. [Google Scholar]
- Beaton, D. African rhodochrosite and Colombian quartz with trapiche patterns. Gems Gemol. 2016, 52, 218. [Google Scholar]
- Sun, Z.Y.; Muyal, J.; Hand, D. Trapiche-like amethyst from Brazil. Gems Gemol. 2018, 54, 237–238. [Google Scholar]
- Farfan, G.; Rakovan, J.; Ackerson, M.; Andrews, B.; Post, J. The origin of trapiche-like inclusion patterns in quartz from Inner Mongolia, China. Am. Mineral. 2021, 106, 1797–1808. [Google Scholar] [CrossRef]
- Pignatelli, I.; Giuliani, G.; Ohnenstetter, D.; Agrosi, G.; Mathieu, S.; Morlot, C.; Branquet, Y. Colombian Trapiche Emeralds: Recent Advances in Understanding Their Formation. Gems Gemol. 2015, 51, 222–259. [Google Scholar] [CrossRef]
- Garnier, V.; Ohnenstetter, D.; Giuliani, G.; Schwarz, D. Rubis trapiches de Mong Hsu, Myanmar. Rev. Gemmol. AFG 2002, 144, 5–12. [Google Scholar]
- Koivula, J.I. Gem News International: Two unusual aquamarines. Gems Gemol. 2008, 44, 275–276. [Google Scholar]
- Befi, R. Gem News International: Trapiche aquamarine fromNamibia. Gems Gemol. 2012, 48, 143–144. [Google Scholar]
- Masayuki, K.; Mutsumi, K.; Mikuni, H.; Ritsuro, M.; Hiroyuki, K.; Hiroyuki, I.; Toshiro, N. Kinetic roughening of tapered quartz and formation of trapiche quartz from Goyomatsu mine, Nara prefecture. Hist. Caribe 2016, 32, 41. [Google Scholar] [CrossRef]
- Wang, X.D.; Song, Y.J. A special type of trapiche quartz. Gems Gemol. 2019, 55, 285–286. [Google Scholar]
- Zinkernagel, U.S. Cathodoluminescence of Quartz and Its Application to Sandstone Petrology. Sedimentology 1980, 27, 235–236. [Google Scholar]
- Boiron, M.; Essarraj, S.; Sellier, E.; Cathelineau, M.; Lespinasse, M.; Poty, B. Identification of fluid inclusions in relation to their host microstructural domains in quartz by cathodoluminescence. Geochim. Cosmochim. Acta 1992, 56, 175–185. [Google Scholar] [CrossRef]
- Götze, J.; Plötze, M.; Habermann, D. Cathodoluminescence (CL) of quartz: Origin, spectral characteristics and practical applications. Mineral Petrol. Mineral. Petrol. 2001, 71, 225–250. [Google Scholar] [CrossRef]
- Rusk, B. Cathodoluminescent Textures and Trace Elements in Hydrothermal Quartz. In Quartz: Deposits, Mineralogy and Analytics; Springer Geology: Berlin/Heidelberg, Germany, 2012; pp. 307–329. [Google Scholar]
- Yu, X.Y. Colored Gemmology, 2nd ed.; Geological Publishing House: Beijing, China, 2009; pp. 144–151. [Google Scholar]
- Zhang, L.J.; Rao, J.; Zhang, C.L.; Ruan, Q.F.; Lei, W.; Liao, B.L.; He, T. Study on the Crystal Morphologies of Quartz Crystals of Different Genetic Types. Acta Mineral. Sin. 2008, 294–298. [Google Scholar] [CrossRef]
- Li, Y.Q.; She, Z.B.; Ma, C.Q. SEM-CL Analysis of Quartz and Its Application in Petrology. Adv. Earth Sci. 2011, 26, 325–331. [Google Scholar] [CrossRef]
- Li, S.R. Crystallography and Mineralogy; Geological Publishing House: Beijing, China, 2008; p. 232. [Google Scholar]
- Chen, X.J. Study on Color Mechanism and Testing Technology of Rock Crystal. Master’s Dissertation, East China University of Science and Technology, Shanghai, China, 2011. [Google Scholar]
- Ruffini, R.; Borghi, A.; Cossio, R.; Olmi, F.; Vaggelli, G. Volcanic Quartz Growth Zoning Identified by Cathodoluminescence and EPMA Studies. Mikrochim. Acta 2002, 139. [Google Scholar] [CrossRef]
- Wark, D.A.; Hildreth, W.; Spear, F.S.; Cherniak, D.; Watson, E. Pre-eruption recharge of the Bishop magma system. Geology 2007, 35, 235–238. [Google Scholar] [CrossRef]
- Wiebe, R.A.; Wark, D.A.; Hawkins, D.P. Insights from quartz cathodoluminescence zoning into crystallization of Vinalhaven granite, Coastal Mine. Contrib. Mineral. Petrol. 2007, 154, 439–453. [Google Scholar] [CrossRef]
- Wark, D.A.; Watson, E.B. Titani Q: A titanium-in-quartz geothermometer. Contrib. Mineral. Petrol. 2006, 152, 743–752. [Google Scholar] [CrossRef]
- Ji, H.W.; Li, Z.Y.; Zhang, C. Study on ore-controlling structure of uranium-molybdenum deposit in Hongshan, Hexigten County, Inner Mongolia, China. Geol. Rev. 2015, 61, 321–322. [Google Scholar]
- Li, K.; Shen, X.P. Research on Identification Characteristics of Tremolite and Actinolite by Using Nondestructive Testing Techniques of Infrared Spectroscopy and Raman Spectroscopy. Bull. Mineral. Petrol. Geochem. 2019, 38, 405–408. [Google Scholar]
- Gong, X.Y.; You, J.L.; Wang, J.; Liming, L. Simulated and Experimental Raman Spectroscopic Studies on the Micro-Structure of Several Iron Compounds. Spectrosc. Spectr. Anal. 2018, 38, 241–242. [Google Scholar]
- Gong, X.Y.; You, J.L.; Wang, J.; Liming, L.; Wan, S.M. High temperature in situ Raman Spectroscopic Studies of Several Iron Compounds. In Proceedings of the CNCLS 20, Suzhou, China, 3–5 November 2019; p. 144. [Google Scholar]
Figure 1.
Quartz samples from Huanggangliang area.

Figure 2.
Magnified pictures of samples. (a) Black core of sample qb1. (b) Hexagonal bands of the trapiche pattern in qb3.
Figure 2.
Magnified pictures of samples. (a) Black core of sample qb1. (b) Hexagonal bands of the trapiche pattern in qb3.

Figure 3.
Microscopy images and CL image of samples. (a) Color zones in cross section of sample qb3; (b) Dumbbell-shaped longitudinal section of sample qb4; (c) Distribution of fluid inclusions in the core (in the red hexagon) (qb32); (d) Fluid inclusions in the hexagonal color zones of qb32; (e) Fibrous inclusions of qb32 randomly distributed in crystals; (f) Intercalation of spherical and fibrous inclusions in qb3; (g) Rhombic cross section of fibrous inclusion in qb3; (h) Green fibrous inclusion of qb3; (i) Randomly scattered spherical inclusions (qb32); (j) Spherical inclusions exposed by slicing; (k) Earthy luster and nearly opaque transparency of spherical inclusions; (l) Clustered spherical inclusions of qb1; (m) The oxidized cross-section of spherical inclusion in qb2; (n) CL image of qb32.

Figure 4.
Locations of points where EPMA was performed. (a) Electron probe location 11 and 12 in fibrous inclusion; (b) Electron probe location 13 in fibrous inclusion; (c) EPMA points 14 and 15 in spherical inclusion; (d) EPMA points 16–19 in spherical inclusion.
Figure 4.
Locations of points where EPMA was performed. (a) Electron probe location 11 and 12 in fibrous inclusion; (b) Electron probe location 13 in fibrous inclusion; (c) EPMA points 14 and 15 in spherical inclusion; (d) EPMA points 16–19 in spherical inclusion.

Figure 5.
Histogram of TiO2, FeO, and Al2O3 contents in ten EPMA points. Inset (a) is detailed locations of ten EPMA points; inset (b) give the legible photo of color zones under the transmitted light.
Figure 5.
Histogram of TiO2, FeO, and Al2O3 contents in ten EPMA points. Inset (a) is detailed locations of ten EPMA points; inset (b) give the legible photo of color zones under the transmitted light.

Figure 6.
SEM images of fibrous and spherical inclusions. (a) Intercalation of fibrous inclusions and quartz; (b) Fibrous inclusions with floating smaller quartz; (c) Spherical inclusion of qbd1: slightly hexagonal outline; (d) Complicated relationship among quartz, spherical inclusion, and fibrous inclusion in qbd2; (e) Spherical inclusion of qbd3; (f) Particles attached to spherical inclusions.

Figure 7.
SEM images and EDX data of spherical inclusions of spherical inclusions. (a) EDX data of flaky material; (b) EDX data of particle minerals on spherical inclusions.
Figure 7.
SEM images and EDX data of spherical inclusions of spherical inclusions. (a) EDX data of flaky material; (b) EDX data of particle minerals on spherical inclusions.

Figure 8.
Raman spectra of the samples. (a) Raman spectra of the qb34 fibrous inclusion, compared with spectra of actinolite (RRUFF ID: R040063) and quartz (RRUFF ID: R040031); (b) Raman spectra of spherical inclusions in qb1 and qb4.
Figure 8.
Raman spectra of the samples. (a) Raman spectra of the qb34 fibrous inclusion, compared with spectra of actinolite (RRUFF ID: R040063) and quartz (RRUFF ID: R040031); (b) Raman spectra of spherical inclusions in qb1 and qb4.


Table 1.
Chemical compositions of color zones, fibrous inclusions, and spherical inclusions, obtained by EPMA (wt.%).
Table 1.
Chemical compositions of color zones, fibrous inclusions, and spherical inclusions, obtained by EPMA (wt.%).
| Items | No. | Na2O | SiO2 | F | Cr2O3 | K2O | MgO | MnO | Cl | CaO | Al2O3 | FeO | TiO2 | NiO | Total |
|---|---|---|---|---|---|---|---|---|---|---|---|---|---|---|---|
| color zones | 1 | 0.041 | 99.351 | - | 0.007 | 0.019 | 0.021 | 0.022 | - | 0.014 | 0.054 | - | - | - | 99.534 |
| 2 | 0.007 | 99.517 | - | - | 0.003 | - | - | - | 0.003 | 0.050 | - | 0.015 | 0.015 | 99.610 | |
| 3 | 0.022 | 99.277 | - | 0.019 | 0.003 | 0.006 | 0.015 | - | - | 0.045 | 0.016 | - | - | 99.403 | |
| 4 | 0.001 | 100.060 | - | - | 0.004 | 0.014 | - | - | 0.009 | 0.037 | - | 0.017 | 0.029 | 100.171 | |
| 5 | 0.007 | 99.429 | - | 0.006 | 0.012 | - | - | - | - | 0.045 | - | - | - | 99.501 | |
| 6 | 0.013 | 99.400 | - | 0.008 | 0.015 | - | 0.005 | - | - | 0.108 | - | 0.017 | - | 99.566 | |
| 7 | 0.022 | 100.107 | - | - | 0.019 | - | 0.011 | - | - | 0.042 | - | - | 0.011 | 100.219 | |
| 8 | - | 99.209 | - | - | - | - | - | - | 0.018 | 0.034 | - | - | 0.014 | 99.275 | |
| 9 | 0.036 | 99.447 | - | - | 0.026 | 0.017 | - | - | 0.013 | 0.030 | 0.019 | - | - | 99.588 | |
| 10 | 0.055 | 99.152 | - | - | 0.019 | 0.006 | 0.001 | - | 0.006 | 0.032 | 0.013 | - | - | 99.284 | |
| fibrous inclusions | 11 | 0.160 | 57.140 | - | - | 0.130 | 0.910 | 2.550 | 0.020 | 9.110 | 0.650 | 27.360 | - | - | 98.010 |
| 12 | 0.270 | 53.510 | - | - | 0.210 | 2.420 | 1.230 | 0.030 | 10.100 | 1.610 | 28.700 | 0.058 | 0.013 | 98.140 | |
| 13 | 0.210 | 55.880 | - | 0.028 | 0.120 | 0.970 | 2.490 | 0.030 | 9.070 | 1.070 | 28.370 | 0.019 | - | 98.230 | |
| spherical inclusions | 14 | 0.460 | 10.440 | - | 0.192 | 0.210 | 0.830 | 0.650 | 0.210 | 0.600 | 0.970 | 58.550 | - | - | 73.070 |
| 15 | 0.100 | 5.950 | - | 0.045 | 0.060 | 0.300 | 0.360 | 0.190 | 0.370 | 0.250 | 65.640 | - | 0.042 | 73.250 | |
| 16 | 0.340 | 8.120 | - | 0.059 | 0.140 | 0.280 | 0.340 | 0.210 | 0.620 | 0.280 | 65.240 | 0.024 | 0.033 | 75.630 | |
| 17 | 0.280 | 9.850 | - | 0.041 | 0.340 | 0.450 | 0.440 | 0.200 | 0.560 | 0.490 | 63.760 | 0.012 | - | 76.370 | |
| 18 | 0.100 | 7.420 | - | 0.071 | 0.120 | 0.360 | 0.380 | 0.150 | 0.590 | 0.390 | 65.390 | - | 0.010 | 74.940 | |
| 19 | 0.320 | 13.520 | - | 0.353 | 0.450 | 1.270 | 1.080 | 0.110 | 0.480 | 1.570 | 56.300 | - | - | 75.430 |
(“-” represents below the detection limit).
Publisher’s Note: MDPI stays neutral with regard to jurisdictional claims in published maps and institutional affiliations. |
© 2022 by the authors. Licensee MDPI, Basel, Switzerland. This article is an open access article distributed under the terms and conditions of the Creative Commons Attribution (CC BY) license (https://creativecommons.org/licenses/by/4.0/).
Share and Cite
MDPI and ACS Style
Jiang, L.; Chen, Z.; Liu, Y. The Chemical Composition of Trapiche-like Quartz from Huanggangliang Area, Inner Mongolia, China. Crystals 2022, 12, 122. https://0-doi-org.brum.beds.ac.uk/10.3390/cryst12010122
AMA Style
Jiang L, Chen Z, Liu Y. The Chemical Composition of Trapiche-like Quartz from Huanggangliang Area, Inner Mongolia, China. Crystals. 2022; 12(1):122. https://0-doi-org.brum.beds.ac.uk/10.3390/cryst12010122
Chicago/Turabian StyleJiang, Ling, Zhu Chen, and Yingxin Liu. 2022. "The Chemical Composition of Trapiche-like Quartz from Huanggangliang Area, Inner Mongolia, China" Crystals 12, no. 1: 122. https://0-doi-org.brum.beds.ac.uk/10.3390/cryst12010122
Note that from the first issue of 2016, this journal uses article numbers instead of page numbers. See further details here.