1. Introduction
Brasses are Cu–Zn alloys that contain different amounts of zinc, which have considerable applications in various industrial areas due to their special physical and mechanical properties. For example, they possess high thermal conductivity, considerable corrosion resistance, and a good combination of mechanical performances such as tensile strength and ductility [
1]. It is notable that Zn plays the main role in determining the final properties of brasses, as it changes the microstructure at different concentrations. For example, at Zn < 37 wt. %, brasses only contain an α phase, which has a face-centered cubic (
FCC) crystallographic structure. On the other hand, at Zn > 37 wt. %, the ordered β phase with a body-centered cubic (
BCC) structure appears in brasses at room temperature, which causes an increase in strength. A disordered β phase transfers to an ordered β phase during equilibrium cooling at about 454 °C [
2].
According to the Cu–Zn binary phase diagram [
3] as shown in
Figure 1, after equilibrium cooling of a Cu-37 wt. % Zn alloy, the microstructure only contains the α phase. This is due to the fact that an ordered β phase cannot be formed from an α phase. Therefore, one way to produce a double-phase structure in a Cu-37 wt. % Zn alloy is a non-equilibrium heat treatment in which the brass must be heated within the α + β zone, and the subsequent quenching should be applied to stabilize the disordered β phase at room temperature. Recently, Heidarzadeh et al. [
2,
3,
4] used this technique to produce a double-phase structure in a Cu-37 wt. % Zn alloy before friction stir welding/processing (FSW/P). They showed that after FSW/FSP of α/disordered β brasses, novel composite structures such as nano and laminar composites can be produced.
Although in some studies, the α/disordered β brasses in Cu-37 wt. % Zn alloys have been friction stir welded/processed to produce novel structures, the fundamental information regarding the crystallographic orientation relationship between α and disordered β phases is lacking, which can help us to control the microstructure and final mechanical properties of such alloys. With this in mind, in this study, orientation imaging microscopy (OIM) was utilized to disclose the orientation relationship between α and disordered β phases after non-equilibrium heat treatment.
2. Materials and Methods
A single-phase brass plate containing 37 wt. % Zn with dimensions of 100 mm length × 100 mm width × 3 mm thickness was used as the base material in this study. To produce the disordered β phase in α matrix, the base material was heat treated as follows. First, the single-phase plate was heated at 800 °C in an electrical furnace for 1 h. Then, the heated plate was quenched in water at room temperature (25 °C). The microstructures of the single-phase and double-phase samples were investigated using optical microscopy (OM). For this aim, the samples were cut from the single-phase and double-phase plates. Then, the mechanical polishing and etching with a solution of 50 mL of HCl, 10 mL of H2O and 5 g of FeCl3 was employed at room temperature (25 °C). A Philips XL30 E-SEM field emission gun scanning electron microscope (SEM) with an electron backscattered diffraction (EBSD) system was used to analyze the orientation relationships between α and disordered β phases. The EBSD samples were electro-polished in 250 mL of H3PO4, 250 mL of ethanol, 50 mL of propanol, 500 mL of distilled water and 3 g of urea at 10 V and 25 °C. The EBSD scans were obtained using a step size of 100 nm. EBSD data were analyzed using TSL OIM software. Moreover, the phase identification was confirmed using X-ray diffraction (XRD).
3. Results
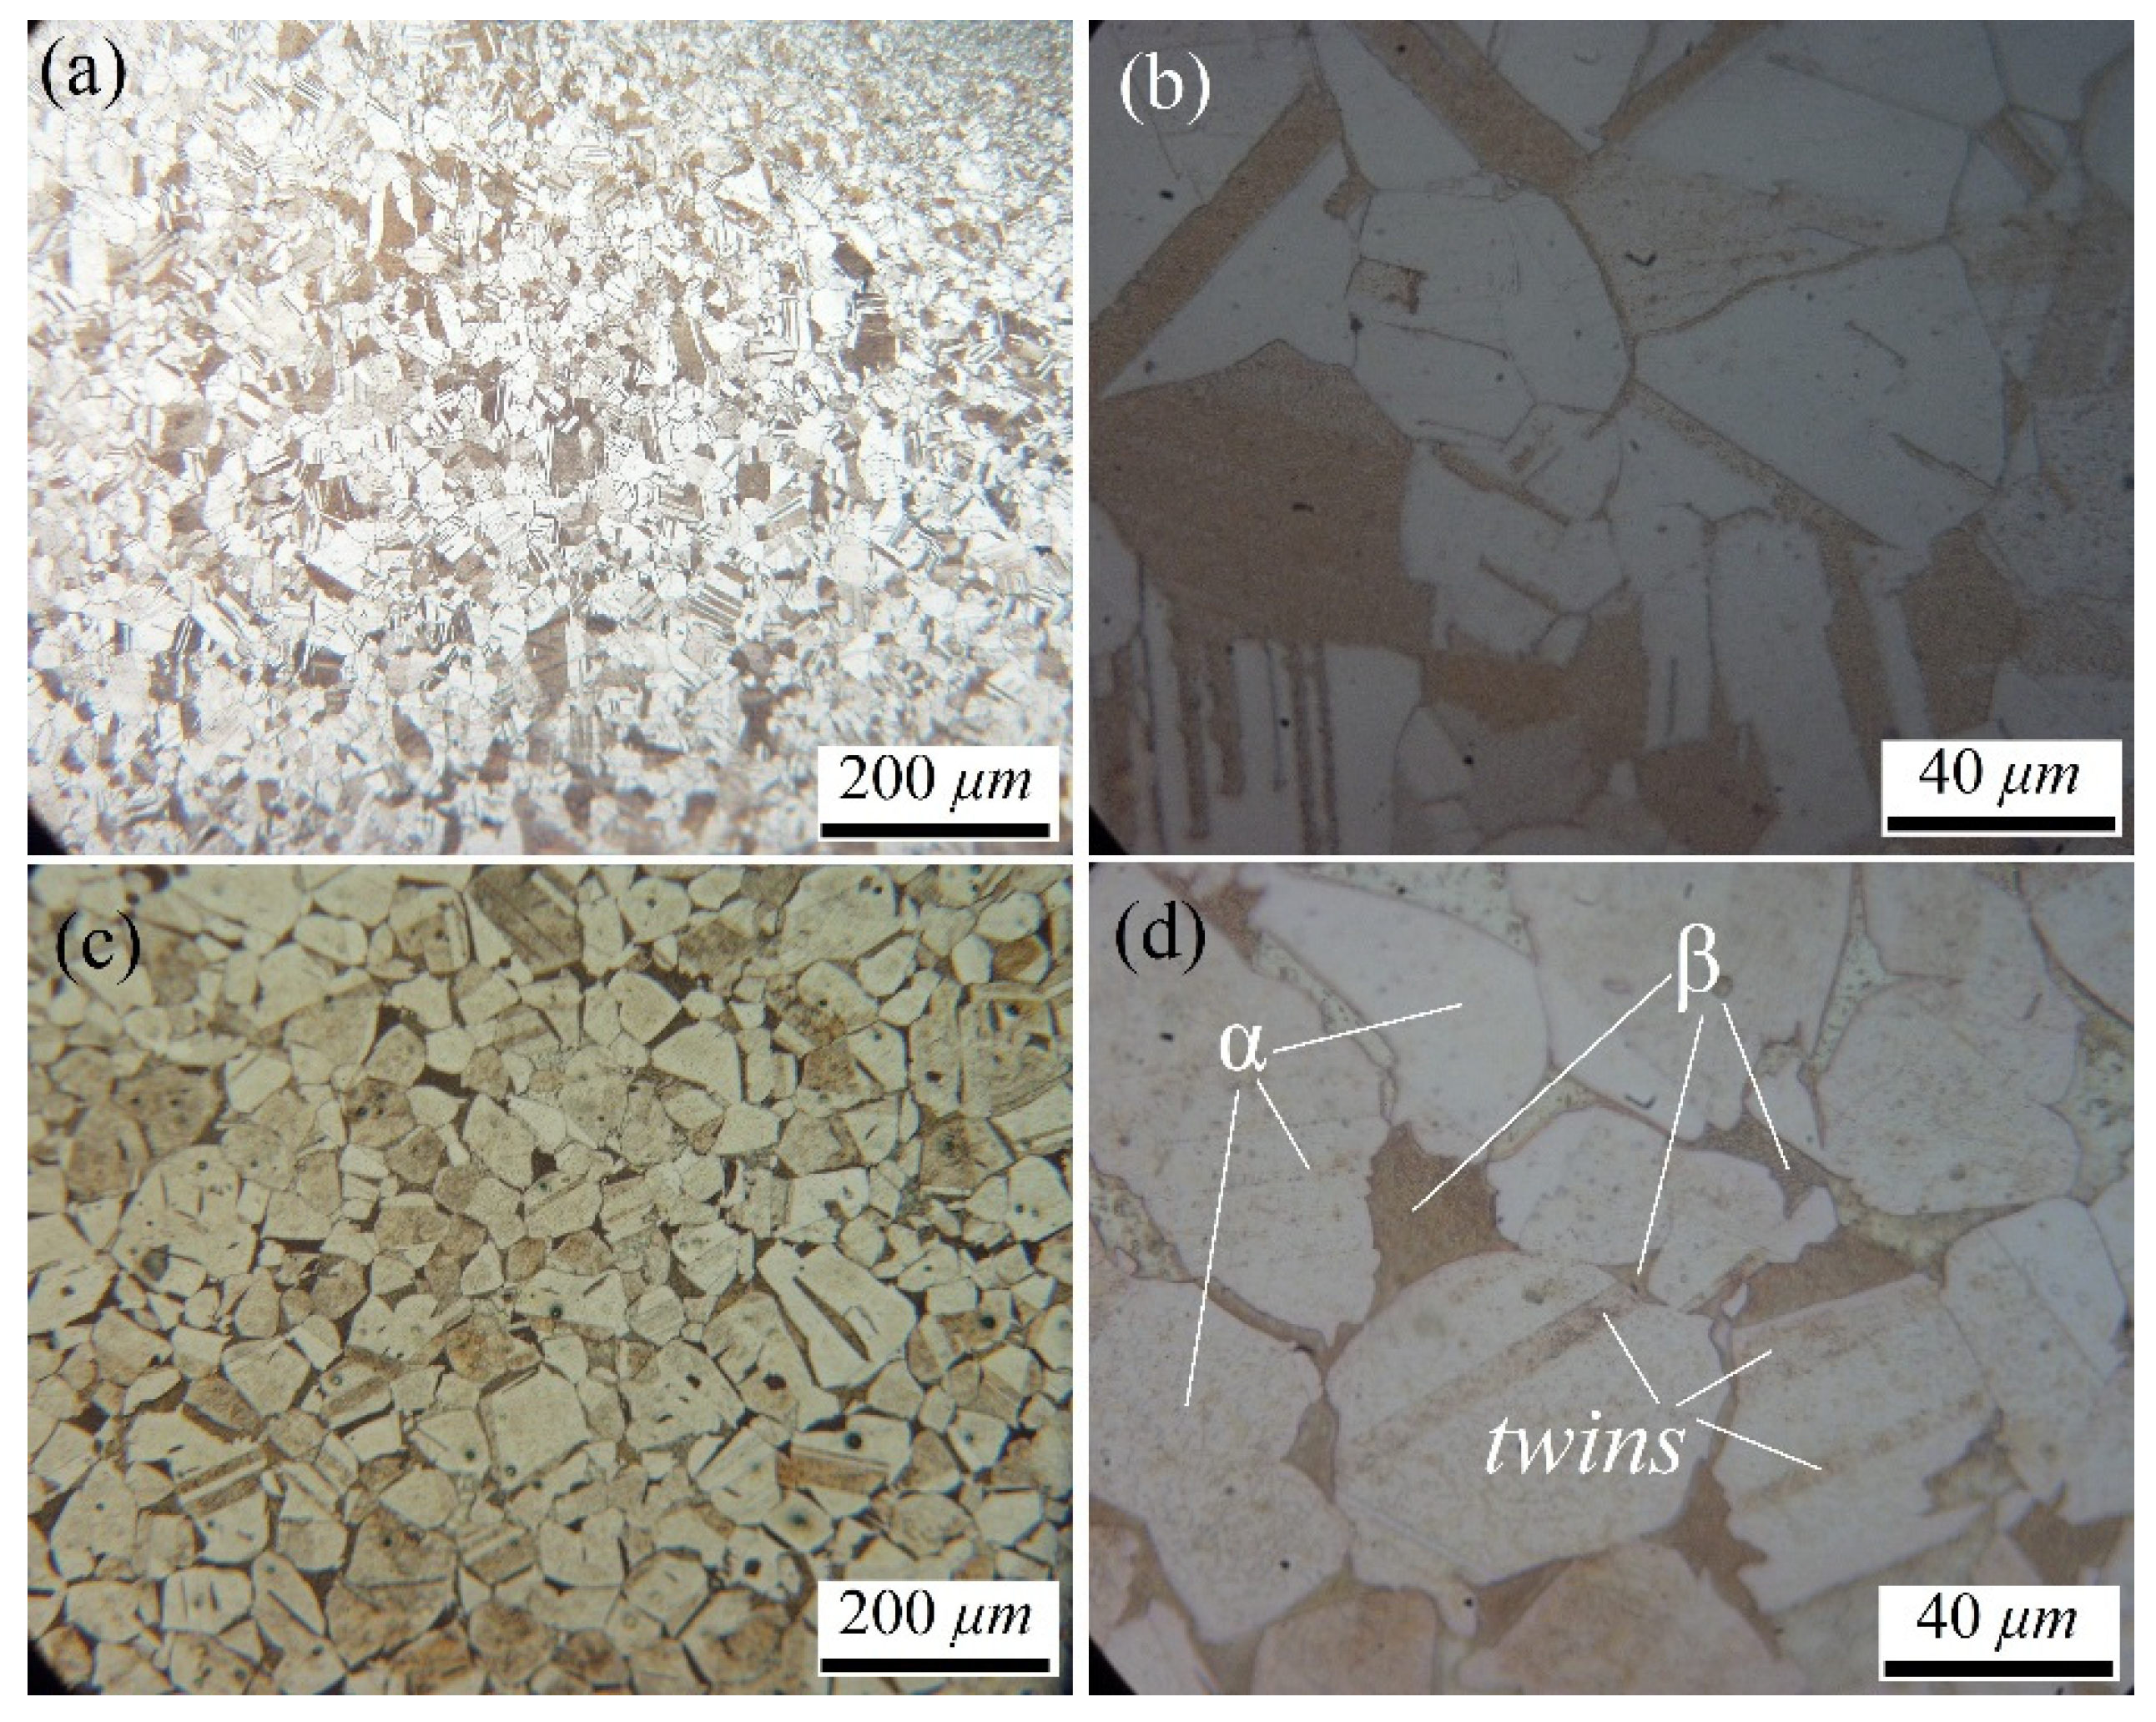
The OM images of the single-phase (before heat treatment) and double-phase (after heat treatment) brasses at low and high magnifications are shown in
Figure 2. According to
Figure 2a,b, the single-phase plate had large grains of α (
FCC) phase containing lots of annealing twins. After non-equilibrium heat treatment (described in the previous section), α grains were grown to some extent, and another phase was formed at the primary α grain boundaries and interiors (
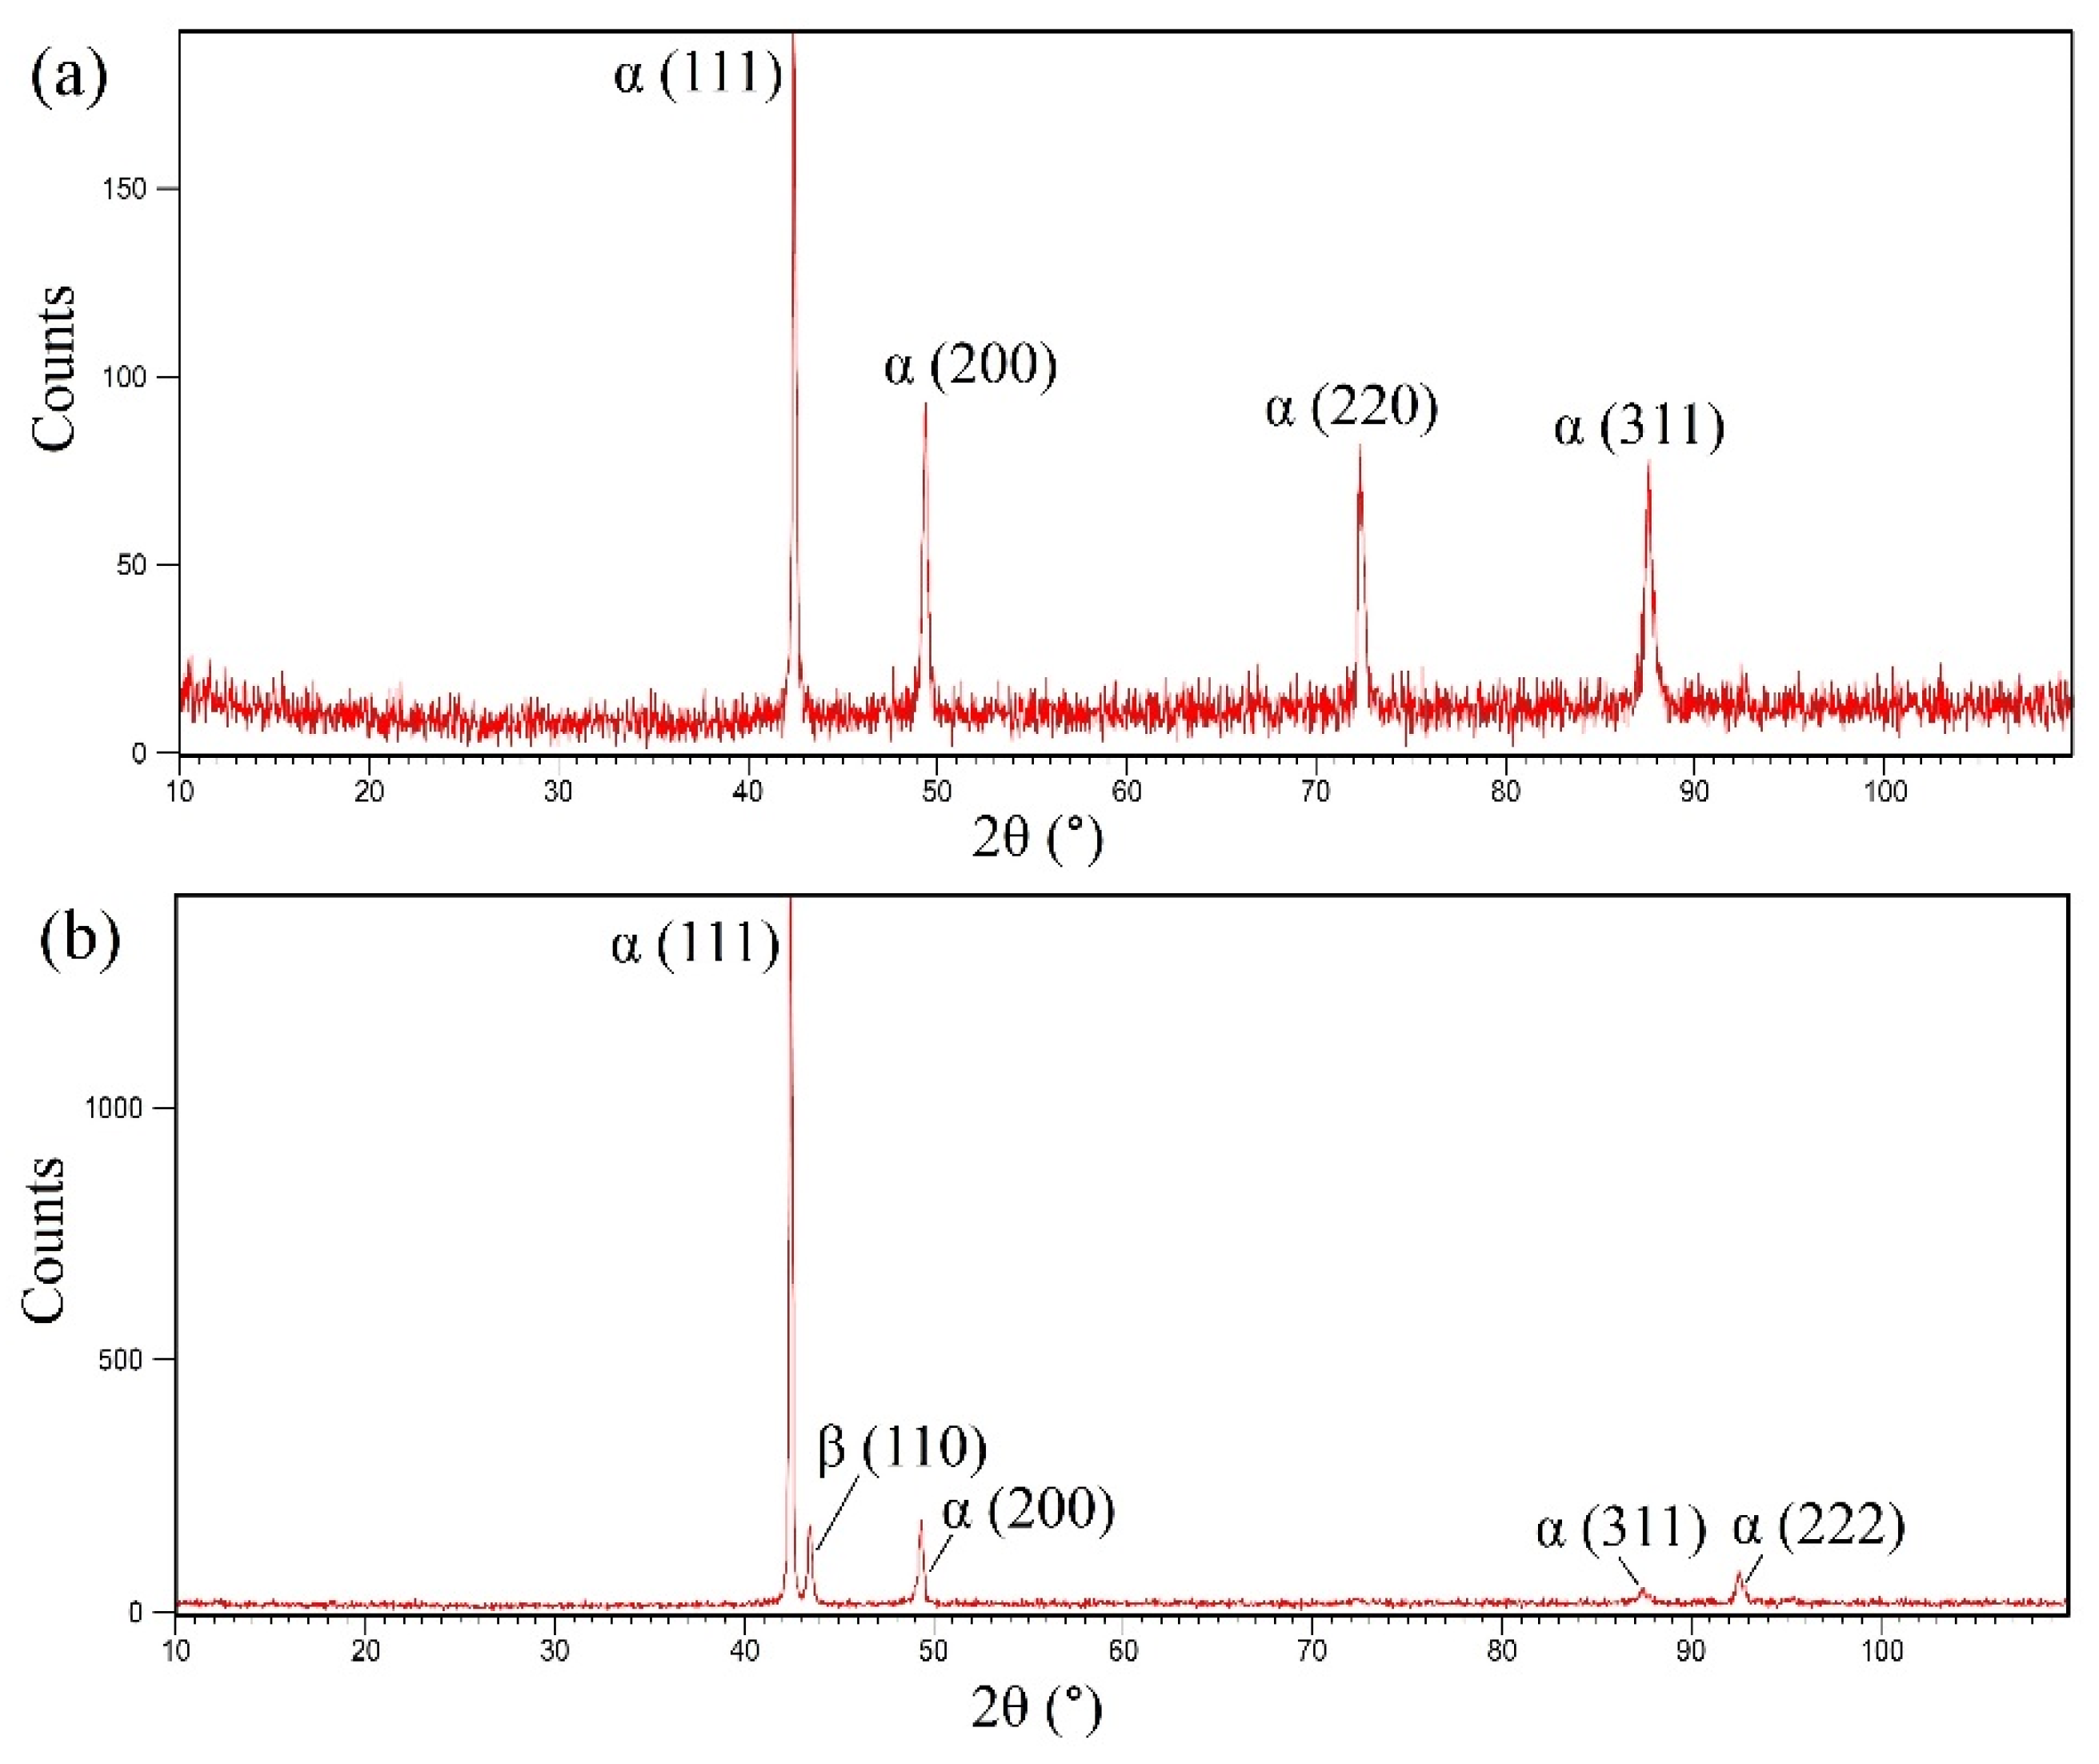
Figure 2c,d). In addition, the XRD patterns of single-phase and double-phase samples are illustrated in
Figure 3. The observation of a β (110) peak after heat treatment in the double-phase sample (
Figure 3) confirms that β phase was formed from α phase during heat treatment (
Figure 2c,d).
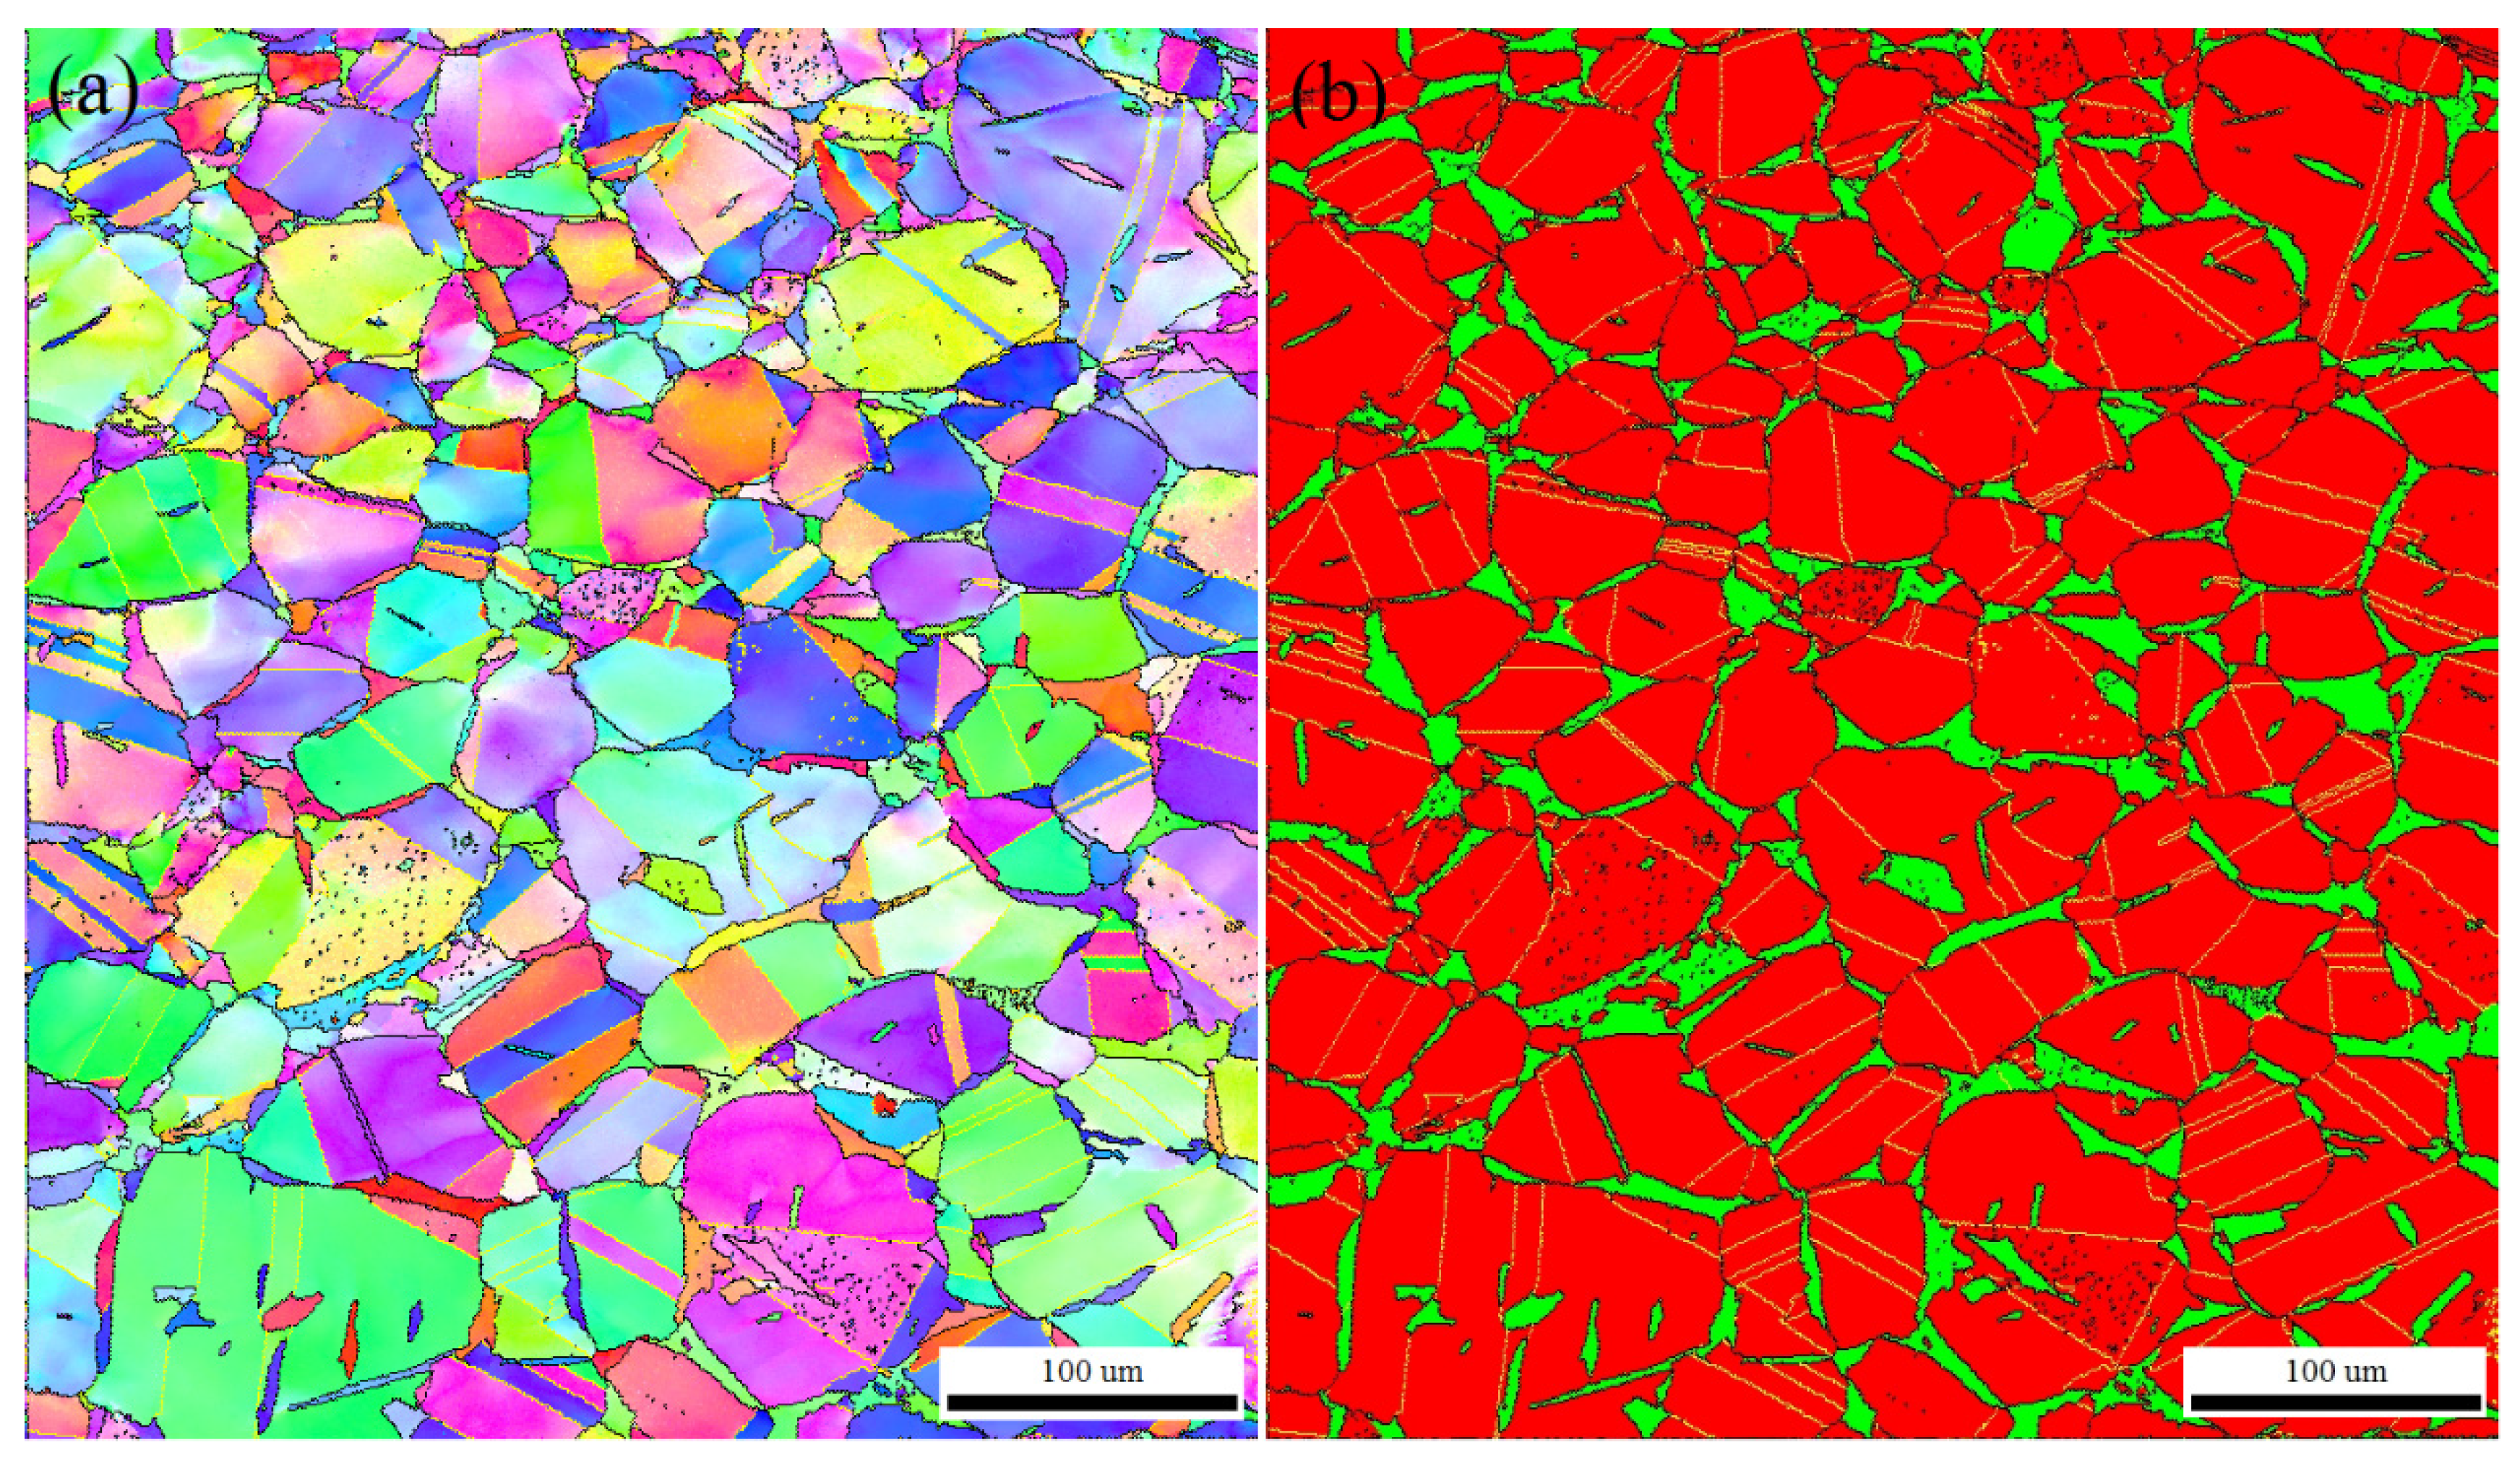
The inverse pole figure (IPF) map and phase map of the double-phase sample are shown in
Figure 4, in which α and β phases are indicated by red and green colors, respectively.
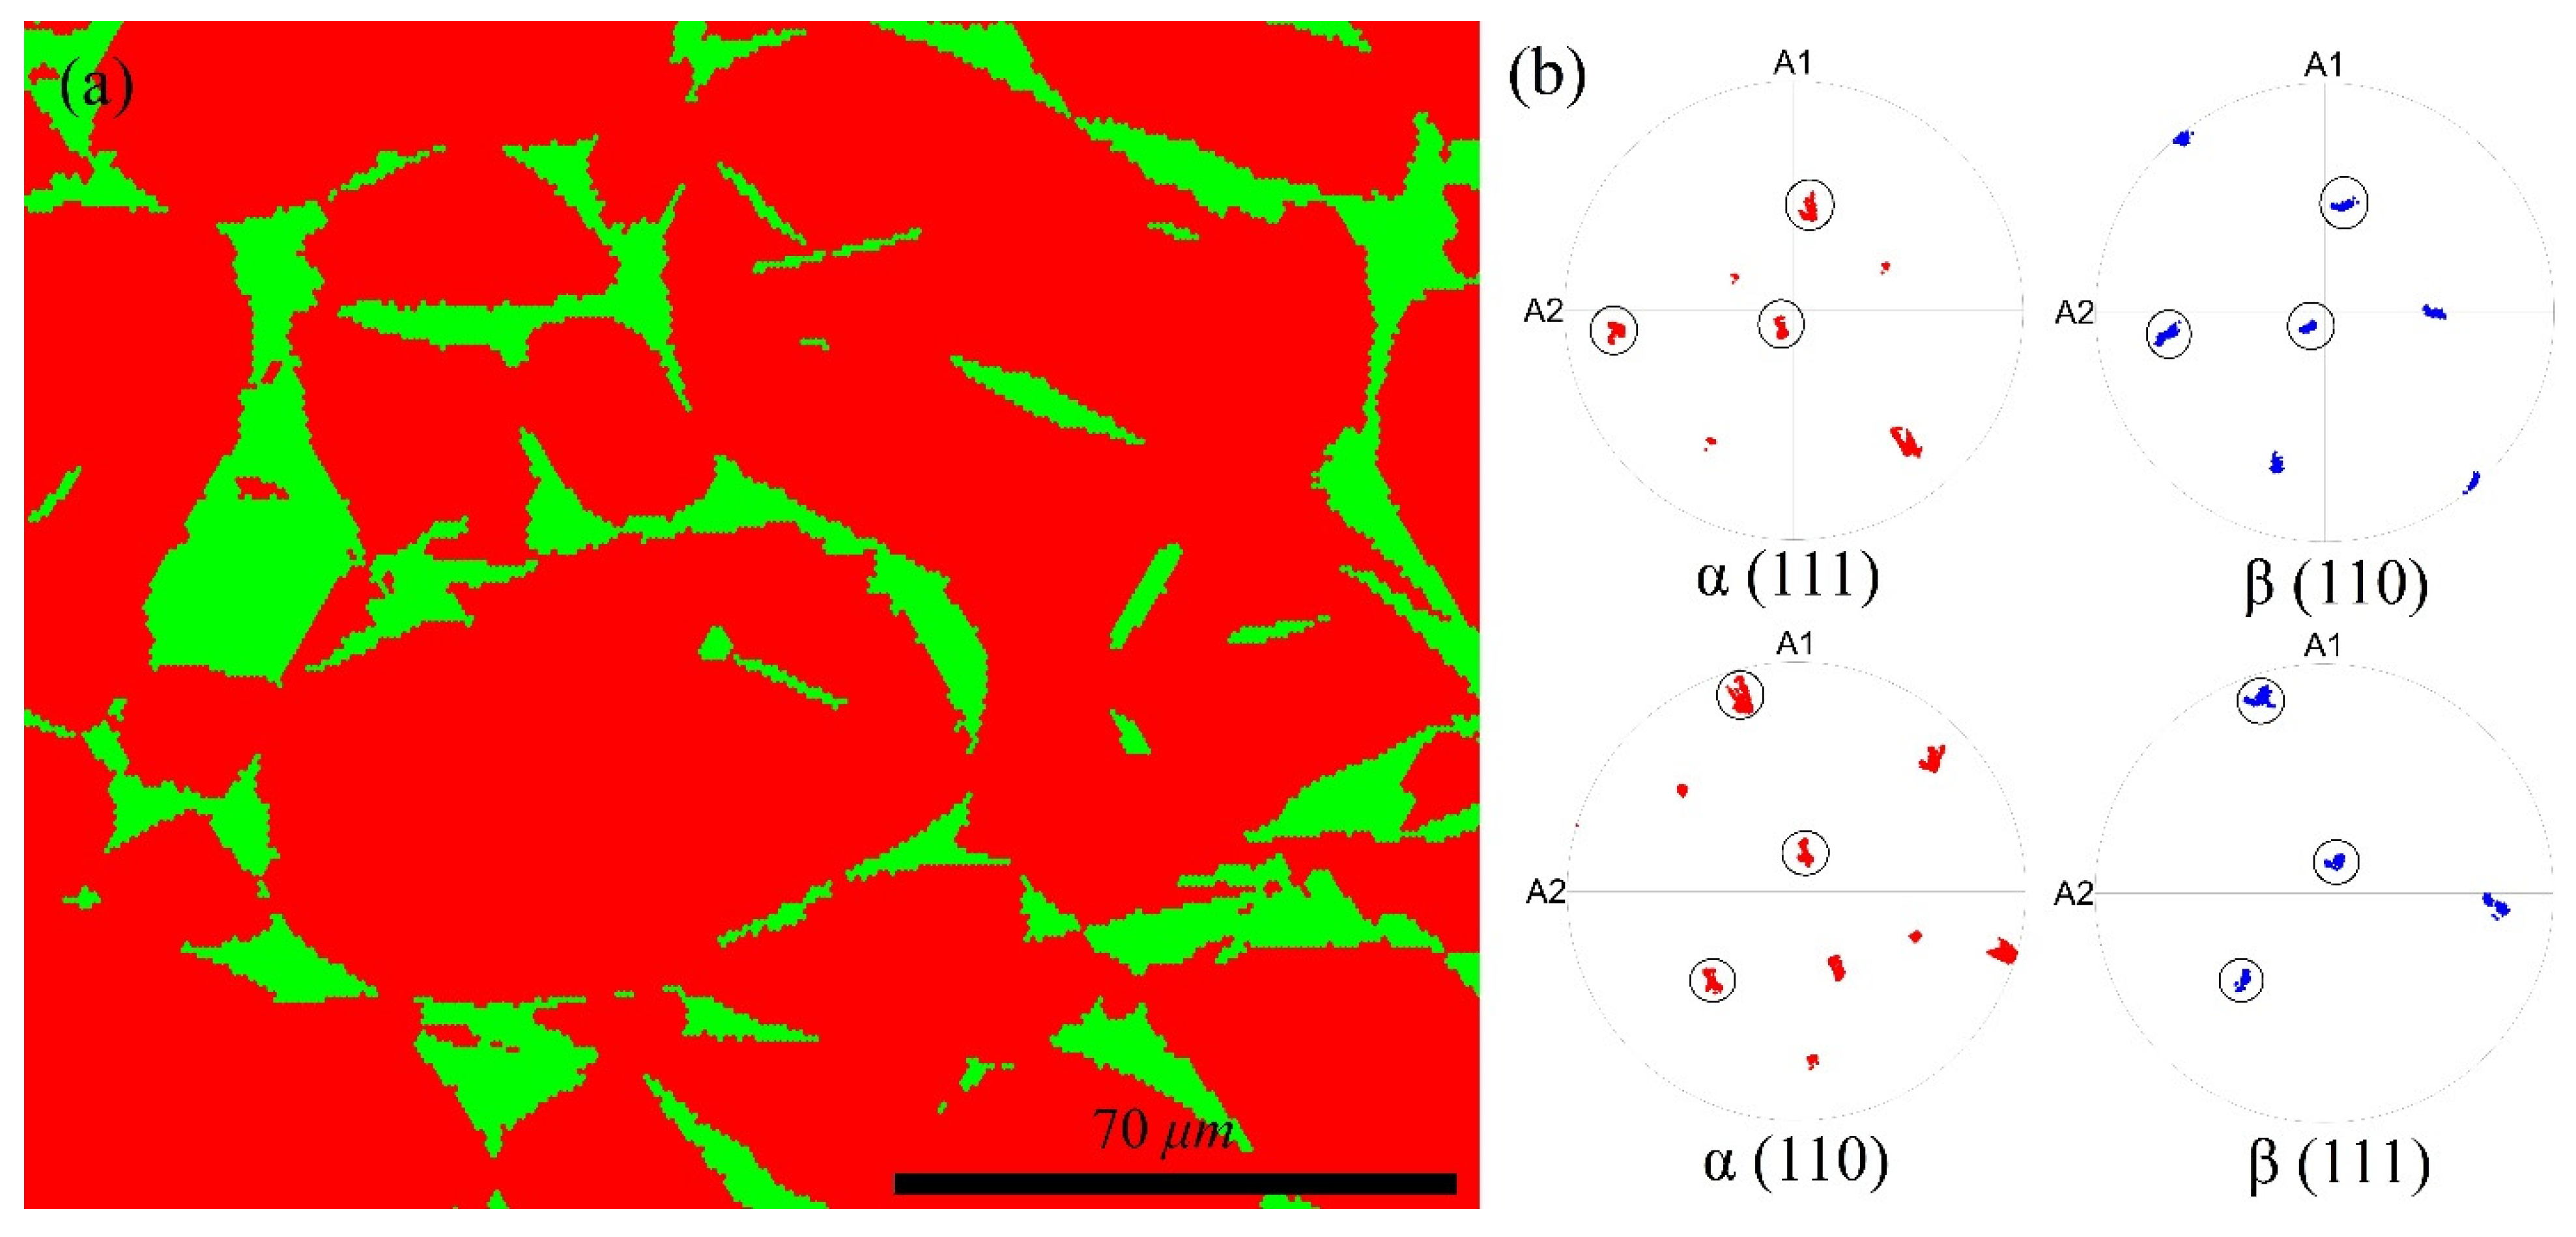
Figure 4 confirms the formation of larger β colonies at the primary α grain boundaries and finer β at the grain interiors. The higher magnification of the phase map of the double-phase sample in conjunction with (110) and (111) pole figures of α and β at the interfacial areas (primary α grain boundary’s zone) are depicted in
Figure 5. Moreover, the highly magnified phase map of grain interiors and related (110) and (111) pole figures of α and β at the interfacial areas are illustrated in
Figure 6.
In
Figure 5 and
Figure 6, pole figures designate the orientation relationship (OR) between α (
FCC) and β (
BCC) phases. From
Figure 5, it can be seen that there is an OR in the regions of large β phases (at primary α grain boundaries) between
and
. The OR during phase transformation of
FCC↔
BCC structures have been investigated frequently, and it is well known that the possible ORs are as follows [
5,
6,
7]:
- (1)
, (Kurdjumov–Sachs)
- (2)
, (Bain)
- (3)
, (Nishiyama–Wassermann)
According to
Figure 5, the OR between α and disordered β at α primary grain boundaries was Kurdjumov–Sachs (KS) type.
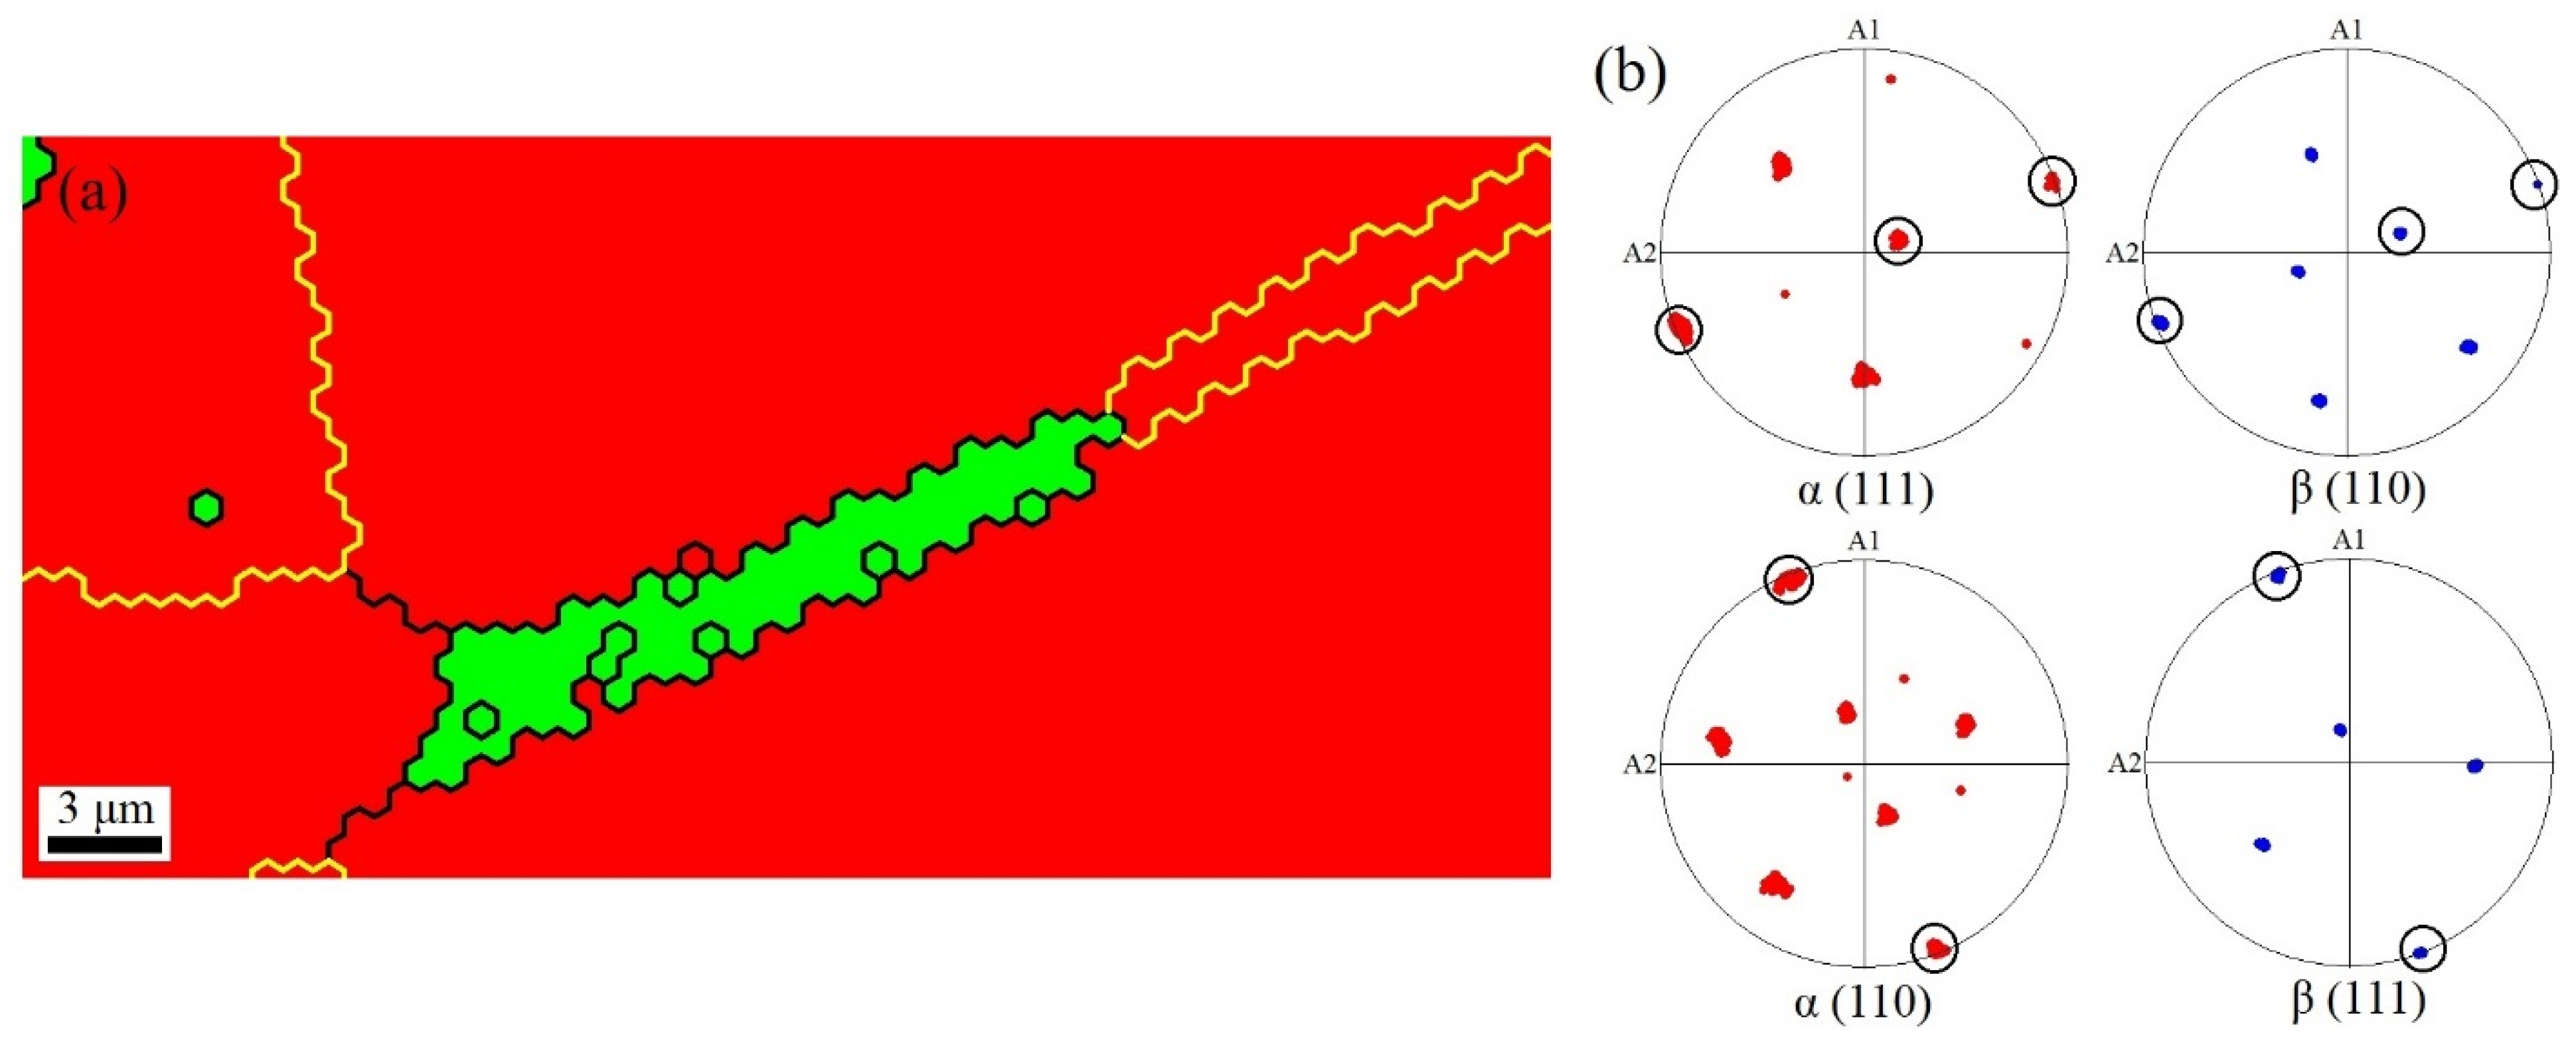
In the case of grain interior (
Figure 6), the Σ3 twin boundaries (indicated by the yellow color in
Figure 6a) are the preferred zones for α→β phase transformation. As shown in
Figure 6a, a Σ3 twin boundary was partially transferred to a high-angle boundary (indicated by the black color) due to the formation of disordered β (
BCC) within the twinned zone. On the other hand, the pole figures extracted from α and β phases adjacent to the Σ3 twin boundary (
Figure 6b) indicate the existence of a KS OR similar to α primary grain boundary zones. Therefore, the type of OR does not depend on the nucleation sites of the disordered β phase, and the α→β phase transformation occurs under the KS relationship. Similar results have been reported by other researchers during phase transformation in brasses under different processing routes [
8,
9]. Zhao et al. [
8] investigated the type of OR during α→β phase transformation induced by electric current pulses in a brass alloy containing Cu 63.8 wt. % and Zn 36.2 wt. %. They concluded that the KS relationship is the most possible OR during α→β phase transformation in brasses. Stanford and Bate [
9] studied the type of OR during β→α phase transformation during heat treatment. In their study, Widmanstatten α phase was grown from the primary β grain boundaries. Their results showed that the OR was close to the Young–Kurdjumov–Sachs relationship for α formation in β phase. The comparison between the results of this study with the literature [
8,
9] indicates two main points. First, the OR during α→β phase transformation in brasses does not depend on the processing route. Second, the OR during α→β and β→α phase transformation in brasses does not alter, and in both cases, the Kurdjumov–Sachs relationship governs the microstructural evolution.
4. Conclusions
The phase-transformation-induced orientation relationship between the α and disordered β phase during heat treatment of a Cu-37 wt. % Zn alloy was investigated using electron backscattered diffraction. By heating a Cu-37 wt. % Zn single-phase alloy at 800 °C for one hour, the primary α grains grew, and the β phase formed at suitable nucleation sites. The preferred nucleation sites for α→β transformation are grain boundaries and grain interiors of the primary α phase. However, the more preferred zones are the grain boundaries in which the larger β phases are produced. It is worth noting that, at grain interior sites, the Σ3 twins are the preferred sites for the nucleation of β phase. In the case of twin sites, the formation of a β phase destroys the Σ3 special orientation and changes them to random, high-angle grain boundaries. The main orientation relationship induced by α→β transformation is the Kurdjumov–Sachs relationship. Moreover, the Kurdjumov–Sachs relationship is not dependent on the type of β nucleation sites and processing routes.


