
Micromechanical Effect of Martensite Attributes on Forming Limits of Dual-Phase Steels Investigated by Crystal Plasticity-Based Numerical Simulations


Abstract
:
1. Introduction
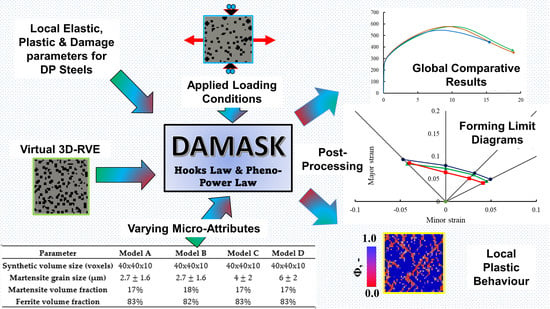
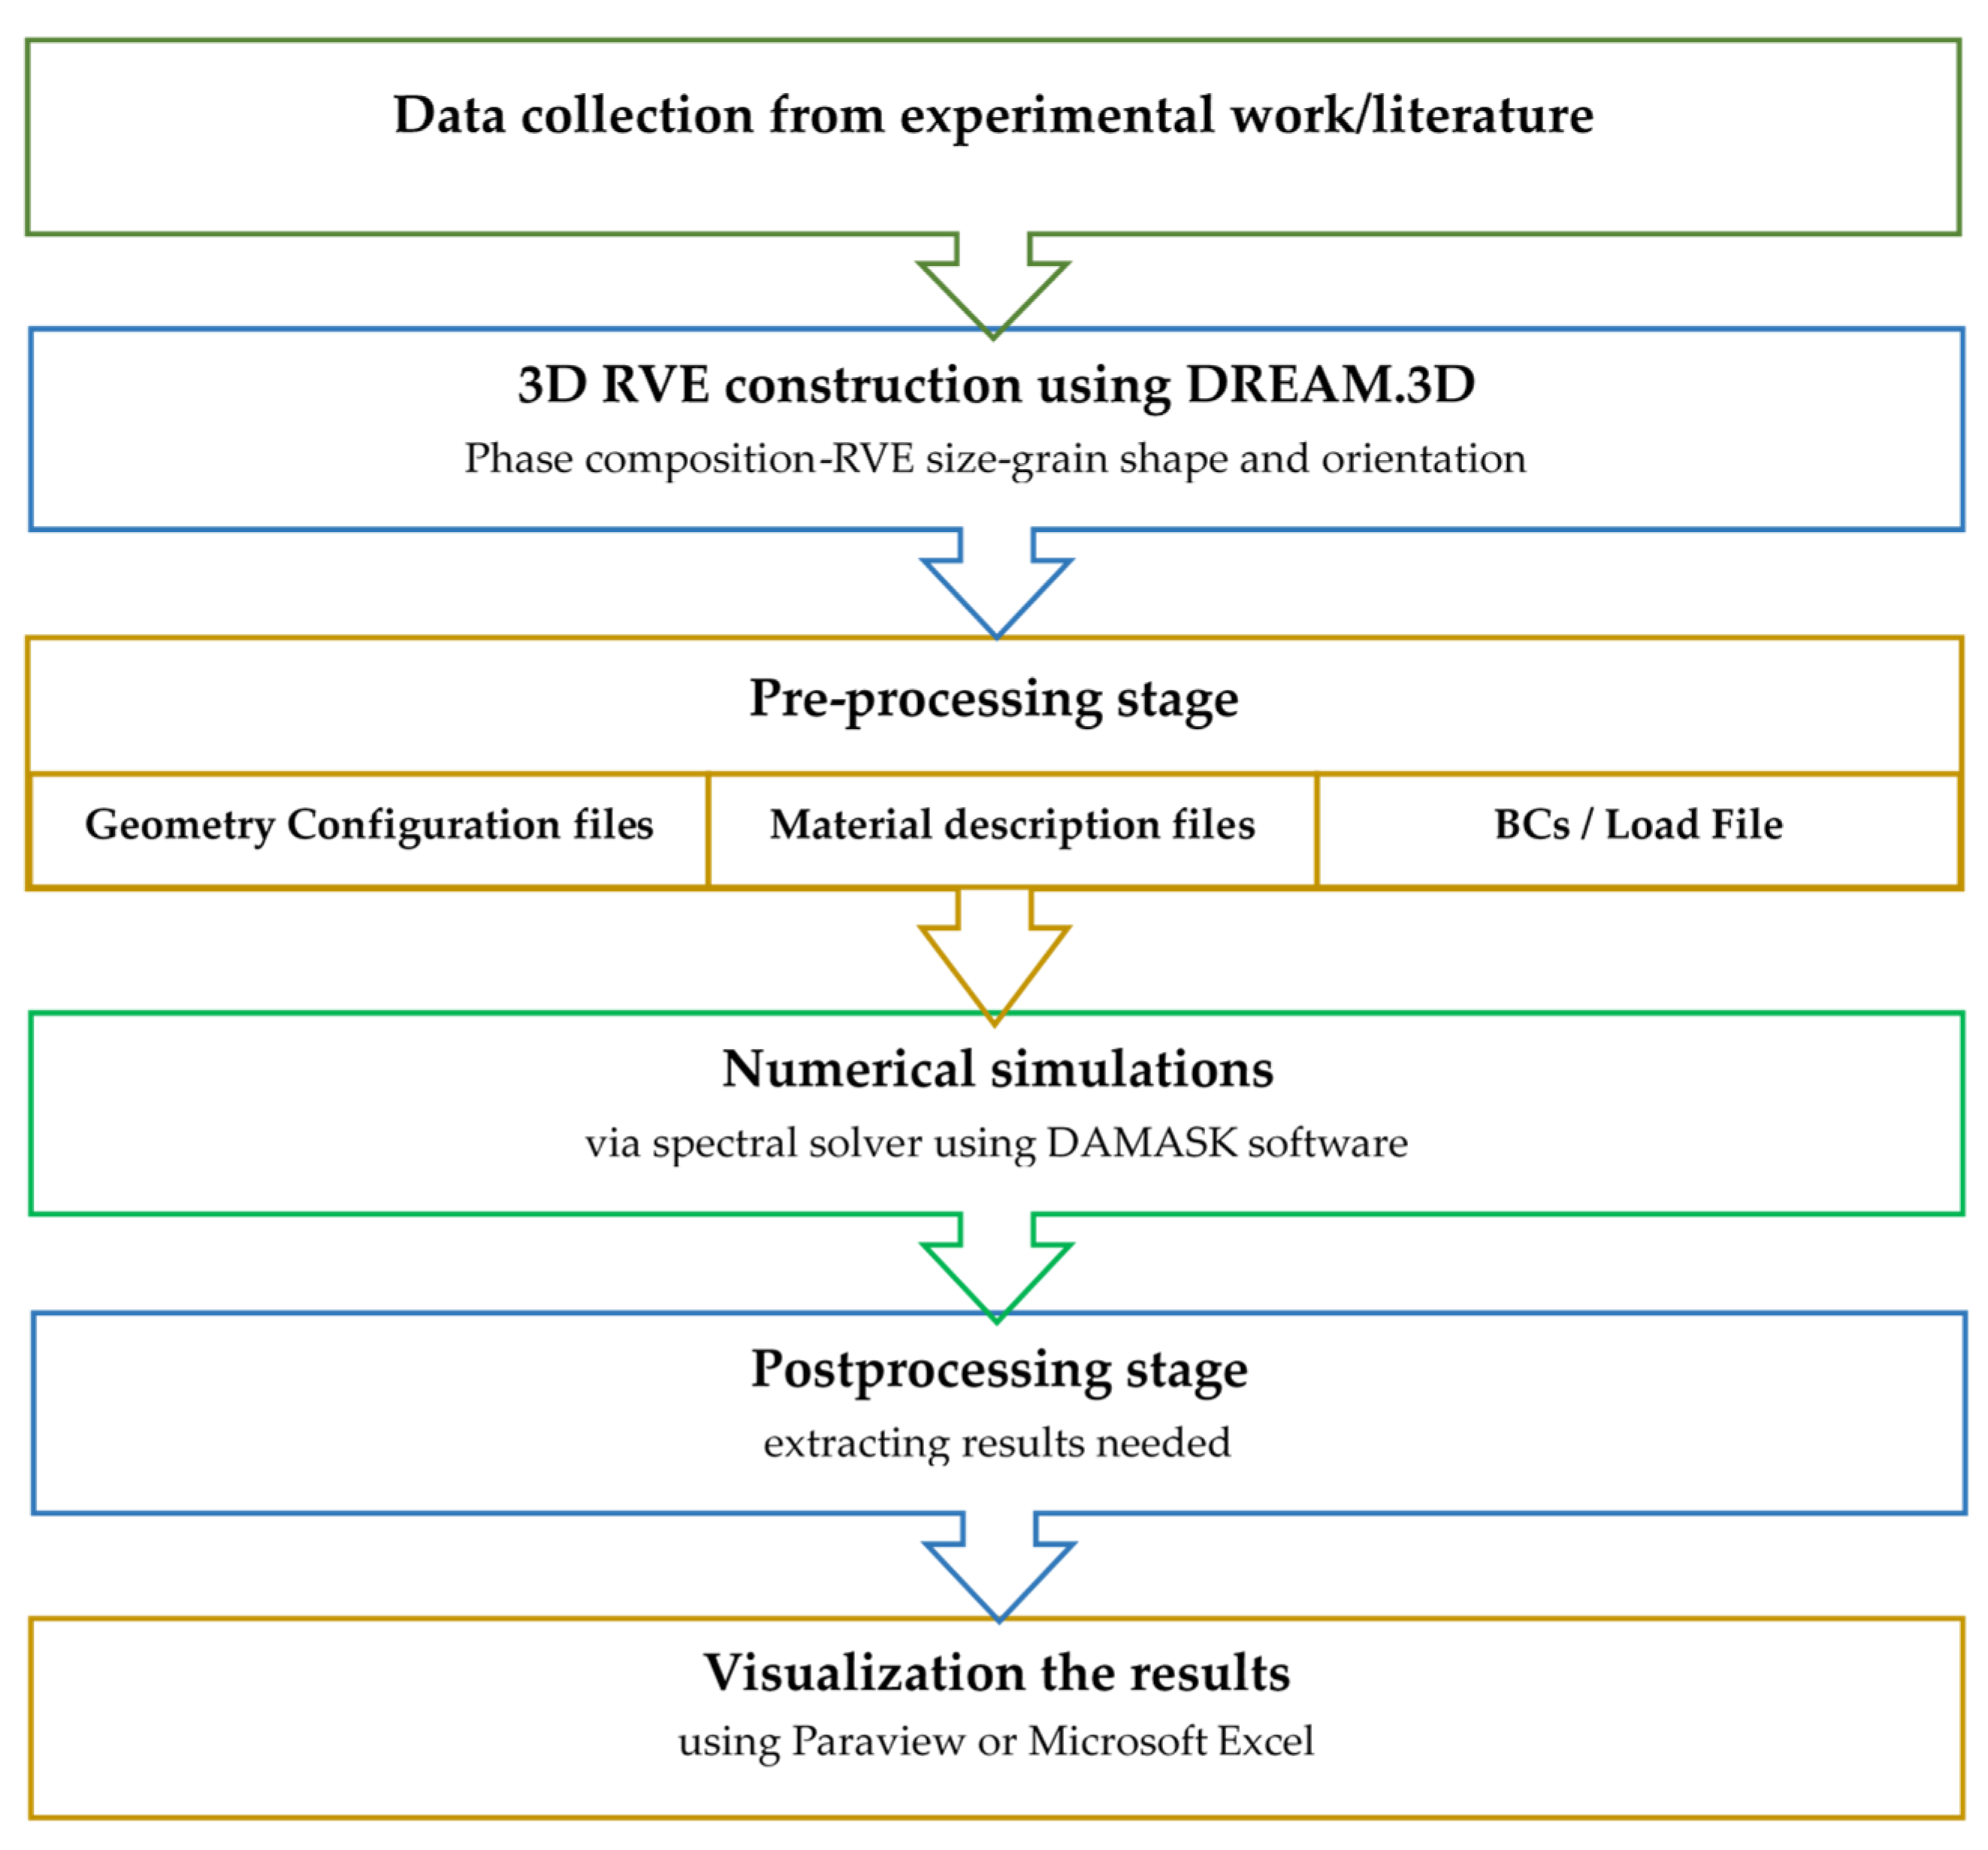
2. Methodology
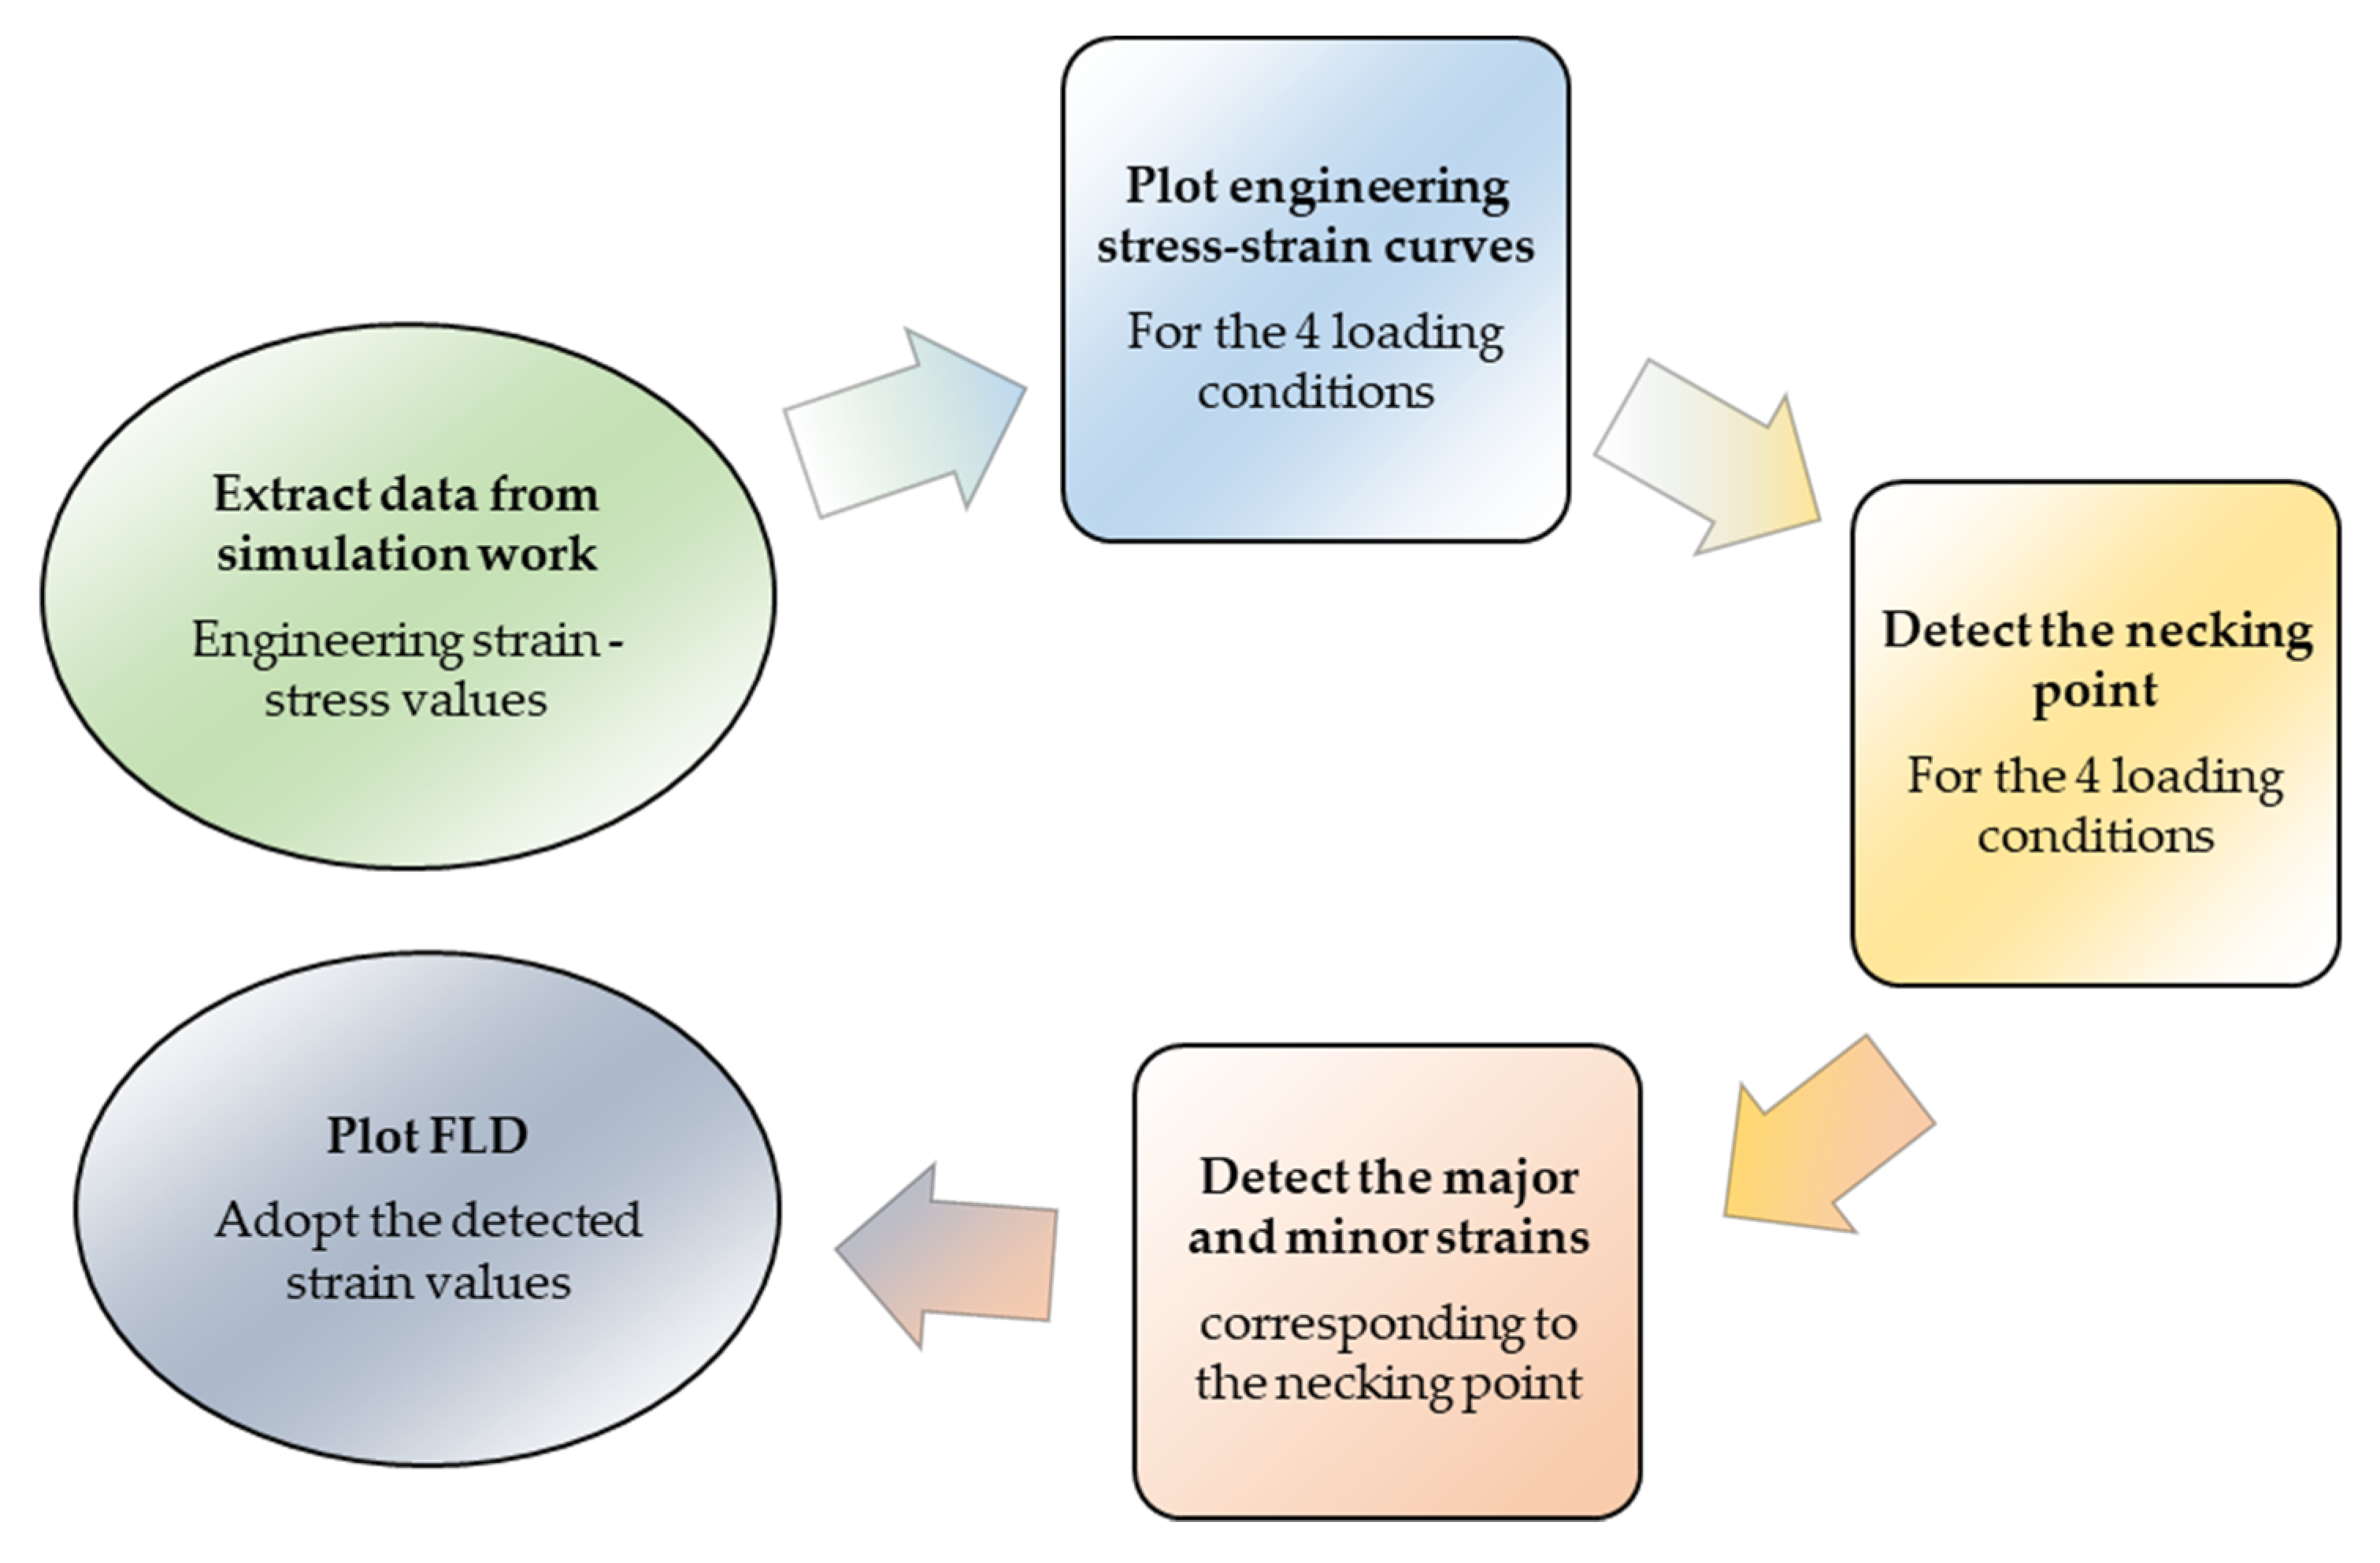
2.1. Data Collection
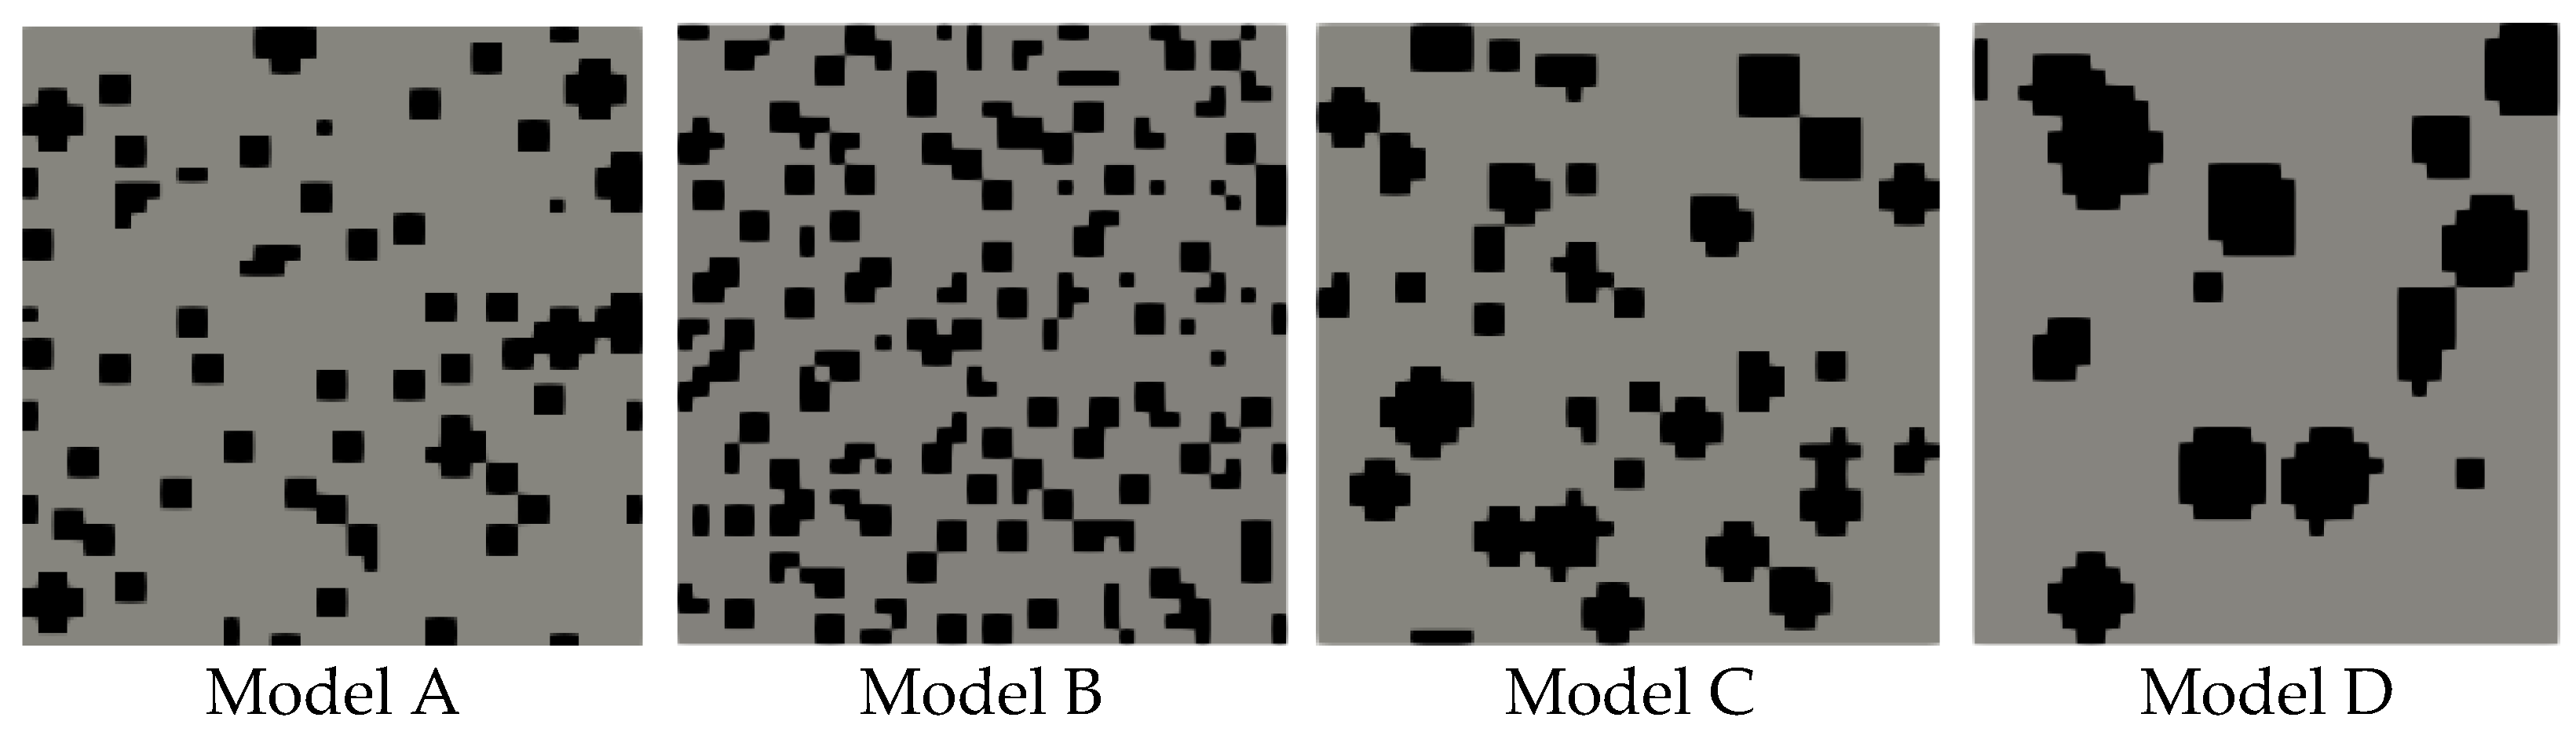
2.2. RVE Construction
2.3. Pre-Processing Stage
2.3.1. Material Properties
2.3.2. Boundary/Loading Conditions
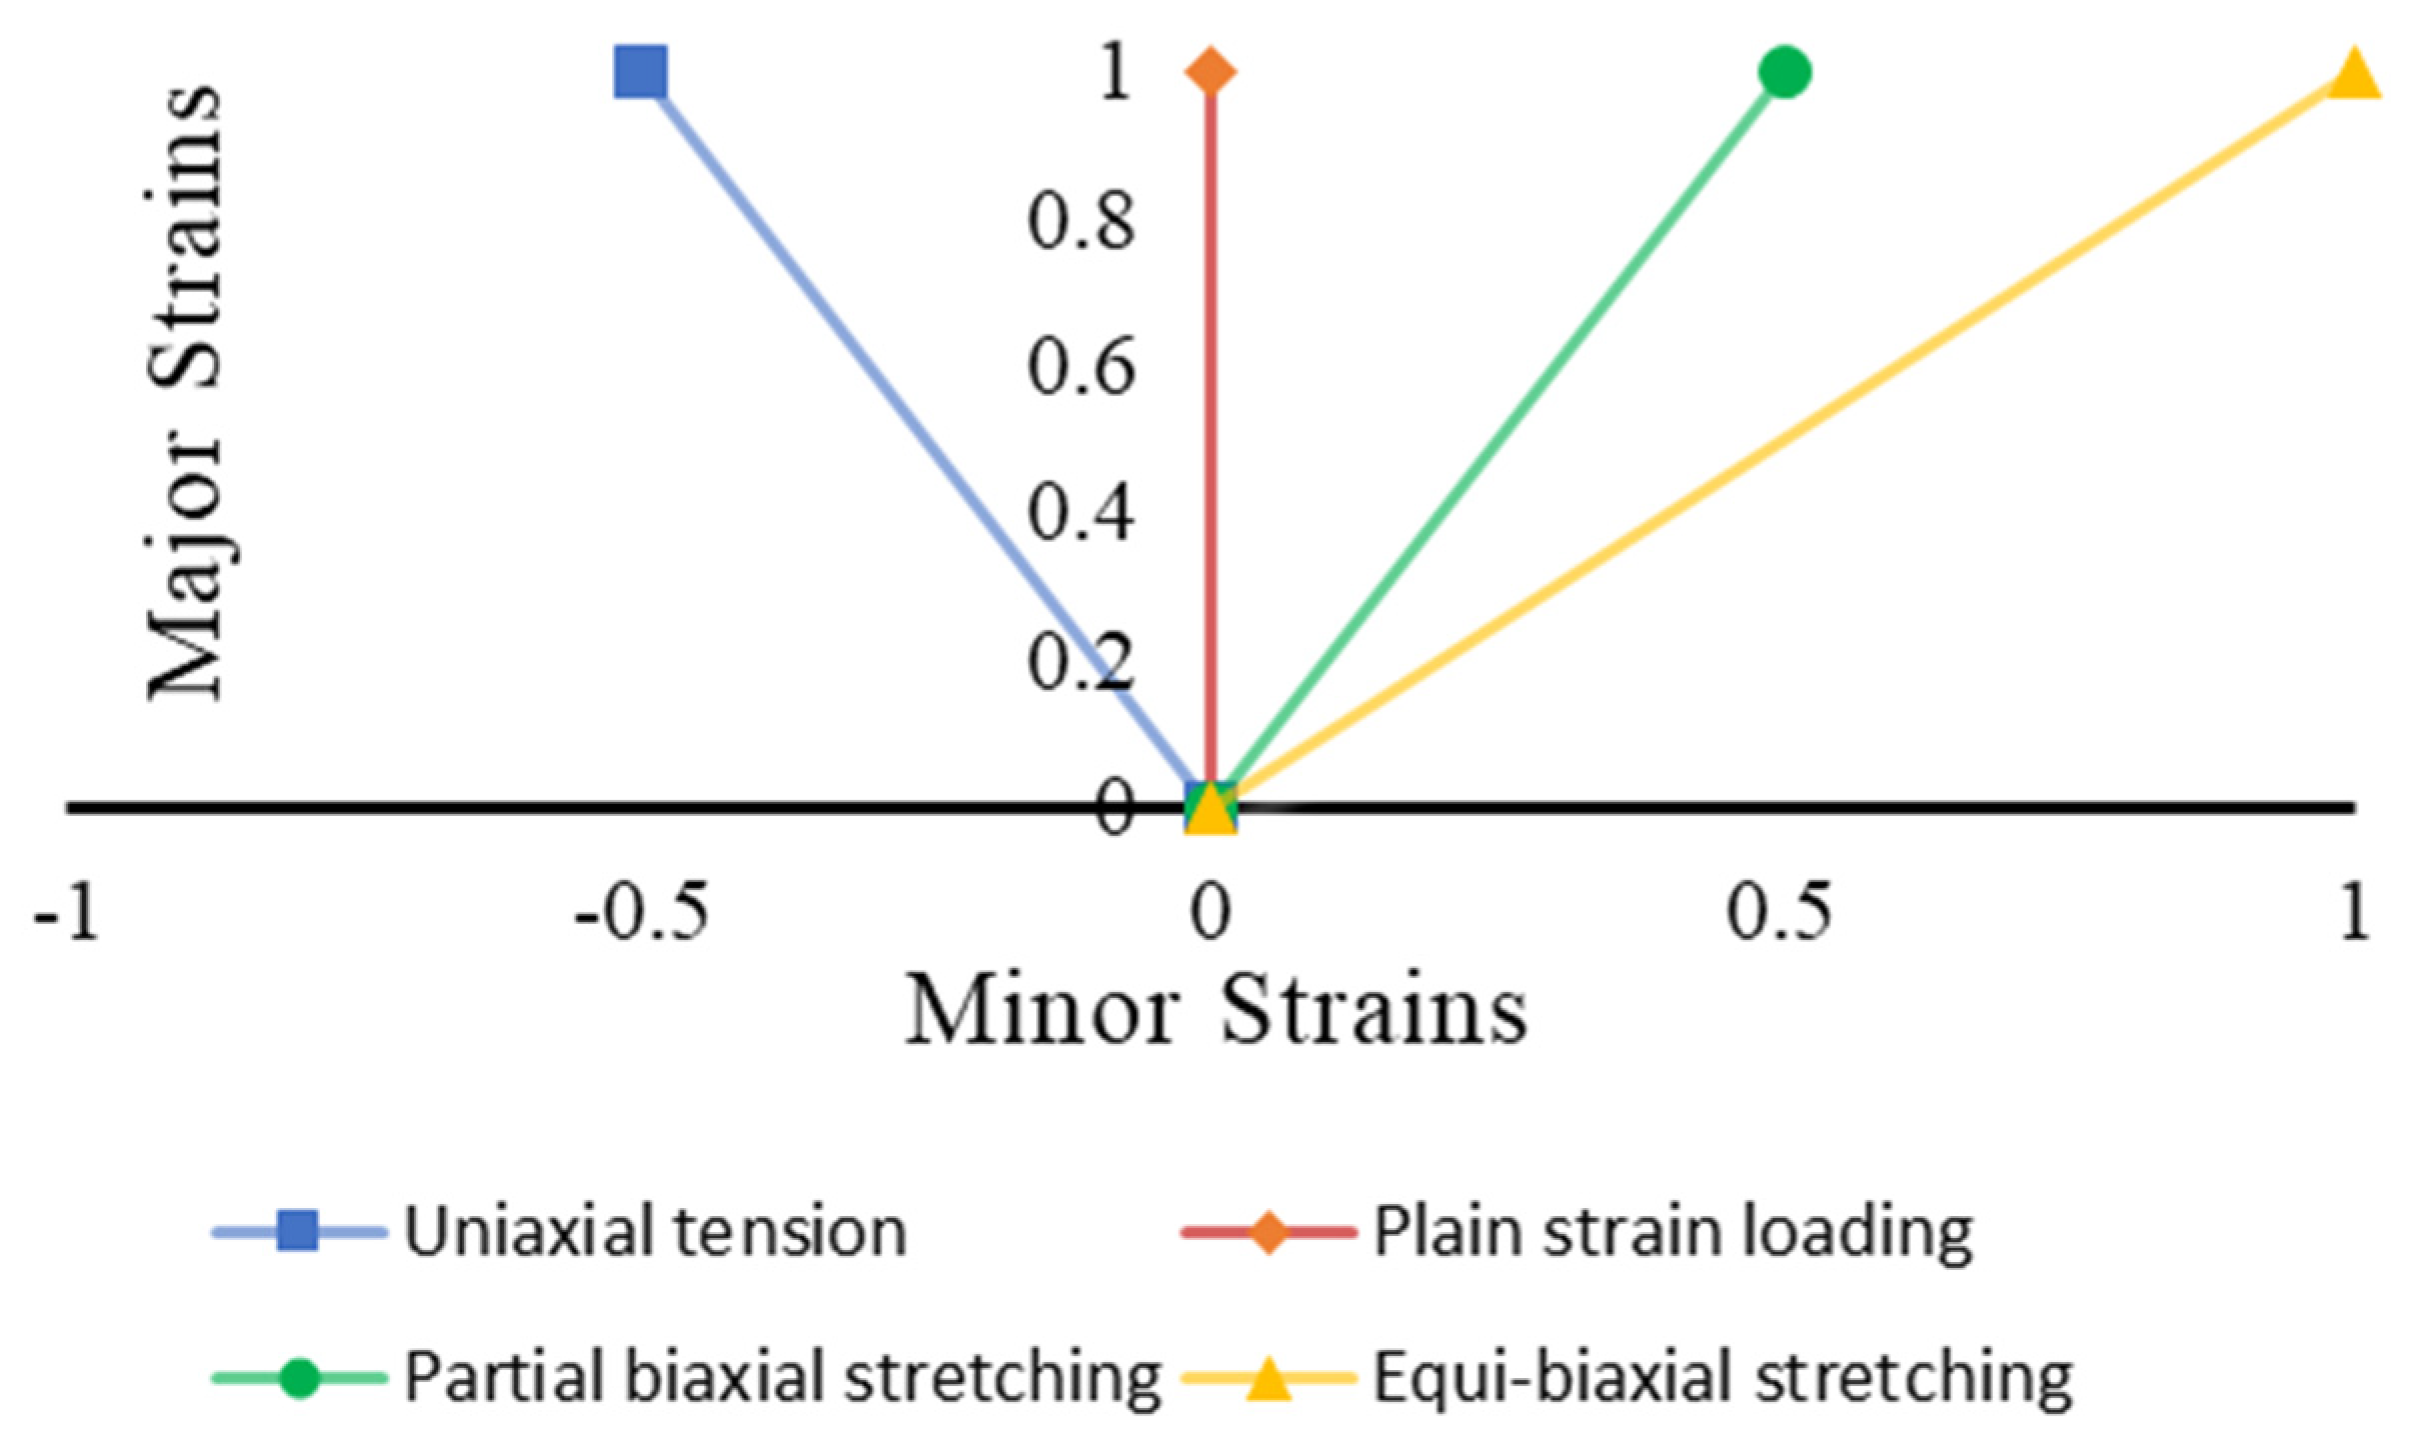
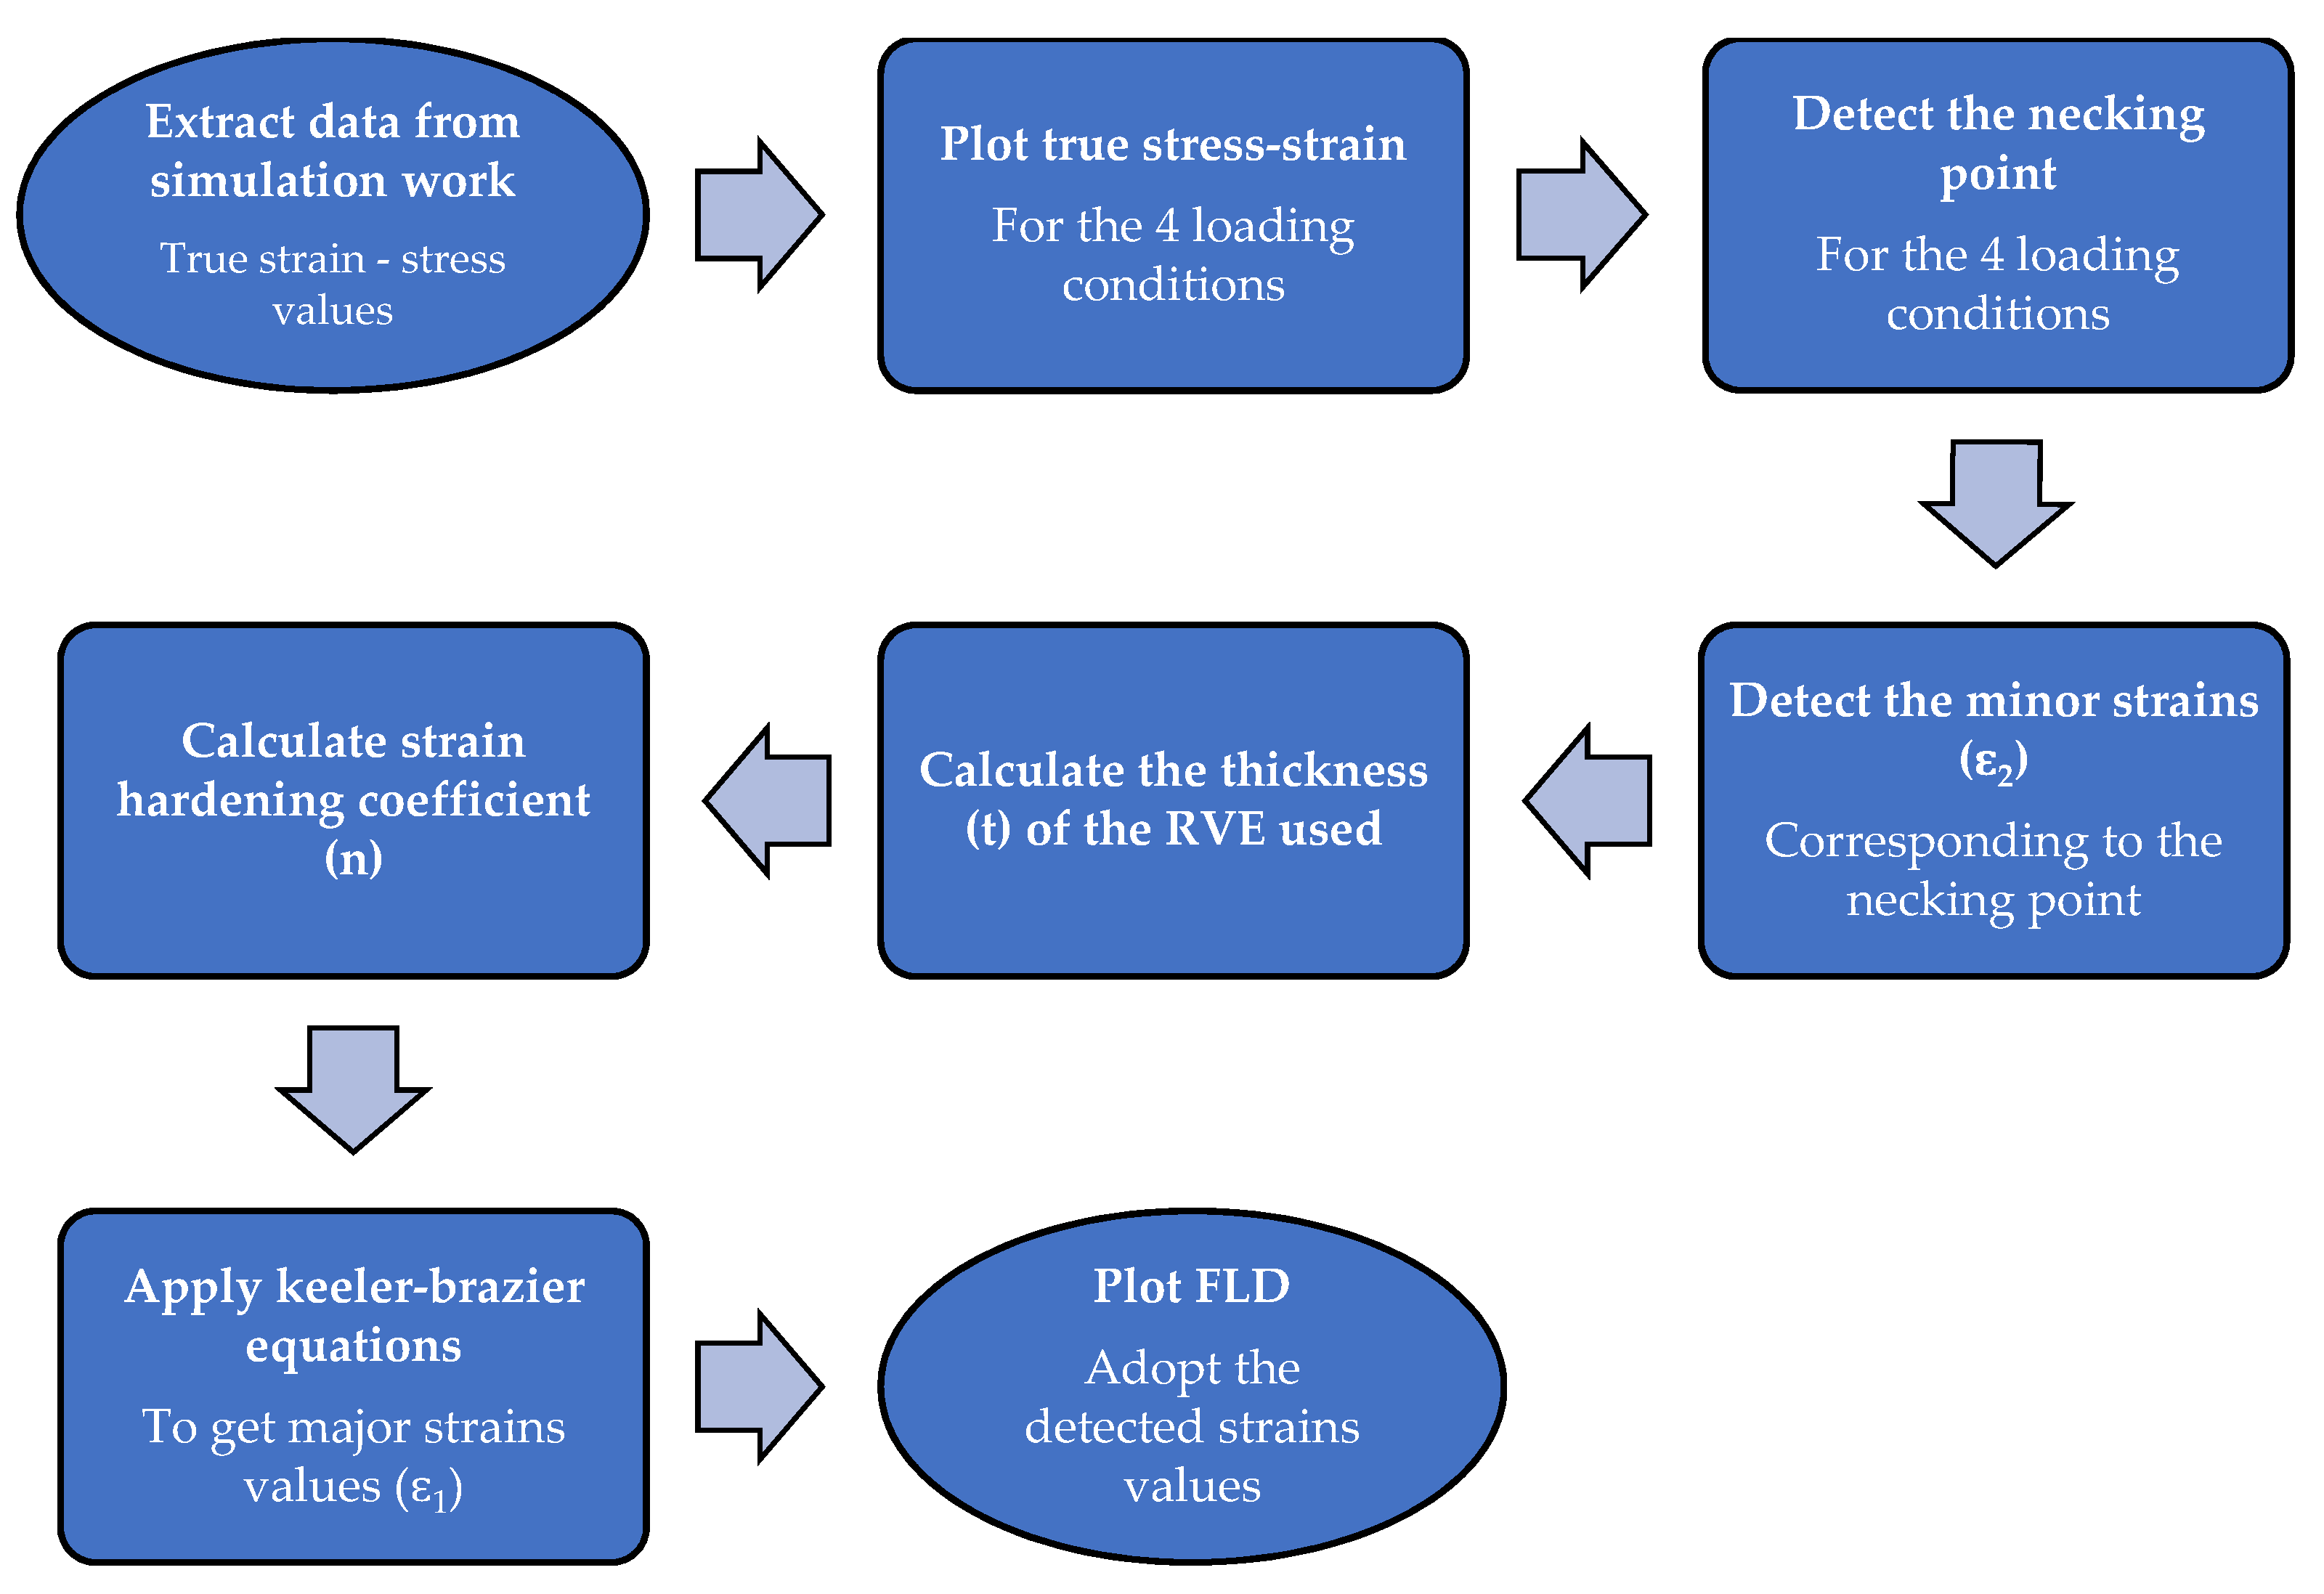
2.4. Evaluation of FLDs by M-K and K-B Approaches
2.4.1. M-K Approach
2.4.2. Keeler-Brazier Approach
3. Results
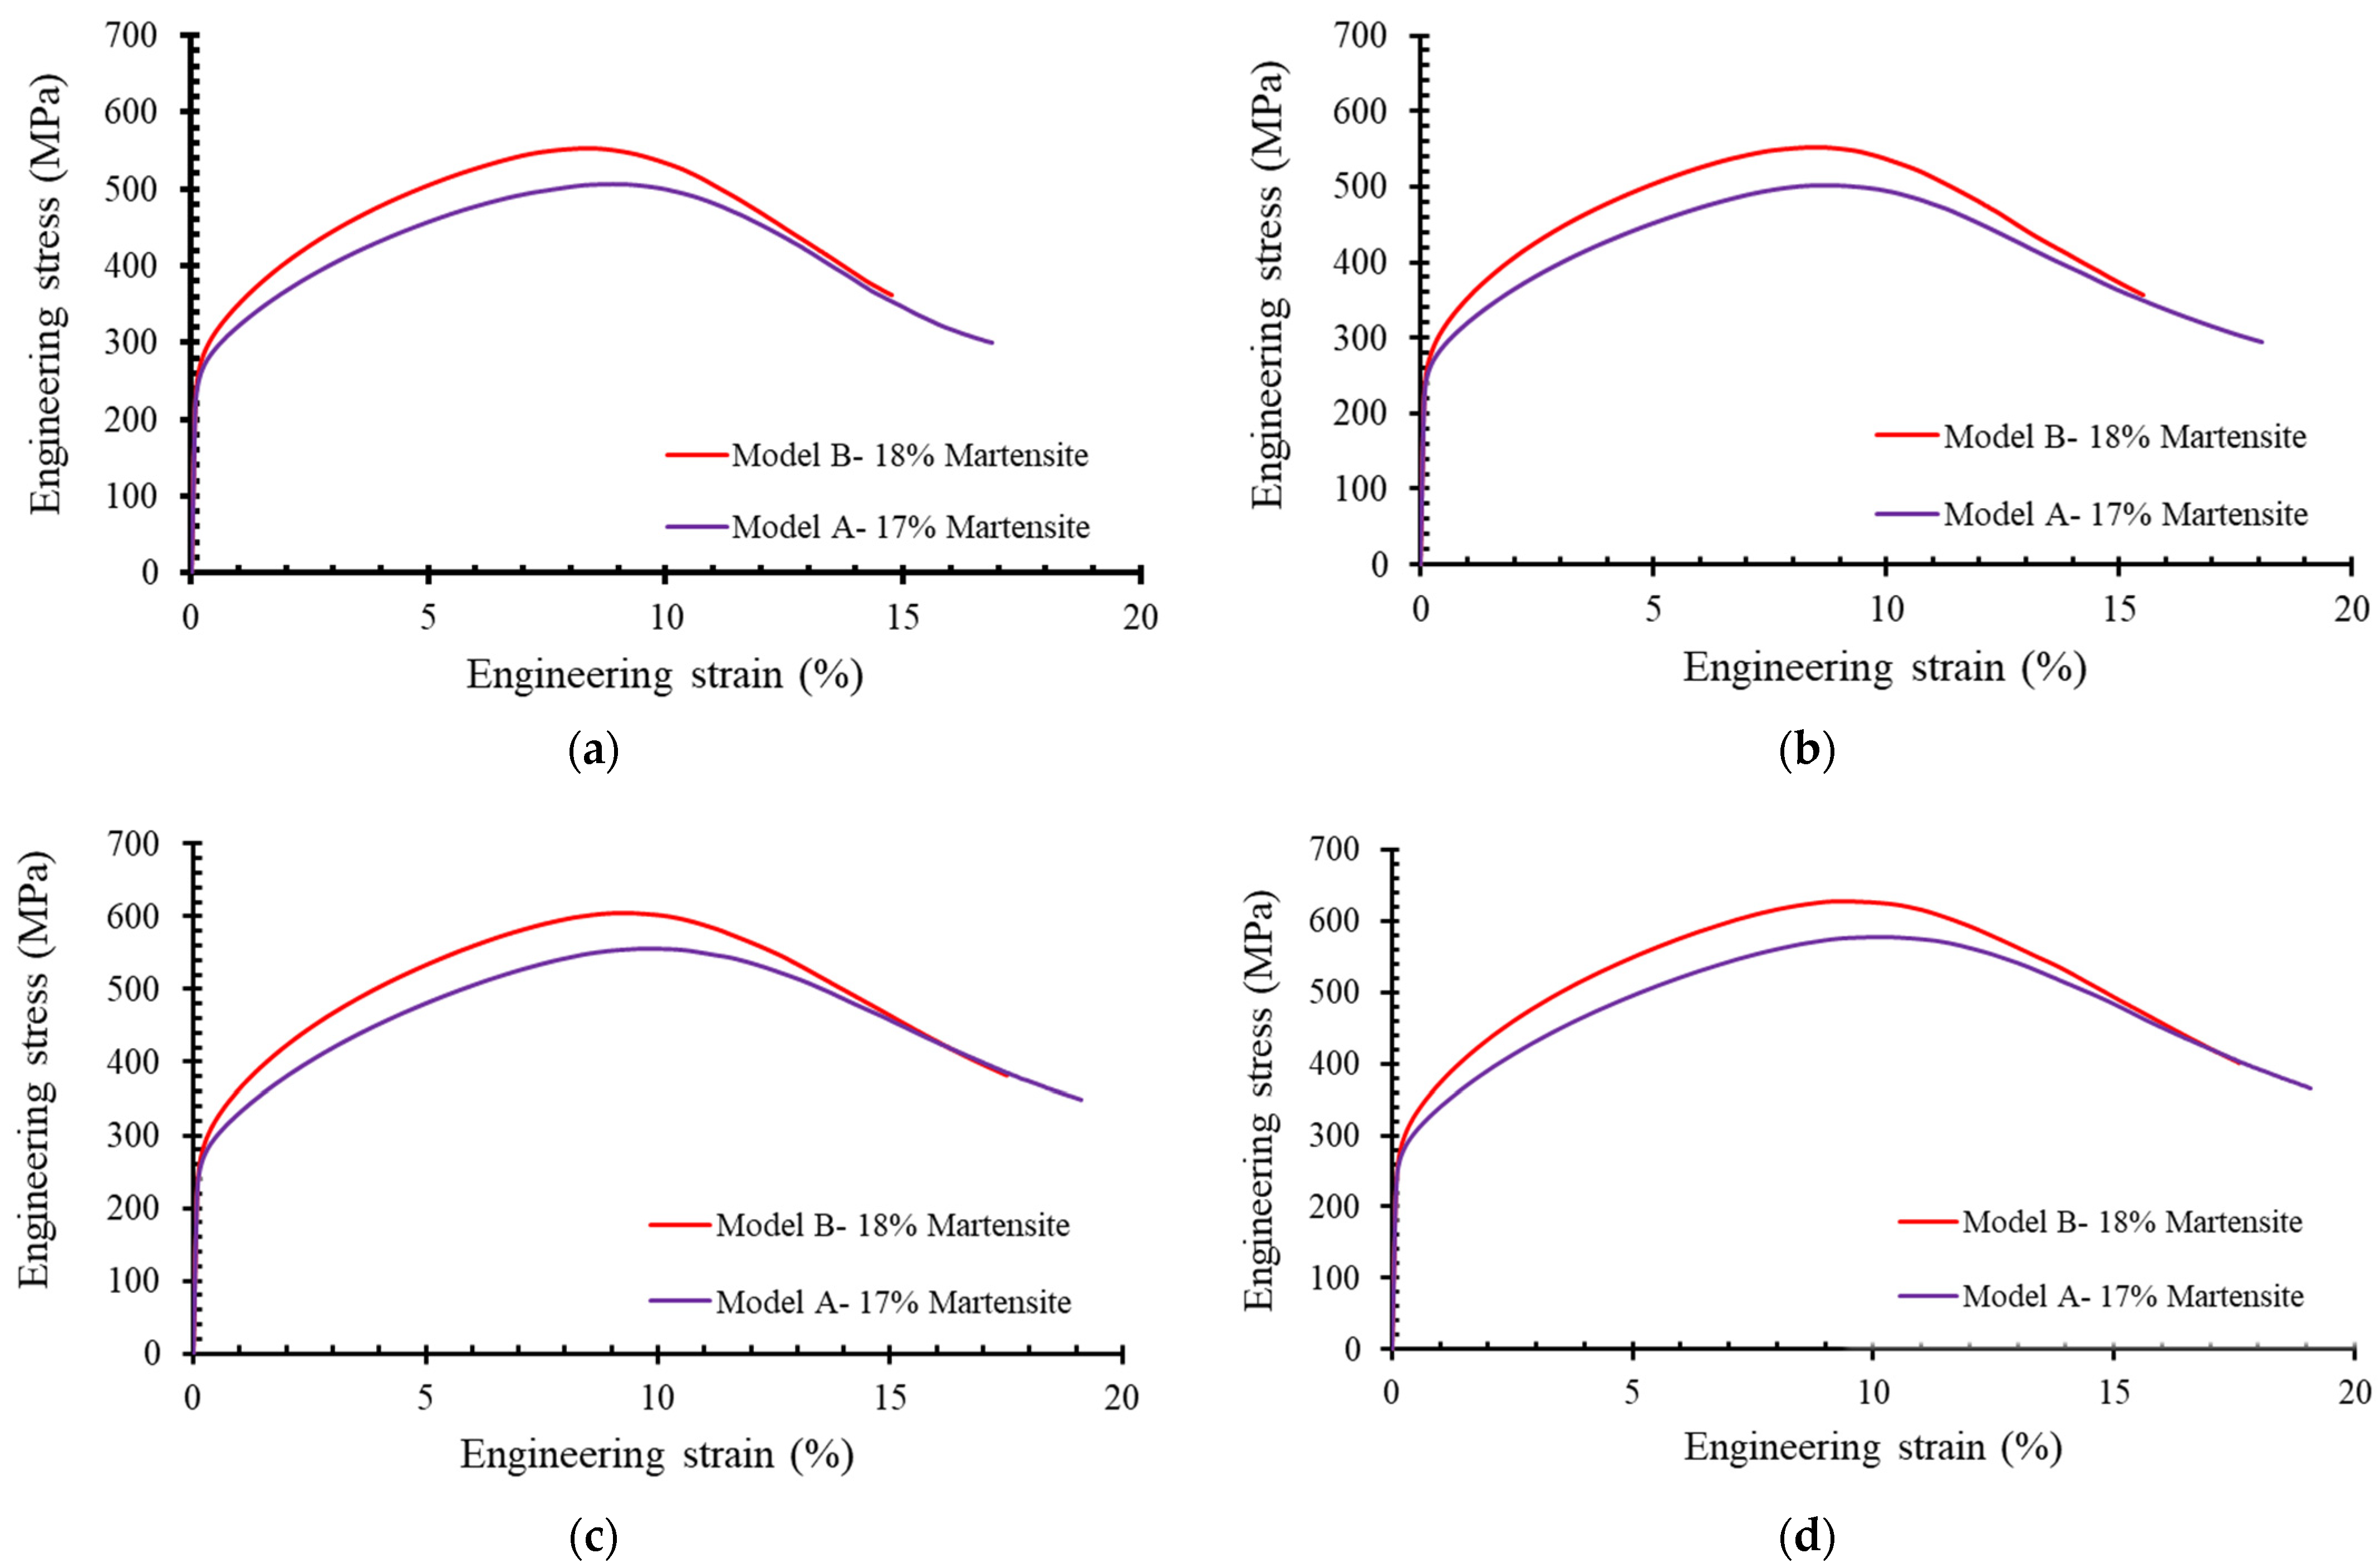
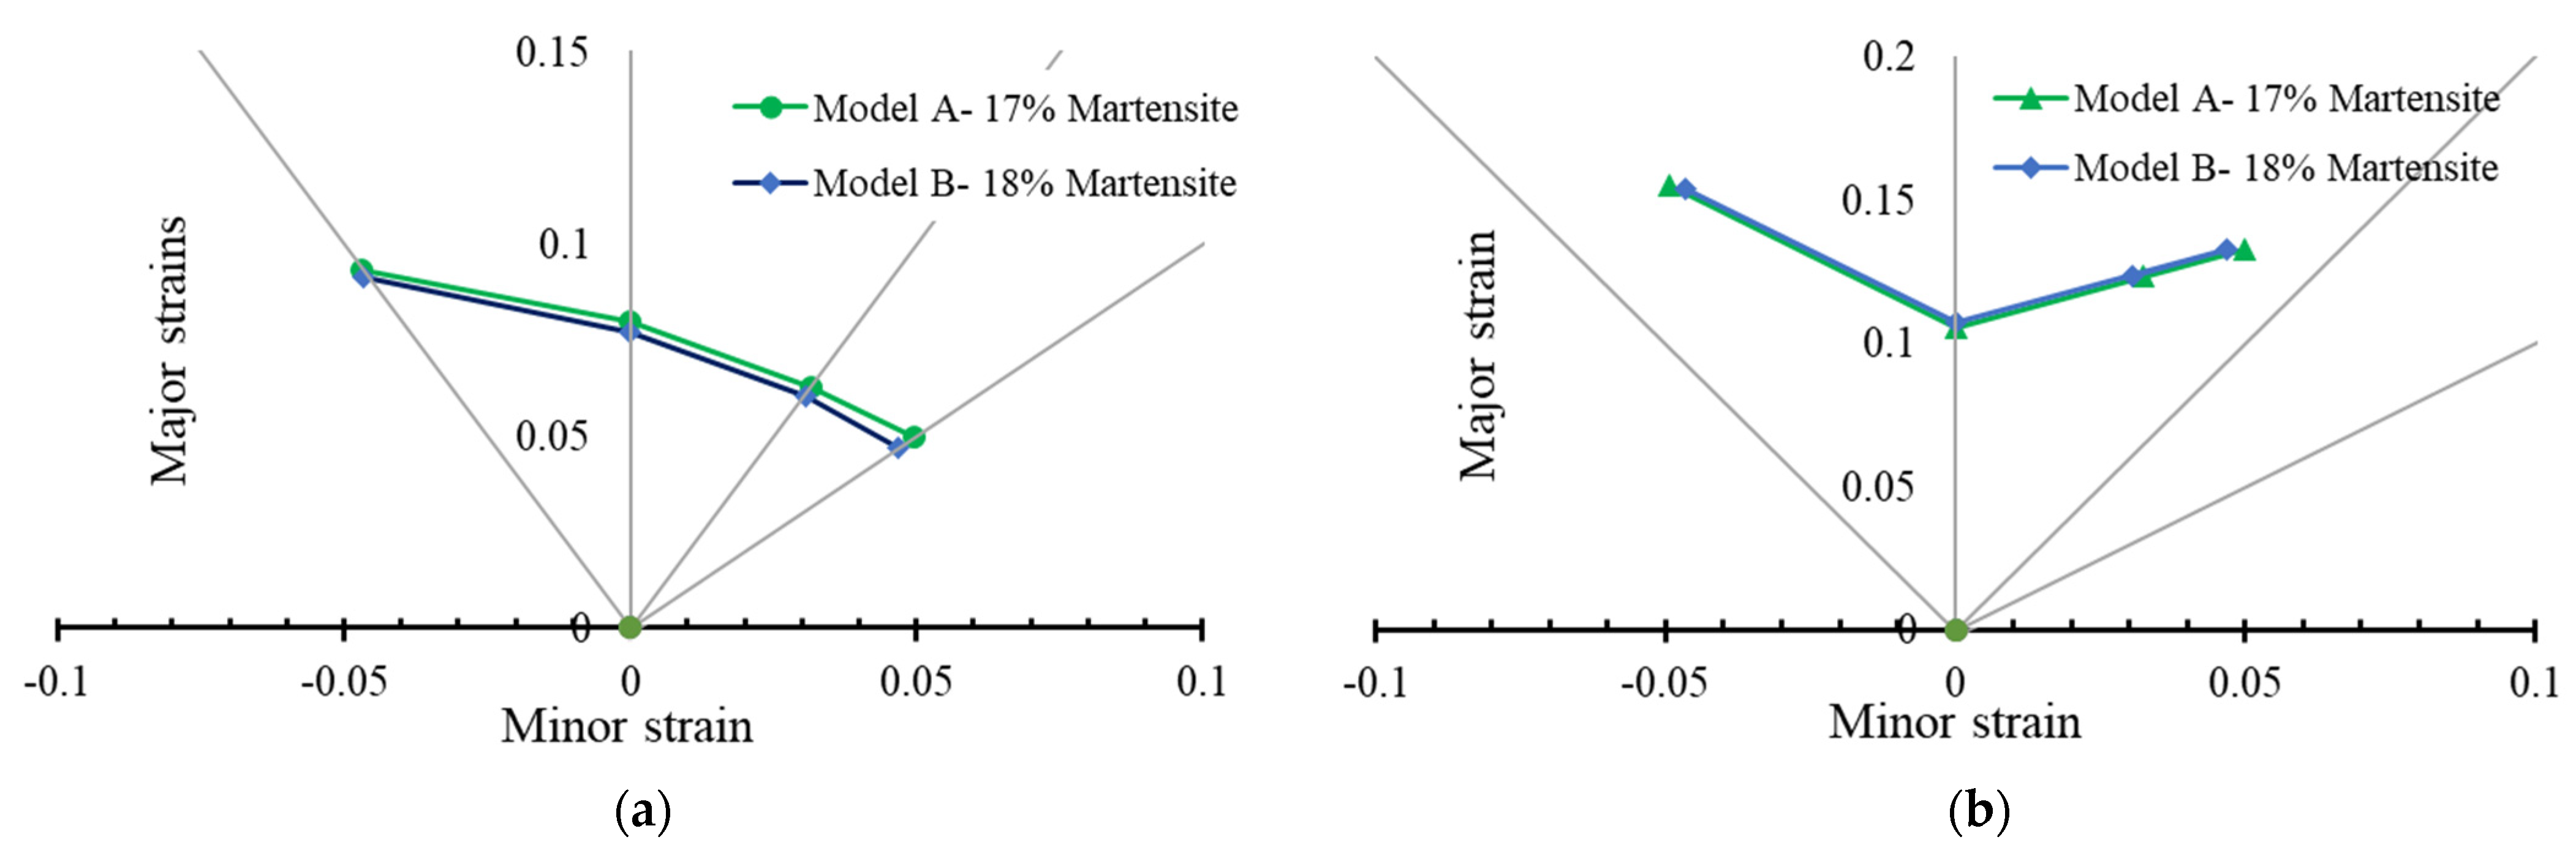
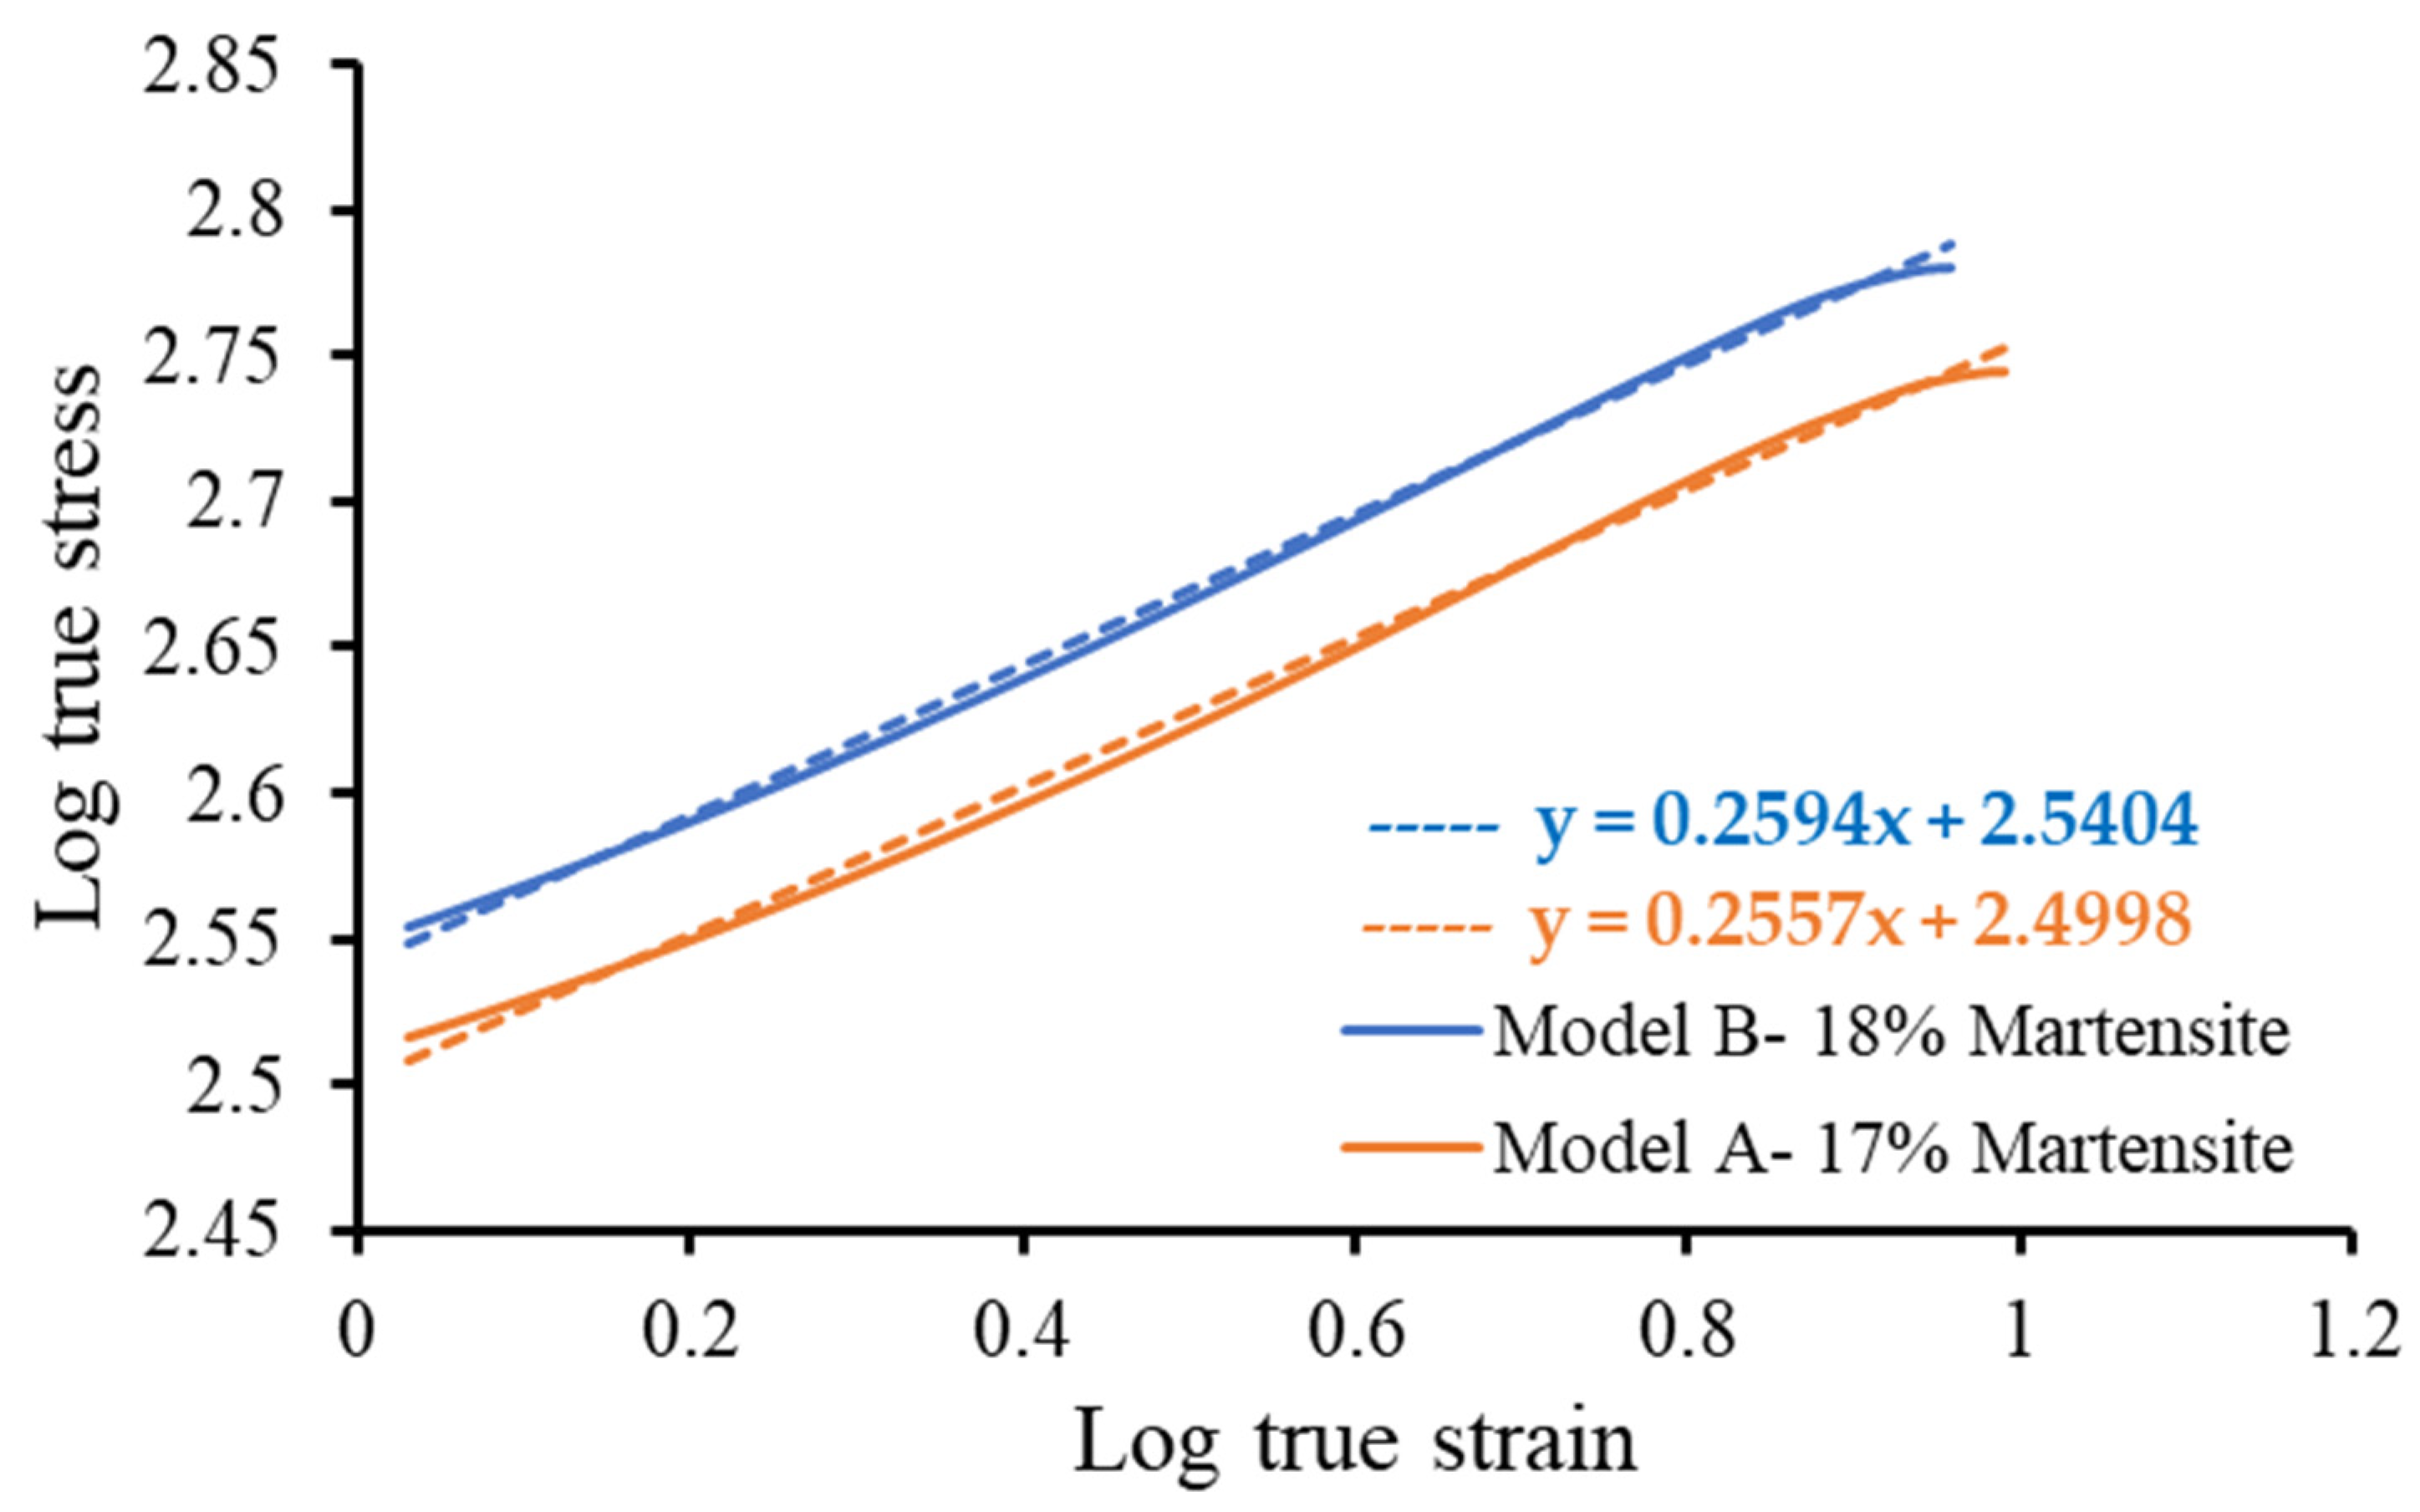
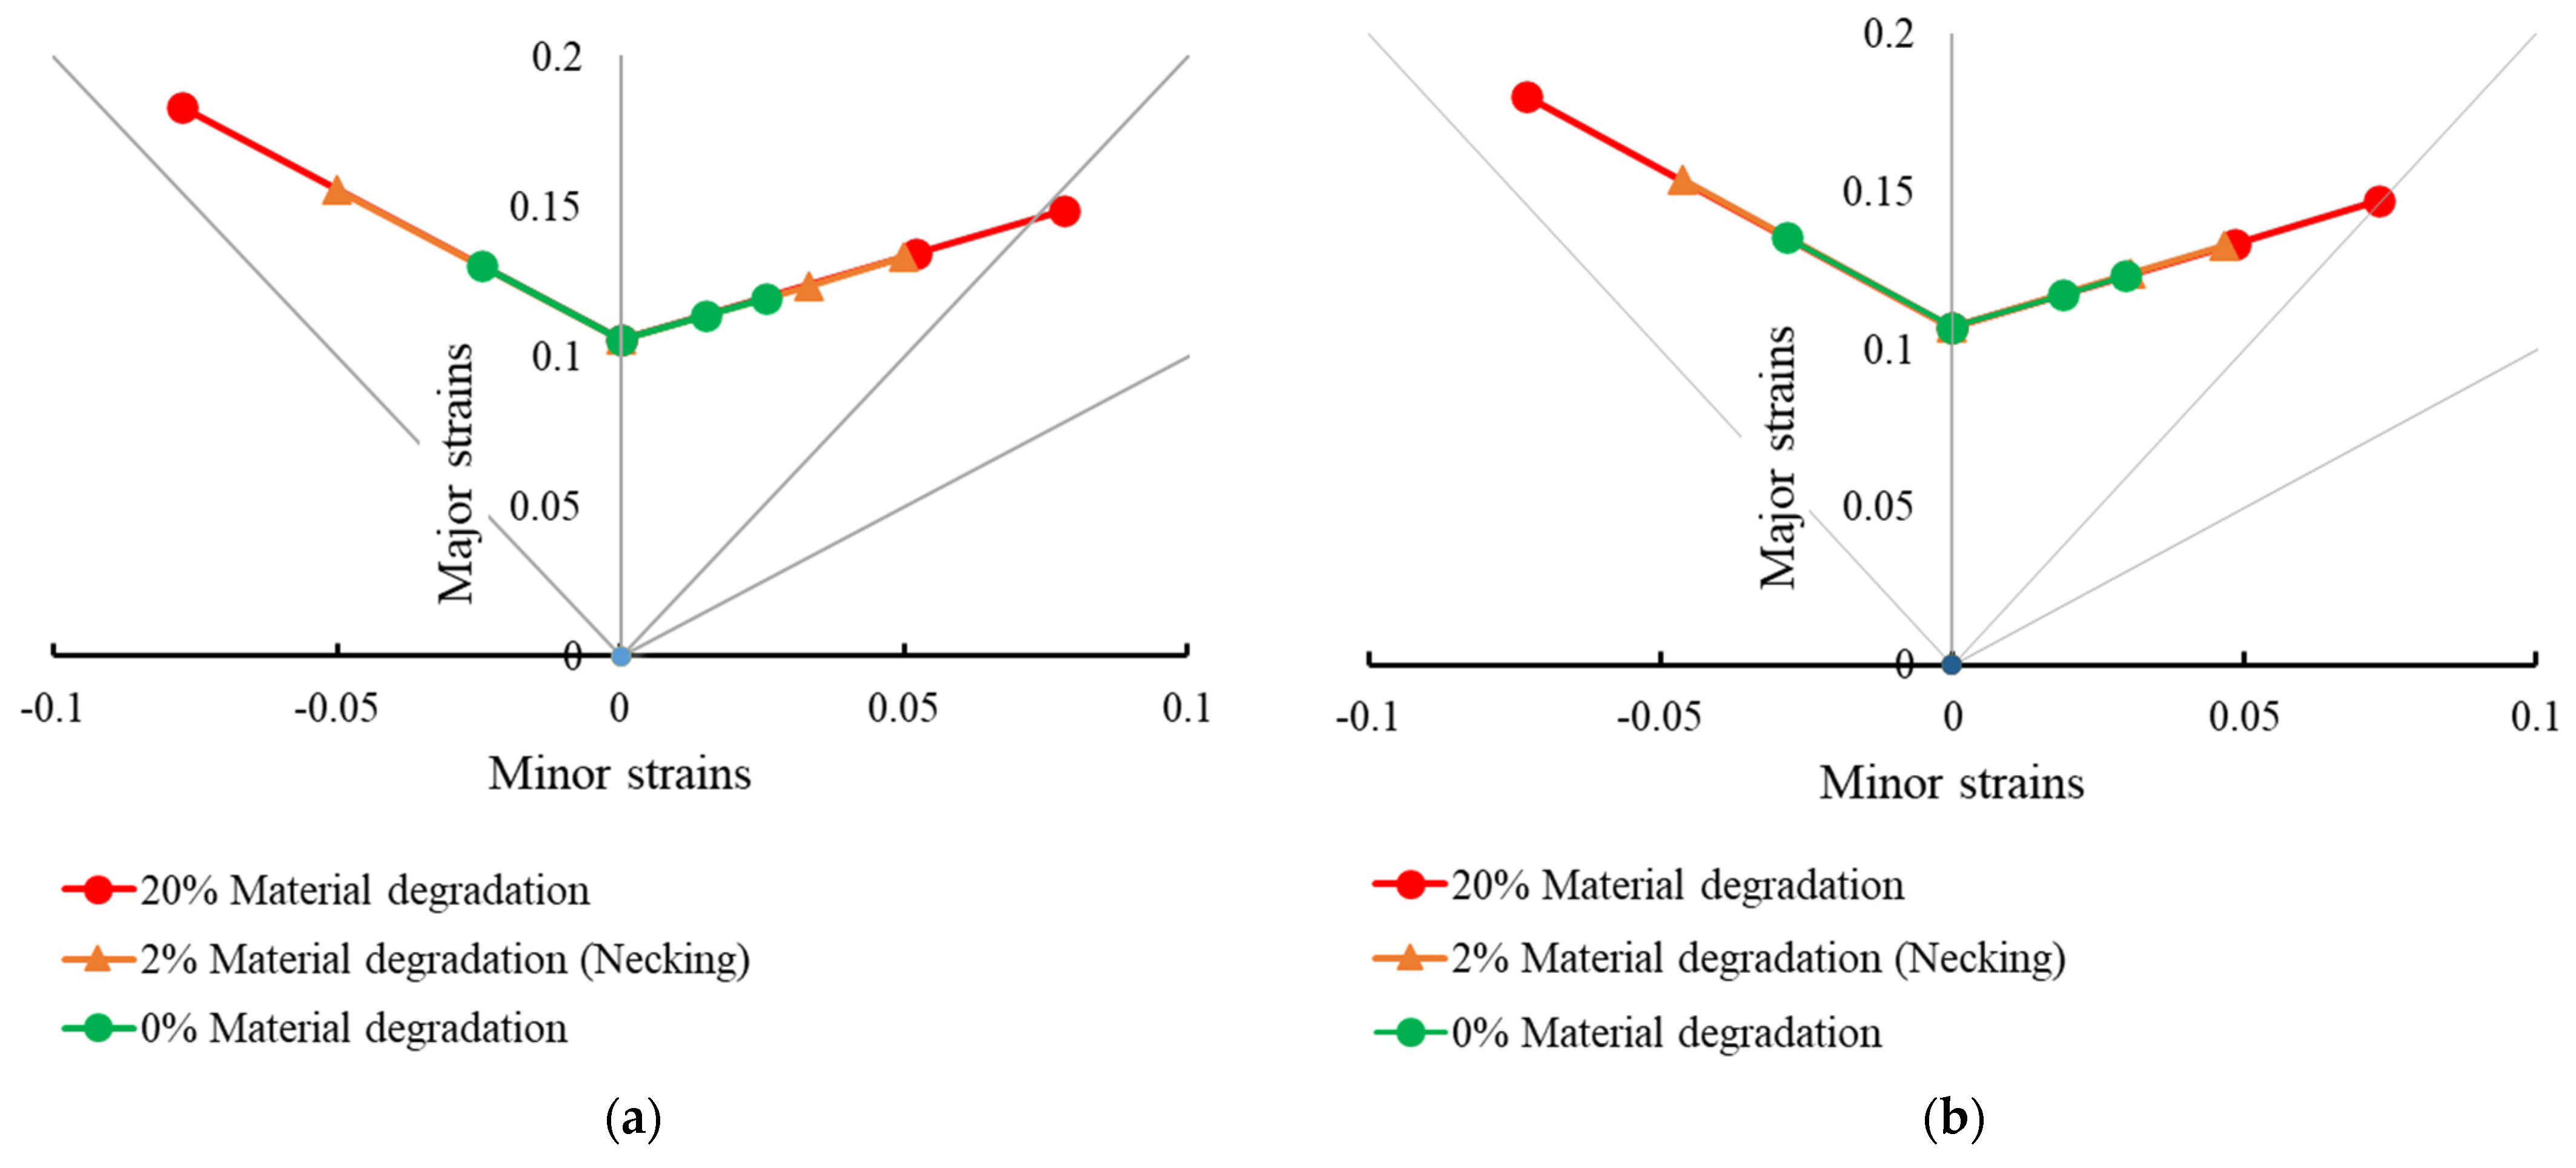
3.1. Effect of Martensite Fractions on Stress–Strain Curve and FLDs
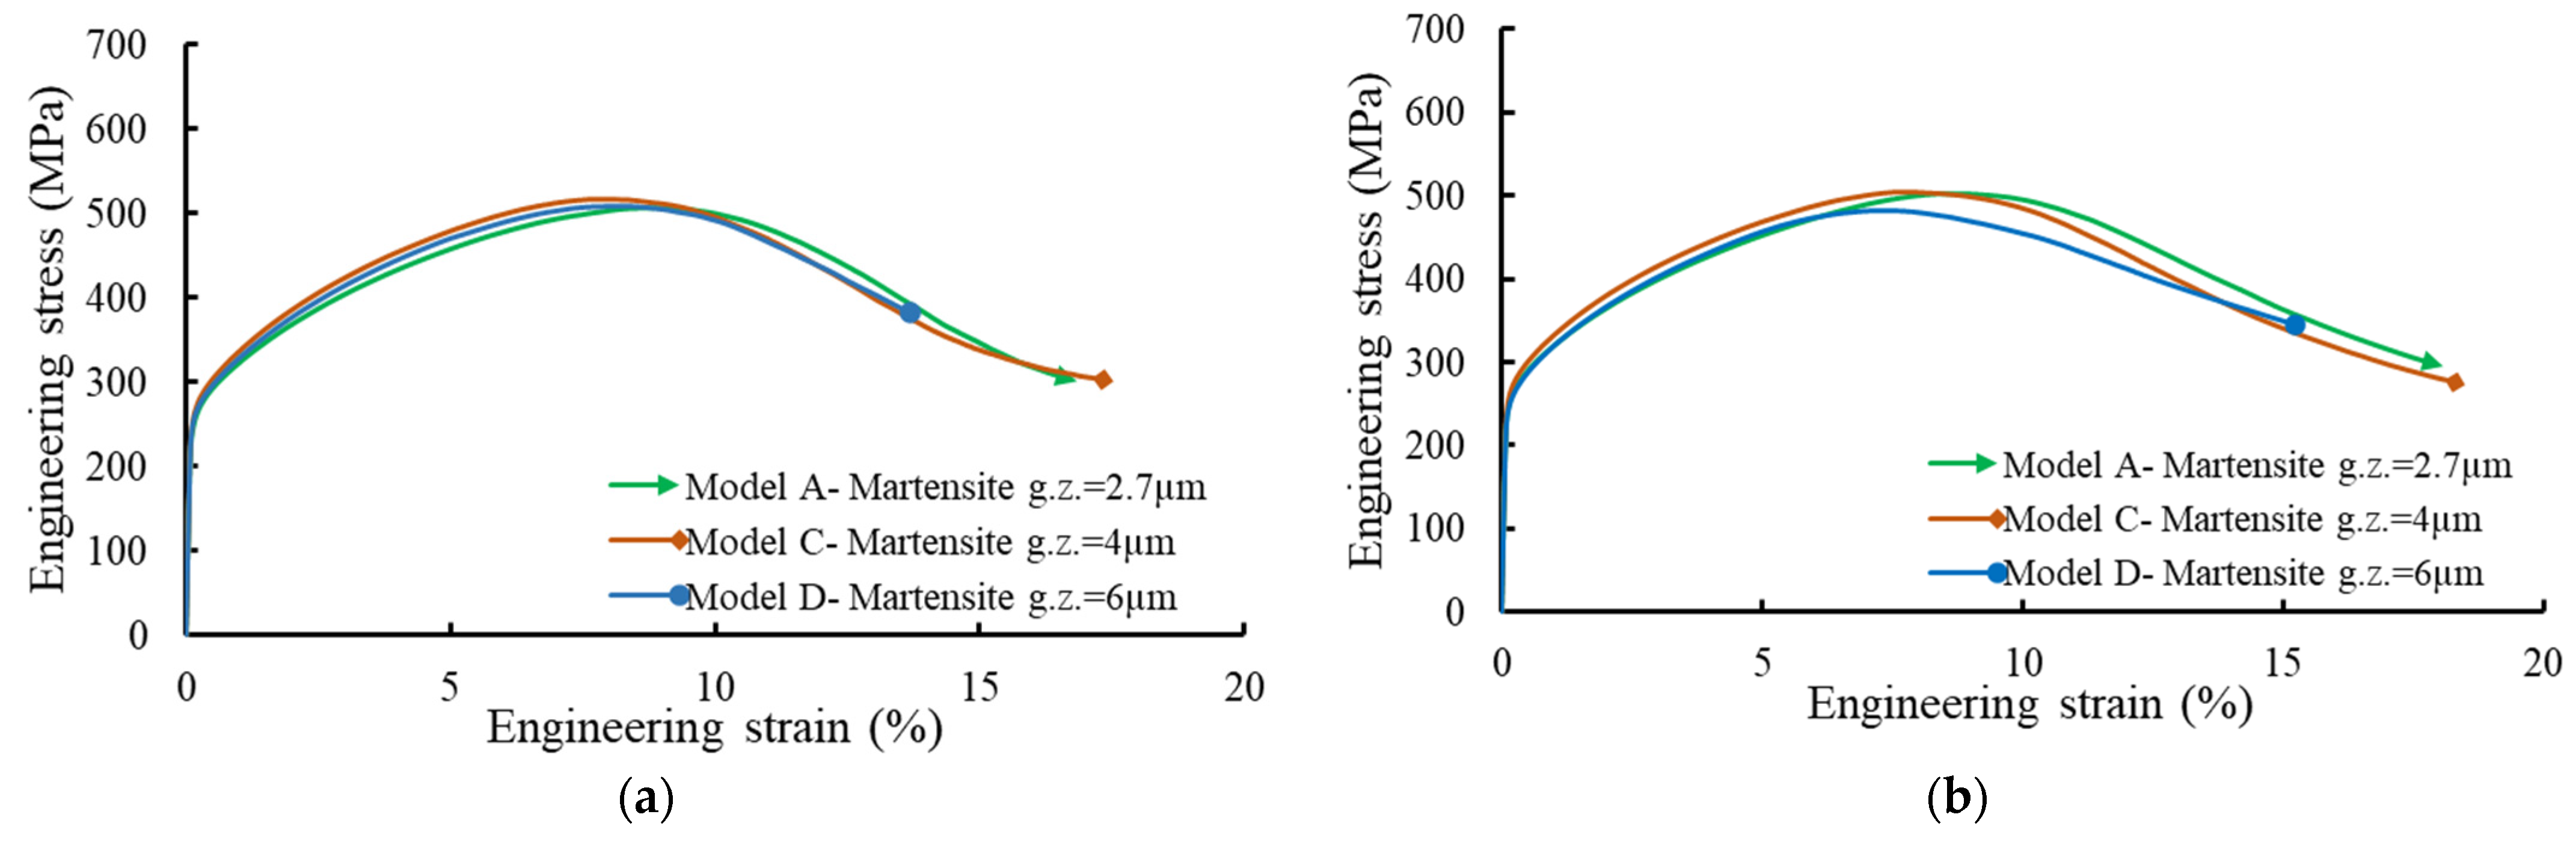
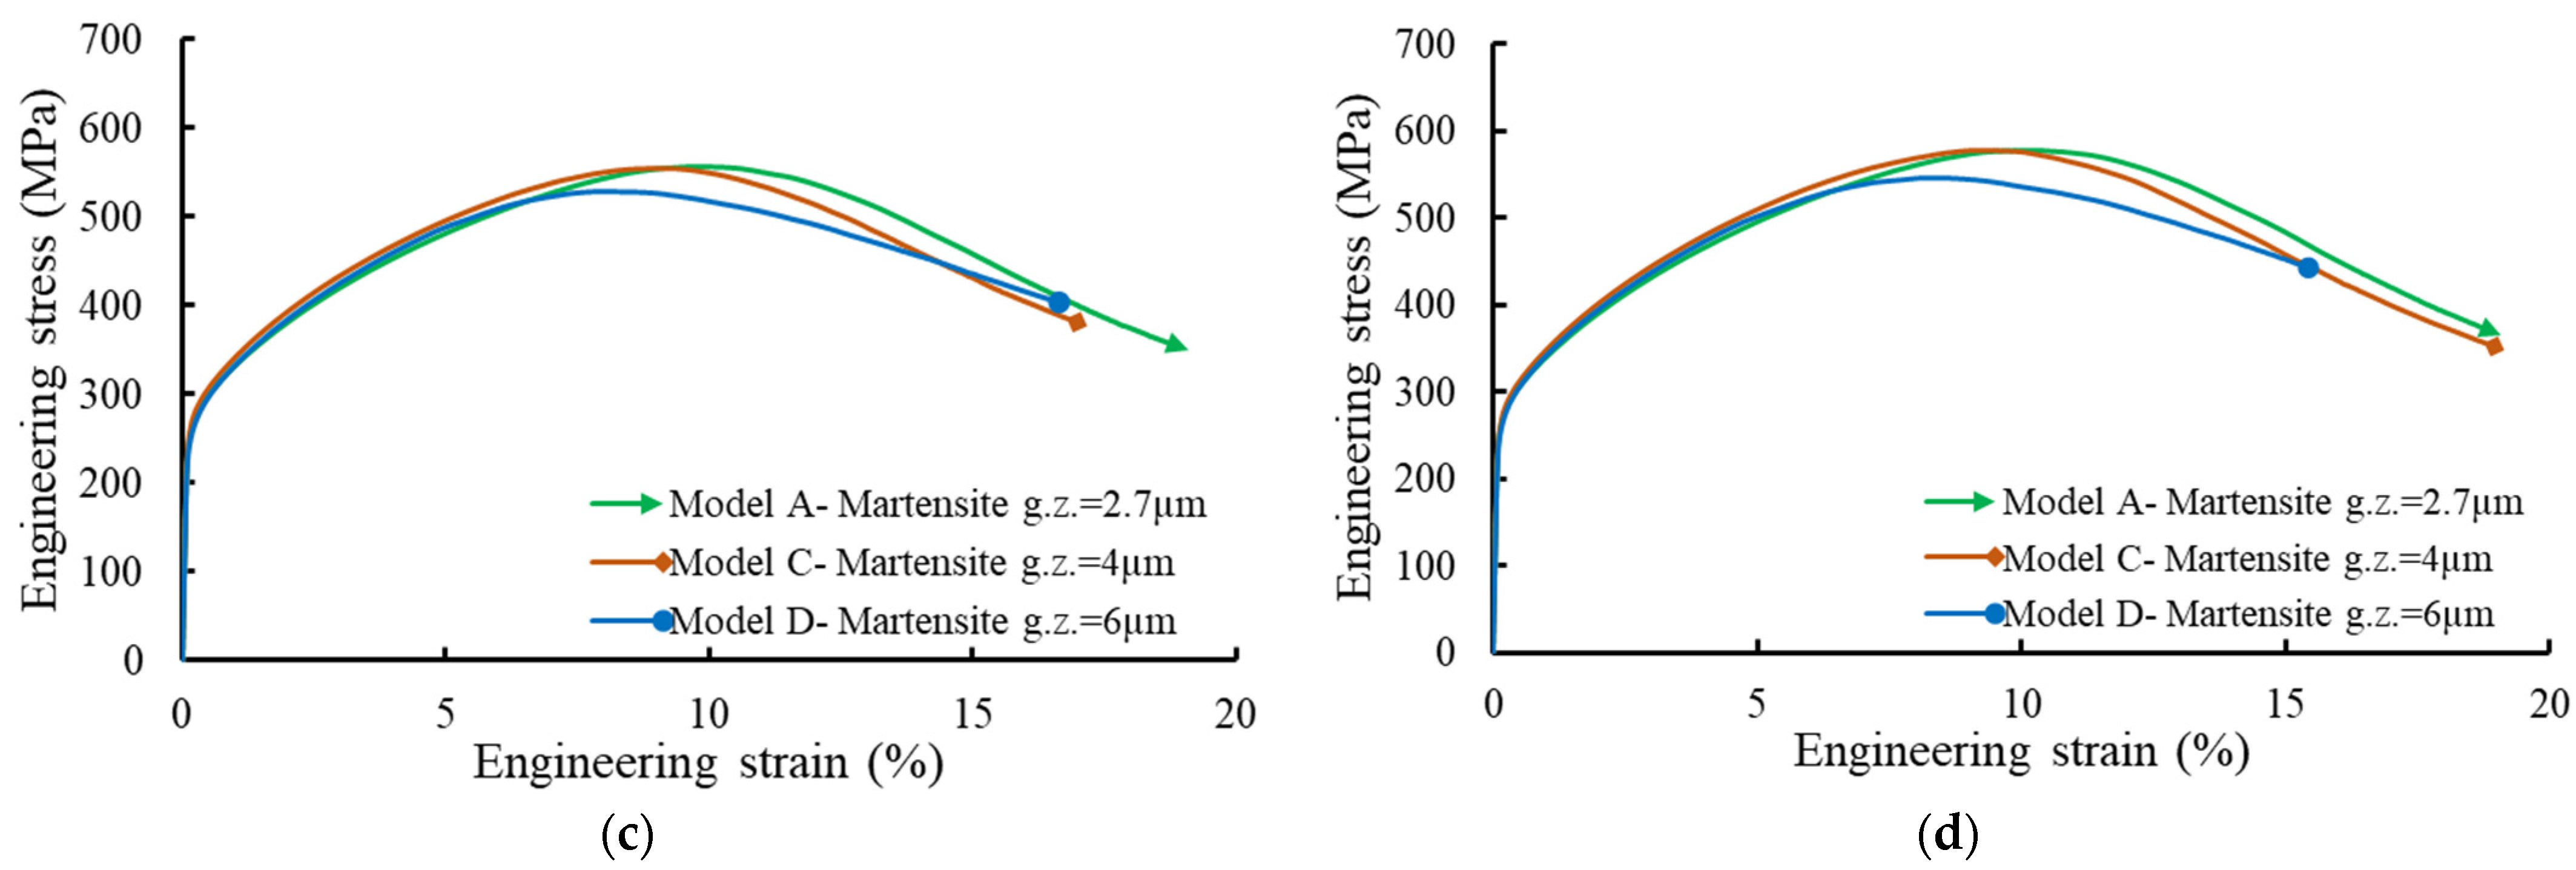
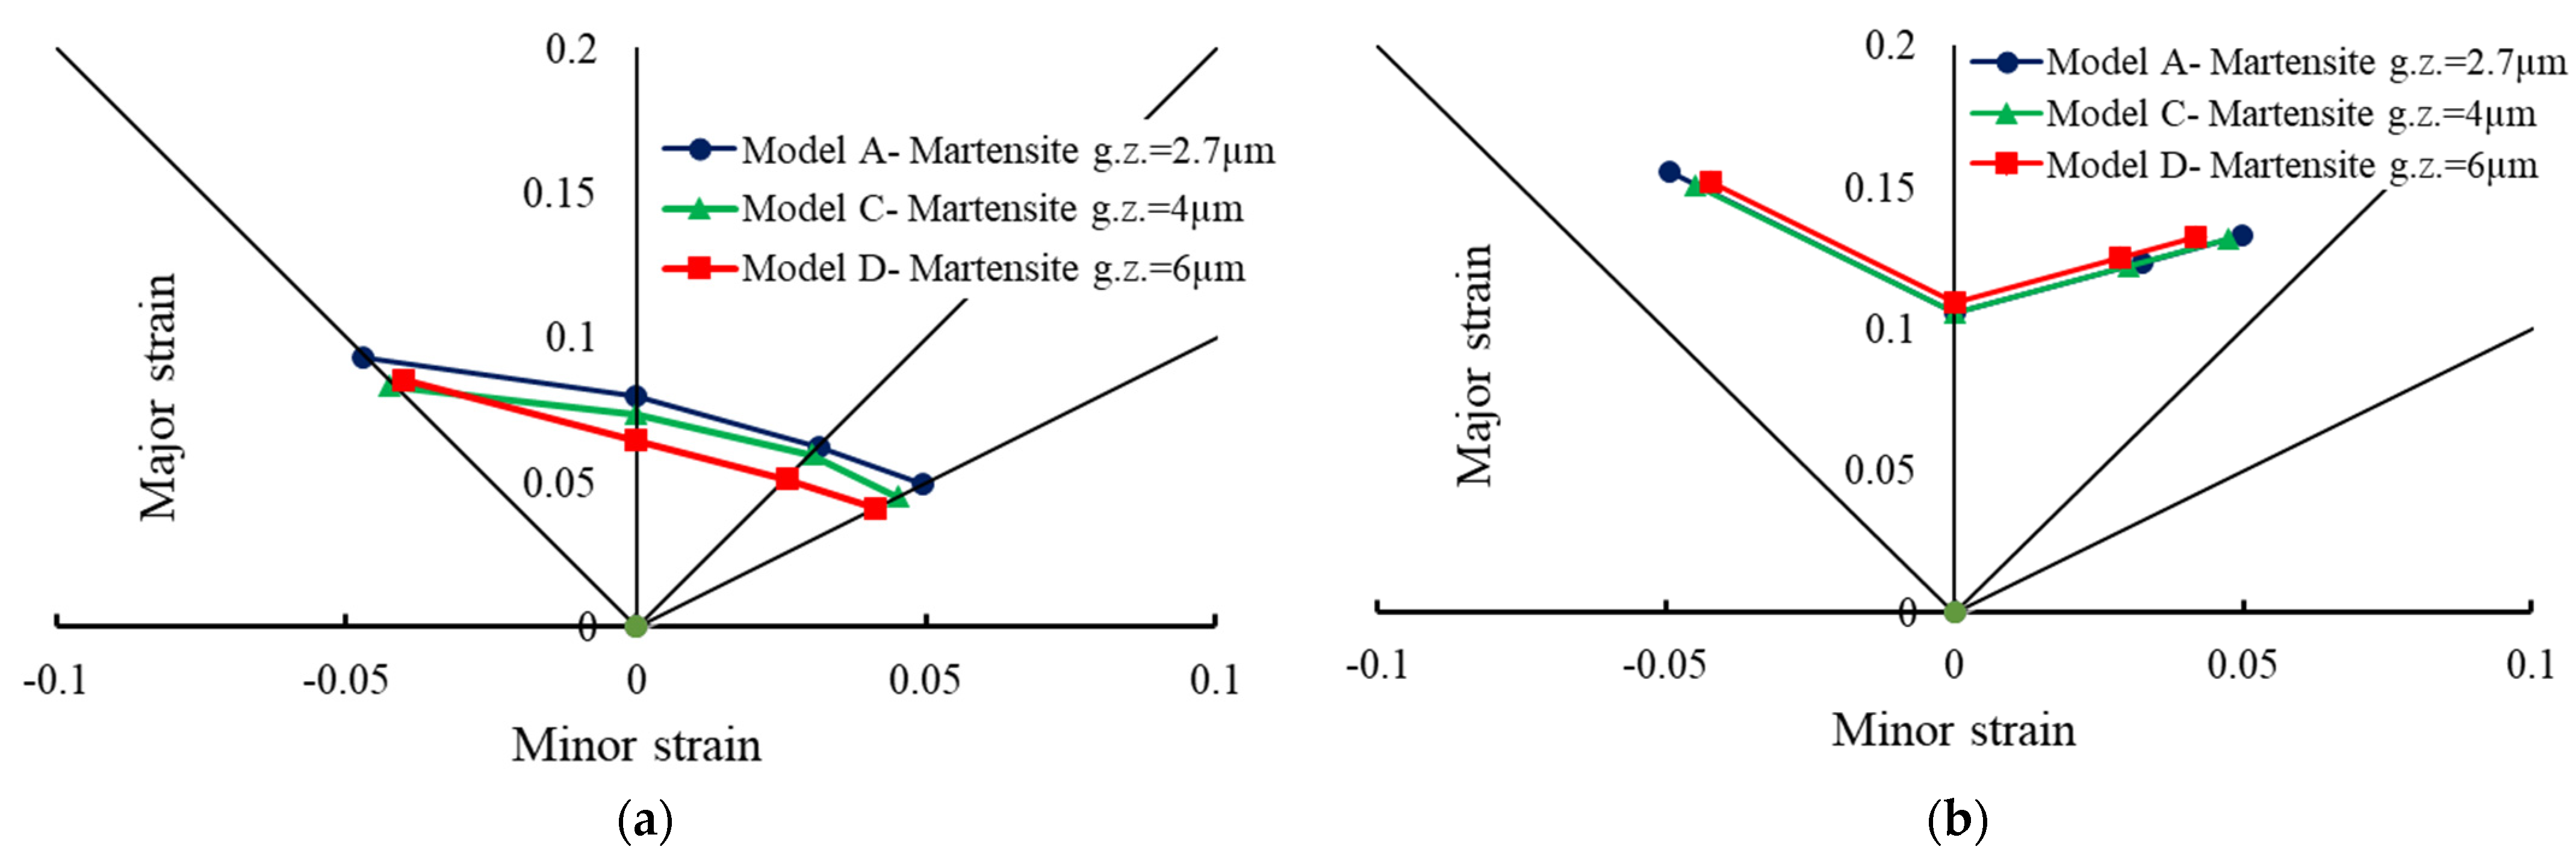
3.2. Effect of Martensite Grain Size on Stress–Strain Curve and FLDs
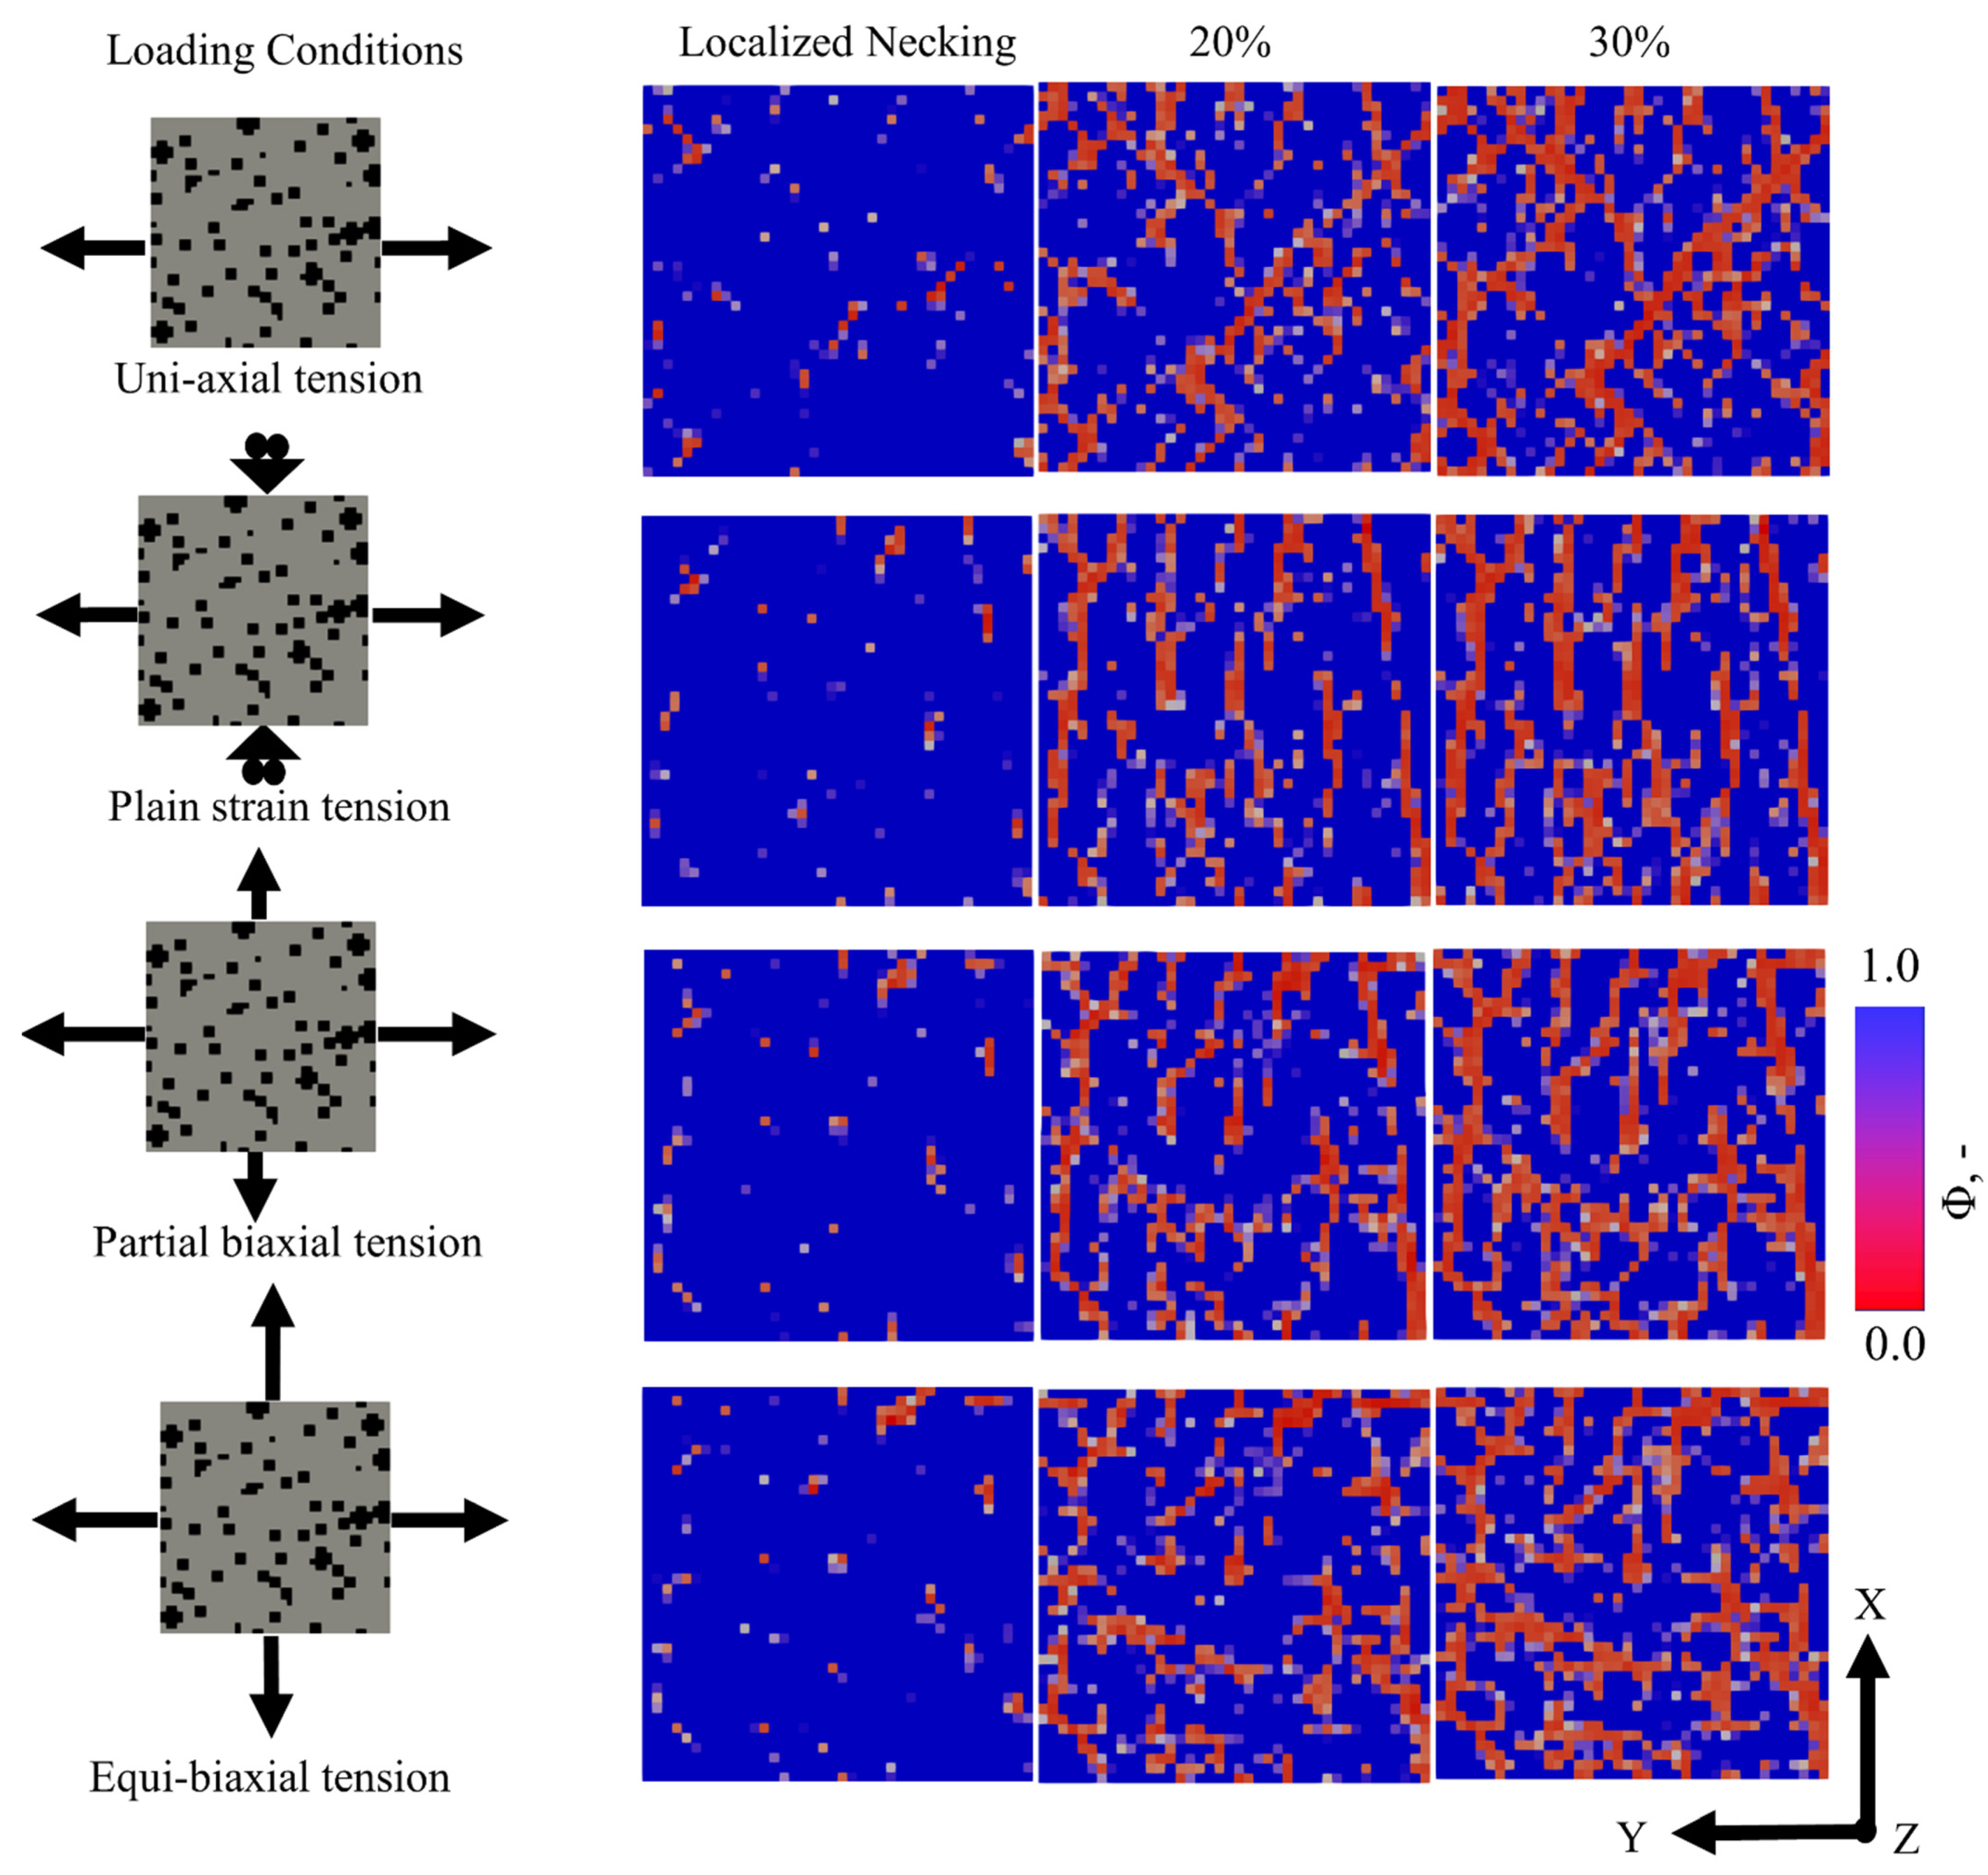
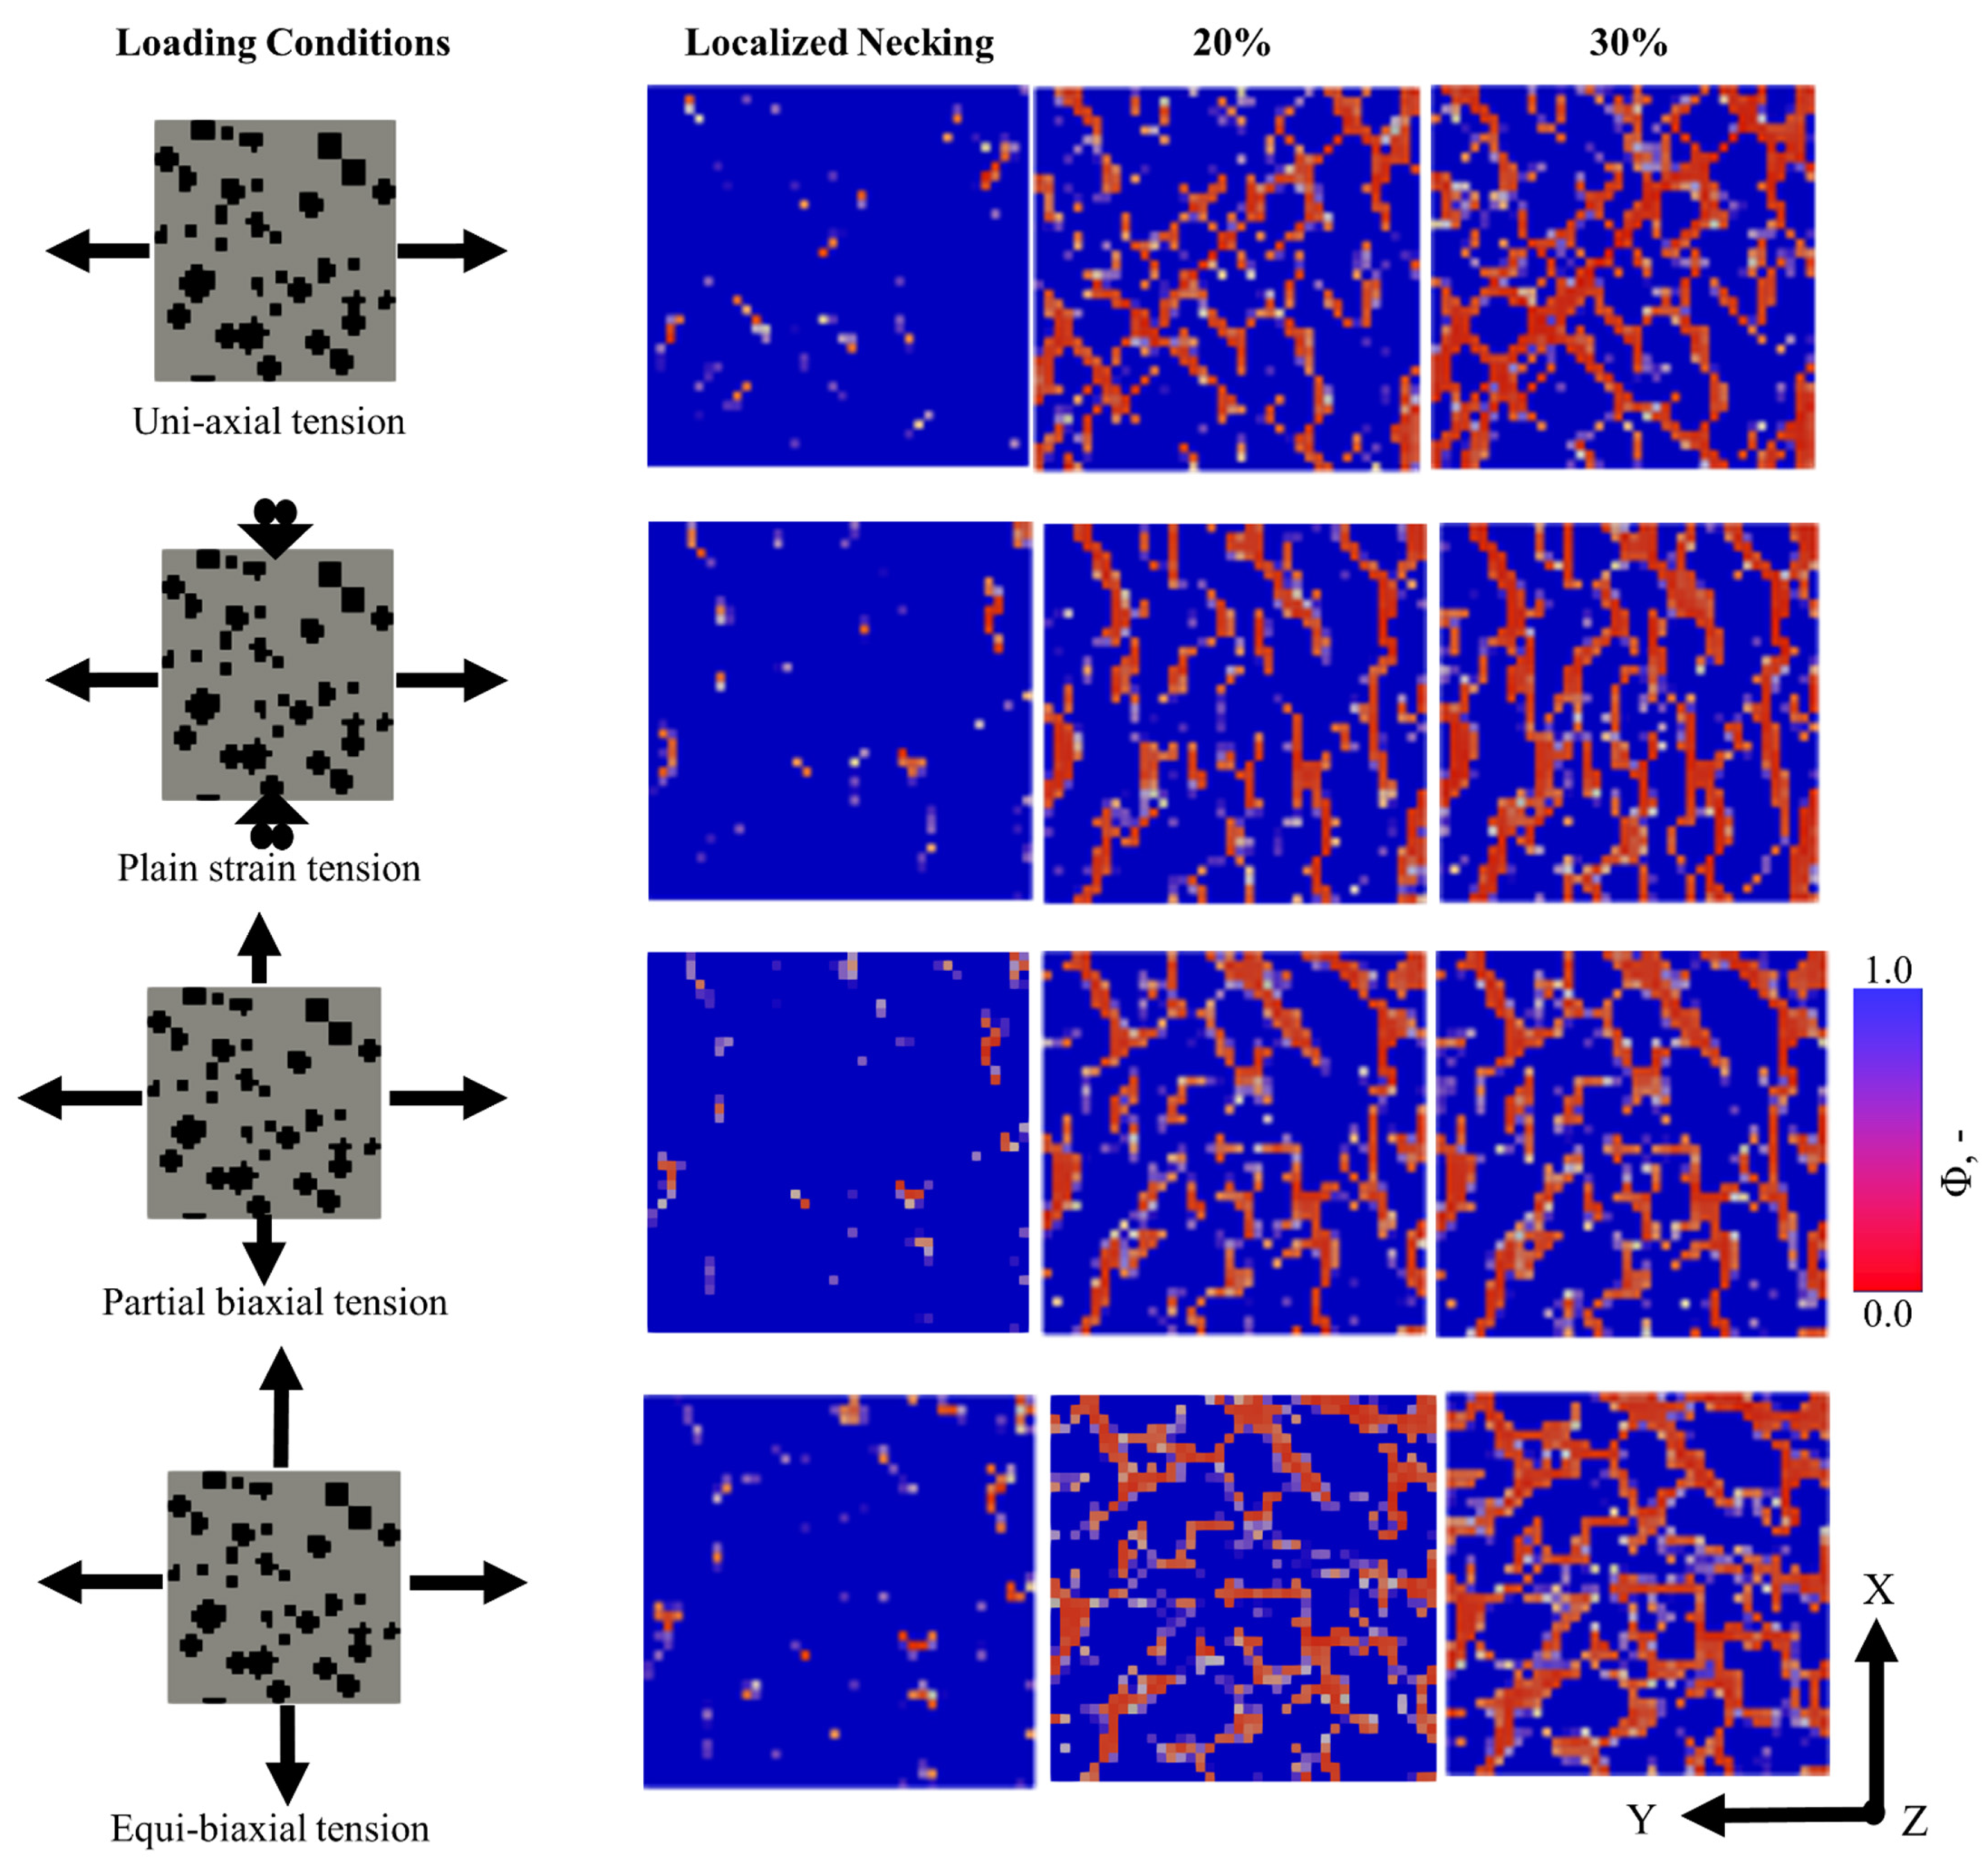
3.3. Necking Band
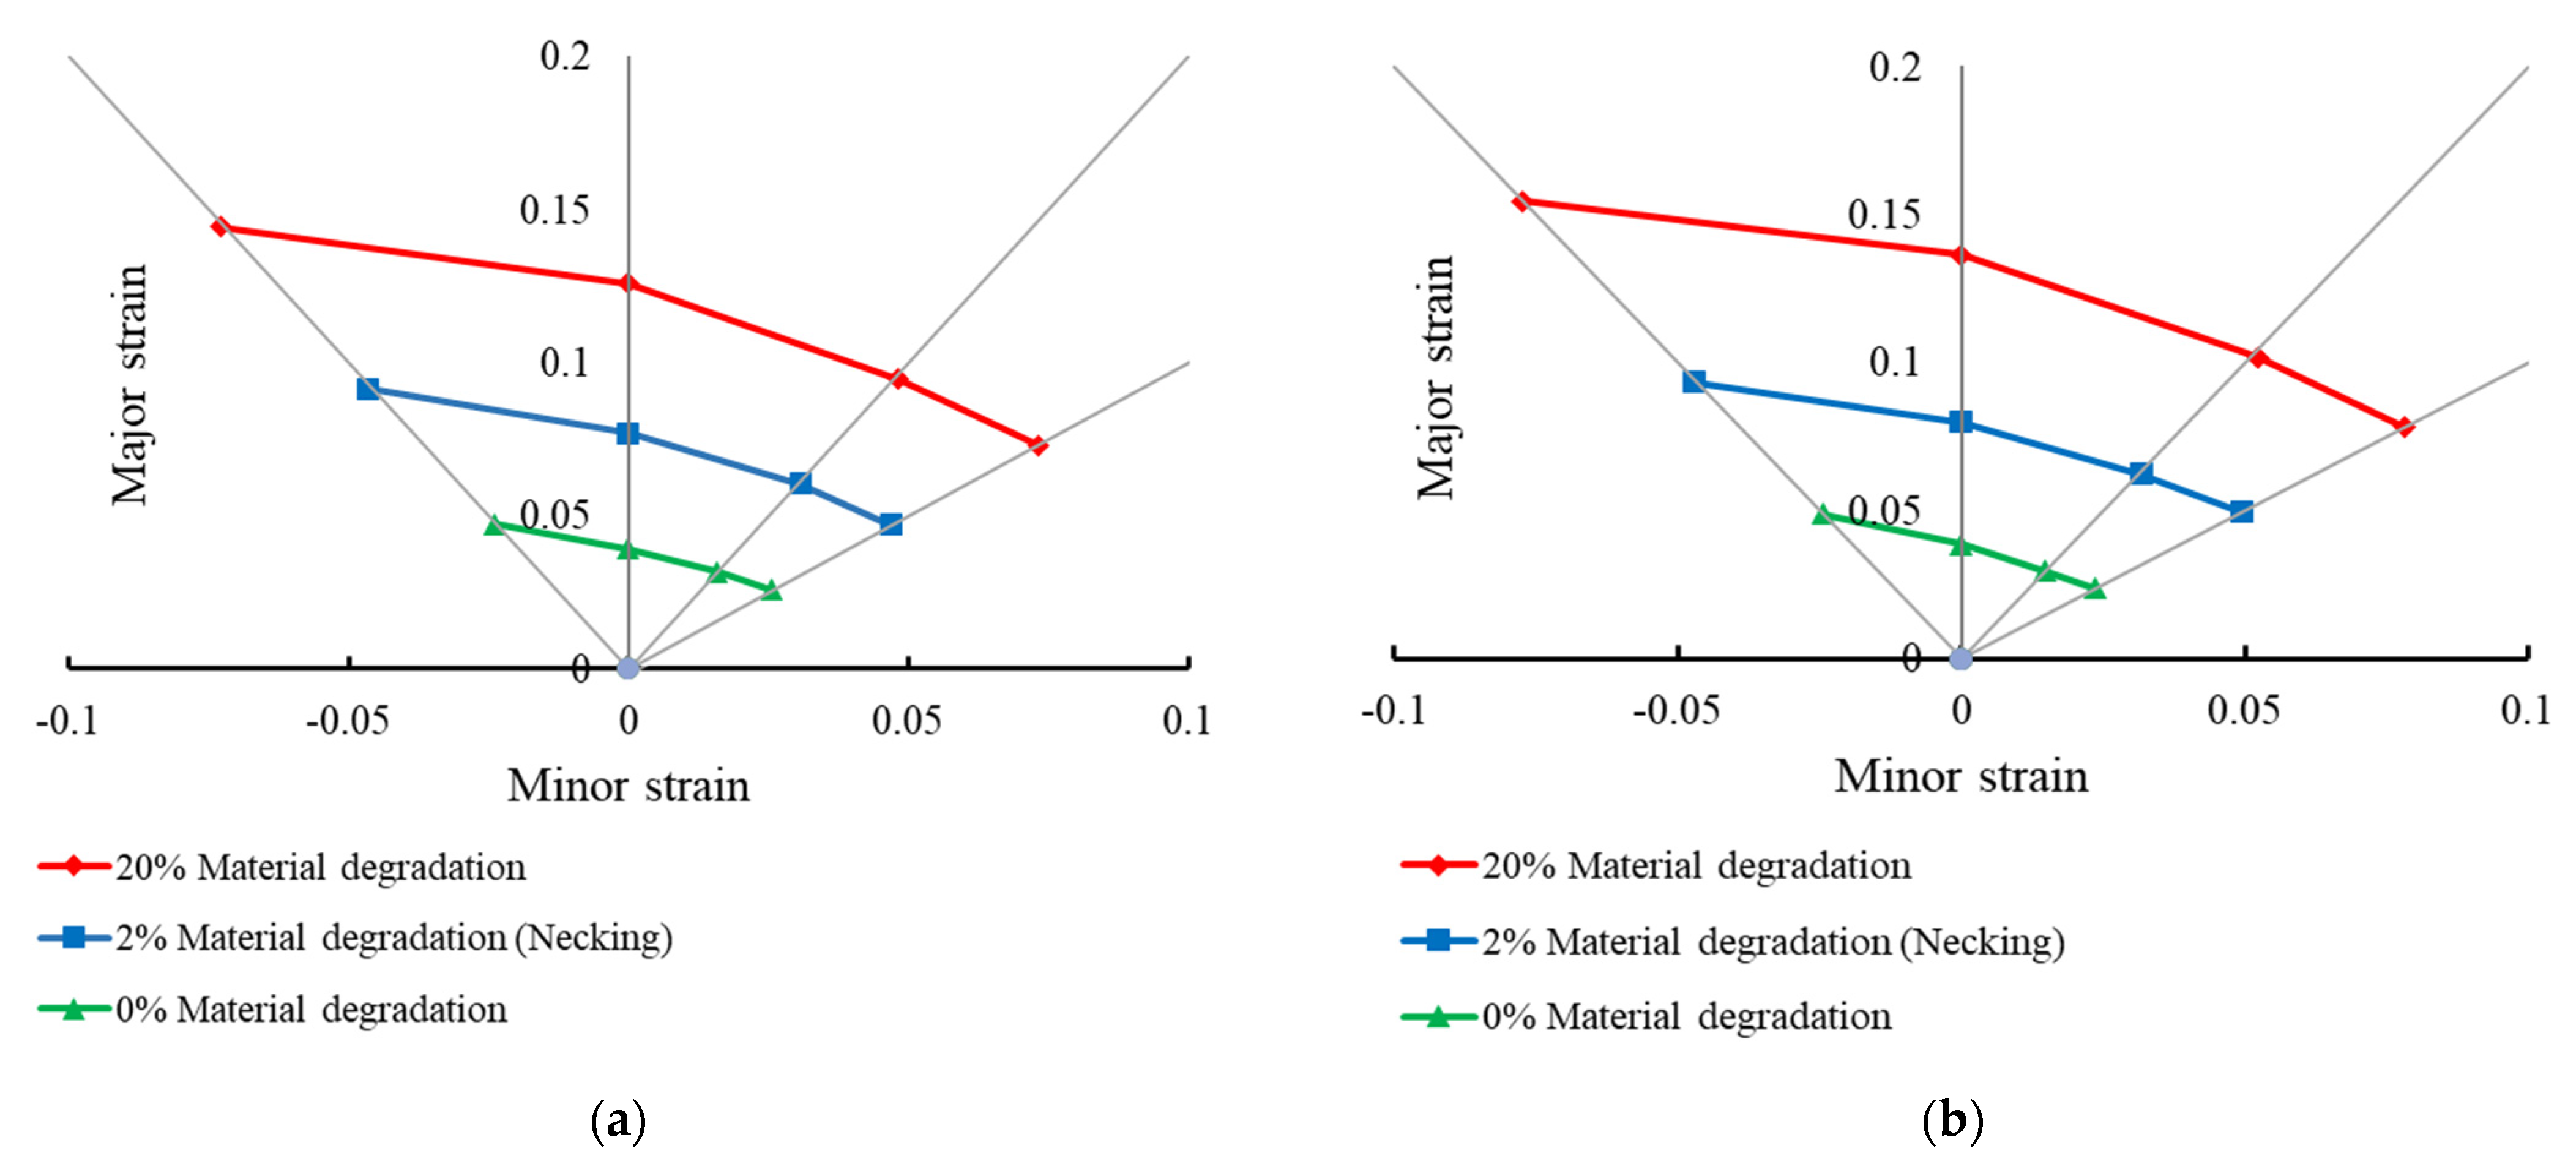
3.4. Local Damage Evolution
4. Discussion
5. Conclusions
- DAMASK can model FLDs of multi-phase materials with different loading conditions. Therefore, it can be used to study the effect of microstructural attributes on the formability of crystalline materials.
- There are some limitations in the K-B model; firstly, the equations did not introduce a significant difference in FLDs by using different martensite grain sizes. Secondly, they did not possess the traditional marginal zones of FLDs. Contrarily, the M-K approach was proved to have good efficacy and agreement with the previous study of Duancheng Ma [7]. Moreover, it can clarify differences in mechanical behavior influenced by varying grain sizes of martensite in FLDs. Consequently, it shows comparatively safe necking and damage zones for different loading conditions.
- In plotting FLDs, it was found that the lower the martensite fractions in DP steels, the better the formability. The precipitates of martensite act as obstacles, which restricts the slip deformation. Regarding martensite grain size in DP steels, the formability generally improves by decreasing martensite grain size. The higher strain hardening coefficient values (n-values), the better the formability because of comparatively low martensite phase fractions, which is a hard phase.
- Plastic work and strength values of biaxial loading cases are higher than those in uniaxial and plane strain loading. At the same time, the plastic work values increase by decreasing martensite fractions in DP steels.
- The difference in martensite grain sizes and loading conditions strongly affects the damage initiation and propagation behaviors of the RVEs, which could serve as a good guide on how to avoid damage propagation in the future.
Author Contributions
Funding
Institutional Review Board Statement
Informed Consent Statement
Data Availability Statement
Acknowledgments
Conflicts of Interest
Nomenclature
| Acronym | |
| Symbol | Description |
| CPFEM | Crystal plasticity finite element method |
| DAMASK | Düsseldorf Advanced Materials Simulation Kit |
| DP | Dual-phase steels |
| FEM | Finite Element Method |
| FFT | Fast Fourier Transform |
| FLD | Forming Limit Diagram |
| K-B equations | Keeler–Brazier equations |
| M-K approach | Marciniak and Kuczynski approach |
| RVE | Representative volume element |
| SP | Spectral method |
| g.z. | Grain Size (µm) |
Appendix A
Appendix A.1. Running Simulation via CP Spectral Solver
Appendix A.2. Postprocessing Stage
Appendix A.2.1. M-K Approach

Appendix A.2.2. K-B Approach

References
- Qayyum, F.; Guk, S.; Prahl, U. Studying the Damage Evolution and the Micro-Mechanical Response of X8CrMnNi16-6-6 TRIP Steel Matrix and 10% Zirconia Particle Composite Using a Calibrated Physics and Crystal-Plasticity-Based Numerical Simulation Model. Crystals 2021, 11, 759. [Google Scholar] [CrossRef]
- Umar, M.; Qayyum, F.; Farooq, M.U.; Khan, L.A.; Guk, S.; Prahl, U. Analyzing the cementite particle size and distribution in heterogeneous microstructure of C45EC steel using crystal plasticity based DAMASK code. In Proceedings of the 2021 International Bhurban Conference on Applied Sciences and Technologies (IBCAST), Islamabad, Pakistan, 12–16 January 2021; p. 6. [Google Scholar] [CrossRef]
- Qayyum, F.; Shah, M.; Ali, S.; Ali, U. Bulge hydroforming of tube by rubber mandrel without axial feed: Experiment and Numerical Simulation. In Proceedings of the First International Symposium on Automotive and Manufacturing Engineering (SAME), Islamabad, Pakistan, 11 November 2015; Volume 1, Number 7. pp. 19–26. [Google Scholar]
- Zaeimi, M.; Basti, A.; Alitavoli, M. Effect of martensite volume fraction on forming limit diagrams of dual-phase steel. J. Mater. Eng. Perform. 2015, 24, 1781–1789. [Google Scholar] [CrossRef]
- Mohrbacher, H. Advanced metallurgical concepts for DP steels with improved formability and damage resistance. In Proceedings of the International Symposium on New Developments in Advanced High-Strength Sheet Steels, Vail, CO, USA, 23–27 June 2013. [Google Scholar]
- Xiong, Z.; Kostryzhev, A.G.; Zhao, Y.; Pereloma, E.V. Microstructure evolution during the production of dual phase and transformation induced plasticity steels using modified strip casting simulated in the laboratory. Metals 2019, 9, 449. [Google Scholar] [CrossRef] [Green Version]
- Qayyum, F.; Umar, M.; Guk, S.; Schmidtchen, M.; Kawalla, R.; Prahl, U. Effect of the 3rd dimension within the representative volume element (Rve) on damage initiation and propagation during full-phase numerical simulations of single and multi-phase steels. Materials 2021, 14, 42. [Google Scholar] [CrossRef] [PubMed]
- Arrieux, R.; Bedrin, C.; Boivin, M. Determination of an Intrinsic Forming Limit Stress Diagram for isotropic metal sheets. In Proceedings of the 12th Biennial Congress of the IDDRG, Margherita, Italy, 24–28 May1982; pp. 61–71. [Google Scholar]
- Akinribide, O.J.; Mekgwe, G.N.; Ajibola, O.O.; Obadele, B.A.; Akinwamide, S.O.; Olubambi, P.A. Studies on Mechanical properties of graphite reinforced Ti (Cx, N1-x) using nanoindentation techniques. Procedia Manuf. 2019, 30, 604–610. [Google Scholar] [CrossRef]
- Tasan, C.C.; Hoefnagels, J.P.M.; Diehl, M.; Yan, D.; Roters, F.; Raabe, D. Strain localization and damage in dual phase steels investigated by coupled in-situ deformation experiments and crystal plasticity simulations. Int. J. Plast. 2014, 63, 198–210. [Google Scholar] [CrossRef] [Green Version]
- Ma, D. Assessment of full field crystal plasticity finite element method for forming limit diagram prediction. arXiv 2018, arXiv:1810.05742. [Google Scholar]
- Béres, G.; Weltsch, Z.; Tisza, M. Comparative study on theoretical and experimental evaluation of forming limit diagrams. In Proceedings of the IOP Conference Series: Materials Science and Engineering; IOP Publishing: Bristol, UK, 2018; Volume 426, p. 12005. [Google Scholar]
- Basak, S.; Bandyopadhyay, K.; Panda, S.K.; Saha, P. Prediction of formability of bi-axial pre-strained dual phase steel sheets using stress-based forming limit diagram. In Advances in Material Forming and Joining; Springer: Berlin/Heidelberg, Germany, 2015; pp. 167–192. [Google Scholar]
- Chang, K.-H. Chapter 13—Sheet Metal Forming Simulation; Chang, K.-H.B.T.-D., Ed.; Academic Press: Boston, MA, USA, 2015; pp. 685–741. ISBN 978-0-12-382038-9. [Google Scholar]
- Hussain, N.; Qayyum, F.; Pasha, R.A.; Shah, M. Development of multi-physics numerical simulation model to investigate thermo-mechanical fatigue crack propagation in an autofrettaged gun barrel. Def. Technol. 2020, 17, 1579–1591. [Google Scholar] [CrossRef]
- Qayyum, F.; Guk, S.; Kawalla, R.; Prahl, U. On attempting to create a virtual laboratory for application-oriented microstructural optimization of multi-phase materials. Appl. Sci. 2021, 11, 1506. [Google Scholar] [CrossRef]
- Bruschi, S.; Altan, T.; Banabic, D.; Bariani, P.F.; Brosius, A.; Cao, J.; Ghiotti, A.; Khraisheh, M.; Merklein, M.; Tekkaya, A.E. Testing and modelling of material behaviour and formability in sheet metal forming. CIRP Ann. 2014, 63, 727–749. [Google Scholar] [CrossRef]
- Hutchinson, J.W. Bounds and Self-Consistent Estimates for Creep of Polycrystalline Materials. Proc. R. Soc. A Math. Phys. Eng. Sci. 1976, 348, 101–127. [Google Scholar] [CrossRef]
- Michel, J.C.; Moulinec, H.; Suquet, P. A computational scheme for linear and non-linear composites with arbitrary phase contrast. Int. J. Numer. Methods Eng. 2001, 52, 139–160. [Google Scholar] [CrossRef]
- Diehl, M.; An, D.; Shanthraj, P.; Zaefferer, S.; Roters, F.; Raabe, D. Crystal plasticity study on stress and strain partitioning in a measured 3D dual phase steel microstructure. Phys. Mesomech. 2017, 20, 311–323. [Google Scholar] [CrossRef]
- McHugh, P.; Asaro, J.; Shih, C. Texture development and strain hardening in rate dependent polycrystals. Acta Metall. Mat. 1993, 41, 1461–1477. [Google Scholar] [CrossRef]
- Umar, M.; Qayyum, F.; Farooq, M.U.; Guk, S.; Kirschner, M.; Korpala, G.; Prahl, U. Exploring the Structure–Property Relationship in Spheroidized C45EC Steel Using Full Phase Crystal Plasticity Numerical Simulations. Steel Res. Int. 2021, 93. [Google Scholar] [CrossRef]
- Umar, M.; Qayyum, F.; Farooq, M.U.; Khan, L.A.; Guk, S.; Prahl, U. Investigating the Effect of Cementite Particle Size and Distribution on Local Stress and Strain Evolution in Spheroidized Medium Carbon Steels using Crystal Plasticity-Based Numerical Simulations. Steel Res. Int. 2020, 92. [Google Scholar] [CrossRef]
- Shanthraj, P.; Svendsen, B.; Sharma, L.; Roters, F.; Raabe, D. Elasto-viscoplastic phase field modelling of anisotropic cleavage fracture. J. Mech. Phys. Solids 2017, 99, 19–34. [Google Scholar] [CrossRef]
- Roters, F.; Diehl, M.; Shanthraj, P.; Eisenlohr, P.; Reuber, C.; Wong, S.L.; Maiti, T.; Ebrahimi, A.; Hochrainer, T.; Fabritius, H.O.; et al. DAMASK—The Düsseldorf Advanced Material Simulation Kit for modeling multi-physics crystal plasticity, thermal, and damage phenomena from the single crystal up to the component scale. Comput. Mater. Sci. 2019, 158, 420–478. [Google Scholar] [CrossRef]
- Zhou, R.; Roy, A.; Silberschmidt, V.V. A crystal-plasticity model of extruded AM30 magnesium alloy. Comput. Mater. Sci. 2019, 170, 109140. [Google Scholar] [CrossRef]
- Groeber, M.A.; Jackson, M.A. Dream.3D: A digital representation enviroment for the analysis of microstructure in 3D. Integr. Mater. Manuf. Innov. 2014, 3, 5. [Google Scholar] [CrossRef] [Green Version]
- Qayyum, F.; Chaudhry, A.A.; Guk, S.; Schmidtchen, M.; Kawalla, R.; Prahl, U. Effect of 3d representative volume element (Rve) thickness on stress and strain partitioning in crystal plasticity simulations of multi-phase materials. Crystals 2020, 10, 944. [Google Scholar] [CrossRef]
- Umar, M.; Qayyum, F.; Farooq, M.U.; Guk, S.; Prahl, U. Qualitative Investigation of Damage Initiation at Meso-Scale in Spheroidized C45EC Steels by Using Crystal Plasticity-Based Numerical Simulations. J. Compos. Sci. 2021, 5, 222. [Google Scholar] [CrossRef]
- Ma, D.; Eisenlohr, P.; Epler, E.; Volkert, C.A.; Shanthraj, P.; Diehl, M.; Roters, F.; Raabe, D. Crystal plasticity study of monocrystalline stochastic honeycombs under in-plane compression. Acta Mater. 2016, 103, 796–808. [Google Scholar] [CrossRef]
- Rees, D.W.A. Basic Engineering Plasticity an Introduction with Engineering and Manufacturing Applications—STRESS ANALYSIS; Rees, D.W.A.B.T.-B.E.P., Ed.; Butterworth-Heinemann: Oxford, UK, 2006; pp. 1–32. ISBN 978-0-7506-8025-7. [Google Scholar]
- Diehl, M.; Shanthraj, P.; Eisenlohr, P.; Roters, F. Neighborhood influences on stress and strain partitioning in dual-phase microstructures: An investigation on synthetic polycrystals with a robust spectral-based numerical method. Meccanica 2016, 51, 429–441. [Google Scholar] [CrossRef]
- Tian, C.; Kirchlechner, C. The fracture toughness of martensite islands in dual-phase DP800 steel. J. Mater. Res. 2021, 36, 2495–2504. [Google Scholar] [CrossRef]
- ISO Metallic Materials—Sheet and Strip—Biaxial Tensile Testing Method Using a Cruciform Test Piece. Available online: https://www.iso.org/standard/82087.html (accessed on 14 December 2021).
- Tasan, C.C.; Diehl, M.; Yan, D.; Bechtold, M.; Roters, F.; Schemmann, L.; Zheng, C.; Peranio, N.; Ponge, D.; Koyama, M.; et al. An Overview of Dual-Phase Steels: Advances in Microstructure-Oriented Processing and Micromechanically Guided Design. Annu. Rev. Mater. Res. 2015, 45, 391–431. [Google Scholar] [CrossRef]
- Ullah, M.; Wu, C.S.; Qayyum, F. Prediction of crack tip plasticity induced due to variation in solidification rate of weld pool and its effect on fatigue crack propagation rate (FCPR). J. Mech. Sci. Technol. 2018, 32, 3625–3635. [Google Scholar] [CrossRef]
- Roters, F. DAMASK—The Düsseldorf Advanced Material Simulation Kit, Installation and Documentation. Available online: https://damask.mpie.de/ (accessed on 15 December 2021).


| Steel | Martensite (%) | Ferrite Grain Size (µm) | Martensite Grain Sizes (µm) |
|---|---|---|---|
| DP600 | 17.2 | ||
| 18.4 |
| Parameter | Model A | Model B | Model C | Model D |
|---|---|---|---|---|
| Synthetic volume size (voxels) | 40 × 40 × 10 | 40 × 40 × 10 | 40 × 40 × 10 | 40 × 40 × 10 |
| Martensite grain size (µm) | ||||
| Martensite volume fraction | 17% | 18% | 17% | 17% |
| Ferrite volume fraction | 83% | 82% | 83% | 83% |
| Parameter Definition | Symbol | Ferrite Attributes | Martensite Attributes |
|---|---|---|---|
| Lattice crystal structure | lattice structure | bcc | bcc |
| First elastic stiffness constant with normal strain | C11 | 233.3 GPa | 417.4 GPa |
| Second elastic stiffness constant with normal strain | C12 | 135.5 GPa | 242.4 GPa |
| First elastic stiffness constant with shear strain | C44 | 118.0 GPa | 211.1 GPa |
| Shear strain rate | γα | 10−3/s | 10−3/s |
| Initial shear resistance on [111] | So [111] | 95 MPa | 405.8 MPa |
| Saturation shear resistance on [111] | S∞ [111] | 222 MPa | 872.9 MPa |
| Initial shear resistance on [112] | So [112] | 97 MPa | 456.7 MPa |
| Saturation shear resistance on [112] | S∞ [112] | 412 MPa | 971.2 MPa |
| Slip hardening parameter | h0 | 1000 MPa | 563.0 MPa |
| Interaction hardening parameter | hα,β | 1 | 1 |
| Stress exponent | n | 20 | 20 |
| Curve fitting parameter | w | 2 | 2 |
| Damage parameters | |||
| Interface energy | g0 | 1.0 J m−2 | - |
| Characteristic length | l0 | 1.5 µm | - |
| Damage mobility | M | 0.01 s−1 | - |
| Damage diffusion | D | 1.0 | - |
| Critical plastic strain | crit | 0.5 | - |
| Damage rate sensitivity | P | 10 | - |
| n-Values | Martensite Fractions |
|---|---|
| 0.2594 | 18% |
| 0.2557 |
Publisher’s Note: MDPI stays neutral with regard to jurisdictional claims in published maps and institutional affiliations. |
© 2022 by the authors. Licensee MDPI, Basel, Switzerland. This article is an open access article distributed under the terms and conditions of the Creative Commons Attribution (CC BY) license (https://creativecommons.org/licenses/by/4.0/).
Share and Cite
Hussein, T.; Umar, M.; Qayyum, F.; Guk, S.; Prahl, U. Micromechanical Effect of Martensite Attributes on Forming Limits of Dual-Phase Steels Investigated by Crystal Plasticity-Based Numerical Simulations. Crystals 2022, 12, 155. https://0-doi-org.brum.beds.ac.uk/10.3390/cryst12020155
Hussein T, Umar M, Qayyum F, Guk S, Prahl U. Micromechanical Effect of Martensite Attributes on Forming Limits of Dual-Phase Steels Investigated by Crystal Plasticity-Based Numerical Simulations. Crystals. 2022; 12(2):155. https://0-doi-org.brum.beds.ac.uk/10.3390/cryst12020155
Chicago/Turabian StyleHussein, Tarek, Muhammad Umar, Faisal Qayyum, Sergey Guk, and Ulrich Prahl. 2022. "Micromechanical Effect of Martensite Attributes on Forming Limits of Dual-Phase Steels Investigated by Crystal Plasticity-Based Numerical Simulations" Crystals 12, no. 2: 155. https://0-doi-org.brum.beds.ac.uk/10.3390/cryst12020155