
Luminescence Properties of Ho2O3-Doped Y2O3 Stabilized ZrO2 Single Crystals
by
Yuhua Yang
, 
Shoulei Xu
,
Siyao Li
,
Wenxia Wu
,
Yihua Pan
,
Daini Wang
,
Xing Hong
,
Zeyu Cheng
and
Wen Deng
* School of Physical Science and Technology, Guangxi University, 100 East Daxue Road, Nanning 530004, China
*
Author to whom correspondence should be addressed.
Crystals 2022, 12(3), 415; https://0-doi-org.brum.beds.ac.uk/10.3390/cryst12030415
Submission received: 28 January 2022
/
Revised: 12 March 2022
/
Accepted: 15 March 2022
/
Published: 17 March 2022
Abstract
:Single crystals of Ho2O3-doped Y2O3 stabilized ZrO2 (YSZ) with different Y2O3 and Ho2O3 contents were grown by the optical floating zone method. XRD and Raman spectra were measured and showed that crystal samples all had tetragonal structures. Measurements of positron annihilation lifetime spectra indicated that the increase in Y2O3 concentration led to the increases of defects and mean positron lifetime, which enhanced the scattering of light and reduced the luminous intensity and the quantum yield (QY) of the crystal. Under the excitation at 446 nm, photoluminescence (PL) spectra of Ho2O3 -doped YSZ crystals showed emission peaks at 540, 551, 670, and 757 nm corresponding to Ho3+ transitions from 5S2, 5F4, 5F5, and 5I4 excited states to the 5I8 ground state, respectively. At low Ho2O3-doped concentrations (0.10–0.50 mol%), the overall emission intensity increased with Ho2O3 contents, reached the maximum value at 0.50 mol%, then decreased with higher Ho2O3 contents, probably as a result of increased non-radiative relaxation caused by increased interactions between Ho3+ ions. Quenching of the PL occurred at Ho2O3 concentrations > 0.5 mol% and due to the electric dipole–dipole interaction. The calculated chromaticity coordinates (CIE) were approximately (0.307, 0.683) and the color purity achieved 99.6%. The results showed that Ho2O3: YSZ crystals were suitable for green light-emitting devices.
1. Introduction
Rare-earth doped materials have many valuable properties and have potential applications in display [1], lasers [2], solar cells [3], optical amplifier [4], mid-infrared fiber amplifiers [5], optical communication [6], etc. Rare earth ion Ho3+ has absorption bands in both ultra-violet and visible regions and generates highly intensified emission, especially in the green region [7]. Many studies [8,9,10] have shown that Ho could be used as an element in white light production for its green emission. To investigate the emission characteristics of Ho3+, they must be incorporated into the right host.
Host materials could be in the form of glasses, powders, ceramics, or crystals. Metal oxide crystals have the highest physical and chemical stability and emission efficiency and doped rare-earth (RE) oxide crystals with high optical quality for use in laser physics have been developed over the past half-century [11]. As a host matrix for photonics and industrial applications, zirconia was attracted for its favorable properties, such as high hardness and refractive index, wide optical band gap, low optical loss, and high transparency from near-infrared to visible light [12]. ZrO2 has significant technological applications such as fuel cells [13], catalysis [14], gas sensors [15], and optoelectronic devices [16]. Ho2O3: YSZ crystal has a promising application for visible light emission devices.
ZrO2 could exist in three crystal structures: monoclinic, tetragonal, and cubic. At ambient temperature, the monoclinic phase was the stable form, and it transforms into the tetragonal phase at 1170–2370 °C and the cubic phase at temperatures above 2370 °C to its melting point at 2716 °C [17,18]. There was a transition from the tetragonal phase to the monoclinic phase during the preparation of zirconia from high temperature to room temperature. This transition caused a volume expansion of 4.5%, which caused the crystal to crack [18]. The addition of certain kinds of oxides such as Y2O3, TiO2, CaO, and CeO2 to pure ZrO2 stabilized a cubic or tetragonal phase down to room temperatures [19,20]. Y2O3 was the most common oxide additive. Both Y(III) and Zr (IV) have closed-shell electronic configurations and no transitions that could interfere with those of Ho3+. The tetragonal or cubic phase could be stabilized by adding Y2O3 [21]. High-quality crystals could be grown using the optical floating zone method [22].
Zirconia single crystals stabilized with 6 mol%, 8 mol%, and 10 mol% Y2O3, referred to as 6YSZ, 8YSZ, and 10YSZ, respectively, have been grown by the optical floating zone method by our group. It has been found that the growth quality and light transmittance of 8YSZ and 10YSZ crystals were good, while the 6YSZ crystal was not a transparence material. As RE3+ replaced Zr4+ in YSZ crystals, defects such as oxygen vacancies were created to maintain charge balance and zirconia was stabilized in the tetragonal or cubic phase. The luminescence efficiency depended on the luminescent rare-earth ions and substrates. In addition to luminescent ion concentration, the concentration of the stabilizer also affected the luminescence of the crystal. In the ZrO2 crystal, doping different concentrations of stabilizer Y2O3 would produce defects due to charge compensation, and the defects influenced the luminescence of the crystal. It is very important to study the influence of defects and rare ions on the luminescence properties of the crystals.
In this paper, a series of (ZrO2)90(Y2O3)10−x(Ho2O3) x (x = 0.00, 0.10, 0.20, 0.30, 0.50, 0.75, 1.00, 1.20), (ZrO2)92(Y2O3)8, and (ZrO2)92(Y2O3)7.25(Ho2O3)0.75 single crystals were grown by optical floating zone method. The microstructures and optical properties of the crystals were investigated by a variety of physical techniques, including X-ray diffraction (XRD), Raman spectroscopy, positron annihilation lifetime spectroscopy (PALS), UV-Visible Spectrophotometry (UV-Vis), photoluminescence (PL), and photoluminescence excitation (PLE).
2. Materials and Methods
2.1. Ceramic Rods Preparation
High purity oxide powders of Ho2O3 (99.99%), Y2O3 (99.99%), and ZrO2 (99.99%) were mixed in molar percentage composition of (ZrO2)90(Y2O3)10−x(Ho2O3)x (x = 0.00, 0.10, 0.20, 0.30, 0.50, 0.75, 1.00, 1.20). For comparison, (ZrO2)92(Y2O3)8 and (ZrO2)92(Y2O3)7.25(Ho2O3)0.75 samples were also prepared. The chemical compositions of Ho2O3-doped YSZ samples were shown in Table 1. Powders were put in ethanol and stirred with a magnetic stirrer for 24 h to ensure the various components in homogenization. Dry powder was obtained by drying suspension for 24 h and pouring into an agate mortar to ground thoroughly. The dried powder was formed into cylinders in a mold and then sintered at 1500 °C in a muffle furnace to produce ceramic rods.
2.2. Crystal Growth
For crystal production, the sintered ceramic rods were used as a raw material in an optical floating zone furnace (model: FZ-T-12000-X-VII-VPO-GU-PC, Crystal Systems Co., Kobchisawa, Japan).
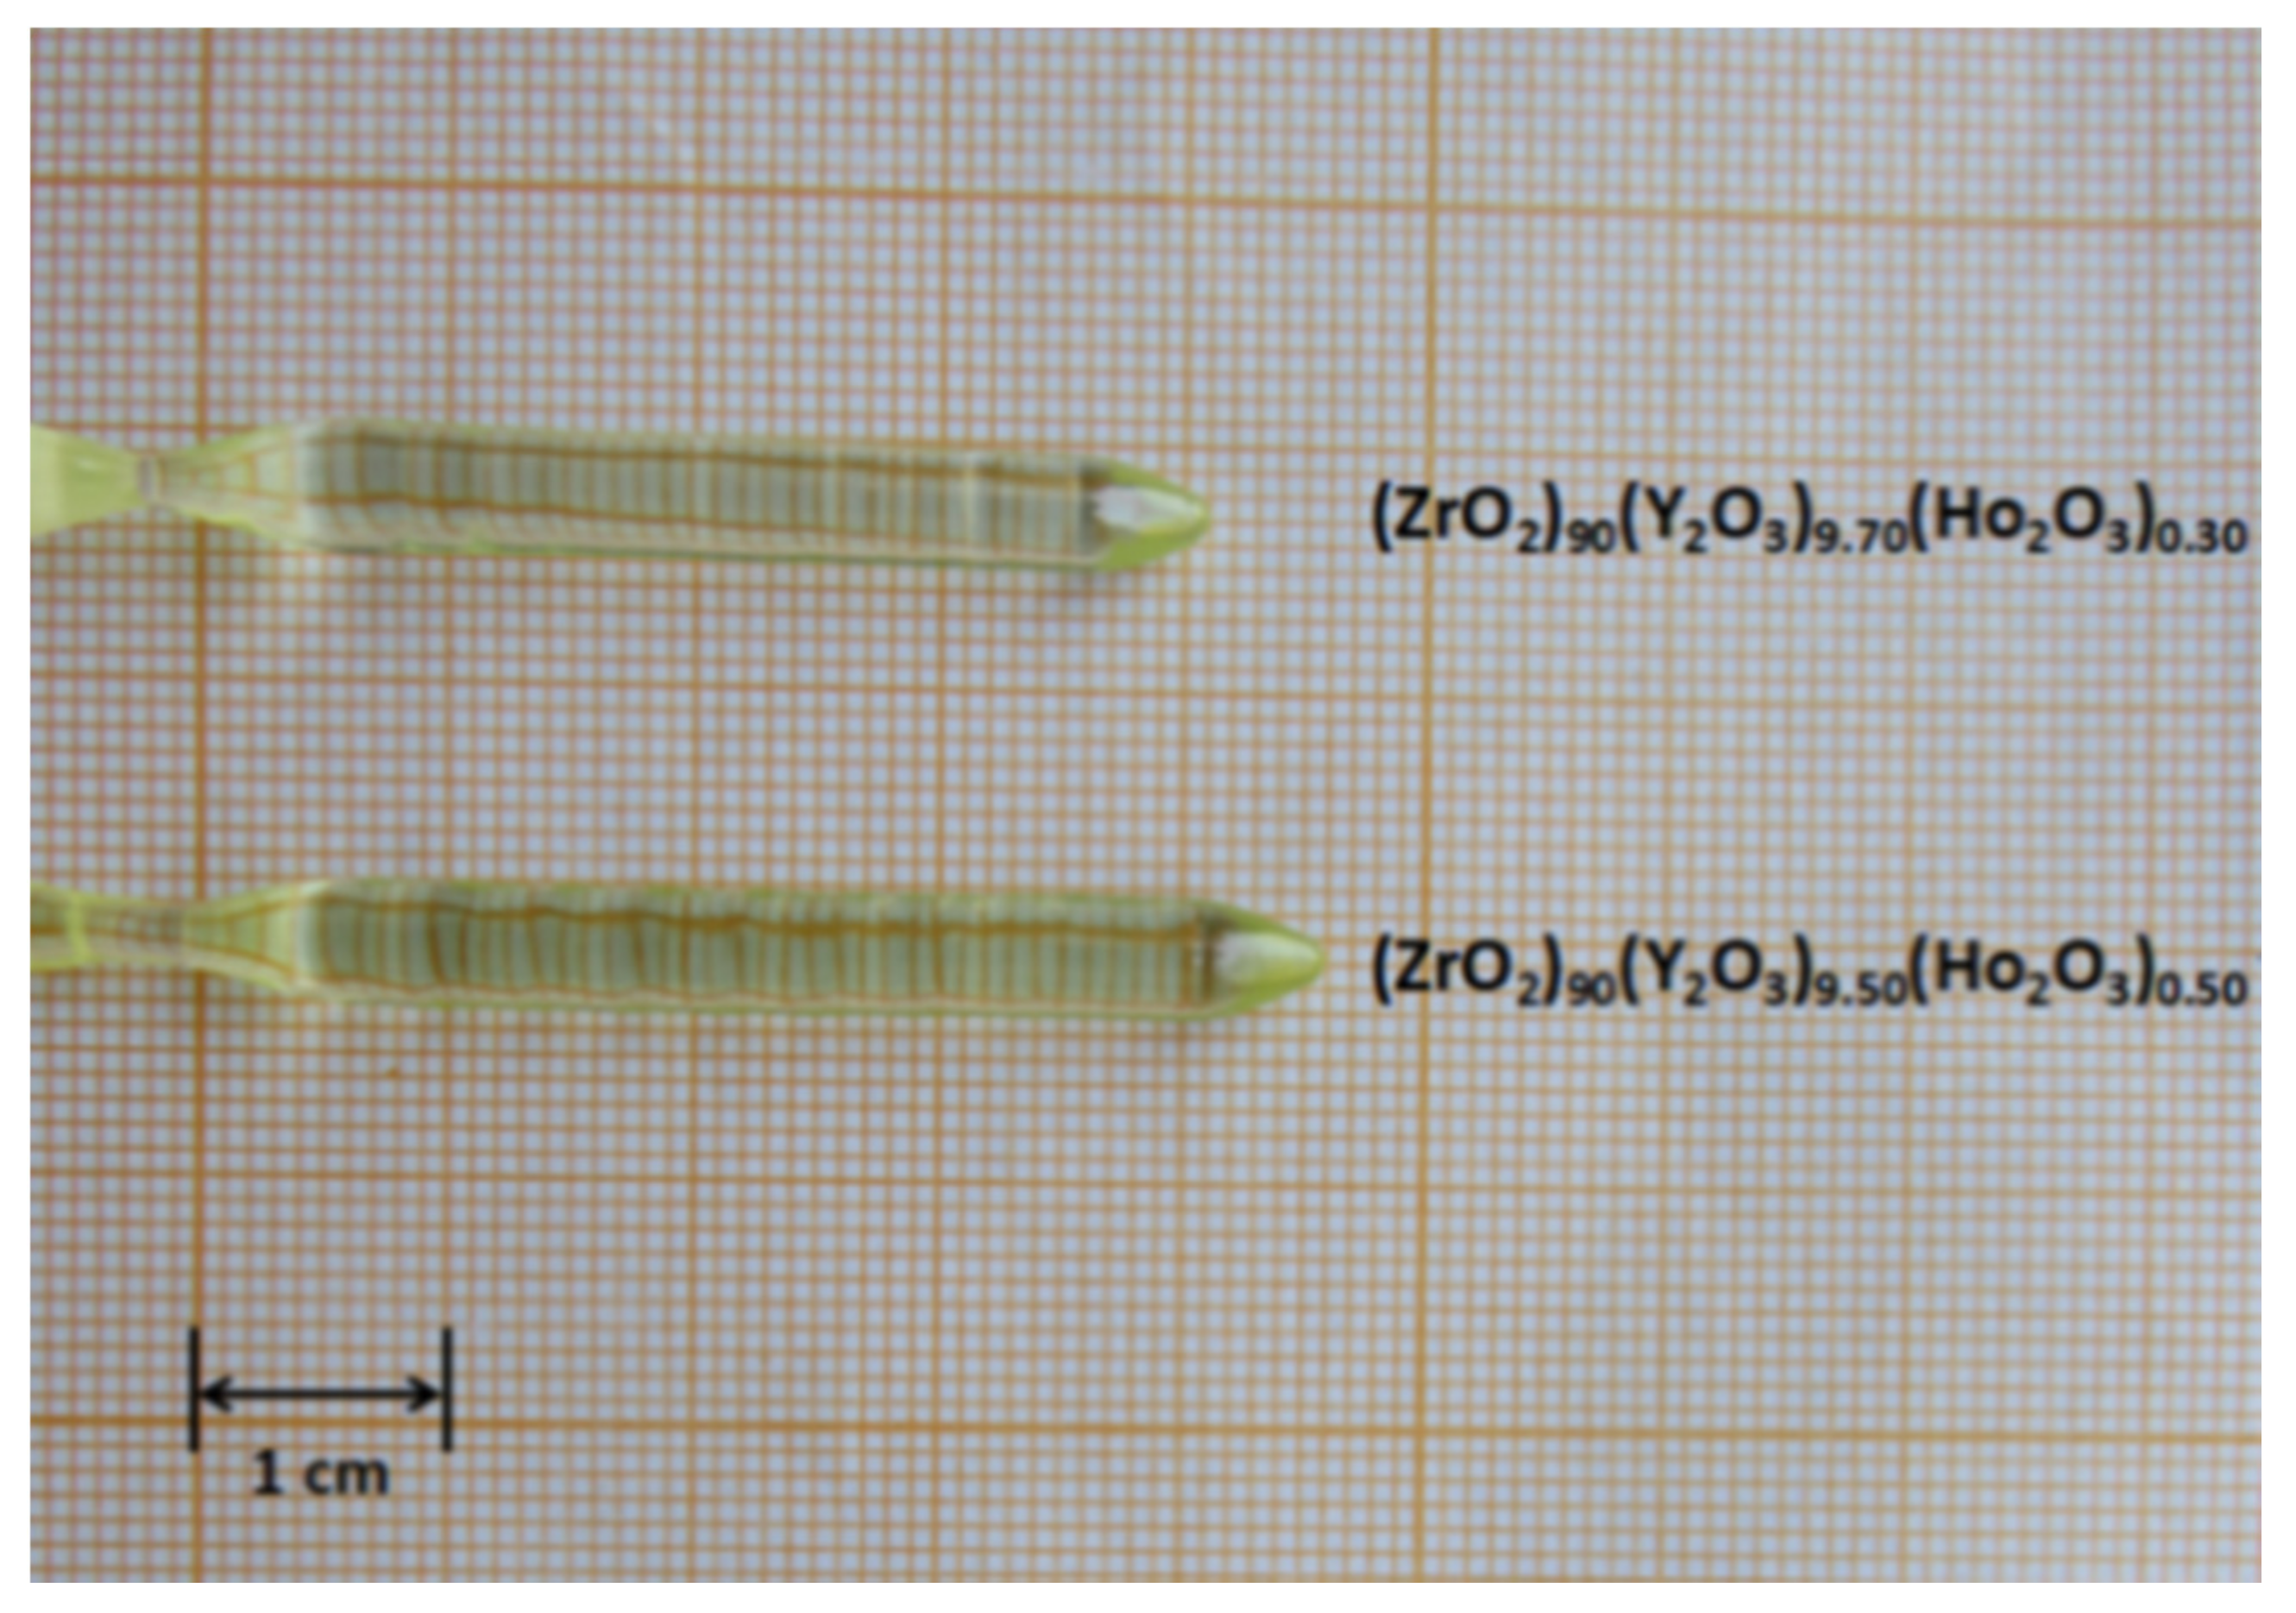
Two ceramic rods with the same chemical composition but different lengths were used as feed and seed rods during crystal growth. The furnace consists of four 3-kilowatt Xe lamps that were focused by four polished elliptical mirrors to form a molten zone between the feed and the seed rods. The power was adjusted to produce a stable melting zone. In the process of crystal growth, the feed and seed rods were rotated in opposite directions to improve uniformity, and then they were moved down at a speed of 5 mm/h for crystallization. The crystals rods grown by this method are shown in Figure 1. They were transparent, large, and uniform, with no obvious cracks or impurity phases. Discs of 1 mm thickness were cut using a crystal cutter from the crystals. The surfaces of the discs were polished with a single shaft polisher for investigations of optical properties. The XRD powder samples were ground from the crystals.
Analytical measurements were made on a (ZrO2)90(Y2O3)9.25(Ho2O3)0.75 crystal disc using energy-dispersive X-ray (EDX) spectroscopy on our SEM instrument. The SEM–EDS measurements showed that all Zr, Y, Ho, and O elements were evenly distributed, and thus the doping elements were well dispersed in the crystal, as shown in Figure 2.
2.3. Sample Measurements
XRD patterns of the powder samples at room temperature were obtained with an X-ray diffractometer (Rigaku, Japan) using Cu Kα radiation (λ = 0.15406 nm) as the light source, and with 0.6°/s scan rate, and 0.02° step size within the scan range 20°–80° 2θ diffraction angles. Raman spectra in the range 100–800 cm−1 were obtained with a laser Raman spectrometer (Finder One, Zhuoli Hanguang Company, Beijing, China). Absorption spectra were obtained using a Shimadzu UV-2700 spectrometer. Positron annihilation lifetime spectra were acquired using an ORTEC fast-fast coincidence system with a time resolution of 250 ps. A 22Na positron source (with an activity of about 3.7 × 10⁵ Bq) was sandwiched between 2 polished disks. 1.28 MeV and 511 keVγ-rays as signals of positron produced and their annihilation. 106 counts were accumulated to produce a time-dependent spectrum. The POSITRONFIT extended software program was used to analyze the positron lifetime spectra. The PL and PLE spectra were obtained by a photoluminescence spectrometry (ZLF-325 type, Beijing Zhuoli Hanguang Optical Instrument) at room temperature, using a 150 W Xe lamp as the excitation source.
3. Results and Discussion
3.1. X-ray Diffraction (XRD)
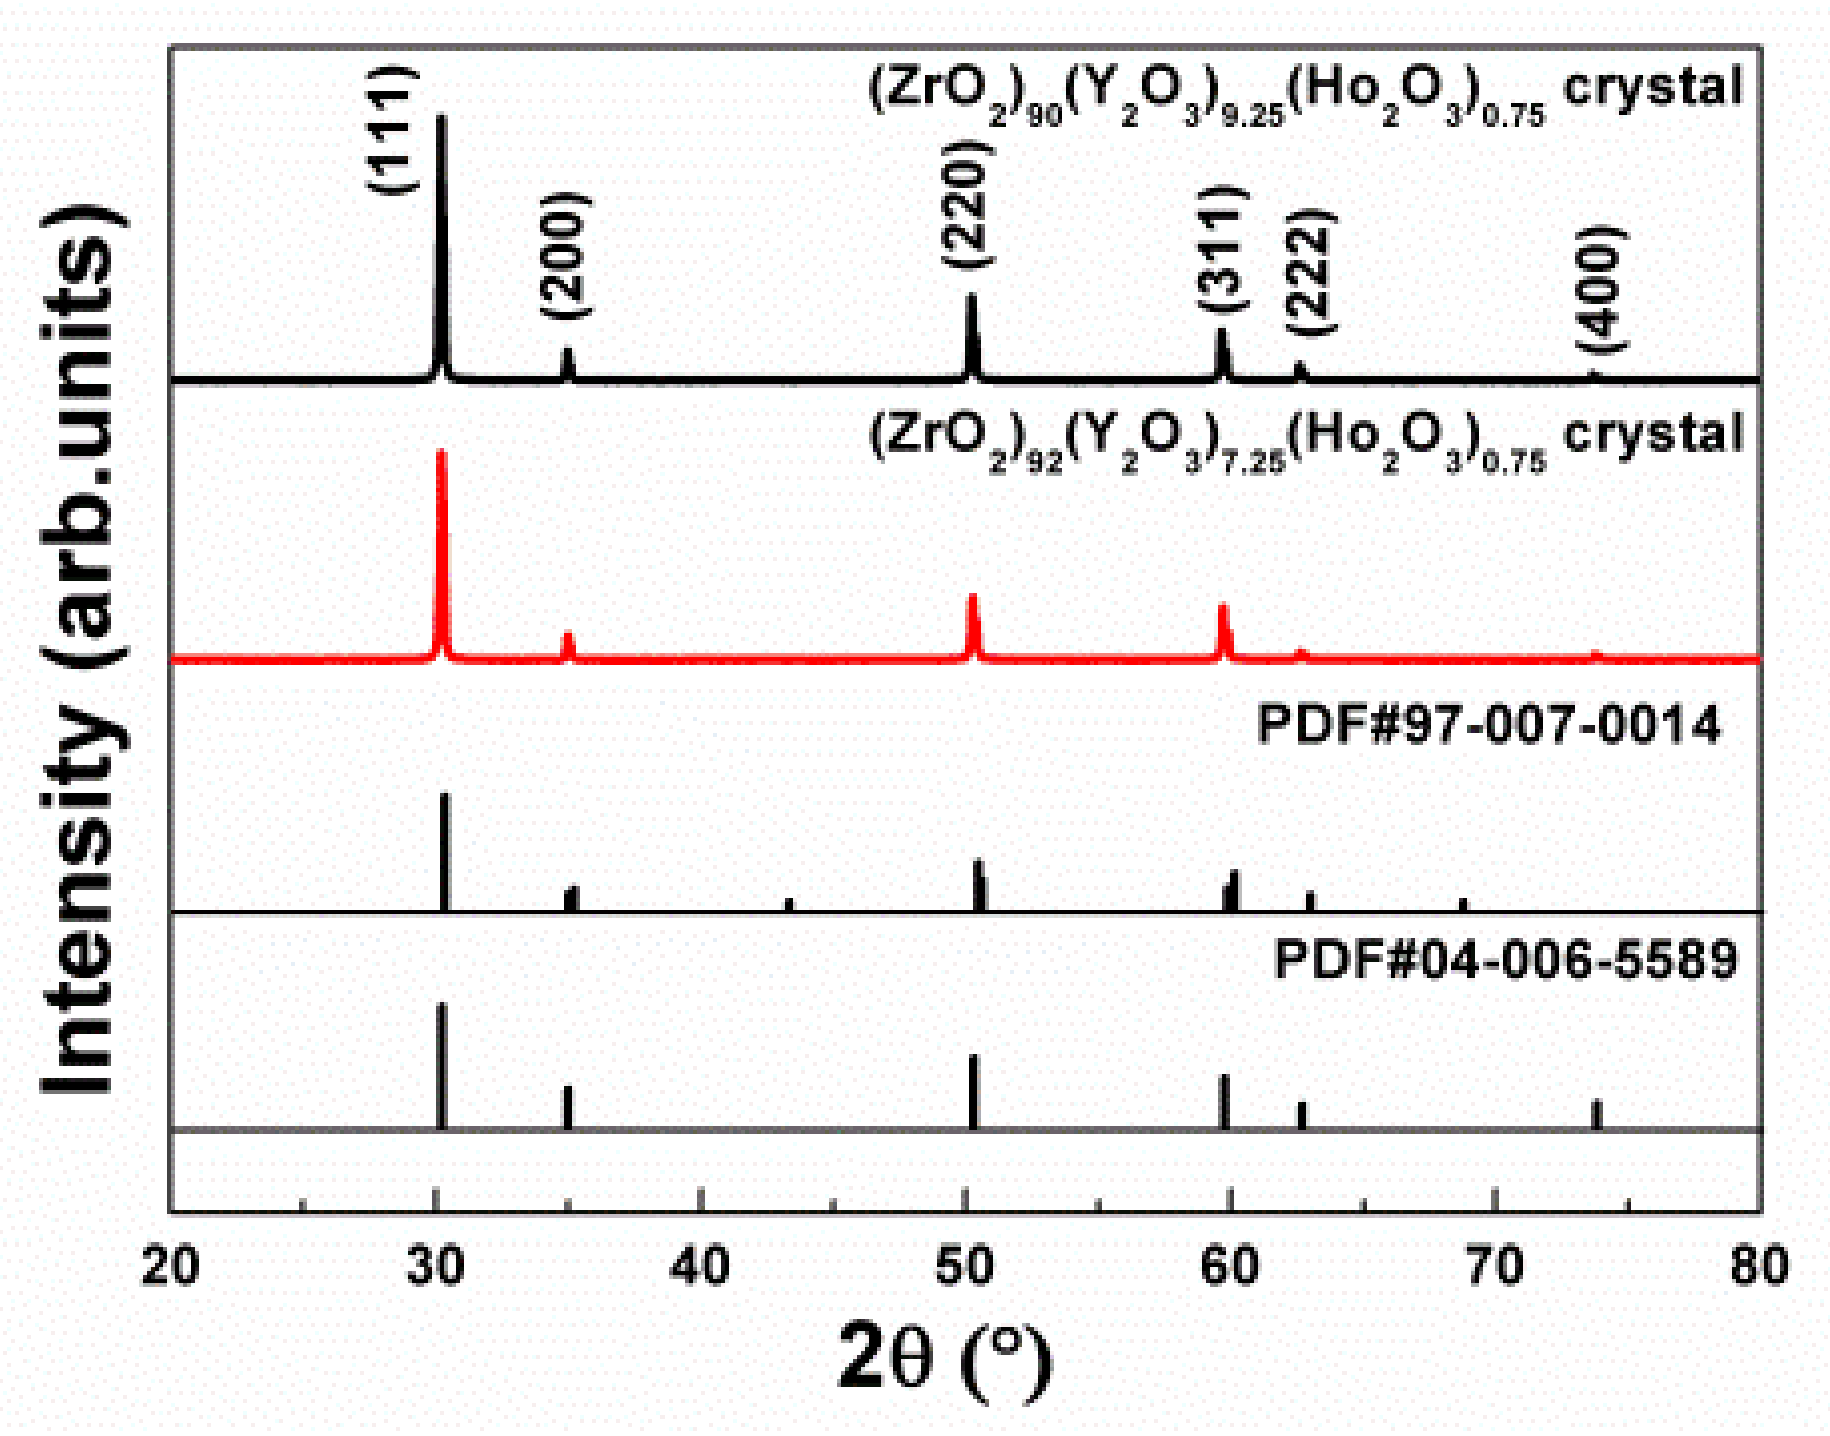
The XRD patterns of the (ZrO2)92(Y2O3)7.25(Ho2O3)0.75 and (ZrO2)90(Y2O3)9.25(Ho2O3)0.75 powders ground from the crystals were shown in Figure 3, respectively. All samples had peaks at 30.14°, 35.02°, 50.21°, 59.70°, 62.61°, and 73.66° that corresponded to either the tetragonal or cubic phase. No additional peaks of a secondary phase were observed in the patterns, indicating that Ho3+ and Y3+ come into the ZrO2 lattice successfully.
3.2. Raman Spectroscopy
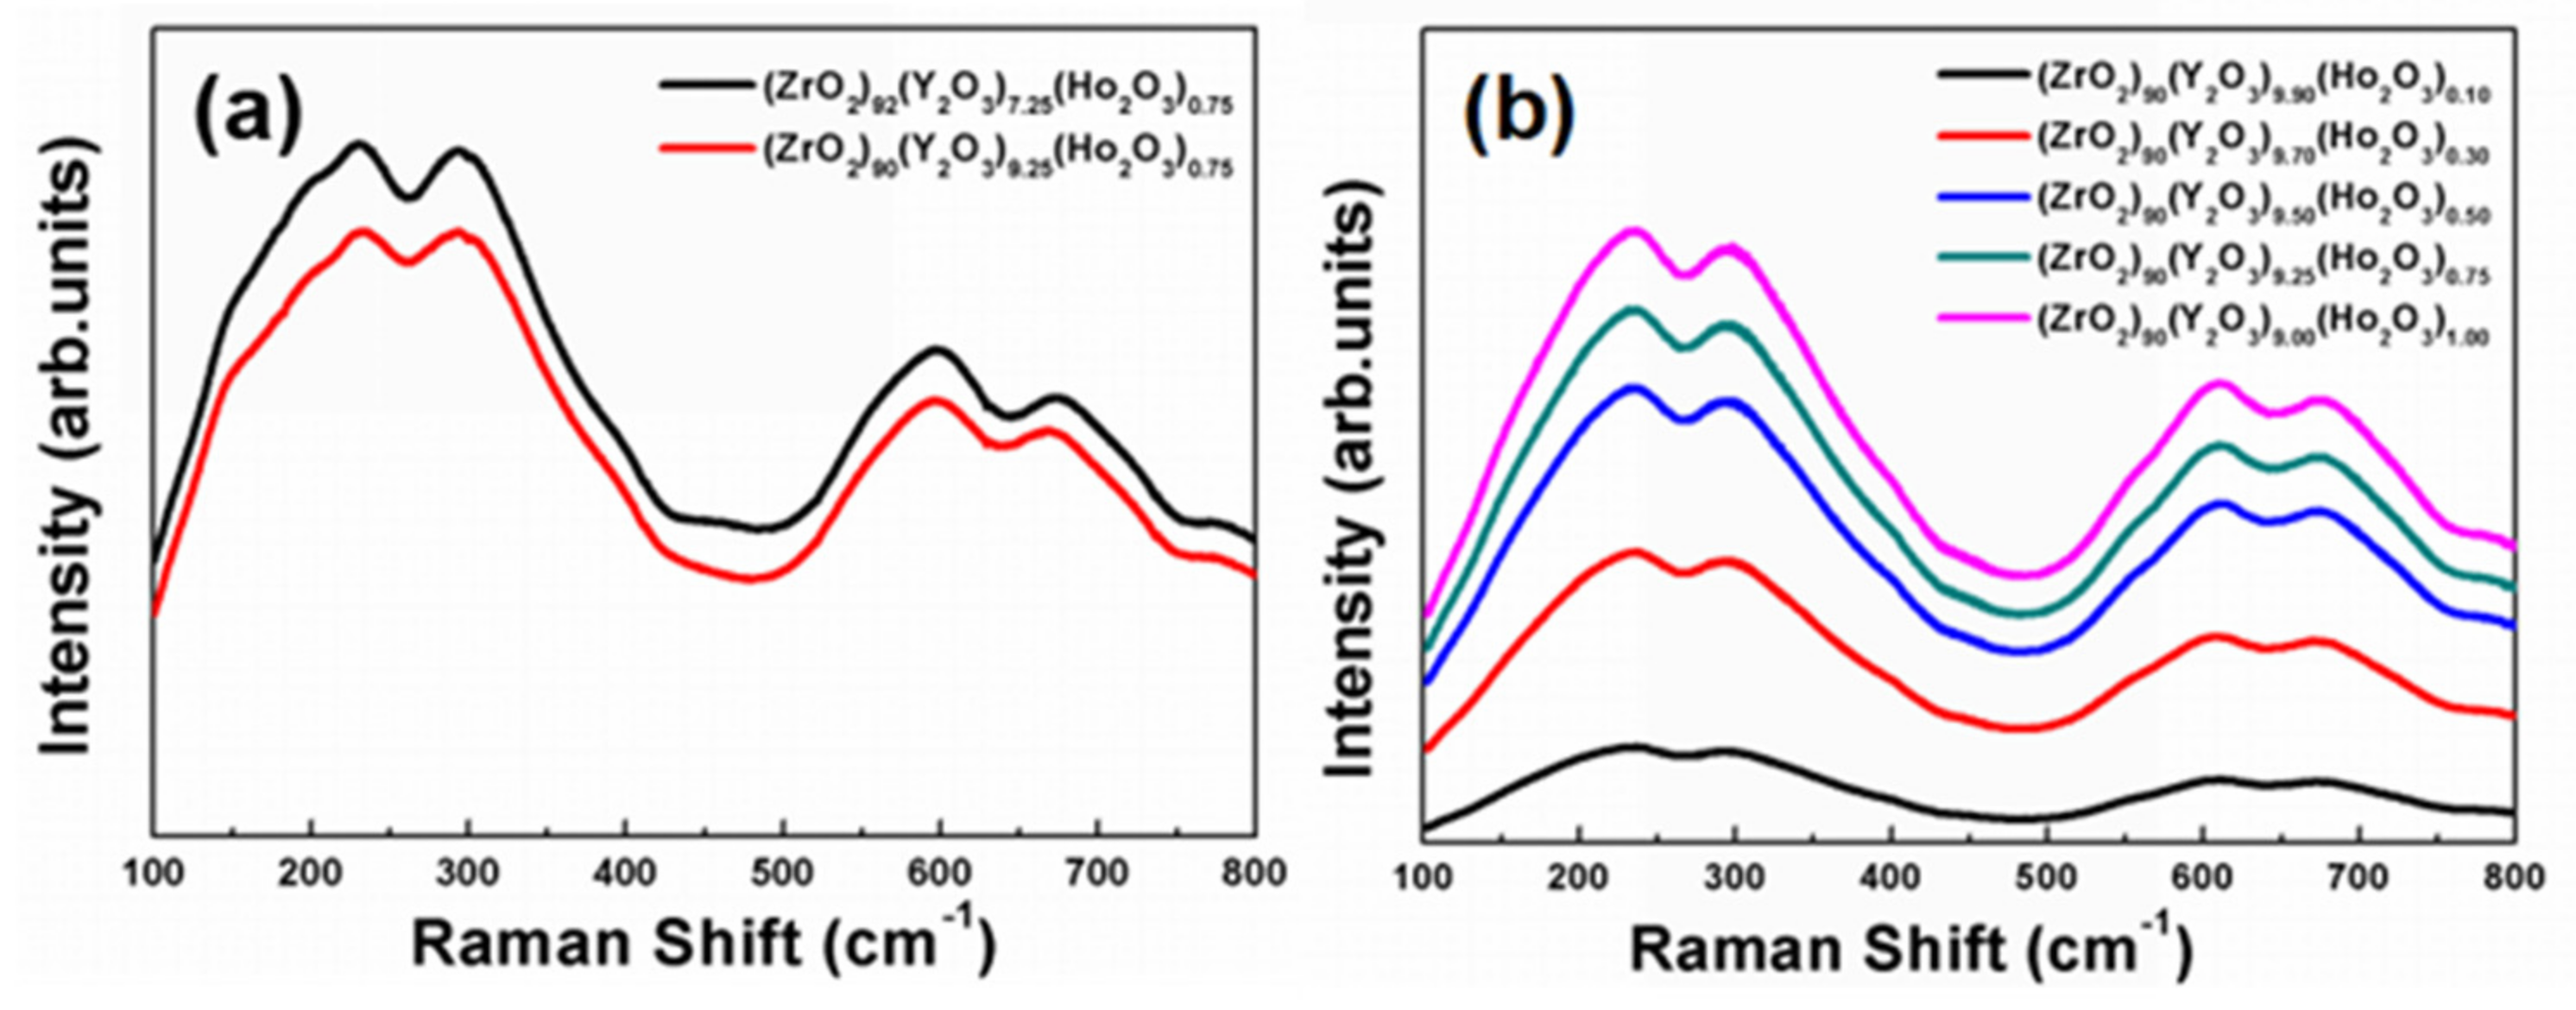
Because of the high degree of similarity in the XRD patterns from the tetragonal and cubic structures, additional measurements were needed to conclusively identify the phase composition of the Ho3+ doped YSZ samples. This could be achieved by Raman spectroscopy because the tetragonal phase produced six peaks (A1g + 2B1g + 3Eg), while the cubic phase had only one active mode (F2g) [23]. The Raman spectra of all crystal samples were shown in Figure 4a,b; all contained peaks at about 237, 295, 406, 609, and 680 cm−1, and, thus, they were consistent with the tetragonal structure [24]. Therefore, the Ho3+ doped YSZ single crystal was a tetragonal structure.
Combined with the XRD pattern, the results from the two crystals were very similar and indicative of a tetragonal structure. The crystal structure of the Ho2O3 doped YSZ sample did not change with different concentrations of Y2O3 and Ho2O3.
3.3. Positron Annihilation Lifetime Spectroscopy (PALS)
The type, size, and concentration of defects in the crystal could be analyzed according to positron lifetime parameters [25,26]. Positron annihilation lifetime spectra of (ZrO2)92(Y2O3)7.25(Ho2O3)0.75 and (ZrO2)90(Y2O3)9.25(Ho2O3)0.75 crystals were shown in Figure S1 (see Supplementary Materials). After source correction (τs = 380 ps, Is = 8.0%) and background subtraction, the fitting results of PALS for Ho2O3-doped YSZ crystals were obtained with three decay components, τ1, τ2, and τ3 and relative intensities I1′, I2′ and I3′. The third component τ3 in each spectrum with intensity I3′ (<1%) resulted from the positron that was annihilated on the surface of the specimens. This was disregarded in our discussion. Let I1 = I1′/(I1′ + I2′), I2 = I2′/(I1′ + I2′) for renormalization of the intensities. The second component τ2 was the lifetime of positron annihilated at microdefects. According to the standard trapping model [27,28], one could obtain the positron annihilation rate and the positron lifetime in the bulk (λb and τb): λb = I1/τ1 + I2/τ2, τb = 1/λb. The mean lifetime τm was calculated by equation τm = I1τ1 + I2τ2 reflected the properties of all positron annihilation of the Ho2O3:YSZ sample. The positron lifetime parameters of the (ZrO2)92(Y2O3)7.25(Ho2O3)0.75 and (ZrO2)90(Y2O3)9.25(Ho2O3)0.75 crystals were listed in Table 2.
Except interstitial defects, open volume defects normally included vacancies, dislocations, grain boundaries, and bubbles. In comparison to the interstitial defects, open volume defects were more sensitive to positron annihilation techniques [29,30]. The bulk positron lifetime τb > 200 ps represented the low electron densities in the bulk of the crystals. It was obvious that the mean lifetime τm and the I2 of the (ZrO2)90(Y2O3)9.25(Ho2O3)0.75 crystal were larger than those of the (ZrO2)92(Y2O3)7.25(Ho2O3)0.75 crystal. This meant that the concentration of open volume defects of the (ZrO2)90(Y2O3)9.25(Ho2O3)0.75 crystal was higher than that of the (ZrO2)92(Y2O3)7.25(Ho2O3)0.75 crystal. When some of the Zr4+ ions in the crystal lattice were replaced by trivalent rare-earth ions (Y3+ or Ho3+), defects such as oxygen vacancies were created to maintain charge balance. Obviously, (ZrO2)90(Y2O3)9.25(Ho2O3)0.75 crystal had a higher Y2O3 concentration, thus, it contained more defects.
3.4. The Luminescence Spectra of the (ZrO2)92(Y2O3)7.25(Ho2O3)0.75 and (ZrO2)90(Y2O3)9.25(Ho2O3)0.75 Crystals
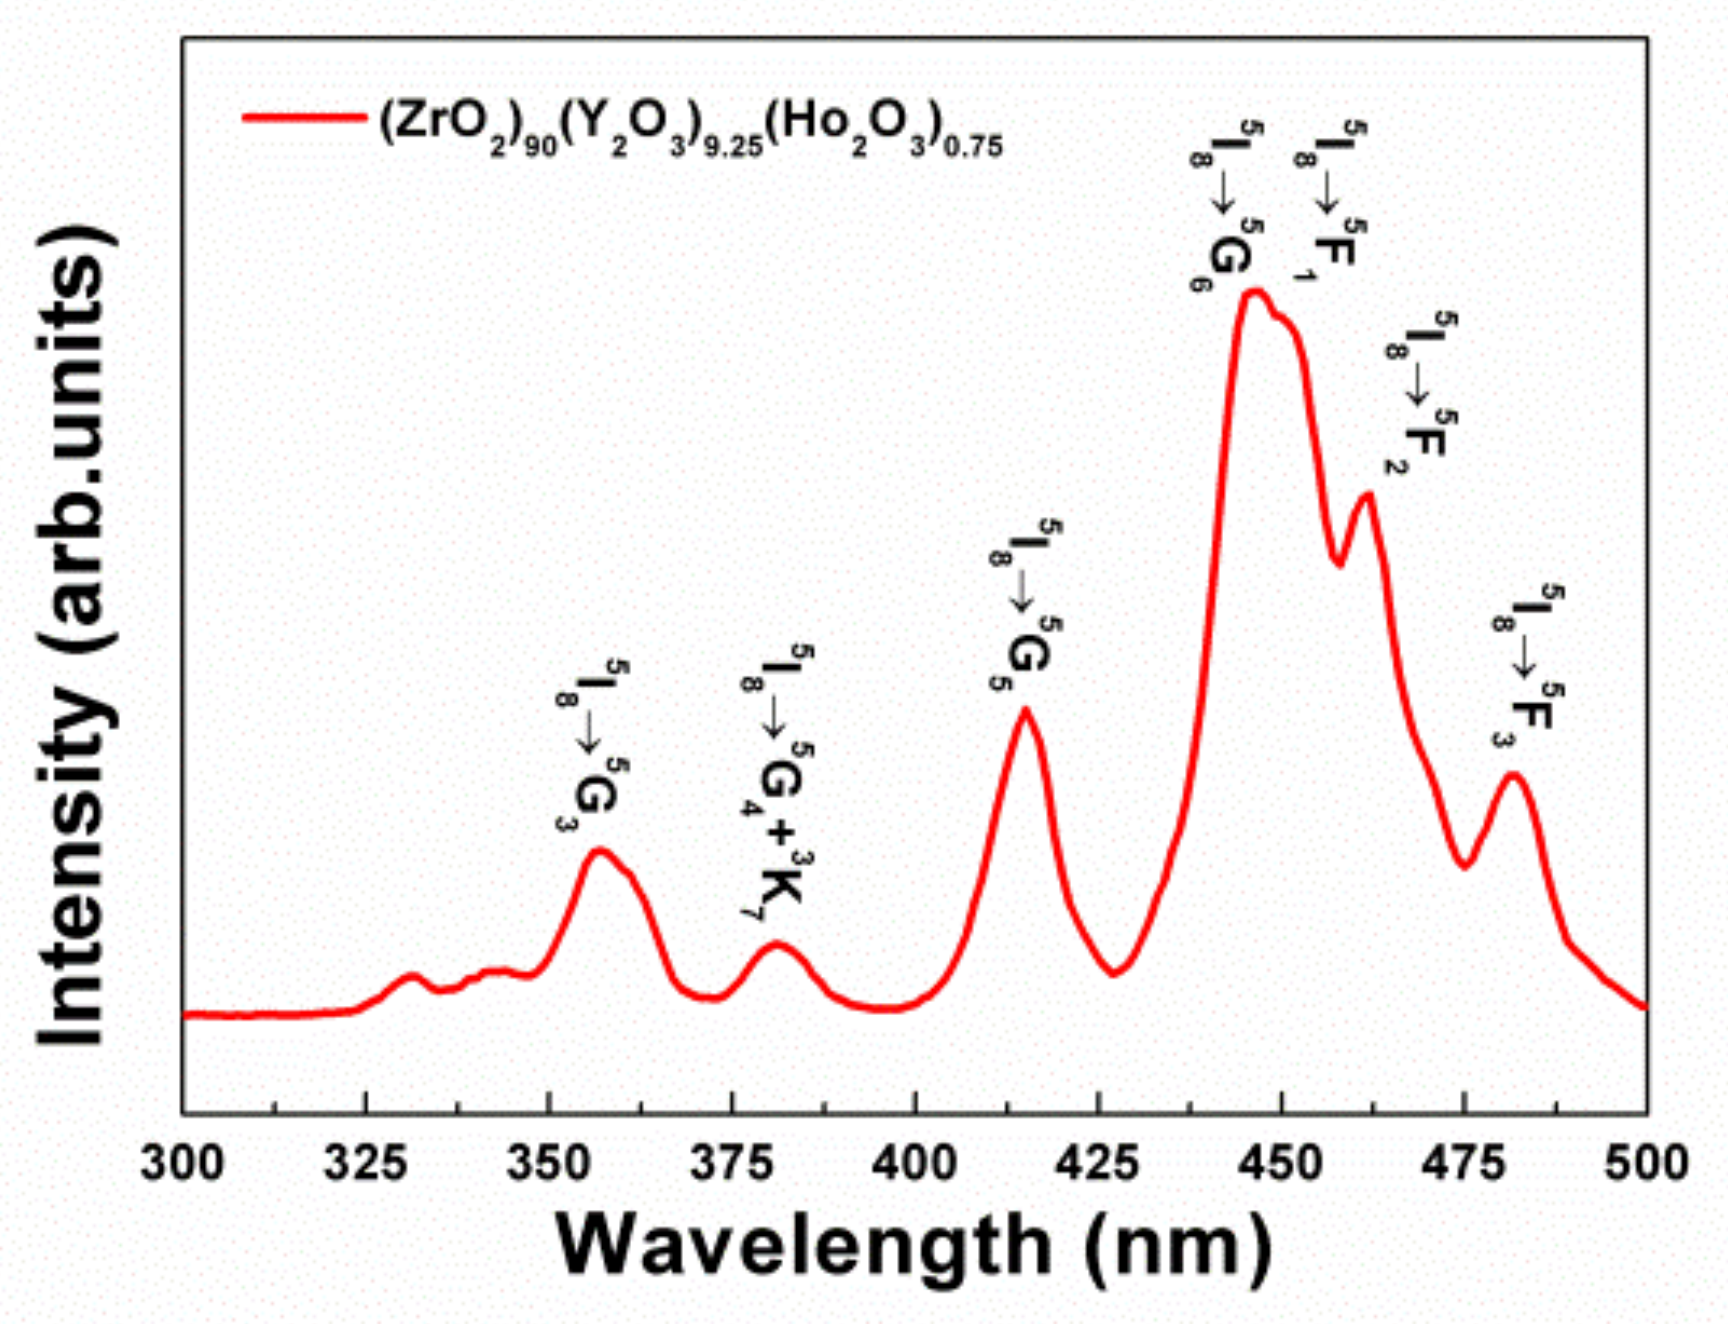
Room temperature PLE spectrum of (ZrO2)90(Y2O3)9.25(Ho2O3)0.75 crystal in the 300–500 nm range monitored at 551 nm was shown in Figure 5. It had seven peaks located at 356, 381, 415, 446, 452, 461, and 481 nm corresponding to the transitions from Ho3+ 5I8 ground state to the 5G2, 5G4 + 3K7, 5G5 + 3G5, 5G6, 5F1, 5F2, and 5F3 energy levels states, respectively [31]. The sample produced spectrum with the band at 446 nm having the highest intensity. This wavelength was then used to excite the sample to produce the down-conversion PL spectrum.
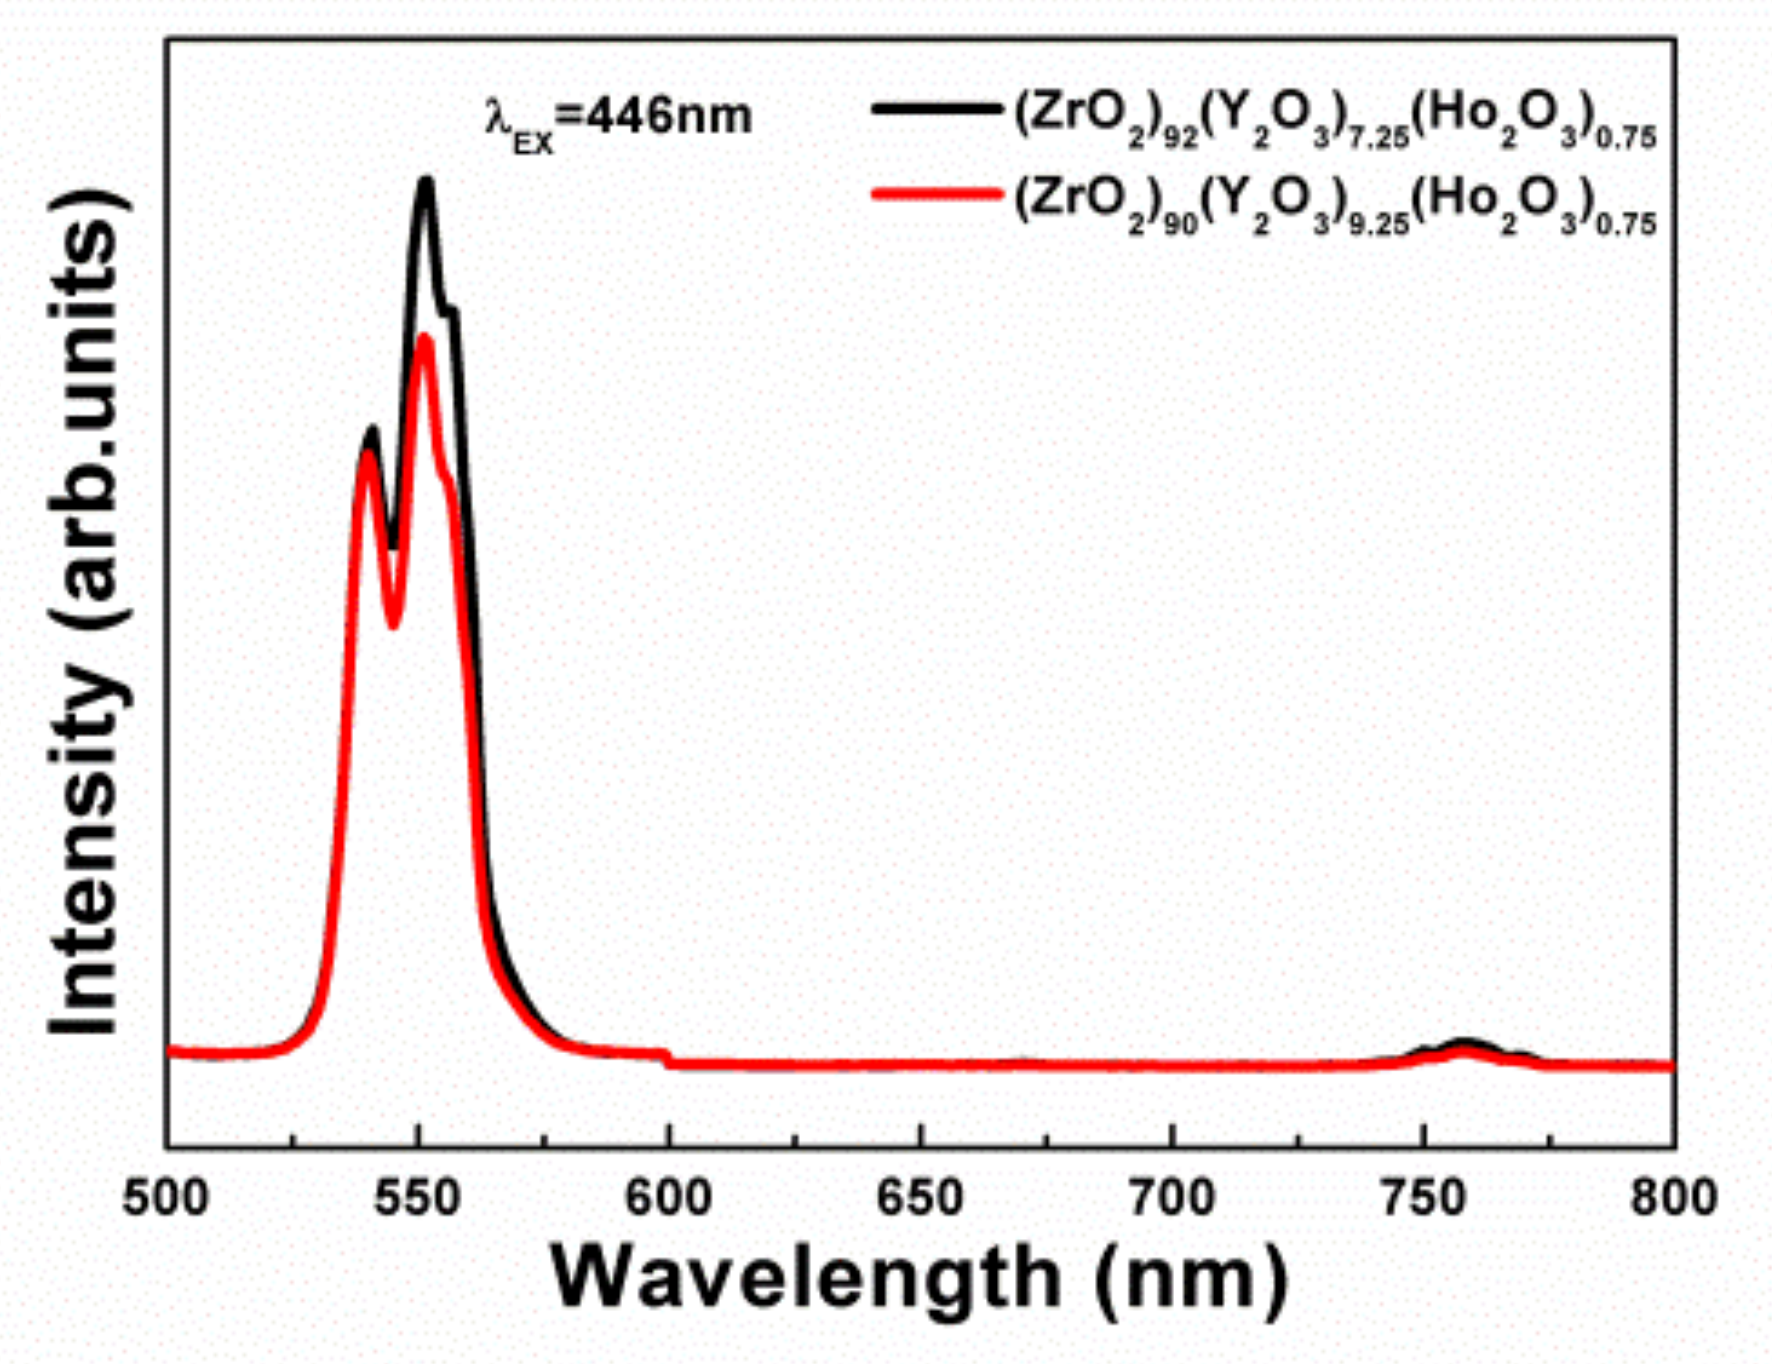
The PL spectra for (ZrO2)92(Y2O3)7.25(Ho2O3)0.75 and (ZrO2)90(Y2O3)9.25(Ho2O3)0.75 crystals under the excitation at 446 nm were shown in Figure 6. Their spectral shape did not change with Y2O3 concentration. As we know, the symmetry of the main material was an important factor affecting the luminescence intensity [32,33]. XRD and Raman spectra indicated that both crystal samples were tetragonal structures. In addition, the concentration of defects also affected the luminescence intensity of RE3+ [34].
The luminescence intensity of (ZrO2)90(Y2O3)9.25(Ho2O3)0.75 crystal was weaker than that of (ZrO2)92(Y2O3)7.25(Ho2O3)0.75 crystal, which was due to the higher concentration of Y2O3. As a result, the luminescence intensity of (ZrO2)90(Y2O3)9.25(Ho2O3)0.75 crystal was lower than that of the (ZrO2)92(Y2O3)7.25(Ho2O3)0.75 crystal.
3.5. The Quantum Yields of the (ZrO2)92(Y2O3)7.25(Ho2O3)0.75 and (ZrO2)90(Y2O3)9.25(Ho2O3)0.75 Crystals
Figure 5 demonstrated that there was an absorption peak at 446 nm in the PLE spectrum of the (ZrO2)90(Y2O3)9.25(Ho2O3)0.75 crystal. And a green light emission peak at 551 nm was found in the PL spectra of (ZrO2)92(Y2O3)7.25(Ho2O3)0.75 and (ZrO2)90(Y2O3)9.25(Ho2O3)0.75 crystals under the excitation at 446 nm as shown in Figure 6.
To measure the quantum yields of the (ZrO2)92(Y2O3)7.25(Ho2O3)0.75 and (ZrO2)90(Y2O3)9.25(Ho2O3)0.75 crystals, luminescence spectra in the 425–600 nm range of the (ZrO2)90(Y2O3)10, (ZrO2)92(Y2O3)8, (ZrO2)92(Y2O3)7.25(Ho2O3)0.75, and (ZrO2)90(Y2O3)9.25(Ho2O3)0.75 crystals under the excitation at 446 nm were collected, as shown in Figure 7. The (ZrO2)92(Y2O3)8 and (ZrO2)90(Y2O3)10 crystals were the reference samples of the (ZrO2)92(Y2O3)7.25(Ho2O3)0.75 and (ZrO2)90(Y2O3)9.25(Ho2O3)0.75 crystals, respectively.
Figure 7 indicated that there was an absorption band from 434 to 460 nm and a green light emission band from 521 to 575 nm in the luminescence spectra of (ZrO2)92(Y2O3)7.25(Ho2O3)0.75 and (ZrO2)90(Y2O3)9.25(Ho2O3)0.75 crystals.
QY (quantum yield) could be calculated by Equation (1) [35,36]:
where Nabs was the number of photons absorbed by a sample and Nem was the number of photons emitted from a sample. The quantum yields of the (ZrO2)92(Y2O3)7.25(Ho2O3)0.75 and (ZrO2)90(Y2O3)9.25(Ho2O3)0.75 crystals could be obtained by Formula (2) and (3), respectively.
where and were the integrated intensities of the emission light of the (ZrO2)92(Y2O3)7.25(Ho2O3)0.75 and (ZrO2)90(Y2O3)9.25(Ho2O3)0.75 crystals. and represented the integrated intensities of the emission light of the (ZrO2)92(Y2O3)8 and (ZrO2)90(Y2O3)10 crystals. and were the integrated intensities of the excitation light of the (ZrO2)92(Y2O3)8 and (ZrO2)90(Y2O3)10 crystal. and represented the integrated intensities of the excitation light of the (ZrO2)92(Y2O3)7.25(Ho2O3)0.75 and (ZrO2)90(Y2O3)9.25(Ho2O3)0.75 crystals, respectively. The quantum yields of the (ZrO2)92(Y2O3)7.25(Ho2O3)0.75 and (ZrO2)90(Y2O3)9.25(Ho2O3)0.75 crystals were listed in Table 3.
It was known that the defects in the crystals reduced the quantum yields [36,37]. The quantum yield of the (ZrO2)90(Y2O3)9.25(Ho2O3)0.75 crystal was less than that of the (ZrO2)92(Y2O3)7.25(Ho2O3)0.75 crystal, which was due to the higher concentration of Y2O3, more defects were generated, thus enhanced the scattering of light and decreased the probability of the light emission. As a result, the quantum yield of (ZrO2)90(Y2O3)9.25(Ho2O3)0.75 crystal was lower than that of the (ZrO2)92(Y2O3)7.25(Ho2O3)0.75 crystal. The results were consistent with that from Figure 6.
3.6. The Luminescence Properties of (ZrO2)90(Y2O3)10−x(Ho2O3)x
3.6.1. Absorption Spectrum
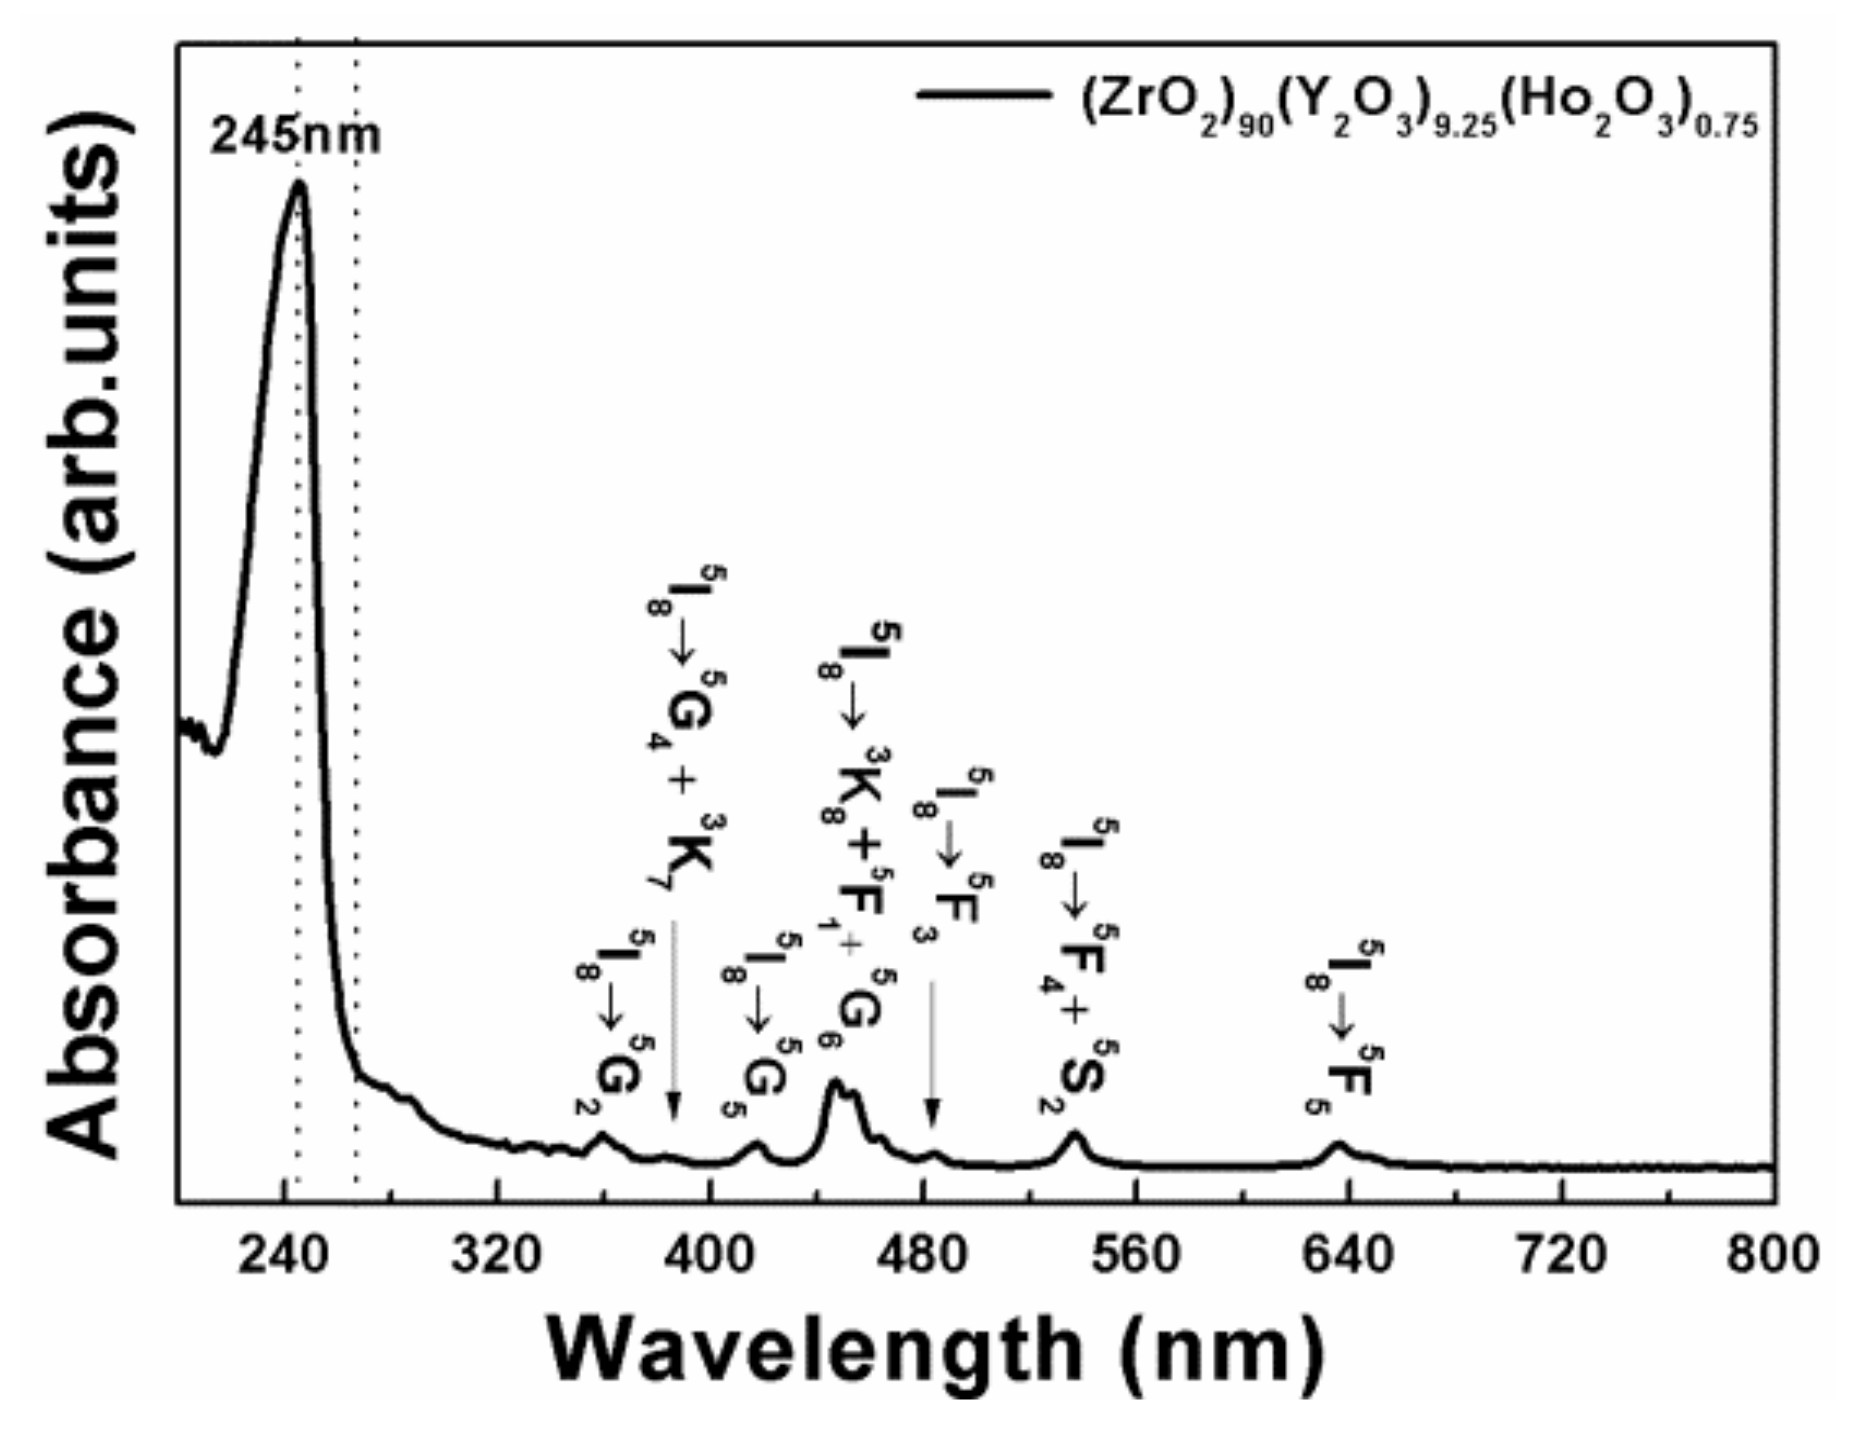
The absorption spectrum of (ZrO2)90(Y2O3)9.25(Ho2O3)0.75 crystal was shown in Figure 8.
The absorption spectrum of the (ZrO2)90(Y2O3)9.25(Ho2O3)0.75 crystal contained eight peaks, at 245, 359, 382, 416, 446, 484, 537, and 635 nm. The absorption peak at 245 nm was considered as the charge transfer transition from the valence to the conduction band in the zirconia matrix [38,39,40,41]. However, the other 7 peaks were the results of the transitions from the 5I8 ground state to the 5G2, 5G4 + 3K7, 5G5, 3K8 + 5F1 + 5G6, 5F3, 5F4 + 5S2, and 5F5 excited states of the Ho3+ ions [42,43]. An absorption band was found at 446 nm corresponding to the transition from 5I8 to 3K8 + 5G6 + 5F1 due to hypersensitivity, which obeyed the selection rules , , and . This represented the sensitivity around Ho3+ in the matrix [44]. The absorption intensity was influenced by the concentrations of Ho3+. Figure S2 (see Supplementary Materials) indicated that the absorption intensity was influenced by the concentrations of Ho3+.
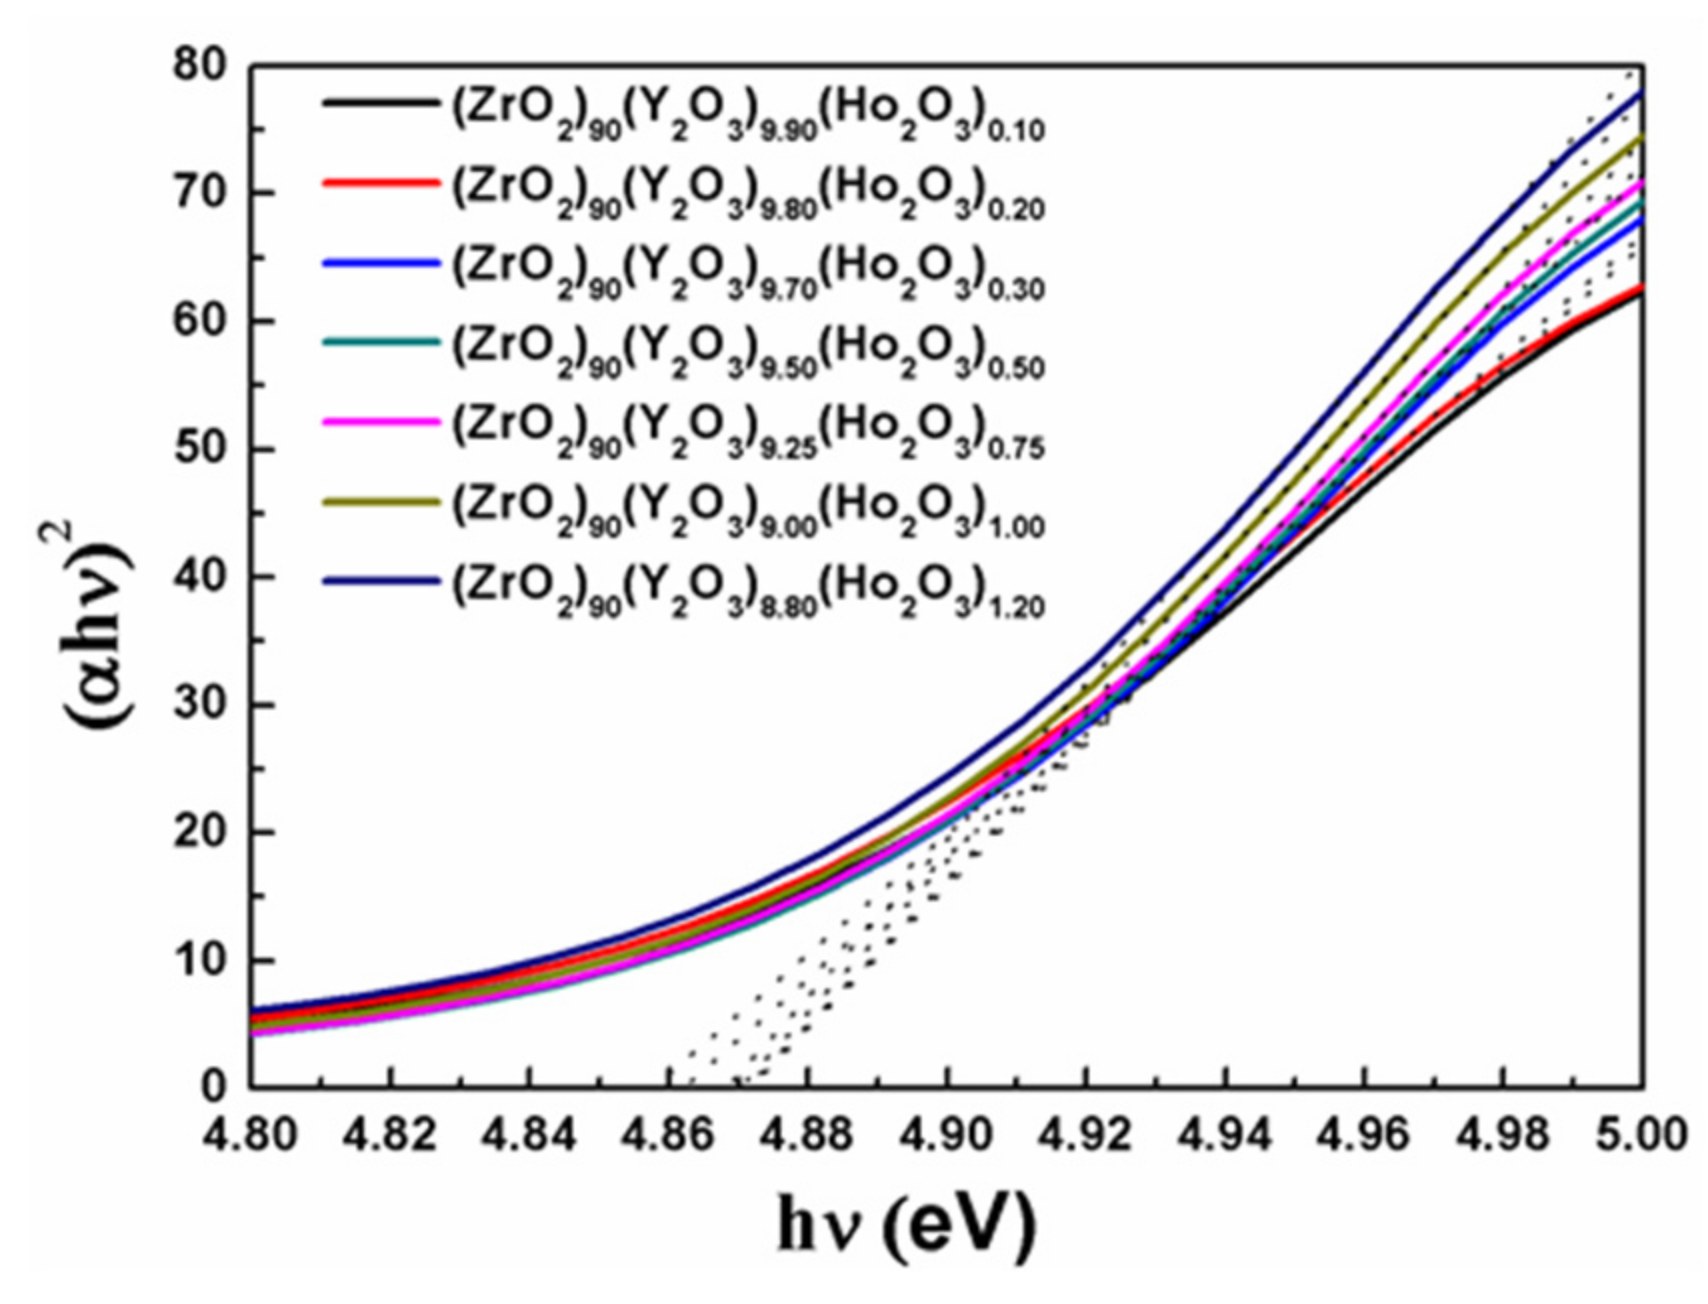
The optical band gap (Eg) for the sample was calculated using the following formula [45]:
where α was the absorption coefficient of the crystal sample, B was the constant, and hν was the energy of the absorbed photon. A plot of hν against (αhν)2 was shown in Figure 9 and the point of intersection of the linear region with the X-axis gave an assessment of Eg. Values for the slopes, interceptions, regressions, and the optical band gaps Eg were presented in Table 4, which showed that the Eg of the (ZrO2)90(Y2O3)10−x(Ho2O3)x crystals were about 4.86 eV, and the crystals were wide bandgap materials. The optical band gaps of the Ho2O3:YSZ crystals were different from those in Dy2O3:YSZ crystals, where the optical band gap energy of the Dy2O3:YSZ crystals increased with Dy2O3 contents [46].
3.6.2. PL Spectra
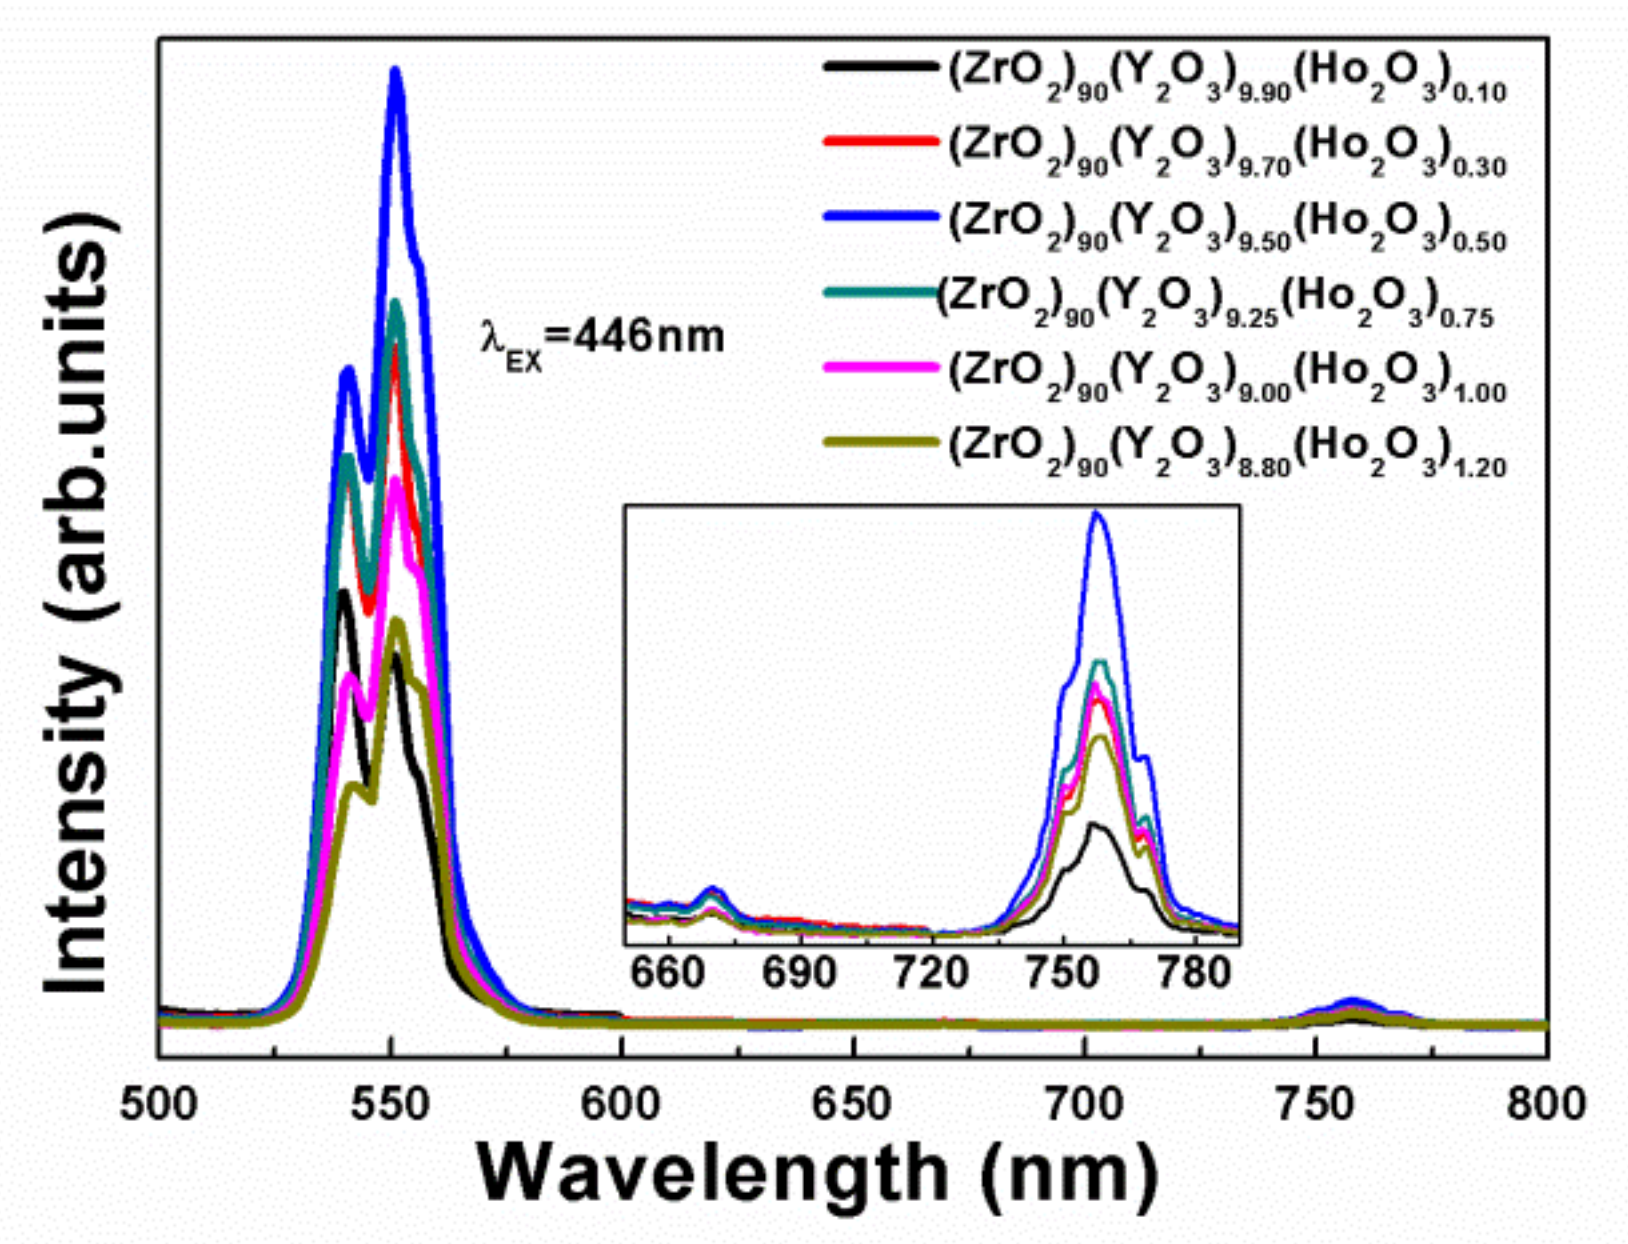
The PL spectra of the (ZrO2)90(Y2O3)10−x(Ho2O3)x crystals under the excitation at 446 nm were shown in Figure 10.
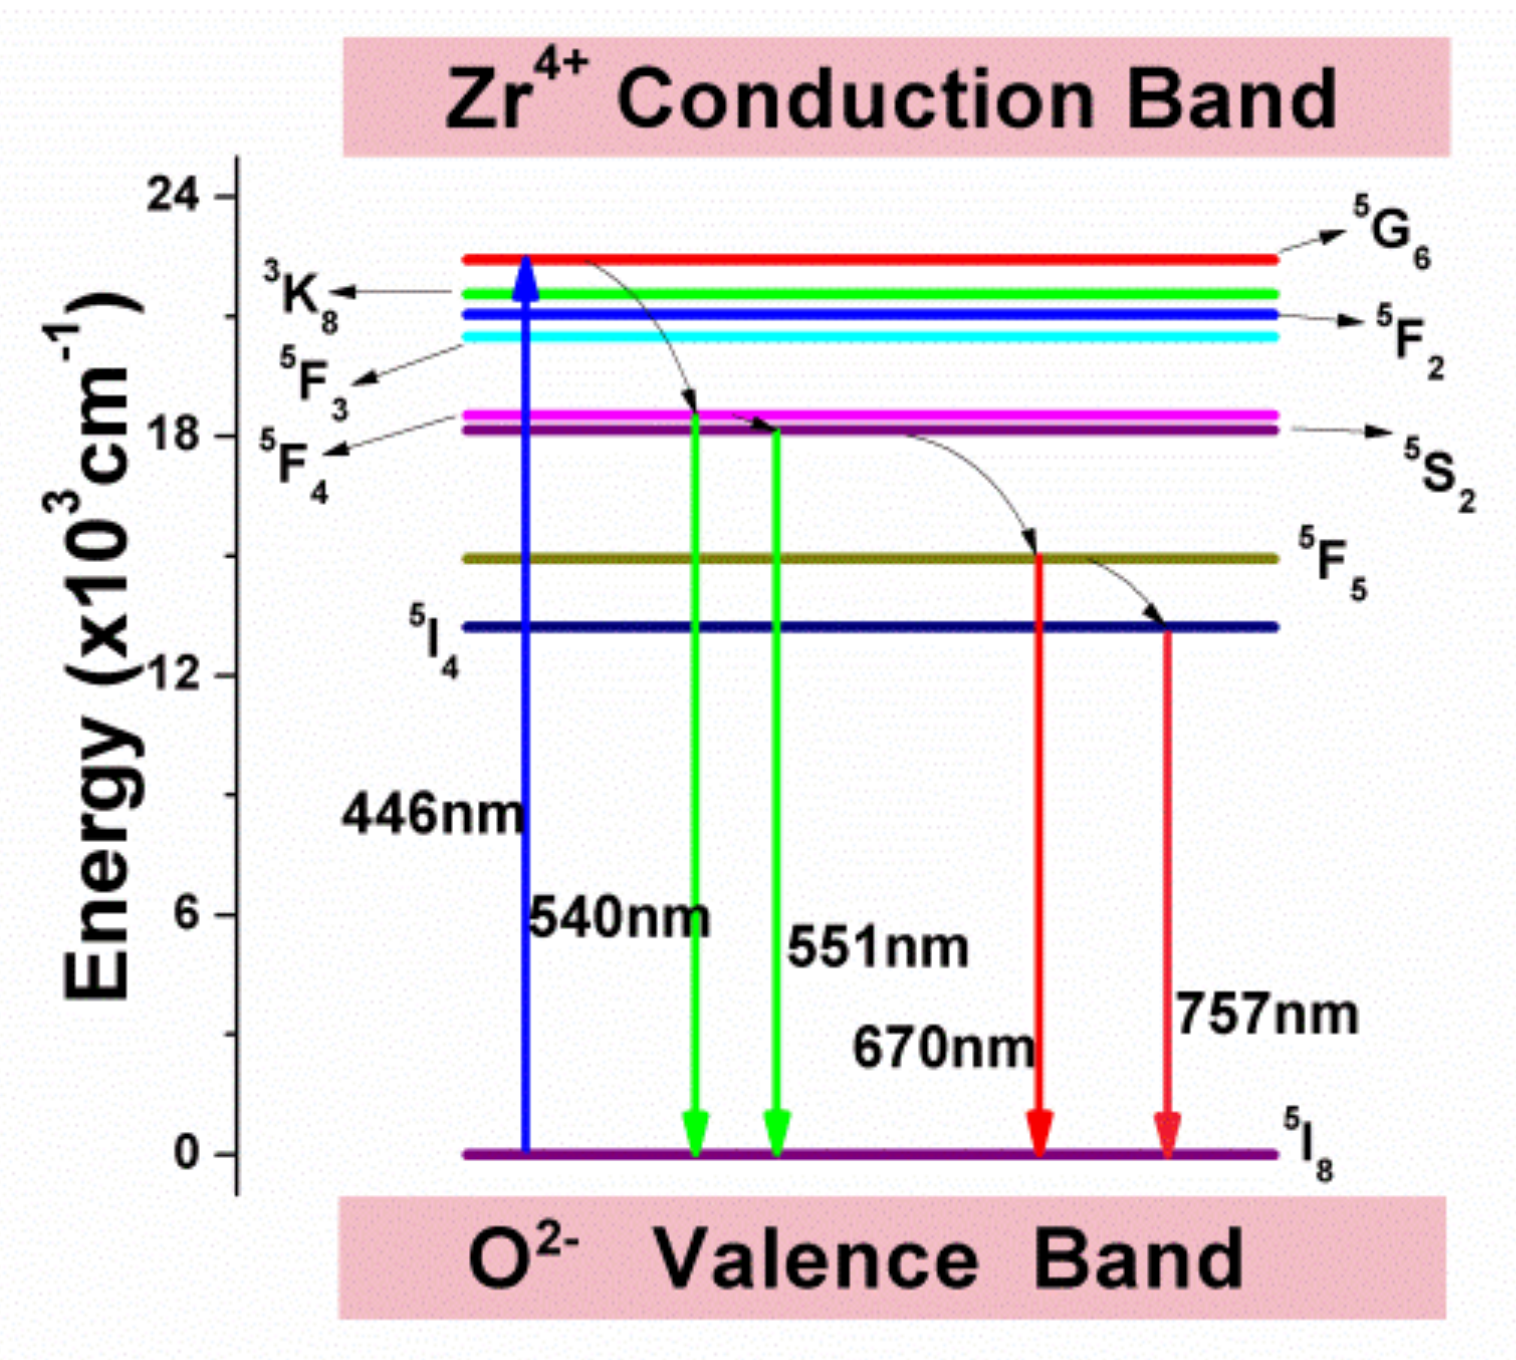
The emission peaks at 540, 551, 670, and 757 nm correspond to the transitions from 5S2, 5F4, 5F5, and 5I4 excited states to the 5I8 ground state Ho3+, respectively [47]. Although their relative intensities varied, the emission peaks positions were independent of Ho2O3 concentrations. For Ho2O3 concentrations were between 0.30 and 1.20 mol%, the strongest green emission peak was at 551 nm (5S2 → 5I8), whereas the strongest green emission was at 540 nm (5F4 → 5I8) for the (ZrO2)90(Y2O3)9.90(Ho2O3)0.10 sample.
At low Ho2O3-doped concentrations (0.10−0.50 mol%), the emission intensity increased with Ho2O3 contents and reached the maximum at 0.50 mol%, then decreased with higher Ho2O3 contents (0.50−1.20 mol%) due to the concentration quenching effect.
The energy diagram of Ho3+ in Ho2O3 doped YSZ crystals with the radiative and non-radiative transitions were shown in Figure 11. The probability of non-radiative relaxation from 5F4 to 5S2 increased with Ho3+ concentration. Therefore, for samples with Ho2O3 concentrations higher than 0.30 mol%, the emission peak at 551 nm (5S2 → 5I8) was higher than that at 540 nm (5F4 → 5I8).
Based on the Dexter theory [48], the concentration quenching effect via an electric multipole moment interaction was given by the formula [49]:
where I was the luminous intensity, k was a constant, x and y were the concentrations of Ho2O3 and Ho3+, respectively. It was obvious that y = 2x. The values for θ of 3, 6, 8, and 10 represented exchange, electric dipole–dipole interaction, dipole–quadrupole, and quadrupole–quadrupole interactions, respectively [49]. The slope of the fitted line in Figure 12 was −1.95, or θ ≈ 6, this suggested that the quenching effect occurred via an electric dipole–dipole interaction between closest neighbor Ho3+ ions.
3.6.3. Color Coordinate
The measurement of color coordinates of a light source was an important method for characterizing its quality. In general, the overall emitted color was represented by the CIE chromaticity coordinate (x, y) [50,51].
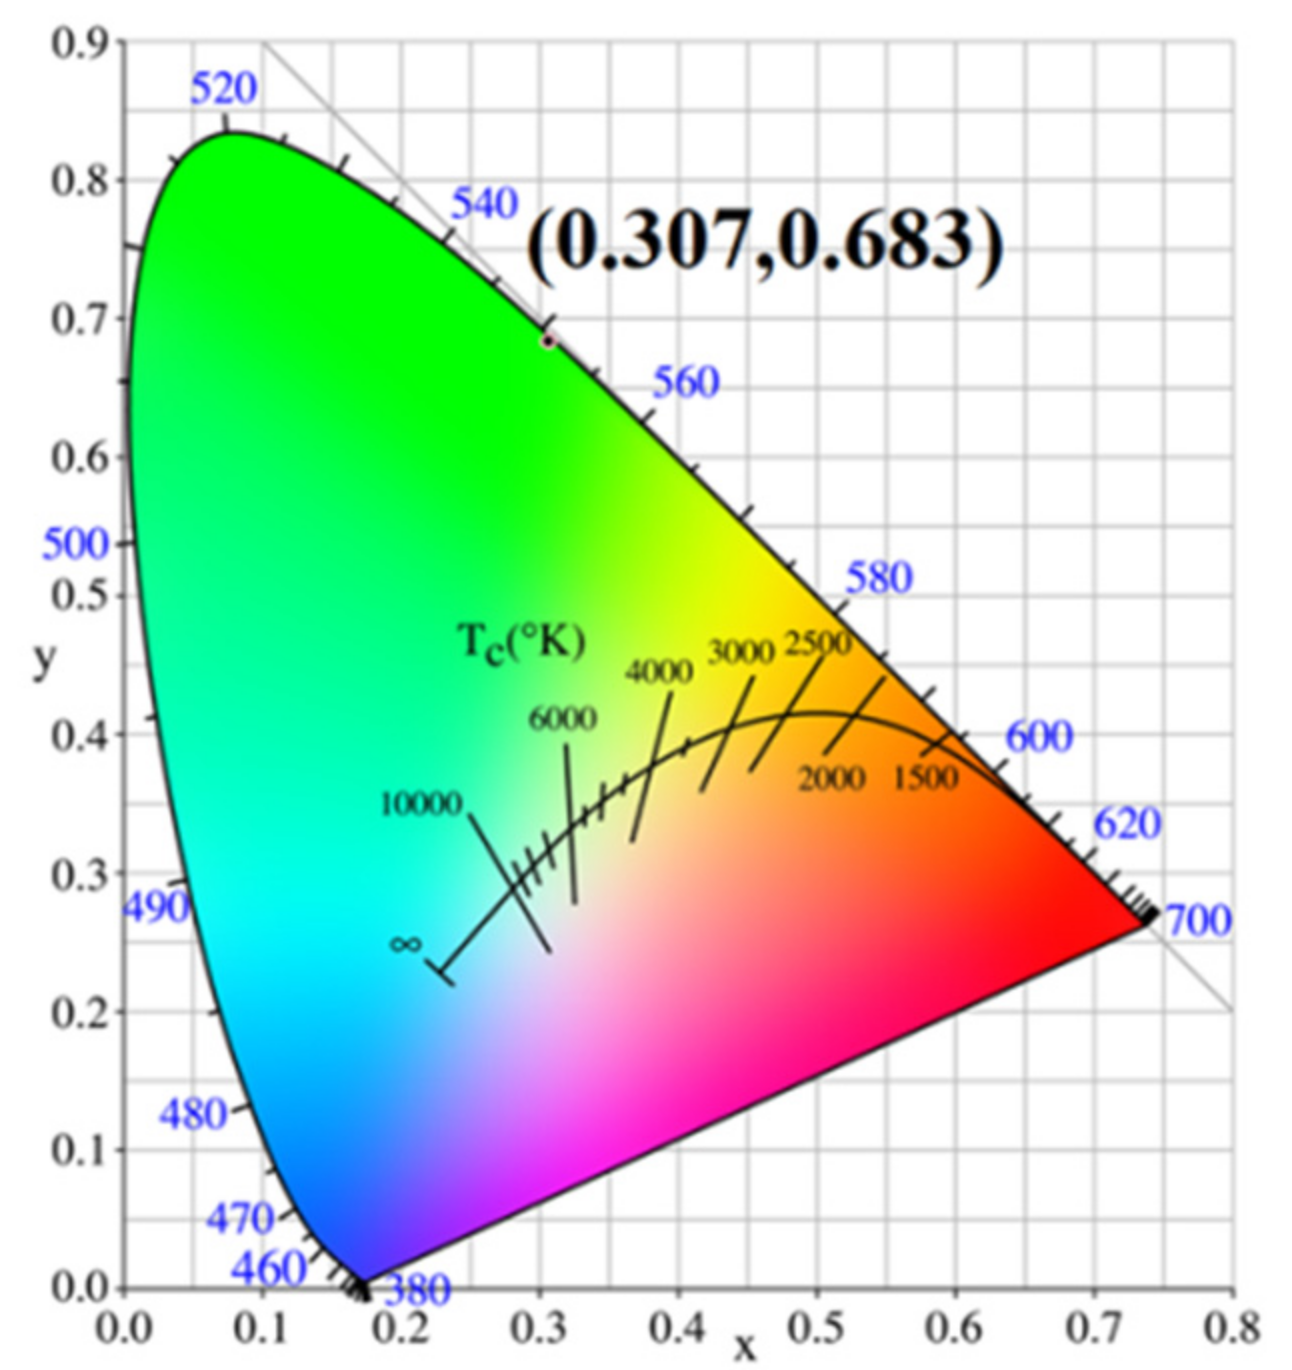
The color coordinates of the (ZrO2)90(Y2O3)10−x(Ho2O3) x crystals were shown in Figure 13 and the color purity of (ZrO2)90(Y2O3)9.50(Ho2O3)0.50 crystal calculated by CIE1931. The overall color coordinates of the emission spectra from the crystal samples were all in the green region near 551 nm and the color coordinates of the (ZrO2)90(Y2O3)9.50(Ho2O3)0.50 crystal were (0.307, 0.683).
Color purity could be calculated by the formula:
where (x, y), (xi, yi), and (xd, yd) represented the color coordinates of the emission spectrum of the sample, the coordinates of the light source and the main wavelength of the light source, respectively. The value calculated for the color purity of the (ZrO2)90(Y2O3)9.50(Ho2O3)0.50 crystal sample was 99.6% and thus was suitable for use in green light-emitting devices.
In addition, the relative color temperature (CCT) could be calculated by McCamy’s formula [52]:
where n = (x − xe)/(y − ye) was the inverse slope of the line. The color coordinates xe = 0.332, ye = 0.186, which was obtained by extending the isochromatic temperature lines on the CIE1931xy chromaticity diagram down to a point. The CCT values, as shown in Table 5, were near 5700 K for each of the crystals. This was close to the color temperature value of household appliance lighting.
4. Conclusions
A series of (ZrO2)90(Y2O3)10−x(Ho2O3)x (x = 0.00, 0.10, 0.20, 0.30, 0.50, 0.75, 1.00, 1.20), (ZrO2)92(Y2O3)8 and (ZrO2)92(Y2O3)7.25(Ho2O3)0.75 single crystals were successfully grown and stabled in tetragonal phase. The results of positron annihilation lifetime spectra indicated that the increase in Y2O3 concentration led to the increases of defects and mean positron lifetime, which enhanced the scattering of light and reduced the luminous intensity and the quantum yields of the crystals. Optical absorption spectra of (ZrO2)90(Y2O3)10−x(Ho2O3)x crystals showed peaks at 359, 382, 416, 446, 484, 537, and 635 nm corresponding to the transitions from the 5I8 ground state to 5G3, 5G4 + 3K7, 5G5, 3K8 + 5F1 + 5G6, 5F3, 5F4 + 5S2, and 5F5 excited states of Ho3+, respectively. The samples all had an optical bandgap of about 4.86 eV. Under excitation with 446 nm, strong green light and weak near-red emissions were observed at 540, 551, 670, and 757 nm. The concentration quenching occurred when the concentration of Ho2O3 was above 0.50 mol%. This suggested that the quenching effect occurred via an electric dipole–dipole interaction between closest neighbor Ho3+ ions. The color purity calculated by CIE1931 was > 99%. All results show the samples have good prospects for applications in green light-emitting devices.
Supplementary Materials
The following supporting information can be downloaded at: https://0-www-mdpi-com.brum.beds.ac.uk/article/10.3390/cryst12030415/s1, Figure S1. Positron annihilation lifetime spectra of (ZrO2)92(Y2O3)7.25(Ho2O3)0.75 and (ZrO2)90(Y2O3)9.25(Ho2O3)0.75 crystals; Figure S2. UV-vis absorption spectra of the (ZrO2)90(Y2O3)10−x(Ho2O3)x crystal discs.
Author Contributions
Conceptualization, Y.Y. and S.X.; methodology, Y.Y.; software, Y.Y. and Y.P.; validation, Y.Y., S.X. and W.D.; formal analysis, Y.Y., S.L. and Z.C.; investigation, S.X.; resources, W.D.; data curation, Y.Y., W.W. and X.H.; writing—original draft preparation, Y.Y.; writing—review and editing, Y.Y. and W.D.; visualization, D.W.; supervision, W.D.; project administration, Y.Y. and W.D. All authors have read and agreed to the published version of the manuscript.
Funding
This work was financially supported by the Natural Science Foundations of China under Grant Nos. 11975004 and 12175047, the Key Research and Development Plan Project of Guangxi, China under Grant No. Guike AB18281007 and Education Department of Guangxi Zhuang Autonomous Region (No. 2021KY0017).
Data Availability Statement
The data presented in this study are available on reasonable request from the corresponding author.
Acknowledgments
The authors gratefully thank Bernard A. Goodman, Dingkang Xiong and Yuyang Huang for useful discussions on the subject matter of this paper.
Conflicts of Interest
The authors declare no conflict of interest.
References
- Zhang, X.; Cao, C.; Zhang, C.; Xie, S.; Xu, G.; Zhang, J.; Wang, X. Photoluminescence and energy storage traps in CaTiO3:Pr3+. Mater. Res. Bull. 2010, 45, 1832–1836. [Google Scholar] [CrossRef]
- Yuan, J.; Wang, W.; Ye, Y.; Deng, T.; Huang, Y.; Gu, S.; Chen, Y.; Xiao, P. 2.0 μm Ultra Broadband Emission from Tm3+/Ho3+Co-Doped Gallium Tellurite Glasses for Broadband Light Sources and Tunable Fiber Lasers. Crystals 2021, 11, 190. [Google Scholar] [CrossRef]
- Buarque, J.M.M.; Manzani, D.; Scarpari, S.L.; Nalin, M.; Ribeiro, S.J.L.; Esbenshade, J.; Schiavon, M.A.; Ferrariet, J.L. SiO2-TiO2 doped with Er3+/Yb3+/Eu3+ photoluminescent material: A spectroscopy and structural study about potential application for improvement of the efficiency on solar cells. Mater. Res. Bull. 2018, 107, 295–307. [Google Scholar] [CrossRef] [Green Version]
- Liu, L.; Sun, Z.; Ma, C.; Tao, R.; Zhang, J.; Li, H.; Zhao, E. Highly sensitive and accurate optical thermometer through Er doped tellurite glasses. Mater. Res. Bull. 2018, 105, 306–311. [Google Scholar] [CrossRef]
- Sreedhar, V.B.; Basavapoornima, C.; Jayasankar, C.K. Spectroscopic and fluorescence properties of Sm3+-doped zincfluorophosphate glasses. J. Rare Earths 2014, 32, 918–926. [Google Scholar] [CrossRef]
- Neelima, G.; Kummara, V.K.; Ravi, N.; Suresh, K.; Rasool, S.N.; Tyagarajan, K.; Prasad, T.J. Investigation of spectroscopic properties of Sm3+-doped oxyfluorophosphate glasses for laser and display applications. Mater. Res. Bull. 2018, 110, 223–229. [Google Scholar] [CrossRef]
- Singh, V.; Annapurna Devi, C.B.; Kaur, S.; Rao, A.S.; Singh, N. Optical properties of Sr2La8(SiO4)6O2 doped with Ho3+ phosphor. Optik 2021, 242, 167268. [Google Scholar] [CrossRef]
- Sarkar, J.; Mondal, S.; Panja, S.; Dey, I.; Sarkar, A.; Ghorai, U.K. Multicolour tuning and perfect white emission from novel PbWO4:Yb3+:Ho3+:Tm3+ nanophosphor. Mater. Res. Bull. 2019, 112, 314–322. [Google Scholar] [CrossRef]
- Xu, Y.; Wang, Y.; Shi, L.; Xing, L.; Tan, X. Bright white upconversion luminescence in Ho3+/Yb3+/Tm3+ triple doped CaWO4 polycrystals. Opt. Laser Technol. 2013, 54, 50–52. [Google Scholar] [CrossRef]
- Zhang, Y.; Huang, F.; Liu, L.; Liu, X.; Zheng, S.; Chen, D. Pr3+/Ho3+ co-doped glass phosphors for application in warm white light-emitting diodes. Mater. Lett. 2016, 167, 1–3. [Google Scholar] [CrossRef]
- Ming, C.; Song, F.; Yu, Y.; Wang, Q. Impact of Ce4+ ion on microstructure and luminescence character of Ho3+/Yb3+ co-doped ZrO2 nanocrystal. J. Alloys Compd. 2012, 512, 121–123. [Google Scholar] [CrossRef]
- John Berlin, I.; Lakshmi, J.S.; Sujatha Lekshmy, S.; Daniel, G.P.; Thomas, P.V.; Joy, K. Effect of sol temperature on the structure, morphology, optical and photoluminescence properties of nanocrystalline zirconia thin films. J. Sol-Gel Sci. Technol. 2011, 58, 669–676. [Google Scholar] [CrossRef]
- Liang, F.; Chen, J.; Cheng, J.; Jiang, S.P.; He, T.; Pu, J.; Li, J. Novel nano-structured Pd+ yttrium doped ZrO2 cathodes for intermediate temperature solid oxide fuel cells. Electrochem. Commun. 2008, 10, 42–46. [Google Scholar] [CrossRef]
- Di Monte, R.; Kašpar, J. Heterogeneous environmental catalysis—A gentle art: CeO2–ZrO2 mixed oxides as a case history. Catal. Today 2005, 100, 27–35. [Google Scholar] [CrossRef]
- Hafele, E.; Kaltenmaier, K.; Schtinauer, U. Application of the ZrO2, Sensor in Determination of Pollutant Gases. Sens. Actuators B 1991, 4, 525–527. [Google Scholar] [CrossRef]
- Sathyaseelan, B.; Manikandan, E.; Baskaran, I.; Senthilnathan, K.; Sivakumar, K.; Moodley, M.K.; Ladchumanandasivam, R.; Maaza, M. Studies on structural and optical properties of ZrO2 nanopowder for opto-electronic applications. J. Alloys Compd. 2017, 694, 556–559. [Google Scholar] [CrossRef]
- French, R.H.; Glass, S.J.; Ohuchi, F.S.; Xu, Y.; Ching, W.Y. Experimental and theoretical determination of the electronic structure and optical properties of three phases of ZrO2. Phys. Rev. B Condens. Matter. 1994, 49, 5133–5142. [Google Scholar] [CrossRef]
- Viazzi, C.; Bonino, J.P.; Ansart, F.; Barnabé, A. Structural study of metastable tetragonal YSZ powders produced via a sol–gel route. J. Alloys Compd. 2008, 452, 377–383. [Google Scholar] [CrossRef] [Green Version]
- Morinaga, M.; Adachi, H.; Tsukada, M. Electronic structure and pahse stability of ZrO2. J. Phys. Chem. Solids 1983, 44, 301–306. [Google Scholar] [CrossRef]
- Barabás, R.; Fort, C.I.; Turdean, G.L.; Bizo, L. Influence of HAP on the Morpho-Structural Properties and Corrosion Resistance of ZrO2-Based Composites for Biomedical Applications. Crystals 2021, 11, 202. [Google Scholar] [CrossRef]
- Schubert, H. Anisotropic Thermal Expansion Coefficients of Y203-Stabilized Tetragonal Zirconia. J. Am. Ceram. Soc. 1986, 69, 270–271. [Google Scholar] [CrossRef]
- Wang, D.N.; Xu, S.L.; Wang, X.Y.; Li, S.Y.; Hong, X.; Goodman, B.A.; Deng, W. Crystal growth, structure and optical properties of Pr3+-doped yttria-stabilized zirconia single crystals. Chin. Phys. B 2021, 30, 078103. [Google Scholar] [CrossRef]
- Srigurunathan, K.; Meenambal, R.; Guleria, A.; Kumar, D.; Ferreira, J.; Kannan, S. Unveiling the Effects of Rare-Earth Substitutions on the Structure, Mechanical, Optical, and Imaging Features of ZrO2 for Biomedical Applications. ACS Biomater. Sci. Eng. 2019, 5, 1725–1743. [Google Scholar] [CrossRef] [PubMed]
- Popov, V.V.; Menushenkov, A.P.; Yastrebtsev, A.A.; Tsarenko, N.A.; Arzhatkina, L.A.; Shchetinin, I.V.; Zheleznyi, M.V.; Ponkratov, K.V. Regularities of formation of complex oxides with the fluorite structure in the ZrO2–Y2O3 system. Russ. J. Inorg. Chem. 2017, 62, 1147–1154. [Google Scholar] [CrossRef]
- Cruz, R.M.; Pareja, R.; Gonzalez, R. Effect of thermochemical reduction on the electrical, optical-absorption, and positron-annihilation characteristics of ZnO crystals. Phys. Rev. B 1992, 45, 6581–6586. [Google Scholar] [CrossRef]
- Dutta, S.; Chattopadhyay, S.; Jana, D.; Banerjee, A.; Manik, S.; Pradhan, S.K.; Sutradhar, M.; Sarkar, A. Annealing effect on nano-ZnO powder studied from positron lifetime and optical absorption spectroscopy. J. Appl. Phys. 2006, 100, 114328. [Google Scholar] [CrossRef]
- Brandt, W.; Paulin, R. Positron Diffusion in Solids. Phys. Rev. B 1972, 5, 2430–2435. [Google Scholar] [CrossRef]
- Nambissan, P.M.G. Nano sulfide and oxide semiconductors as promising materials for studies by positron annihilation. J. Phys. Conf. Ser. 2013, 443, 012040. [Google Scholar] [CrossRef] [Green Version]
- Šćepanović, M.; de Castro, V.; García-Cortés, I.; Sánchez, F.J.; Gigl, T.; Hugenschmidt, C.; Leguey, T. Characterisation of open volume defects in Fe–Cr and ODS Fe–Cr alloys after He+ and Fe+ ion irradiations. J. Nucl. Mater. 2020, 538, 152230. [Google Scholar] [CrossRef]
- Anwand, W.; Skorupa, W.; Schumann, T.; Posselt, M.; Schmidt, B.; Grötzschel, R.; Brauer, G. Implantation-caused open volume defects in Ge after flash lamp annealing (FLA) probed by slow positron implantation spectroscopy (SPIS). Appl. Surf. Sci. 2008, 255, 81–83. [Google Scholar] [CrossRef]
- Kesavulu, C.R.; Kim, H.J.; Lee, S.W.; Kaewkhao, J.; Wantana, N.; Kothan, S.; Kaewjaeng, S. Optical spectroscopy and emission properties of Ho3+-doped gadolinium calcium silicoborate glasses for visible luminescent device applications. J. Non-Cryst. Solids 2017, 474, 50–57. [Google Scholar] [CrossRef]
- Zhao, Y.; Zhai, X.; Yan, D.; Zhao, Y.; Zhou, H.; Zhao, X.; Li, J.; Jin, H. The effect of artificial stress on Er3+ doped perovskite lead-free piezoceramics. J. Alloys Compd. 2017, 709, 724–728. [Google Scholar] [CrossRef]
- Zhao, Y.; Ge, Y.; Zhang, X.; Zhao, Y.; Zhou, H.; Li, J.; Jin, H. Comprehensive investigation of Er2O3 doped (Li,K,Na)NbO3 ceramics rendering potential application in novel multifunctional devices. J. Alloys Compd. 2016, 683, 171–177. [Google Scholar] [CrossRef]
- Lin, J.; Lu, Q.; Xu, J.; Wu, X.; Lin, C.; Lin, T.; Chen, C.; Luo, L.H. Outstanding optical temperature sensitivity and dual-mode temperature-dependent photoluminescence in Ho3+ -doped (K,Na)NbO3–SrTiO3 transparent ceramics. J. Am. Ceram. Soc. 2019, 102, 4710–4720. [Google Scholar] [CrossRef]
- Ishida, H.; Bünzli, J.C.; Beeby, A. Guidelines for measurement of luminescence spectra and quantum yields of inorganic and organometallic compounds in solution and solid state (IUPAC Technical Report). Pure Appl. Chem. 2016, 88, 701–711. [Google Scholar] [CrossRef] [Green Version]
- Ishida, H.; Tobita, S.; Hasegawa, Y.; Katoh, R.; Nozaki, K. Recent advances in instrumentation for absolute emission quantum yield measurements. Coord. Chem. Rev. 2010, 254, 2449–2458. [Google Scholar] [CrossRef]
- Katoh, R.; Suzuki, K.; Furube, A.; Kotani, M.; Tokumaru, K. Fluorescence Quantum Yield of Aromatic Hydrocarbon Crystals. J. Phys. Chem. C 2009, 113, 2961–2965. [Google Scholar] [CrossRef]
- Upadhyaya, D.D.; Ghosh, A.; Gurumurthy, K.R.; Ram, P. Microwave sintering of cubic zirconia. Ceram. Int. 2001, 27, 415–418. [Google Scholar] [CrossRef]
- Soares, M.R.N.; Soares, M.J.; Fernandes, A.J.S.; Rino, L.; Costa, F.M.; Monteiro, T. YSZ:Dy3+ single crystal white emitter. J. Mater. Chem. 2011, 21, 15262–15265. [Google Scholar] [CrossRef]
- Manjunatha, S.; Dharmaprakash, M.S. Microwave assisted synthesis of cubic Zirconia nanoparticles and study of optical and photoluminescence properties. J. Lumin. 2016, 180, 20–24. [Google Scholar] [CrossRef]
- Rosa, E.D.L.; Diaz-Torres, L.A.; Salas, P.; Rodríguez, R.A. Visible light emission under UV and IR excitation of rare earth doped ZrO2 nanophosphor. Opt. Mater. 2005, 27, 1320–1325. [Google Scholar] [CrossRef]
- Wang, C.; Chen, X.B.; Zhang, C.L.; Zhang, Y.Z.; Liu, J.Y.; Wang, Y.F.; Liu, D.H.; Du, S.; Xu, X.L.; Wang, L.; et al. Optical parameters and energy levels splitting of Ho3+ in Ho3+ GdVO4. Chin. Phys. B 2008, 17, 4656–4664. [Google Scholar]
- Wang, H.; Yang, Q.; Sun, Y.; Jiang, X.; Huang, D. Optical spectroscopy studies of Ho/Yb co-doped yttrium lanthanum oxide transparent ceramics. J. Lumin. 2017, 192, 752–756. [Google Scholar] [CrossRef]
- Jayachandra Prasad, T.; Neelima, G.; Ravi, N.; Kiran, N.; Nallabala, N.K.; Kummara, V.K.; Suresh, K.; Gadige, P. Optical and spectroscopic properties of Ho3+-doped fluorophosphate glasses for visible lighting applications. Mater. Res. Bull. 2020, 124, 110753. [Google Scholar]
- Priyanka, R.; Arunkumar, S.; Basavapoornima, C.; Mary Mathelane, R.; Marimuthu, K. Structural and spectroscopic investigations on Eu3+ ions doped boro-phosphate glasses for optical display applications. J. Lumin. 2020, 220, 116964. [Google Scholar] [CrossRef]
- Hong, X.; Xu, S.; Wang, X.; Wang, D.; Li, S.; Goodman, B.A.; Deng, W. Growth, structure and optical spectroscopic properties of dysprosia-doped cubic yttria stabilized zirconia (YSZ) single crystals. J. Lumin. 2021, 231, 117766. [Google Scholar] [CrossRef]
- Lim, C.S.; Aleksandrovsky, A.; Molokeev, M.; Oreshonkov, A.; Atuchin, V. Structural and Spectroscopic Effects of Li+ Substitution for Na+ in LixNa1−xCaGd0.5Ho0.05Yb0.45(MoO4)3 Scheelite-Type Upconversion Phosphors. Molecules 2021, 26, 7357. [Google Scholar] [CrossRef]
- Dexter, D.L. A theory of sensitized luminescence in solids. J. Chem. Phys. 1953, 21, 836–850. [Google Scholar] [CrossRef]
- Kalimuthu, K.R.; Moorthy Babu, S.; Kalimuthu, V. Synthesis and photoluminescence properties of Sm3+ doped LiGd(WO4)2 phosphors with high color purity. Opt. Mater. 2020, 102, 109804. [Google Scholar]
- Gavenda, T.; Gedeon, O.; Jurek, K. Volume changes in glass induced by an electron beam. Nucl Instrum Methods. Phys. Res. B 2014, 322, 7–12. [Google Scholar]
- Das, S.; Lalla, N.P.; Okram, G.S. Synthesis, characterization and dielectric properties of nanocrystalline nickel. Indian J. Pure Appl. Phys. 2014, 52, 386–390. [Google Scholar]
- McCamy, C.S. Correlated Color Temperature as an Explicit Function of Chromaticity Coordinates. Color Res. Appl. 1992, 17, 142–144. [Google Scholar] [CrossRef]
Figure 1.
(ZrO2)90(Y2O3)9.70(Ho2O3)0.30 and (ZrO2)90(Y2O3)9.50(Ho2O3)0.50 crystal rods.

Figure 2.
EDS image of the (ZrO2)90(Y2O3)9.25(Ho2O3)0.75 sample.

Figure 3.
XRD patterns of (ZrO2)92(Y2O3)7.25(Ho2O3)0.75 and (ZrO2)90(Y2O3)9.25(Ho2O3)0.75 powders ground from the crystals.
Figure 3.
XRD patterns of (ZrO2)92(Y2O3)7.25(Ho2O3)0.75 and (ZrO2)90(Y2O3)9.25(Ho2O3)0.75 powders ground from the crystals.

Figure 4.
(a) Raman spectra of (ZrO2)92(Y2O3)7.25(Ho2O3)0.75 and (ZrO2)90(Y2O3)9.25(Ho2O3)0.75. (b) Raman spectra of (ZrO2)90(Y2O3)10−x(Ho2O3)x.
Figure 4.
(a) Raman spectra of (ZrO2)92(Y2O3)7.25(Ho2O3)0.75 and (ZrO2)90(Y2O3)9.25(Ho2O3)0.75. (b) Raman spectra of (ZrO2)90(Y2O3)10−x(Ho2O3)x.

Figure 5.
PLE spectrum monitored at 551 nm for (ZrO2)90(Y2O3)9.25(Ho2O3)0.75 crystals.

Figure 6.
PL spectra for (ZrO2)92(Y2O3)7.25(Ho2O3)0.75 and (ZrO2)90(Y2O3)9.25(Ho2O3)0.75 crystals under the excitation at 446 nm.
Figure 6.
PL spectra for (ZrO2)92(Y2O3)7.25(Ho2O3)0.75 and (ZrO2)90(Y2O3)9.25(Ho2O3)0.75 crystals under the excitation at 446 nm.

Figure 7.
Luminescence spectra for (ZrO2)90(Y2O3)10, (ZrO2)92(Y2O3)8, (ZrO2)92(Y2O3)7.25(Ho2O3)0.75, and (ZrO2)90(Y2O3)9.25(Ho2O3)0.75 crystals under the excitation at 446 nm.
Figure 7.
Luminescence spectra for (ZrO2)90(Y2O3)10, (ZrO2)92(Y2O3)8, (ZrO2)92(Y2O3)7.25(Ho2O3)0.75, and (ZrO2)90(Y2O3)9.25(Ho2O3)0.75 crystals under the excitation at 446 nm.

Figure 8.
UV-vis absorption spectrum of the (ZrO2)90(Y2O3)9.25(Ho2O3)0.75 crystal.

Figure 9.
Measurements of the optical bandgap in (ZrO2)90(Y2O3)10−x(Ho2O3)x crystal discs.

Figure 10.
PL spectra of the (ZrO2)90(Y2O3)10−x(Ho2O3)x crystals under the excitation at 446nm.

Figure 11.
The energy diagram of Ho3+ in Ho2O3 doped YSZ crystals with the radiative and non-radiative transitions.
Figure 11.
The energy diagram of Ho3+ in Ho2O3 doped YSZ crystals with the radiative and non-radiative transitions.

Figure 12.
Relationship between log(I/y) vs. log(y) in (ZrO2)90(Y2O3)10−x(Ho2O3)x crystals.

Figure 13.
Color coordinates of (ZrO2)90(Y2O3)9.50(Ho2O3)0.50 crystal.


Table 1.
Chemical compositions of Ho2O3-doped YSZ samples.
| Samples | Composition mol% | ||
|---|---|---|---|
| ZrO2 | Y2O3 | Ho2O3 | |
| (ZrO2)90(Y2O3)10 | 90.00 | 10.00 | 0.00 |
| (ZrO2)90(Y2O3)9.90(Ho2O3)0.10 | 90.00 | 9.90 | 0.10 |
| (ZrO2)90(Y2O3)9.80(Ho2O3)0.20 | 90.00 | 9.80 | 0.20 |
| (ZrO2)90(Y2O3)9.70(Ho2O3)0.30 | 90.00 | 9.70 | 0.30 |
| (ZrO2)90(Y2O3)9.50(Ho2O3)0.50 | 90.00 | 9.50 | 0.50 |
| (ZrO2)90(Y2O3)9.25(Ho2O3)0.75 | 90.00 | 9.25 | 0.75 |
| (ZrO2)90(Y2O3)9.00(Ho2O3)1.00 | 90.00 | 9.00 | 1.00 |
| (ZrO2)90(Y2O3)8.80(Ho2O3)1.20 | 90.00 | 8.80 | 1.20 |
| (ZrO2)92(Y2O3)8 | 92.00 | 8.00 | 0.00 |
| (ZrO2)92(Y2O3)7.25(Ho2O3)0.75 | 92.00 | 7.25 | 0.75 |
Table 2.
Positron lifetime parameters of the (ZrO2)92(Y2O3)7.25(Ho2O3)0.75 and (ZrO2)90(Y2O3)9.25(Ho2O3)0.75 crystals.
Table 2.
Positron lifetime parameters of the (ZrO2)92(Y2O3)7.25(Ho2O3)0.75 and (ZrO2)90(Y2O3)9.25(Ho2O3)0.75 crystals.
| Sample | τ1 (ps) | τ2 (ps) | I1 (%) | I2 (%) | λb (ns−1) | τb (ps) | τm (ps) |
|---|---|---|---|---|---|---|---|
| (ZrO2)92(Y2O3)7.25(Ho2O3)0.75 | 193 ± 1 | 482 ± 26 | 89.2 | 10.8 | 4.84 | 206 | 224 |
| (ZrO2)90(Y2O3)9.25(Ho2O3)0.75 | 191 ± 1 | 436 ± 14 | 82.2 | 17.8 | 4.71 | 212 | 234 |
Table 3.
The quantum yields of the (ZrO2)92(Y2O3)7.25(Ho2O3)0.75 and (ZrO2)90(Y2O3)9.25(Ho2O3)0.75 crystals.
Table 3.
The quantum yields of the (ZrO2)92(Y2O3)7.25(Ho2O3)0.75 and (ZrO2)90(Y2O3)9.25(Ho2O3)0.75 crystals.
| Sample | Nabs (Counts) | Nem (Counts) | QY (%) |
|---|---|---|---|
| (ZrO2)92(Y2O3)7.25(Ho2O3)0.75 | 49,204,500 | 15,458,581 | 31.4 |
| (ZrO2)90(Y2O3)9.25(Ho2O3)0.75 | 48,688,100 | 11,318,743 | 23.2 |
Table 4.
Values of intercept, slope, R2, and Eg for (ZrO2)90(Y2O3)10−x(Ho2O3)x.
| x | Slope | Intercept | R2 | Eg (eV) |
|---|---|---|---|---|
| 0.10 | 477 | −2324 | 0.9998 | 4.86 |
| 0.30 | 557 | −2714 | 0.9995 | 4.87 |
| 0.50 | 561 | −2732 | 0.9995 | 4.87 |
| 0.75 | 577 | −2812 | 0.9997 | 4.87 |
| 1.00 | 596 | −2904 | 0.9998 | 4.87 |
| 1.20 | 611 | −2974 | 0.9998 | 4.86 |
Table 5.
Chromaticity coordinates (x, y) for (ZrO2)90(Y2O3)10−x(Ho2O3)x crystals.
| x | CIE x | CIE y | CCT |
|---|---|---|---|
| 0.10 | 0.2977 | 0.6891 | 5777 |
| 0.30 | 0.3020 | 0.6877 | 5745 |
| 0.50 | 0.3072 | 0.6835 | 5707 |
| 1.00 | 0.3093 | 0.6822 | 5693 |
| 1.20 | 0.3129 | 0.6786 | 5667 |
Publisher’s Note: MDPI stays neutral with regard to jurisdictional claims in published maps and institutional affiliations. |
© 2022 by the authors. Licensee MDPI, Basel, Switzerland. This article is an open access article distributed under the terms and conditions of the Creative Commons Attribution (CC BY) license (https://creativecommons.org/licenses/by/4.0/).
Share and Cite
MDPI and ACS Style
Yang, Y.; Xu, S.; Li, S.; Wu, W.; Pan, Y.; Wang, D.; Hong, X.; Cheng, Z.; Deng, W. Luminescence Properties of Ho2O3-Doped Y2O3 Stabilized ZrO2 Single Crystals. Crystals 2022, 12, 415. https://0-doi-org.brum.beds.ac.uk/10.3390/cryst12030415
AMA Style
Yang Y, Xu S, Li S, Wu W, Pan Y, Wang D, Hong X, Cheng Z, Deng W. Luminescence Properties of Ho2O3-Doped Y2O3 Stabilized ZrO2 Single Crystals. Crystals. 2022; 12(3):415. https://0-doi-org.brum.beds.ac.uk/10.3390/cryst12030415
Chicago/Turabian StyleYang, Yuhua, Shoulei Xu, Siyao Li, Wenxia Wu, Yihua Pan, Daini Wang, Xing Hong, Zeyu Cheng, and Wen Deng. 2022. "Luminescence Properties of Ho2O3-Doped Y2O3 Stabilized ZrO2 Single Crystals" Crystals 12, no. 3: 415. https://0-doi-org.brum.beds.ac.uk/10.3390/cryst12030415
Note that from the first issue of 2016, this journal uses article numbers instead of page numbers. See further details here.