
Creep and Oxidation Behaviors of 25 wt.% Cr–Containing Nickel-Based Alloys Reinforced by ZrC Carbides


1
CNRS, IJL, Université de Lorraine, 2 Allée André Guinier, F-54000 Nancy, France
2
Faculté des Sciences et Technologies, Campus Victor Grignard, Université de Lorraine, F-54000 Nancy, France
*
Author to whom correspondence should be addressed.
Crystals 2022, 12(3), 416; https://0-doi-org.brum.beds.ac.uk/10.3390/cryst12030416
Submission received: 10 February 2022
/
Revised: 8 March 2022
/
Accepted: 12 March 2022
/
Published: 17 March 2022
(This article belongs to the Special Issue Recent Advances in Metallurgy and Properties of Superalloys (Volume II))
Abstract
:Three alloys based on nickel, rich in chromium due to their oxidation resistance at high temperature and containing ZrC carbides for their mechanical reinforcing against creep, were elaborated by foundry. After control of their as-cast microstructures, these alloys were subjected at 1100 °C to flexural creep and to oxidation in air. Script-like ZrC carbides were obtained in the interdendritic spaces, forming a eutectic compound with a part of the matrix. One of the alloys additionally contained Cr7C3 eutectic carbides. By comparison with a Ni–Cr–C reference alloy with similar contents in Cr and C, the three alloys demonstrated a much better creep resistance for the same conditions of stress and temperature. However, their oxidation rates were much greater than for the reference alloy. In contrast with the chromia-forming reference alloy, several kinds of oxides formed in the case of the three alloys, as NiCr2O4 spinel and oxides involving zirconium. A significant inward interdendritic oxidation progression was noticed for the three studied alloys. To benefit from the interesting creep resistance of these alloys for long sustainability in service, it appears necessary to significantly improve their oxidation behavior.
1. Introduction
Superalloys with a polycrystalline structure and strengthened by carbides have been used for a long time [1,2]. Many of them contain high levels of chromium to combat both corrosion and oxidation at high temperature [3]. Despite the superior properties level of more modern superalloys, such as the γ/γ′ single crystals based on nickel and rich in aluminum [4] with their particular microstructure exceptionally rich in reinforcing particles [5] and their alumina-forming behavior [6], the chromium-rich carbides-strengthened family of superalloys is currently still of significant interest for some high temperature use cases. Among them there are applications that combine the complex geometry of the concerned components (excluding single crystals and oxide dispersion strengthened superalloys), the need of high resistance against corrosion by hot aggressive melts in absence of protective coatings (excluding alumina-forming superalloys), sustainability of the reinforcing particles even at 1100 °C and slightly more (excluding γ′-reinforced alloys), and not too high density (excluding heavy refractory alloys). The reinforcement of cobalt-based [1,2,7] and nickel-based [4,8,9] conventionally cast chromium-rich alloys with MC carbides such as TaC, HfC or TiC is one of the ways new developments and application prospects to superalloys of this family are offered. The refractory monocarbides list can be enriched by ZrC, which may be present in solidified alloys with a morphology similar to the MC carbides cited above [10]. Zirconium is known as a base element of alloys, belonging to the famous Zircaloy family [11,12]. Its more frequent uses in superalloys are only with small amounts. With, for instance, less (and even much less) than 0.1 wt.%, Zr may trap sulfur (as in the 80A alloy [13]). However, it also influences the microstructures of the superalloys containing it: e.g., the quantity of carbides in the grain boundaries [14], MC formation [15], and grain size refinement [16]. Effects of low Zr amounts can also be noticed on the mechanical behaviors of superalloys [17,18], as well as on the high temperature oxidation behavior of bulk [19], bondcoats/diffusion barrier, or coatings [20,21,22].
Seemingly, intermediate Zr contents to form a ZrC carbide network for a mechanical strengthening purpose have not yet been considered. In this work, this method of strengthening has been explored: Zr was added to a Ni–25Cr–(0.25 or 0.50)C base, in quantities significantly higher than usually in nickel-based superalloys, but much lower than in Zircaloys, to produce a mechanical reinforcement by ZrC carbides. Three alloys were cast with two Zr contents (about 2 to 4 wt.%), and their creep resistance as well as their oxidation behavior were explored at 1100 °C. The choice of this temperature is motivated by the fact that the gamma prime precipitates disappear significantly in Ni–based single crystals: 1100 °C is the threshold temperature above which these alloys start presenting a significant mechanical weakening due to this disappearance of their reinforcing particles. In this study, we want to verify whether ZrC carbides are able to mechanically take over for nickel superalloys for service temperature above 1100 °C, while still resisting oxidation.
2. Materials and Methods
2.1. Design of the Alloys
Four alloys, all based on nickel and containing 25 wt.% Cr, were synthesized for this study. As previously done—with more or less success—for Ni–based chromium-containing alloys previously studied, which were designed to contain exclusively MC carbides (M = Ta [23], Ti [24], or Hf [25]), the zirconium and carbon contents of two of the present alloys were rated to respect the molar equivalence between the two elements: 0.25 wt.% C with 1.9 wt.% Zr, and 0.50 wt.% C with 3.8 wt.% Zr. Another alloy with two times more carbon than zirconium (0.50 wt.% C with 9 wt.% Zr) was also synthesized for comparison for the two first alloys, and a ternary alloy Ni–25Cr–0.5C (wt.%) for a second comparison to better reveal the effect of the presence of zirconium.
2.2. Elaboration
All alloys were obtained by melting pure Ni, Cr, C and Zr for three of the alloys, introduced in the charges in the form of metallic flakes and of graphite rod (Alfa Aesar, purity >99.9%). Melting these charges and the following solidification were done in a 50-kW induction furnace (CELES, France). As a gaseous atmosphere, the fusion chamber, closed with a silica tube, contained 300 mbar of pure argon. The input voltage was increased to the maximal value of 5 kV, while the frequency of the alternative current (4 A) stayed at the 100 kHz level. Solidification resulted in compact ingots weighing about 40 g for each of the four alloys.
2.3. Control of the Obtained Chemical Compositions and Microstructures
The obtained ingots were cut in several parts using a metallographic saw (BUELHER). A part per alloy was embedded in resin, ground (using SiC papers from #240 to #1200), washed, and polished (using a textile disk containing 3 µm hard particles).
The obtained mirror-like metallographic samples were examined using a Scanning Electron Microscope (SEM) JEOL JSM 6010LA under 20 kV (acceleration voltage) in the Back Scattered Electrons (BSE) mode to control the microstructures. The chemical compositions were analyzed using Energy Dispersion Spectrometry (EDS) using the device attached to the SEM. This was performed on 5 × 250 areas randomly chosen in the bulk (i.e., over a total surface equal to 5 × 0.16 mm2). With this spectrometer, the accuracy of the values obtained for each content was close to +/− 0.2 wt.%). For each element, the average value and the standard deviation value were calculated from the five obtained results.
2.4. Control of the Hardness of the Alloys
The hardness at ambient temperature was specified by indentation using the Vickers method: penetration of a four-sided diamond pyramid under a 30 kg (F = 294 N) load maintained for 10 s, removing the indentor and the measurements of the diagonal lengths of the obtained pyramidal marks and calculation of their average value (d), and calculation of the Vickers hardness (equal to 0.1891 × F/d2). Five indentations were performed per sample, in areas randomly chosen. The average value and the standard deviation were then calculated.
2.5. Creep Tests
Concerning the high temperature properties of the obtained alloys, the creep resistance was tested first, using a thermodilatometer (SETARAM, Caluire, France) especially configured to allow performing bending creep tests (two bottom supports and one top centered support). A parallelepiped was cut in each ingot. Its dimensions were about 2 mm (width) × 1.5 mm (thickness) × 15 mm (length) in each case. The sample was supported by two alumina rods perpendicularly oriented to the sample (distance between the two bottom supports: 12 mm). The load to apply on the middle of the top surface of the sample was defined to induce a tensile stress equal to 20 MPa, in the middle of the bottom face. The heating was performed to reach the temperature of test. Temperature (1100 °C) and the applied load (to obtain 20 MPa) were maintained for about 100 h, during which the movement of the top central point was recorded thanks to the displacement captor.
2.6. Oxidation Tests
The oxidation tests were carried out for 46 h at 1100 °C in a thermo-balance TGA92 (SETARAM, Caluire, France) in a 1.5 L/h flow of synthetic air. Heating up to 1200 °C was performed at +20 °C min−1 and the final cooling was done at −5 °C min−1. The used samples—one per alloy—were parallelepipeds with the following approximate dimensions: 3 mm × 3 mm × 10 mm. Prior to the tests, the six faces of these samples were ground using #1200 SiC papers. Edges and corners were smoothed with the same SiC papers. The mass gain files were plotted as mass gain versus time for the isothermal part of the oxidation test, to specify the kinetic of oxidation at 1100 °C. They were also plotted as mass variation versus temperature for the whole cycle to access to supplementary elements of characterization, notably concerning the cooling part.
2.7. Characterization of the Oxidized States
X-ray diffraction (XRD) was first performed on the oxidized samples before further metallographic characterization. The used diffractometer was a Philips X’Pert Pro. Thereafter, the oxidized samples were subjected to gold deposition all around using a cathodic pulverizator (JEOL, Tokyo, Japan), for obtaining the electrical conductivity to the oxidized surfaces required for the electrolytic deposition of nickel for developing a protective nickel shell prior to cutting. Electrolytic Ni was deposited in a Watt’s bath heated at 50 °C (1.6 A/dm2 for 2 h). The samples were then divided in two halves, using the Buehler metallographic saw, and embedded in a cold resin mixture (resin and hardener from ESCIL, Chassieu, France). The obtained metallographic samples were ground and polished as described above for the metallographic samples for the as-cast microstructure observations. The external and internal oxides were observed with the SEM in BSE mode. EDS X-maps and EDS spot analyses helped to identify the oxides natures and to specify the chemical composition of the subsurfaces of the alloys affected by oxidation.
3. Results and Discussion
3.1. Microstructures and Chemical Compositions of the Alloys
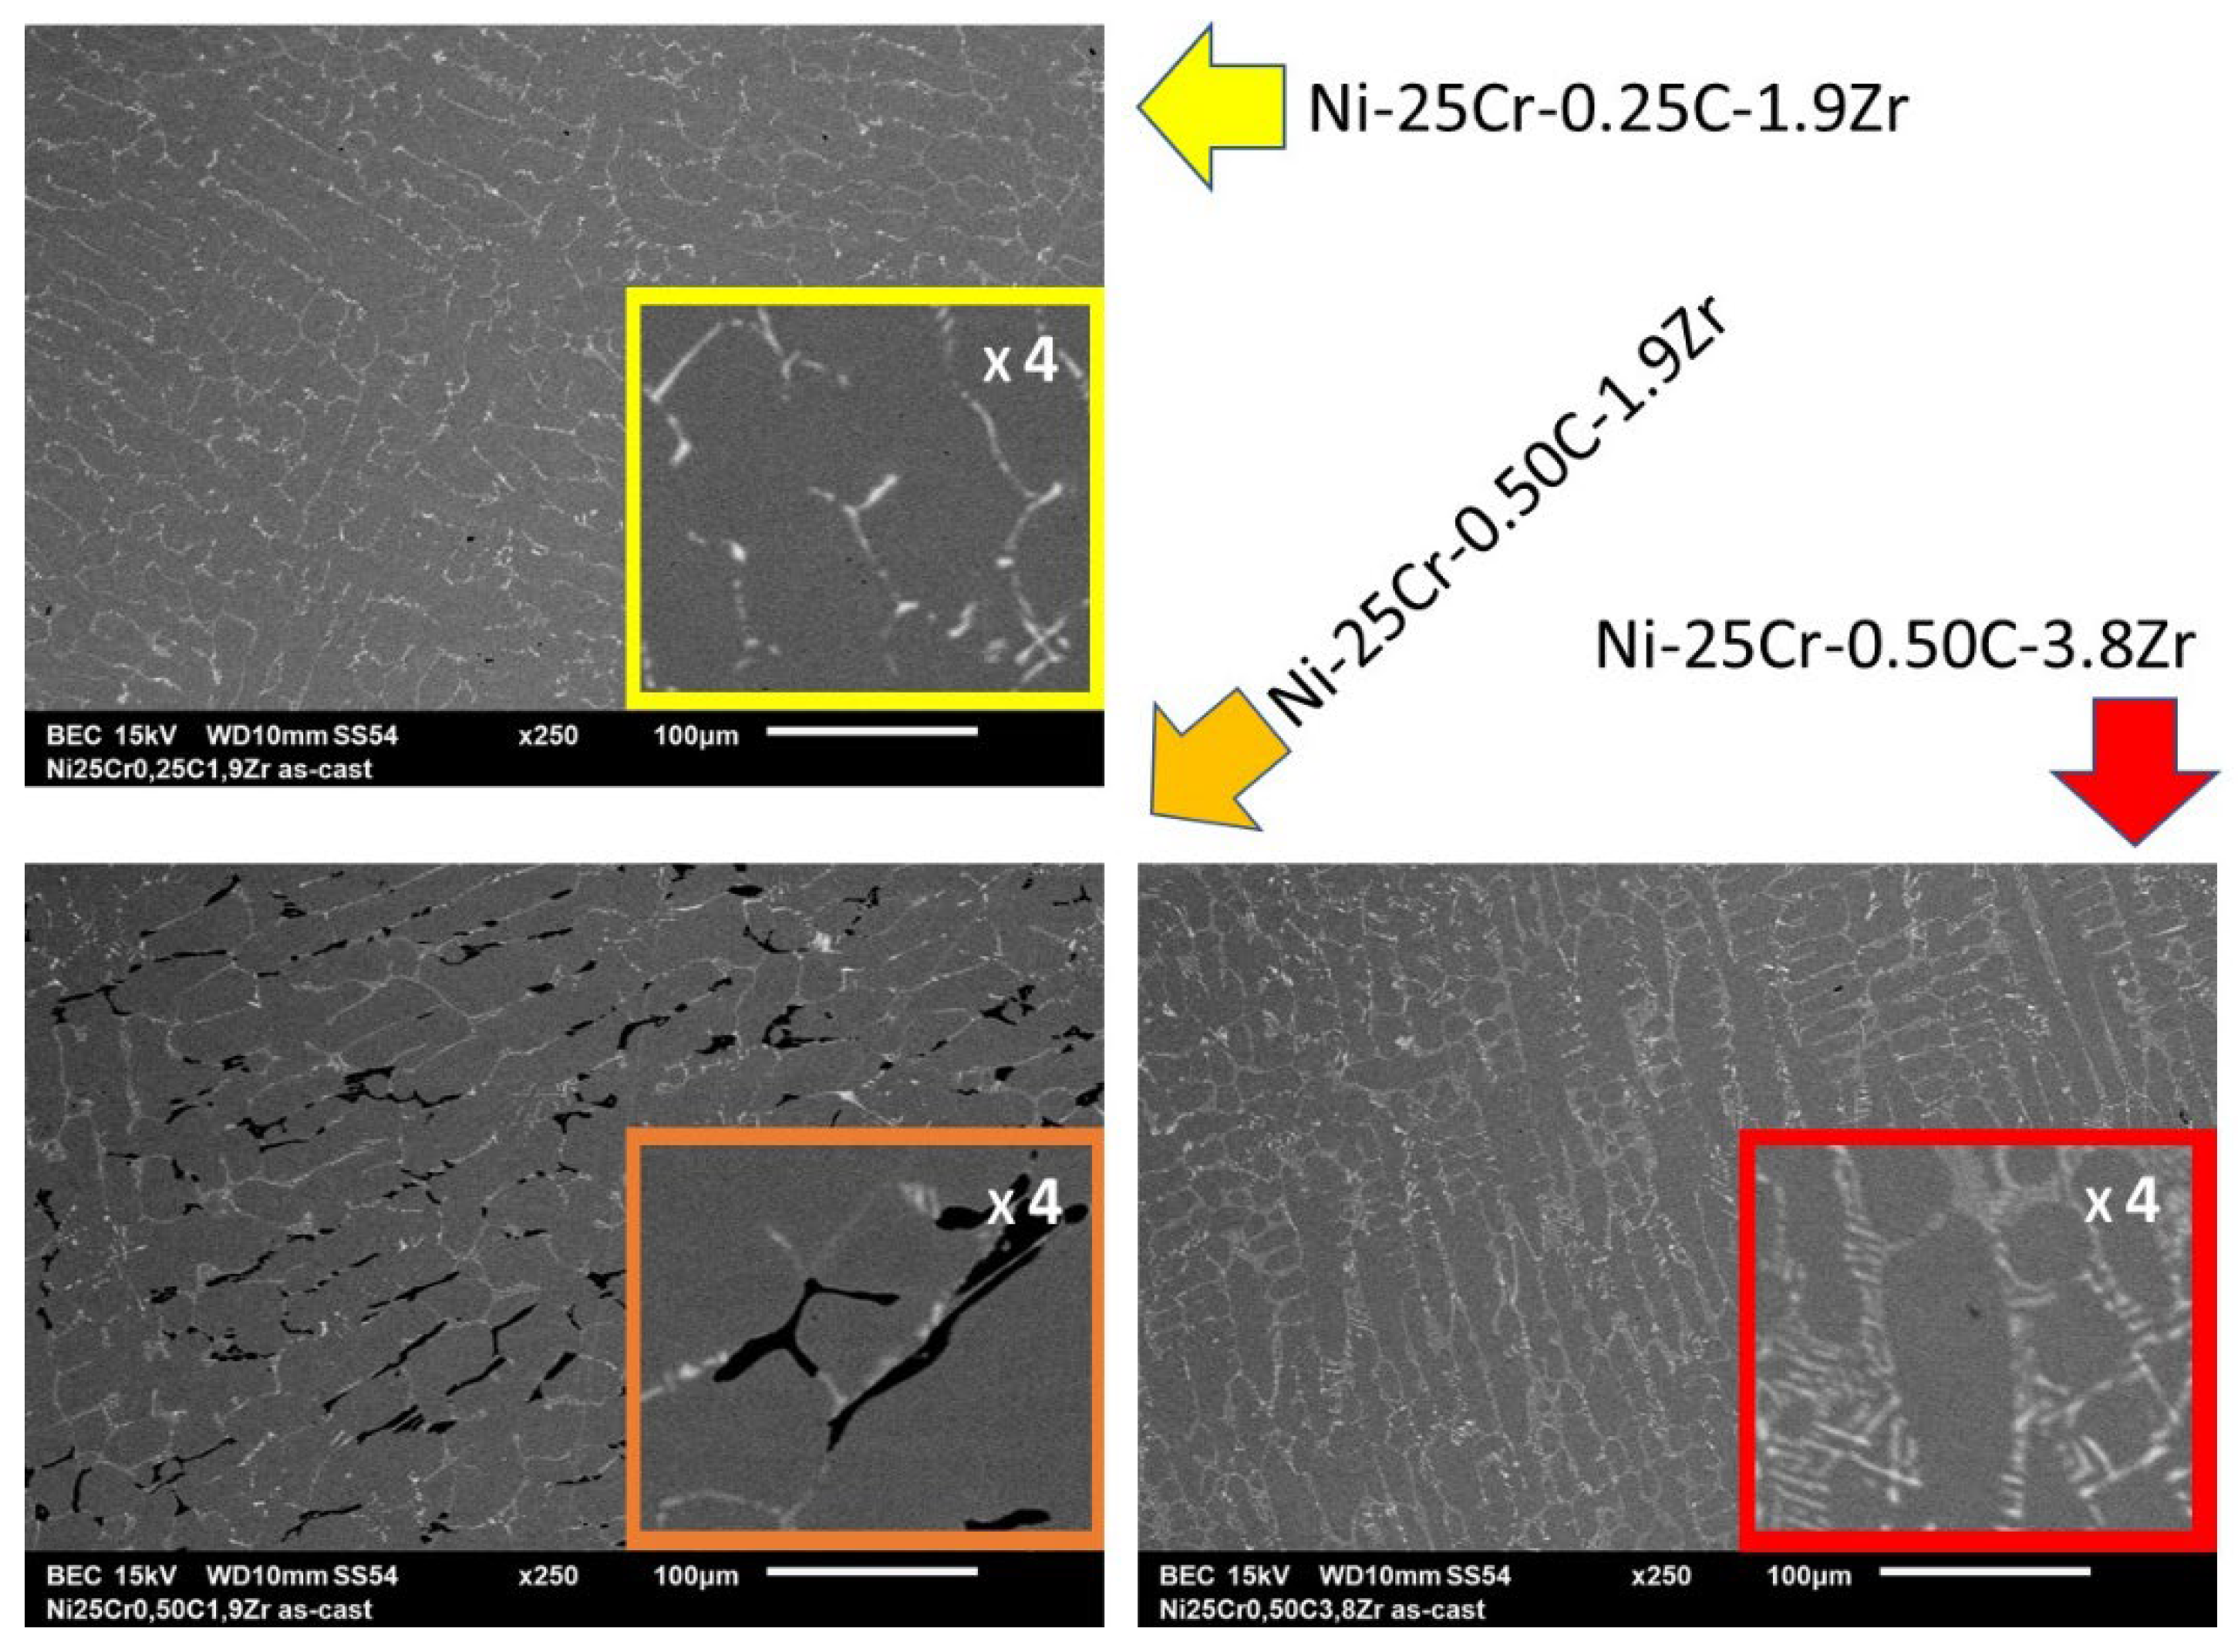
The microstructures of the Zr–containing alloys after their elaboration are illustrated in Figure 1, with SEM/BSE micrographs. The three alloys are composed of a dendritic matrix and of interdendritic particles that are whiter than the matrix. A series of spot EDS analyses carried out on these particles showed that they are rich in zirconium and in carbon. More information was obtained concerning the stoichiometry of these carbides thanks to spot analyses performed on the coarsest particles found in the metallographic samples—zirconium monocarbides. The densities of the ZrC populations in the Ni–25Cr–0.25C–1.9Zr alloy and in the Ni–25Cr–0.50C–1.9Zr are seemingly equivalent, while the ZrC quantity is significantly higher in the Ni–25Cr–0.50C–3.8Zr alloy. No other carbide is present in the first and third cited alloys while the second alloy (with 0.50 wt.% C and 1.9 wt.% Zr) contains additional black particles, which are Cr7C3 carbides, as revealed here as well by spot EDS analysis carried out on the coarsest black particles present. The ZrC are script–like shaped and the Cr7C3 are acicular. Both of them are obviously of a eutectic origin (they are closely associated with the matrix in the periphery of the dendrites). Concerning the Ni–25Cr–0.5C alloy, its microstructure is composed of a dendritic matrix and of interdendritic chromium carbides of the Cr7C3 stoichiometry, forming an acicular-shaped eutectic with the peripheric part of the dendrites.
The three Zr–containing alloys contain two principal carbide-former elements: Cr and Zr. Zirconium seemingly has a stronger carbide-forming power than chromium. Indeed, despite the much higher atomic content in Cr, all the carbon available to form carbides was involved in the ZrC formation in the two alloys, where Zr and C was present in the same molar quantities. It is only in the alloy containing carbon in excess (by comparison to Zr) that chromium carbides succeeded in precipitating. In a Ni(bal.)–25Cr environment, zirconium behaved as hafnium [25] and in a different way as titanium [24] and tantalum [23]. Indeed, in case of atomic equivalence between carbon and the MC–forming metal in chromium-rich Ni–based alloys, HfC exclusively form [25], while the carbides population is equilibrated between TaC and Cr7C3 [23] and is almost made only of chromium carbides when M is Ti [24].
To summarize what was observed above regarding the as-cast microstructures of the three alloys and how the chemical compositions (and notably the variations in C content and in Zr content) influenced them, one can say that:
- -
- The rather moderate presence of C and Zr allowed the nucleation and growth of the matrix first, with as result a dendritic morphology, which is generally favorable for strength and ductility (particularly at high temperature);
- -
- The presence of carbon in a moderate content allowed the crystallization of carbides, only of a eutectic nature, located in the interdendritic spaces; the carbon content drives the proportions of matrix volume fraction and of interdendritic eutectic volume fraction: when it increases there is less and less dendrites and more and more eutectic carbides;
- -
- The presence of zirconium, which is a carbide—a former element stronger than chromium, which allows obtaining ZrC carbides, very useful for strengthening the alloys at high temperature due to their high stability and their script—like morphology, is recognized as particularly efficient to resist stress at high temperature;
- -
- Rating the Zr quantity to obtain the same molar content in Zr as in C allows obtaining ZrC as single carbide phase present; conversely, choosing a Zr molar content lower than the C molar content leads to the additional presence of chromium carbides in the interdendritic spaces.
The measured chemical compositions of the three Zr–containing alloys are given in Table 1. The chromium contents are well respected while the Zr contents are slightly higher than targeted. This overestimation is classical in MC–containing alloys: this is due to further exposure of the MC carbide network emerging on the surface after final polishing. However, the overestimations here are lower than generally encountered with TaC– or HfC–containing alloys with the same carbide fractions. The Zr contents can be considered as well respected too. Carbon cannot be analyzed by full frame EDS analysis because of its low atomic mass and its low contents in these alloys. Nevertheless, since the fractions in carbides are typical either of 0.25 wt.% C or 0.50 wt.% C, one can consider that the carbon content is also at least reasonably respected.
The chemical compositions of the matrixes of the three Zr–containing alloys were also analyzed by EDS (three spot analyses in the dendrites centers). The results are displayed in Table 2. The chromium content is slightly higher than in the whole alloys for the Ni–25Cr–0.25C–1.9Zr and Ni–25Cr–0.50C–3.8Zr alloys, which is logical since all chromium is stored in a slightly lower volume. In the case of the Ni–25Cr–0.50C–1.9Zr alloy, which contains a significant fraction of Cr7C3 carbides, the Cr content in the matrix is slightly lower than for the two other alloys. Concerning zirconium, it is interesting to notice that almost no Zr is present in the matrix: all Zr, or at least a very major part, is involved in the ZrC carbides.
3.2. Mechanical Properties
Considering the differences in carbides populations (nature and volume fraction), possible differences in hardness may be expected. Five Vickers macro indentations were carried out in randomly chosen locations. The obtained average and standard deviation values are presented in Table 3. It appears that the addition of Cr7C3 carbides allowed by increasing the C content at constant Zr (Ni–25Cr–0.25C–1.9Zr → Ni–25Cr–0.50C–1.9Zr) allowed a slight increase in hardness, and that replacing the Cr7C3 carbides by ZrC carbides by increasing the Zr content at constant C (Ni–25Cr–0.50C–1.9Zr → Ni–25Cr–0.50C–3.8Zr) induces a stronger increase in hardness. All these hardness values are higher than the Ni–25Cr–0.50C one (about 170 HV) and suggest better mechanical properties at high temperature than the values of the ternary alloy.
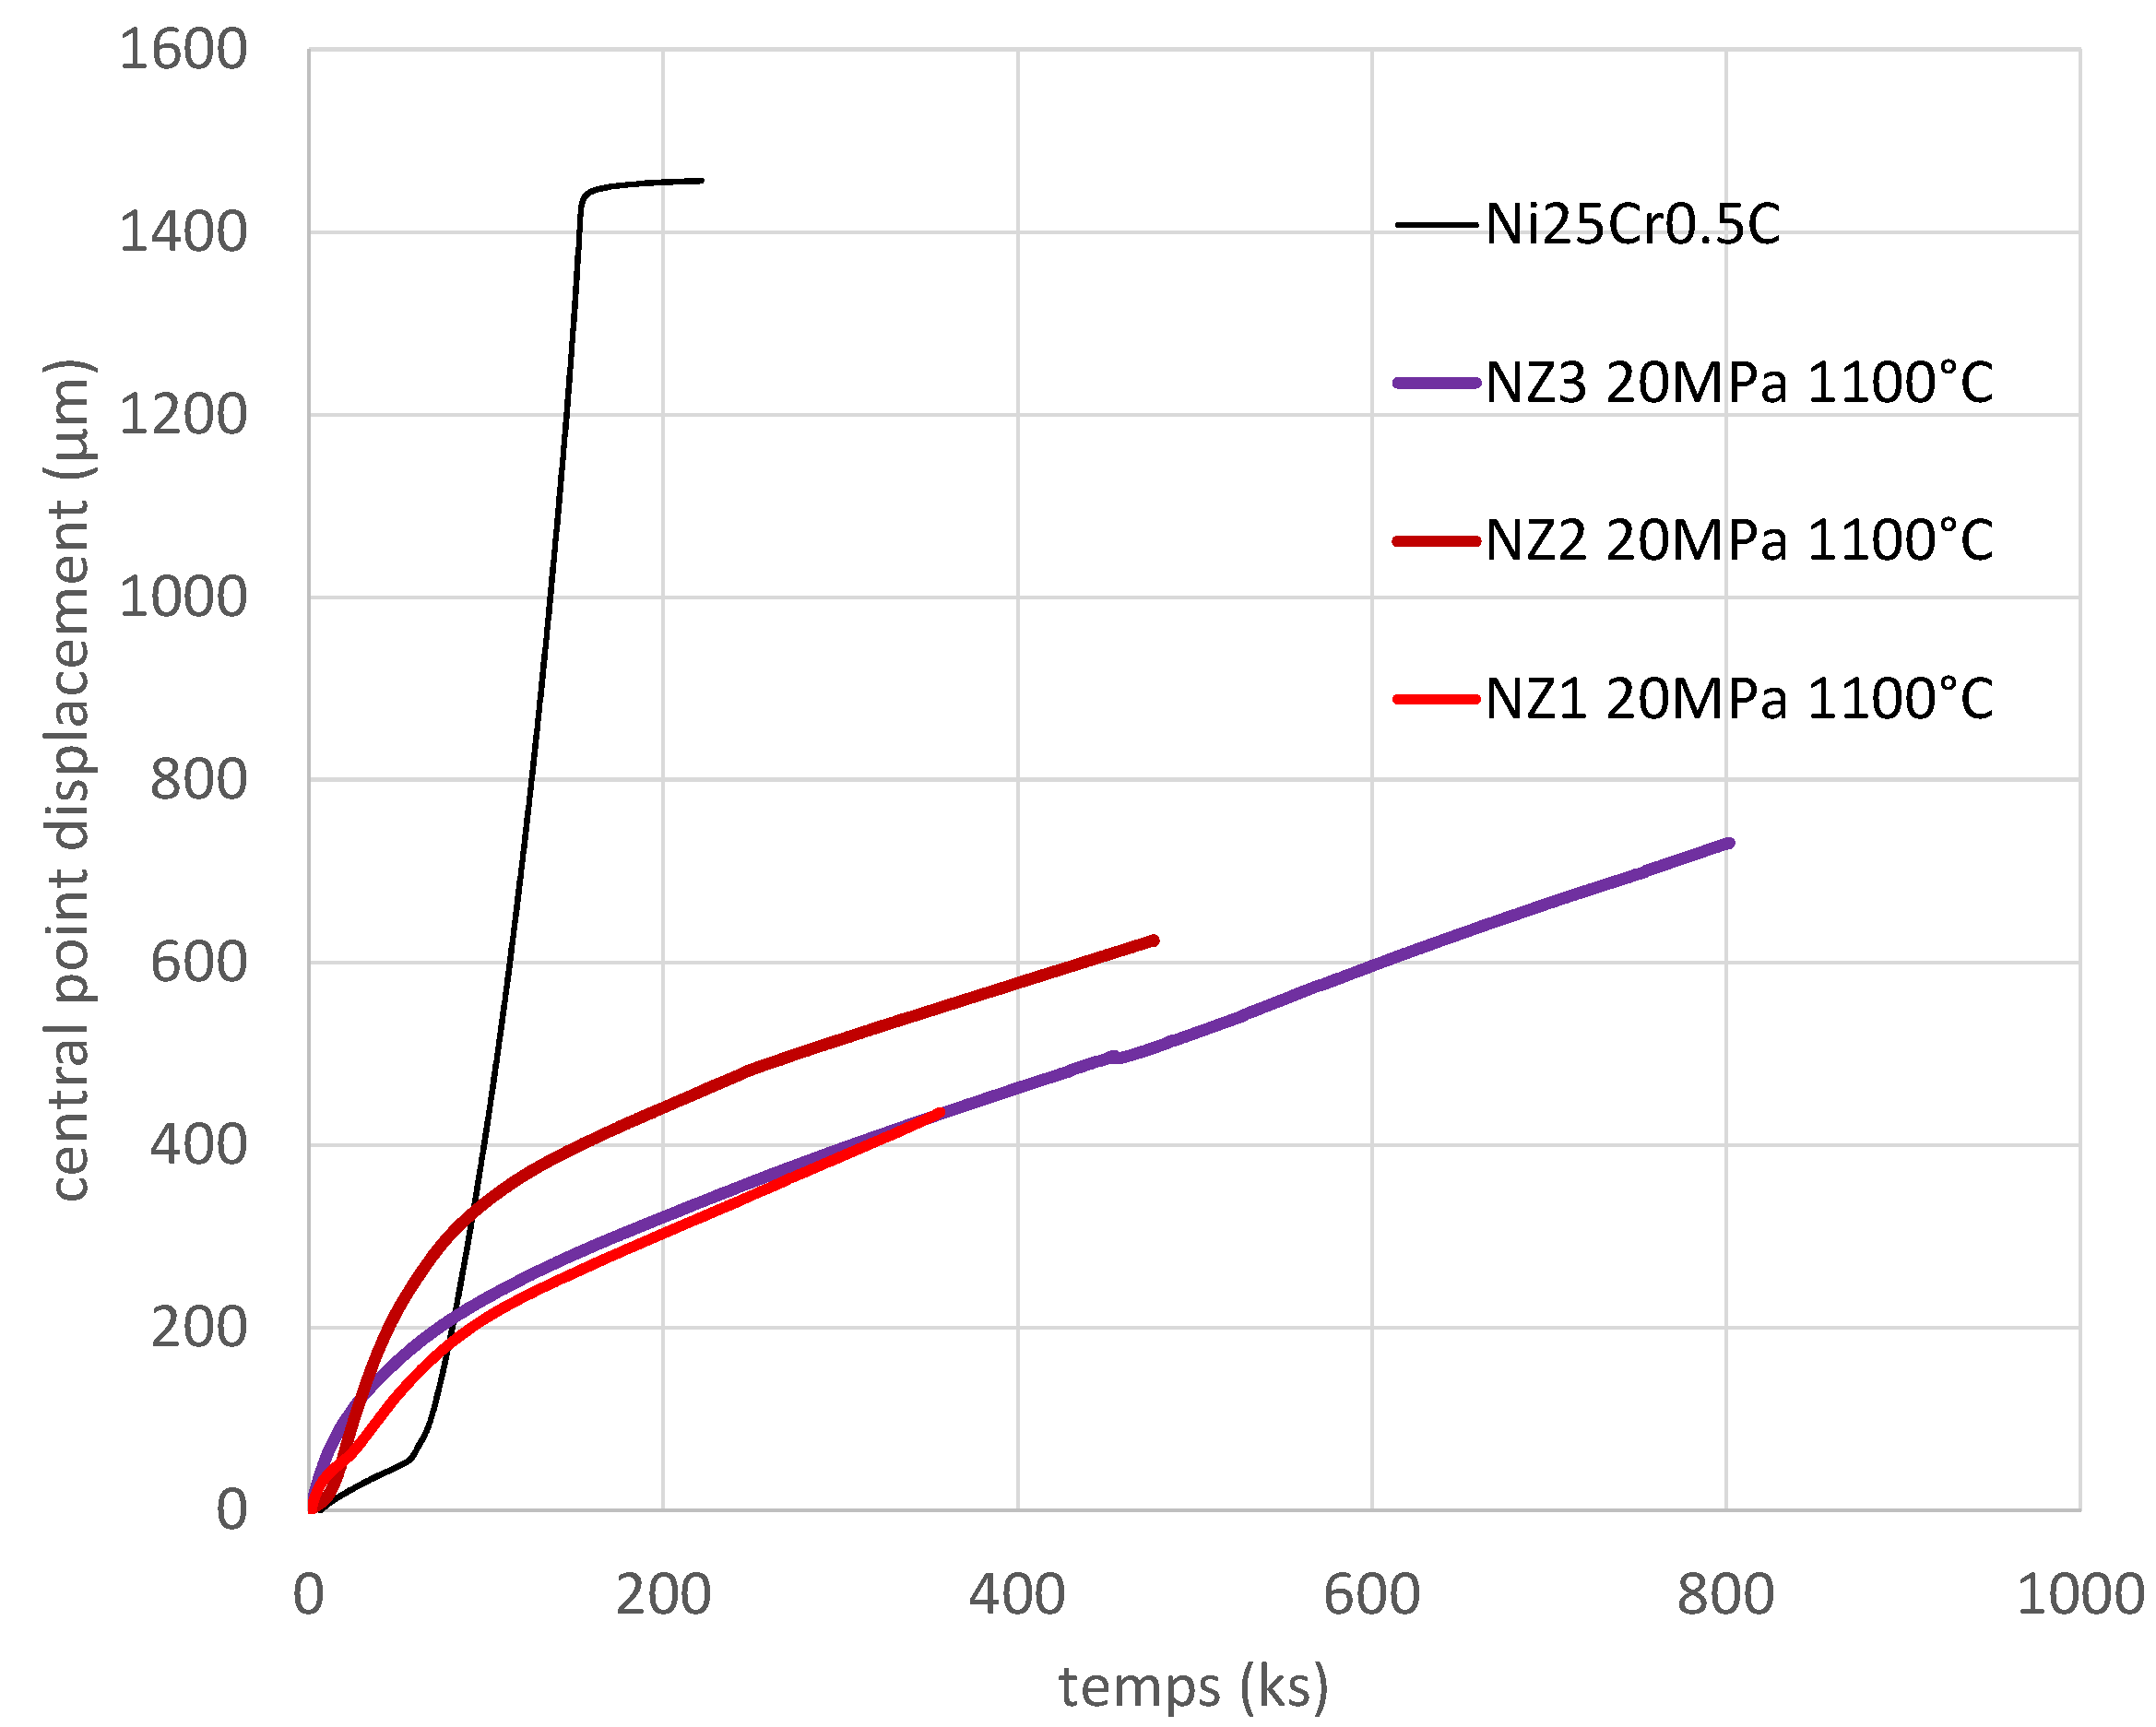
The three-points flexural creep tests confirmed these expectations: the creep deformation curves obtained for the three Zr–containing alloys are much slower than the one of the ternary alloy (Figure 2, Table 4). The primary and a secondary (steady state) creep deformation of this last alloy obviously occurred during the heating and the secondary → tertiary creep transition was done at the beginning of the isothermal stage. The Zr–containing alloys all finished their primary creep deformation after the beginning of the isothermal stage and the steady state creep was still taking place when the tests were stopped (after 100 h or later). It is thus obvious that the script-like ZrC carbides played a key role in the creep resistance of these alloys.
To synthesize and comment what was observed above regarding the mechanical properties of the three alloys and how the chemical compositions (and notably the variations in C content and in Zr content) influenced them, one can say that:
- -
- The addition of carbon, in an environment rich in chromium and containing a strong carbide-forming metal, zirconium, induced by the development of a dense (with 0.25 wt.% C) or very dense (with 0.5 wt.% C) carbide population; whatever the nature—chromium carbide or zirconium carbide—the presence of these particles is much harder than matrix, which hardened the whole alloy; furthermore, due to its particularly strong carbide-former character, zirconium was almost wholly involved in carbides; by comparison with the reference alloy—which contains only chromium carbides—the obtained interdendritic network of ZrC is present with a significantly higher volume fraction and consequently a higher hardness at the whole alloy scale;
- -
- As eutectic carbides, the chromium carbides (the reference Ni–25Cr–0.5C alloy and Ni–25Cr–0.50C–1.9Zr alloys) and the zirconium carbides (all the three Zr–containing alloys), are all located in the grain boundaries and the interdentritic spaces, where they are combined with the peripherical parts of the dendrites of matrix. In this strategic position they may take part in the resistance against the inter-grain and inter-dendritic decohesion in alloy during the creep deformation due to high temperature stress; in contrast with the reference alloy, the chromium carbides, which rapidly get fragmented, the zirconium carbides—more morphologically stable at high temperature—allowed long lasting cohesion, and the transition from the secondary stage of creep to the tertiary stage was significantly delayed (and not yet observed after 100 h or more (Ni–25Cr–0.50C–3.8Zr alloy).
3.3. Oxidation Kinetics
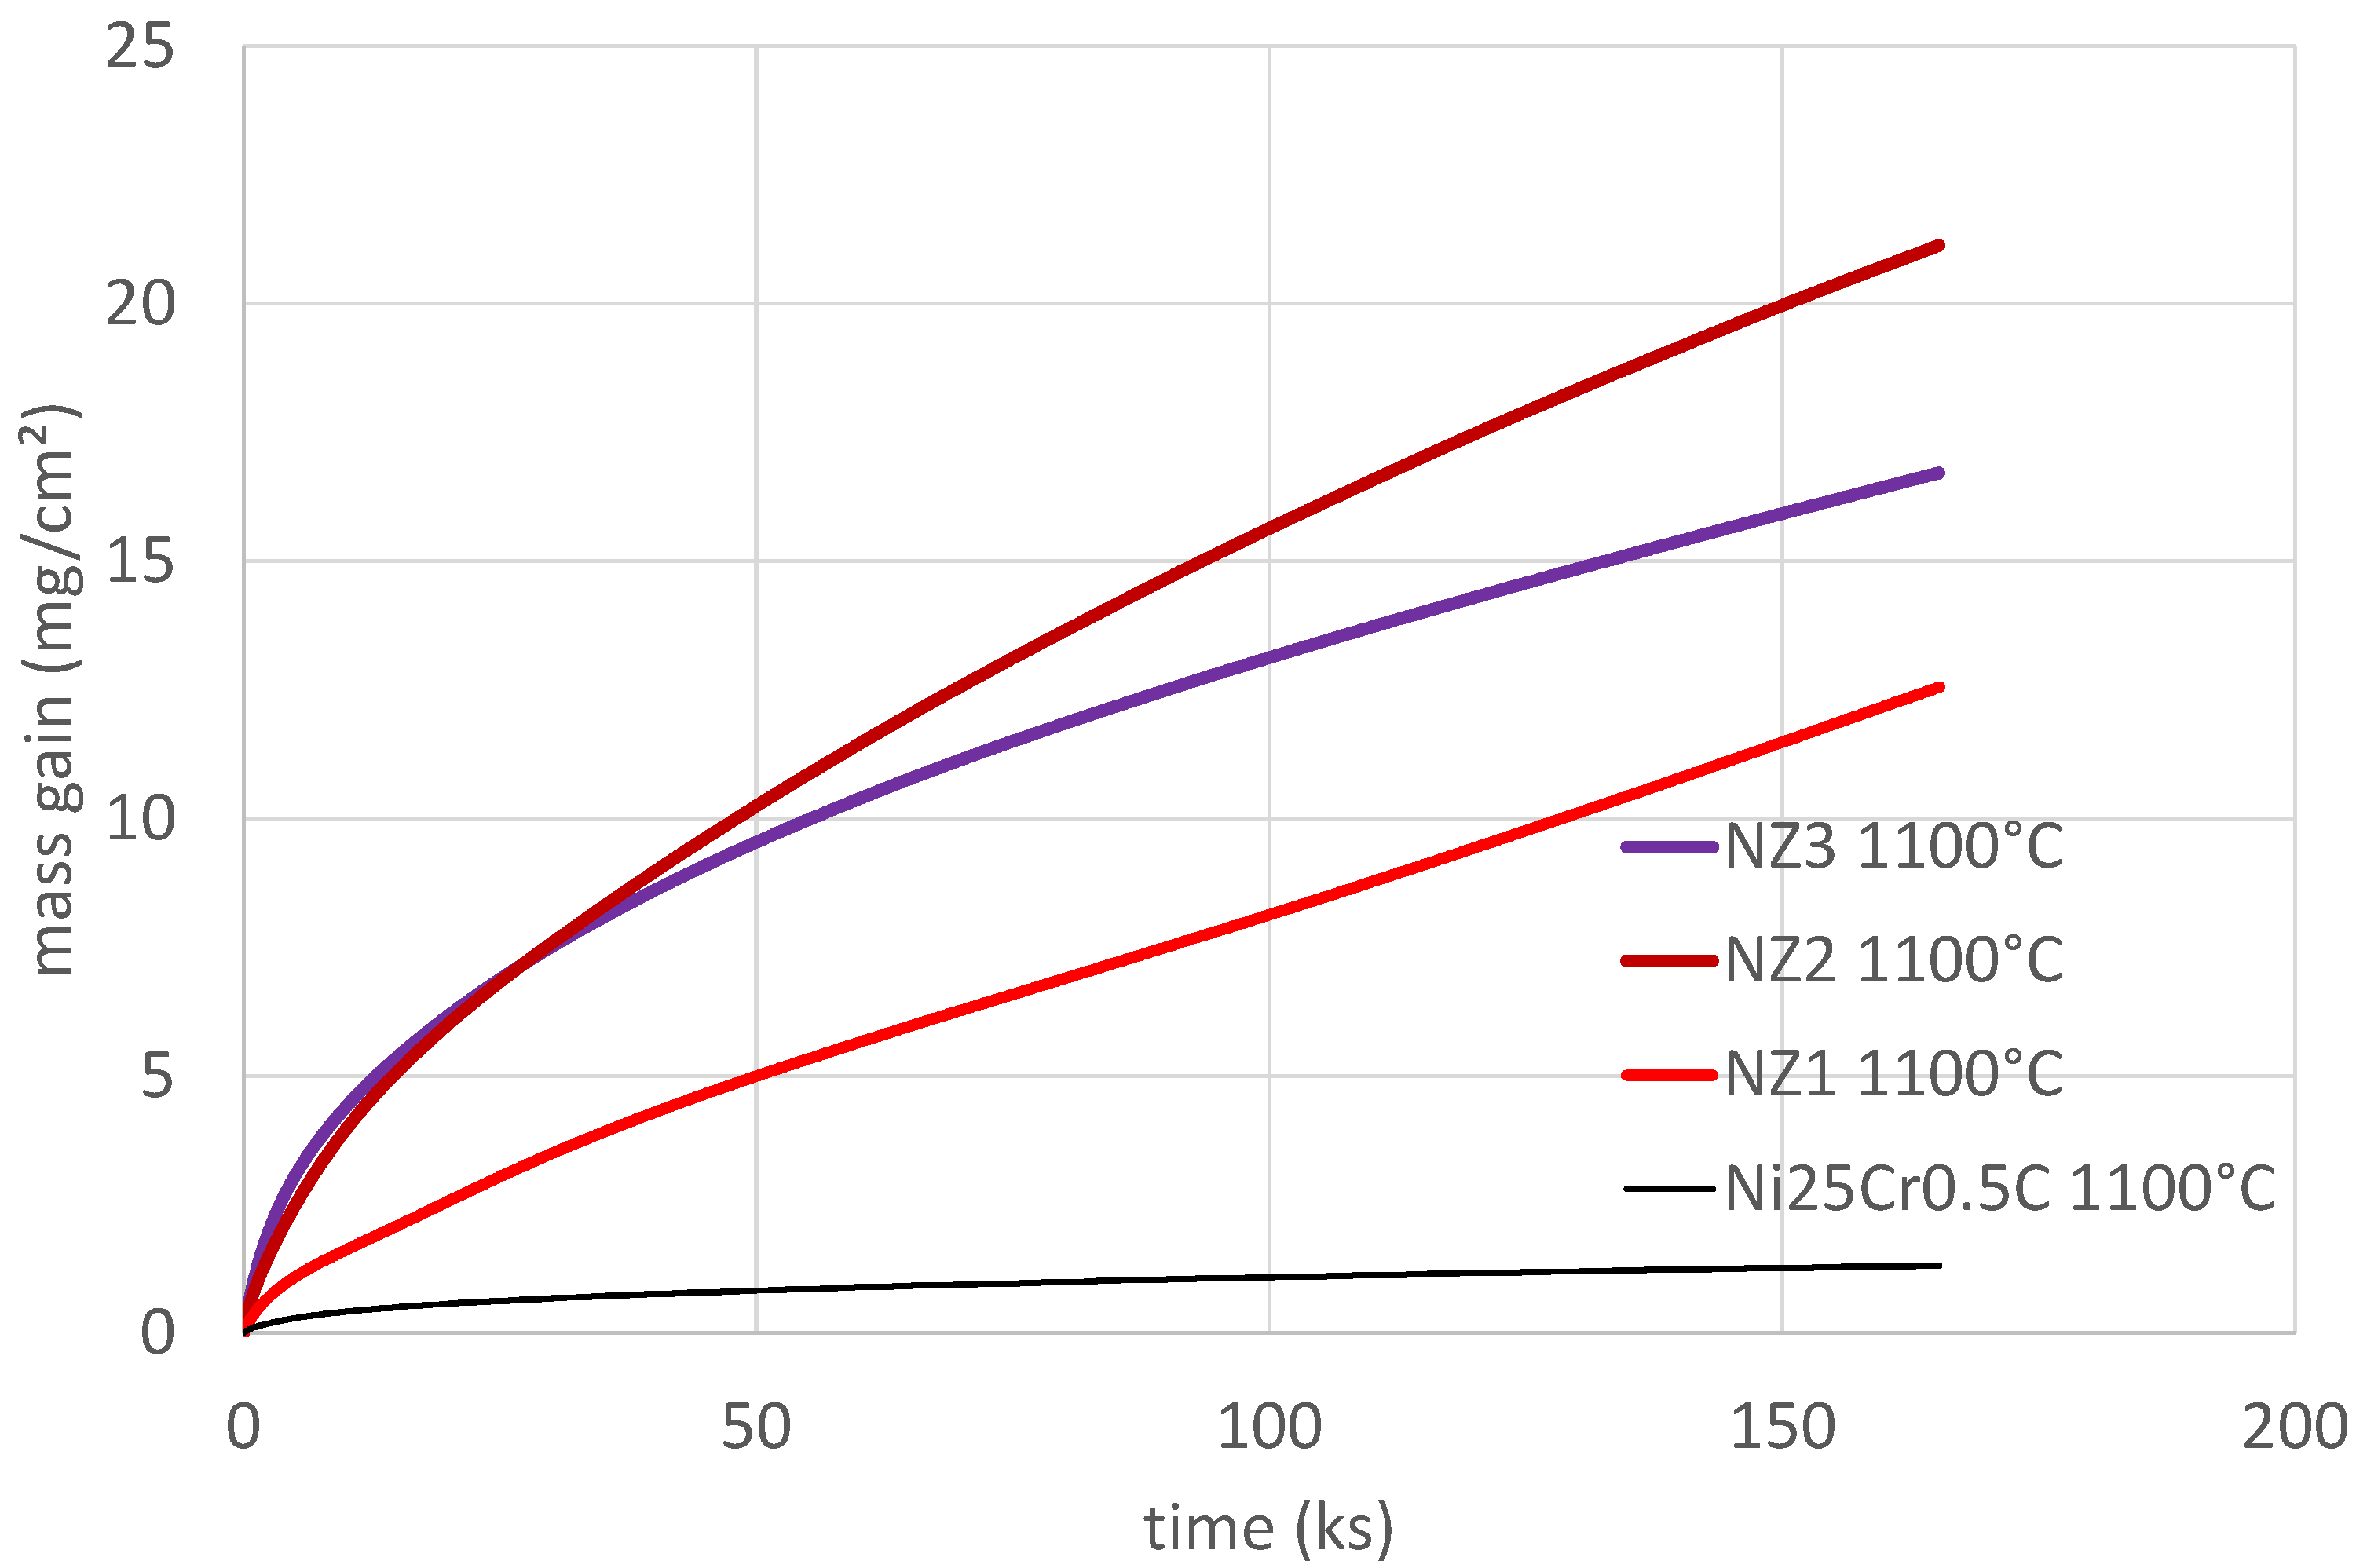
The mass gain curves plotted with the measurements of the thermobalance are displayed in Figure 3, in comparison with the one of the Ni–25Cr–0.5C reference alloy. Obviously, the oxidation kinetics of the three Zr–containing alloys are largely superior to the ternary alloy’s one. Furthermore, at least two of them (Ni–25Cr–0.25C–1.9Zr indicated by “NZ1” and Ni–25Cr–0.50C–1.9Zr, “NZ2”) are not clearly parabolic and present a partially linear characteristic. The mass gain of the third Zr–containing alloy, Ni–25Cr–0.50C–3.8Zr, “NZ3”, seems to be presenting a more parabolic kinetic.
Plotting, versus the square root of time (t1/2), the mass gain per surface unit area m(t), leads to a curve that is more or less straight line. This is rather a straight line for the Ni–25Cr–0.50C–3.8Zr alloy, with however a slight downward curvature. For the Ni–25Cr–0.50C–1.9Zr alloy, this is a rather straight line that is obtained, with however a slight upward curvature. Concerning the Ni–25Cr–0.25C–1.9Zr alloy, there is, in contrast, a sharp upward curvature. An average regression line was notwithstanding defined for each of the three curves, and their slopes led to the approximate values of parabolic constant Kp given in Table 5. The results are all close to 1000 × 10−6 mg2 cm−4 s−1, much higher than the 6 × 10⁻⁶ mg2 cm−4 s−1 obtained by the ternary reference alloy.
For a better description of the mass gain rates by kinetic constants, the mass gain m(t) multiplied by its derived value (dm/dt) was plotted versus–m(t), followed by smoothening of the rather scattered values of m × dm/dt by the calculation of a moving average on 10 successive values of m × dm/dt. After the not clear evolution of m × dm/dt versus–m due to transient oxidation, a straight line was obtained for each of the three alloys. In two cases, the slope of this straight line was negative (indicating thus a part of linear mass gain) and in the last case (Ni–25Cr–0.50C–3.8Zr alloy) the slope of the obtained straight line was positive, indicating a part of linear mass loss. The real Kp values (real because they are decorrelated from the linear part of mass gain, noted as “KpcorrL”) and the linear kinetic constant values (noted “KL”), are displayed in Table 6.
This second type of data treatment allows demonstrating the double-character of the mass gain of the Ni–25Cr–0.25C–1.9Zr and Ni–25Cr–0.50C–1.9Zr alloys: a parabolic part with a low KpcorrL value and a high KL value (in term of absolute value) for the first alloy, and a high KpcorrL value and a medium KL value for the second alloy. Obviously, the linear oxidation was particularly important for the Ni–25Cr–0.25C–1.9Zr alloy, hiding the parabolic contribution to mass gain. In contrast, the parabolic oxidation was preponderant compared to the linear mass gain for the Ni–25Cr–0.50C–1.9Zr alloy. The case of the Ni–25Cr–0.50C–3.8Zr alloy is different since the linear constant is positive and suggests that, in parallel with the parabolic mass gain, there is a linear mass loss. In the case of the reference ternary alloy the linear constant is also positive and is of the same order of magnitude of the chromia volatilization constant KV earlier measured for a Ni–30Cr alloy [26]. Equally, The linear constant, close to 150 mg cm−2 s−1 obtained for the Ni–25Cr–0.50C–3.8Zr alloy, despite being three times higher than the reference ternary alloy, is itself of the same order of magnitude of the Ni–30Cr alloy [26]. This suggests that the Ni–25Cr–0.50C reference alloy logically behaved almost as the chromia-forming Ni–30Cr alloy to which it is rather close chemically (KpcorrL = 11 × 10−6 mg2 cm−4 s−1 and KL = 46 mg cm−2 s−1, against, respectively, KpcorrL = 23 × 10−6 mg2 cm−4 s−1 and KL = 87 mg cm−2 s−1 for the Ni–30Cr alloy [26]). With almost KpcorrL = 1100 × 10−6 mg2 cm−4 s−1 and KL = 150 mg cm−2 s−1, the Ni–25Cr–0.50C–3.8Zr alloy oxidized much faster (KpcorrL 50 times higher) while the linear mass loss rate (KL) is higher than the pure chromia volatilization one, but moderately (twice the Ni–30Cr one [26] and three times the Ni–25Cr–0.50C one).
3.4. Behavior of the Oxide Scales at Cooling
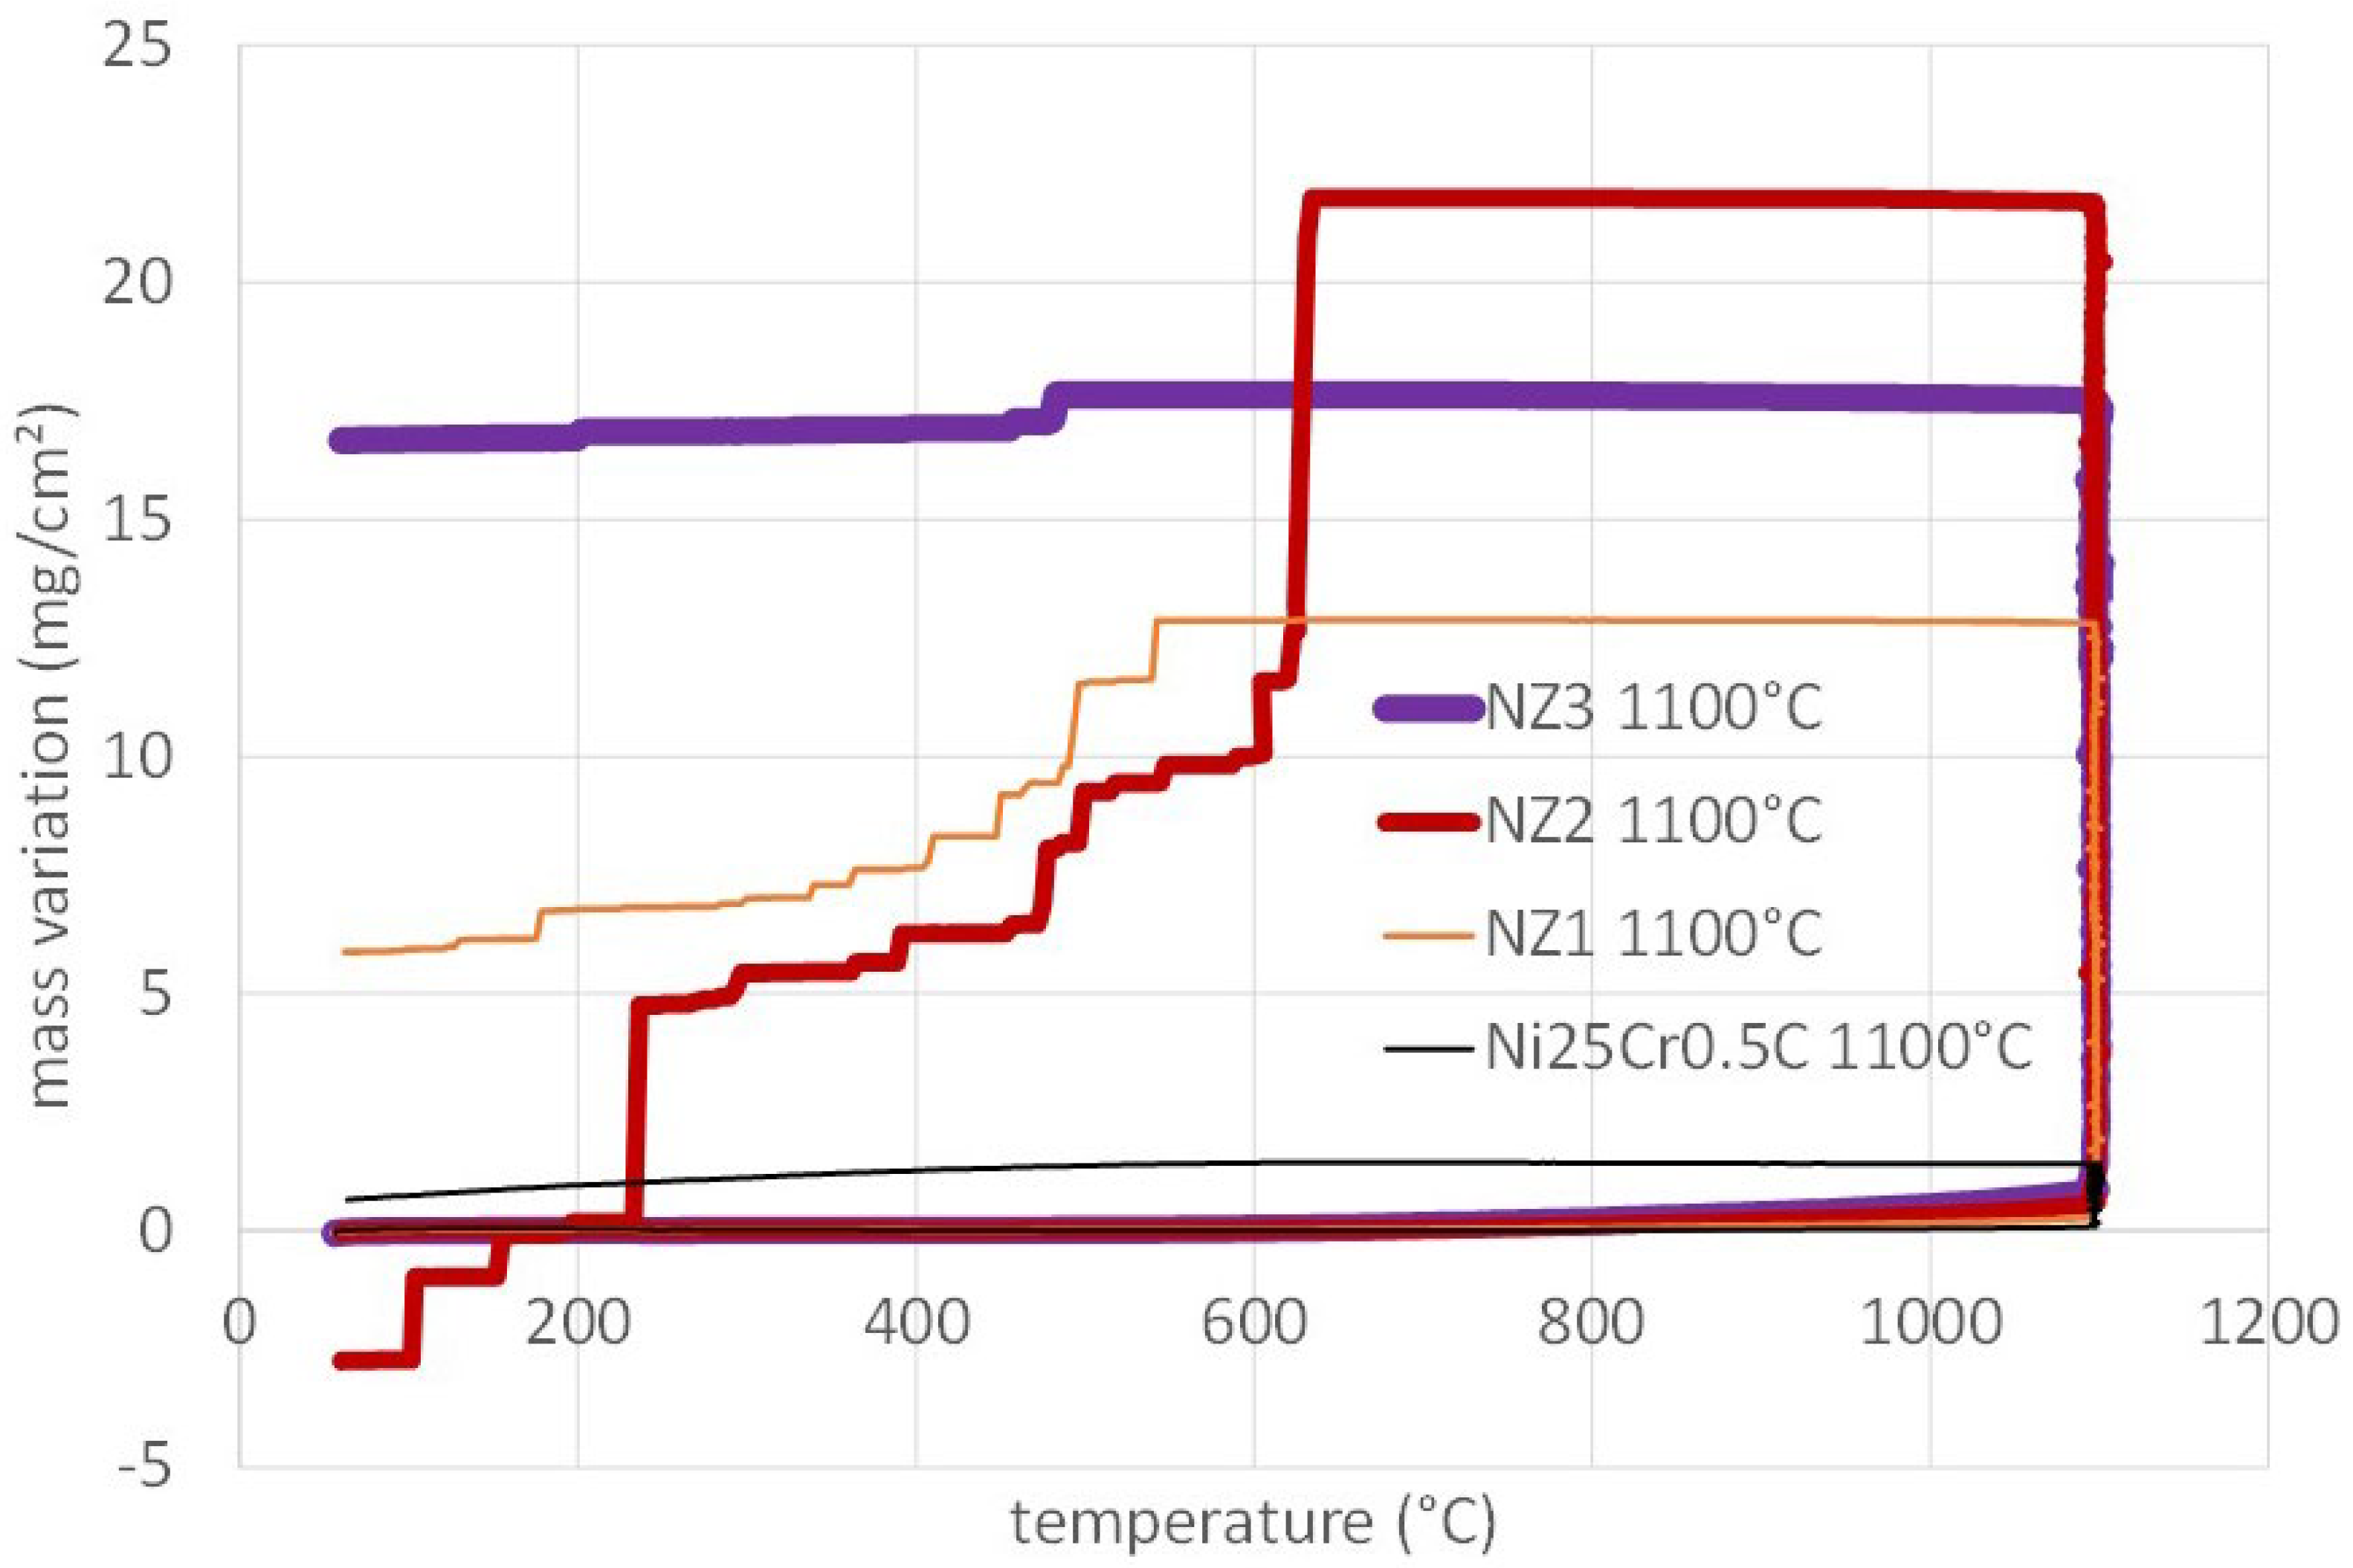
The mass gain variations all along the thermal cycle are plotted versus the temperature in Figure 4, and some parameter values resulting from their exploitation are given in Table 7.
It was seen above that the isothermal oxidation of the Zr–containing alloys led to much higher isothermal mass gains than for the ternary reference alloy. A new great difference concerns the resistance of the formed oxide scales against spallation during the cooling. Since the average thermal expansion coefficient of oxides is several times lower than the one of metallic alloys, cooling commonly involves the appearance and intensification of compressive stresses in the external oxide scales and of shear stresses at the scale/alloy interface. It is this frequent that a rupture occurs in the oxide scales as well as scale detachment from the metallic substrate, with as consequence the loss of parts of the oxide scale. Here, the Ni–25Cr–0.25C–1.9Zr and Ni–25Cr–0.50C–1.9Zr alloys were effectively affected by such a phenomenon. This is evidenced on the mass versus temperature-curves in Figure 4, by the existence of irregular decreases in mass during the cooling, started before reaching 500 °C. The amplitude of the resulting mass losses is here variable: higher for the Ni–25Cr–0.50C–1.9Zr alloy (with notably a negative final mass variation over the whole cycle) than for the Ni–25Cr–0.25C–1.9Zr alloy, and much more tenuous mass loss for the Ni–25Cr–0.50C–3.8Zr alloy. At the same time, the reference ternary alloy did not encounter any oxide spallation. For the resistance against scale spallation-criterion, the Ni–25Cr–0.50C–3.8Zr alloy is thus the one among the Zr–containing alloys that behaved the best.
3.5. Study of the Oxidation Products Prior to Cross-Sectional Preparation
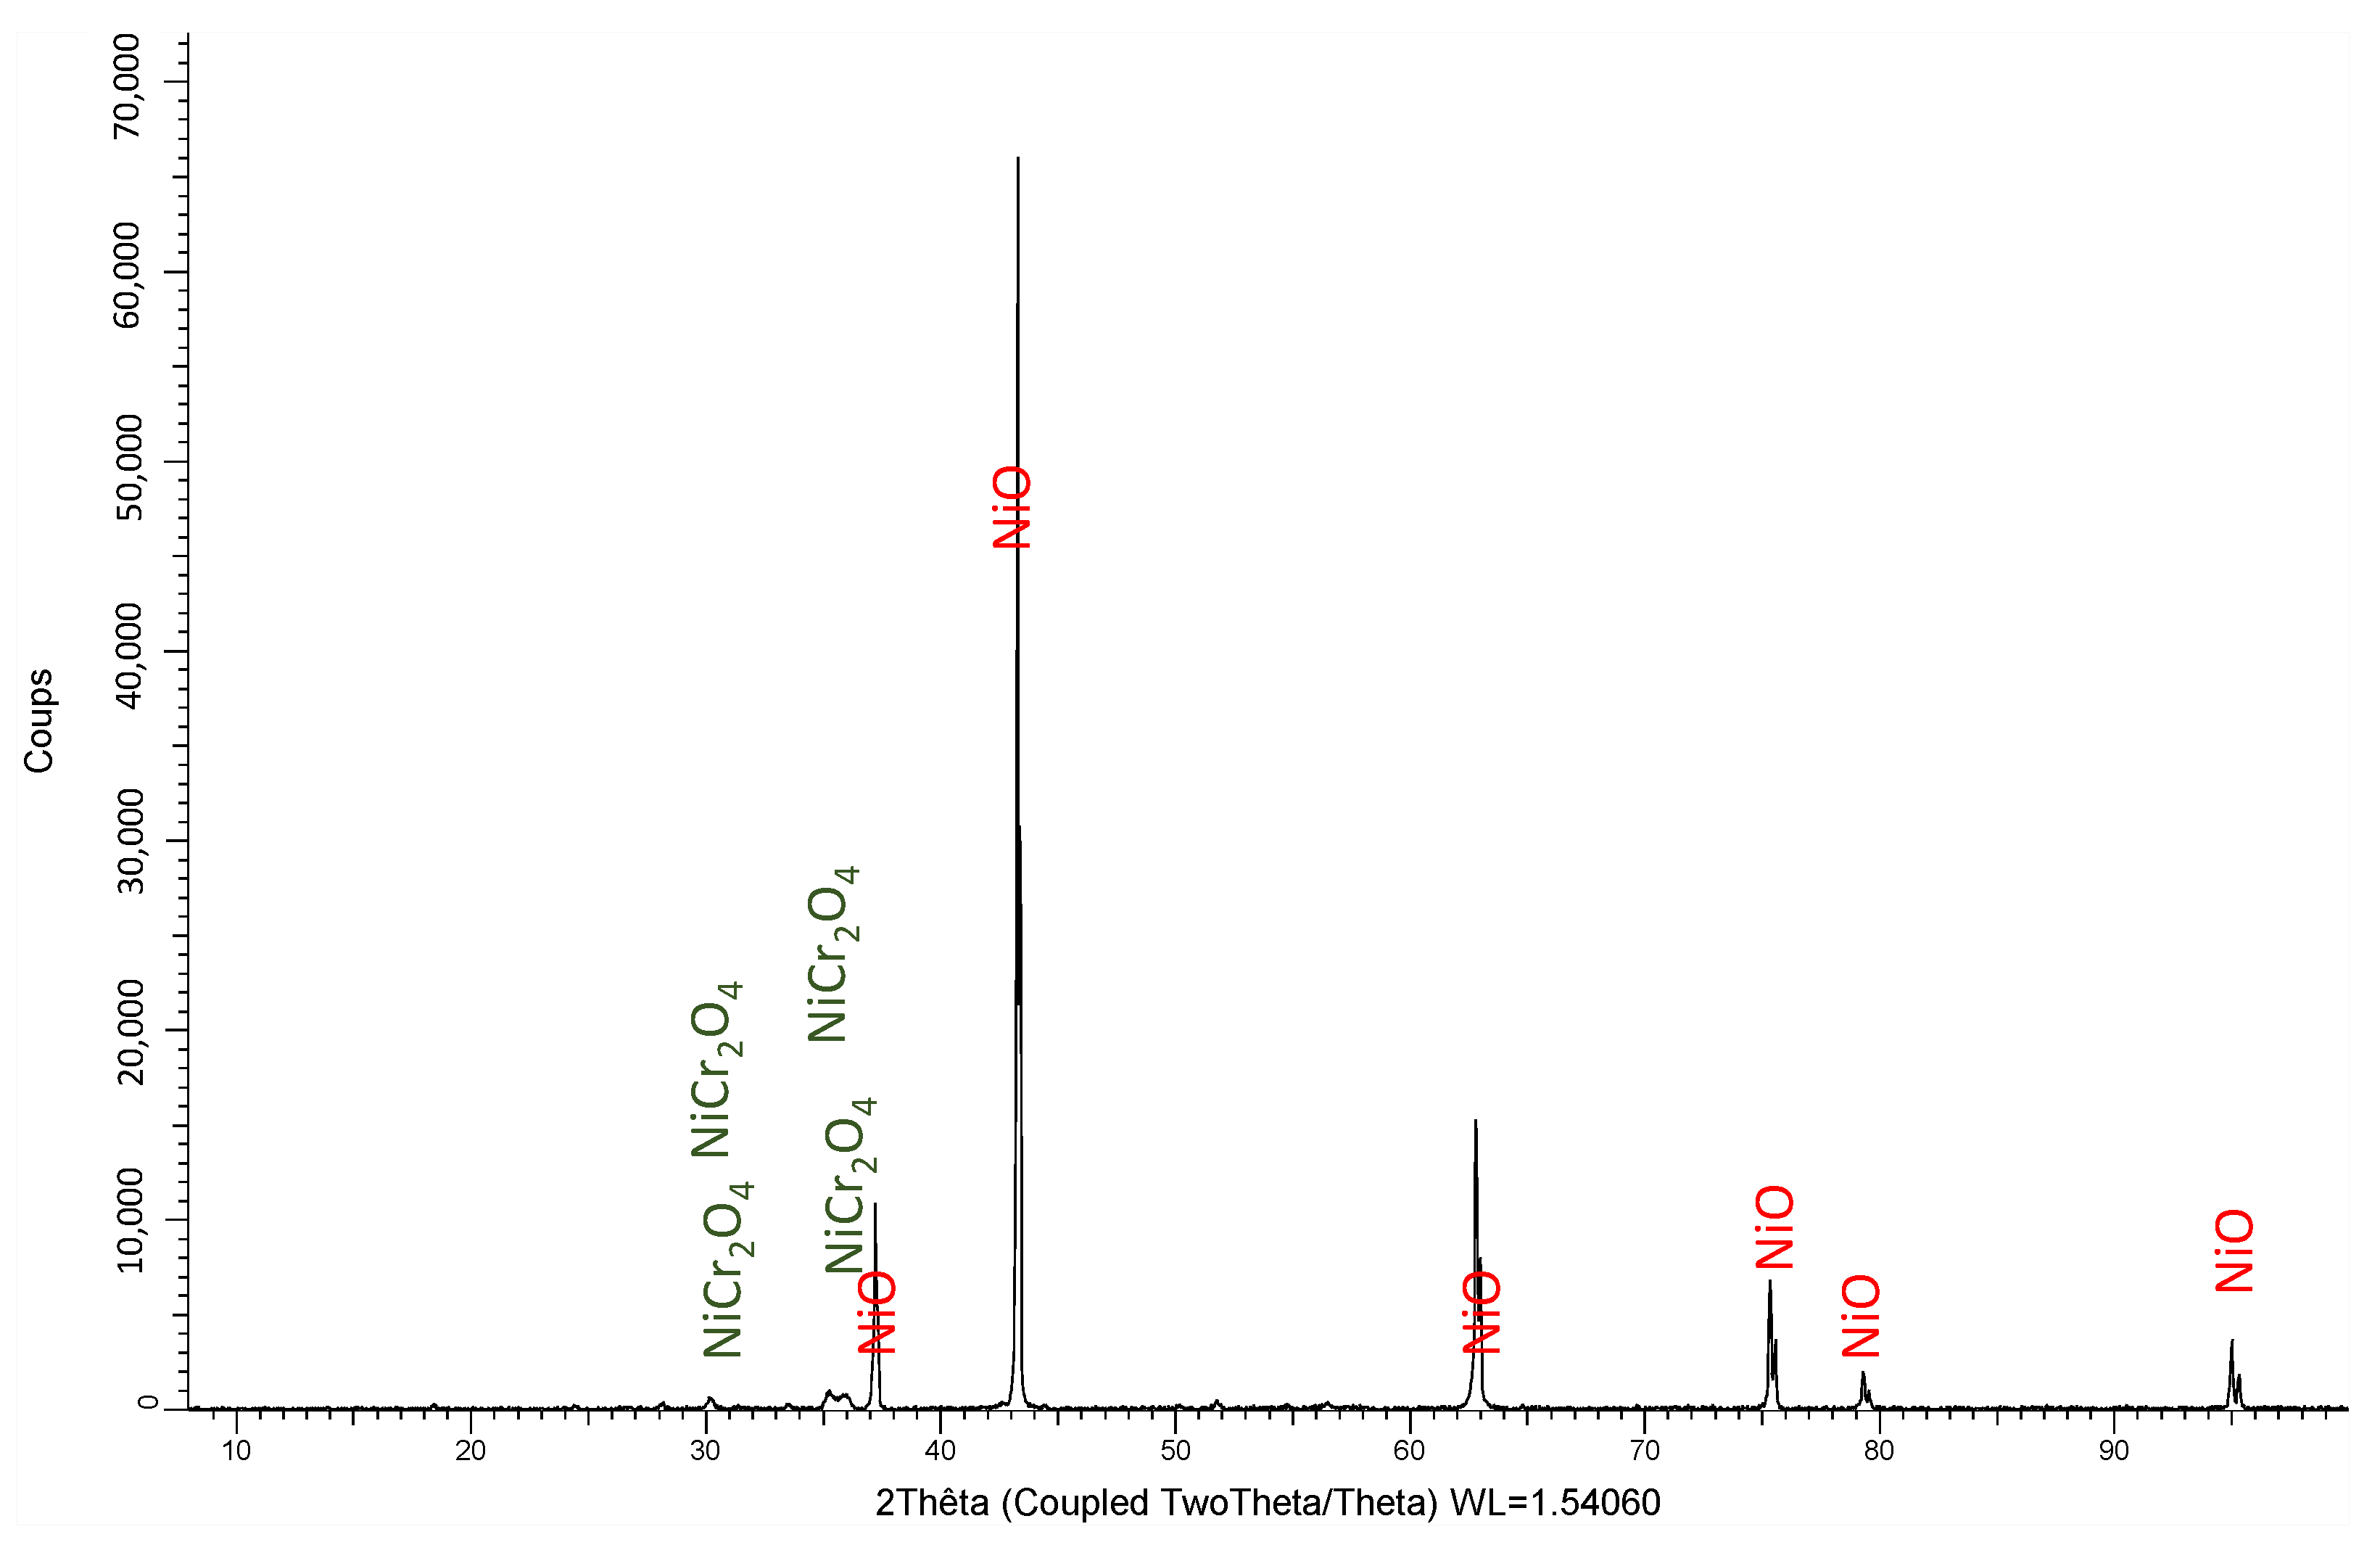
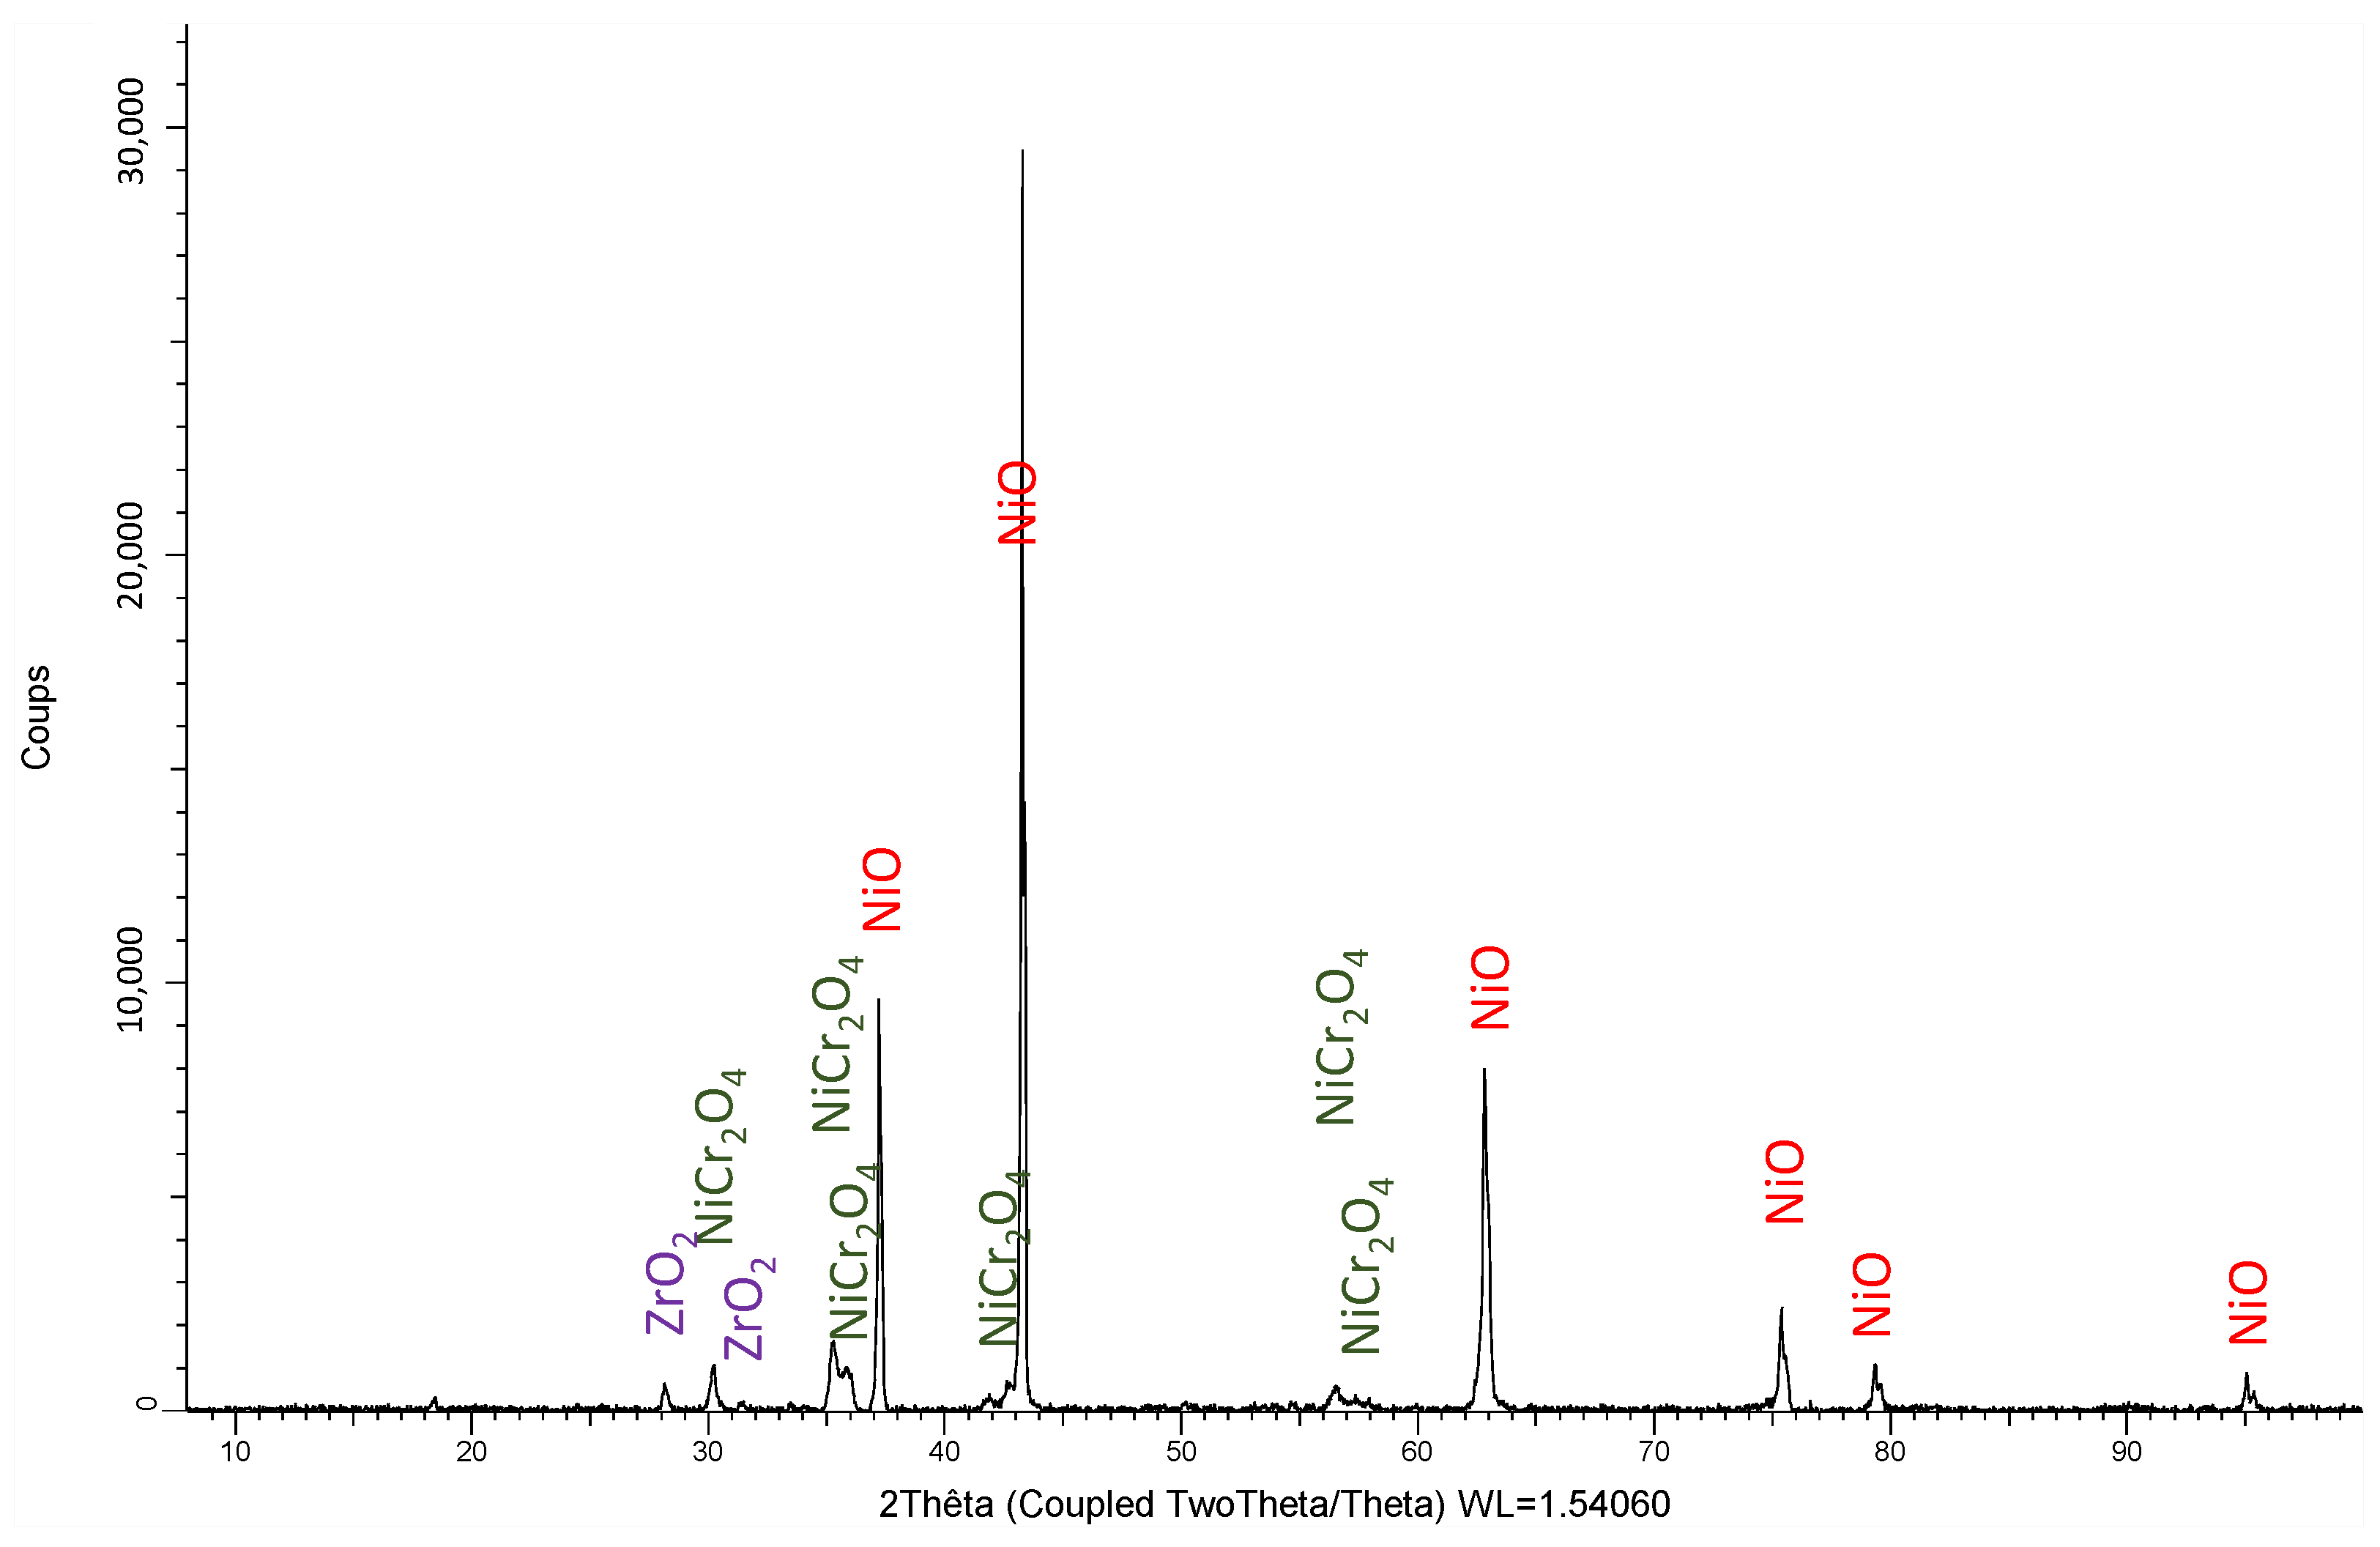
The oxidized samples were first subjected to analysis using X-ray diffraction. The obtained diffractograms are shown in Figure 5 for the Ni–25Cr–0.25C–1.9Zr alloy, in Figure 6 for the Ni–25Cr–0.50C–1.9Zr alloy, and in Figure 7 for the Ni–25Cr–0.50C–3.8Zr alloy. All of them evidence the presence of nickel oxide NiO, with, in addition, the spinel NiCr2O4 for the two last alloys, and also zirconia (ZrO2) in the case of the Zr–richest alloy.
3.6. Study of the Oxidation Products after Cross-Sectional Preparation
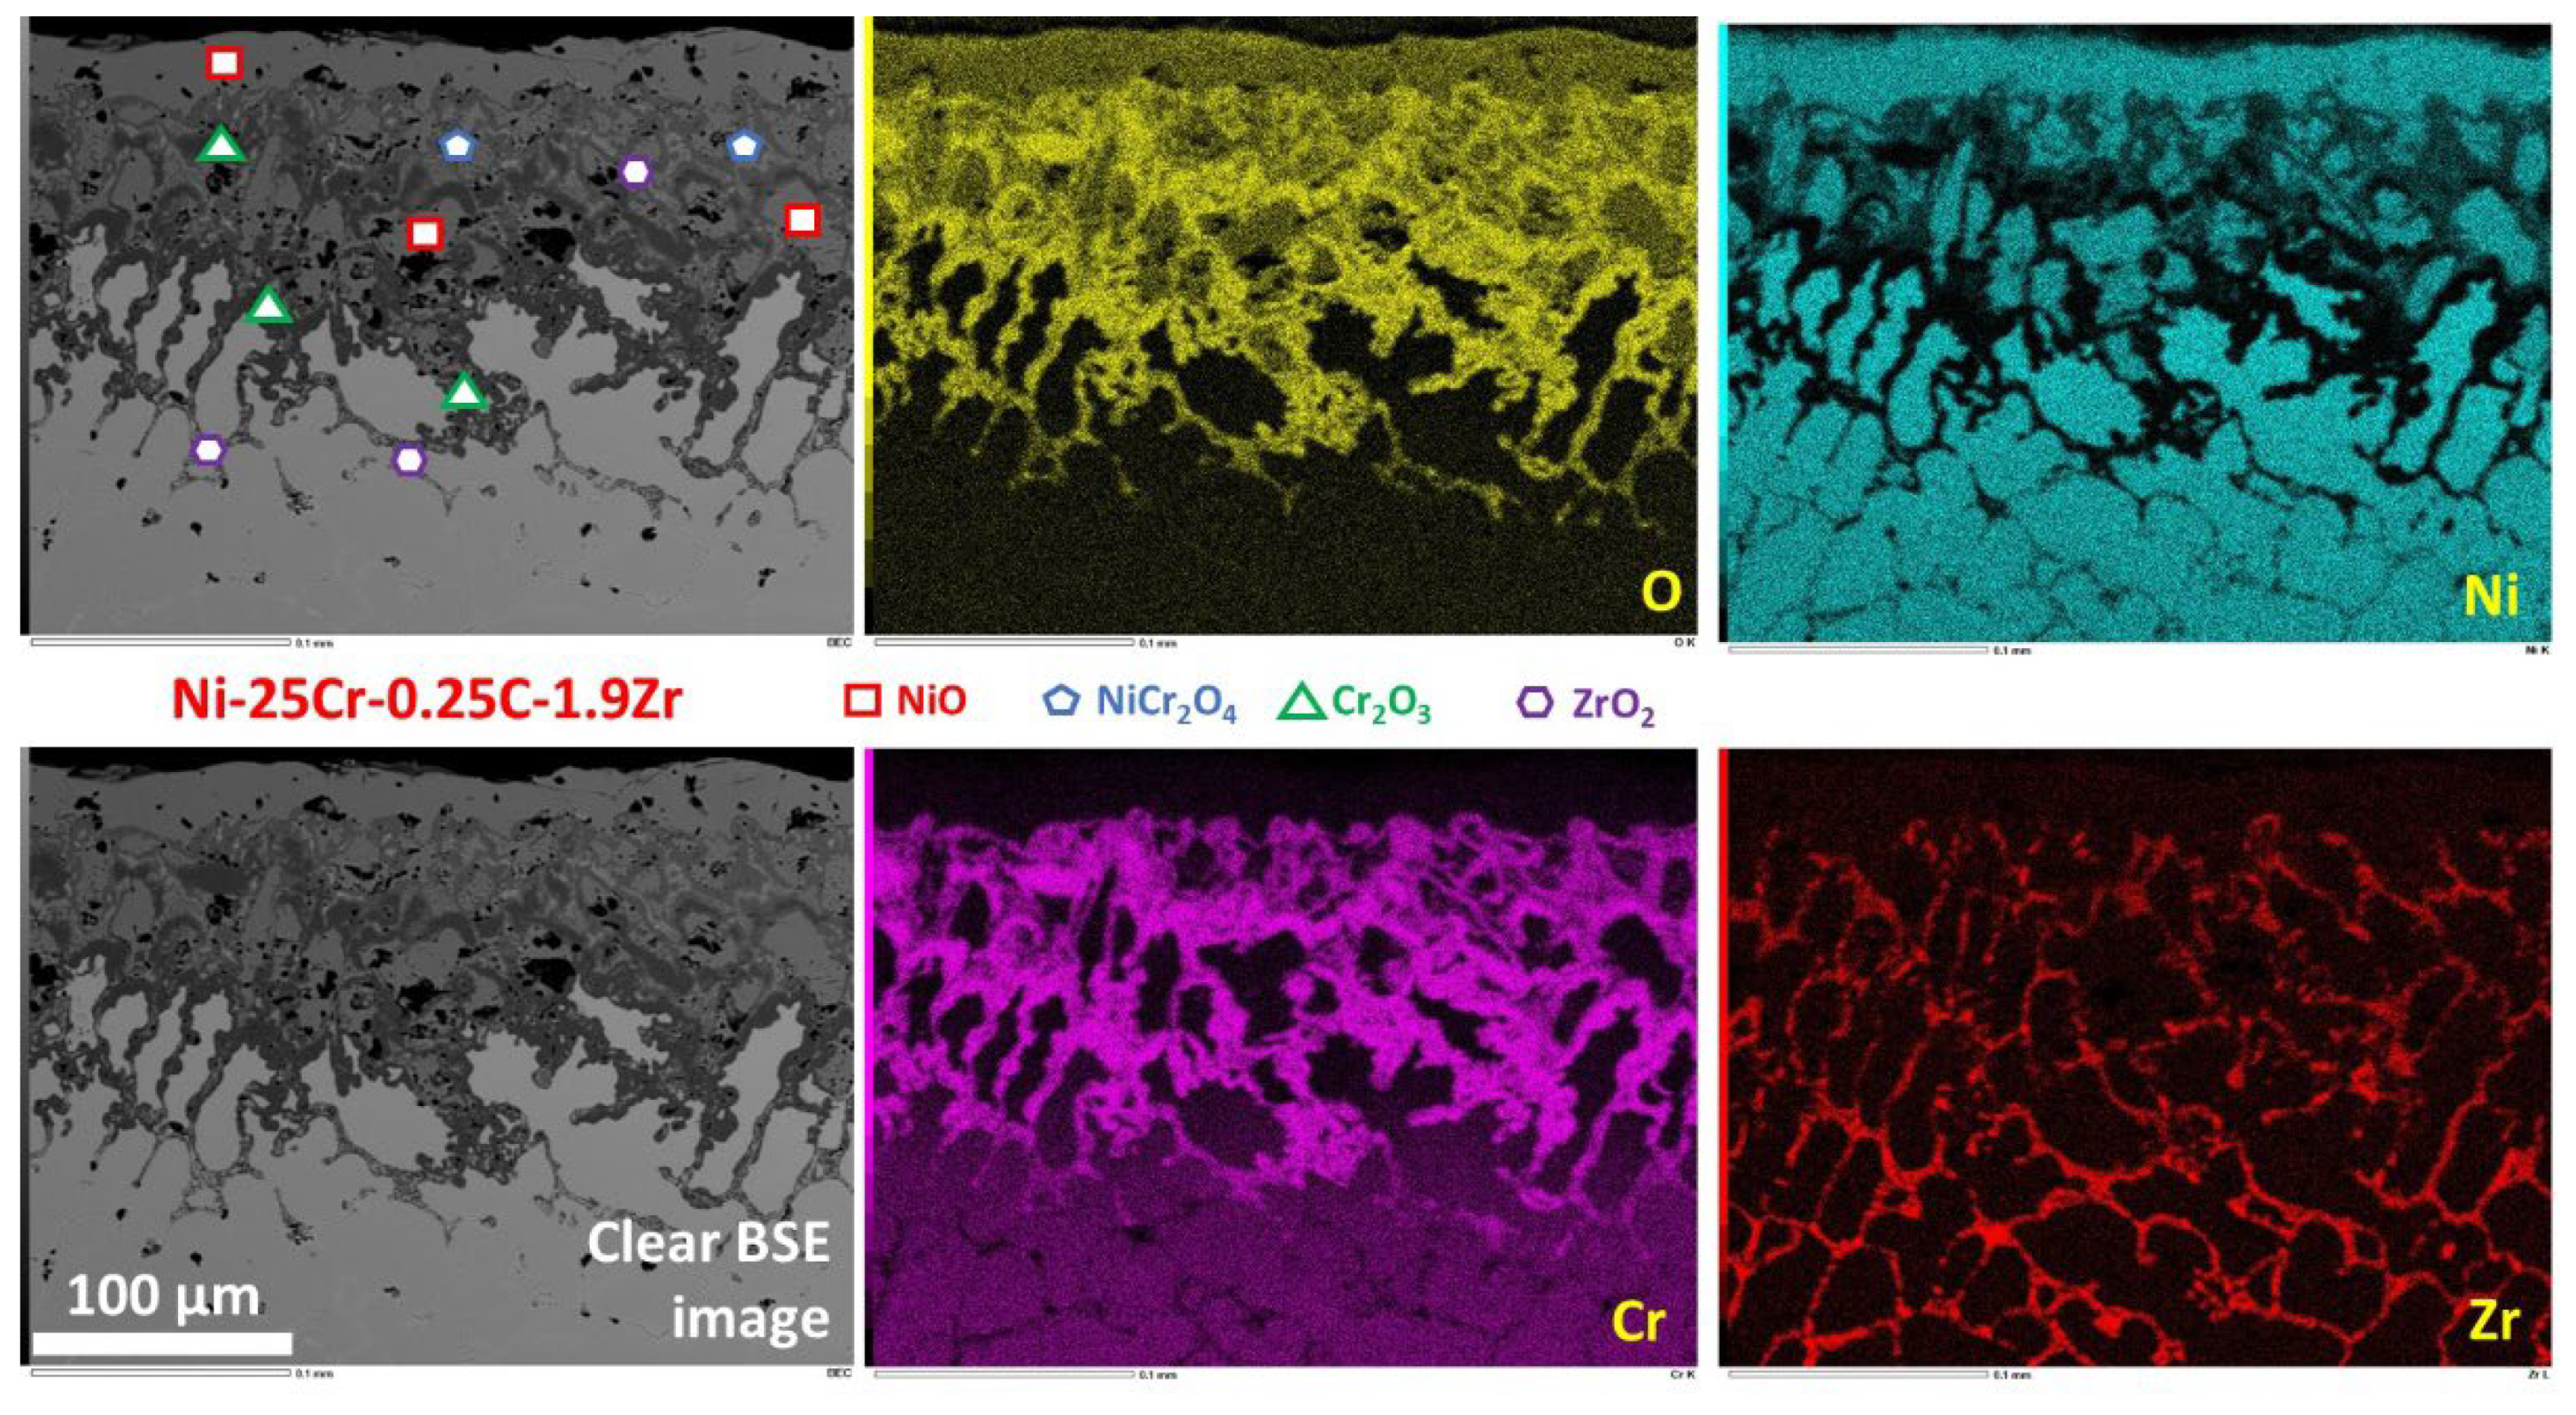
The cross-sectional observations carried out using the SEM in BSE mode, with the use of spot analyses performed on each of the seen oxides, allowed understanding how the different oxides are distributed in the oxide scale in the area where this one was not lost. In the SEM/BSE micrographs given in Figure 8 and with the elemental X-maps in Figure 9 (in the case of the oxidized Ni–25Cr–0.25C–1.9Zr alloy) to illustrate the composition of the oxides scales, one can see the complexity of these scales. They are obviously composed of a more or less thick continuous outermost NiO scale, of discontinuous Cr2O3 (chromia) along the alloy surface, and a mix of NiO, NiCr2O4 spinel, and chromia in the thickness of the scale. ZrO2 seems to be present as internal oxides in the subsurface in the two 1.9 wt.% Zr–containing alloys, while, in the case of the Zr–richest alloy, ZrO2 is also present in the external scale as dispersed small inclusions. In addition to external oxide growth and to internal oxidation, oxidation obviously progressed inwards. Notably, the interdendritic spaces, where the eutectic ZrC carbides were initially present, were notably severely oxidized.
These oxidized surface states are totally different from the one of the reference Ni–25Cr–0.5C, which was covered only by a continuous, adherent, and compact scale made of chromia exclusively. The presence of NiO and of the NiCr2O4 spinel is unusual in oxidized Ni–based alloys containing 25 wt.% Cr. Obviously, the presence of interdendritic ZrC carbides in rather great quantity, even for the 0.25 wt.% C–containing alloy, had a deleterious effect on the oxidation resistance. Seemingly, chromium was not available enough on the oxidation front to allow a chromia–forming behavior similar to the ternary reference alloy.
3.7. Microstructural and Chemical Changes in the Subsurfaces
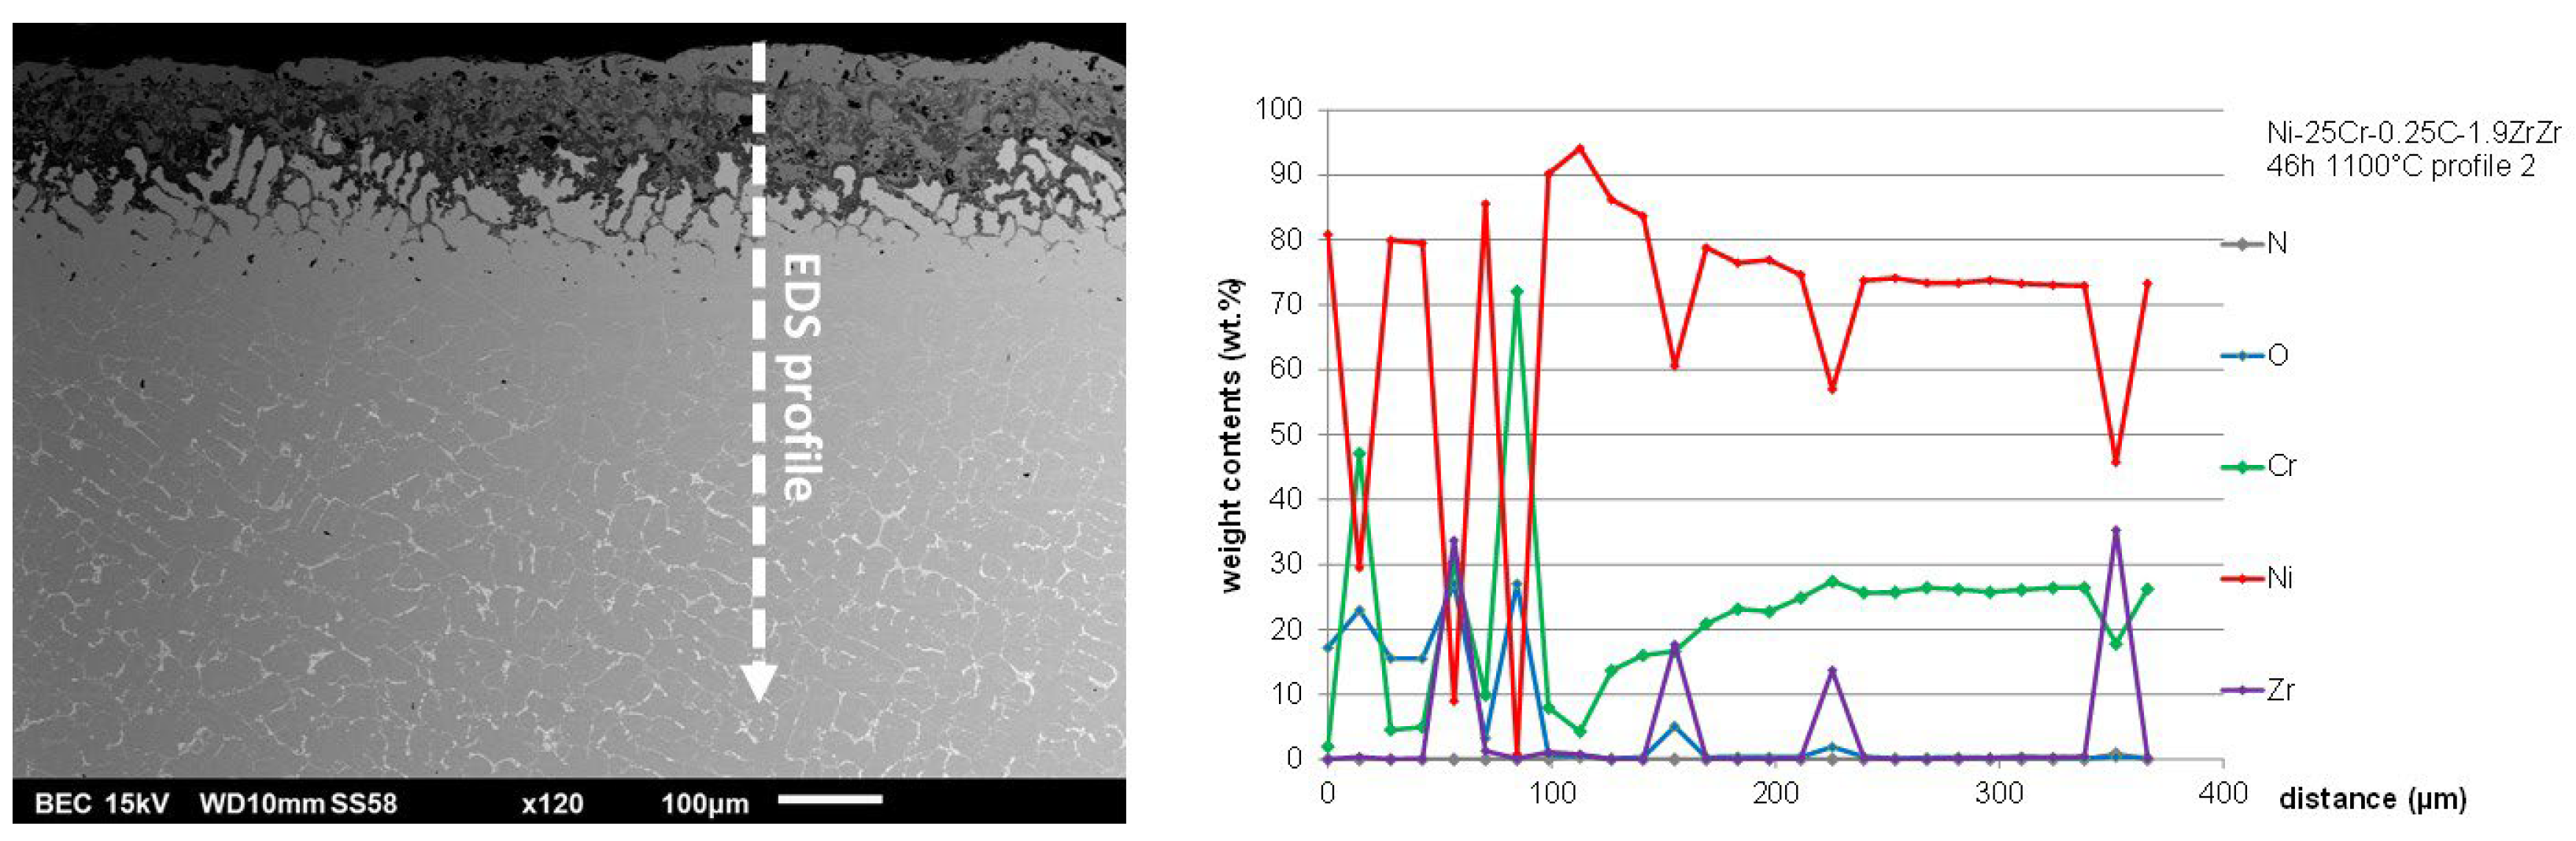
Due to oxidation, in addition to the interdendritic oxidation progressing inwards from the {oxide scale/alloy}-interface, the subsurface is deeper microstructurally and chemically modified. The ZrC carbides (and also the Cr7C3 carbides for the Ni–25Cr–0.50C–1.9Zr alloy) have disappeared in the subsurfaces of the three Zr–containing alloys, over more or less 200 µm (an example of Ni–25Cr–0.25C–1.9Zr is illustrated by a low magnification SEM/BSE micrograph in Figure 10, left). Chemical modifications also occurred in the subsurface, as illustrated by the concentration profile (Figure 10 right) acquired by successive spot EDS analyses along the dotted white arrow featuring in the SEM/BSE micrograph. The first part of this concentration profile corresponds to the oxides present in the external scale (NiO, NiCr2O4, Cr2O3) and the isolated parts of alloy with very low or extremely low chromium content (less than 5 wt.% Cr). When one goes deeper, the chromium content in the alloy progressively increases until reaching the initial alloy Cr content. ZrO2 internal oxides were also detected in the second part of the concentration profile. Concerning the concentration profiles also acquired through the external oxide scale and the subsurface of the Ni–25Cr–0.50C–1.9Zr and Ni–25Cr–0.50C–3.8Zr alloys (Figure 11), the same comments can be done. However, one must notice two differences: on the first hand, the two 1.9 wt.% Zr–containing alloys, and on the other hand, the Zr–richest alloy. For the latter, alloy zirconium oxides are much more present in the subsurface and the chromium content was decreased down to values not as low as for the two other alloys.
The low or very low chromium contents close to the oxidation front explain that the oxidation behavior of these Zr–containing alloys was not chromia-forming, and that the mass gain were particularly fast. The external scale is a mix of different oxides, including chromia. Since chromia was not continuous and did not separate the sample from hot air, it was not protective enough, in contrast with its efficiency in the case of the ternary reference alloy. In absence of any real diffusion barrier, as chromia was for the ternary alloy, all elements were affected by oxidation, with consequently a rapid mass gain.
With Kp values 100 times higher than for the ternary reference alloy, with a mass gain rate 10 times higher, the chemical surface deterioration of the Ni–25Cr–0.50C–1.9Zr and Ni–25Cr–0.50C–3.8Zr alloys was very fast. Despite the apparent low Kp value determined for the Ni–25Cr–0.25C–1.9Zr alloy, a significant part of its surface was already catastrophically oxidizing, a phenomenon that started during the first 46 h of exposure to air at 1100 °C. Indeed, it presents a large part of surface linear oxidation (revealed by the high value of the linear constant KL: more than 600 × 10−7 mg cm−2 s−1). The part of its surface that is still in a parabolic kinetic regime (equal to about (1300/30)1/2 ≈ 7 times lower than the surface affected by linear oxidation) will most likely shortly overbalance in a linear kinetic itself.
One must add that an already rather significant part of surface of the Ni–25Cr–0.50C–1.9Zr alloy—four times lower than the one of the Ni–25Cr–0.25C–1.9Zr alloy—was already linearly oxidizing when the oxidation test was interrupted, as suggested by the almost 150 × 10−7 mg cm−2 s−1 value of the linear constant for this alloy. Furthermore, one can also anticipate, despite its still parabolic oxidation regime (only affected by a linear mass loss, the rate of which is compatible with a chromia volatilization phenomenon), that the Ni–25Cr–0.50C–3.8Zr, at the end of the 46 h-test, was itself most likely close to the start of local, and, a little later, catastrophic oxidation.
3.8. The Particular Mechanisms of Oxidation as Suggested by the Metallographic Results
When a cast Ni–25Cr or Ni–25Cr–0.5C alloy starts oxidizing in air at a high temperature, selective oxidation occurs and, after eventually a very short oxidation of Ni into NiO (staying thereafter as an outermost thin layer in the external oxide scale), it results in chromia, which appears and grows outwards, exclusively. This is allowed by the rather easiness with which chromium diffuses from deeper and deeper in the bulk, mainly along the grain boundaries when temperature is moderate (1000 °C and lower), and both along the grain boundaries and in volume through the matrix when temperature is higher (over 1000 °C). For alloys containing chromium carbides only, the outward chromium diffusion induces the progressive disappearance of these initially present carbides from the oxidation front inward the bulk. Chromium (and carbon) thus diffuse along carbide-free interdendrite boundaries (and also through the matrix if the temperature is high enough).
For the alloys of this study, this is different, since the interdendritic ZrC are decomposing in a progressing depth from the oxidation front (illustration by the micrograph in Figure 10, for instance) but the Zr atoms stay in place (as if only carbon diffuse). They certainly hinder the outward chromium diffusion, which must essentially diffuse in volume (still a little difficult at only 1100 °C), resulting in limited chromium-depleted depths and minimal Cr content around 10 wt.% (concentration profiles in Figure 10 and Figure 11), which is unusually low for nickel-chromium alloys for such temperature and time conditions. The supply in chromium on the oxidation front is thus not efficient enough to allow a chromia-forming behavior. In absence of a protective continuous external chromia scale, a generalized oxidation (of all elements) obviously started and progressed inwards during the oxidation tests. At the same time, oxygen diffused inward and oxidized the Zr atoms present in the interdendritic spaces (X-maps in Figure 9), resulting in the formation of interdendrites oxides of zirconium and also of chromium and nickel. X-maps (Figure 9) evidence the interdendritic presence of zirconium: as ZrO2 oxides (inside the thick oxide scale), as Zr atoms released from the decomposed carbides after outward diffusion of carbon (intermediate depth), and as ZrC carbides (deeper, in the bulk).
4. Conclusions
In contrast with tantalum [23], titanium [24], or niobium [27], but similarly to hafnium [25], Zr is able, for equal molar contents in Zr and in C, to form exclusively MC carbides in Ni–based alloys containing several tens of percent of chromium. Reinforced by the eutectic ZrC carbides that appeared in their microstructures, with the same interdendritic locations and script-like morphologies as the HfC earlier obtained in Ni–25 wt.% Cr–based alloys [28], the alloys studied here showed very promising creep resistance (comparable to the high creep resistance of the HfC–reinforced Ni alloys [28]). Unfortunately, the oxidation behavior, the weak point of these alloys, is dramatically low. So, to allow such alloys to compete efficiently for service at 1100 °C with γ/γ′ single-crystals (weakened by the gamma prime disappearance at this temperature) and with the HfC–reinforced nickel-chromium polycrystalline alloys, their resistance against oxidation must be improved. Zr is more available and cheaper than hafnium, and such alloys ought to be bases for alternative superalloys. Future work may first concern the understanding of the deleterious role of Zr for the oxidation behavior, as well as obtaining a real chromia-forming behavior, by increasing the chromium content beyond 30 wt.%, for instance (as successfully tested for HfC–strengthened Co–based alloys [29]).
Author Contributions
Conceptualization, P.B.; methodology, P.B.; validation, P.B.; formal analysis, P.B. and S.T.; investigation, P.B.; data curation, P.B.; writing—original draft preparation, P.B.; writing—review and editing, P.B.; visualization, P.B.; project administration, P.B. All authors have read and agreed to the published version of the manuscript.
Funding
This research received no external funding.
Institutional Review Board Statement
Not applicable.
Informed Consent Statement
Not applicable.
Data Availability Statement
The data presented in this study are available in article.
Acknowledgments
The authors wish thanking Mélissa Ritouet-Léglise for her technical help for the thermogravimetry tests and the creep test.
Conflicts of Interest
The authors declare no conflict of interest.
References
- Sims, C.T.; Hagel, W.C. The Superalloys; Wiley-Interscience: New York, NY, USA, 1972. [Google Scholar]
- Bradley, E.F. Superalloys: A Technical Guide; ASM International: Metals Park, OH, USA, 1988. [Google Scholar]
- Kofstad, P. High Temperature Corrosion; Elsevier Applied Science: London, UK, 1988. [Google Scholar]
- Donachie, M.S.; Donachie, S.J. Superalloys: A Technical Guide, 2nd ed.; ASM International: Materials Park, OH, USA, 2002. [Google Scholar]
- Durand-Charre, M. The Microstructure of Superalloys; CRC Press: Boca-Raton, FL, USA, 1997. [Google Scholar]
- Young, D.J. High Temperature Oxidation and Corrosion of Metals; Elsevier: Amsterdam, The Netherlands, 2008. [Google Scholar]
- Berthod, P.; Aranda, L.; Gomis, J.P. Effects of Ni additions on the high temperature expansion, melting and oxidation behaviors of cobalt–based superalloys. Crystals 2021, 11, 173. [Google Scholar] [CrossRef]
- Berthod, P.; Kane, D.A.; Aranda, L. Oxidation and microstructural behaviors of Ni–based alloys strengthened by (Ta, Hf)C carbides at 1250 °C in air. Crystals 2021, 11, 159. [Google Scholar] [CrossRef]
- Berthod, P.; Ozouaki Wora, S.A.; Aranda, L.; Medjahdi, G.; Etienne, E. Kinetic and metallography study of the oxidation at 1250 of {Co+Ni}-based superalloys containing Ti to form MC Carbides. Metals 2022, 12, 10. [Google Scholar] [CrossRef]
- Berthod, P. High temperature properties of several chromium-containing Co-based alloys reinforced by different types of MC carbides (M = Ta, Nb, Hf and/or Zr). J. Alloy Compd. 2009, 481, 746–754. [Google Scholar] [CrossRef] [Green Version]
- Xu, J.; Bai, X.; Fan, Y. Studies on the corrosion behavior of yttrium-implanted zircaloy-4. J. Mater. Sci. 2000, 35, 6225–6229. [Google Scholar] [CrossRef]
- Li, Q.; Wang, Y.; Du, P.; Song, P.; Zhang, R.; Li, Z.; Lu, J. Oxidation properties and microstructure of a chromium coating on zircaloy-4 fuel cladding material applied by atmospheric plasma spraying. J. Nucl. Mater. 2022, 560, 153496. [Google Scholar] [CrossRef]
- Gozlan, E.; Bamberger, M.; Dirnfeld, S.F.; Prinz, B. Role of zirconium in the phase formation at the interdendritic zone in nickel-based superalloys. J. Mater. Sci. 1992, 27, 3869–3875. [Google Scholar] [CrossRef]
- Xie, S.; Wang, T.; Lu, J.; Yang, H.; Zhao, G. Effects of Zr on microstructure and short-term strength in GH586. J. Mater. Sci. Technol. 1999, 15, 415–418. [Google Scholar]
- Huang, H.E.; Koo, C.H. Effect of Zirconium on Microstructure and Mechanical Properties of Cast Fine-Grain CM 247 LC Superalloy. Mater. Trans. 2004, 45, 554–561. [Google Scholar] [CrossRef] [Green Version]
- Tsai, Y.L.; Wang, S.F.; Bor, H.Y.; Hsu, Y.F. Effects of Zr addition on the microstructure and mechanical behavior of a fine-grained nickel-based superalloy at elevated temperatures. Mater. Sci. Eng. A 2014, 607, 294–301. [Google Scholar] [CrossRef]
- Opiekun, Z. Influence of zirconium and heat treatment on the structure of heat-resistant cobalt casting alloys of MAR-M509 type. J. Mater. Sci. 1987, 22, 1547–1556. [Google Scholar] [CrossRef]
- Kao, W.H.; Yang, J.M. Development of zirconium diboride particulate-reinforced Rene 41 superalloy composite. Mater. Manuf. Processes 1990, 5, 215–228. [Google Scholar] [CrossRef]
- El Golmati, M.M.; Walker, C.; Peacock, D.C.; Prutton, M. On the role of rare earth additives in the oxidation of superalloys. Corros. Sci. 1985, 25, 351–359. [Google Scholar] [CrossRef]
- Hamadi, S.; Bacos, M.P.; Poulain, M.; Zanna, S.; Maurice, V.; Marcus, P. Short-time oxidation of a NiAl(Zr) bond coat thermochemically deposited on a nickel-based superalloy. Mater. Sci. Forum 2008, 595–598, 95–100. [Google Scholar] [CrossRef]
- Hamadi, S.; Bacos, M.P.; Poulain, M.; Zanna, S.; Seyeux, A.; Maurice, V.; Marcus, P. Oxidation of a Zr-doped NiAl bondcoat thermochemically deposited on a nickel-based superalloy. Mater. High Temp. 2009, 26, 195–198. [Google Scholar] [CrossRef]
- Cai, Y.; Tao, C.; Lu, F.; Li, J. Structure and oxidation behavior of gradient Zr/ZrN/Zr diffusion barrier on the Ni-based superalloy by arc ion plating. Adv. Mater. Res. 2010, 97–101, 1479–1483. [Google Scholar] [CrossRef]
- Berthod, P.; Aranda, L.; Vébert, C.; Michon, S. Experimental and thermodynamic study of the microstructural state at high temperature of nickel base alloys containing tantalum. Calphad 2004, 28, 159–166. [Google Scholar] [CrossRef] [Green Version]
- Berthod, P.; Kretz, E.; Allègre, F. Experimental and thermodynamic study of the role of titanium in the microstructural and thermal properties of cast Ni-Cr-C-Ti alloys. Calphad 2017, 56, 41–48. [Google Scholar] [CrossRef]
- Berthod, P. Hafnium carbides in cast chromium-rich refractory alloys. Part 1: Case of nickel-based alloys. Mater. Sci. Indian J. 2013, 9, 359–365. [Google Scholar]
- Berthod, P. Kinetics of high temperature oxidation and chromia volatilization for a binary Ni–Cr alloy. Oxid. Met. 2005, 64, 235–252. [Google Scholar] [CrossRef] [Green Version]
- Ritouet, M.; Berthod, P. Effect of NbC addition on the high-temperature oxidation resistance of Co- and Ni-based chromium-rich alloys. Oxid. Met. 2018, 89, 339–355. [Google Scholar] [CrossRef]
- Berthod, P.; Conrath, E. Creep and oxidation kinetics at 1100 °C of nickel-base alloys reinforced by hafnium carbides. Mater. Des. 2016, 104, 27–36. [Google Scholar] [CrossRef] [Green Version]
- Berthod, P. Oxidation and microstructural behaviors at 1200 °C of 32.5 wt.% Cr–containing Co–based alloys strengthened by HfC carbides. Crystals 2022, 12, 361. [Google Scholar] [CrossRef]
Figure 1.
Microstructures of the three Zr–containing alloys in their initial states (top: the Ni–25Cr–0.25C–1.9Zr alloy, bottom left: the Ni–25Cr–0.50C–1.9Zr alloy, bottom right: Ni–25Cr–0.50C–3.8Zr).
Figure 1.
Microstructures of the three Zr–containing alloys in their initial states (top: the Ni–25Cr–0.25C–1.9Zr alloy, bottom left: the Ni–25Cr–0.50C–1.9Zr alloy, bottom right: Ni–25Cr–0.50C–3.8Zr).

Figure 2.
The creep deformation curves of the three Zr–containing alloys in comparison with the Ni–25Cr–0.50C ternary alloy; “NZ1”, “NZ2”, and “NZ3” are the Ni–25Cr–0.25C–1.9Zr, Ni–25Cr–0.50C–1.9Zr, and Ni–25Cr–0.50C–3.8Zr alloys, respectively.
Figure 2.
The creep deformation curves of the three Zr–containing alloys in comparison with the Ni–25Cr–0.50C ternary alloy; “NZ1”, “NZ2”, and “NZ3” are the Ni–25Cr–0.25C–1.9Zr, Ni–25Cr–0.50C–1.9Zr, and Ni–25Cr–0.50C–3.8Zr alloys, respectively.

Figure 3.
Mass gain recorded during the isothermal oxidation of the three Zr–containing alloys in comparison with the reference ternary alloy; “NZ1”, “NZ2”, and “NZ3” are the Ni–25Cr–0.25C–1.9Zr, Ni–25Cr–0.50C–1.9Zr, and Ni–25Cr–0.50C–3.8Zr alloys, respectively.
Figure 3.
Mass gain recorded during the isothermal oxidation of the three Zr–containing alloys in comparison with the reference ternary alloy; “NZ1”, “NZ2”, and “NZ3” are the Ni–25Cr–0.25C–1.9Zr, Ni–25Cr–0.50C–1.9Zr, and Ni–25Cr–0.50C–3.8Zr alloys, respectively.

Figure 4.
Mass variation recorded during the whole thermal cycle for the three Zr–containing alloys in comparison with the reference ternary alloy; “NZ1”, “NZ2”, and “NZ3” are the Ni–25Cr–0.25C–1.9Zr, Ni–25Cr–0.50C–1.9Zr, and Ni–25Cr–0.50C–3.8Zr alloys, respectively.
Figure 4.
Mass variation recorded during the whole thermal cycle for the three Zr–containing alloys in comparison with the reference ternary alloy; “NZ1”, “NZ2”, and “NZ3” are the Ni–25Cr–0.25C–1.9Zr, Ni–25Cr–0.50C–1.9Zr, and Ni–25Cr–0.50C–3.8Zr alloys, respectively.

Figure 5.
Diffractogram acquired on the oxidized surface of the Ni–25Cr–0.25C–1.9Zr sample.

Figure 6.
Diffractogram acquired on the oxidized surface of the Ni–25Cr–0.50C–1.9Zr sample.

Figure 7.
Diffractogram acquired on the oxidized surface of the Ni–25Cr–0.50C–3.8Zr sample.

Figure 8.
SEM/BSE micrographs of the external oxide scales of the three Zr–containing alloys (top: the Ni–25Cr–0.25C–1.9Zr alloy, bottom left: the Ni–25Cr–0.50C–1.9Zr alloy, bottom right: the Ni–25Cr–0.50C–3.8Zr alloy).
Figure 8.
SEM/BSE micrographs of the external oxide scales of the three Zr–containing alloys (top: the Ni–25Cr–0.25C–1.9Zr alloy, bottom left: the Ni–25Cr–0.50C–1.9Zr alloy, bottom right: the Ni–25Cr–0.50C–3.8Zr alloy).

Figure 9.
SEM/BSE micrographs (with and without oxide identification) with the elemental X-maps (oxide scale and oxidized subsurface of the Ni–25Cr–0.25C–1.9Zr alloy).
Figure 9.
SEM/BSE micrographs (with and without oxide identification) with the elemental X-maps (oxide scale and oxidized subsurface of the Ni–25Cr–0.25C–1.9Zr alloy).

Figure 10.
Low magnification SEM/BSE view of the external oxide scale and of the subsurface of the Ni–25Cr–0.25C–1.9Zr alloy (left) and EDS concentration profile acquired over the depth, represented by a dotted white arrow in this SEM/BSE micrograph (right).
Figure 10.
Low magnification SEM/BSE view of the external oxide scale and of the subsurface of the Ni–25Cr–0.25C–1.9Zr alloy (left) and EDS concentration profile acquired over the depth, represented by a dotted white arrow in this SEM/BSE micrograph (right).

Figure 11.
EDS concentration profiles acquired over the external oxide scale and the subsurfaces of the oxidized Ni–25Cr–0.50C–1.9Zr (left) and Ni–25Cr–0.50C–3.8Zr alloys (right).
Figure 11.
EDS concentration profiles acquired over the external oxide scale and the subsurfaces of the oxidized Ni–25Cr–0.50C–1.9Zr (left) and Ni–25Cr–0.50C–3.8Zr alloys (right).


Table 1.
Chemical compositions of the three Zr–containing alloys (wt.%, SEM/EDS; 3 × 250 full frame analyses, about 3 × 600 µm2).
Table 1.
Chemical compositions of the three Zr–containing alloys (wt.%, SEM/EDS; 3 × 250 full frame analyses, about 3 × 600 µm2).
| Alloy (3 Zones ×250) | As-Cast Ni–25Cr –0.25C–1.9Zr | As-Cast Ni–25Cr –0.50C–1.9Zr | As-Cast Ni–25Cr –0.50C–3.8Zr |
|---|---|---|---|
| Cr (average value) | 25.7 | 24.9 | 25.1 |
| Cr (standard deviation) | 0.2 | 0.9 | 0.2 |
| Zr (average value) | 2.3 | 2.5 | 4.6 |
| Zr (standard deviation) | 0.2 | 0.1 | 0.2 |
| C (not measured) | (0.25) | (0.50) | (0.50) |
| Ni | Balance | Balance | Balance |
Table 2.
Chemical compositions of the matrixes of the three Zr–containing alloys (wt.%, SEM/EDS; three spot analyses).
Table 2.
Chemical compositions of the matrixes of the three Zr–containing alloys (wt.%, SEM/EDS; three spot analyses).
| Matrix (3 Zones ×250) | As-Cast Ni–25Cr –0.25C–1.9Zr | As-Cast Ni–25Cr –0.50C–1.9Zr | As-Cast Ni–25Cr –0.50C–3.8Zr |
|---|---|---|---|
| Cr (average value) | 25.8 | 24.4 | 26.2 |
| Cr (standard deviation) | 0.4 | 0.1 | 0.7 |
| Zr (average value) | 0.3 | 0 | 0.24 |
| Zr (standard deviation) | 0.3 | 0 | 0.1 |
| C (not measured) | / | / | / |
| Ni | Balance | Balance | Balance |
Table 3.
Vickers macro hardness of the Zr–containing alloys.
| Vickers Hardness (5 Indentations) | As-Cast Ni–25Cr –0.25C–1.9Zr | As-Cast Ni–25Cr –0.50C–1.9Zr | As-Cast Ni–25Cr –0.50C–3.8Zr |
|---|---|---|---|
| average value | 199 | 216 | 251 |
| standard deviation | 3 | 7 | 6 |
Table 4.
Quantitative data characterizing the creep deformation of the alloys.
| Creep Rate in the 2nd stage at t = 250 ks | Ni–25Cr– 0.25C–1.9Zr | Ni–25Cr– 0.50C–1.9Zr | Ni–25Cr– 0.50C–3.8Zr | Ni–25Cr–0.5C (Reference) |
|---|---|---|---|---|
| µm/ks | 0.84 | 0.66 | 0.68 | 2nd stage → 3rd stage at t < 60 ks |
| µm/h | 3.0 | 2.4 | 2.5 |
Table 5.
The values of the oxidation parabolic constants Kp as classically determined, for the three Zr–containing alloys; comparison with the reference ternary alloy.
Table 5.
The values of the oxidation parabolic constants Kp as classically determined, for the three Zr–containing alloys; comparison with the reference ternary alloy.
| Kp (×10−6 mg2 cm−4 s−1) | Ni–25Cr –0.25C–1.9Zr | Ni–25Cr –0.50C–1.9Zr | Ni–25Cr –0.50C–3.8Zr | Ni–25Cr–0.5C (Reference) |
|---|---|---|---|---|
| 969 | 1460 | 890 | 5.5 |
Table 6.
The values of the oxidation parabolic constants Kp determined by taking into account a part of linear mass gain (and value of the linear constant KL) for the three Zr–containing alloys; comparison with the reference ternary alloy.
Table 6.
The values of the oxidation parabolic constants Kp determined by taking into account a part of linear mass gain (and value of the linear constant KL) for the three Zr–containing alloys; comparison with the reference ternary alloy.
| KpcorrL (×10−6 mg2 cm−4 s−1) | Ni–25Cr –0.25C–1.9Zr | Ni–25Cr –0.50C–1.9Zr | Ni–25Cr –0.50C–3.8Zr | Ni–25Cr–0.5C (reference) |
| 30 | 1300 | 1090 | 10.5 | |
| KL (×10−7 mg cm−2 s−1) | Ni–25Cr –0.25C–1.9Zr | Ni–25Cr –0.50C–1.9Zr | Ni–25Cr –0.50C–3.8Zr | Ni–25Cr–0.5C (reference) |
| −639 | −154 | 152 | 46.3 |
Table 7.
The values of two parameters characterizing the scale spallation during the post-isothermal stage cooling for the three Zr–containing alloys; comparison with the reference ternary alloy.
Table 7.
The values of two parameters characterizing the scale spallation during the post-isothermal stage cooling for the three Zr–containing alloys; comparison with the reference ternary alloy.
| Oxide Spallation at Cooling | Ni–25Cr –0.25C–1.9Zr | Ni–25Cr –0.50C–1.9Zr | Ni–25Cr –0.50C–3.8Zr | Ni–25Cr–0.5C (Reference) |
|---|---|---|---|---|
| Start temperature (°C) | 555 | 507 | 441 | No oxide spallation during cooling |
| Mass loss due to spallation (mg cm−2) | −7 | −25 | −1 |
Publisher’s Note: MDPI stays neutral with regard to jurisdictional claims in published maps and institutional affiliations. |
© 2022 by the authors. Licensee MDPI, Basel, Switzerland. This article is an open access article distributed under the terms and conditions of the Creative Commons Attribution (CC BY) license (https://creativecommons.org/licenses/by/4.0/).
Share and Cite
MDPI and ACS Style
Berthod, P.; Tlili, S. Creep and Oxidation Behaviors of 25 wt.% Cr–Containing Nickel-Based Alloys Reinforced by ZrC Carbides. Crystals 2022, 12, 416. https://0-doi-org.brum.beds.ac.uk/10.3390/cryst12030416
AMA Style
Berthod P, Tlili S. Creep and Oxidation Behaviors of 25 wt.% Cr–Containing Nickel-Based Alloys Reinforced by ZrC Carbides. Crystals. 2022; 12(3):416. https://0-doi-org.brum.beds.ac.uk/10.3390/cryst12030416
Chicago/Turabian StyleBerthod, Patrice, and Safa Tlili. 2022. "Creep and Oxidation Behaviors of 25 wt.% Cr–Containing Nickel-Based Alloys Reinforced by ZrC Carbides" Crystals 12, no. 3: 416. https://0-doi-org.brum.beds.ac.uk/10.3390/cryst12030416
Note that from the first issue of 2016, this journal uses article numbers instead of page numbers. See further details here.