Article

Photoluminescence of the Eu3+-Activated YxLu1−xNbO4 (x = 0, 0.25, 0.5, 0.75, 1) Solid-Solution Phosphors

by
Milica Sekulić
,
Tatjana Dramićanin
,
Aleksandar Ćirić
,
Ljubica Đačanin Far
,
Miroslav D. Dramićanin
and
Vesna Đorđević
*
Center of Excellence for Photoconversion, Vinča Institute of Nuclear Sciences—National Institute of the Republic of Serbia, University of Belgrade, P.O. Box 522 Belgrade, Serbia
*
Author to whom correspondence should be addressed.
Submission received: 18 February 2022 / Revised: 11 March 2022 / Accepted: 15 March 2022 / Published: 19 March 2022
(This article belongs to the Special Issue Optical and Spectroscopic Properties of Rare-Earth-Doped Crystals)

Abstract

:
Eu3+-doped YxLu1−xNbO4 (x = 0, 0.25, 0.5, 0.75, 1) were prepared by the solid-state reaction method. YNbO4:Eu3+ and LuNbO4:Eu3+ crystallize as beta-Fergusonite (SG no. 15) in 1–10 μm diameter particles. Photoluminescence emission spectra show a slight linear variation of emission energies and intensities with the solid-solution composition in terms of Y/Lu content. The energy difference between Stark sublevels of 5D07F1 emission increases, while the asymmetry ratio decreases with the composition. From the dispersion relations of pure YNbO4 and LuNbO4, the refractive index values for each concentration and emission wavelength are estimated. The Ω2 Judd–Ofelt parameter shows a linear increase from 6.75 to 7.48 × 10⁻²⁰ cm2 from x = 0 to 1, respectively, and Ω4 from 2.69 to 2.95 × 10⁻²⁰ cm2. The lowest non-radiative deexcitation rate was observed with x = 1, and thus LuNbO4:Eu3+ is more efficient phosphor than YNbO4:Eu3+.

1. Introduction

Phosphors designed with rare earth (RE)-activated compounds are a continuously rising research topic in both basic and applied science. Materials containing the trivalent europium ion (Eu3+) are well known for their strong luminescence in the orange/red spectral region, making them suitable for use in artificial lights, display devices, luminescent sensing, and biomedical research, among other applications [1,2,3,4]. In addition, the Eu3+ ion is a truly unique spectroscopic probe from a theoretical point of view. Because the 4f shell of Eu3+ has an even number of electrons ([Xe]4f6), the ion exhibits a non-degenerated ground (7F0) and excited (5D0) energy states, as well as non-overlapping 2S+1LJ multiplets, resulting in emission spectra that are predictably dependent on the host material site symmetry. The energy level structure, the intensities of the f-f transitions (including the Judd–Ofelt theory), and the decay times of the excited states allow the Eu3+ ion to be used as a spectroscopic probe [5,6,7,8].
Compounds with the ABO4 composition (A = RE; B = P, V, Nb) are suggested to be excellent hosts for luminescent materials in the vast field of phosphors [9,10,11] due to the coupling between rare-earth (RE3+) ions and the BO43− group. RE-Niobates (RENbO4) have long been known, but have received far less attention than vanadates or phosphates. They are chemically stable and have good dielectric properties, as well as ion and proton conductivities [12,13,14,15]. They have been prepared as single crystals [16,17], thin films [18], and in crystalline power form [19,20] for a variety of potential applications, primarily as optical hosts. Under UV or x-ray excitation, YNbO4 is a self-activated phosphor with a broad and strong emission band in the blue spectral region around 400 nm (associated with NbO43− groups from the host crystalline lattice) [21,22]. RE-Niobates’ luminescent properties can be altered by doping with various rare-earth ions. Emission has been observed from: Tm3+, Tb3+, Dy3+, Sm3+, Er3+, Nd3+ [23,24,25,26,27,28], and Eu3+ [20,29]. Recent applications of RE-doped niobates involved luminescent temperature sensors [27,30].
The RENbO4 structure type has a more complex profile than the REVO4 materials, which always occurs in the typical tetragonal zircon structure type. YNbO4 was originally thought to be the parent material of the RENbO4 group, like the natural mineral fergusonite, leading to the classification of the material as a tetragonal phase with a scheelite (I41/a) structure [31]. However, there are two major crystalline forms of RENbO4. One is the low-temperature M-phase isostructure with a monoclinic form of the fergusonite, and the other is the high-temperature T-phase corresponding to the tetragonal scheelite. Between 500 and 850 °C, the reversible transition between two phases, monoclinic and tetragonal, occurs [32]. Subsequent research revealed that the low-temperature phase, monoclinic beta-Fergusonite structure can be described by the space group I-centered (I12/a1) or C-centered (C12/c1), as the I2/a space group is a non-standard setting of C2/c (SG no. 15) [33,34,35]. In both settings, Y is surrounded by 8 oxygens in a large, low-symmetry YO8 octahedron [34]. When other rare earth ions, such as Eu3+, occupy the Y site, the tilting of adjacent NbO4 and NbO6 polyhedra is expected to influence the luminescence properties of the dopant.
In this study, we wanted to investigate the effect of different ionic radii of RE3+ ions on the photoluminescence of the Eu3+-activated niobate host. We prepared a set of five Eu-doped YxLu1−xNbO4:Eu samples (x = 0, 0.25, 0.5, 0.75, and 1) with a fixed Eu concentration (5%) to investigate the influence of the Y to Lu ratio in the host niobate material on Eu3+ luminescence features. In that sense, the crystal field splitting of 7F1 manifold, R intensity ratio and Judd–Ofelt parameters were determined. The application of Judd–Ofelt theory was explained, and the difference in the refractive index of the materials was considered.

2. Materials and Methods

The set of five samples, Eu-doped YxLu1−xNbO4:Eu3+ (x = 0, 0.25, 0.5, 0.75, and 1), were prepared by the solid-state reaction method. In the stoichiometric amounts of starting materials, Yttirium(III) oxide (Y2O3 Alfa Aesar, 99.9%), Lutetium(III) oxide (Lu2O3, Alfa Aeser 99.9%), and Niobium(V) oxide (Nb2O5 Alfa Aesar, 99.5%) were mixed with Europium oxide (Eu2O3 Alfa Aesar, 99.9%) added in order for Y or Lu to reach 95% (i.e., Y0.95Eu0.05NbO4). With the addition of sodium sulphate decahydrate (Na2SO4 x 10H2O, Alfa Aesar, 99%) as flux and small amount of ethanol, the mixtures were homogenized in a ball mill (BM500, Anton Paar) for several hours. The dried mixture was pre-sintered at 800 °C for 2 h, then sintered at 1450 °C for 8 h and allowed to cool to room temperature. Such obtained powders or pellets prepared from the powder under a load of 5 × 10⁸ Pa were used for measurements.
X-ray diffraction measurements were performed with a Rigaku SmartLab diffractometer (Tokyo, Japan) using Cu Kα radiation (30 mA, 40 kV) measured in the 2θ range from 10° to 90°. The built-in package software was used to obtain relevant structural analysis results (crystal coherence size, microstrain values, unit cell parameters, and data fit parameters). A Mira3 Tescan field emission scanning electron microscope (FE-SEM) (Brno, Czech Republic) was used for microstructural characterization, operated at 20 keV and 5.00 kx magnification. Photoluminescence excitation spectra were measured by a Horiba Jobin Yvon Fluorolog FL3-221 spectrofluorometer (Palaiseau, France) equipped with a 450 W Xenon lamp, TBX-04-D PMT detector and a double-grating monochromator with 1200 g/mm. The excitations were performed by monitoring the emission maxima at 612 nm. Lifetime measurements were performed using the same instrument equipped with a xenon–mercury pulsed lamp. Photoluminescence emission spectra were recorded by a high-resolution spectrograph (FHR 1000) (Palaiseau, France) equipped with a Horiba Jobin–Yvon Intensified Charge Coupled Device–ICCD detector and selectable diffraction gratings of 300 and 1800 g/mm. Samples were excited by a 365 nm LED (Ocean Optics) and driven by an Ocean Insight LDC-1C controller.

3. Results

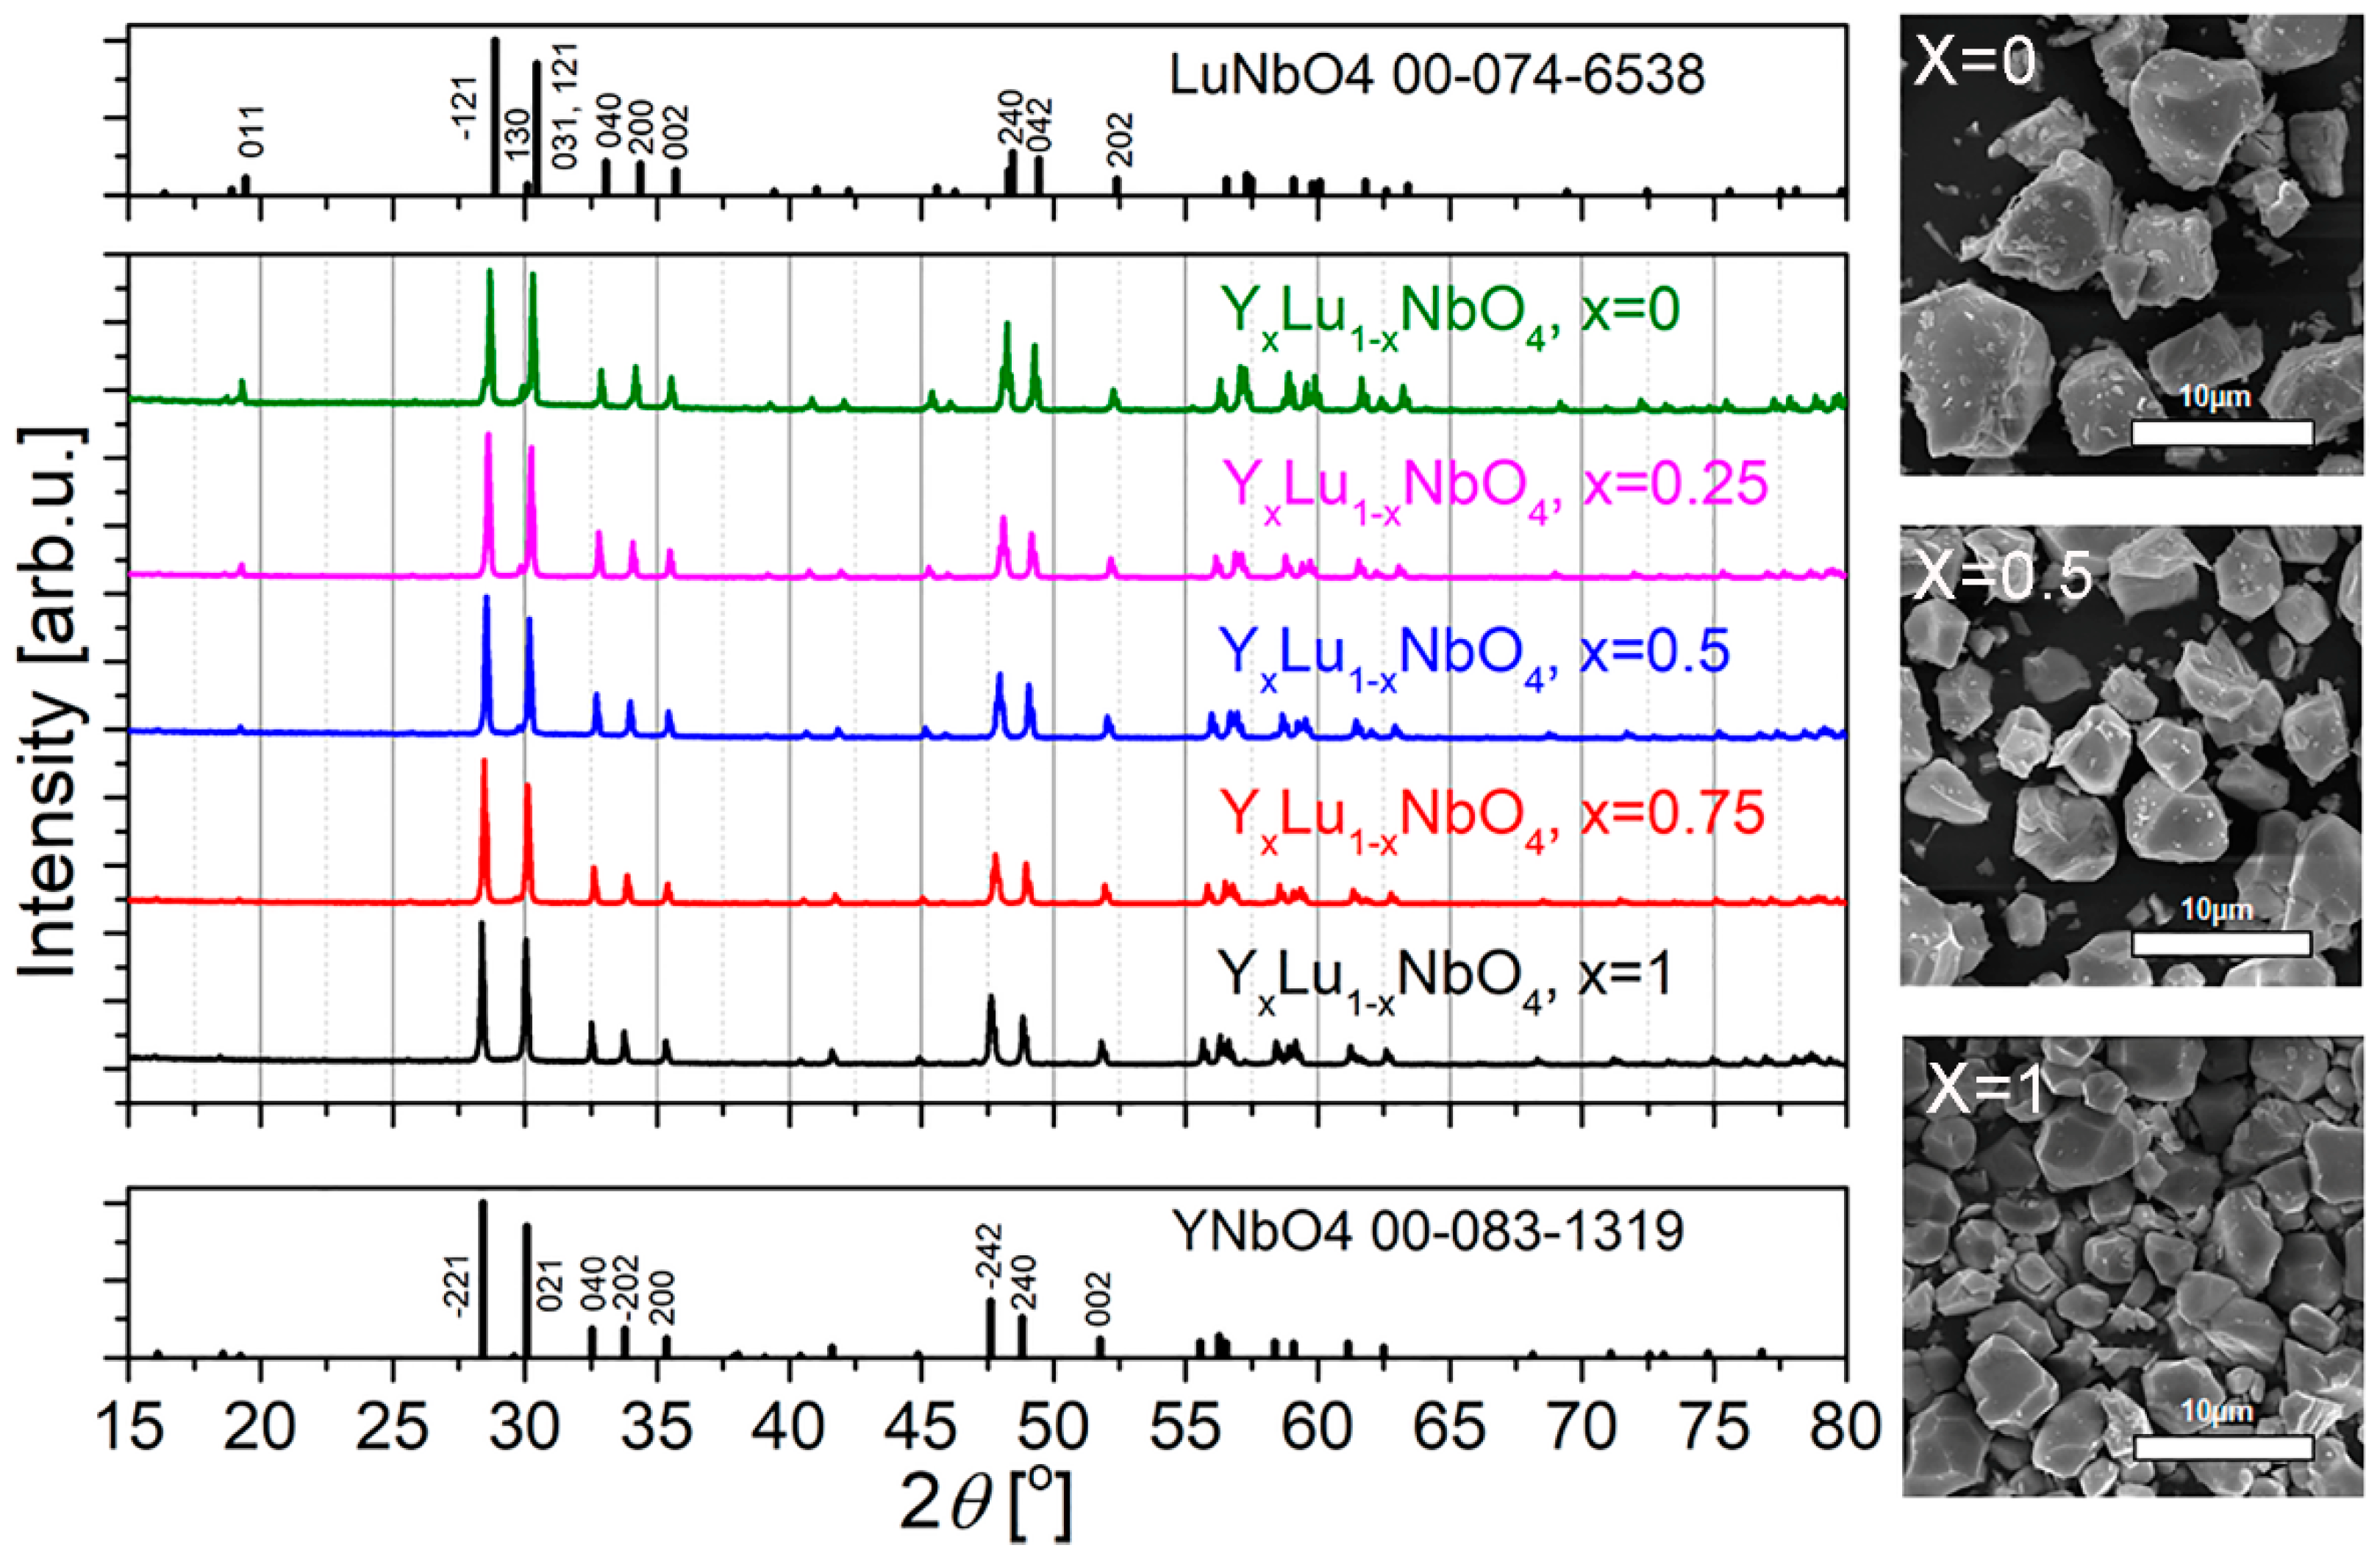
3.1. Crystal Structure and Morphology

X-ray diffraction measurements confirmed that YNbO4:Eu crystallizes in a monoclinic Fergusonite-beta-(Y) structure that can be best fitted with the C2/c space group corresponding to pure YNbO4 ICDD No. 01-083-1319, as can be seen in Figure 1 [36]. The isostructural incorporation of a bigger Eu3+ (rVIII = 1.066 Å) ion instead of a Y3+ (rVIII = 1.019 Å) ion of YO8 dodecahedra results in a small maximum shift of approximately 0.03° to the lower 2θ values [37]. X-ray diffraction measurements confirmed that LuNbO4:Eu3+ crystallizes in a monoclinic Fergusonite-beta-(Lu) structure that can be best fitted with the I2/a space group corresponding to pure LuNbO4 ICDD No. 01-074-6538, as can be seen in Figure 1 [35]. A slight peak position shift of around 0.1° to the lower 2θ values is also observed, resulting from the isostructural incorporation of a larger Eu3+ (rVIII = 1.066 Å) ion into the Lu3+ (rVIII = 0.977 Å) position of LuO8 dodecahedra [36].
Table 1 shows the relevant structural characteristics for both final compositions of YxLu1−xNbO4:Eu3+ (x = 0 and 1), determined by Rietveld refinement of the experimental data derived from Rigaku SmartLab built-in package software. The YNbO4:Eu3+ (x = 1) parameters are refined to the C2/c space group, with a higher value of parameter a of the unit cell around 7.63 Å and a higher β of 138.44°, whereas LuNbO4:Eu3+ (x = 0) parameters are refined to the I2/a space group, with a lower value of parameter a of the unit cell of around 5.24 Å and a lower β of 94.43°. Both samples have crystallite sizes of roughly 50 ± 3 nm and low strain values. The SEM images of YxLu1−xNbO4:5%Eu (x = 0, 0.5, 1) materials presented in Figure 1 show irregularly shaped particles ranging in size from 1 to 10 microns. The YNbO4:5%Eu material comprises a higher proportion of smaller, densely packed particles, whereas the particles in the LuNbO4:5%Eu material are larger and less densely packed.

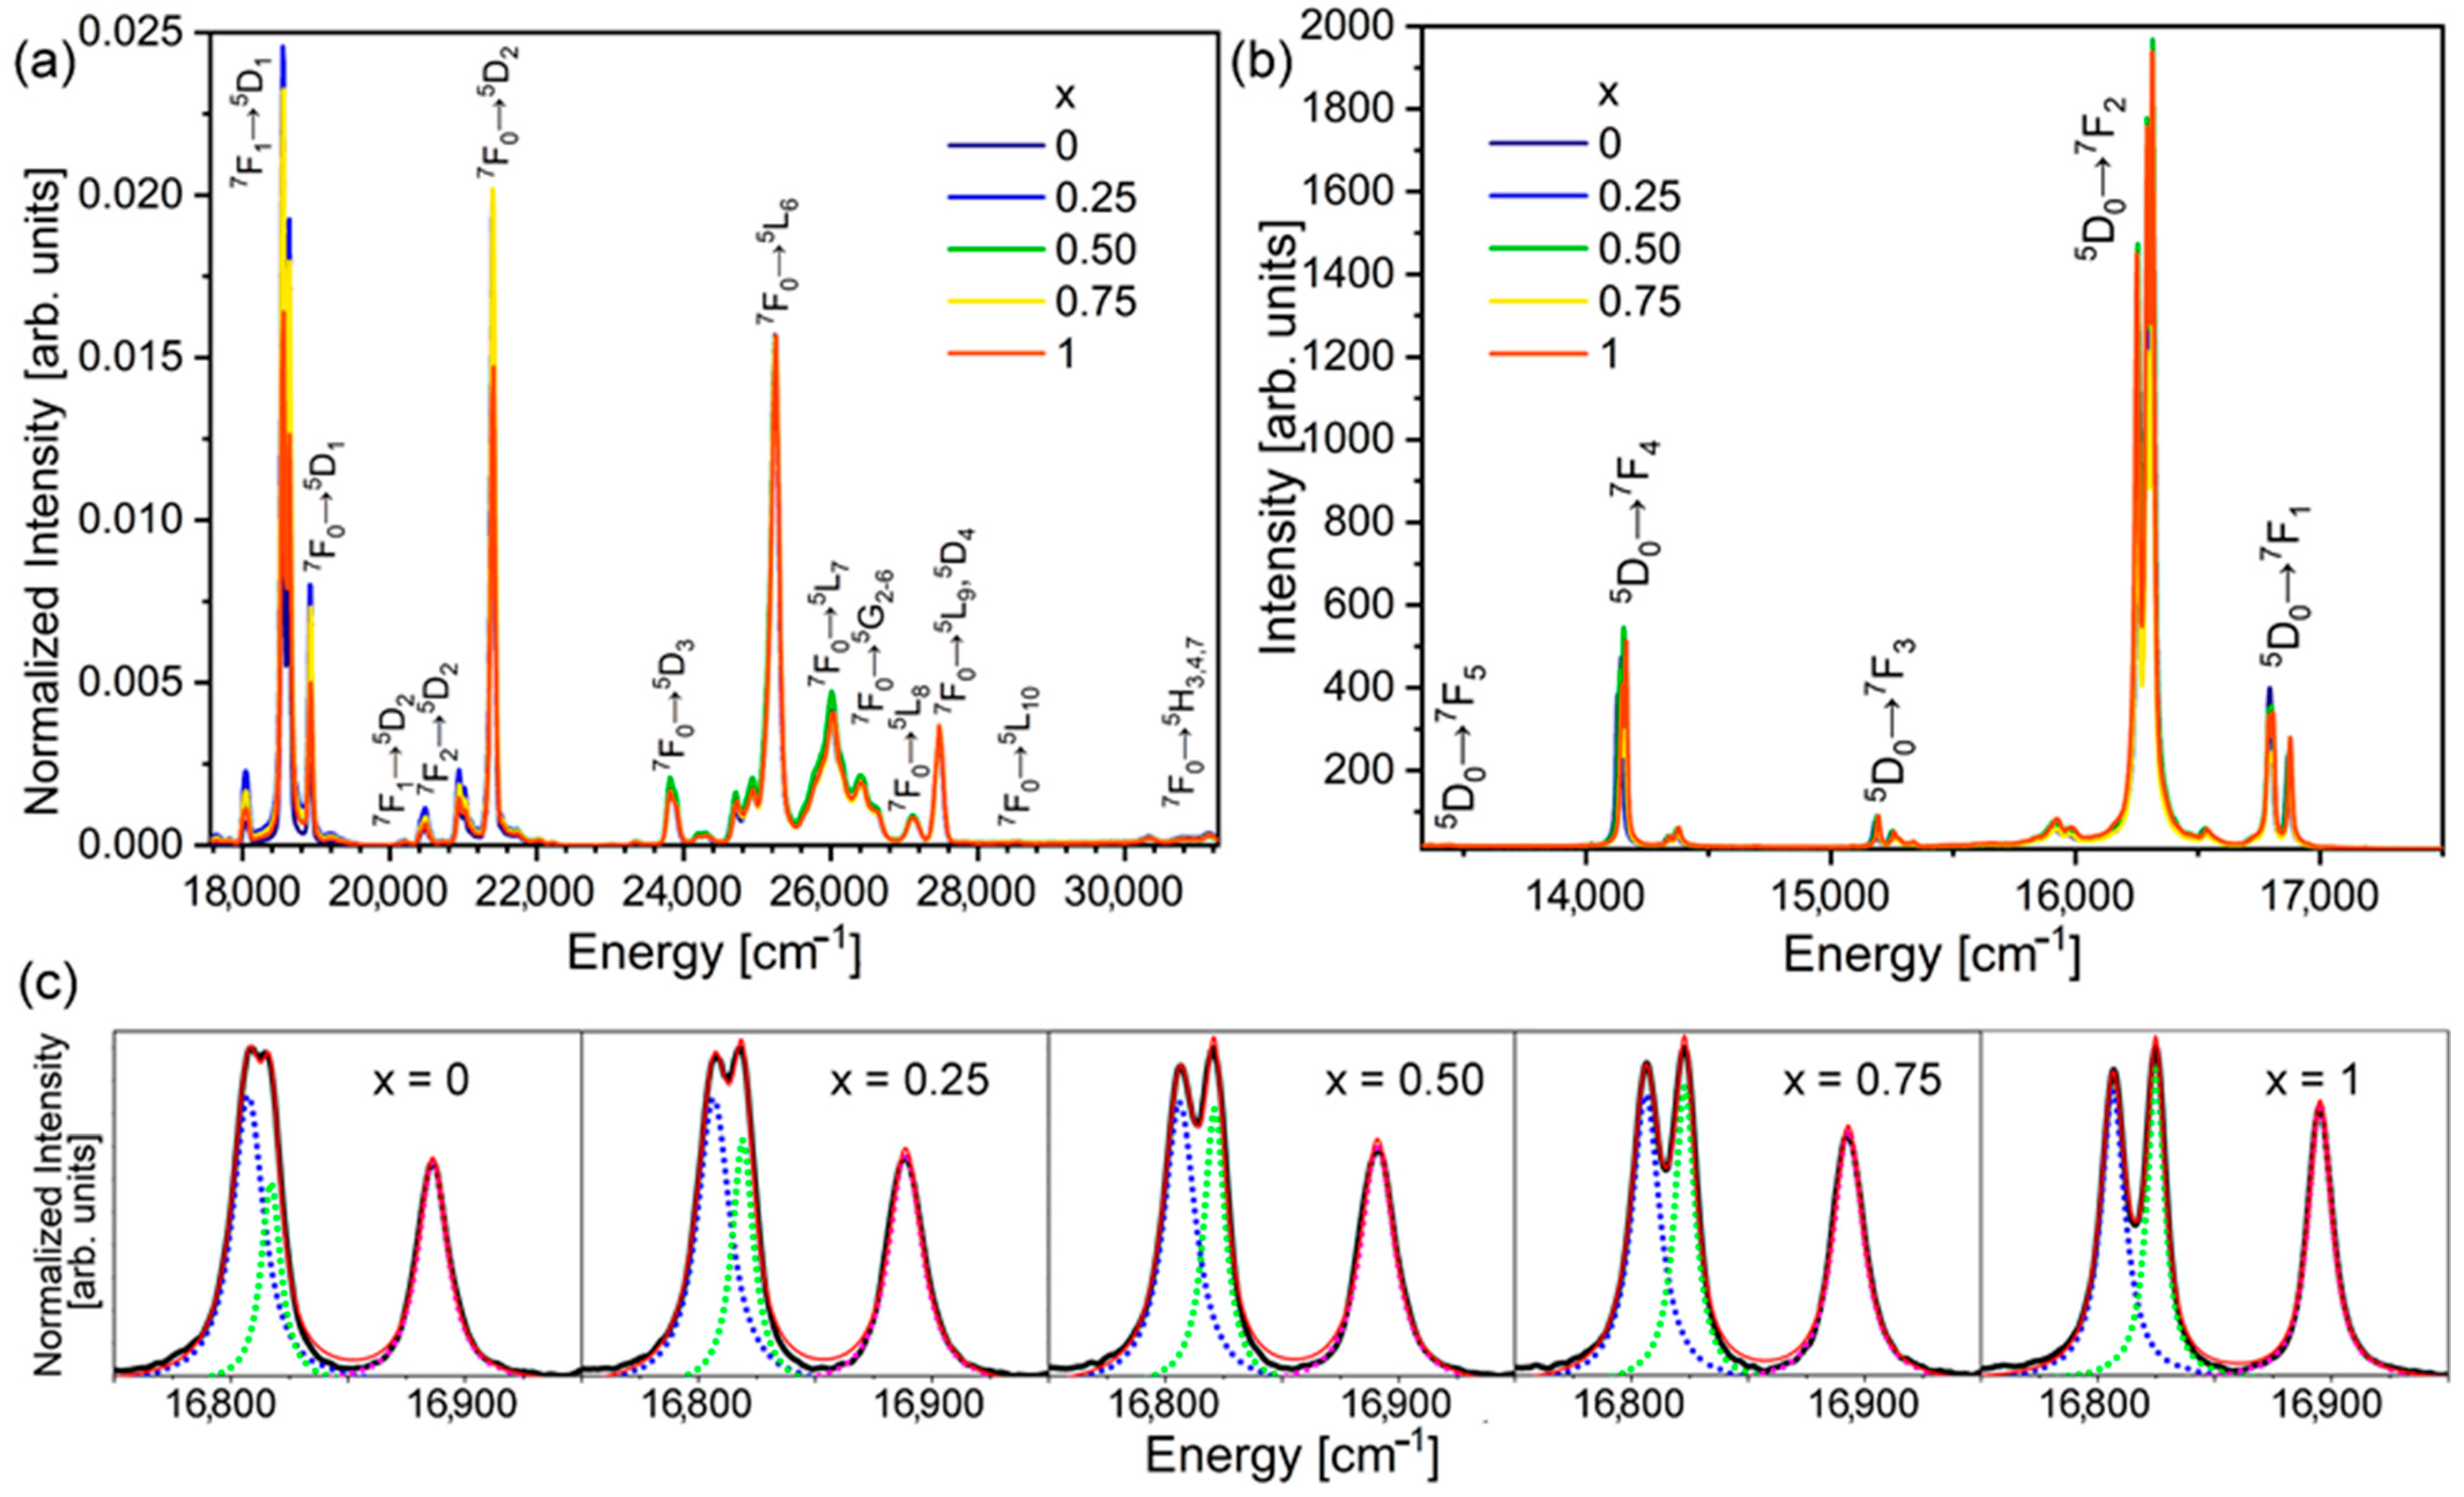
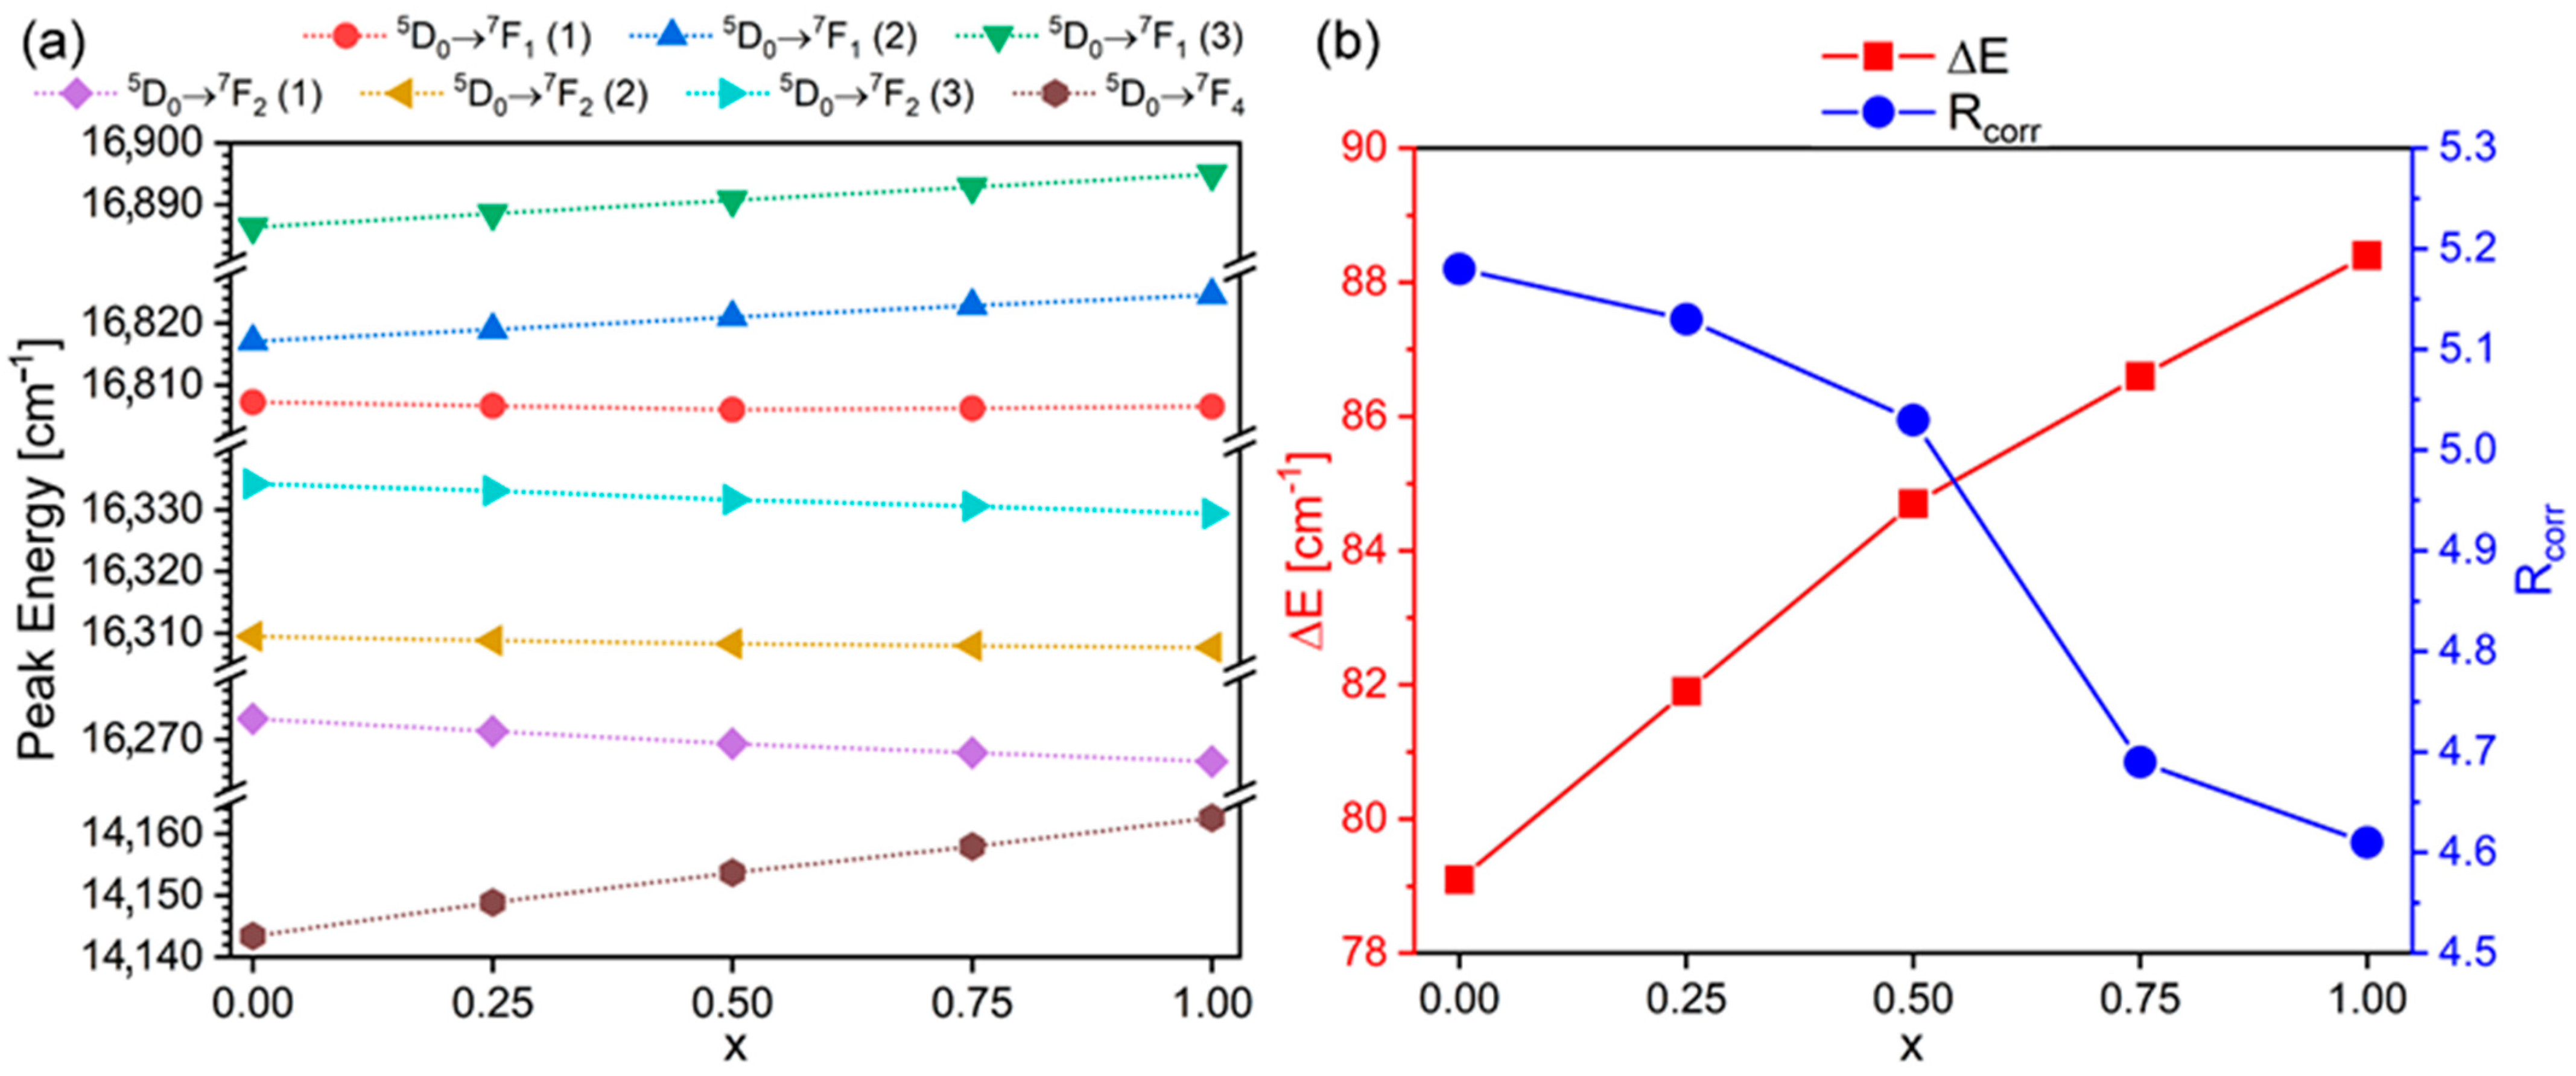
3.2. Photoluminescence

The luminescence excitation and emission spectra of the Eu3+ (4f6) ion in YxLu1−xNbO4 (x = 0, 0.25, 0.5, 0.75, 1) hosts clearly show characteristic f-f transitions, as shown in Figure 2. The excitation spectra of all samples, observed in Figure 2a, as recorded at λem = 612 nm, show several dominant excitation bands centered at around 540 nm (7F15D1), 529 nm (7F05D1), 466 nm (7F05D0), 393 nm (7F0 → 5L6), and 365 nm (7F05D4). The emission spectra of all samples recorded with λexc = 365 nm excitation are presented in Figure 2b. Following the 7F05D4 excitation, the electrons non-radiatively deexcite to the long-lived 5D0 level, from where the radiative relaxation occurs to the 7FJ ground multiplet. In the recorded region, five dominant emission bands from the 5D0 level are centered at 595 nm (5D07F1), 612 nm (5D07F2), 655 nm (5D07F3), 710 nm (5D07F4), and 745 nm (5D07F5). The possible 5D07F6 cannot be recorded by the used experimental setup. As is obvious from Figure 2, the luminescences in all the samples show overlapping bands characteristic for the Eu3+ ion. The Stark level energies calculated from the recorded excitation and emission spectra are presented in Table 2.
The intensity of the Eu3+ 5D07F2J = 2) forced electric dipole transition is hypersensitive since it is strongly dependent on the coordinating polyhedron local site symmetry. Given that the environment of Eu3+ ion is a (Y,Lu)O8 dodecahedron in all samples, small changes can be expected because of the variation of ion positions governed by the different ionic radii of Y and Lu ions [36].
The intensity of the parity-allowed Eu3+ 5D07F1J = 1) magnetic dipole transition is considered as independent to the local symmetry; however, maximum splitting of the 7F1 manifold of the Eu3+ ion is a function of the host [38]. To observe the influence of the host on the 7F1 manifold, additional measurements were performed using a 1800 g/mm diffraction grating monochromator. To precisely determine the positions of all three maxima, a deconvolution is applied, as presented in Figure 2c.
The positions (Peak energies [cm−1]) of the characteristic emission peak maxima of YxLu1−xNbO4:Eu (x = 0, 0.25, 0.5, 0.75, 1) are presented in Figure 3a. As can be seen, only small differences of around 10–20 cm−1 are determined, given the similarity of the Eu3+ ion local environment. Trends of maximum ΔE splitting, the Stark splitting of 7F1 manifold, and the asymmetry ratio R corresponding to the Y/Lu content are presented in Figure 3b. As is evident, ΔE increases linearly with the increase of the x value (increase in Y content). For the same site symmetry and coordination number, the positions of the Stark levels of emissions originating from the 5D0 level of Eu3+ depend on the covalency of the metal-ligand bond [39].
The asymmetry ratio R, which is the ratio of the two characteristic transitions, is frequently used to obtain information on the local site symmetry. As the ratio can be influenced by the refractive index (n) of the host, experimental R values can be corrected for n using the following equation [40]:
R c o r r = [ 9 n 2 ( n 2 + 2 ) 2 ] I ( 5 D 0 7 F 2 ) I ( 5 D 0 7 F 1 ) .
Starting n values for LuNbO4 and YNbO4 were obtained from Ref. [10]. The refractive index values for the other hosts were then calculated by approximation: n(YxLu1−xNbO4) = x∙n(YNbO4) + (1−x)∙n(LuNbO4); and they are given in Figure 4. Characteristic n values at different wavelengths are clearly marked in Figure 4, and they are used for further Judd–Ofelt calculations.

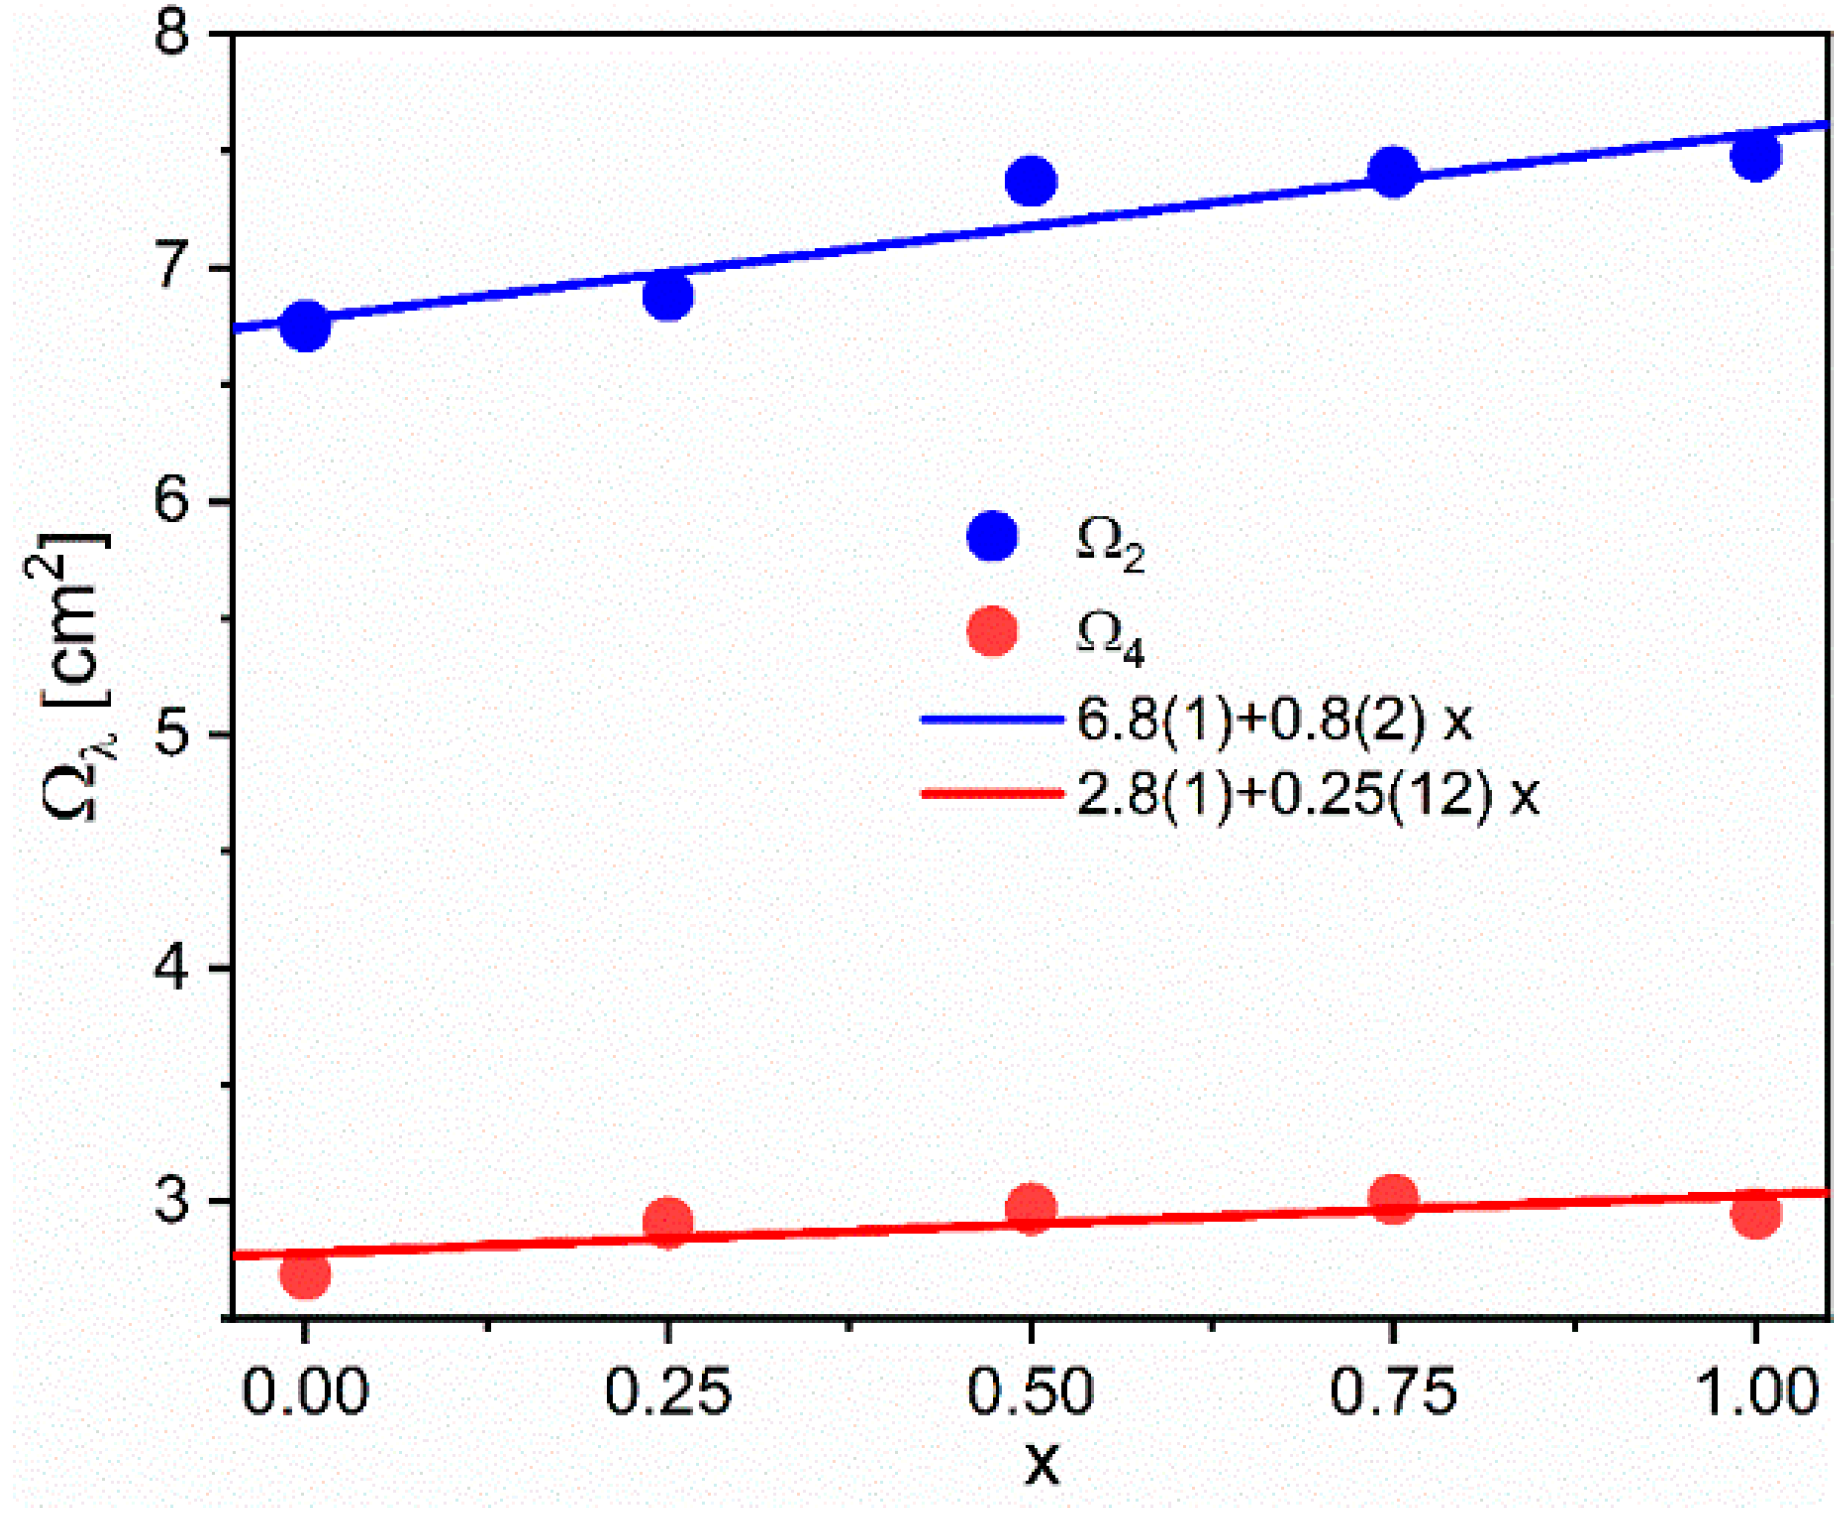
3.3. Judd–Ofelt Analysis

Eu3+ is the only ion with pure magnetic dipole transitions, 5D07F1 and 5D17F0, allowing for the self-referenced Judd–Ofelt analysis from the single emission spectrum [5,6,41]. As the magnetic dipole transition strengths are independent of the host matrix, the radiative transition probability of the magnetic dipole transition (MD) can be used for calibration of the spectrum [42]. Then, the Judd–Ofelt parameters can be estimated from the single emission spectrum (without the traditionally used fitting procedure [43,44]), directly from the relation [45,46]:
Ω λ [ cm 2 ] = 4.135 × 10 23 U λ ( ν M D ν λ ) 3 9 n M D 3 n λ ( n λ 2 + 2 ) 2 I λ I M D ,
where λ = 2,4,6 abbreviates 5D07Fλ transitions, and Uλ are the squared reduced matrix elements with values of 0.0032, 0.0023, and 0.0002 for λ = 2,4,6, respectively. ν is the emission barycenter energy, n is the refractive index, and I are the integrated emission intensities (the employed MD transition here is 5D07F1). Equation (2) is given for intensities measured in counts. In the case where intensities are given in power units, the power to the ratio of barycenter energies should be equal to 4 [47].
From the Judd–Ofelt parameters, many derived quantities can be estimated directly: radiative transition probabilities, branching ratios, radiative lifetime, and emission cross-sections [48]. The radiative transition probabilities for a given λ and MD transition are given by Equations (3) and (4), respectively [49]:
A λ [ s 1 ] = 8.034 × 10 9 ν λ 3 n λ ( n λ 2 + 2 ) 2 U λ Ω λ ,
A M D [ s 1 ] = 3 × 10 12 ν M D 3 n M D 3 ,
The radiative lifetime, branching ratios, and emission cross-sections are estimated by Equations (5)–(7), respectively [50,51]:
τ r a d [ ms ] = 10 3 λ = 2 , 4 , 6 A λ [ s 1 ] + A M D [ s 1 ] ,
β λ , M D = 10 3 A λ , M D [ s 1 ] τ r a d [ ms ] ,
σ λ , M D [ cm 2 ] = 1.33 × 10 5 ν λ , M D 4 n λ , M D 2 max i λ , M D I λ , M D A λ , M D ,
where max(i) is the intensity at the transition maximum.
The experimentally measured lifetime values (τobs) of the emissions from the 5D0 level are given in Table 3, allowing for the calculation of the non-radiative lifetime (τNR) by [52]:
τ N R [ ms ] = τ r a d τ o b s τ r a d τ o b s .
The Judd–Ofelt parameters and derived quantities were calculated by the JOES application software and are given in Table 3 [51]. With the increase of Y content in the hosts (increasing x), certain trends can be observed: the Ω2 parameter of the hypersensitive transition 5D07F2 increases with x, indicating an increasing degree of covalency and decrease of Eu3+ site symmetry, and the Ω4 parameter, which relates to the viscosity and rigidity of the host matrix, shows no significant change [53]. The Ω6 parameter could not be estimated, as the emission 5D07F6 was not observed.
According to the changes in the refractive index and Judd–Ofelt parameters, the radiative transition probabilities and cross-sections show a monotonic increase with x, while the radiative lifetime decreases. As the observable lifetime also increases with x, the non-radiative lifetime is at a minimum in the pure YNbO4, indicating that LuNbO4 is a more efficient host matrix for the Eu3+ emission.
As the Judd–Ofelt parameters depend on the environment of the ion, the parameters obtained by the semi-empirical method are a statistical average of the Judd–Ofelt parameters for each ion. Thus, if there is a mix of non-equivalent sites in the host matrix, the Judd–Ofelt parameters represent an average value for each site, weighted by their contribution [49]. Thus, the Judd–Ofelt parameters of the mixture of two hosts can be predicted from the Judd–Ofelt parameters of the two pure compounds (a,b):
Ω λ = x Ω λ ( a ) + ( 1 x ) Ω λ ( b ) .
The estimation of the Judd–Ofelt parameters from the emission spectra inherently brings an error of about 10%. By fitting the Judd–Ofelt parameters to the linear relations for each x, the Judd–Ofelt parameters can be refined by the values on the fitted curve, as the estimate reduces the error of estimation for each by k , where k is the number of measurements. Thus, in the case of the mixture of YNbO4 and LuNbO4 in five ratios, the error of each estimated Judd–Ofelt parameter is reduced about 2.2 times, and the more correct values are on the fitted curve for each concentration (Figure 5).

4. Conclusions

In this study, we demonstrated how the Y-to-Lu ratio in YxLu1−xNbO4:Eu3+ powder material influenced the Eu3+ luminescence features. The materials were synthesized using the solid state reaction method. All of the structures crystallized as beta-Fergusonite, in which the Eu ion replaced the Y or Lu ion in a large, low-symmetry octahedron. In all composition hosts, the luminescence excitation and emission spectra of the Eu3+ (4f6) ion showed characteristic f-f transitions from which the Stark energy levels were calculated.
The specific features and energy positions of the characteristic 5D07F1 magnetic dipole transition were determined when measured with a higher resolution and when spectra deconvolution was used. The maximum ΔE splitting of the Stark splitting of 7F1 manifold and the asymmetry ratio R all exhibit Y/Lu content-dependent trends. Calculations based on the Judd–Ofelt theory were used to estimate specific quantities, concluding that LuNbO4 is a more efficient host matrix for the Eu3+ emission.

Author Contributions

Conceptualization, V.Đ. and M.D.D.; methodology, M.D.D.; validation, A.Ć.; formal analysis, A.Ć. and V.Đ.; investigation, M.S. and T.D.; data curation, L.Đ.F. and A.Ć.; writing—original draft preparation, V.Đ.; writing—review and editing, V.Đ., A.Ć. and M.D.D. All authors have read and agreed to the published version of the manuscript.

Funding

This research was funded by the NATO Science for Peace and Security Programme under grant id. [G5751]. The authors acknowledge funding from the Ministry of Education, Science and Technological Development of the Republic of Serbia.

Institutional Review Board Statement

Not applicable.

Informed Consent Statement

Not applicable.

Data Availability Statement

Not applicable.

Acknowledgments

The authors acknowledge Đorđe Veljović for SEM measurements.

Conflicts of Interest

The authors declare no conflict of interest.

References

  1. Yen, W.M.; Shionoya, S.; Yamamoto, H. (Eds.) Practical Applications of Phosphors; CRC Press: Boca Raton, FL, USA, 2007; ISBN 9781315219974. [Google Scholar] [CrossRef]
  2. Atuchin, V.V.; Subanakov, A.K.; Aleksandrovsky, A.S.; Bazarov, B.G.; Bazarova, J.G.; Gavrilova, T.A.; Krylov, A.S.; Molokeev, M.S.; Oreshonkov, A.S.; Stefanovich, S.Y. Structural and spectroscopic properties of new noncentrosymmetric self-activated borate Rb3EuB6O12 with B5O10 units. Mater. Des. 2018, 140, 488–494. [Google Scholar] [CrossRef] [Green Version]
  3. Atuchin, V.V.; Aleksandrovsky, A.S.; Chimitova, O.D.; Gavrilova, T.A.; Krylov, A.S.; Molokeev, M.S.; Oreshonkov, A.S.; Bazarov, B.G.; Bazarova, J.G. Synthesis and spectroscopic properties of monoclinic α-Eu2(MoO4)3. J. Phys. Chem. C 2014, 118, 15404–15411. [Google Scholar] [CrossRef]
  4. Shi, P.; Xia, Z.; Molokeev, M.S.; Atuchin, V.V. Crystal chemistry and luminescence properties of red-emitting CsGd1−xEux(MoO4)2 solid-solution phosphors. Dalton Trans. 2014, 43, 9669–9676. [Google Scholar] [CrossRef] [PubMed]
  5. Binnemans, K. Interpretation of europium(III) spectra. Coord. Chem. Rev. 2015, 295, 1–45. [Google Scholar] [CrossRef] [Green Version]
  6. Tanner, P.A. Some misconceptions concerning the electronic spectra of tri-positive europium and cerium. Chem. Soc. Rev. 2013, 42, 5090. [Google Scholar] [CrossRef]
  7. Ðorđević, V.; Antić, Ž.; Lojpur, V.; Dramićanin, M.D. Europium-doped nanocrystalline Y2O3−La2O3 solid solutions with bixbyite structure. J. Phys. Chem. Solids 2014, 75, 1152–1159. [Google Scholar] [CrossRef]
  8. Ðorđević, V.; Antić, Ž.; Nikolić, M.G.; Dramićanin, M.D. Comparative structural and photoluminescent study of Eu3+-doped La2O3 and La(OH)3 nanocrystalline powders. J. Phys. Chem. Solids 2014, 75, 276–282. [Google Scholar] [CrossRef]
  9. Blasse, G.; Bril, A. Luminescence of Phosphors Based on Host Lattices ABO4 (A is Sc, In; B is P, V, Nb). J. Chem. Phys. 2003, 50, 2974. [Google Scholar] [CrossRef]
  10. Ding, S.; Zhang, H.; Liu, W.; Sun, D.; Zhang, Q. Experimental and first principle investigation the electronic and optical properties of YNbO4 and LuNbO4 phosphors. J. Mater. Sci. Mater. Electron. 2018, 29, 11878–11885. [Google Scholar] [CrossRef]
  11. Rubin, J.J.; Van Uitert, L.G. Growth of Large Yttrium Vanadate Single Crystals for Optical Maser Studies. J. Appl. Phys. 1966, 37, 2920. [Google Scholar] [CrossRef]
  12. Erdei, S. Growth of oxygen deficiency-free YVO4 single crystal by top-seeded solution growth technique. J. Cryst. Growth 1993, 134, 1–13. [Google Scholar] [CrossRef]
  13. Packer, R.J.; Tsipis, E.V.; Munnings, C.N.; Kharton, V.V.; Skinner, S.J.; Frade, J.R. Diffusion and conductivity properties of cerium niobate. Solid State Ion. 2006, 177, 2059–2064. [Google Scholar] [CrossRef]
  14. Haugsrud, R.; Norby, T. Proton conduction in rare-earth ortho-niobates and ortho-tantalates. Nat. Mater. 2006, 5, 193–196. [Google Scholar] [CrossRef]
  15. Wu, M.; Liu, X.; Gu, M.; Ni, C.; Liu, B.; Huang, S. Characterization and luminescence properties of sol–gel derived M′-type LuTaO4:Ln3+ (Ln = Pr, Sm, Dy) phosphors. Mater. Res. Bull. 2014, 60, 652–658. [Google Scholar] [CrossRef]
  16. Takei, H.; Tsunekawa, S. Growth and properties of LaNbO4 and NdNbO4 single crystals. J. Cryst. Growth 1977, 38, 55–60. [Google Scholar] [CrossRef]
  17. Fulle, K.; McMillen, C.D.; Sanjeewa, L.D.; Kolis, J.W. Hydrothermal Chemistry and Growth of Fergusonite-type RENbO4 (RE = La-Lu, Y) Single Crystals and New Niobate Hydroxides. Cryst. Growth Des. 2016, 16, 4910–4917. [Google Scholar] [CrossRef]
  18. Brunckova, H.; Mudra, E.; Medvecky, L.; Kovalcikova, A.; Durisin, J.; Sebek, M.; Girman, V. Effect of lanthanides on phase transformation and structural properties of LnNbO4 and LnTaO4 thin films. Mater. Des. 2017, 134, 455–468. [Google Scholar] [CrossRef]
  19. Zhang, P.; Wang, T.; Xia, W.; Li, L. Microwave dielectric properties of a new ceramic system NdNbO4 with CaF2 addition. J. Alloys Compd. 2012, 535, 1–4. [Google Scholar] [CrossRef]
  20. Đačanin, L.R.; Dramićanin, M.D.; Lukić-Petrović, S.R.; Petrović, D.M.; Nikolić, M.G.; Ivetić, T.B.; Gúth, I.O. Mechanochemical synthesis of YNbO4:Eu nanocrystalline powder and its structural, microstructural and photoluminescence properties. Ceram. Int. 2014, 40, 8281–8286. [Google Scholar] [CrossRef]
  21. Blasse, G.; Bril, A. Photoluminescent Efficiency of Phosphors with Electronic Transitions in Localized Centers. J. Electrochem. Soc. 1968, 115, 1067. [Google Scholar] [CrossRef]
  22. Lee, S.K.; Chang, H.; Han, C.H.; Kim, H.J.; Jang, H.G.; Park, H.D. Electronic Structures and Luminescence Properties of YNbO4 and YNbO4:Bi. J. Solid State Chem. 2001, 156, 267–273. [Google Scholar] [CrossRef]
  23. Dwivedi, A.; Mishra, K.; Rai, S.B. Tm3+, Yb3+ activated ANbO4 (A  =  Y, Gd, La) phosphors: A comparative study of optical properties (downshifting and upconversion emission) and laser induced heating effect. J. Phys. D Appl. Phys. 2016, 50, 045602. [Google Scholar] [CrossRef] [Green Version]
  24. Xiao, X.; Yan, B. REMO4 (RE = Y, Gd; M = Nb, Ta) phosphors from hybrid precursors: Microstructure and luminescence. J. Mater. Res. 2008, 23, 679–687. [Google Scholar] [CrossRef]
  25. Liu, C.; Zhou, W.; Shi, R.; Lin, L.; Zhou, R.; Chen, J.; Li, Z.; Liang, H. Host-sensitized luminescence of Dy3+ in LuNbO4 under ultraviolet light and low-voltage electron beam excitation: Energy transfer and white emission. J. Mater. Chem. C 2017, 5, 9012–9020. [Google Scholar] [CrossRef]
  26. Dačanin, L.R.; Lukić-Petrović, S.R.; Petrović, D.M.; Nikolić, M.G.; Dramićanin, M.D. Temperature quenching of luminescence emission in Eu3+- and Sm3+-doped YNbO4 powders. J. Lumin. 2014, 151, 82–87. [Google Scholar] [CrossRef]
  27. Wang, X.; Li, X.; Xu, S.; Cheng, L.; Sun, J.; Zhang, J.; Li, L.; Chen, B. A comparative study of spectral and temperature sensing properties of Er3+ mono-doped LnNbO4 (Ln = Lu, Y, Gd) phosphors under 980 and 1500 nm excitations. Mater. Res. Bull. 2019, 111, 177–182. [Google Scholar] [CrossRef]
  28. Ding, S.; Peng, F.; Zhang, Q.; Luo, J.; Liu, W.; Sun, D.; Dou, R.; Sun, G. Structure, spectroscopic properties and laser performance of Nd:YNbO4 at 1066 nm. Opt. Mater. 2016, 62, 7–11. [Google Scholar] [CrossRef]
  29. Massabni, A.M.G.; Montandon, G.J.M.; Couto, M.A.; Santos, D. Synthesis and luminescence spectroscopy of YNbO4 doped with Eu(III). Mater. Res. 1998, 1, 01–04. [Google Scholar] [CrossRef]
  30. Đačanin Far, L.; Lukić-Petrović, S.R.; Đorđević, V.; Vuković, K.; Glais, E.; Viana, B.; Dramićanin, M.D. Luminescence temperature sensing in visible and NIR spectral range using Dy3+ and Nd3+ doped YNbO4. Sens. Actuators A Phys. 2018, 270, 89–96. [Google Scholar] [CrossRef]
  31. Refguson, R.B. The crystallography of synthetic YTaO4 and fused fergusonite | The Canadian Mineralogist | GeoScienceWorld. Can. Mineral. 1957, 6, 72–77. [Google Scholar]
  32. Brixner, L.H.; Whitney, J.F.; Zumsteg, F.C.; Jones, G.A. Ferroelasticity in the LnNbO4-type rare earth niobates. Mater. Res. Bull. 1977, 12, 17–24. [Google Scholar] [CrossRef]
  33. Bayliss, R.D.; Pramana, S.S.; An, T.; Wei, F.; Kloc, C.L.; White, A.J.P.; Skinner, S.J.; White, T.J.; Baikie, T. Fergusonite-type CeNbO4+δ: Single crystal growth, symmetry revision and conductivity. J. Solid State Chem. 2013, 204, 291–297. [Google Scholar] [CrossRef]
  34. Arulnesan, S.W.; Kayser, P.; Kimpton, J.A.; Kennedy, B.J. Studies of the fergusonite to scheelite phase transition in LnNbO4 orthoniobates. J. Solid State Chem. 2019, 277, 229–239. [Google Scholar] [CrossRef]
  35. Keller, C. Über ternäre Oxide des Niobs und Tantals vom Typ ABO4. Z. Anorg. Allg. Chem. 1962, 318, 89–106. [Google Scholar] [CrossRef]
  36. Weitzel, H. Kristallstrukturverfeinerungen von Euxenit, Y(Nb0.5Ti0.5)2O6, und M-Fergusonit, YNbO4. Z. Krist.-Cryst. Mater. 1980, 152, 69–82. [Google Scholar] [CrossRef]
  37. Shannon, R.D. Revised effective ionic radii and systematic studies of interatomic distances in halides and chalcogenides. Acta Crystallogr. Sect. A 1976, 32, 751–767. [Google Scholar] [CrossRef]
  38. Malta, O.L.; Antic-Fidancev, E.; Lemaitre-Blaise, M.; Milicic-Tang, A.; Taibi, M. The crystal field strength parameter and the maximum splitting of the 7F1 manifold of the Eu3+ ion in oxides. J. Alloys Compd. 1995, 228, 41–44. [Google Scholar] [CrossRef]
  39. Görller-Walrand, C.; Binnemans, K. Chapter 155 Rationalization of crystal-field parametrization. Handb. Phys. Chem. Rare Earths 1996, 23, 121–283. [Google Scholar] [CrossRef]
  40. Srivastava, A.M.; Brik, M.G.; Beers, W.W.; Cohen, W. The influence of nd0 transition metal cations on the Eu3+ asymmetry ratio R = I(5D07F2)/I(5D07F1) and crystal field splitting of 7F1 manifold in pyrochlore and zircon compounds. Opt. Mater. 2021, 114, 110931. [Google Scholar] [CrossRef]
  41. Görller-Walrand, C.; Fluyt, L.; Ceulemans, A.; Carnall, W.T. Magnetic dipole transitions as standards for Judd-Ofelt parametrization in lanthanide spectra. J. Chem. Phys. 1991, 95, 3099–3106. [Google Scholar] [CrossRef]
  42. Ćirić, A.; Stojadinović, S.; Brik, M.G.; Dramićanin, M.D. Judd-Ofelt parametrization from emission spectra: The case study of the Eu3+ 5D1 emitting level. Chem. Phys. 2020, 528, 110513. [Google Scholar] [CrossRef]
  43. Judd, B.R. Optical Absorption Intensities of Rare-Earth Ions. Phys. Rev. 1962, 127, 750–761. [Google Scholar] [CrossRef]
  44. Ofelt, G.S. Intensities of Crystal Spectra of Rare-Earth Ions. J. Chem. Phys. 1962, 37, 511–520. [Google Scholar] [CrossRef]
  45. Ćirić, A.; Stojadinović, S.; Dramićanin, M.D. An extension of the Judd-Ofelt theory to the field of lanthanide thermometry. J. Lumin. 2019, 216. [Google Scholar] [CrossRef]
  46. Babu, S.S.; Babu, P.; Jayasankar, C.K.; Sievers, W.; Tröster, T.; Wortmann, G. Optical absorption and photoluminescence studies of Eu3+-doped phosphate and fluorophosphate glasses. J. Lumin. 2007, 126, 109–120. [Google Scholar] [CrossRef]
  47. Suta, M.; Meijerink, A. A Theoretical Framework for Ratiometric Single Ion Luminescent Thermometers—Thermodynamic and Kinetic Guidelines for Optimized Performance. Adv. Theory Simul. 2020, 3, 2000176. [Google Scholar] [CrossRef]
  48. Hehlen, M.P.; Brik, M.G.; Krämer, K.W. 50th anniversary of the Judd–Ofelt theory: An experimentalist’s view of the formalism and its application. J. Lumin. 2013, 136, 221–239. [Google Scholar] [CrossRef]
  49. Görller-Walrand, C.; Binnemans, K. Chapter 167 Spectral intensities of f-f transitions. Handb. Phys. Chem. Rare Earths 1998, 25, 101–264. [Google Scholar]
  50. Babu, P.; Jayasankar, C.K. Optical spectroscopy of Eu3+ ions in lithium borate and lithium fluoroborate glasses. Phys. B Condens. Matter 2000, 279, 262–281. [Google Scholar] [CrossRef]
  51. Ćirić, A.; Stojadinović, S.; Sekulić, M.; Dramićanin, M.D. JOES: An application software for Judd-Ofelt analysis from Eu3+ emission spectra. J. Lumin. 2019, 205, 351–356. [Google Scholar] [CrossRef]
  52. Dramićanin, M.D. Sensing temperature via downshifting emissions of lanthanide-doped metal oxides and salts. A review. Methods Appl. Fluoresc. 2016, 4, 042001. [Google Scholar] [CrossRef] [PubMed] [Green Version]
  53. Brik, M.G.; Antic, Ž.M.; Vuković, K.; Dramićanin, M.D. Judd-Ofelt Analysis of Eu3+ Emission in TiO2 Anatase Nanoparticles. Mater. Trans. 2015, 56, 1416–1418. [Google Scholar] [CrossRef] [Green Version]
Figure 1. Comparison of the powder x-ray diffraction patterns of the YxLu1xNbO4:5%Eu (x = 0, 0.25, 0.5, 0.75, 1) samples with representative SEM images of YxLu1−xNbO4:5%Eu (x = 0, 0.5, 1) with a 10-micron bar.
Crystals 12 00427 g001
Figure 2. Luminescence spectra of YxLu1−xNbO4:Eu3+ (x = 0, 0.25, 0.5, 0.75, 1): (a) Excitation recorded by monitoring 612 nm normalized to 7F05L6; (b) Emission spectra of under 365 nm excitation and recorded with 300 g/mm, (c) Deconvolution of 5D07F1 peaks recorded under 1800 g/mm diffraction grating.
Crystals 12 00427 g002
Figure 3. (a) Positions of the emission peak maxima of YxLu1−xNbO4:Eu3+ (x = 0, 0.25, 0.5, 0.75, 1); (b) Energy difference (ΔE) between 5D07F1 (1) and (3), and corrected asymmetry ratio (Rcorr).
Crystals 12 00427 g003
Figure 4. The calculated refractive index values for YxLu1−xNbO4 (x = 0, 0.25, 0.5, 0.75, 1).
Crystals 12 00427 g004
Figure 5. Experimentally obtained Judd–Ofelt parameters and corresponding linear fits.
Crystals 12 00427 g005
Table 1. Structural parameters obtained by Rietveld refinement of XRD data for YNbO4:Eu3+ according to ICDD 01-083-1319, and for LuNbO4:Eu3+ according to ICDD 01-074-6538.
Ref. ParametersYNbO4:Eu3+ (C2/c)LuNbO4:Eu3+ (I2/a)
Crystallite size (Å)533(6)479(6)
Strain (%)0.08(2)0.11(2)
a (Å)7.62775(17)5.23879(13)
b (Å)10.9636(3)10.8447(3)
c (Å)5.30476(15)5.04724(12)
α (o)9090
β (o)138.4389(11)94.4267(13)
γ (o)9090
Rwp 110.28%10.25%
Rp 26.30%6.55%
Re 33.23%3.32%
GOF 43.18333.0895
1 Rwp—regression sum of weighted squared errors of fit; 2 Rp—regression sum of relative squared errors of fit; 3 Re—regression sum of relative errors of fit; 4 GOF—goodness of fit parameter.
Table 2. Calculated energy of Stark levels Y0.5Lu0.5NbO4:5%Eu.
LevelObserved Energy [cm−1]
7F00
7F1369
7F21200
7F31960
7F42999
7F53799
7F6N/A
5D017,204
5D118,921
5D221,402
5D323,810
5L625,253
5L726,008
5G2–626,420
5L827,100
5D4 + 5L927,473
5L1028,531
5H3,4,730,722
Table 3. Judd–Ofelt parameters of YxLu1−xNbO4:Eu3+, branching ratios (β), radiative lifetimes (τrad), emission cross-sections (σ), radiative transition probabilities (A), total radiative transition probabilities (AR), observed lifetime (τobs), non-radiative lifetime (τNR), and intrinsic quantum yield (ηint). Transitions 5D07F1,2,4 are abbreviated with MD, 2, and 4 in subscripts, respectively.
x00.250.500.751
Ω2∙1020 [cm2]6.756.887.377.417.48
Ω4∙1020 [cm2]2.692.912.973.012.95
βMD [%]1414141414
β2 [%]7373737373
β4 [%]1314141413
τrad [ms]0.7820.8590.9161.0271.134
σMD∙1021 [cm2]2.121.811.641.431.49
σ2∙1021 [cm2]9.969.409.719.018.87
σ4∙1021 [cm2]3.633.503.643.133.18
AMD [s−1]179163148133120
A2 [s−1]928838795705628
A4 [s−1]171164148136115
AR [s−1]127911641092974882
τobs [ms]0.6190.6430.6500.6500.652
τNR [ms]2.9702.5572.2381.7711.534
ηint [%]7975716357
Publisher’s Note: MDPI stays neutral with regard to jurisdictional claims in published maps and institutional affiliations.

