
Trifluoromethyl Substituted Derivatives of Pyrazoles as Materials for Photovoltaic and Electroluminescent Applications
 and
and
Abstract
:1. Introduction
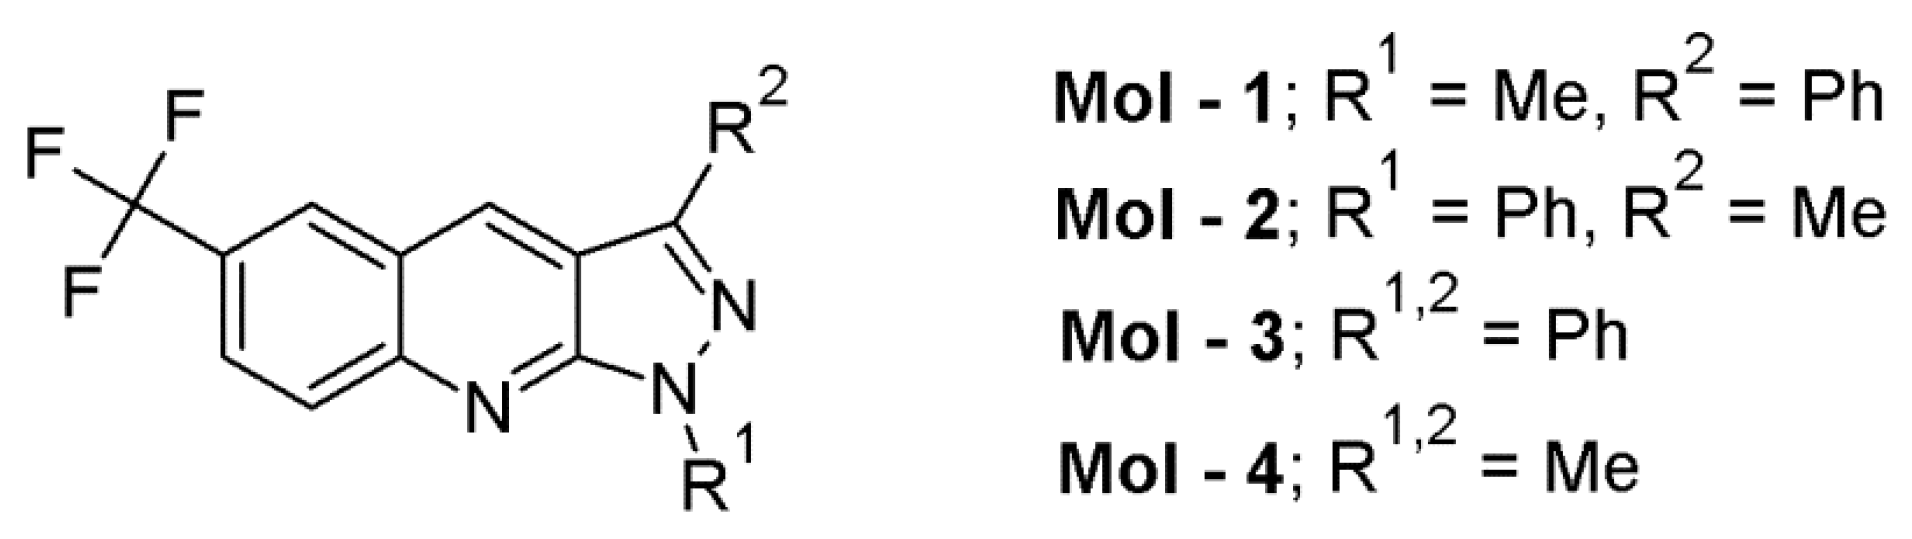
2. Materials
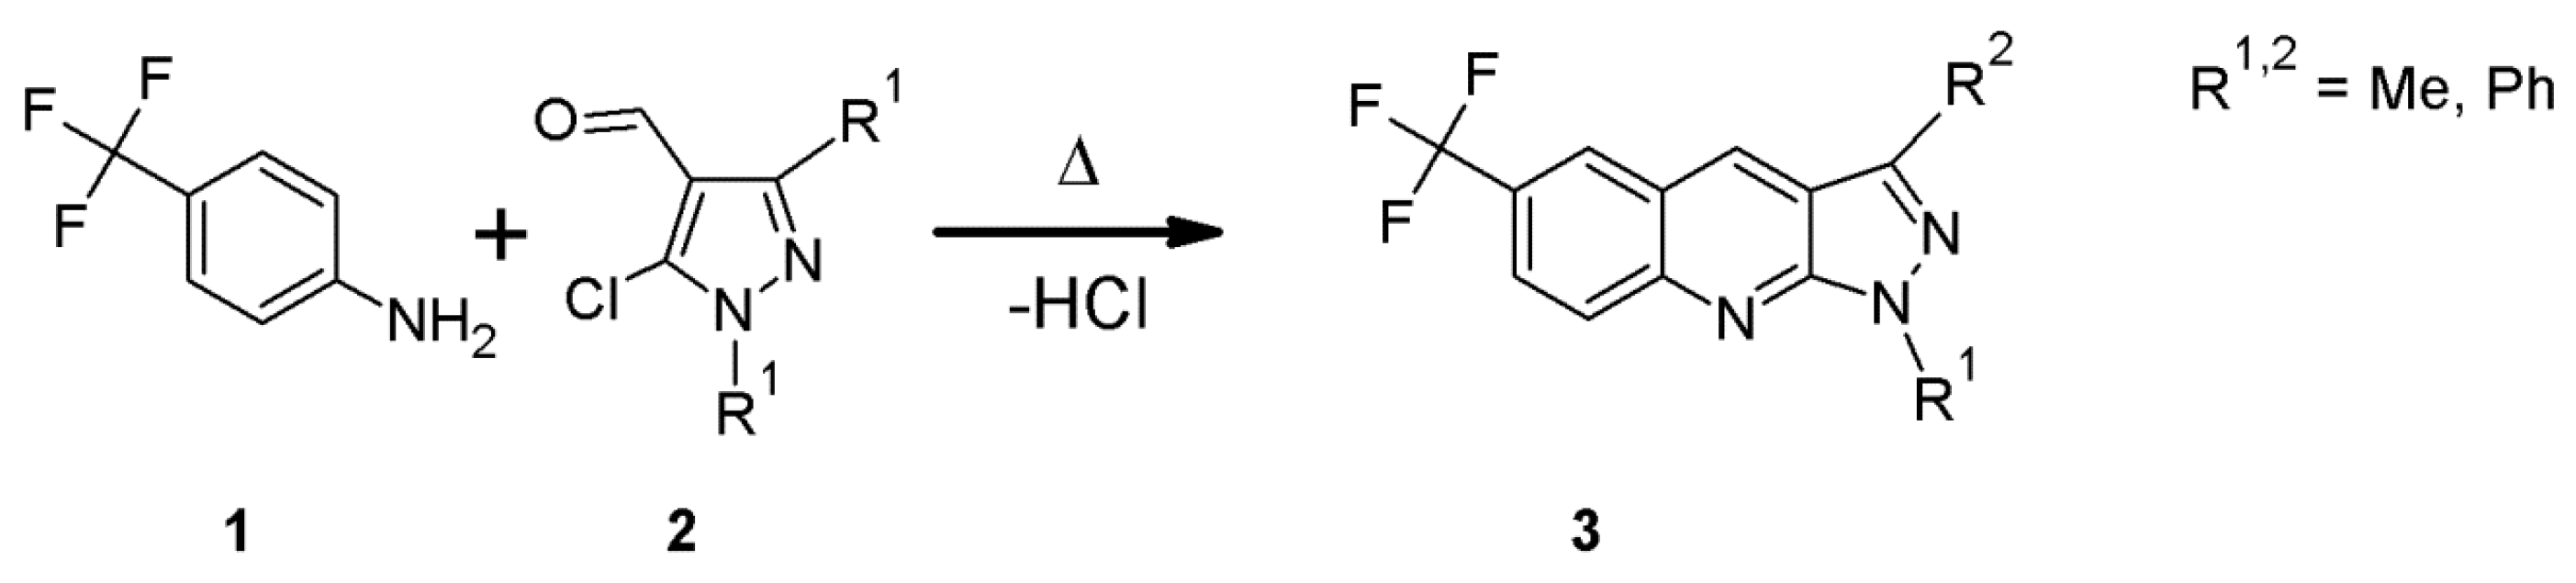
2.1. Synthesis
Synthetic Procedures
3. Equipment and Methods
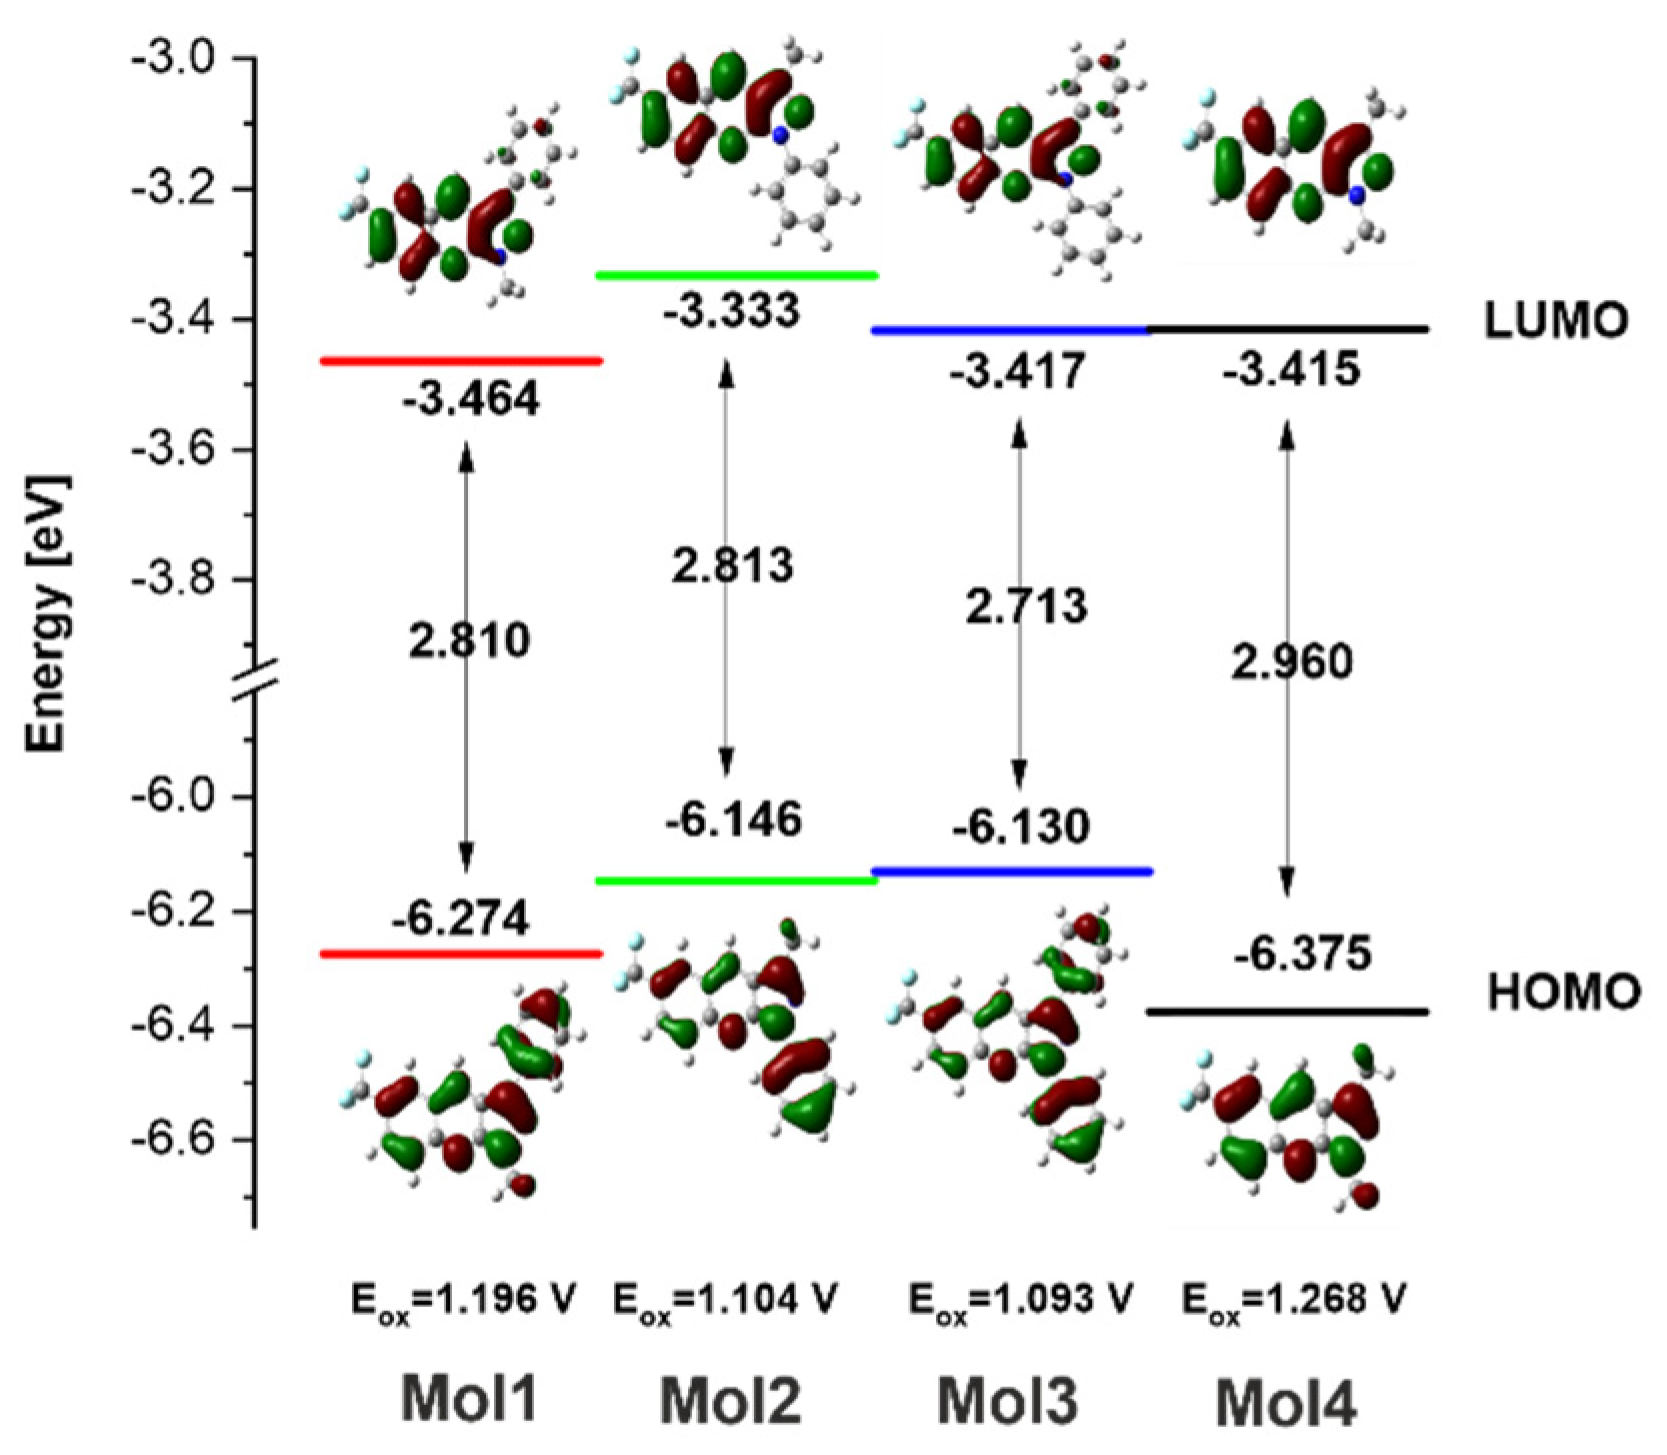
3.1. DFT Calculation
3.2. Spectral and Time Resolved Measurements
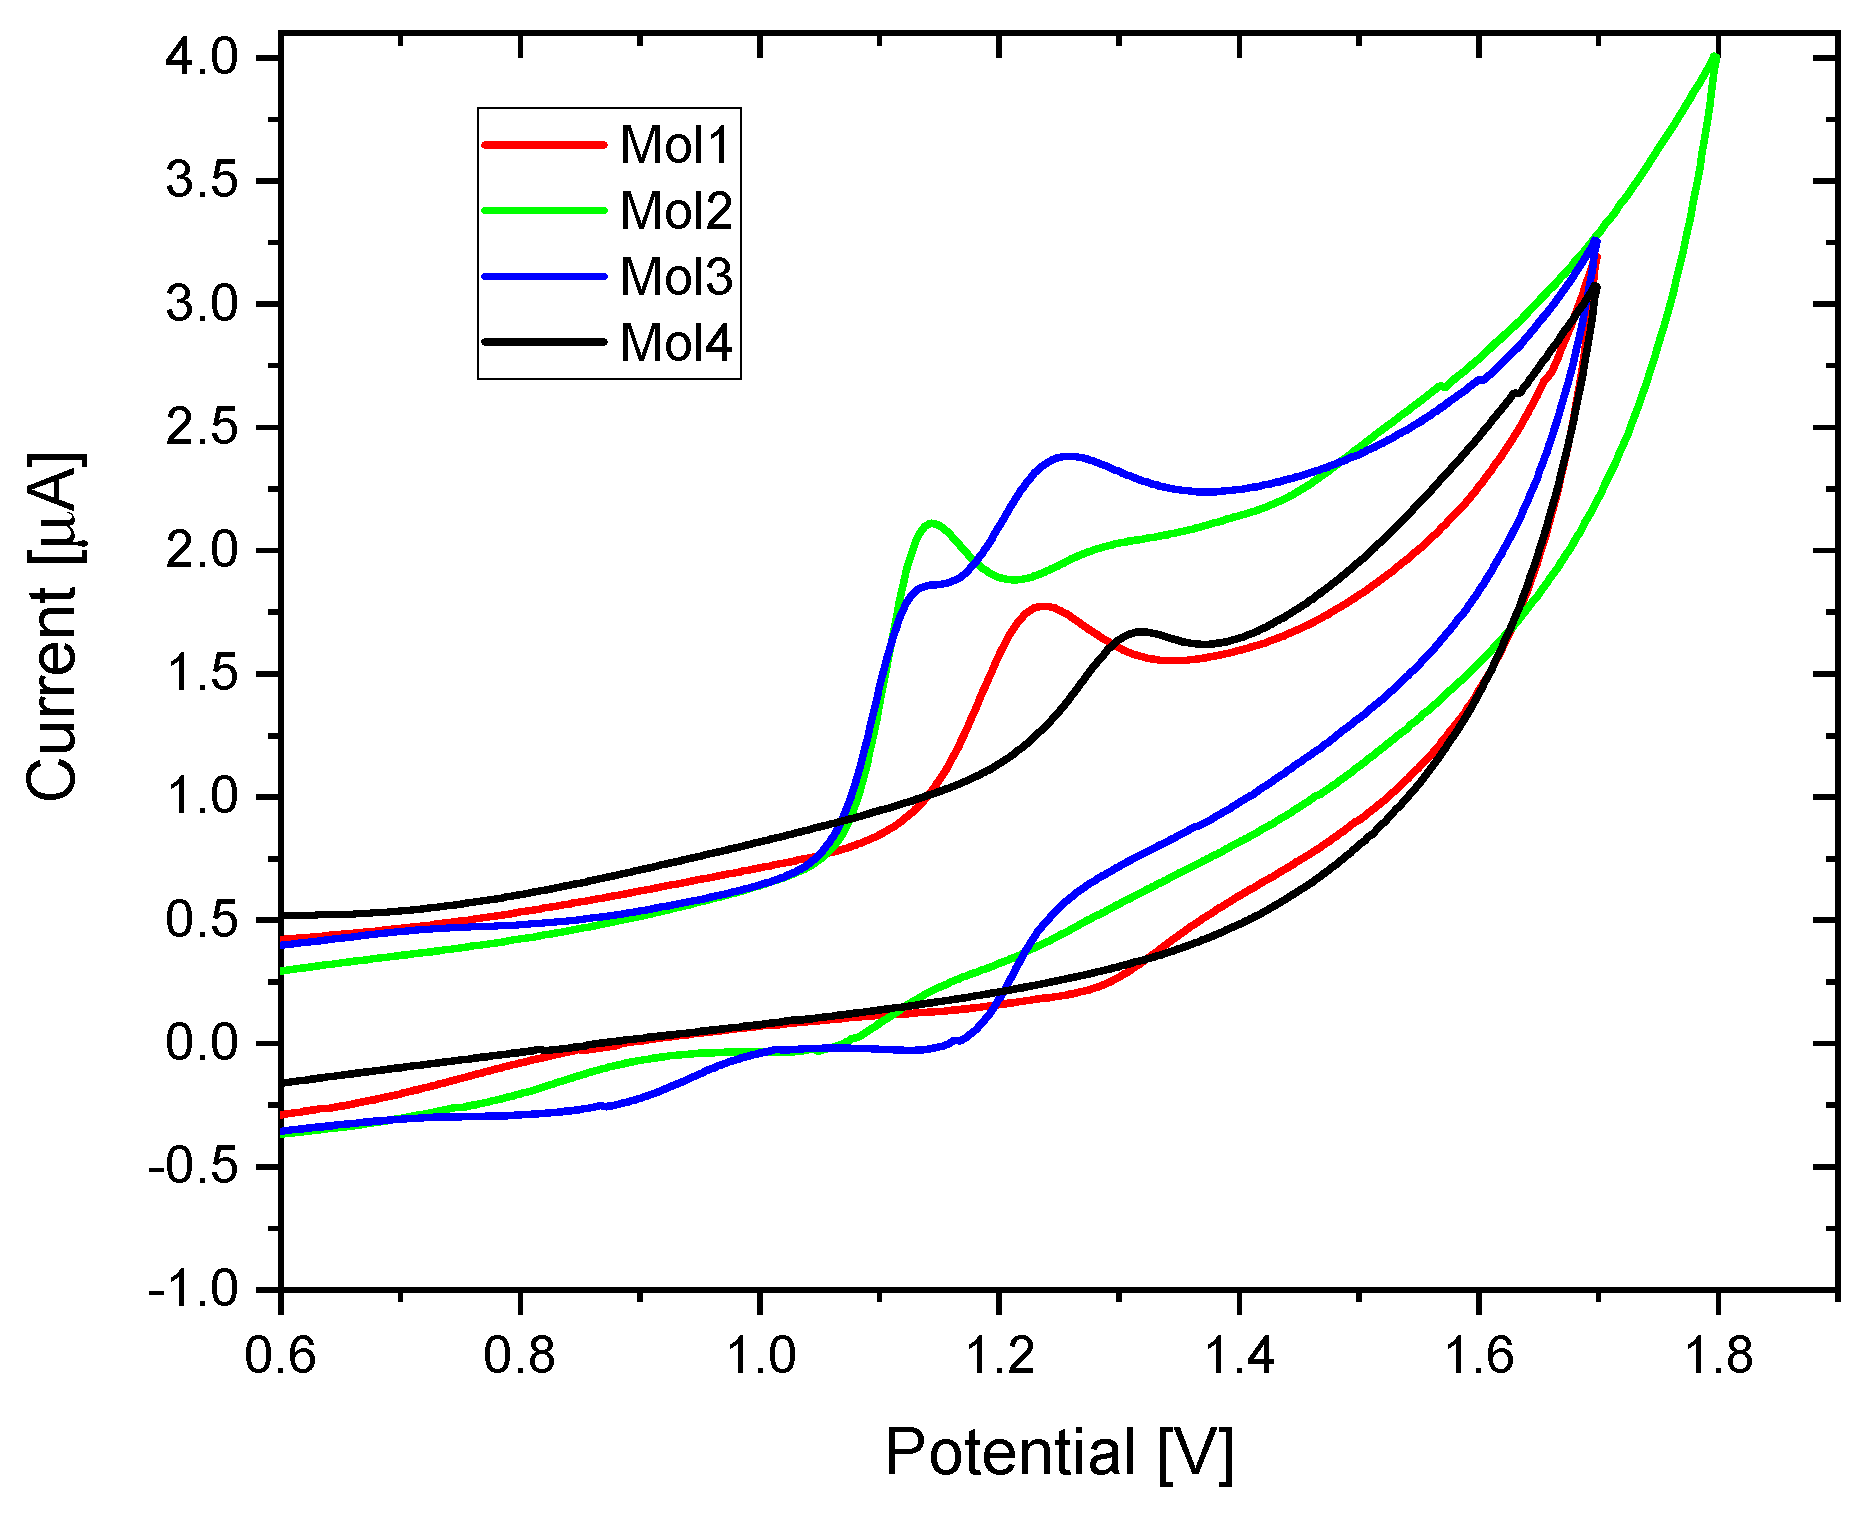
3.3. Electrochemical Measurements
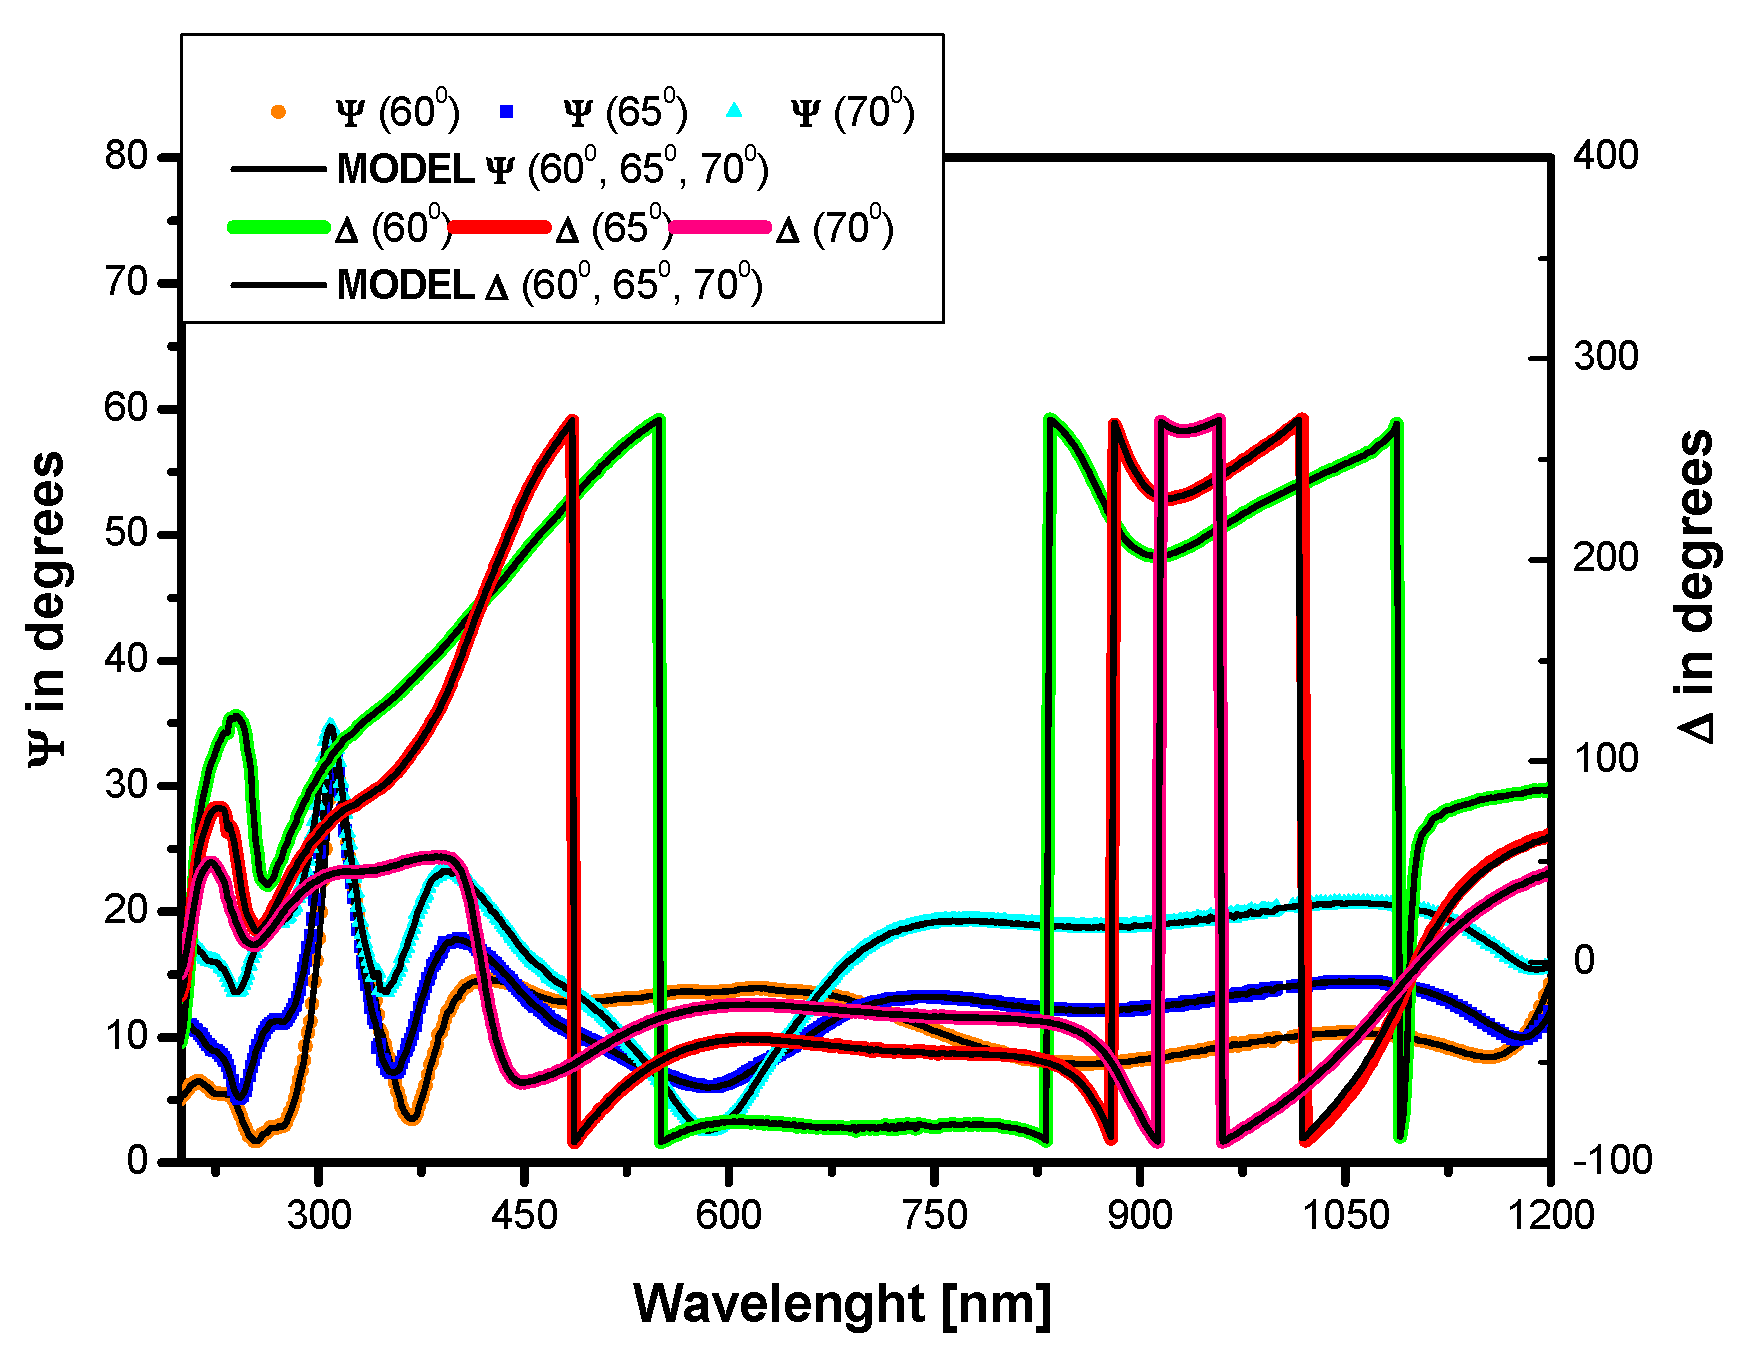
3.4. Ellipsometry
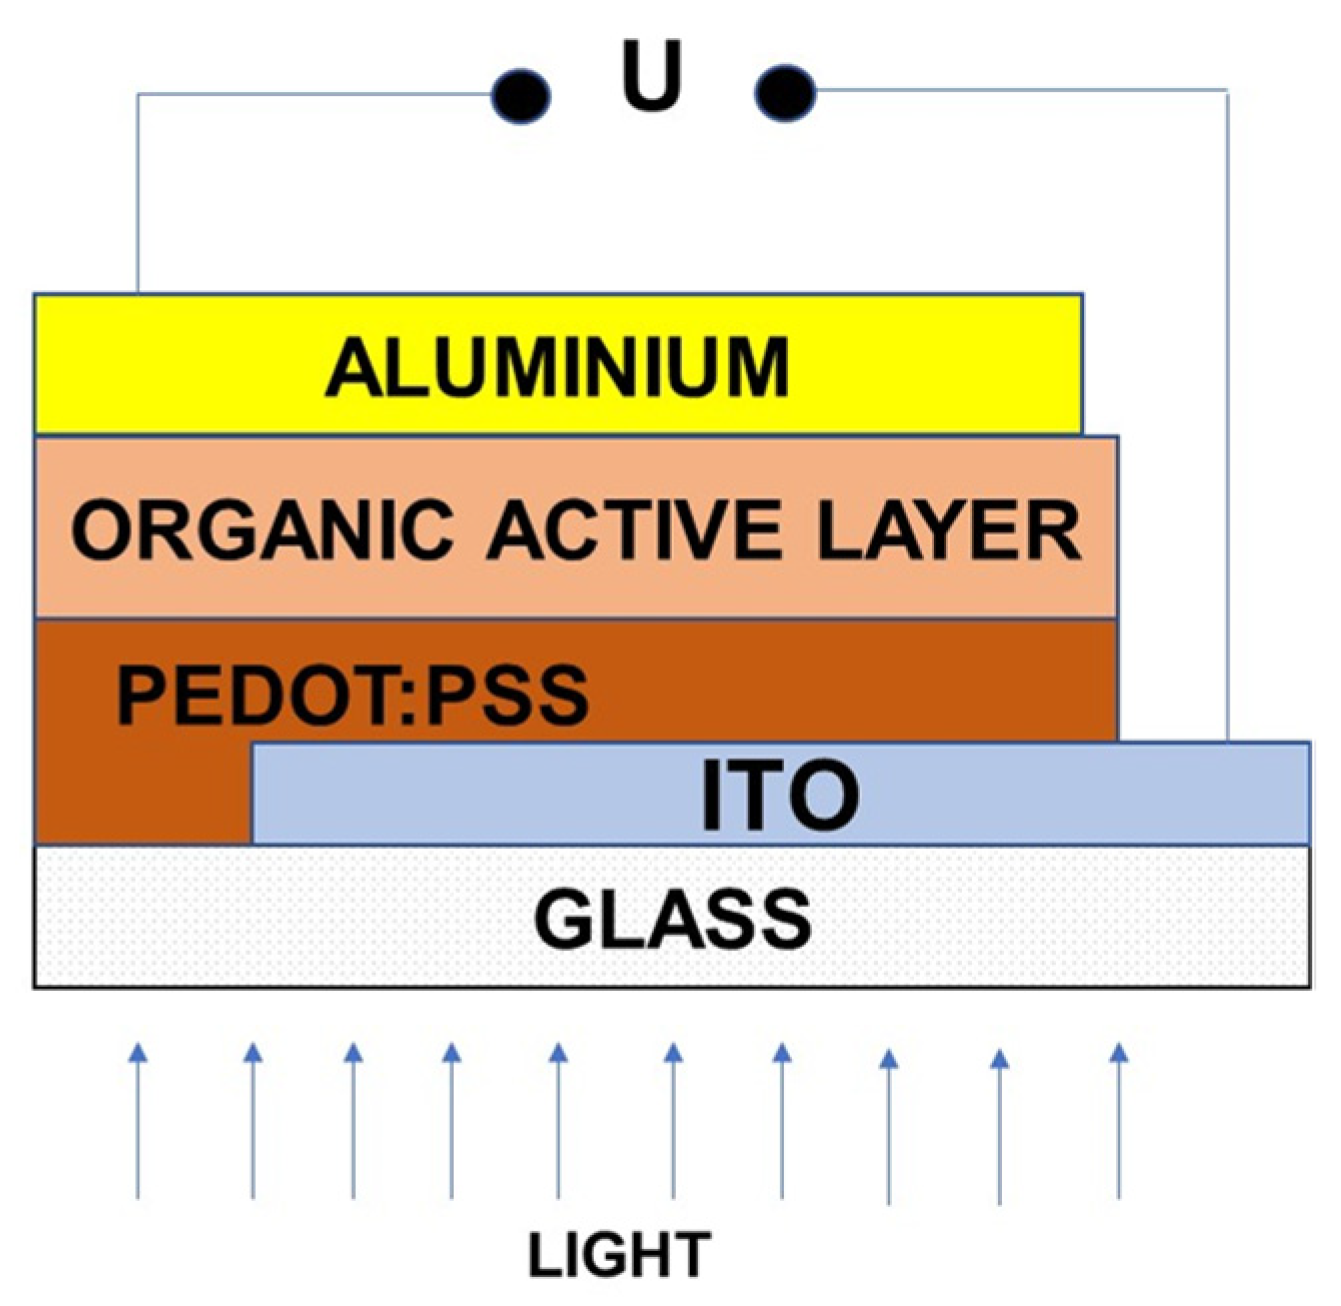
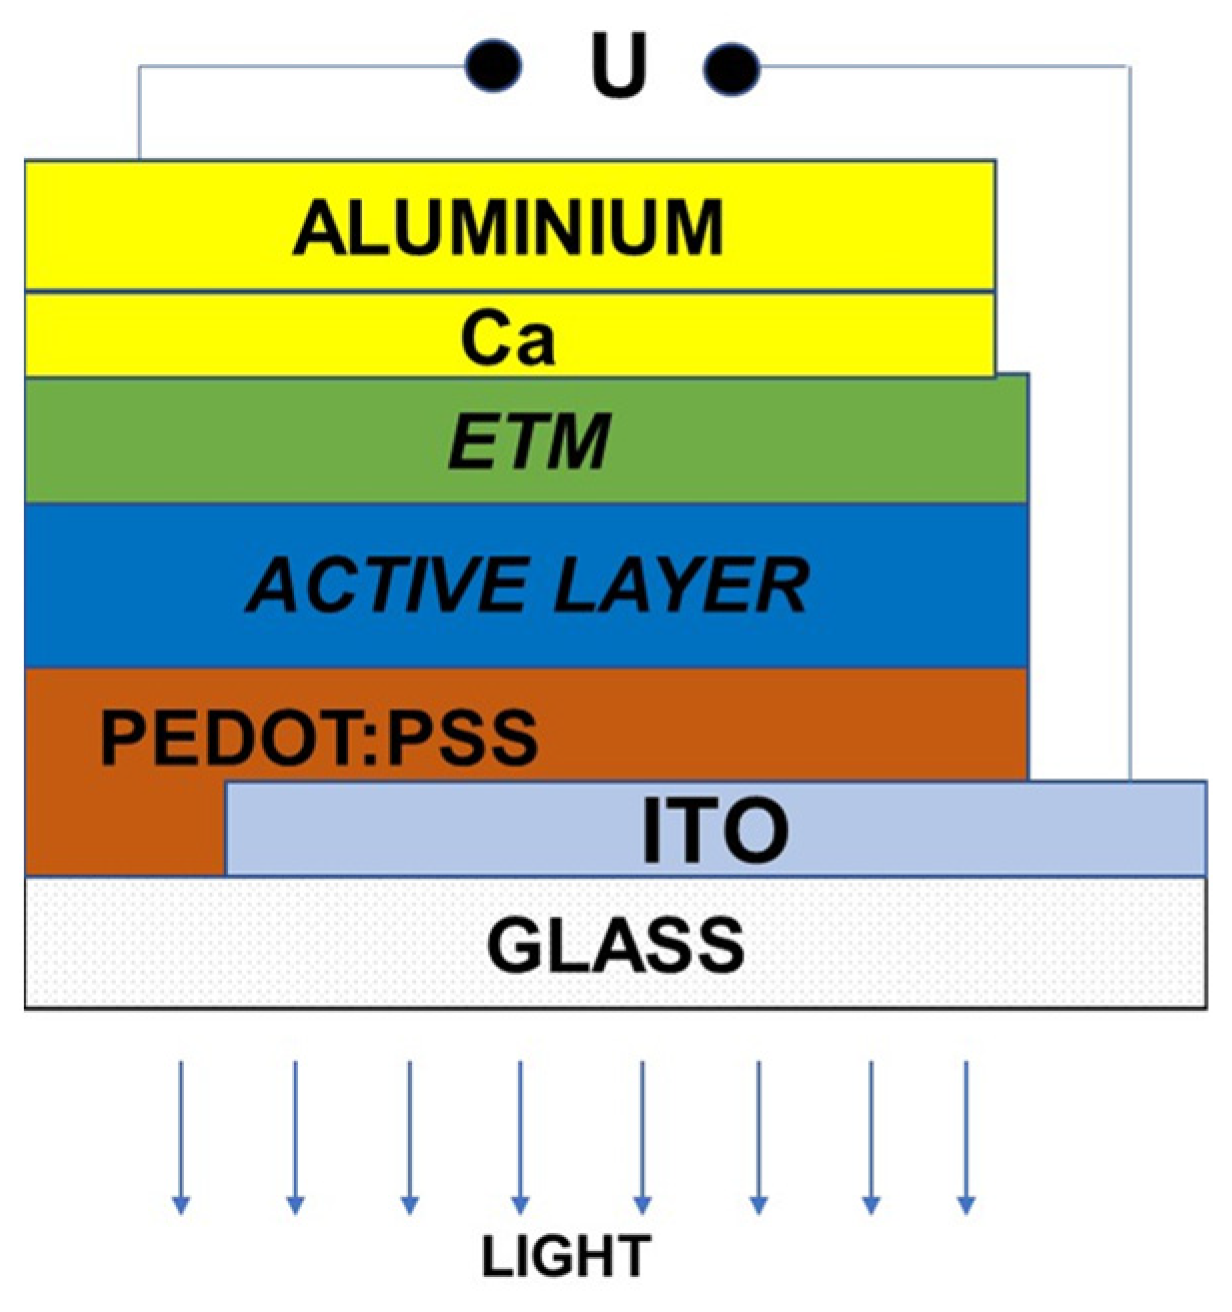
4. Solar Cells and OLEDs Fabrications
5. Results and Discussion
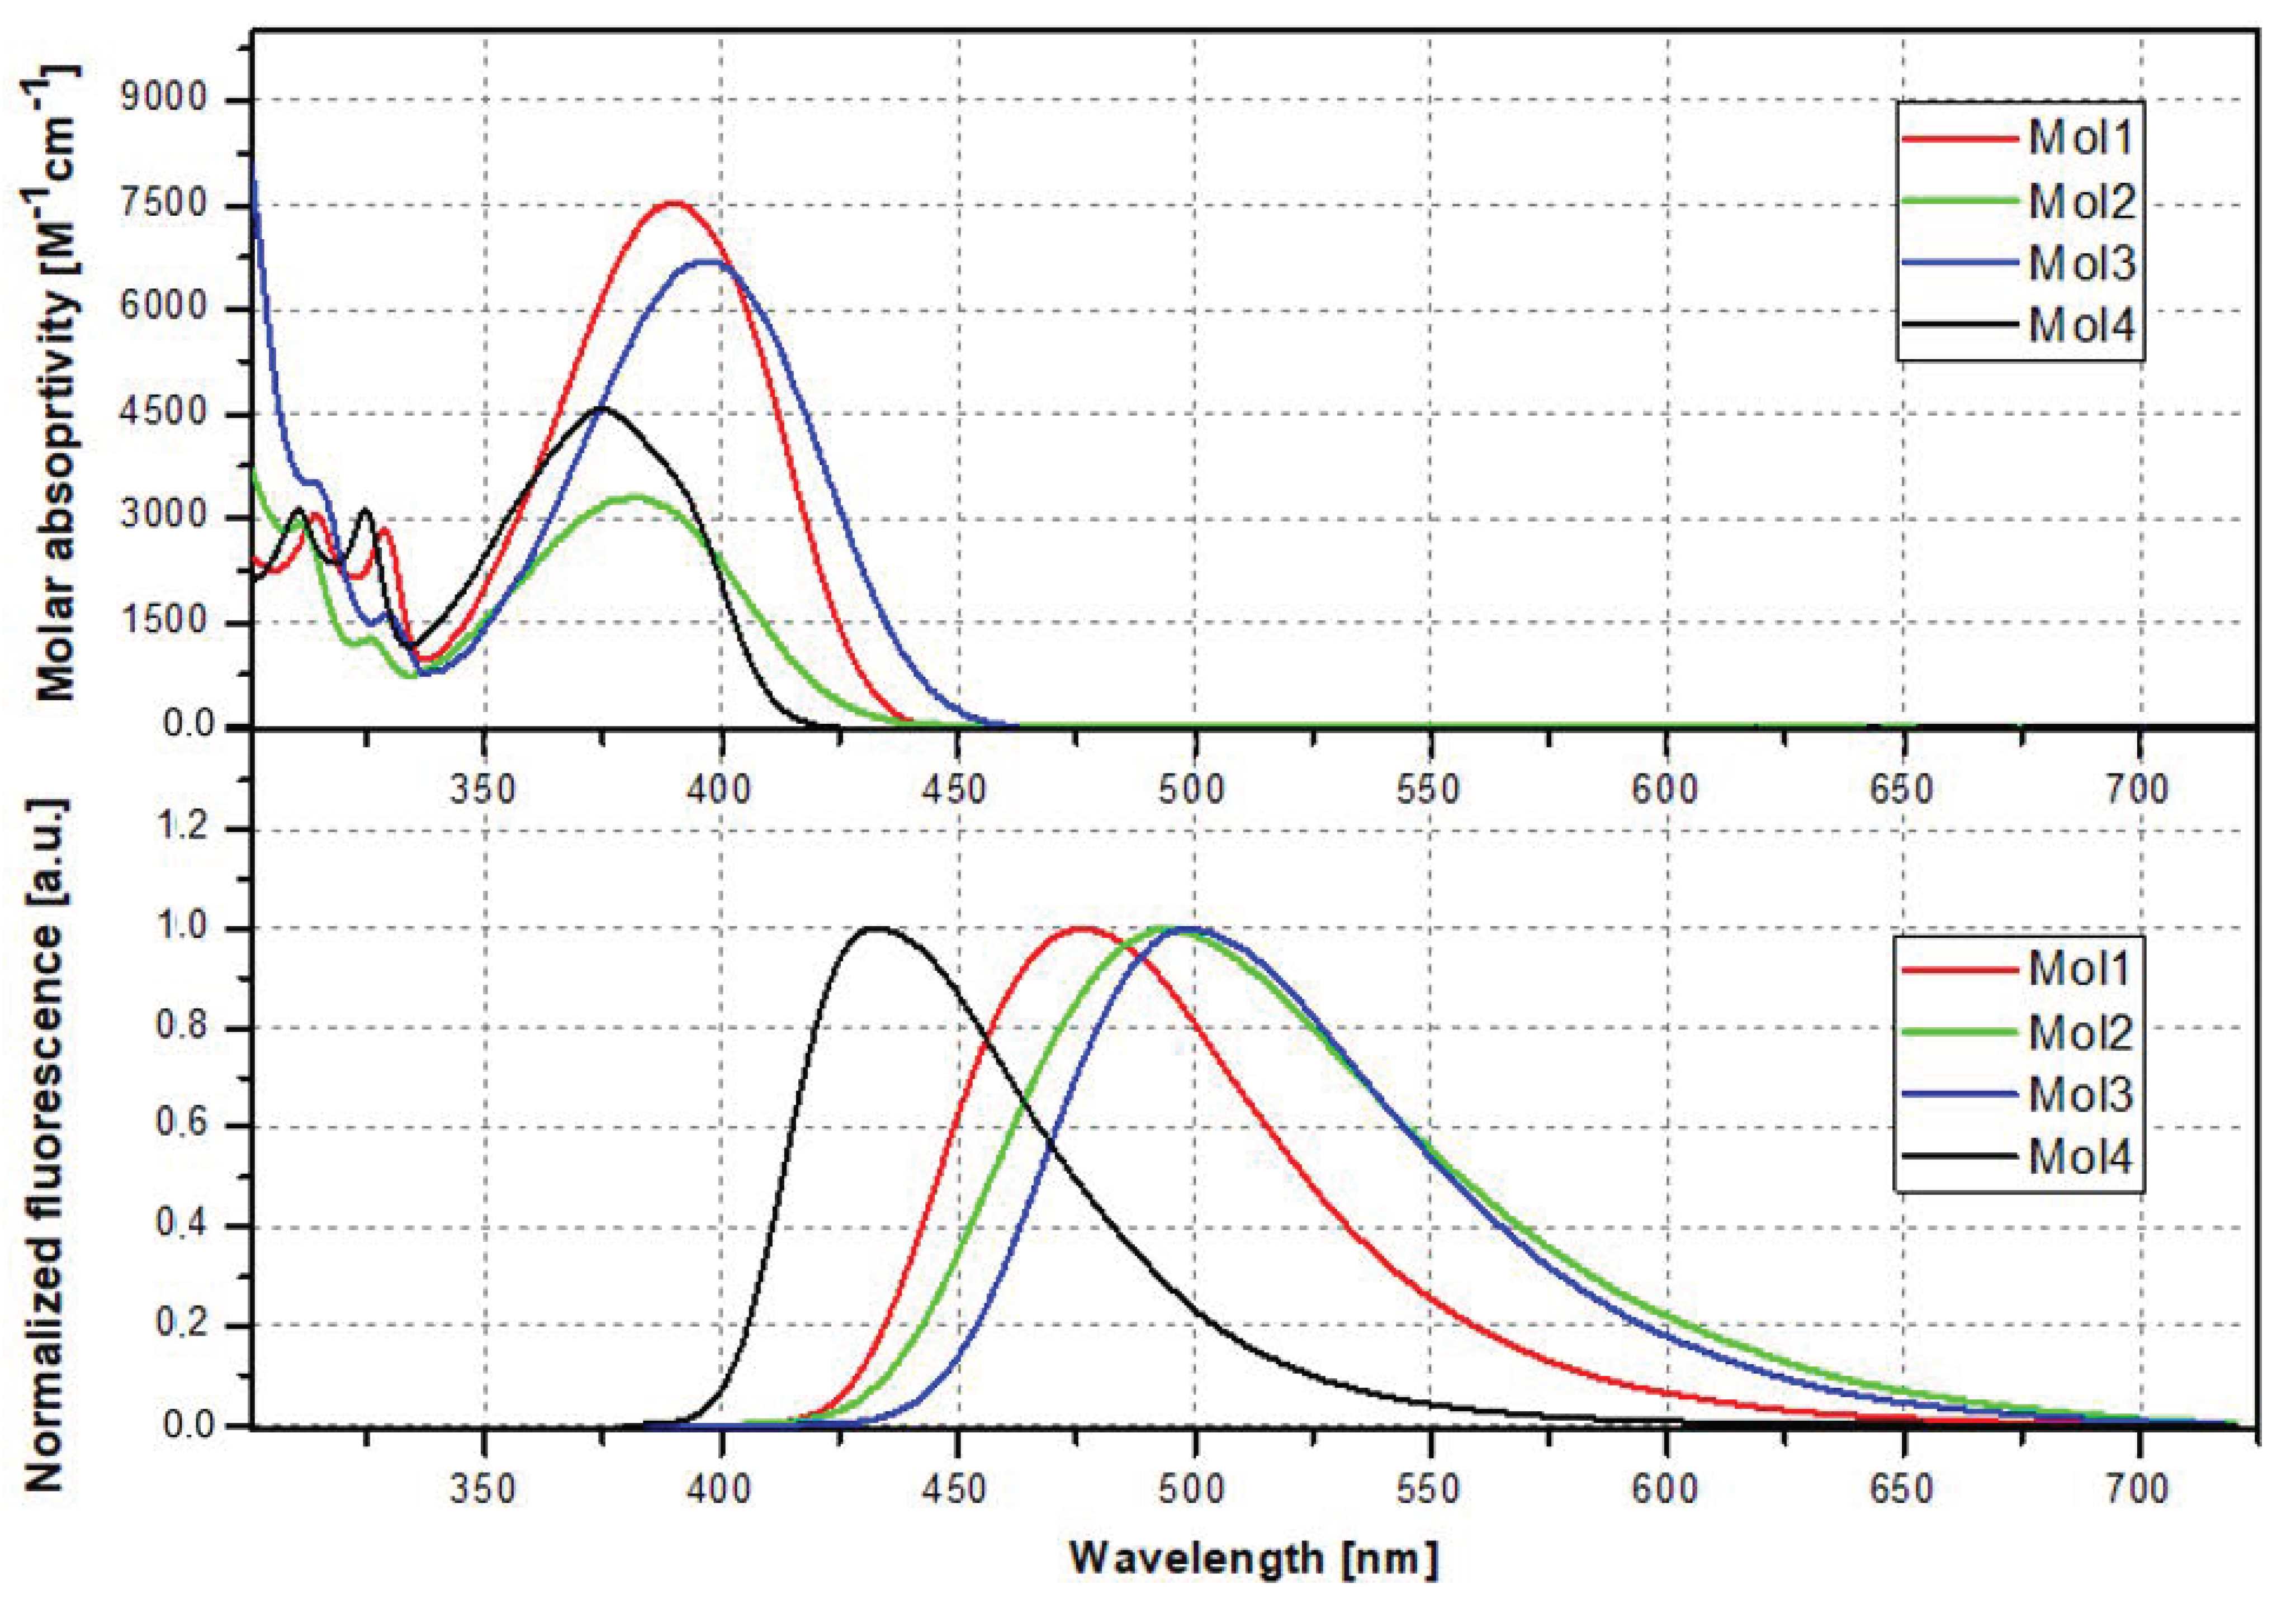
5.1. Photophysical Properties
5.2. Electrochemistry
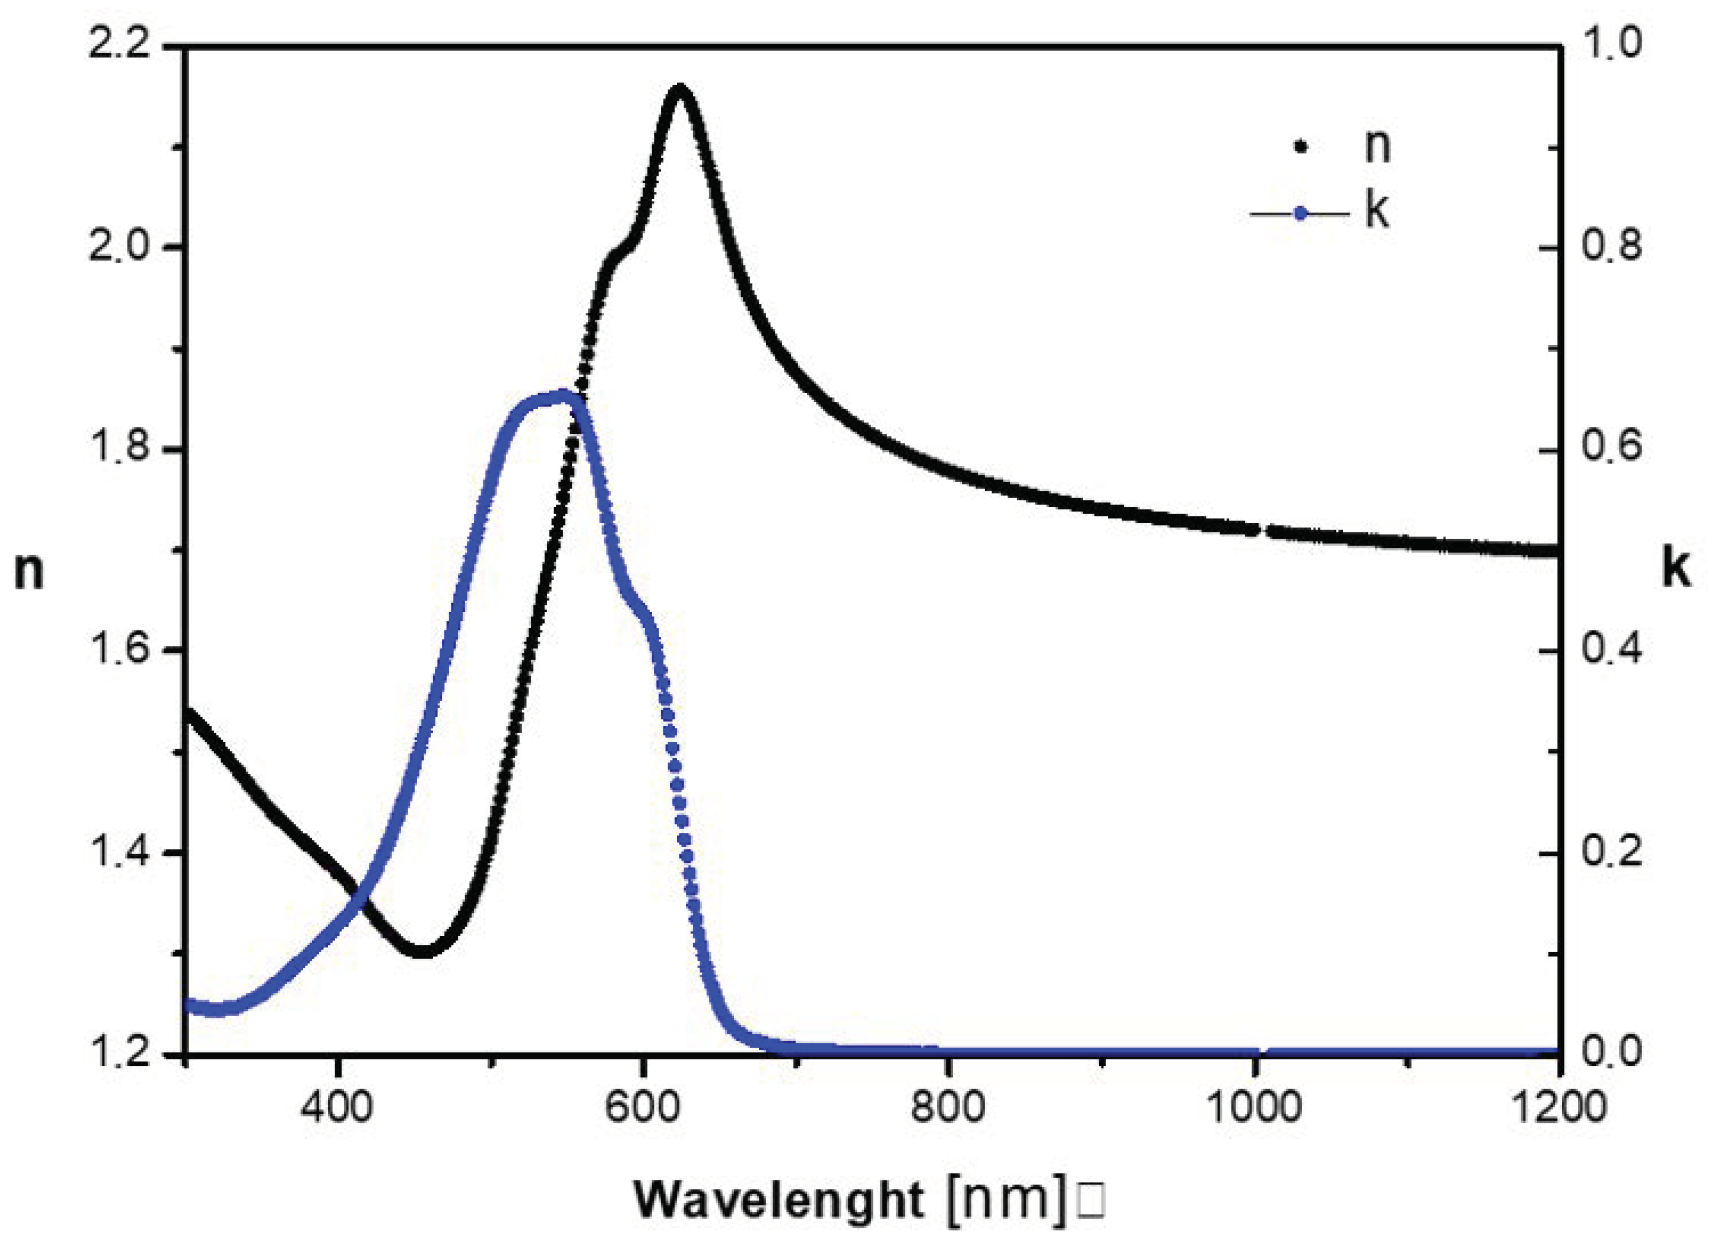
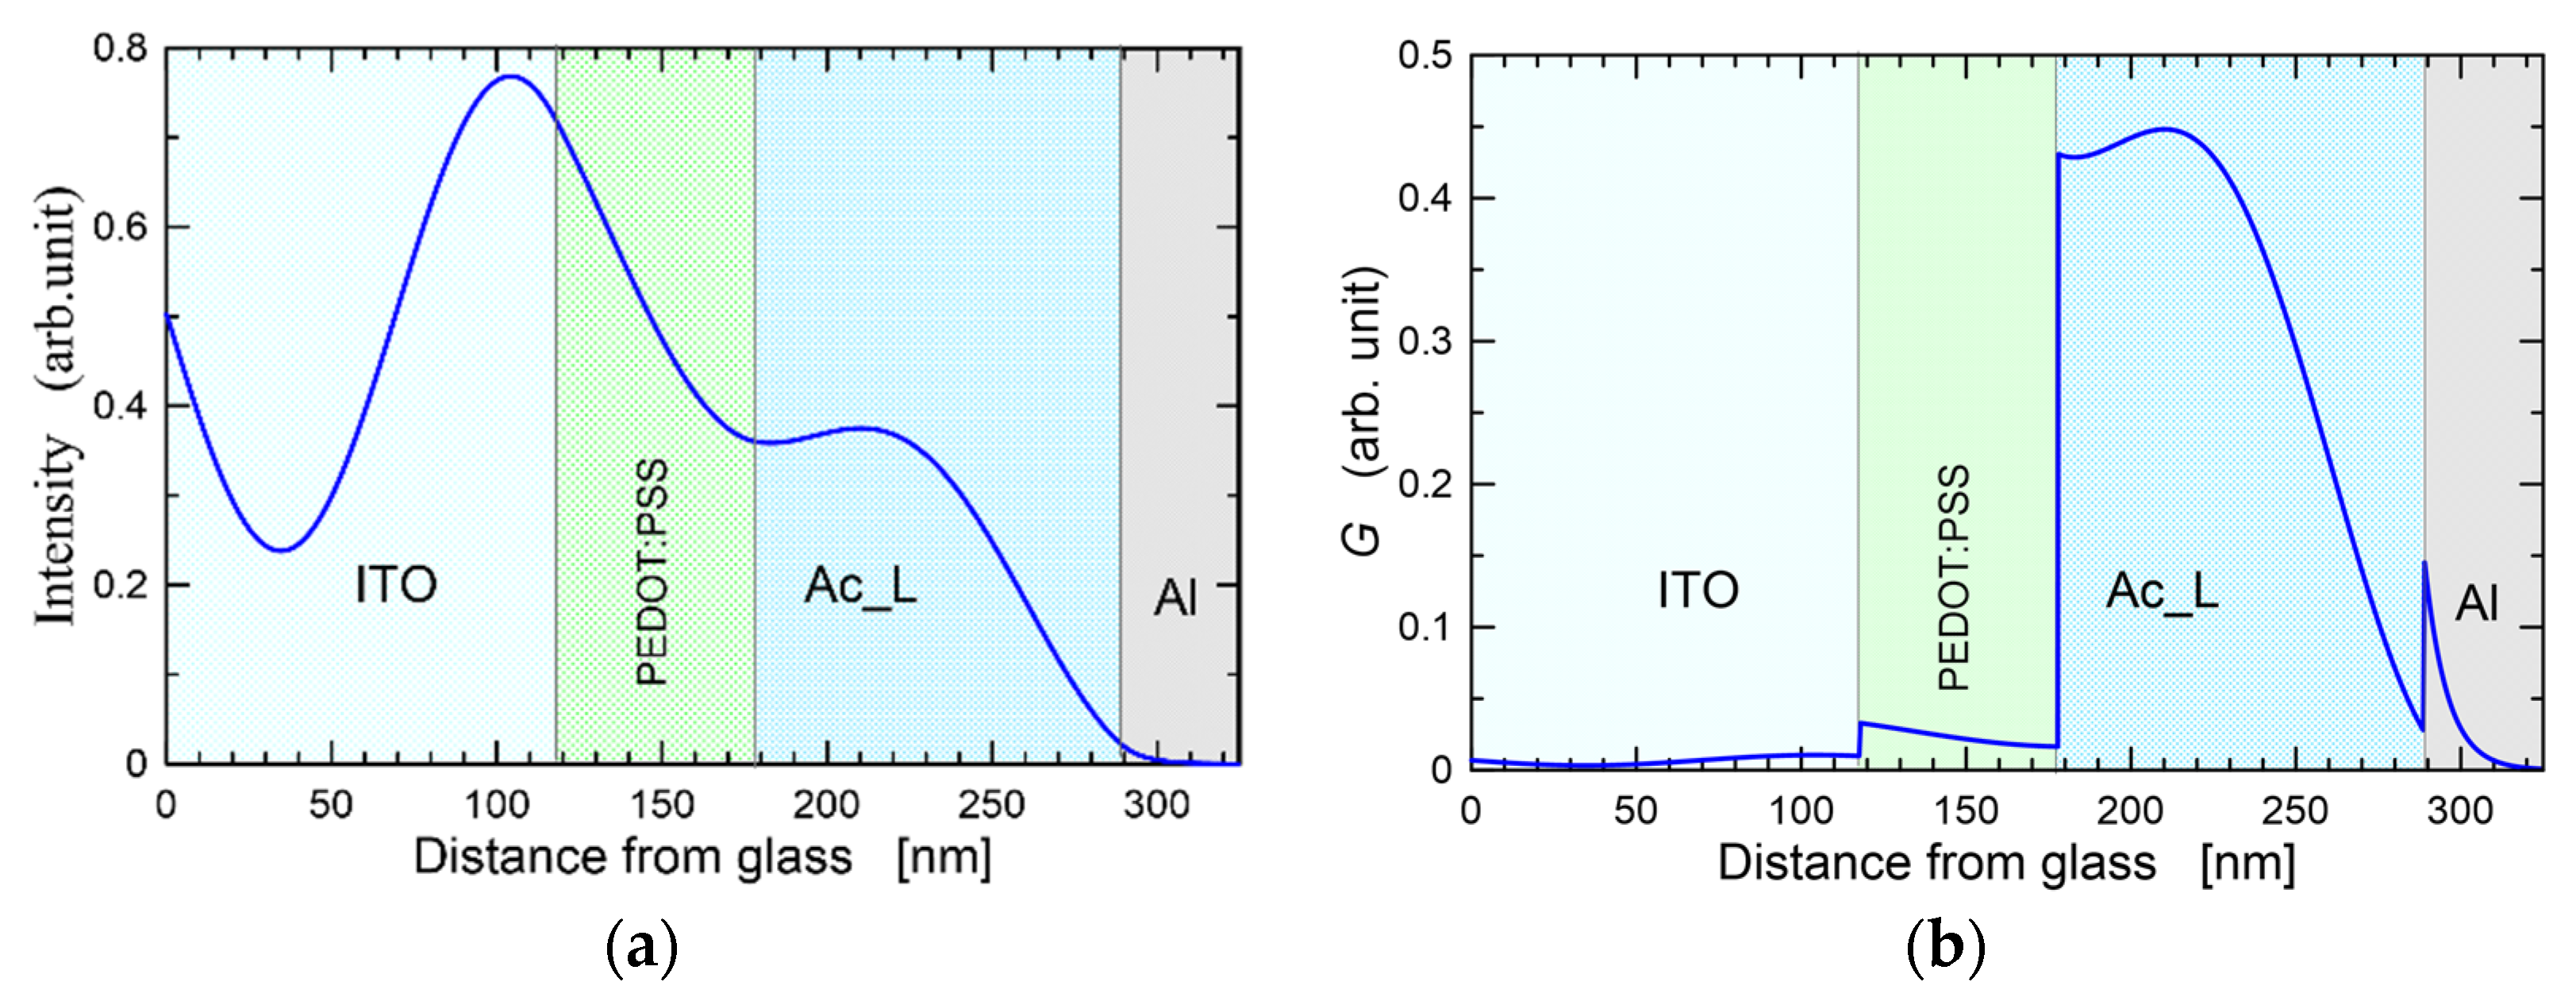
5.3. Complex Refractive Index and Film Thickness
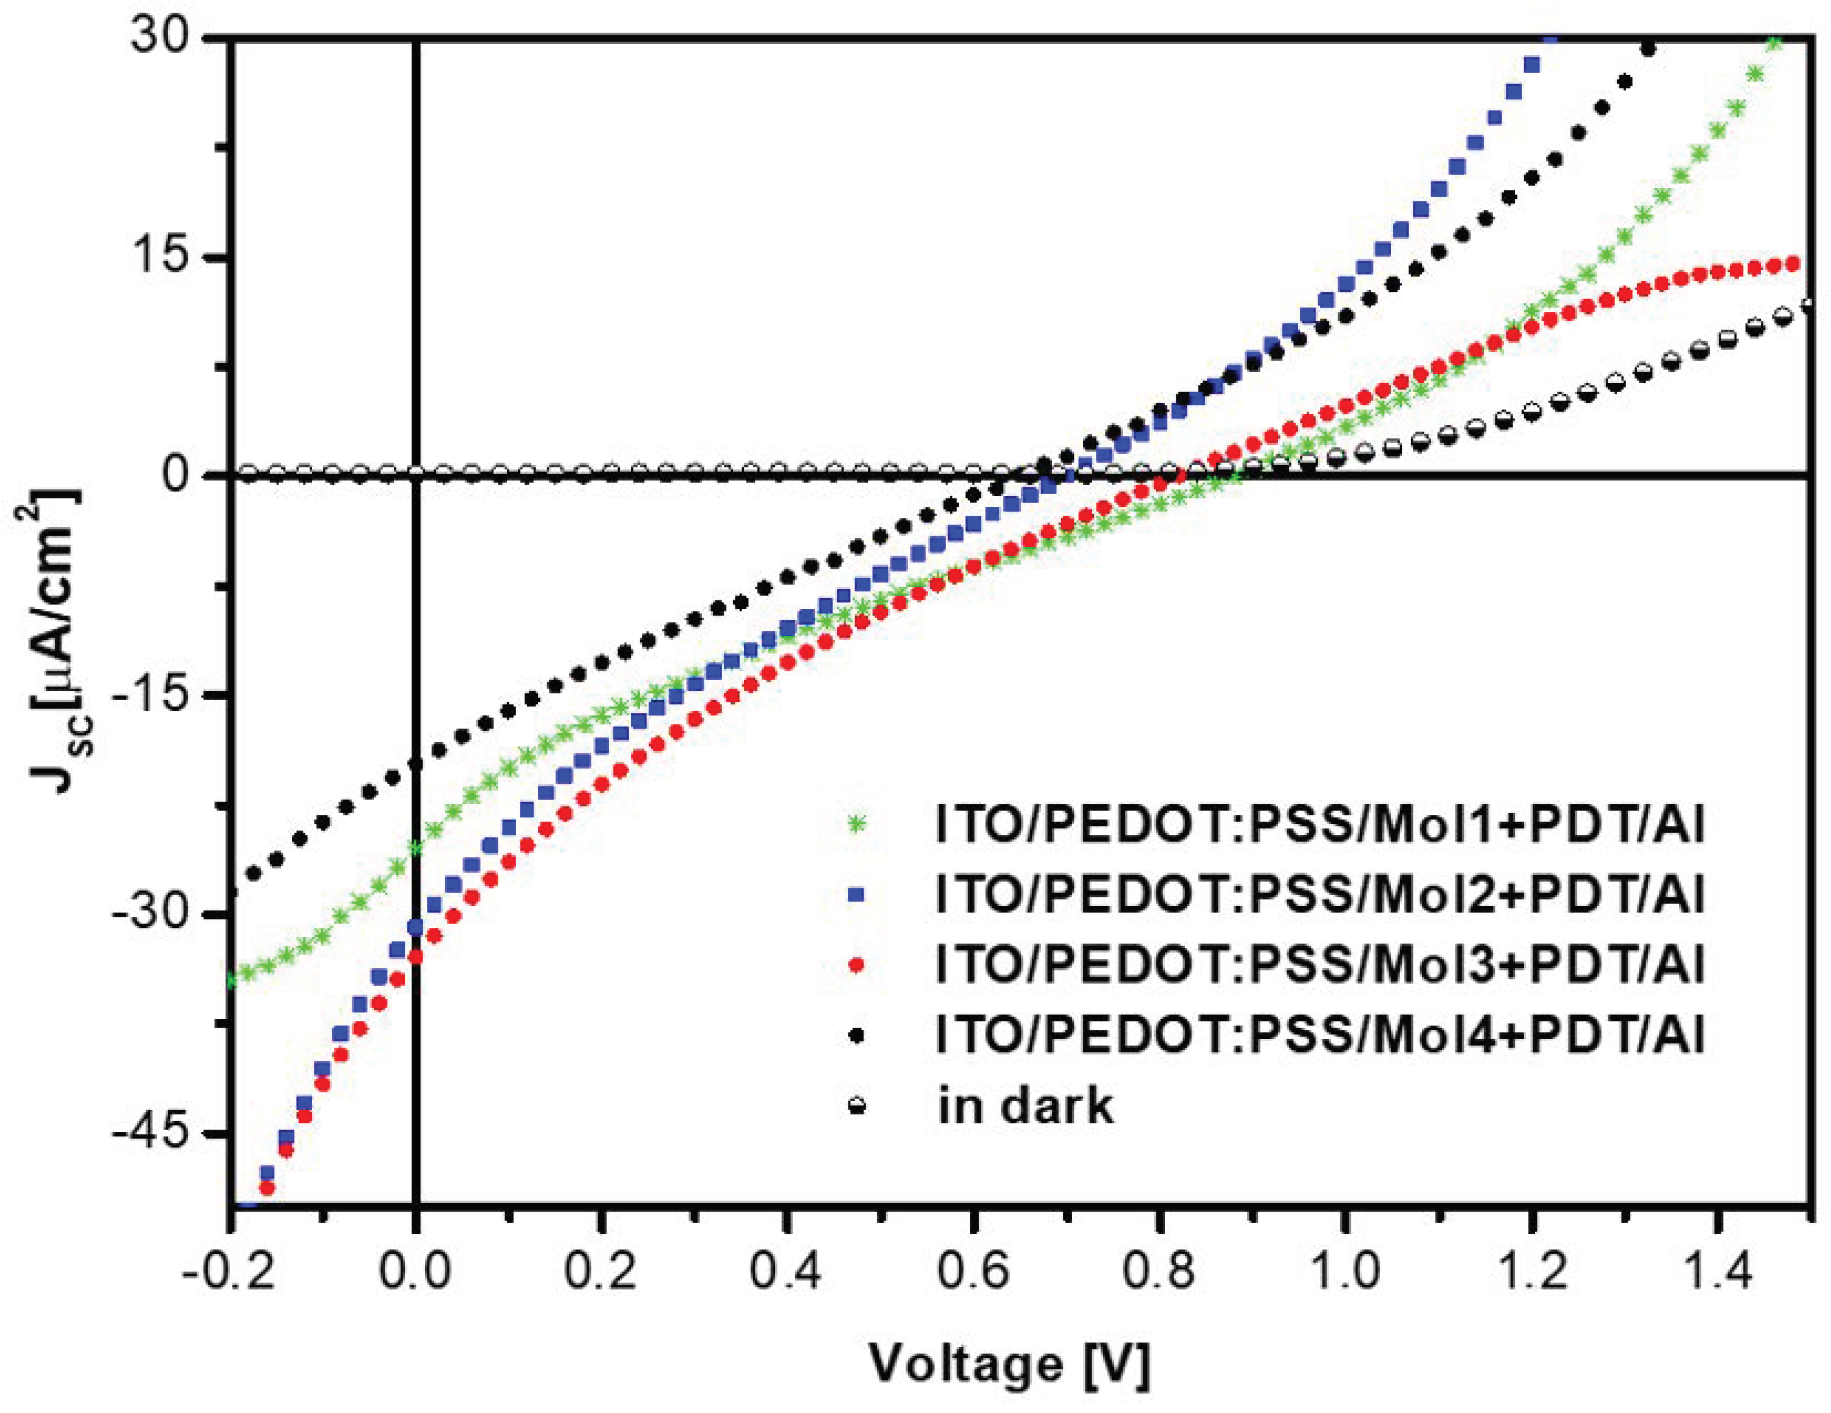
5.4. OPV Devices
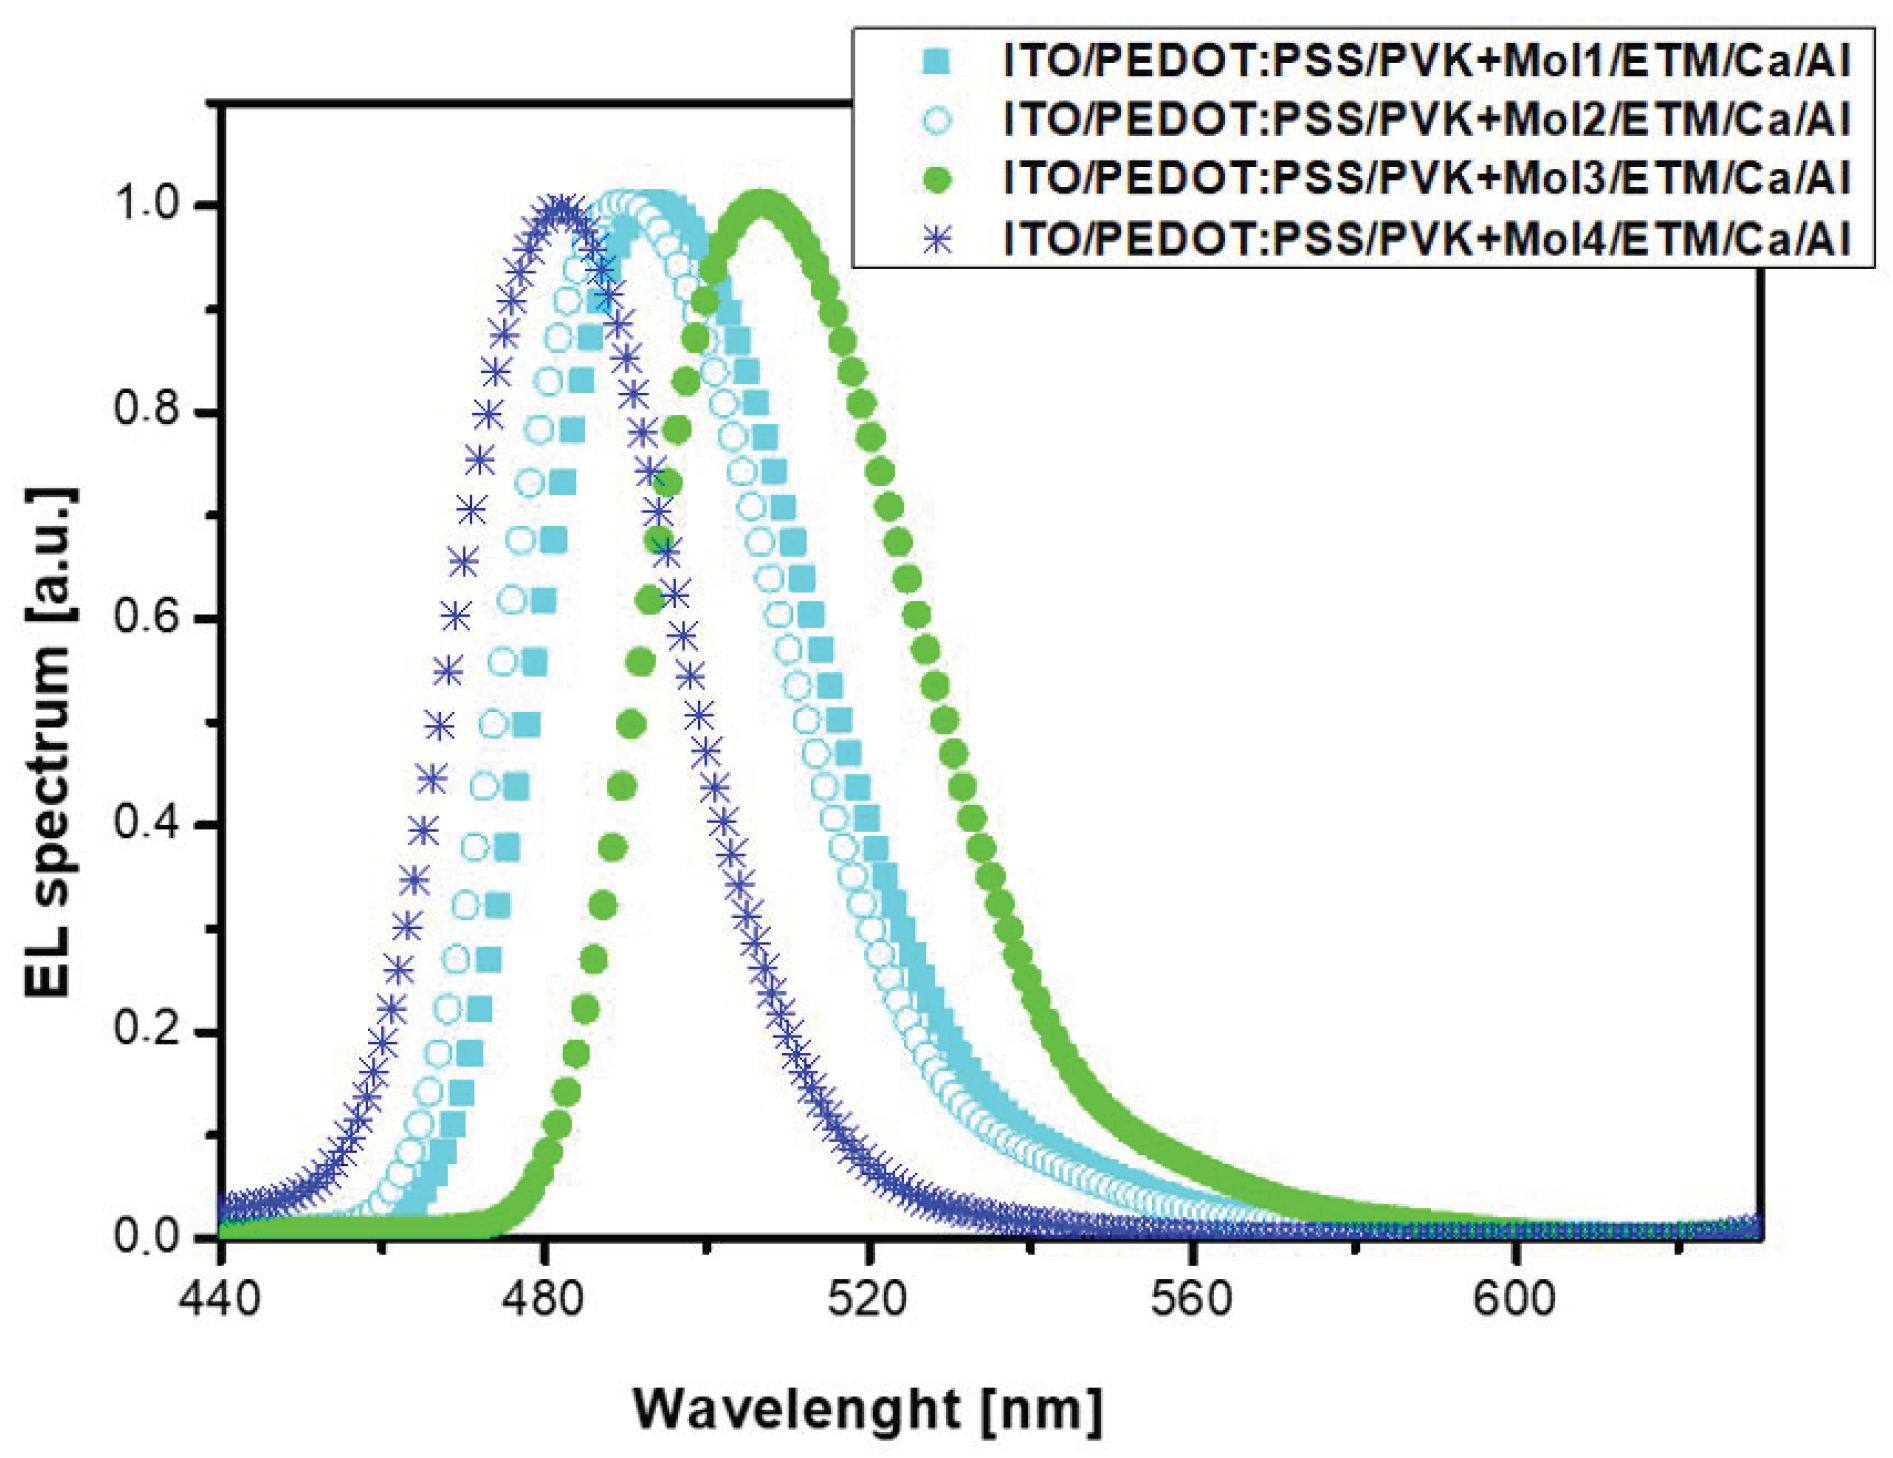
5.5. OLED Characterization
6. Conclusions
Supplementary Materials
Author Contributions
Funding
Institutional Review Board Statement
Informed Consent Statement
Data Availability Statement
Conflicts of Interest
References
- Vogelbaum, H.S.; Sauve, G. Recently developed high-efficiency organic photoactive materials for printable photovoltaic cells: A mini review. Synth. Met. 2017, 223, 107–121. [Google Scholar] [CrossRef] [Green Version]
- Paterson, A.F.; Singh, S.; Fallon, K.J.; Hodsden, T.; Han, Y.; Schroeder, B.C.; Bronstein, H.; Heeney, M.; McCulloch, I.; Anthooulos, T.D. Recent Progress in High-Mobility Organic Transistors: A Reality Check. Adv. Mater. 2018, 30, 1801079. [Google Scholar] [CrossRef] [PubMed]
- Lee, J.-H.; Chen, C.-H.; Lee, P.-H.; Lin, H.-Y.; Leung, M.-K.; Chiu, T.-L.; Lin, C.-F. Blue organic light-emitting diodes: Current status, challenges, and future outlook. J. Mater. Chem. C 2019, 7, 5874–5888. [Google Scholar] [CrossRef]
- Semeniuk, M.; Yi, Z.; Poursorkhabi, V.; Tjong, J.; Jaffer, S.; Lu, Z.-H.; Sain, M. Future Percpectivies and Review on Organic Carbon Dots in Electronic Applications. ACS Nano 2019, 13, 6224–6255. [Google Scholar] [CrossRef]
- Kaur, G.; Adhikari, R.; Cass, P.; Bown, M.; Gunatillake, P. Electrically conductive polymers and composites for biomedical applications. RSC Adv. 2015, 5, 37553–37567. [Google Scholar] [CrossRef]
- Zhu, M.; Meng, K.; Xu, C.; Zhang, J.; Ni, G. Lateral photovoltaic effect in ITO/PEDOT:PSS/MEH-PPV:PCBM?Al organic photovoltaic cells. Org. Electron. 2020, 78, 105585. [Google Scholar] [CrossRef]
- Popoola, I.K.; Gondal, M.A.; Qahtan, T.F. Recent progress in flexible perovskite solar cells: Materials, mechanical tolerance and stability. Renew. Sustain. Energy Rev. 2018, 82, 3127–3151. [Google Scholar] [CrossRef]
- Olalerua, S.A.; Kirui, J.K.; Wamwangi, D.; Roro, K.T.; Mwakikunga, B. Perovskite solar cells: The new epoch in photovoltaics. Sol. Energy 2020, 196, 295–309. [Google Scholar] [CrossRef]
- Torabi, N.; Behjat, A.; Zhou, Y.; Docampo, P.; Stoddard, R.J.; Hillhouse, H.W.; Ameri, T. Progress and challenges in perovskite photovoltaics from single- to multi-junction cells. Mater. Today Energy 2019, 12, 70–94. [Google Scholar] [CrossRef]
- Krebs, F.C. Polymer Photovoltaics A Practical Approach; Society of Photo-Optical Instrumentation Engineers (SPIE) Press: Bellingham, WA, USA, 2008. [Google Scholar]
- Ganesamoorthy, R.; Sathiyan, G.; Sakthivel, P. Review: Fullerene based acceptors for efficient bulk heterojunction organic solar cell applications. Sol. Energy Mater. Sol. Cells 2017, 161, 102–148. [Google Scholar] [CrossRef]
- Halls, J.J.M.; Arias, A.C.; MacKenzie, J.D.; Wu, W.; Inbasekaran, M.; Woo, E.P.; Friend, R.H. Photodiodes Based on Polyfluorene Composities: Influence of Morphology. Adv. Mater. 2000, 12, 498–502. [Google Scholar] [CrossRef]
- Zhennan, G.; Jiuxin, Q.; Xihuang, Z.; Yongqing, W. Buckminsterfulleren C60: Synthesis, spectroscopic characterization and structure analysis. J. Phys. Chem. 1991, 95, 9615–9618. [Google Scholar] [CrossRef]
- Krätschmer, W.; Lamb, L.D.; Fositropoulos, K.; Huffman, D.R. Solid C60: A new form of carbon. Nature 1990, 347, 354–358. [Google Scholar] [CrossRef]
- Liu, Z.; Bao, C.; Xu, X.; Lei, G.; Gao, H.; Peng, Q.; Liu, Y. Tuning terminal units to improve the photovoltaic performance of small molecules based on a large planar fused ring core in solution-processed organic solar cells. Org. Electron. 2020, 78, 105566. [Google Scholar] [CrossRef]
- Saunders, B.R.; Turner, M.L. Nanoparticle-polymer photovoltaic cells. Adv. Colloid Interface Sci. 2008, 138, 1–23. [Google Scholar] [CrossRef]
- Sariciftci, N.S.; Smilowitz, L.; Heeger, A.J.; Wudl, F. Semiconducting polymers (as donors) and buckminsterfullerene (as acceptor): Photoinduced electron transfer and heterojunction devices. Synth. Met. 1993, 59, 333–352. [Google Scholar] [CrossRef]
- Sariciftci, N.S.; Smilowitz, L.; Heeger, A.J.; Wudl, F. Photoinduced electron transfer from a conducting polymer to buckminsterullerene. Science 1992, 258, 1474–1476. [Google Scholar] [CrossRef]
- Yu, G.; Gao, J.; Hummelen, J.C.; Wudl, F.; Heeger, A.J. Polymer photovoltaic cells: Enhanced efficiencies via a network of internal donor-acceptor heterojunctions. Science 1995, 270, 1789–1791. [Google Scholar] [CrossRef] [Green Version]
- Zhao, W.; Li, S.; Yao, H.; Zhang, S.; Zhang, Y.; Yang, B.; Hou, J. Molecular optimization enables over 13% efficiency in organic solar cells. J. Am. Chem. Soc. 2017, 139, 7148–7151. [Google Scholar] [CrossRef]
- Yin, H.; Ho, J.K.W.; Cheung, S.H.; Yan, R.J.; Chiu, K.L.; Hao, X.; So, S.K. Designing a ternary photovoltaic cell for indoor light harvesting wit a power conversion efficiency exceeding 20%. J. Mater. Chem. A 2018, 6, 8579–8585. [Google Scholar] [CrossRef]
- Shittu, S.; Guiqiang, L.; Akhlaghi, Y.G.; Xiaoli, M.; Xudong, Z.; Ayodele, E. Advancements in thermoelectric generators for enhanced hybrid photovoltaic system performance. Renew. Sust. Energ. Rev. 2019, 109, 24–54. [Google Scholar] [CrossRef]
- Benick, J.; Richter, A.; Müller, R.; Hauser, H.; Feldmann, F.; Krenckel, P.; Riepe, S.; Schindler, F.; Schubert, M.C.; Hermle, M.; et al. High efficiency n-type HP MC Silicon Solar Cells. IEEE J. Photovolt. 2017, 7, 1171–1175. [Google Scholar] [CrossRef]
- Olindo, I.; Smets, A.H.M.; Zeman, M. Thin-film silicon—based quadrupole junction solar cells approaching 20% conversion efficiency. Sol. Energy Mater. Sol. Cells 2014, 129, 82–89. [Google Scholar] [CrossRef]
- Kakiage, K.; Aoyama, Y.; Yano, T.; Oya, K.; Fujisawa, J.-I.; Hanaya, M. Highly-efficient dye-sensitized solar cells with collaborative sensitization by silyl-anchor and carboxy-anchor dyes. Chem. Commun. 2015, 51, 15894–15897. [Google Scholar] [CrossRef] [PubMed]
- Chen, F.C. Emerging organic and organic/inorganic hybrid photovoltaic devices for specialty applications: Low level-lighting energy conversion and biochemical treatment. Adv. Opt. Mater. 2019, 7, 1800662. [Google Scholar] [CrossRef] [Green Version]
- Helfrich, W.; Schneider, W.G. Recombination radiation in anthracene crystals. Phys. Rev. Lett. 1965, 14, 229. [Google Scholar] [CrossRef]
- Tang, C.W.; VanSlyke, S.A. Organic electroluminescent diodes. Appl. Phys. Lett. 1987, 51, 913. [Google Scholar] [CrossRef]
- Burroughes, J.H.; Bradley, D.D.C.; Brown, A.R.; Marks, R.N.; Mackay, K.; Friend, R.H.; Burns, P.L.; Holmes, A.B. Light emitting diodes based on conjugated polymers. Nature 1990, 347, 539–541. [Google Scholar] [CrossRef]
- Zhao, X.; Wang, S.; You, J.; Zhang, Y.; Li, X. Solution-processed thermally stable amorphous films of small molecular hole injection/transport bi-functional materials and their application in high efficiency OLEDs. J. Mater. Chem. C 2015, 3, 11377–11384. [Google Scholar] [CrossRef]
- Du, X.; Yang, X.; Zhao, J.; Lin, H.; Zheng, C.; Tao, S. Highly efficient solution- processed small molecule white organic light-emitting diodes. Org. Electron. 2016, 38, 344–349. [Google Scholar] [CrossRef]
- Karzazi, Y. Organic light emitting diodes: Devices and applications. J. Mater. Environ. Sci. 2014, 5, 1–12. Available online: https://www.jmaterenvironsci.com/Document/vol5/vol5_N1/1-JMES-607-2014-Karzazi.pdf (accessed on 16 March 2022).
- Sandström, A.; Dam, H.F.; Krebs, F.C.; Edman, L. Ambient fabrication of flexible and large—Area organic light—Emitting devices using slot-die coating. Nat. Commun. 2012, 3, 1002. [Google Scholar] [CrossRef] [Green Version]
- Karnakis, D.; Kearsley, A.; Knowles, M. Ultrafast laser patterning of OLEDs on flexible substrate for solid-state lighting. J. Laser Micro Nanoeng. 2009, 4, 218–223. [Google Scholar] [CrossRef]
- Adachi, C.; Baldo, M.A.; Thompson, M.E.; Forrest, S.R. Nearly 100% internal phosphorescence efficiency in am organic light emitting device. J. Appl. Phys. 2001, 90, 5048–5051. [Google Scholar] [CrossRef] [Green Version]
- Blom, P.W.M.; Berntsen, A.J.M.; Liedenbaum, C.T.H.F.; Schoo, M.F.M.; Croonen, Y.; Van De Weijer, P. Efficiency and stability of polymer light-emitting diodes. J. Mater. Sci. Mater. Electron. 2000, 11, 105–109. [Google Scholar] [CrossRef]
- Muccini, M.; Toffanin, S. Organic Light-Emitting Transistors: Towards the Next Generation Display Technology, 1st ed.; John Wiley & Sons: Hoboken, NJ, USA, 2016. [Google Scholar]
- Xie, Z.Y.; Hung, L.S. High-contrast organic light-emitting diodes. Appl. Phys. Lett. 2004, 84, 1207. [Google Scholar] [CrossRef]
- Ma, C.; Zhang, B.; Liang, Z.; Xie, P.; Wang, X.; Zhang, B.; Cao, Y.; Jiang, X.; Zhang, Z.J. A novel n-type red luminescent material for organic light-emitting diodes. Mater. Chem. 2002, 12, 1671–1675. [Google Scholar] [CrossRef]
- Aizawa, N.; Pu, Y.-J.; Watanabe, M.; Chiba, T.; Ideta, K.; Toyota, N.; Igarashi, M.; Suzuri, Y.; Sasabe, H.; Kido, J. Solution processed multilayer small molecule light emitting devices with high efficiency white light emission. Nat. Commun. 2014, 5, 5756. [Google Scholar] [CrossRef]
- Grykien, R.; Luszczynska, B.; Glowacki, I.; Kurach, E.; Rybakiewicz, R.; Kotwica, K.; Zagorska, M.; Pron, A.; Tassini, P.; Maglione, M.G.; et al. Photo- and electroluminescent properties of bithiophene disubstituted 1,3,4-thiadiazole and their application as active components in organic light emitting diodes. Opt. Mater. 2014, 37, 193–199. [Google Scholar] [CrossRef]
- Shi, Z.; Zhang, X.; Wang, H.; Huo, J.; Zhao, H.; Shi, H.; Tang, B.Z. The synthesis, photoluminescence and electroluminescence properties of a new emitter based on diphenylethene, carbazole and 9,9,10,10-tetraoxidethianthrene. Org. Electron. 2019, 70, 7–13. [Google Scholar] [CrossRef]
- Tao, Y.T.; Balasubramaniam, E.; Danel, A.; Jarosz, B.; Tomasik, P. Sharp green electroluminescence from 1H-pyrazolo[3,4-b]quinoline based light emitting diodes. Appl. Phys. Lett. 2000, 77, 1575. [Google Scholar] [CrossRef]
- Tao, Y.T.; Chen, C.H.; Wu, F.I.; Shu, C.F.; Chien, C.H. SWpirobifluorene—Based pyrazoloquinolines: Efficient blue electroluminescent materials. J. Mater. Chem. 2004, 14, 1585–1589. [Google Scholar] [CrossRef]
- Liu, C.; Li, Y.; Yang, C.; Wu, H.; Qin, J.; Cao, Y. Efficient solution—Processed deep blue organic light emitting diodes based on multibranched oligofluorenes with a phosphine oxide center. Chem. Mater. 2013, 25, 3320–3327. [Google Scholar] [CrossRef]
- Kim, K.S.; Jeong, S.; Kim, C.; Ham, J.Y.; Kwon, Y.; Choi, B.D.; Han, Y.S. Synthesis and electro-optical properties of carbazole derivatives for organic device applications. Synth. Met. 2009, 159, 1870–1875. [Google Scholar] [CrossRef]
- Brack, A. Uber kondensierte Pyrazolopyridine. Liebigs Ann. Chem. 1965, 681, 105–110. [Google Scholar] [CrossRef]
- Vilsmeier, A.; Haack, A. Uber die Einwirkung von Halogenphosphor auf Alkyl-formanilide. Eine neue Methode zur Darstellung sekundärer und tertiärer p-Alkylamino-benzaldehyde. Ber. Dtsch. Chem. Ges. A/B 1927, 60, 119–122. [Google Scholar] [CrossRef]
- Gondek, E. Optical optimization of organic solar cell with bulk heterojunction. Opto-Electron. Rev. 2014, 22, 77–85. [Google Scholar] [CrossRef]
- Gondek, E. Optical optimization of organic solar cells. Opt. Mater. 2014, 36, 98–101. [Google Scholar] [CrossRef]
- Gondek, E.P. Karasiński, High reflectance structures for photovoltaics applications—Analysis and characterization. J. Mater. Sci. Mater. Electron. 2013, 24, 2934–2943. [Google Scholar] [CrossRef]
- Gondek, E.; Djaoued, Y.; Robichaud, J.; Karasiński, P.; Kityk, I.V.; Danel, A.; Pluciński, K.J. Influence of TiO2 nanoparticles on the photovoltaic efficiency of the ITO/PEDOT:PSS/fluorine copolymers/polythiophene: TiO2/Al architecture. J. Mater. Sci. Mater. Electron. 2012, 23, 2057–2064. [Google Scholar] [CrossRef]
- Gondek, E.; Kityk, I.V.; Danel, A. Molecular engineering by light emitting diode parameters on the base of methoxy-pyrazoloquinoline dyes in polysilane matrices. J. Phys. D Appl. Phys. 2007, 40, 2748–2753. [Google Scholar] [CrossRef]
- Frisch, M.J.; Trucks, G.W.; Schlegel, H.B.; Scuseria, G.E.; Robb, M.A.; Cheeseman, J.R.; Scalmani, G.; Barone, V.; Petersson, G.A.; Nakatsuji, H.; et al. Gaussian 16, Revision B.01; Gaussian Inc.: Wallingford, CT, USA, 2016. [Google Scholar]
- Brik, M.G.; Kuźnik, W.; Gondek, E.; Kityk, I.V.; Uchacz, T.; Szlachcic, P.; Jarosz, B.; Plucinski, K.J. Optical absorption measurements and quantum-chemical simulations of optical properties of novel fluoro derivatives of pyrazoloquinoline. Chem. Phys. 2010, 370, 194–200. [Google Scholar] [CrossRef]
- Szlachcic, P.; Uchacz, T. Influence of fluorine on photophysical, electrochemical properties and basicity of 1,3-diphenylpyrazolo[3,4-b]quinoline derivatives. J. Lumin. 2018, 194, 579–587. [Google Scholar] [CrossRef]
- Uchacz, T.; Szlachcic, P.; Danel, A.; Kukułka, M.; Srebro-Hooper, M.; Stopa, G.; Stadnicka, K.M. Photophysical properties of 1-pyridine-3-phenylpyrazoloquinoline and molecular logic gate implementation. Dye. Pigment. 2019, 166, 490–501. [Google Scholar] [CrossRef]
- Becke, A.D. Density-functional thermochemistry. III. The role of exact exchange. J. Chem. Phys. 1993, 98, 5648. [Google Scholar] [CrossRef] [Green Version]
- Lee, C.; Yang, W.; Parr, R.G. Development of the Colle-Salvetti correlation-energy formula into a functional of the electron density. Phys. Rev. B 1988, 37, 785–789. [Google Scholar] [CrossRef] [PubMed] [Green Version]
- Stephens, P.J.; Devlin, F.J.; Chabalowski, C.F.; Frisch, M.J. Ab initio calculation of Vibrational Absorption and circular dichroism spectra using density functional force fields. J. Phys. Chem. 1994, 98, 11623–11627. [Google Scholar] [CrossRef]
- Dunning, T.H., Jr. Gaussian basis sets for use in correlated molecular calculations. I. The atoms boron through neon and hydrogen. J. Chem. Phys. 1989, 90, 1007–1024. [Google Scholar] [CrossRef]
- Tomasi, J.; Mennucci, B.; Cammi, R. Quantum mechanical continuum solvation models. Chem. Rev. 2005, 105, 2999–3094. [Google Scholar] [CrossRef]
- Velapoldi, R.A. National Bureau of Standards Special Publication 378, Accuracy in Spectrophotometry and Luminescence Measurements. In Proceedings of the National Bureau of Standards, Gaithersburg, MD, USA, 22–24 March 1972; p. 231. [Google Scholar]
- Montaser, A.A.; Abdel-Wahab, F. Spectroscopic ellipsometry investigations of Cd-Se thin film electrochemically prepared. Optik 2019, 178, 1270–1275. [Google Scholar] [CrossRef]
- Uprety, P.; Junda, M.M.; Ghimire, K.; Adhikari, D.; Grice, C.; Podraza, N.J. Spectroscopic ellipsometry determination of optical and electrical properties of aluminium doped zinc oxide. Appl. Surf. Sci. 2017, 421, 852–858. [Google Scholar] [CrossRef]
- Abdel-Wahab, F.; Merazga, A.; Rasheedy, M.S.; Montaser, A.A. Optical characterization of annealing effect on Ge5Te20Se75 thin films by variable angle of-incidence spectroscopic ellipsometry. Optik 2016, 127, 3871–3877. [Google Scholar] [CrossRef]
- Uchacz, T.; Szlachcic, P.; Wojtasik, K.; Mac, M.; Stadnicka, K. Amino derivatives of 1,3-diphenyl-1H-pyrazolo[3,4-b]quinoline—Photophysics and implementation of molecular switches. Dye. Pigment. 2016, 124, 277–292. [Google Scholar] [CrossRef]
- D’Andrade, B.W.; Datta, S.; Forrest, S.R.; Djurovich, P.; Polikarpov, E.; Thomson, M.E. Realationship between the ionization and oxidation potentials of molecular organic semiconductors. Org. Electron. 2005, 6, 11–20. [Google Scholar] [CrossRef]
- Thelakkat, M.; Schmidt, H.-W. Synthesis and properties of novel derivatives of 1,3,5-tris(diarylamino)benzenes for electroluminescent devices. Adv. Mater. 1998, 10, 219–223. [Google Scholar] [CrossRef]
- Tauc, J.; Grigorovici, R.; Vancu, A. Optical properties and electronic structure of amorphous germanium. Phys. Status Solidi B 1966, 15, 627–637. [Google Scholar] [CrossRef]
- Pokladko-Kowar, M.; Danel, A. Photovoltaic Cells Based on Organic Composites. In Proceedings of the 18th International Conference on Transparent Optical Networks, ICTON 2016, Trento, Italy, 10 July 2016; p. 7550270. [Google Scholar]


| Compound | Solvent | λabs (nm) | ε (M−1 cm−1) | λfl (nm) | Φfl | τfl (ns) | knr (×107 s−1) | kr (×107 s−1) |
|---|---|---|---|---|---|---|---|---|
| Mol1 | ACN | 390 | 7500 | 476 | 0.41 | 31.62 | 1.87 | 1.30 |
| Mol2 | ACN | 381 | 3300 | 495 | 0.14 | 20.57 | 4.18 | 0.68 |
| Mol3 | ACN | 397 | 6700 | 500 | 0.27 | 28.97 | 2.52 | 0.93 |
| Mol4 | ACN | 375 | 4600 | 433 | 0.73 | 34.66 | 0.78 | 2.11 |
| Photovoltaic Cell | Thickness Molx + PDT (nm) | JSC (μA/cm2) | VOC (V) | FF | η (%) |
|---|---|---|---|---|---|
| ITO/PEDOT:PSS/Mol1 + PDT/Al | 102.9 | 30.88 | 0.70 | 0.20 | 0.32 |
| ITO/PEDOT:PSS/Mol2 + PDT/Al | 105.6 | 24.71 | 0.85 | 0.21 | 0.33 |
| ITO/PEDOT:PSS/Mol3 + PDT/Al | 111.0 | 32.81 | 0.78 | 0.19 | 0.38 |
| ITO/PEDOT:PSS/Mol4 + PDT/Al | 98.5 | 19.70 | 0.64 | 0.21 | 0.21 |
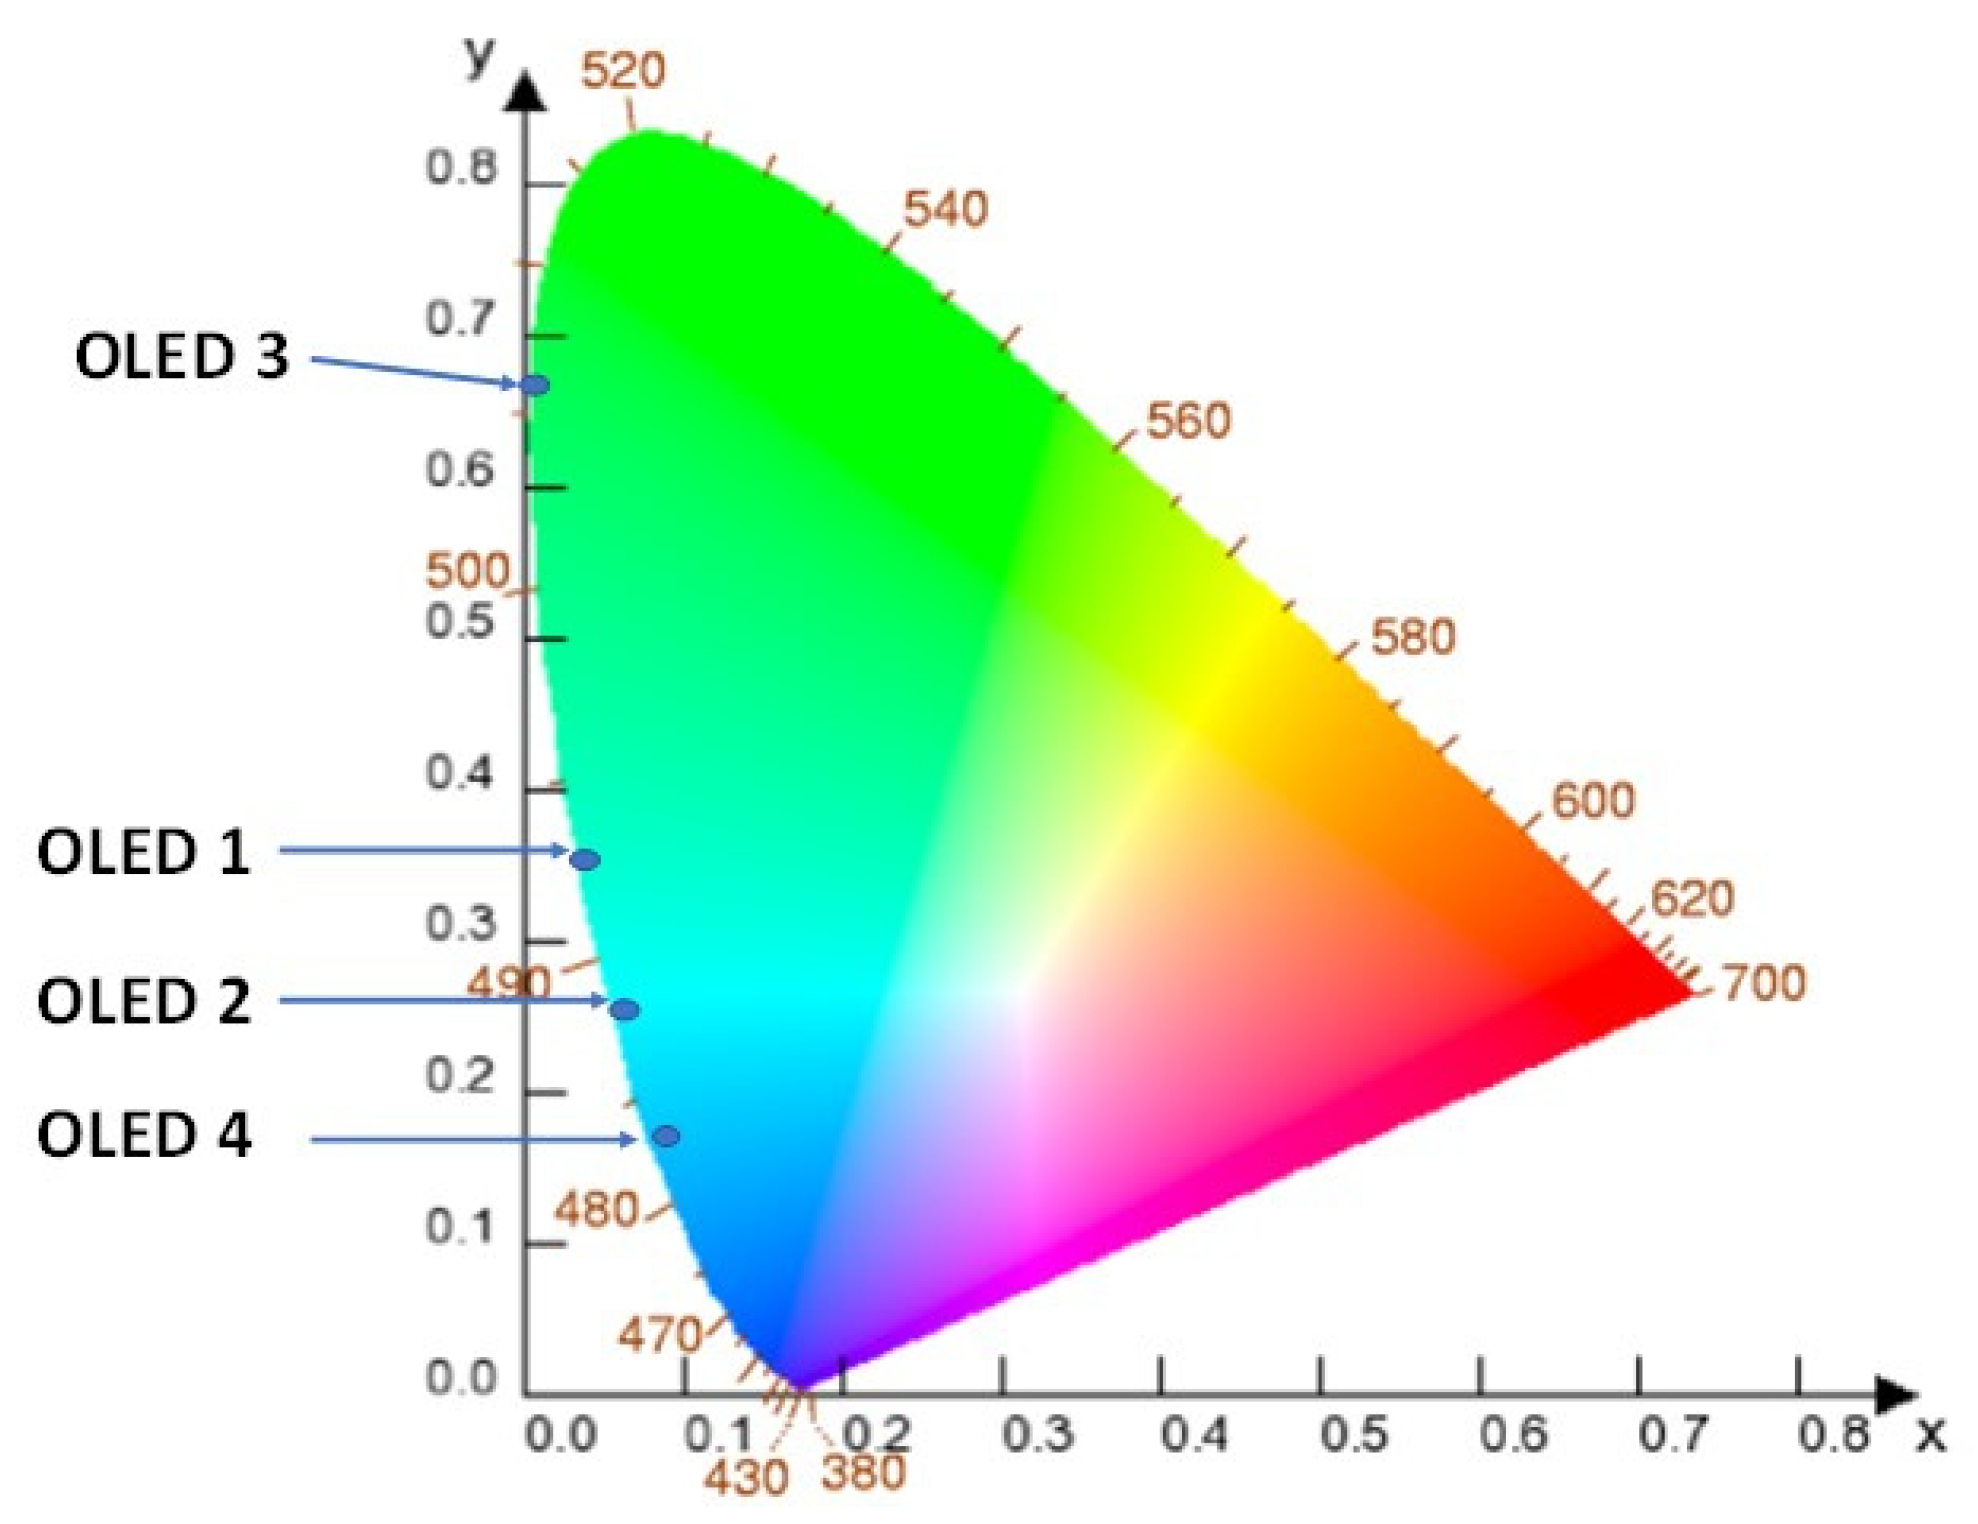
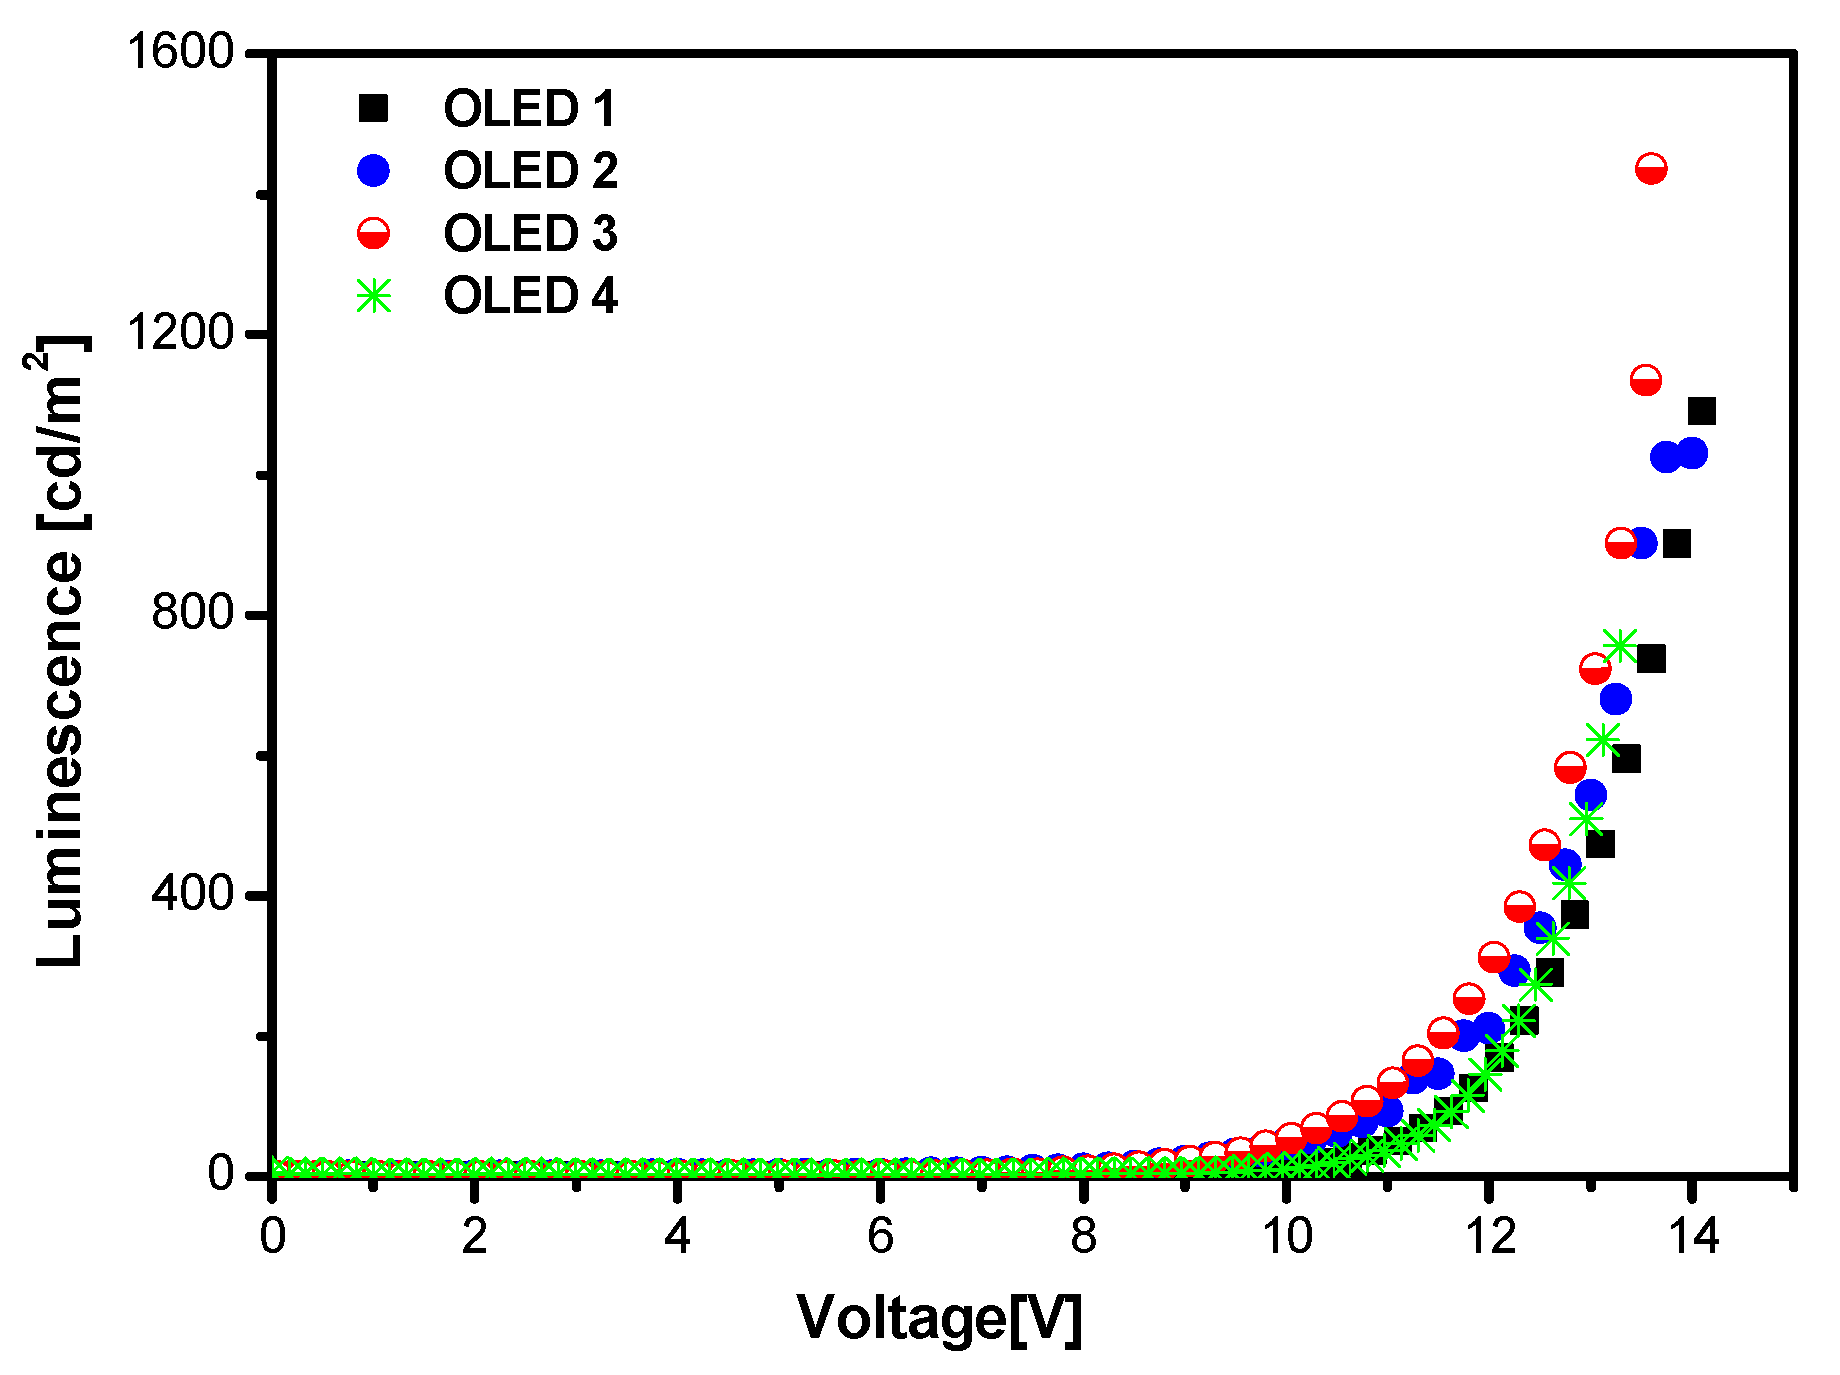
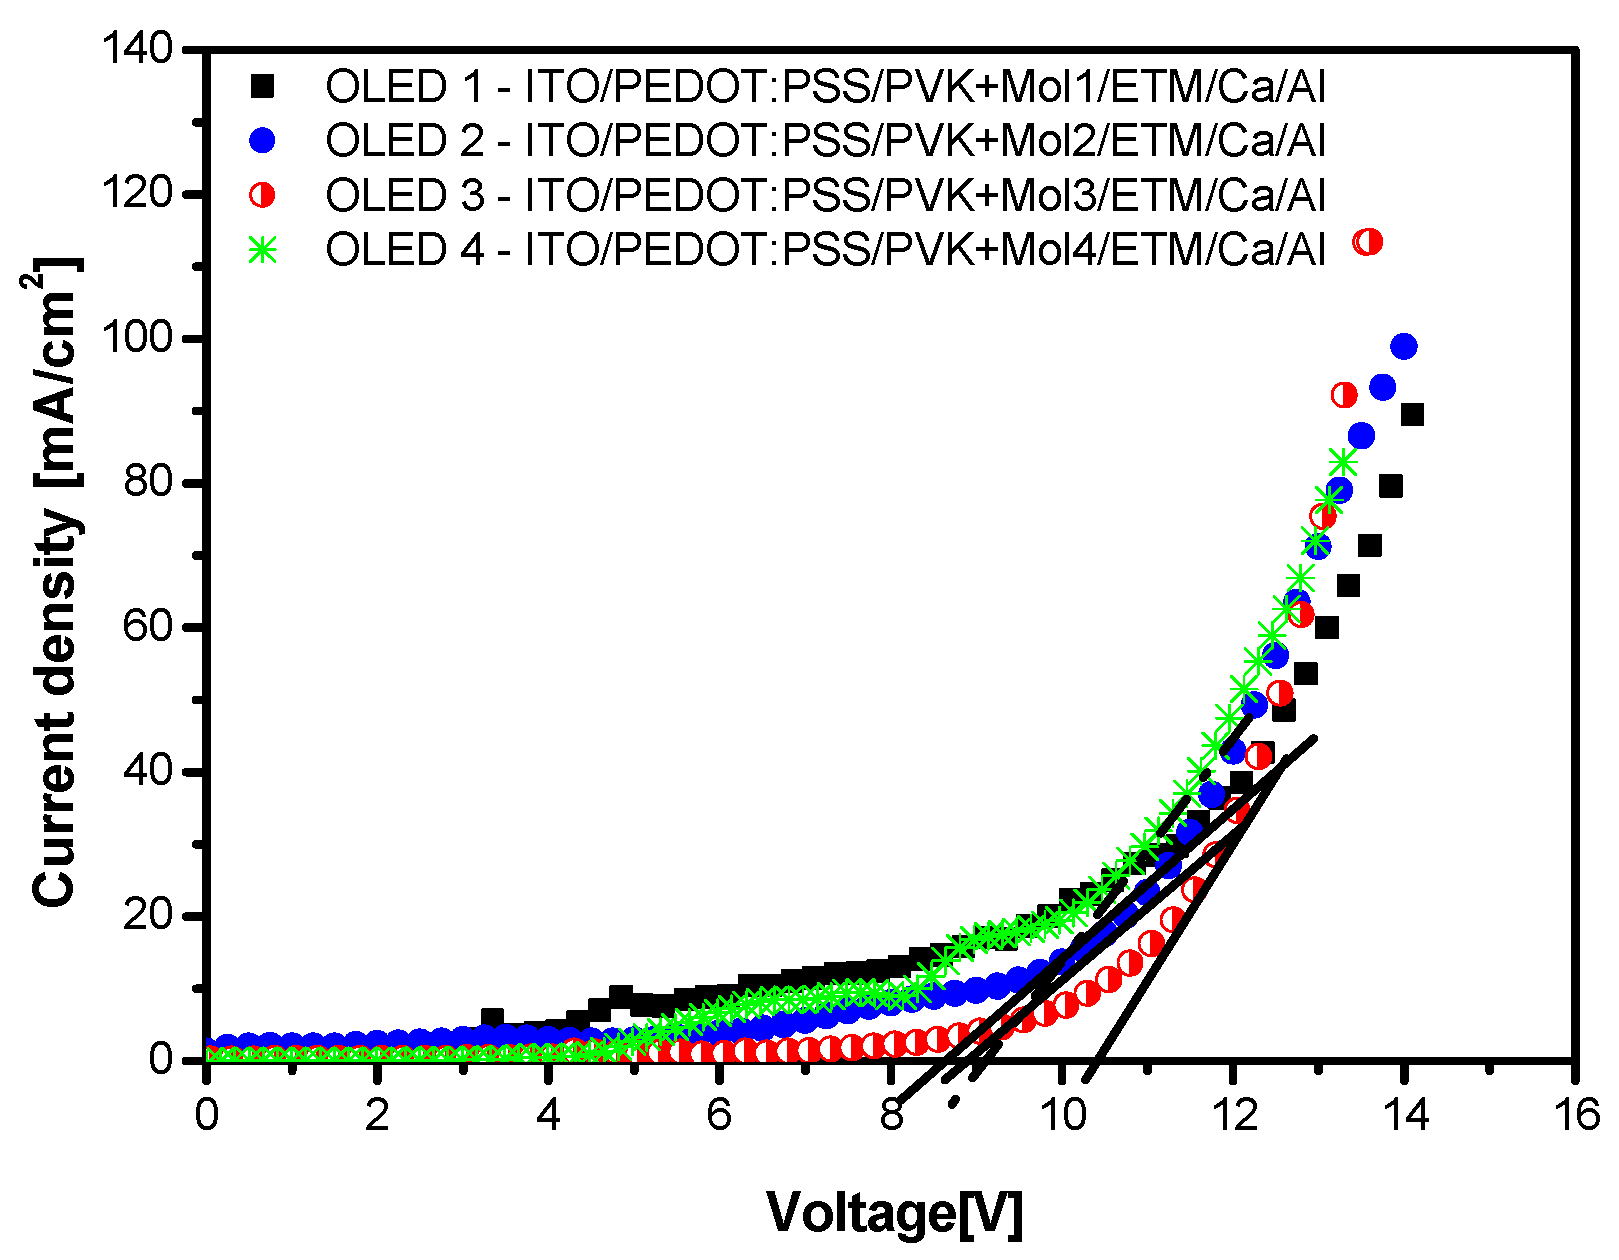
| Molecule | λELmax (nm) | UT (V) | Brightnessmax (cd/m2) | Max CE (cd/A) | CIExy Colour Coordinates |
|---|---|---|---|---|---|
| Mol1 | 493 | 8.66 | 1090.5 | 1.21 | (0.032, 0.364) |
| Mol2 | 487 | 8.98 | 1030.6 | 1.10 | (0.059, 0.235) |
| Mol3 | 506 | 10.32 | 1436.0 | 1.26 | (0.007, 0.692) |
| Mol4 | 481 | 9.06 | 755.9 | 0.91 | (0.087, 0.144) |
Publisher’s Note: MDPI stays neutral with regard to jurisdictional claims in published maps and institutional affiliations. |
© 2022 by the authors. Licensee MDPI, Basel, Switzerland. This article is an open access article distributed under the terms and conditions of the Creative Commons Attribution (CC BY) license (https://creativecommons.org/licenses/by/4.0/).
Share and Cite
Pokladko-Kowar, M.; Gondek, E.; Danel, A.; Uchacz, T.; Szlachcic, P.; Wojtasik, K.; Karasiński, P. Trifluoromethyl Substituted Derivatives of Pyrazoles as Materials for Photovoltaic and Electroluminescent Applications. Crystals 2022, 12, 434. https://0-doi-org.brum.beds.ac.uk/10.3390/cryst12030434
Pokladko-Kowar M, Gondek E, Danel A, Uchacz T, Szlachcic P, Wojtasik K, Karasiński P. Trifluoromethyl Substituted Derivatives of Pyrazoles as Materials for Photovoltaic and Electroluminescent Applications. Crystals. 2022; 12(3):434. https://0-doi-org.brum.beds.ac.uk/10.3390/cryst12030434
Chicago/Turabian StylePokladko-Kowar, Monika, Ewa Gondek, Andrzej Danel, Tomasz Uchacz, Paweł Szlachcic, Katarzyna Wojtasik, and Paweł Karasiński. 2022. "Trifluoromethyl Substituted Derivatives of Pyrazoles as Materials for Photovoltaic and Electroluminescent Applications" Crystals 12, no. 3: 434. https://0-doi-org.brum.beds.ac.uk/10.3390/cryst12030434