
Characteristics of Channel-Water in Blue-Green Beryl and Its Influence on Colour


School of Gemmology, China University of Geosciences, Beijing 100083, China
*
Author to whom correspondence should be addressed.
Crystals 2022, 12(3), 435; https://0-doi-org.brum.beds.ac.uk/10.3390/cryst12030435
Submission received: 20 February 2022
/
Revised: 12 March 2022
/
Accepted: 17 March 2022
/
Published: 21 March 2022
(This article belongs to the Special Issue Mineralogical Crystallography (2nd Edition))
Abstract
:This study reports the characteristics of water in channels of blue-green beryl and its effect on color. An industrial camera was used to measure color in the CIELAB color space. X-ray fluorescence (XRF), X-ray diffraction (XRD), infrared spectroscopy (IR), ultraviolet-visible (UV–vis) spectroscopy, and silicate rock chemical analysis method were used for analysis. The peaks at 5105 cm−1 and 5269 cm−1 were the combination tone of type II water, which were negatively correlated with b*, and positively correlated with the peak area at 3162 cm−1 (Na–H) and cell parameter a0. The peaks at 7097 cm−1 and 7142 cm−1 were related to the metal ions types in the channels. Part of the water in the channel combined with Fe3+ to form [Fe2(OH)4]2+ and cause a yellow tone, and when the yellow tone combined with the blue tone caused by Fe2+, the beryl has a blue-green colour.
1. Introduction
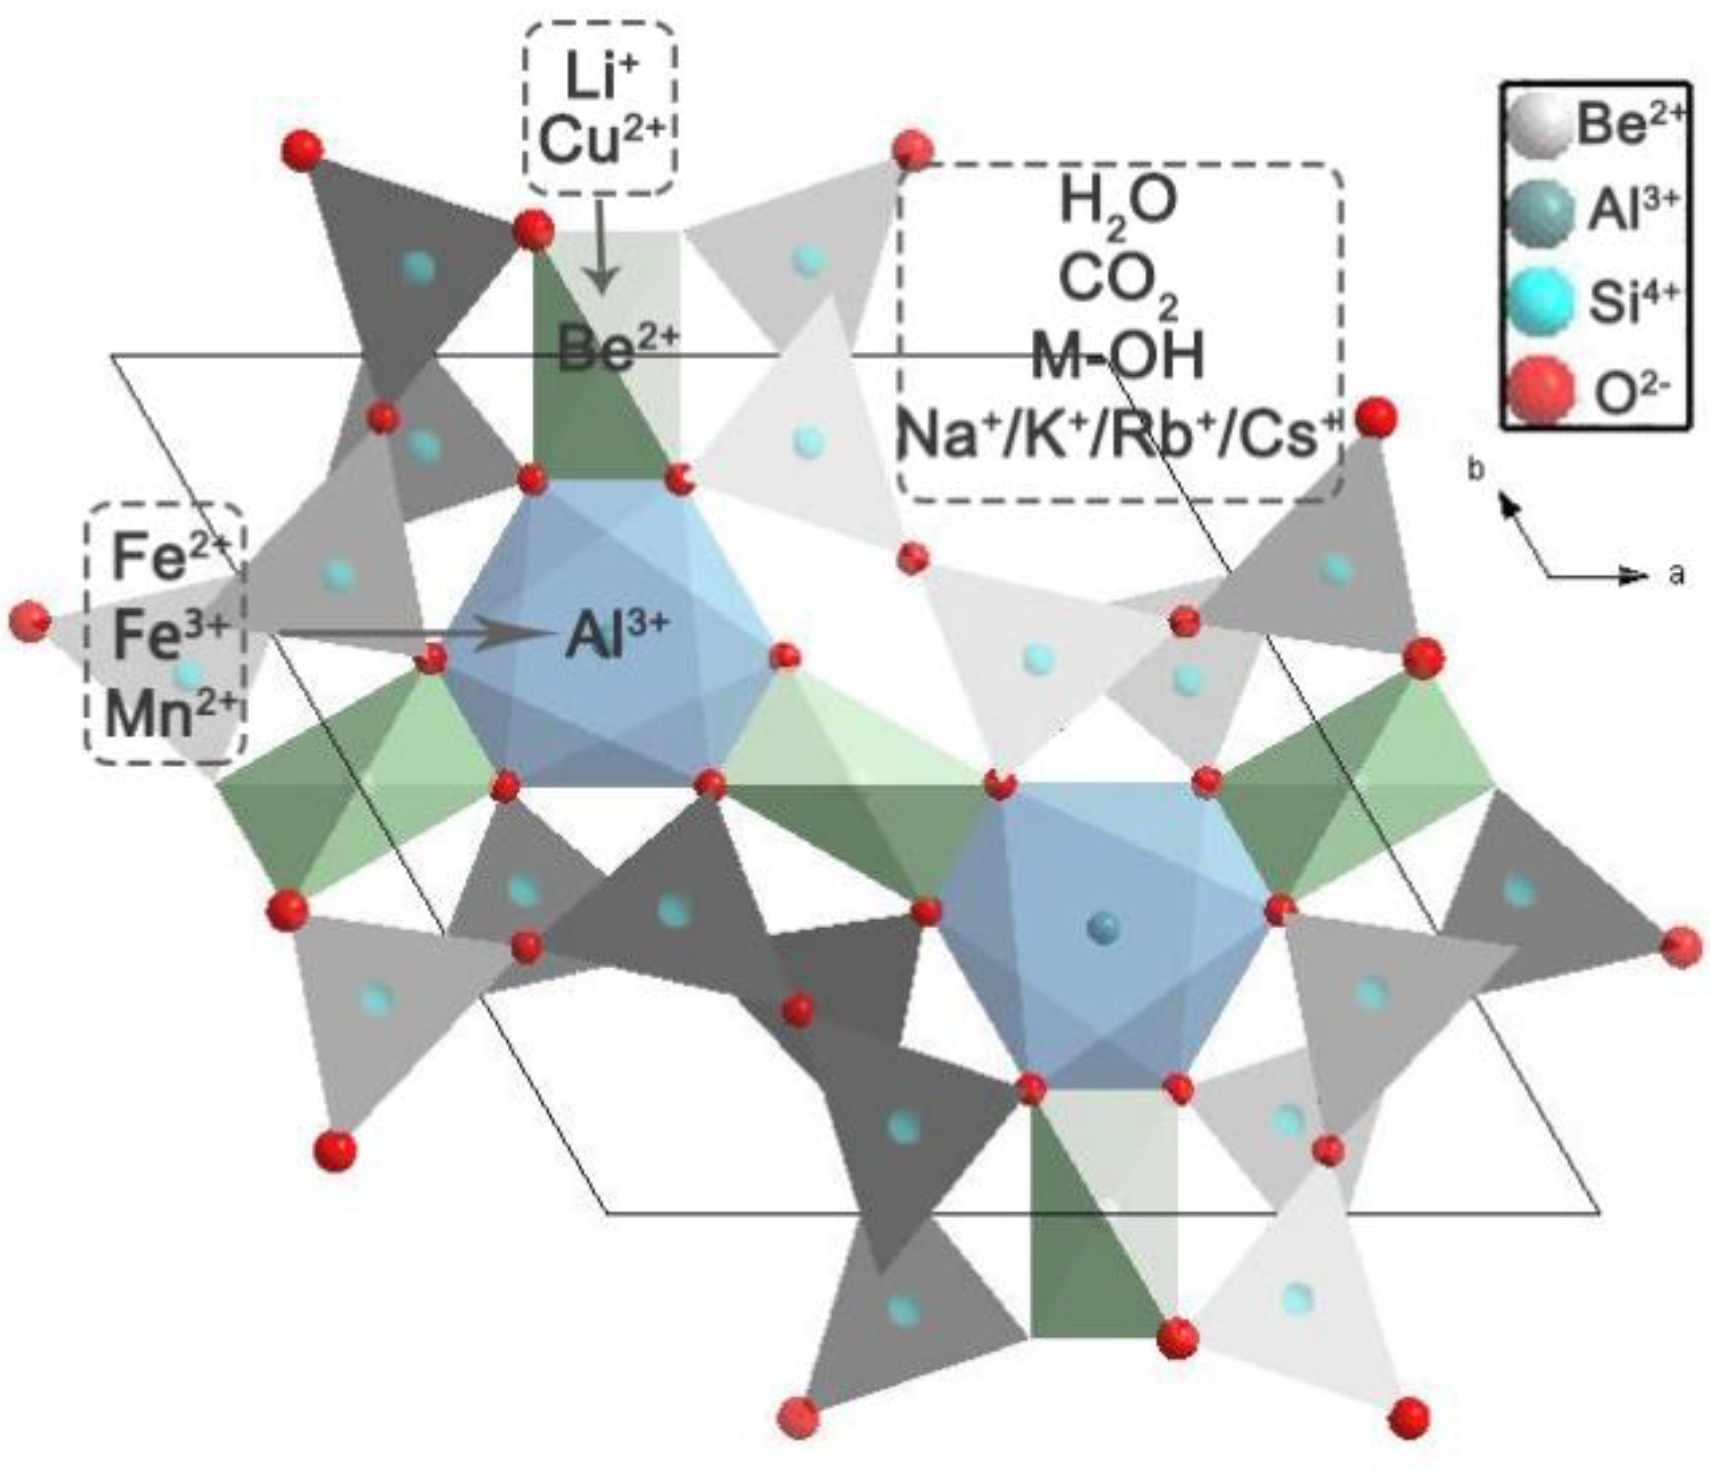
Beryl (Be3Al2Si6O18) is a ring silicate mineral, mainly occurring in pegmatites. Pure beryl is colorless and transparent, but when it contains chromophores (Figure 1), it will show different colors and form different varieties. Many varieties of beryl, such as emerald, aquamarine, morganite, and heliodor occupy a large market share. However, high quality beryl is still in short supply, in recent years, it has been the hot issues to optimize the poor colour of beryl and achieve the desired colour. Therefore, it has become an urgent problem to study the chromaticity mechanism of beryl and guide the chromaticity experiments.
Blue-green beryl is mainly colored by iron ions. By heating and irradiation, high-quality aquamarine can be obtained [1,2,3], so it has an important research value. The chromaticity mechanism has also been studied by many scholars. Goldman et al. [4] concluded that the Fe2+ channel occupancy in beryl caused a light-blue color, the Fe2+–Fe3+ charge transfer caused a blue-green color, the coexistence of the Fe3+ charge transfer and the Fe2+ channel occupancy caused a blue-green color, and the Fe3+ in channel caused a yellow-orange color [4,5]. Hu [6] speculated that [Fe2(OH)4]2+ in the channel was the cause of the yellow tone of beryl. Zhong et al. [7] concluded that the blue-green color of the paraiba-color beryl was influenced by Cu2+, Fe2+, Fe3+, and Ni2+ in the crystal structure. Wang et al. [8] concluded that the d–d electron transition of Fe3+ and the charge transition of the binuclear metal M–M complexes formed by [Fe2(OH)4]2+ in the channel would produce a yellow tone, and when combined with the blue color caused by the Fe2+/Fe3+ charge transfer, the beryl would produce a yellow-green color. The lightness value would decrease with the total amount of transition metal ions increasing, and the chroma would decrease when Cs+ and Mn2+ exist.
In addition to the influence of transition metal ions on the color of beryl, some scholars believed that the channel-water also had an effect. It is well known that water exists in minerals in the following five main forms: hydroscopic water, crystallization water, constitution water, interlayer water, and zeolitic water. Beryl mainly contains constitution water [9], which can exist in the form of H2O molecules, or be polymerized with cations in channels, such as [Fe2(OH)4]2+. Zou [10] found that the color of beryl was closely related to the content ratio of type I and type II water. From golden beryl–cat’s-eye beryl–green-beryl–aquamarine, the content of type I water gradually decreased. Especially in the bright color aquamarine, the value of type I water/type II water was close to 1:1, which was speculated as the best condition to promote the combination of Fe2+ and channel H2O to form hydration ions. However, most scholars [9,11,12,13,14,15,16] concluded that the substitution of isomorphism in beryl was the root cause. When Al3+ and Be2+ were replaced by different valence ions, alkaline ions entered the channel to compensate for the charge difference and caused the transition from type I water to type II water in the channel. Therefore, the beryl color showed a correlation with the type and content of channel-water; although the quantitative relationship has not been obtained so far. The purpose of this study was to use rigorous data to explore the effect of channel-water on the color of blue-green beryl, so that in the future, the characteristics of channel-water can be obtained through simple spectral testing to help predict the chromaticity mechanism of blue-green beryl. This will greatly simplify the experimental process and make a great contribution to the study of chromaticity mechanism and the color optimization of beryl.
A CIE standard color system by the International Commission on Illumination was introduced. Scholars have used this system to quantitatively describe color gems. For example, Jiang et al. [17] classified Australian chalcedony in a CIE 1976 LAB uniform color space. Tang et al. [18] studied the influence of illumination on the color of magnesium olivine in a CIE 1976 LAB uniform color space. Wang [8] explored the influence of transition metal ions on the color of blue-green beryl in a CIE 1976 LAB uniform color space.
2. Materials and Methods
2.1. Materials
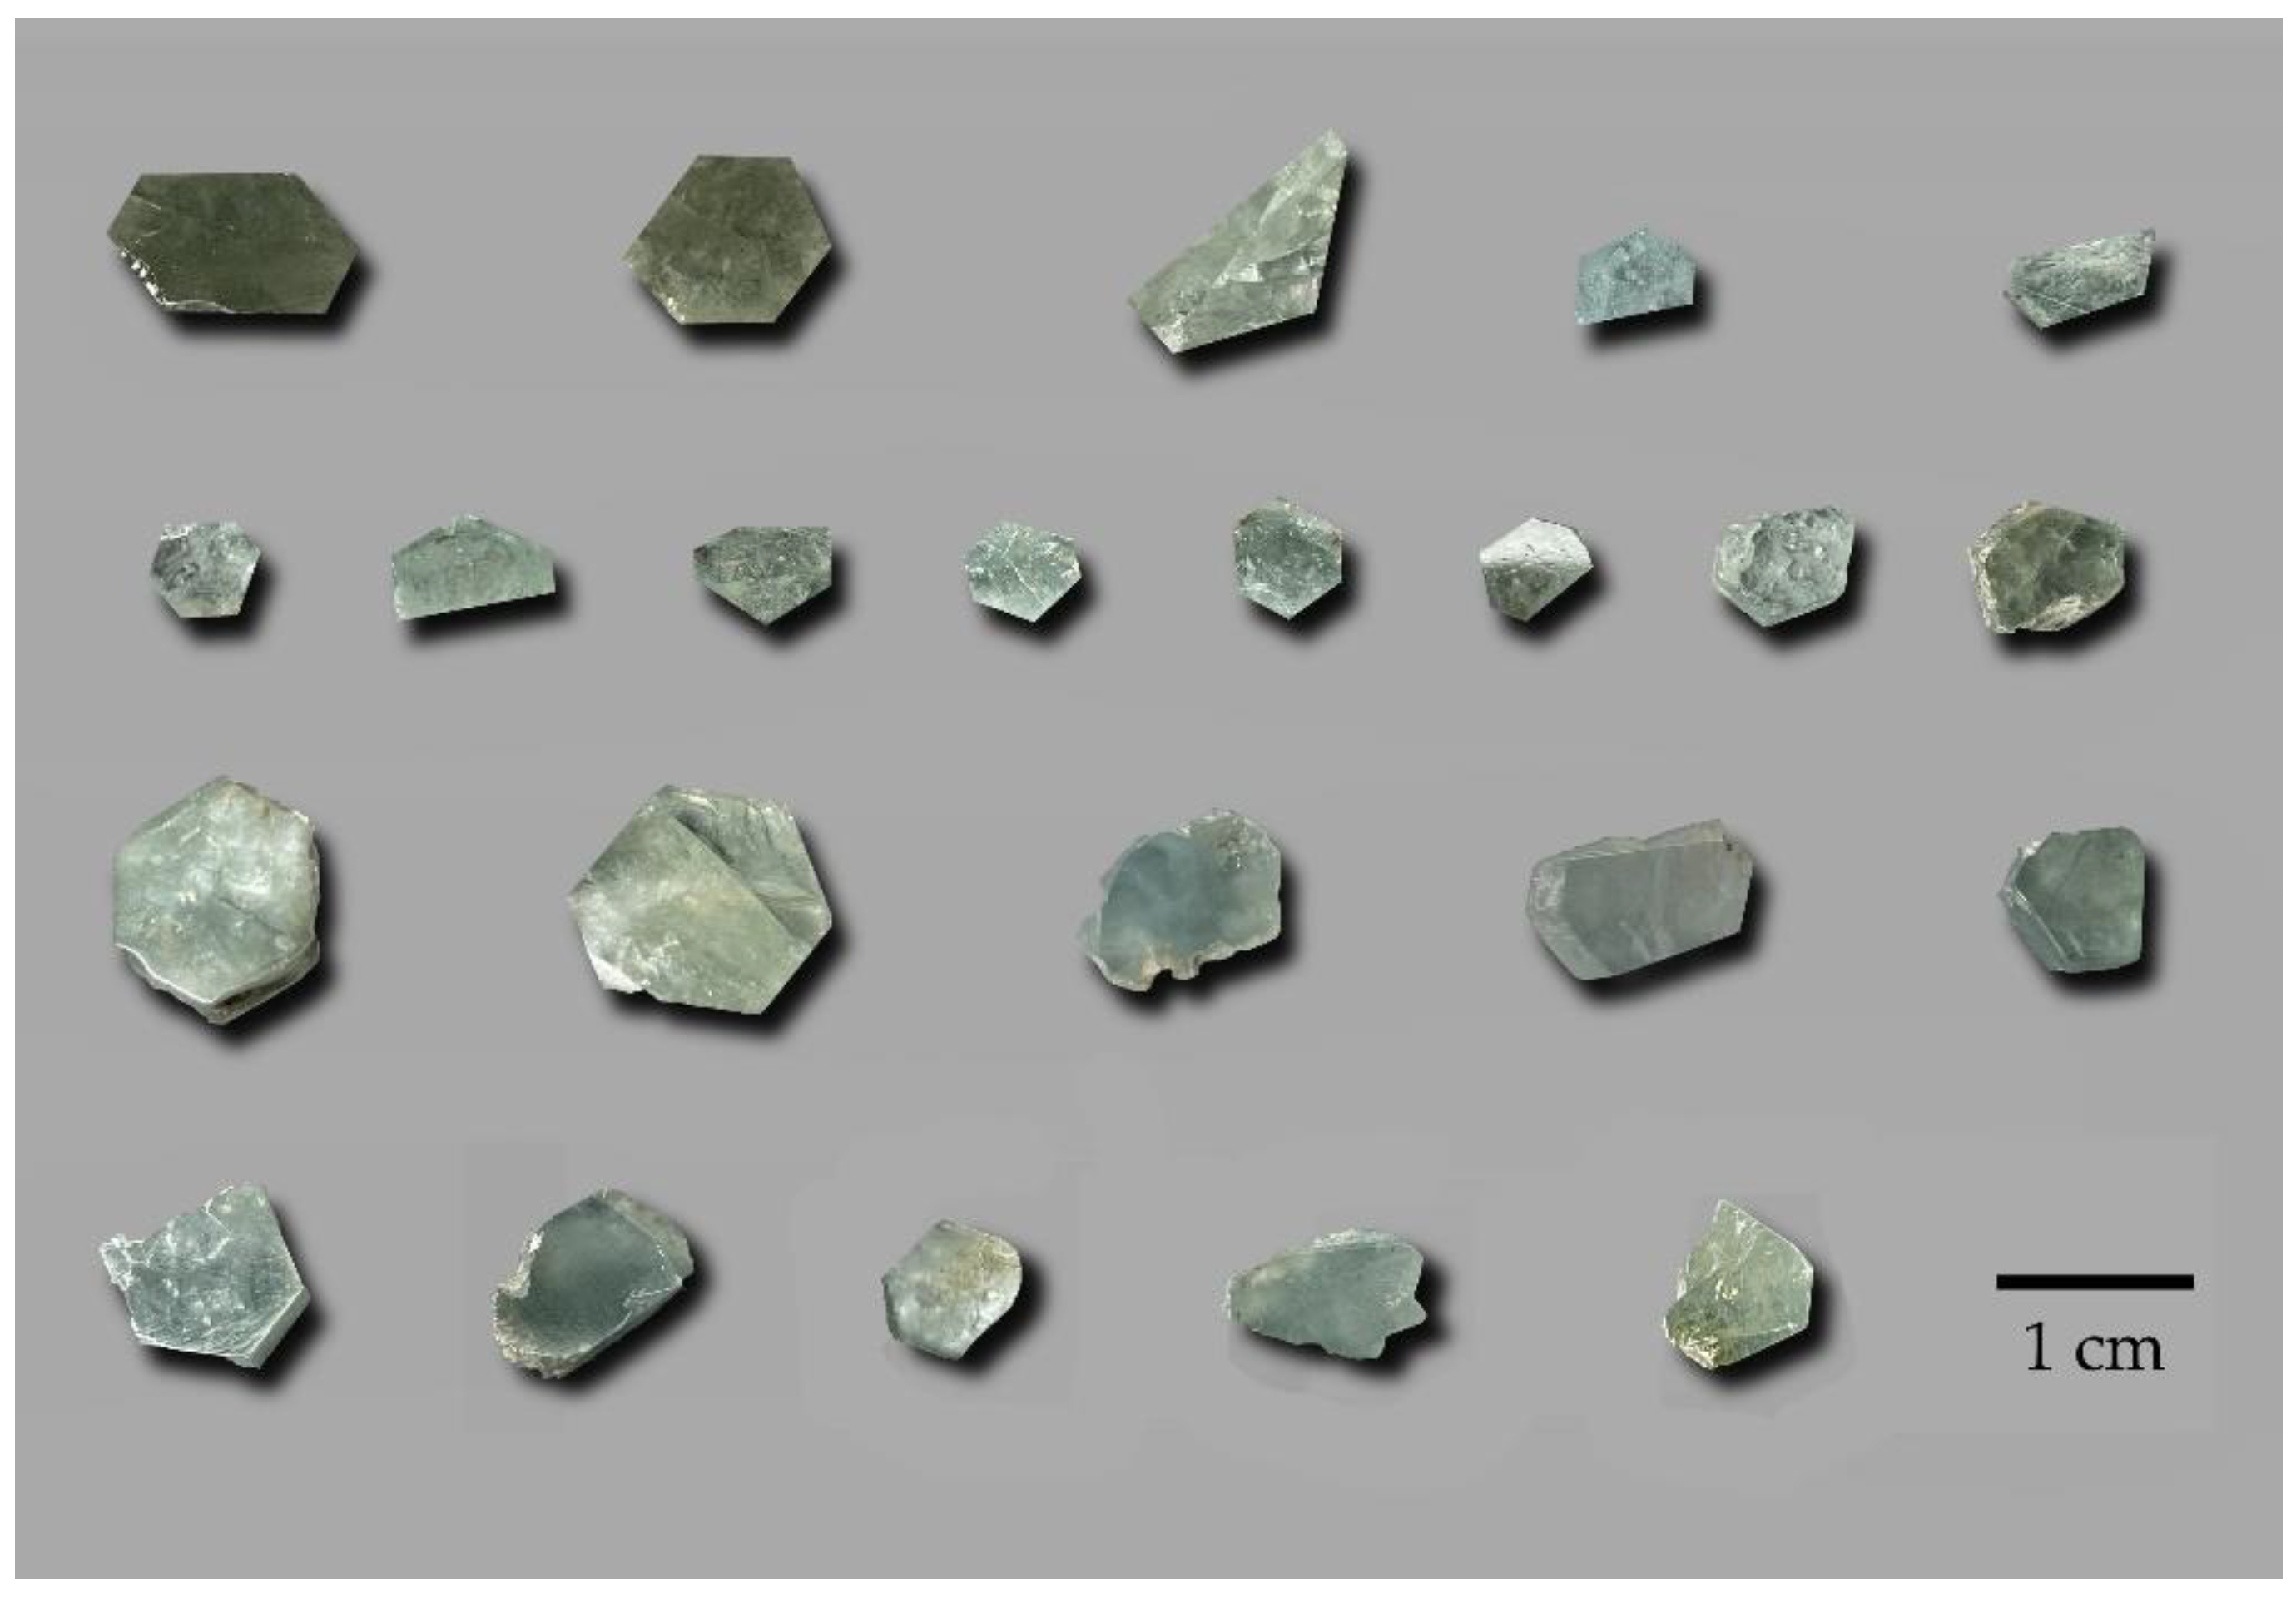
Twenty-three pieces of hexagonal prism beryl with diameters of 6–12 mm were selected as the experimental samples, which were cut and ground into plate shapes perpendicular to the c-axis and polished on both sides. The samples were blue-green, glassy, and translucent to nontranslucent (Figure 2).
2.2. Colour Collection
The CIE 1976 LAB uniform color space was adopted, which was the latest and most widely used uniform color space.
L* is the lightness component and ranged from 0 to 100 (from black to white). A* and B* are the chromaticity components. A* ranges from −128 to +127 (from negative green to positive red) and B* ranges from −128 to +127 (from negative blue to positive yellow). In addition, the C*ab (chroma value) and hab (hue angle) can be calculated according to L*, a*, and b* values:
C*ab = [(a*)2 + (b*)2]1/2
The color measuring instrument used was the industrial camera Mako G-507C (manufactured by Allied Vision Technologies, Stadtroda, Germany), with the following specifications: resolution: 2464 × 2056; frame rate: 23.7; sensitive chip: Sony IMX264; chip type: CMOS; target surface: 2/3″; pixel: 3.45 × 3.45; exposure mode: global, color; and digital interface: GigE.
The light source was standard D65 and the test background was a PANTONE Cool Gray 1C colorless background.
2.3. Structure and Composition Testing
Absorption spectra in the ultraviolet to visible (UV–vis) range were recorded with a UV-3600 UV–vis spectrophotometer (SHIMADZU, Kyoto, Japan). The samples were ground into transparent slices with a thickness of 1 mm. The transmission method was used to test the absorption value. The wavelength range for the test was 300–900 nm, the scanning speed was set to ‘high’, the sampling interval was 1.0s and the scanning mode was ‘single’.
Absorption spectra in the infrared (IR) range were recorded with a Brooke Tensor 27 Fourier transform infrared spectrometer. The test method was transmission for 2000–8000 cm−1. The resolution was 4 cm−1 and the scans were set to ‘32’.
Composition semiquantitative results were obtained with an EDX 700 X-ray fluorescence (XRF) spectrometer (SHIMADZU, Kyoto, Japan). The samples were cut and ground into plate shapes perpendicular to the c-axis and polished, and one of the planes perpendicular to the c-axis were selected as the test plane. The collimator diameter was 5 mm. The testing atmosphere was air. The element test conditions in the Al–U range were 50 kV and 272 μA, the analysis was set to ‘0.00–40.00’, the time was set to ‘live-100’, and the DT% was set to ‘29’. The element test conditions in the Na–Sc range were 15 kV and 1000 μA, the analysis was set to ‘0.00–4.40’, the time was set to ‘live-100’, and the DT% was set to ‘17’.
Samples were grounded to 400 mesh powder and placed in a silicon glass recess, and measured using an Ultima IV polycrystalline powder X-ray diffractometer (XRD). A nickel filter was used and the copper target was used as the detector. The wavelength was 0.15406 nm, the current was 50 mA, and the voltage was 40 kV. The continuous scanning was set to ‘5°/min’. The scanning range was 5–90°, and the step was 0.02. X-ray scan samples were at a different θ angle and detector was at 2θ angle position. The standard PDF card ‘09-4310’ for beryl was used as a reference.
Ferrous oxide was determined for 10 samples, using the silicate rock chemical analysis method. The samples were grounded to 400 mesh powder and decomposed with HF (ρ = 1.15 g/mL) and H2SO4 (ρ = 1.84 g/mL), and the remaining F− in the solution was added to saturated H3BO3 for complexation. The C12H10NNaO3S (ρ = 5 g/L) was used as indicator, and the solution was titrated with K2Cr2O7 (c = 0.002319 mol/L) to calculate the amount of ferrous oxide. The electronic analytical balance BSA 124S-CW was used. The ambient temperature was 21 °C and the humidity was 42%.
The K-means clustering method was adopted to simplify the data processing. When using this method, samples were classified to several clusters according to a certain variable within the cluster of similarity, and the difference between clusters. SPSS software was used to classfy. Other variables of different samples were also divided into the corresponding clusters. To make the figure clearer, box diagrams were used to represent different clusters, and the change rule of these box diagrams could represent the whole data.
3. Results
3.1. Colour Parameters
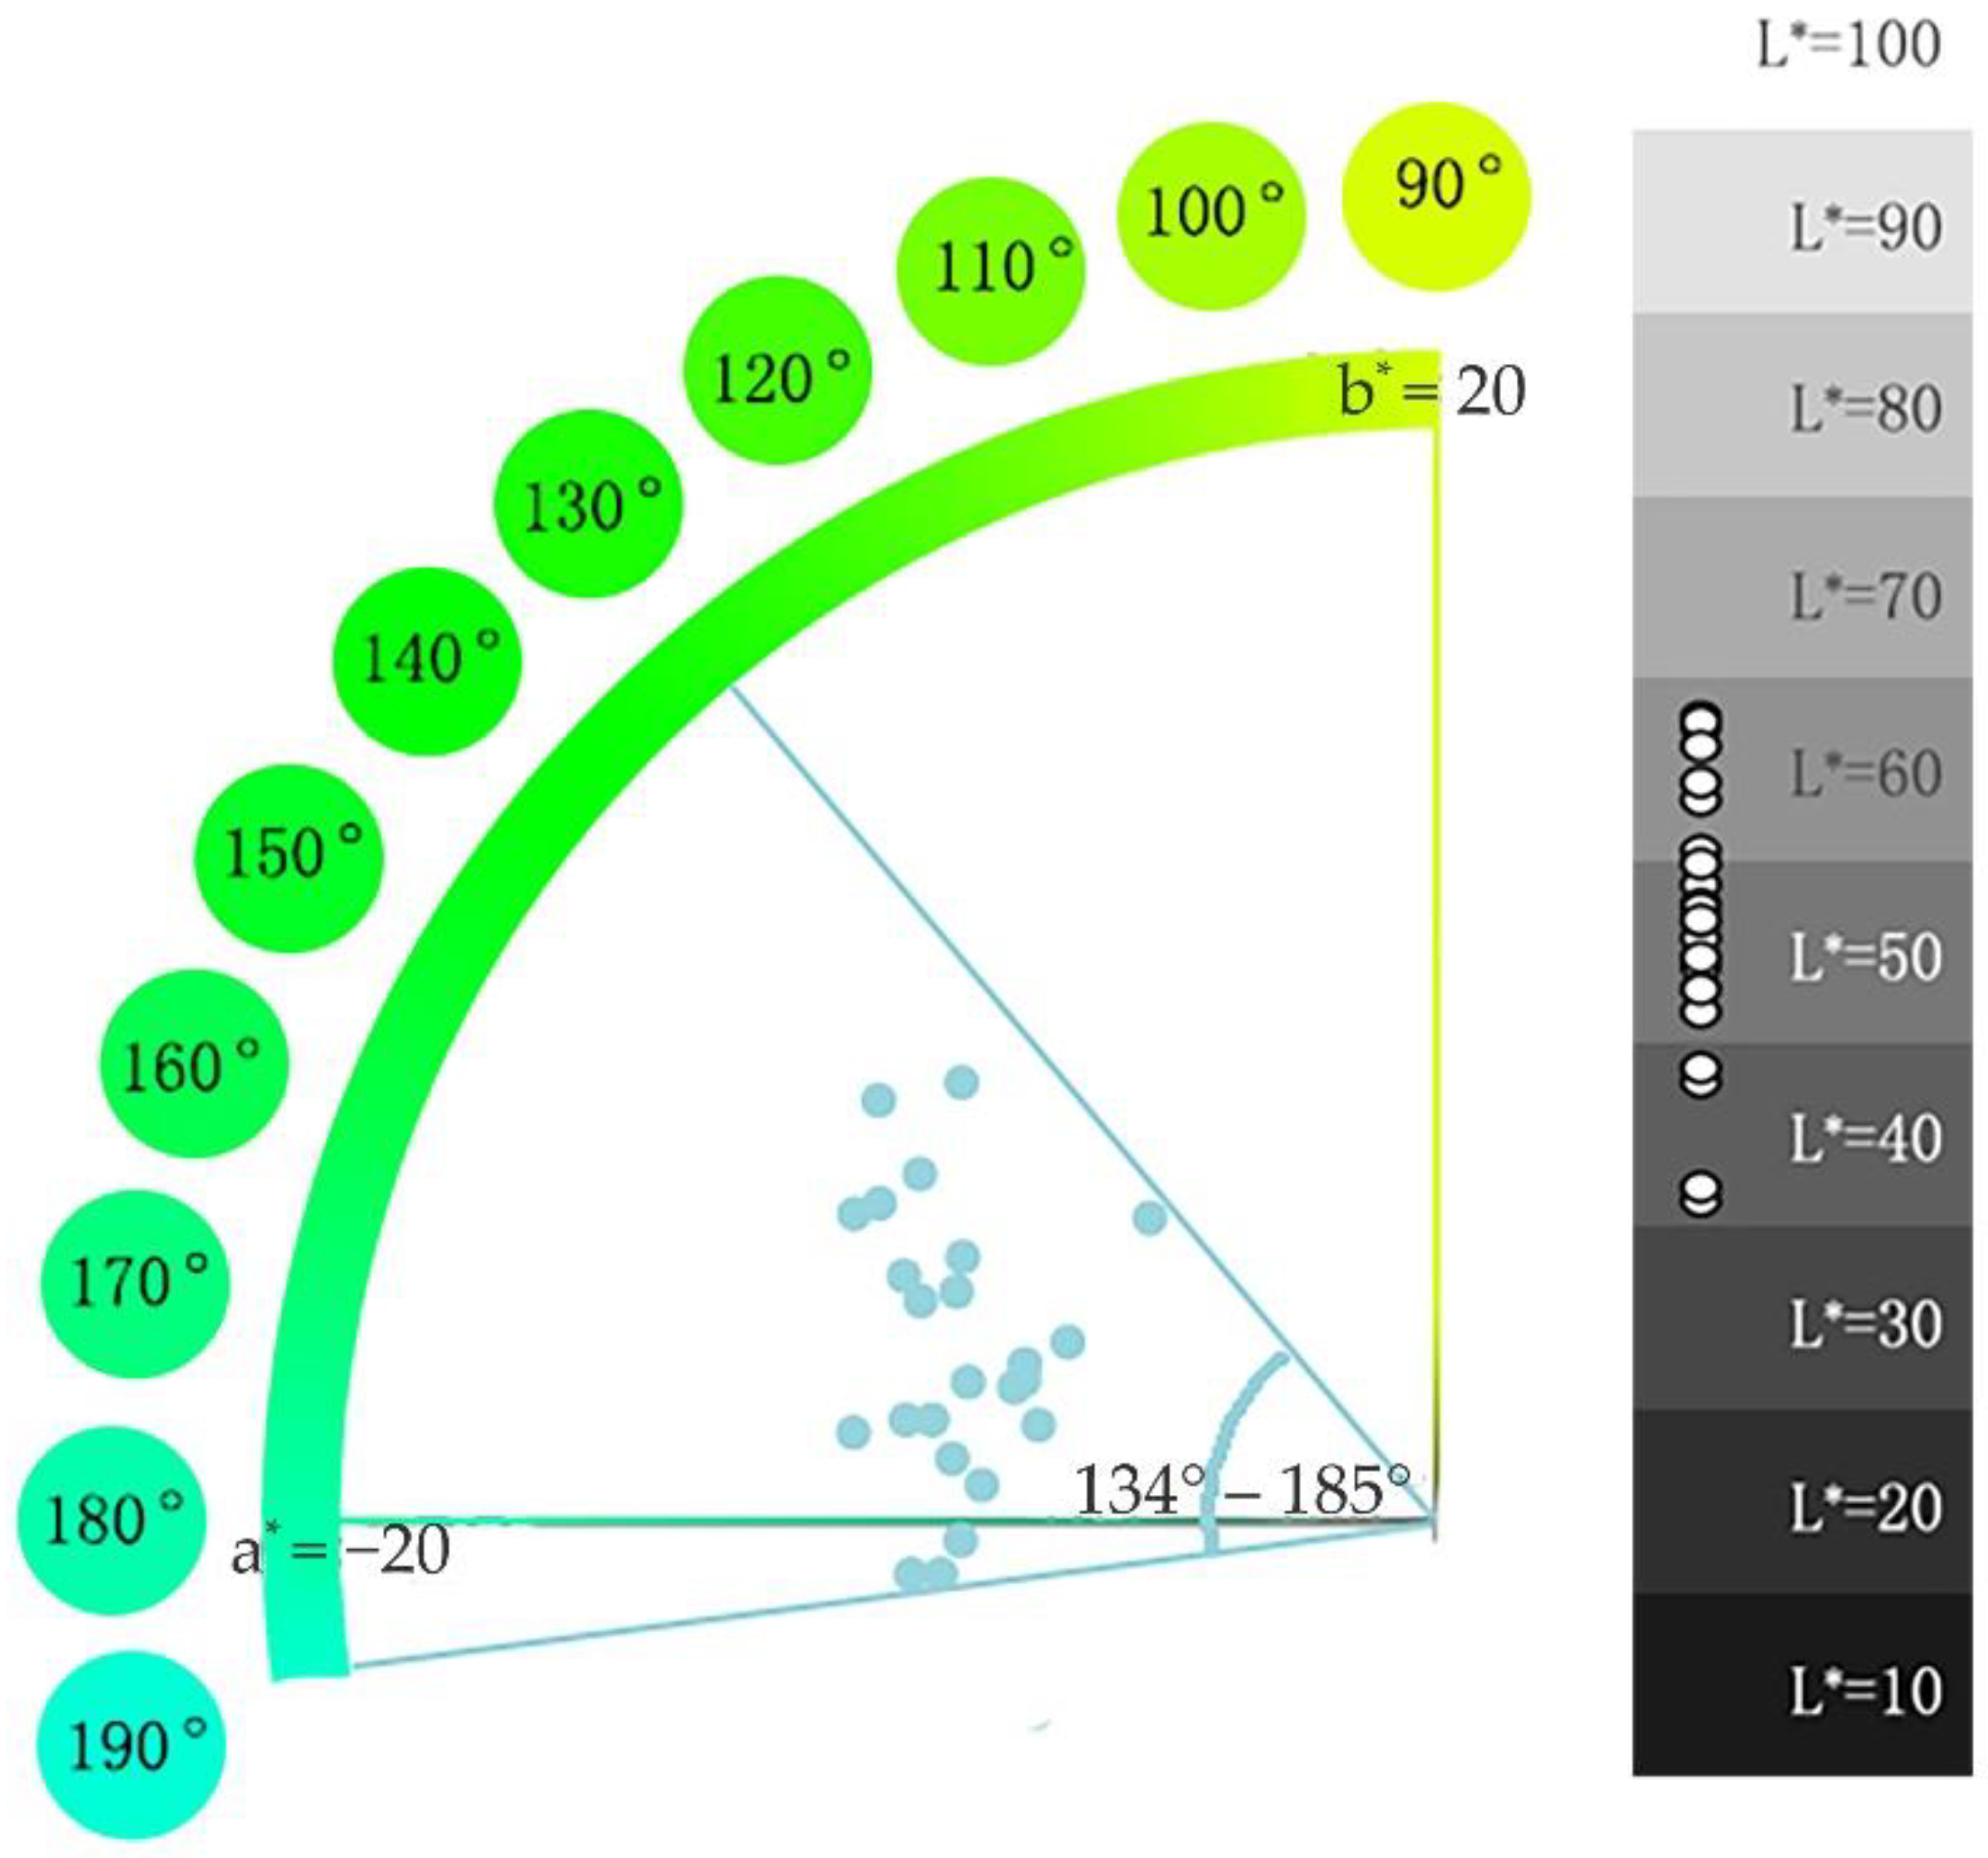
According to the test results, the color parameters of the experimental samples L* ∈ (41.7, 68.05), a* ∈ (−10.8, −5.3), b* ∈ (−0.85, 7.84), C* ∈ (7.55, 12.78), and h ∈ (134.2°, 185.2°), belonged to a blue-green tone interval, medium lightness, and low chroma (Figure 3). The test data can be found in Table S1 (see Supplementary Materials).
3.2. Characteristics of IR Spectroscopy
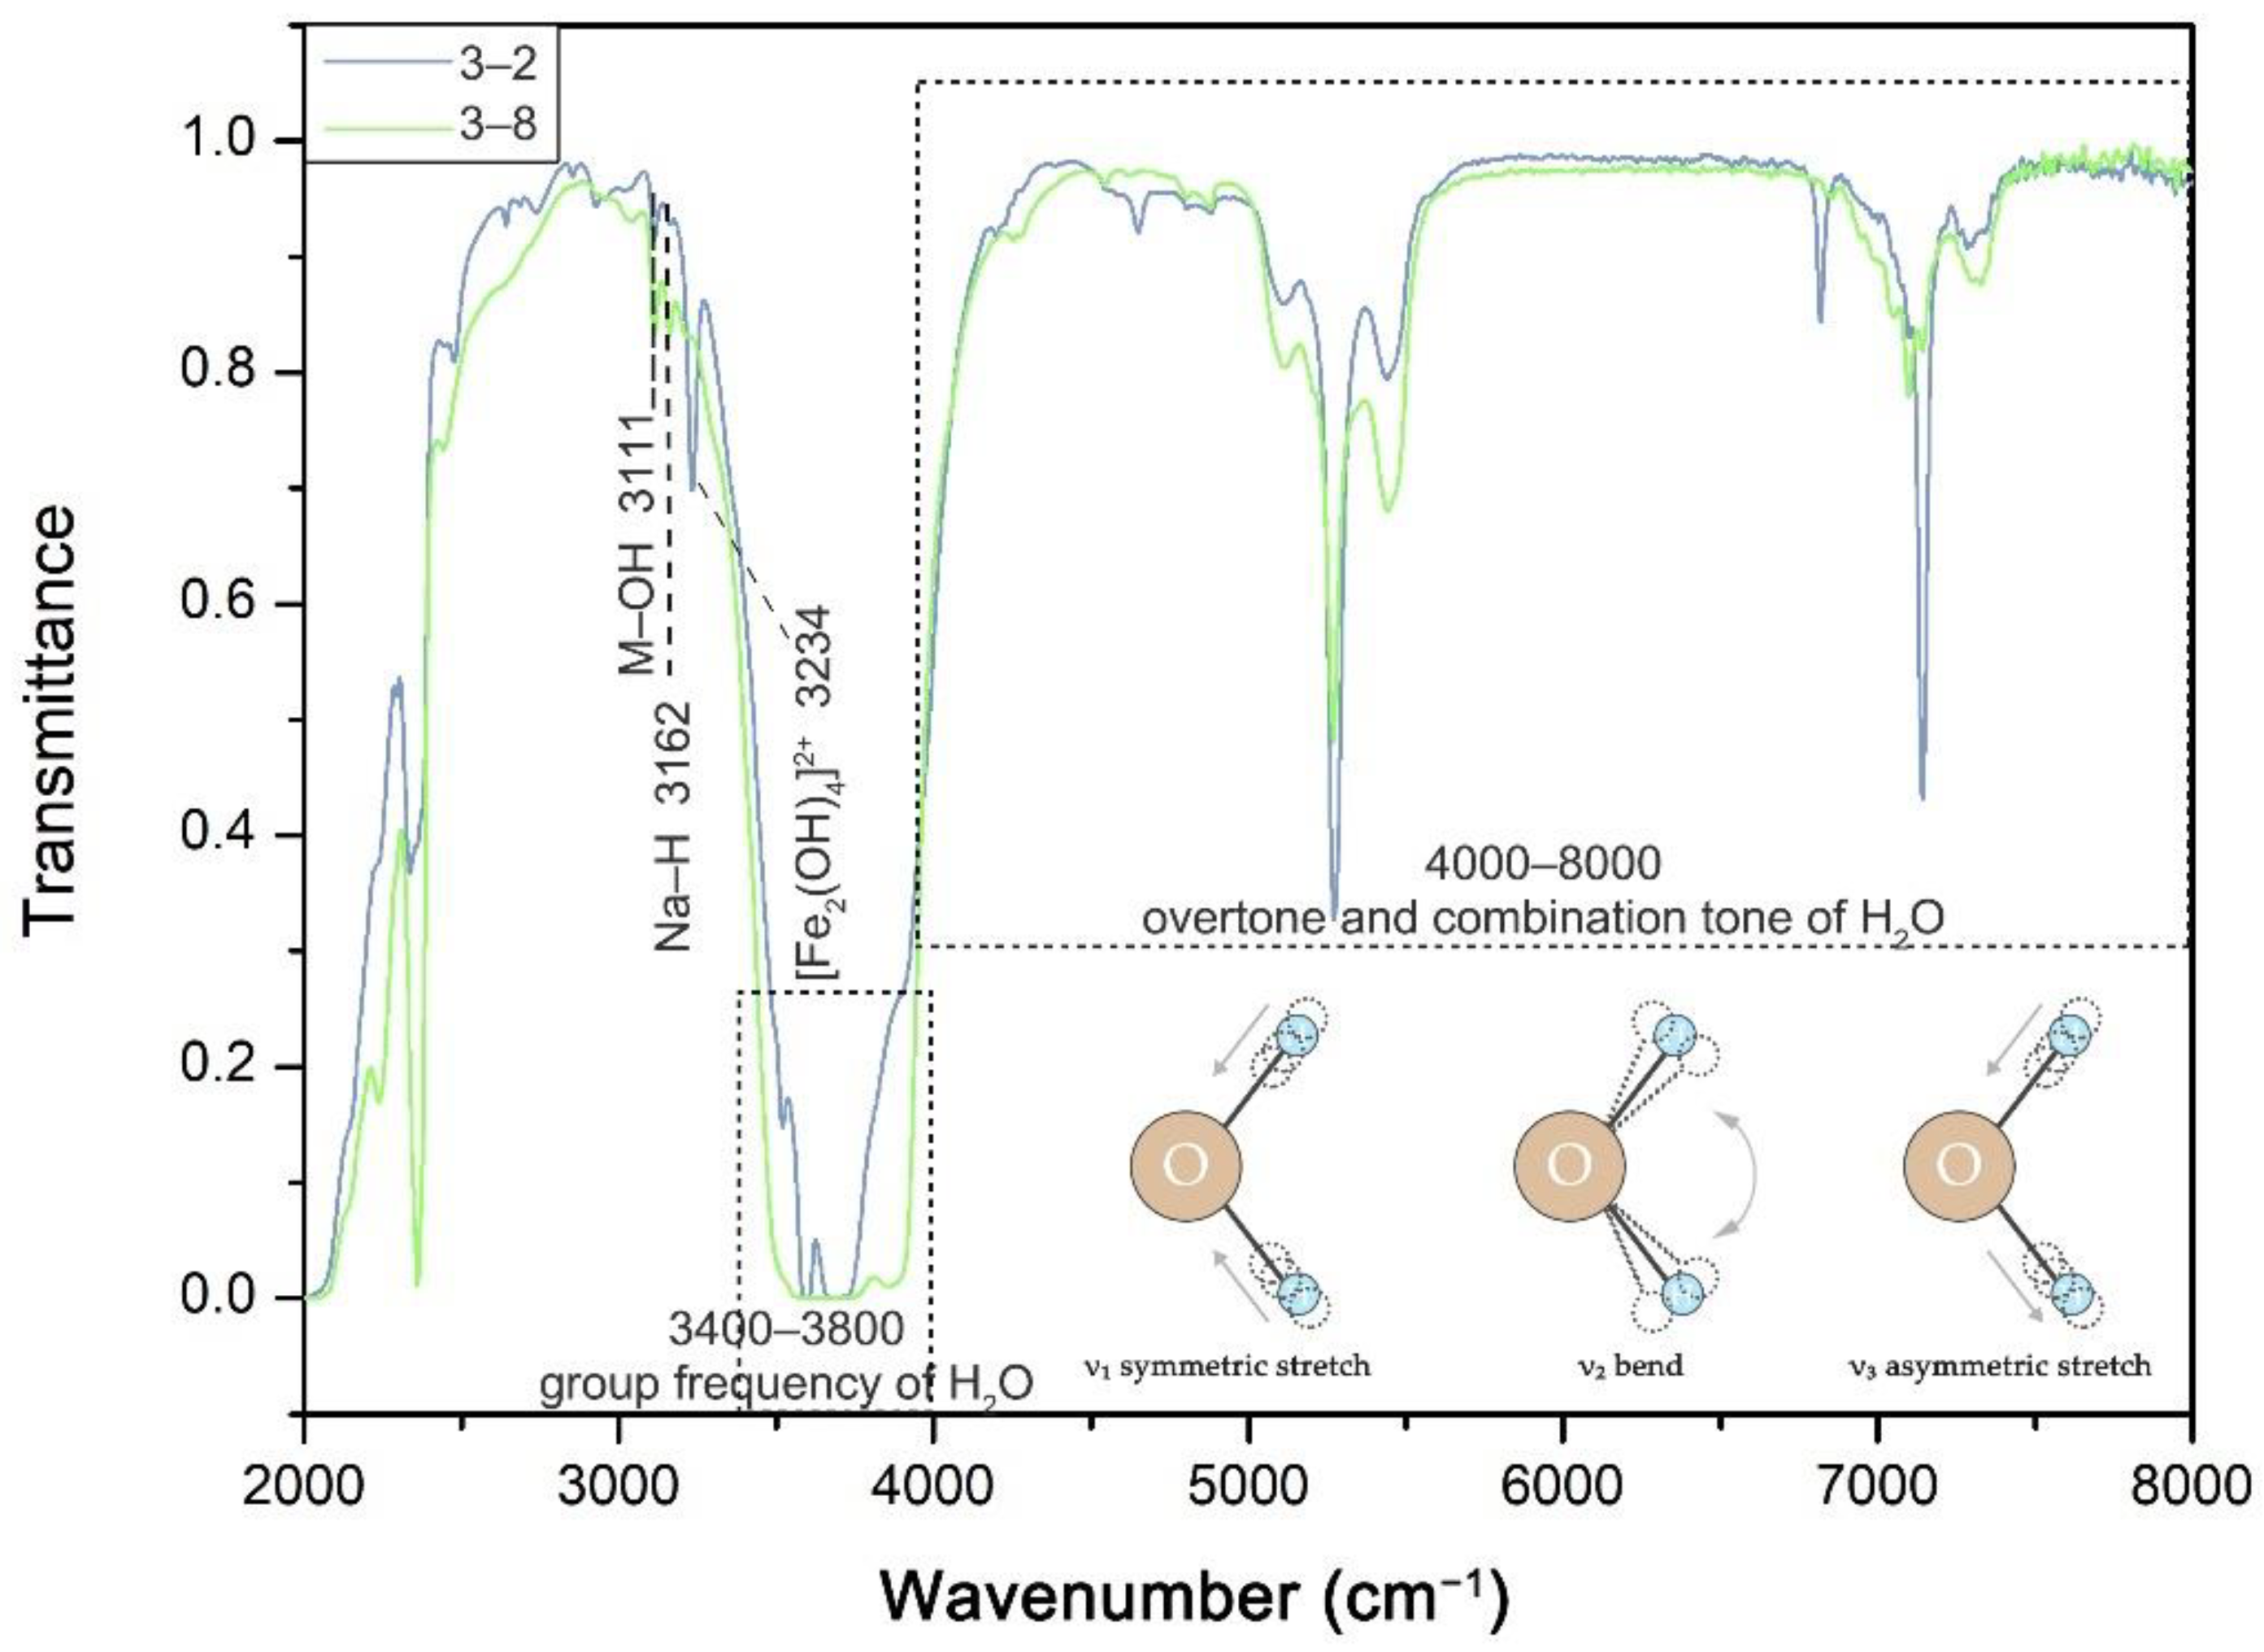
The IR spectra of 23 samples in the range of 2000–8000 cm−1 were obtained as follows (Figure 4), and the test data can be found in Table S2 (see Supplementary Materials).
The 3111 cm−1 was the absorption peak of M–OH, 3162 cm−1 was the absorption peak of Na–H, and 3234 cm−1 was the absorption peak of [Fe2(OH)4]2+. Some peaks for type I and type II water (Box 1) were valuable for this study. The fundamental frequency vibration zone of H2O was 3400–3800 cm−1, which including symmetric stretching vibration (ν1) and asymmetric stretching vibration (ν3) (the bending vibration (ν2) was below 2000 cm−1, and it was not tested and would not be discussed this time (Figure 4). 4000–8000 cm−1 was the combination and overtone zone of H2O.
Among the samples, absorption peaks of No. 2-3, 3-2, and 3-6 were slightly different from others, showing strong absorption at 3234 cm−1, 3520 cm−1, 4645 cm−1, 5269 cm−1, 7142 cm−1, and 3550–3650 cm−1, as shown by the blue curve in Figure 4. Other samples of spectra were similar with No. 3-8, shown by the green curve in Figure 4. There were several wavenumbers shift of absorption peaks, which were caused by different types of alkali ions in the channels [19].
Box 1. Type I and type II water in beryl channel.
There are two types of H2O molecules in the beryl channel: (1) type I water, whose symmetry axis is parallel to the c-axis; (2) type II water, whose symmetry axis is perpendicular to the c-axis. Standard beryl contains only type I water. When there are alkali ions in the channel, the type I water will be rotated 90° to type II water due to the charge attraction between the alkali cation and the O2− [1,2,3,13,14,20,21]. The H–H axis of type I water is bound to Be and Al, respectively, to form chemical bonds such as Be–HOH–Al. The O–H vibration is mainly controlled by Be, Al, and the longitudinal crystal field. The O2− of type II water is bound to the alkali ion, and the O–H vibration is mainly controlled by the alkali ion and the transverse crystal field. So, the vibration frequencies of the two types of water are different [14].
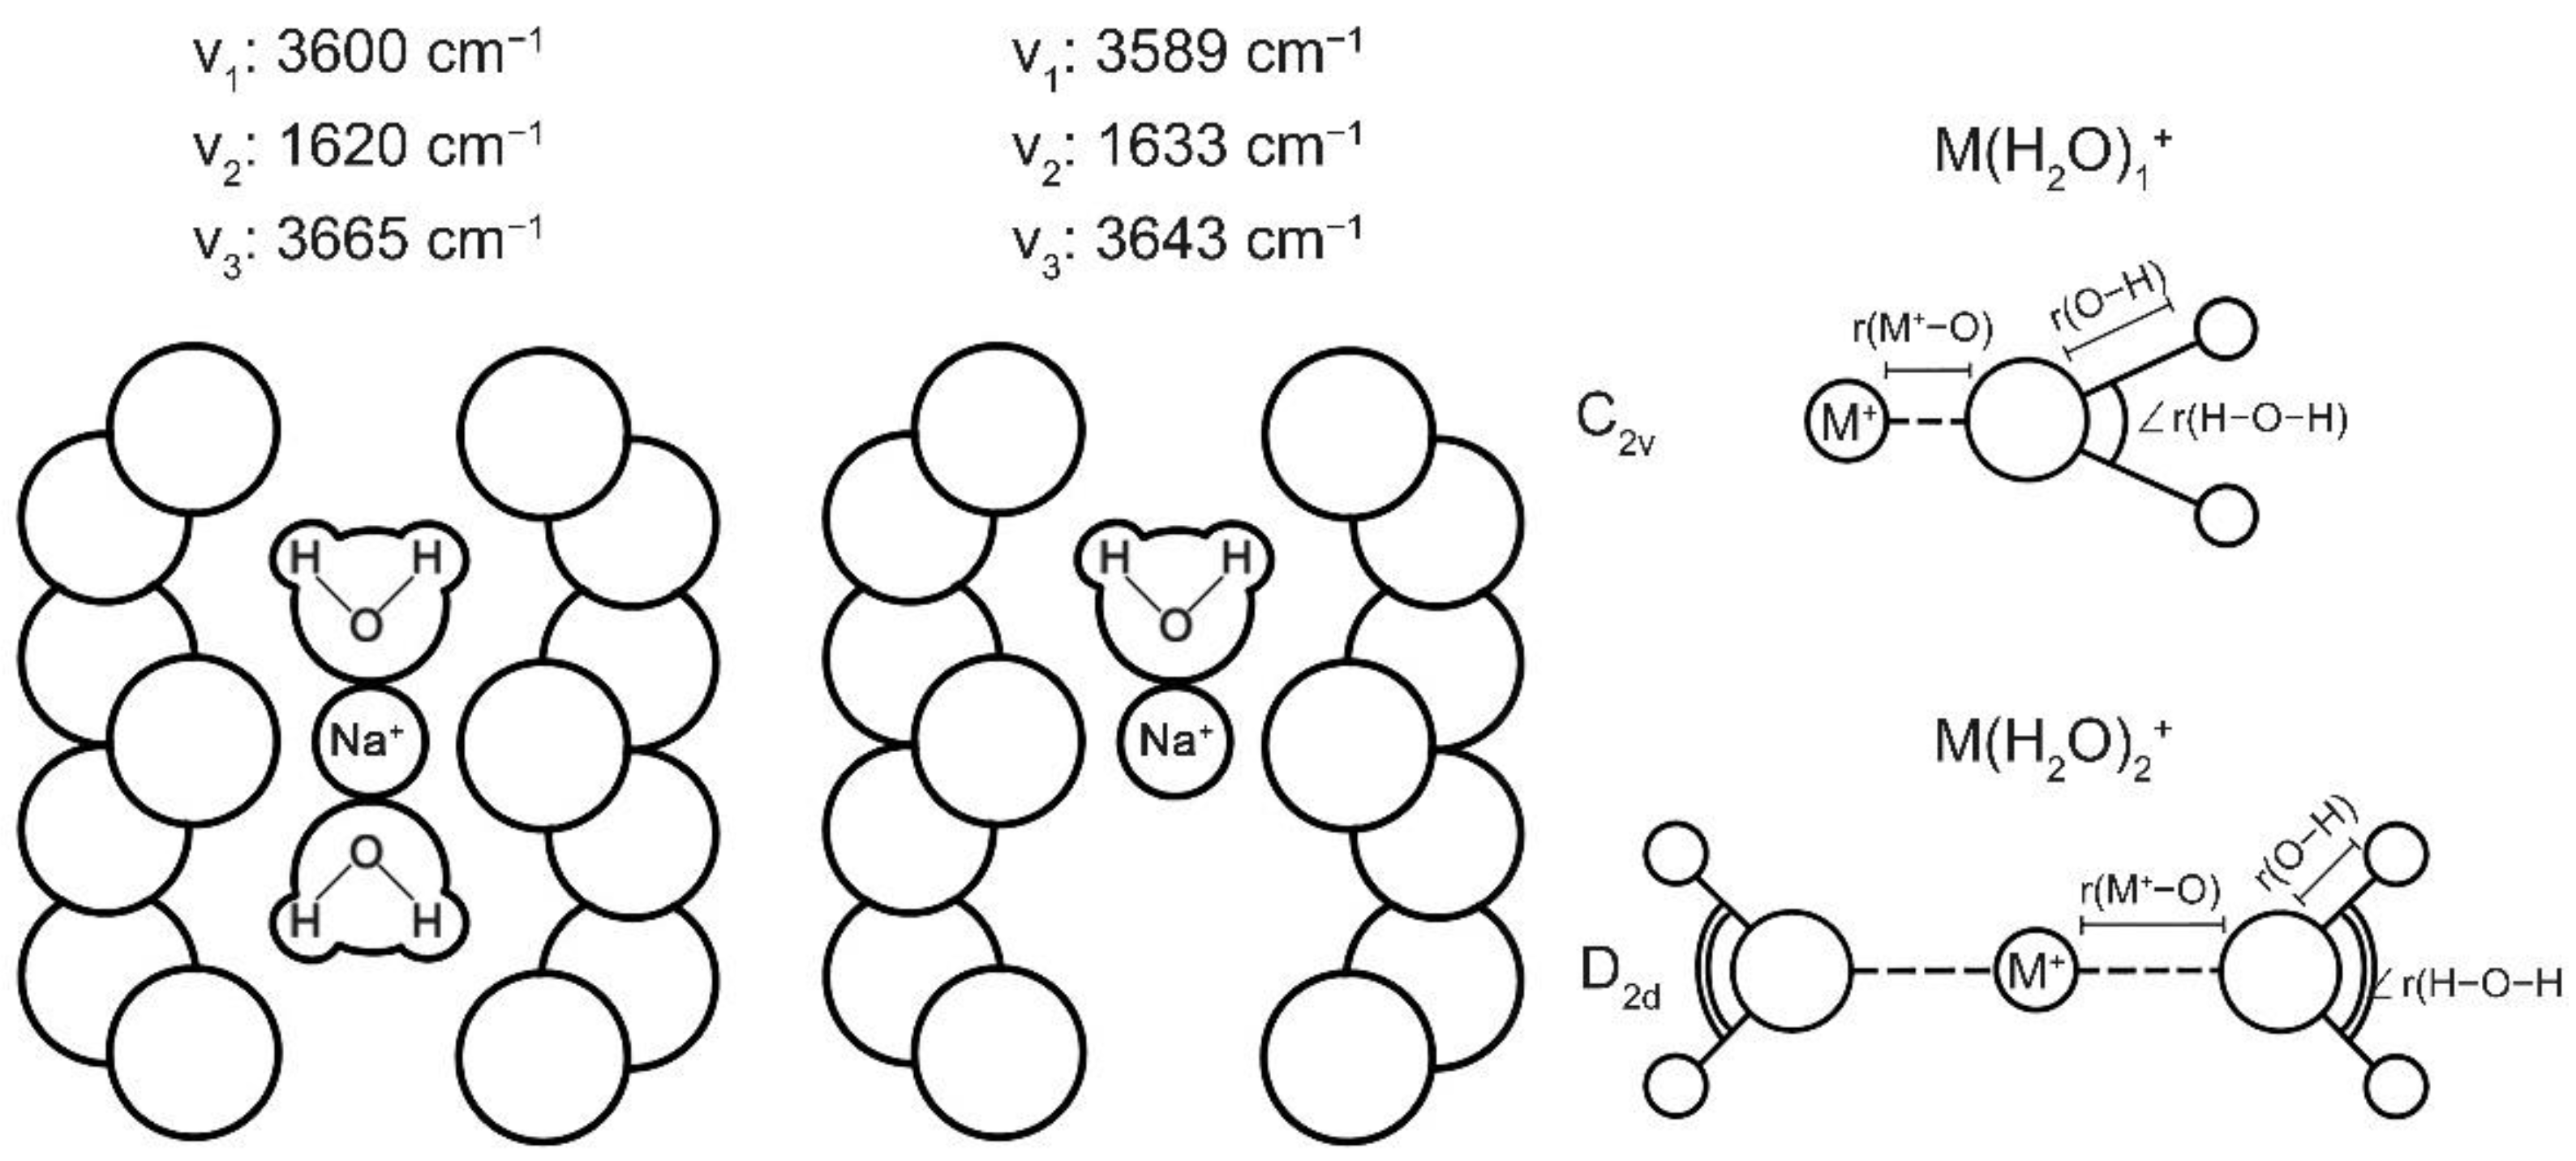
Furthermore, D. G. et al. and K. B. et al. [20,22,23] found that in most beryl, each alkali ion combined with two type II water (Figure 5, left), but in the water-poor samples, each alkali ion only combined with one type II water (Figure 5, middle). This resulted in a vibration frequency shift of type II water. D. G. et al. [20] also explained this in terms of bond length and bond angle (Figure 5, right): in the latter case, the M–O bond length was shortened because of the inductive effect, the O–H bond length increased, and bond angle decreased, so the bending vibration (ν2) increased and the symmetric stretching vibration (ν1) and asymmetric stretching vibration (ν3) decreased.
Figure 5.
Schematic diagram of type II water in water-rich and water-poor condition (from G. Della Ventura [20], redrawn).
Figure 5.
Schematic diagram of type II water in water-rich and water-poor condition (from G. Della Ventura [20], redrawn).

After a comprehensive analysis of previous research, the assignment of characteristic spectrum peaks is shown in Table 1.
3.3. Total Iron and Fe2+ Content
The relative total Fe content of 23 samples was tested by XRF and the test data was shown in Table S3 (see Supplementary Materials). The relative content of Fe2+ in 10 samples was obtained by a chemical analysis of silicate rocks and the test data was shown in Table S4 (see Supplementary Materials). The relative content of Fe3+ is the difference between total Fe and Fe2+. The relative content of Al3+ was also determined by XRF. The above data are listed in Table 2.
3.4. Characteristics of XRD
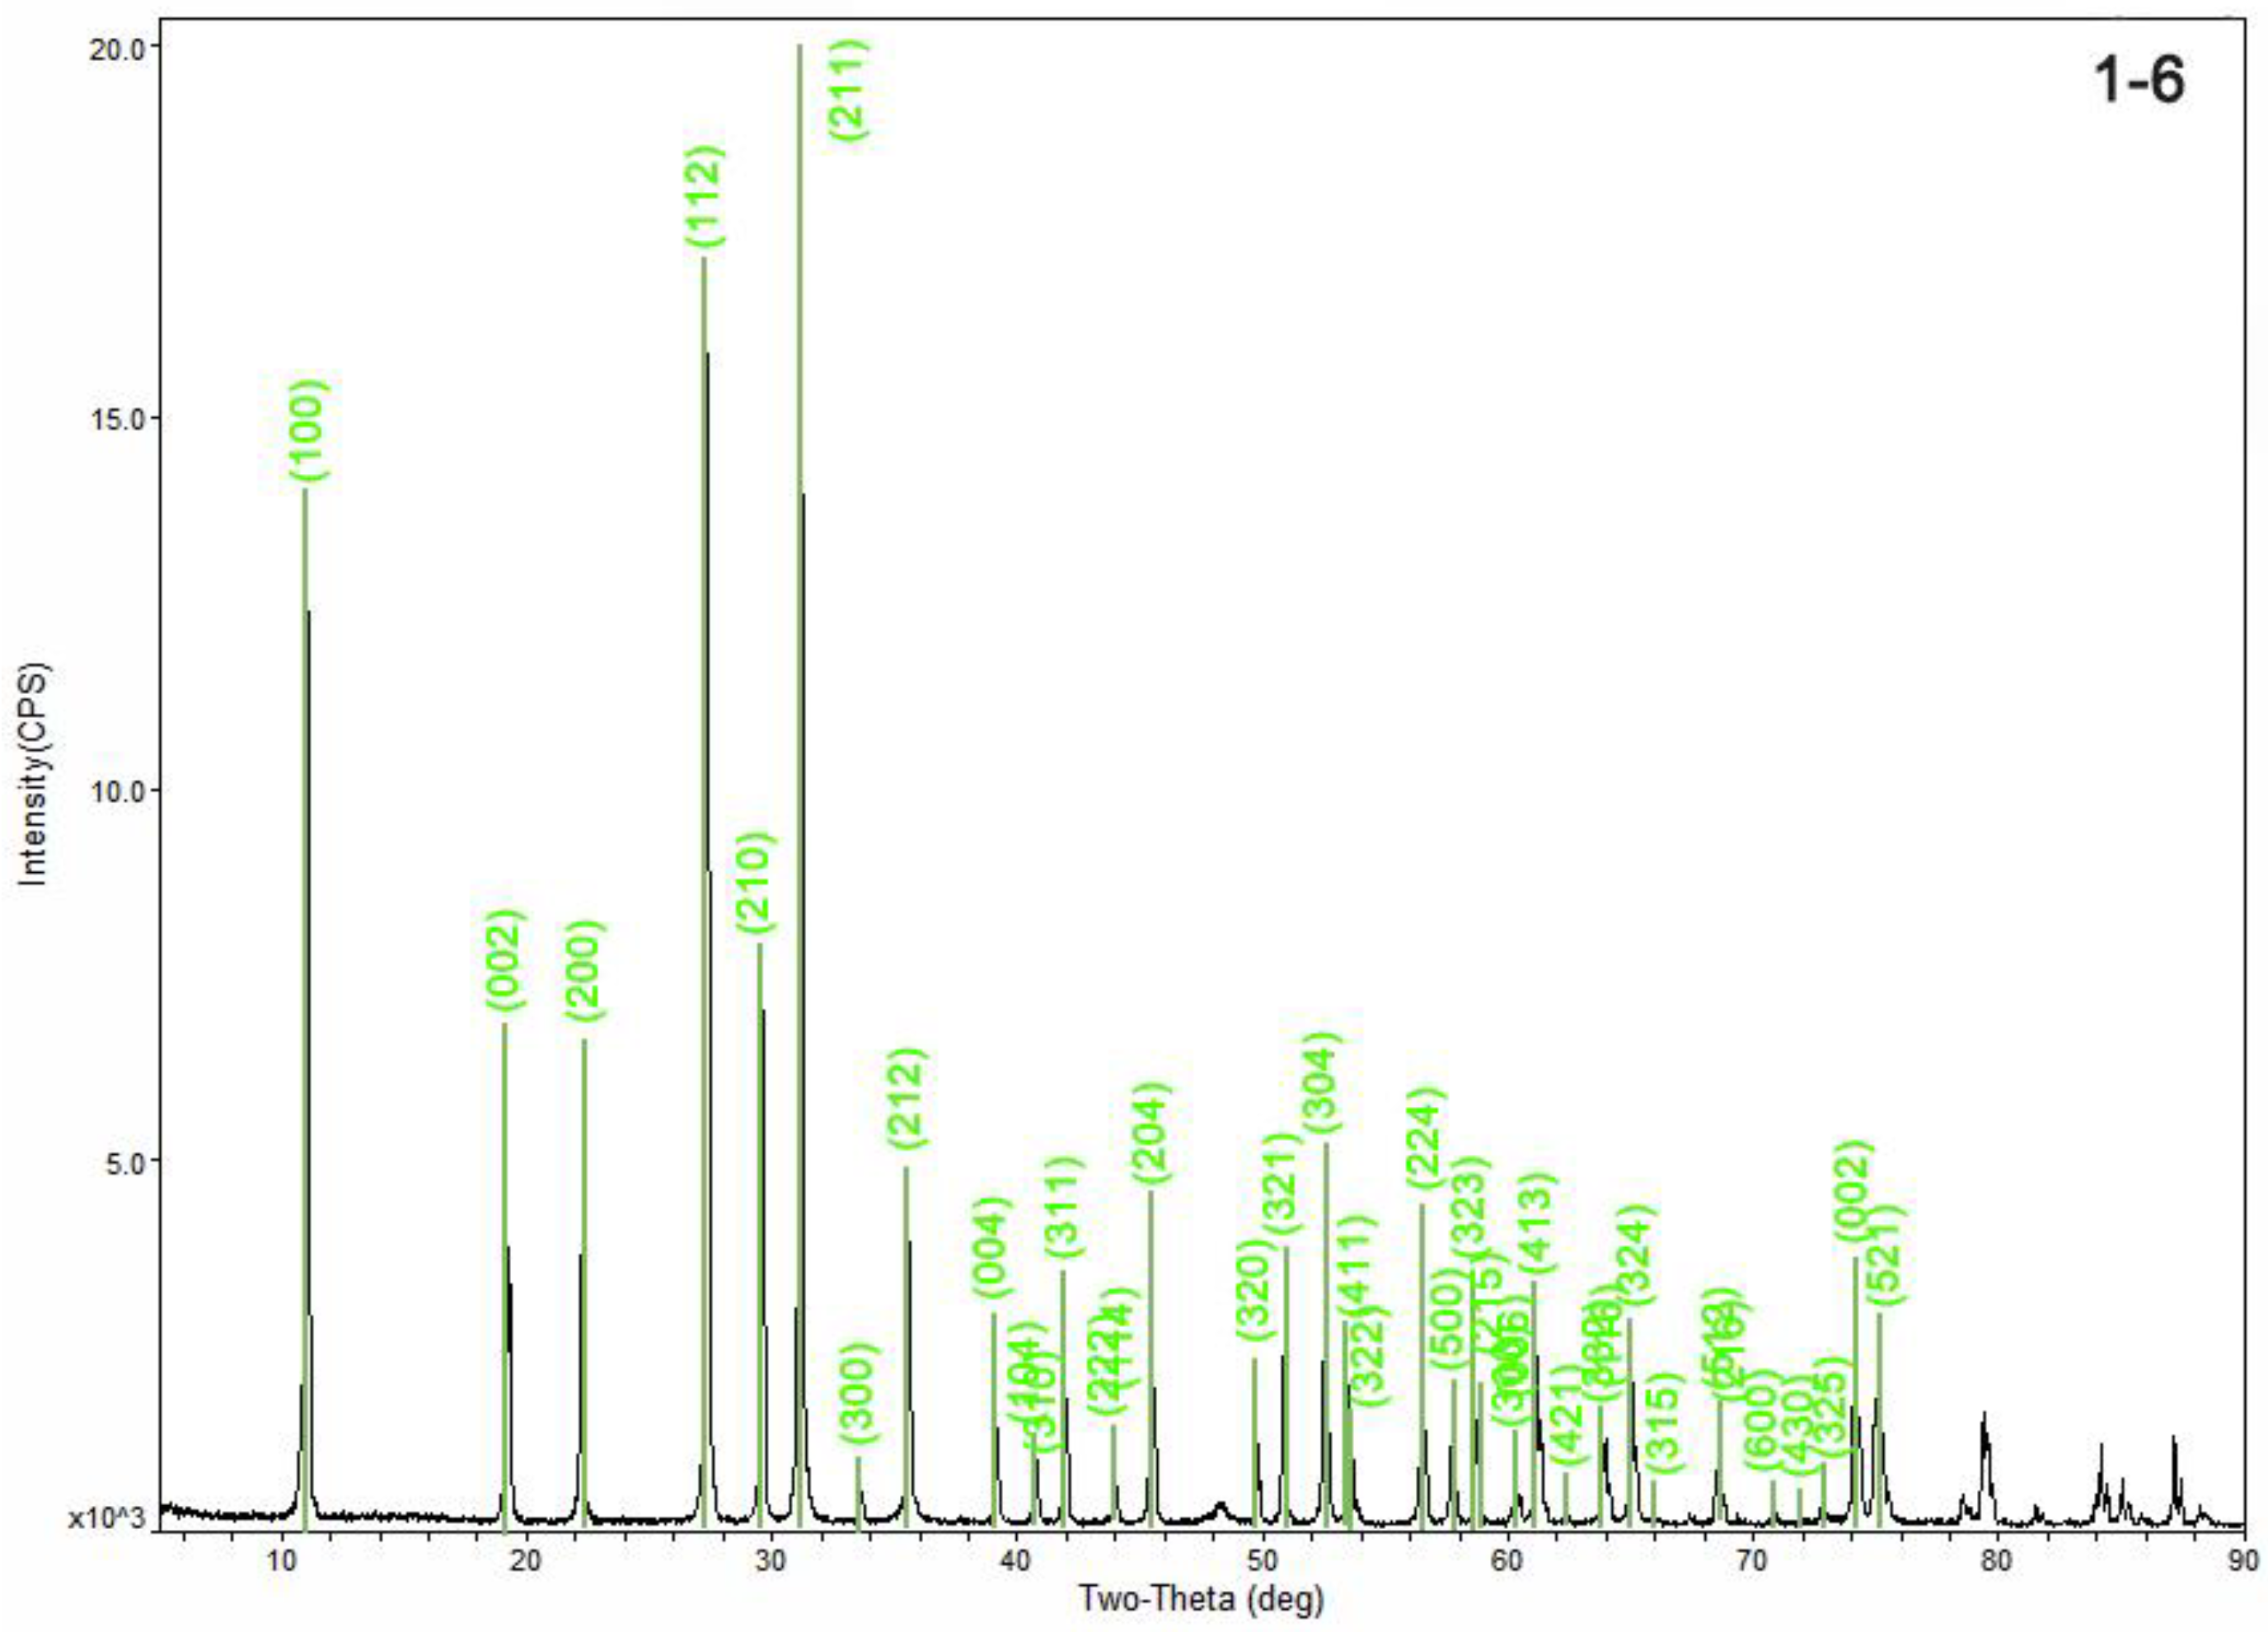
The samples were multiphase beryl and other diffraction lines could be detected besides the standard beryl diffraction lines (Figure 6).
Beryl’s symmetry is P6/mcc (D6h2). The crystal cell parameters can be obtained by XRD and refinement. In standard beryl samples (PDF card: 09-4310), a0 = 9.217 Å and c0 = 9.192 Å. When the octahedral Al3+ is replaced by transition metal ions, a0 increases due to the increase of the ion radius, whereas when the tetrahedral Be2+ is replaced by Li+ or Cu2+, c0 increases. Beryl can be divided into two types according to the c/a value [26]:
Octahedral substitution of Al3+ is dominant: c/a = 0.991–0.998;
Tetrahedral substitution of Be2+ is dominant: c/a = 0.999–1.003.
XRD was carried out on the samples, and JADE 6.5 was used to refine the diffraction lines. With reference to the standard beryl PDF card 09-4310, the crystal cell parameters were obtained (Table 2). Both tetrahedral and octahedral substitutions can be found because the a0 and c0 of the samples were higher than the standard beryl, and the octahedral substitutions were the main one.
4. Discussion
4.1. The Relative Content of Water in the Channel Deduced by IR
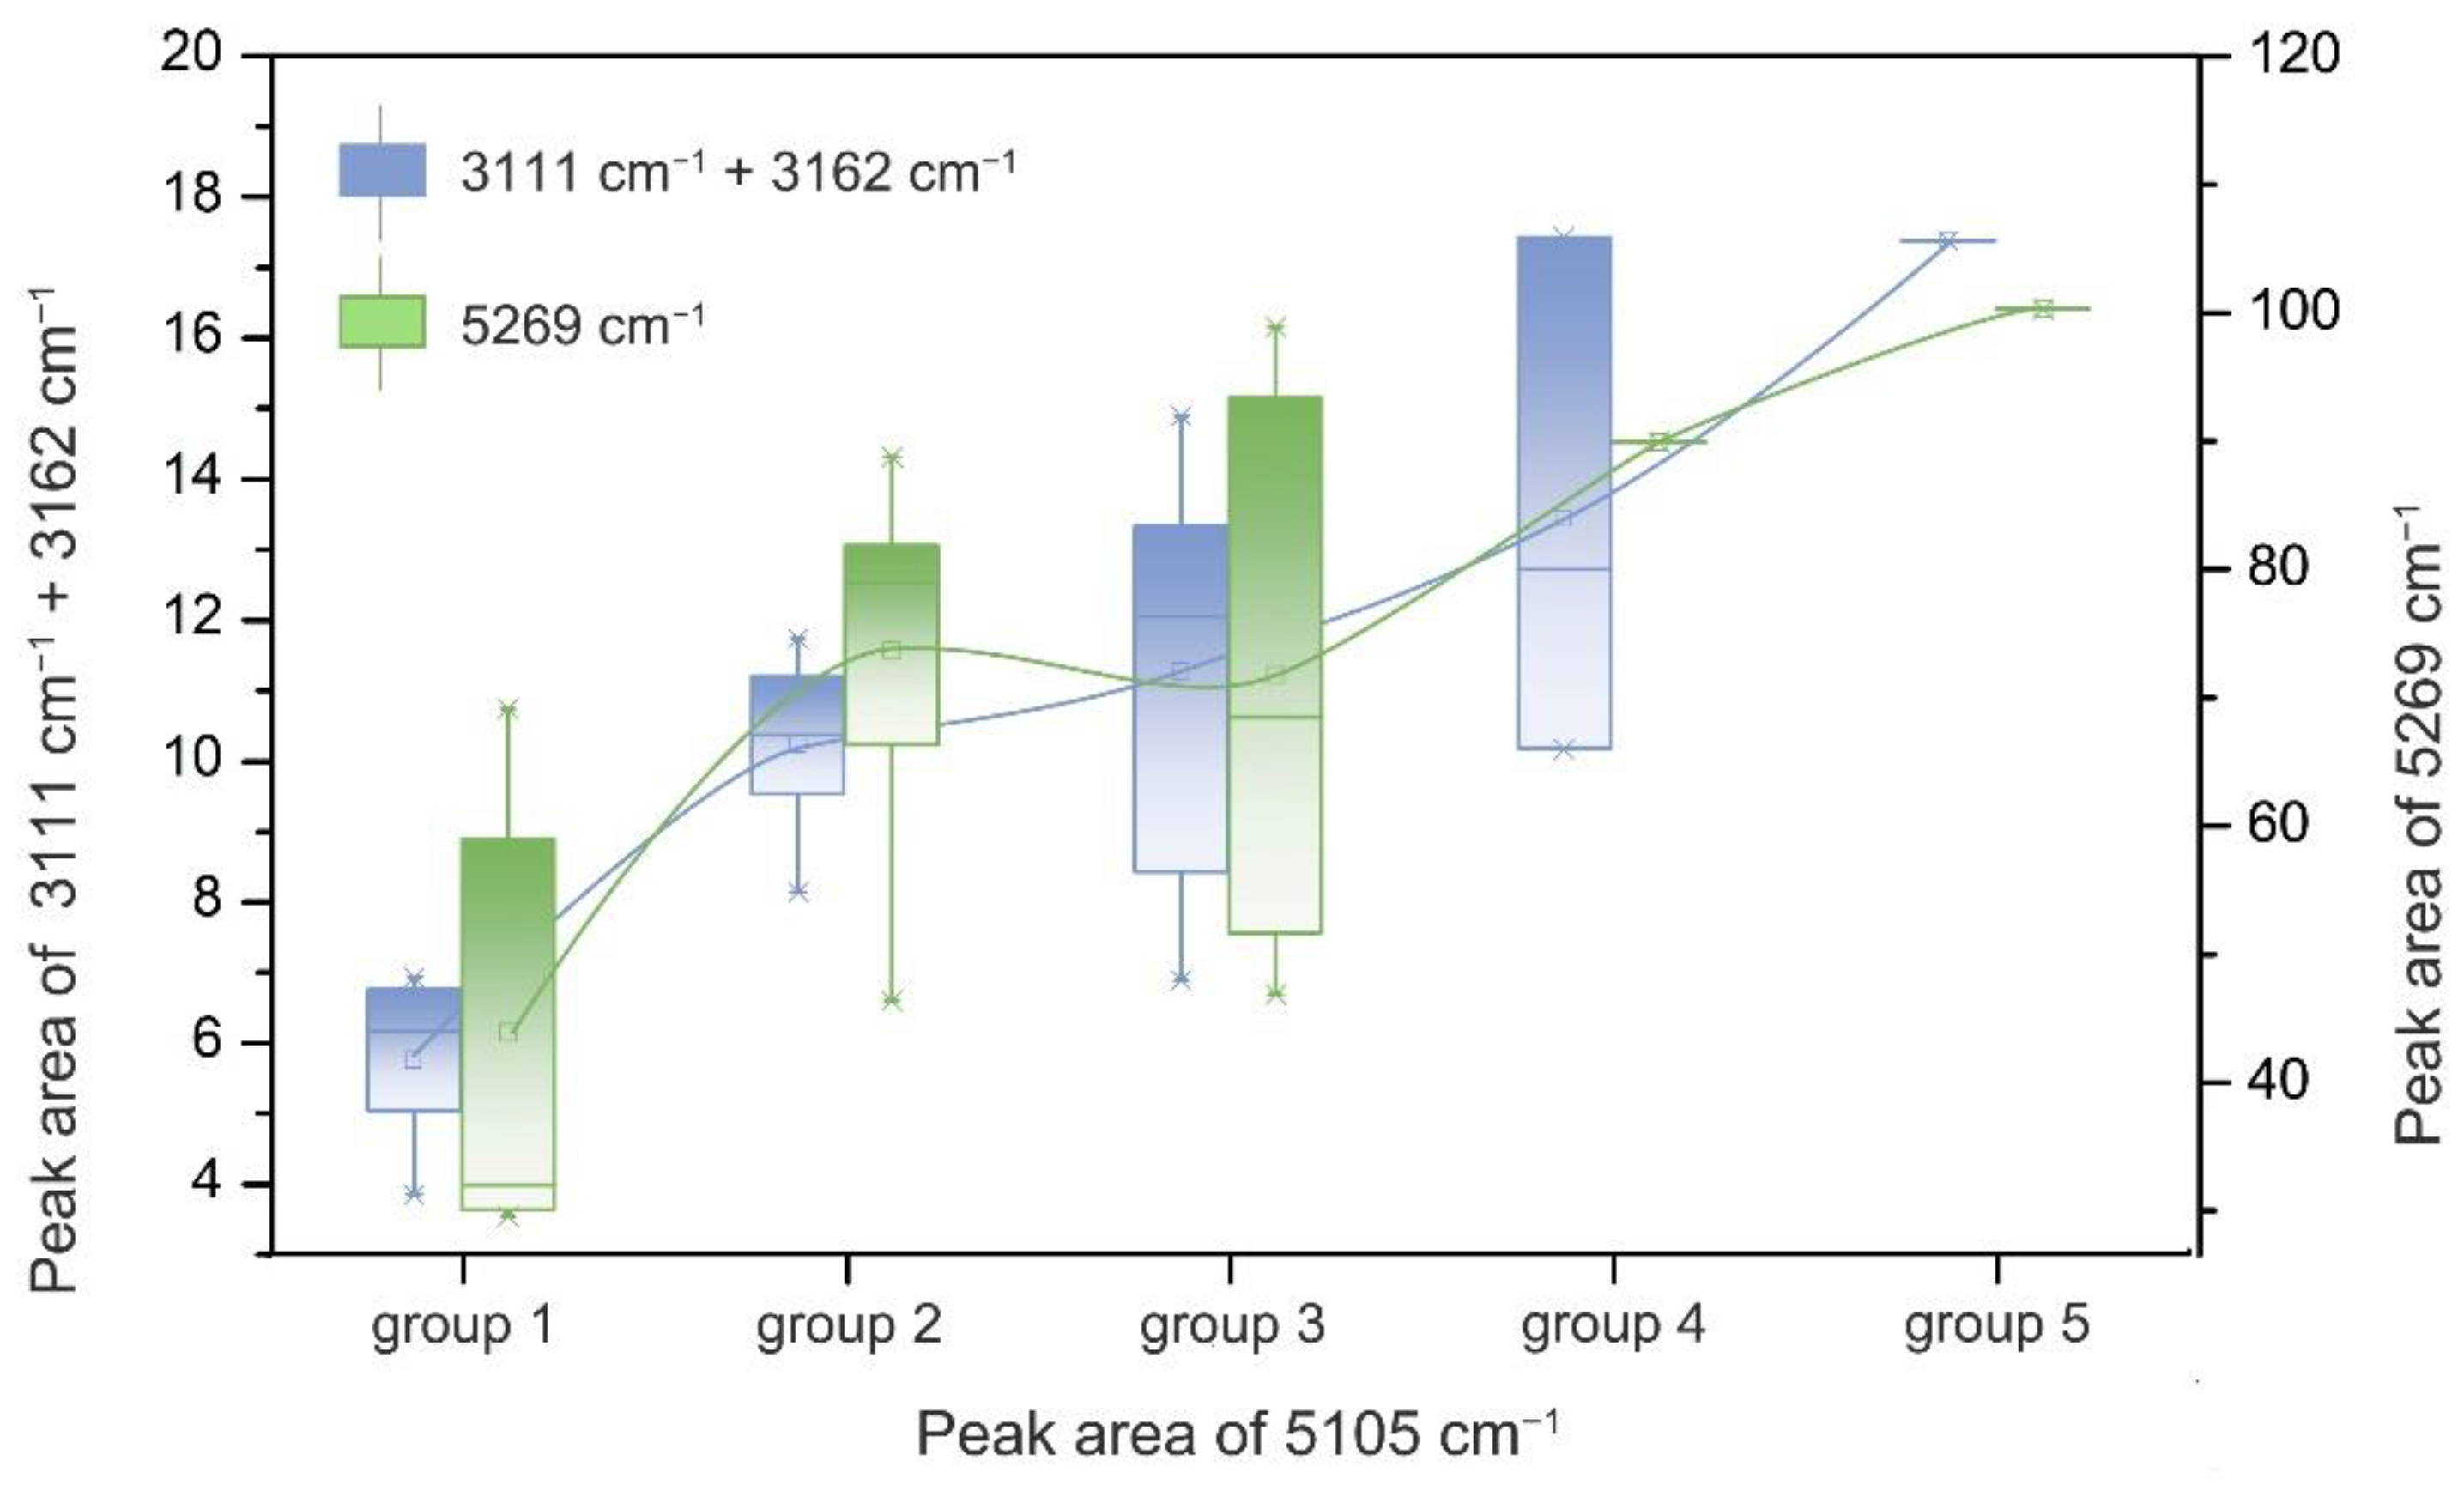
Although Li [21] concluded that the peak at about 5105 cm−1 was the combination peak of type I water, through the study of IR spectrum, it was found that the peak at 5105 cm−1 was positively correlated with the sum of the peak areas of 3111 cm−1 (M–OH) and 3162 cm−1 (Na–H), and with the peak at 5269 cm−1 (type II water, Figure 7). Furthermore, ν1I + ν2I = 1542 cm−1 (this data from D.L. [13]) + 3558 cm−1 = 5100 cm−1 was slightly less than 5105 cm−1, whereas ν1II + ν2II = 1628 cm−1 (this data from D.L. [13]) + 3605 cm−1 = 5233 cm−1, as according to Weng [27], the combined frequency must be less than the sum of fundamental frequency, so the peak here was concluded to be ν1II + ν2II more likely.
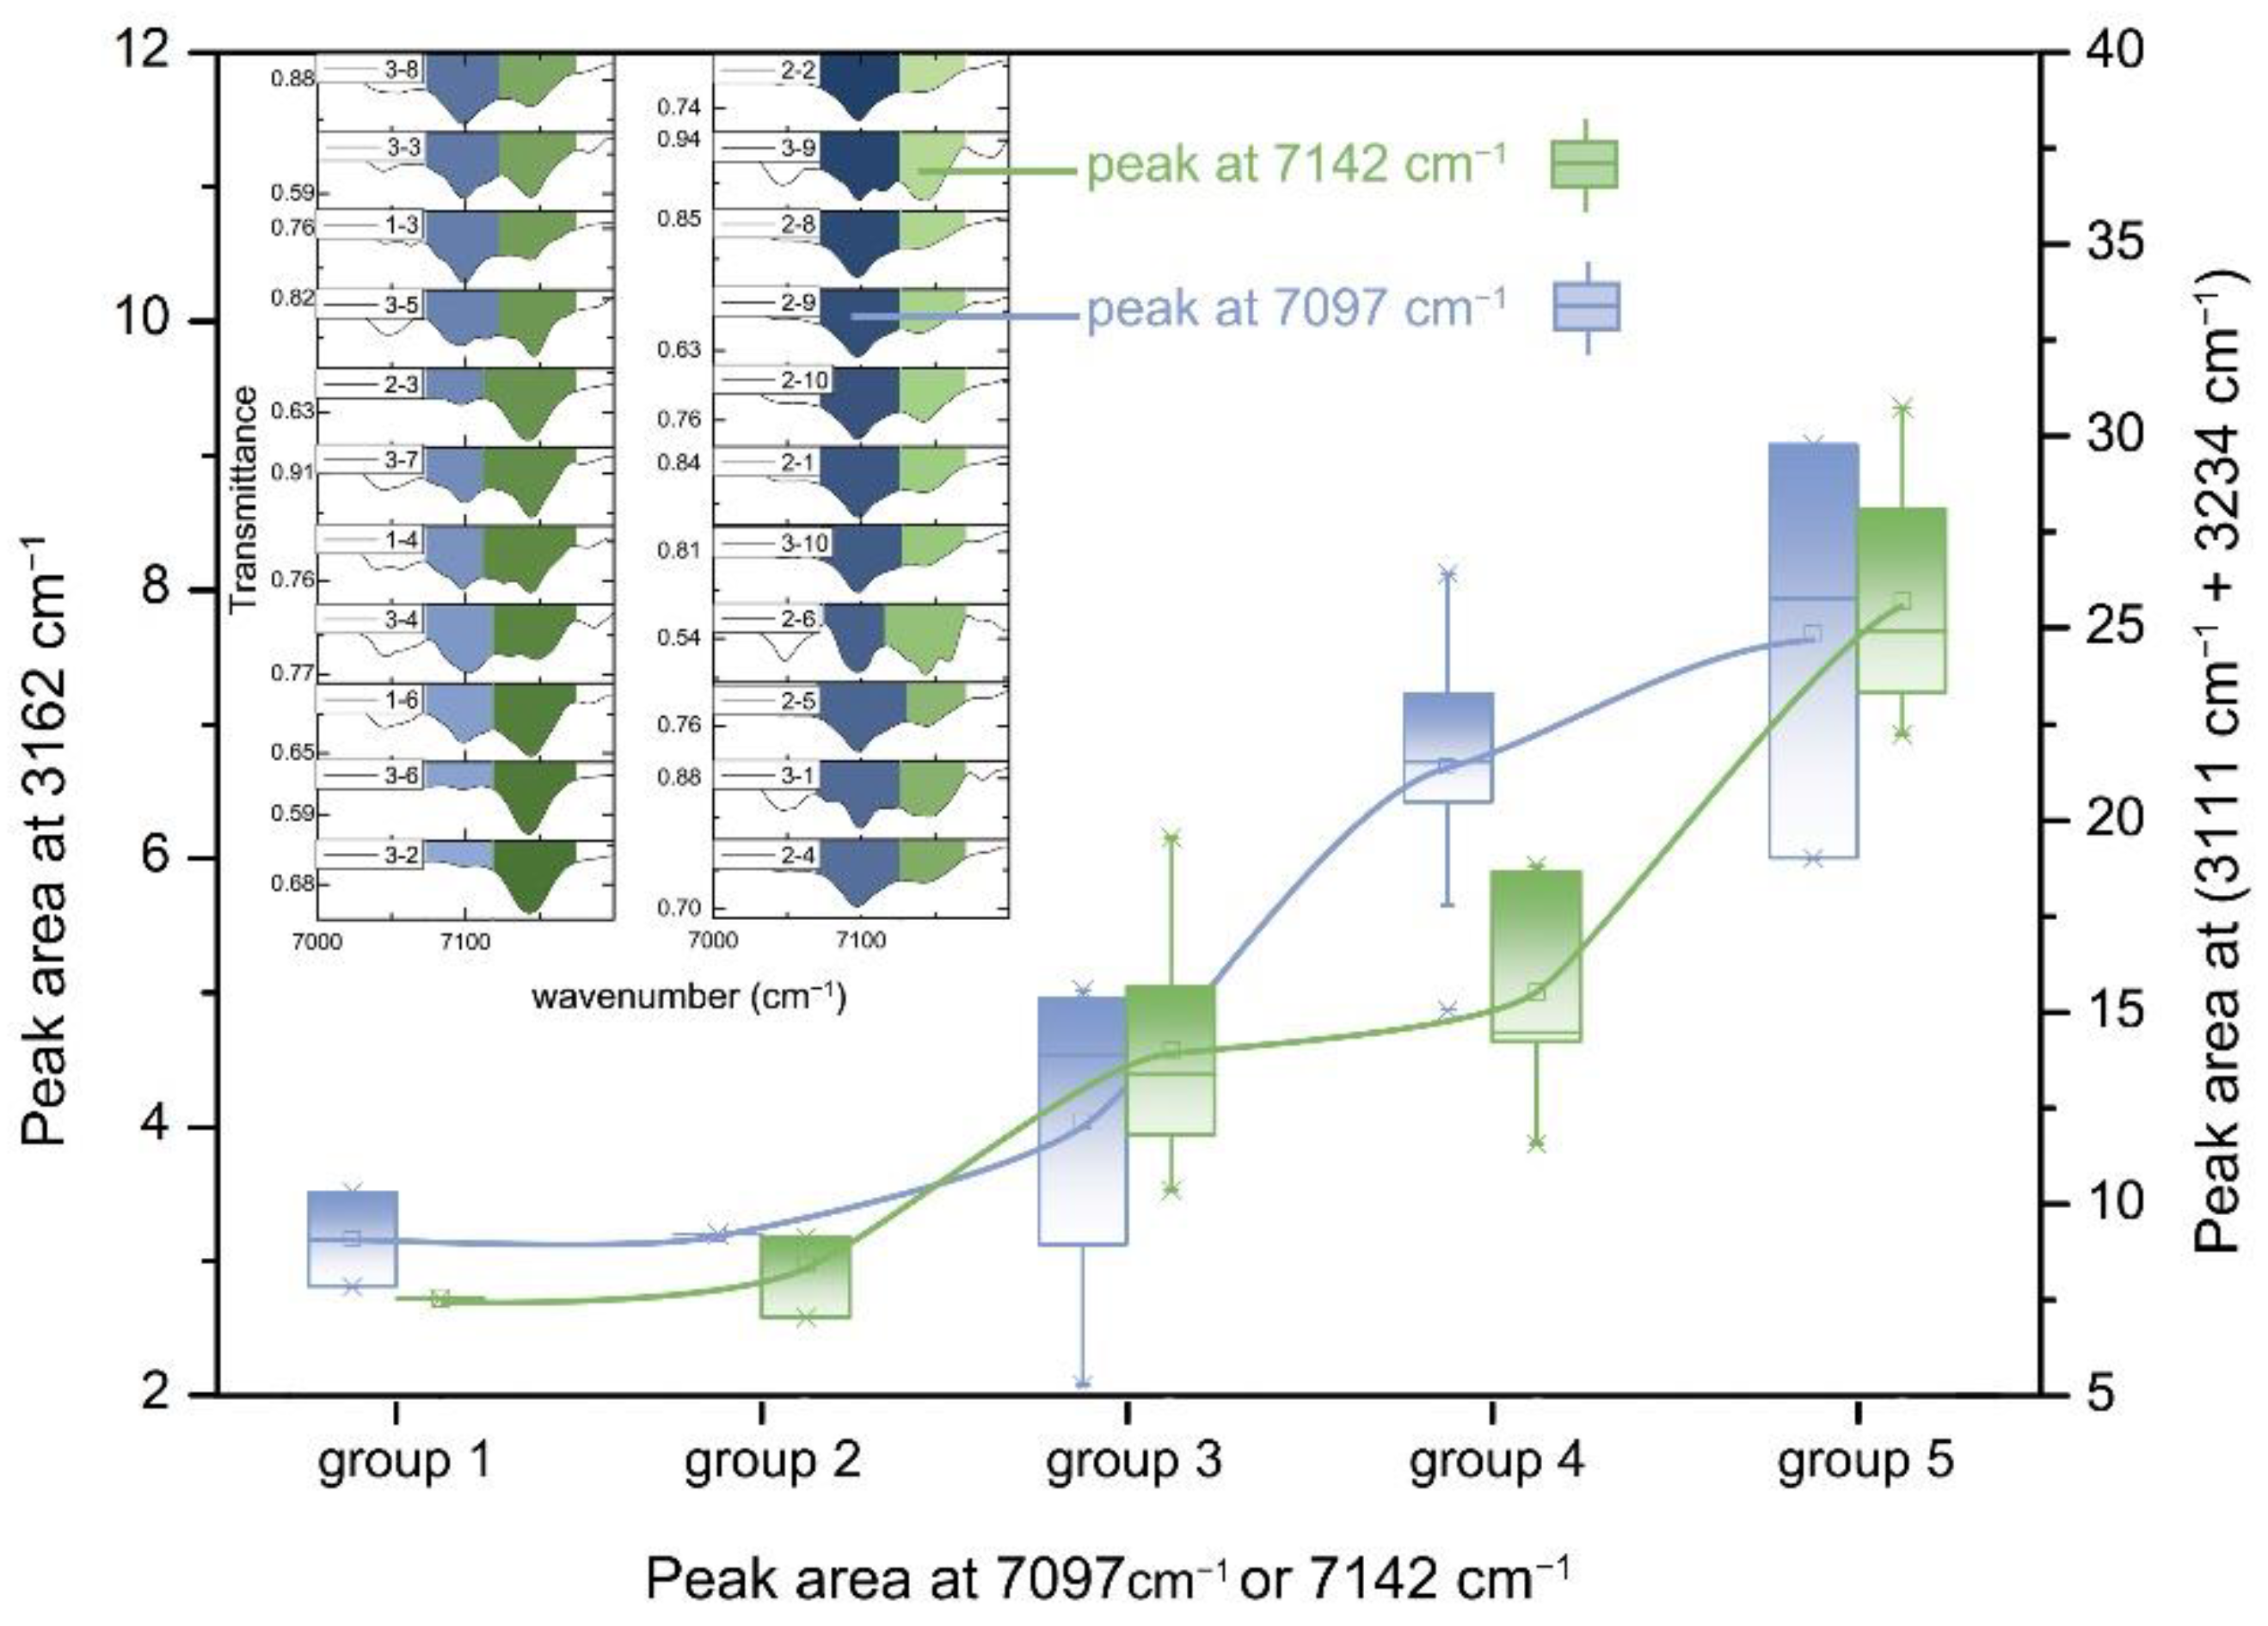
In addition, Li [21] assigned 7098 cm−1 as the first-order overtone peak of type I water, and Mashkovtsev et al. [19] assigned 7142 cm−1 as the combined peak of type I water. Theoretically, with the change of type I water, the two peaks in different samples should show the same trend of change. However, as can be seen from Figure 8, the two peaks in different samples differed greatly. Furthermore, it was found that the peaks at 7097 cm−1 and 7142 cm−1 were controlled by the types of metal ions in the channel. When the sum of peak areas at 3111 cm−1 + 3234 cm−1 was large (representing large radius cation content), the peak area at 7097 cm−1 was large. When the peak area at 3162 cm−1 (representing Na+, small radius cation content) was large, the peak area at 7142 cm−1 was large. Therefore, it was speculated that these two peaks were not the overtone and combination peaks of type I water, but probably related to the overtone or combination peaks of metal cation in the channel.
4.2. Relationship between Type II Water Content and Colour
The strong absorption peak at 5269 cm−1 was selected as the characteristic peak of type II water.
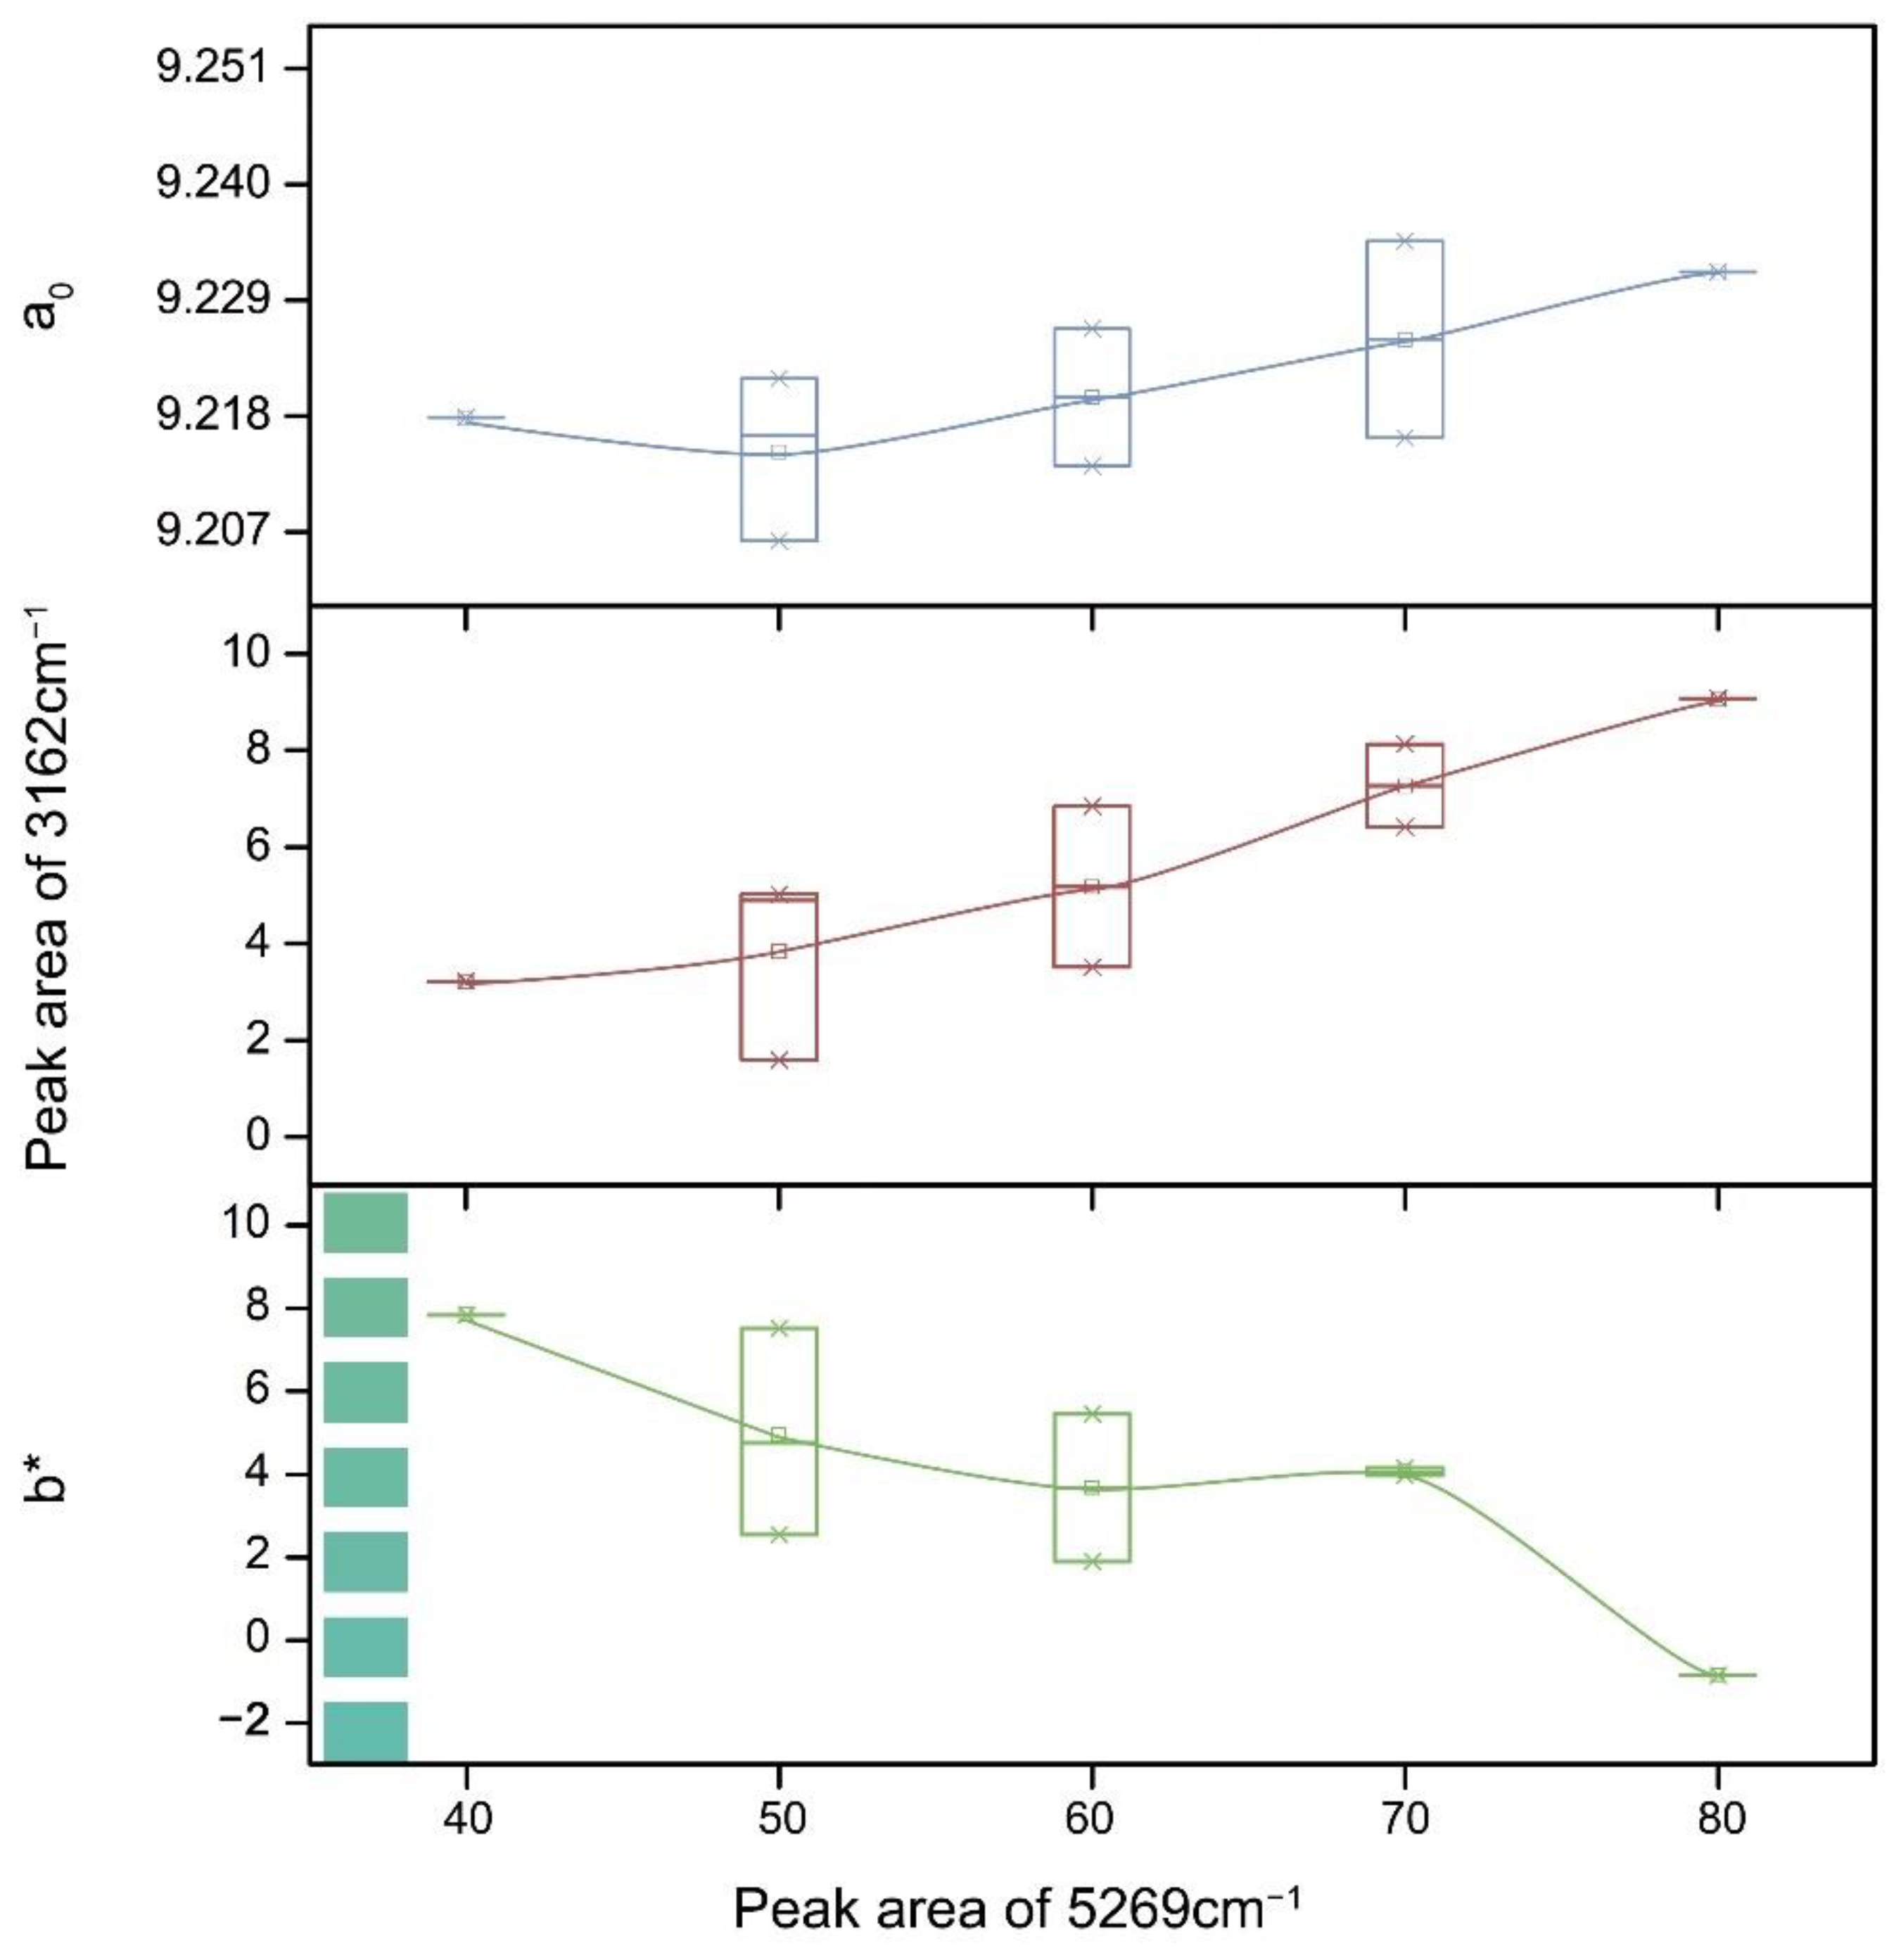
With the increase of the peak area at 5269 cm−1, the value of the cell parameter a0 and the peak area at 3162 cm−1 increased, whereas the color parameter b* decreased; that is, with the increase of type II water, the beryl color transitioned from yellow to blue (Figure 9). The increase of the cell parameter a0 value indicated that the different charge substitution in the octahedral position (mainly Fe2+ replacing Al3+) increased, which led to the increase of Na+ in the channel to compensate for the charge difference. Thus, the peak area at 3162 cm−1 increased, and the amount of type II water increased with the increase of alkali ions in the channel.
4.3. Characteristics of Channel-Water in the Form of Hydration Ions and Its Influence on Colour
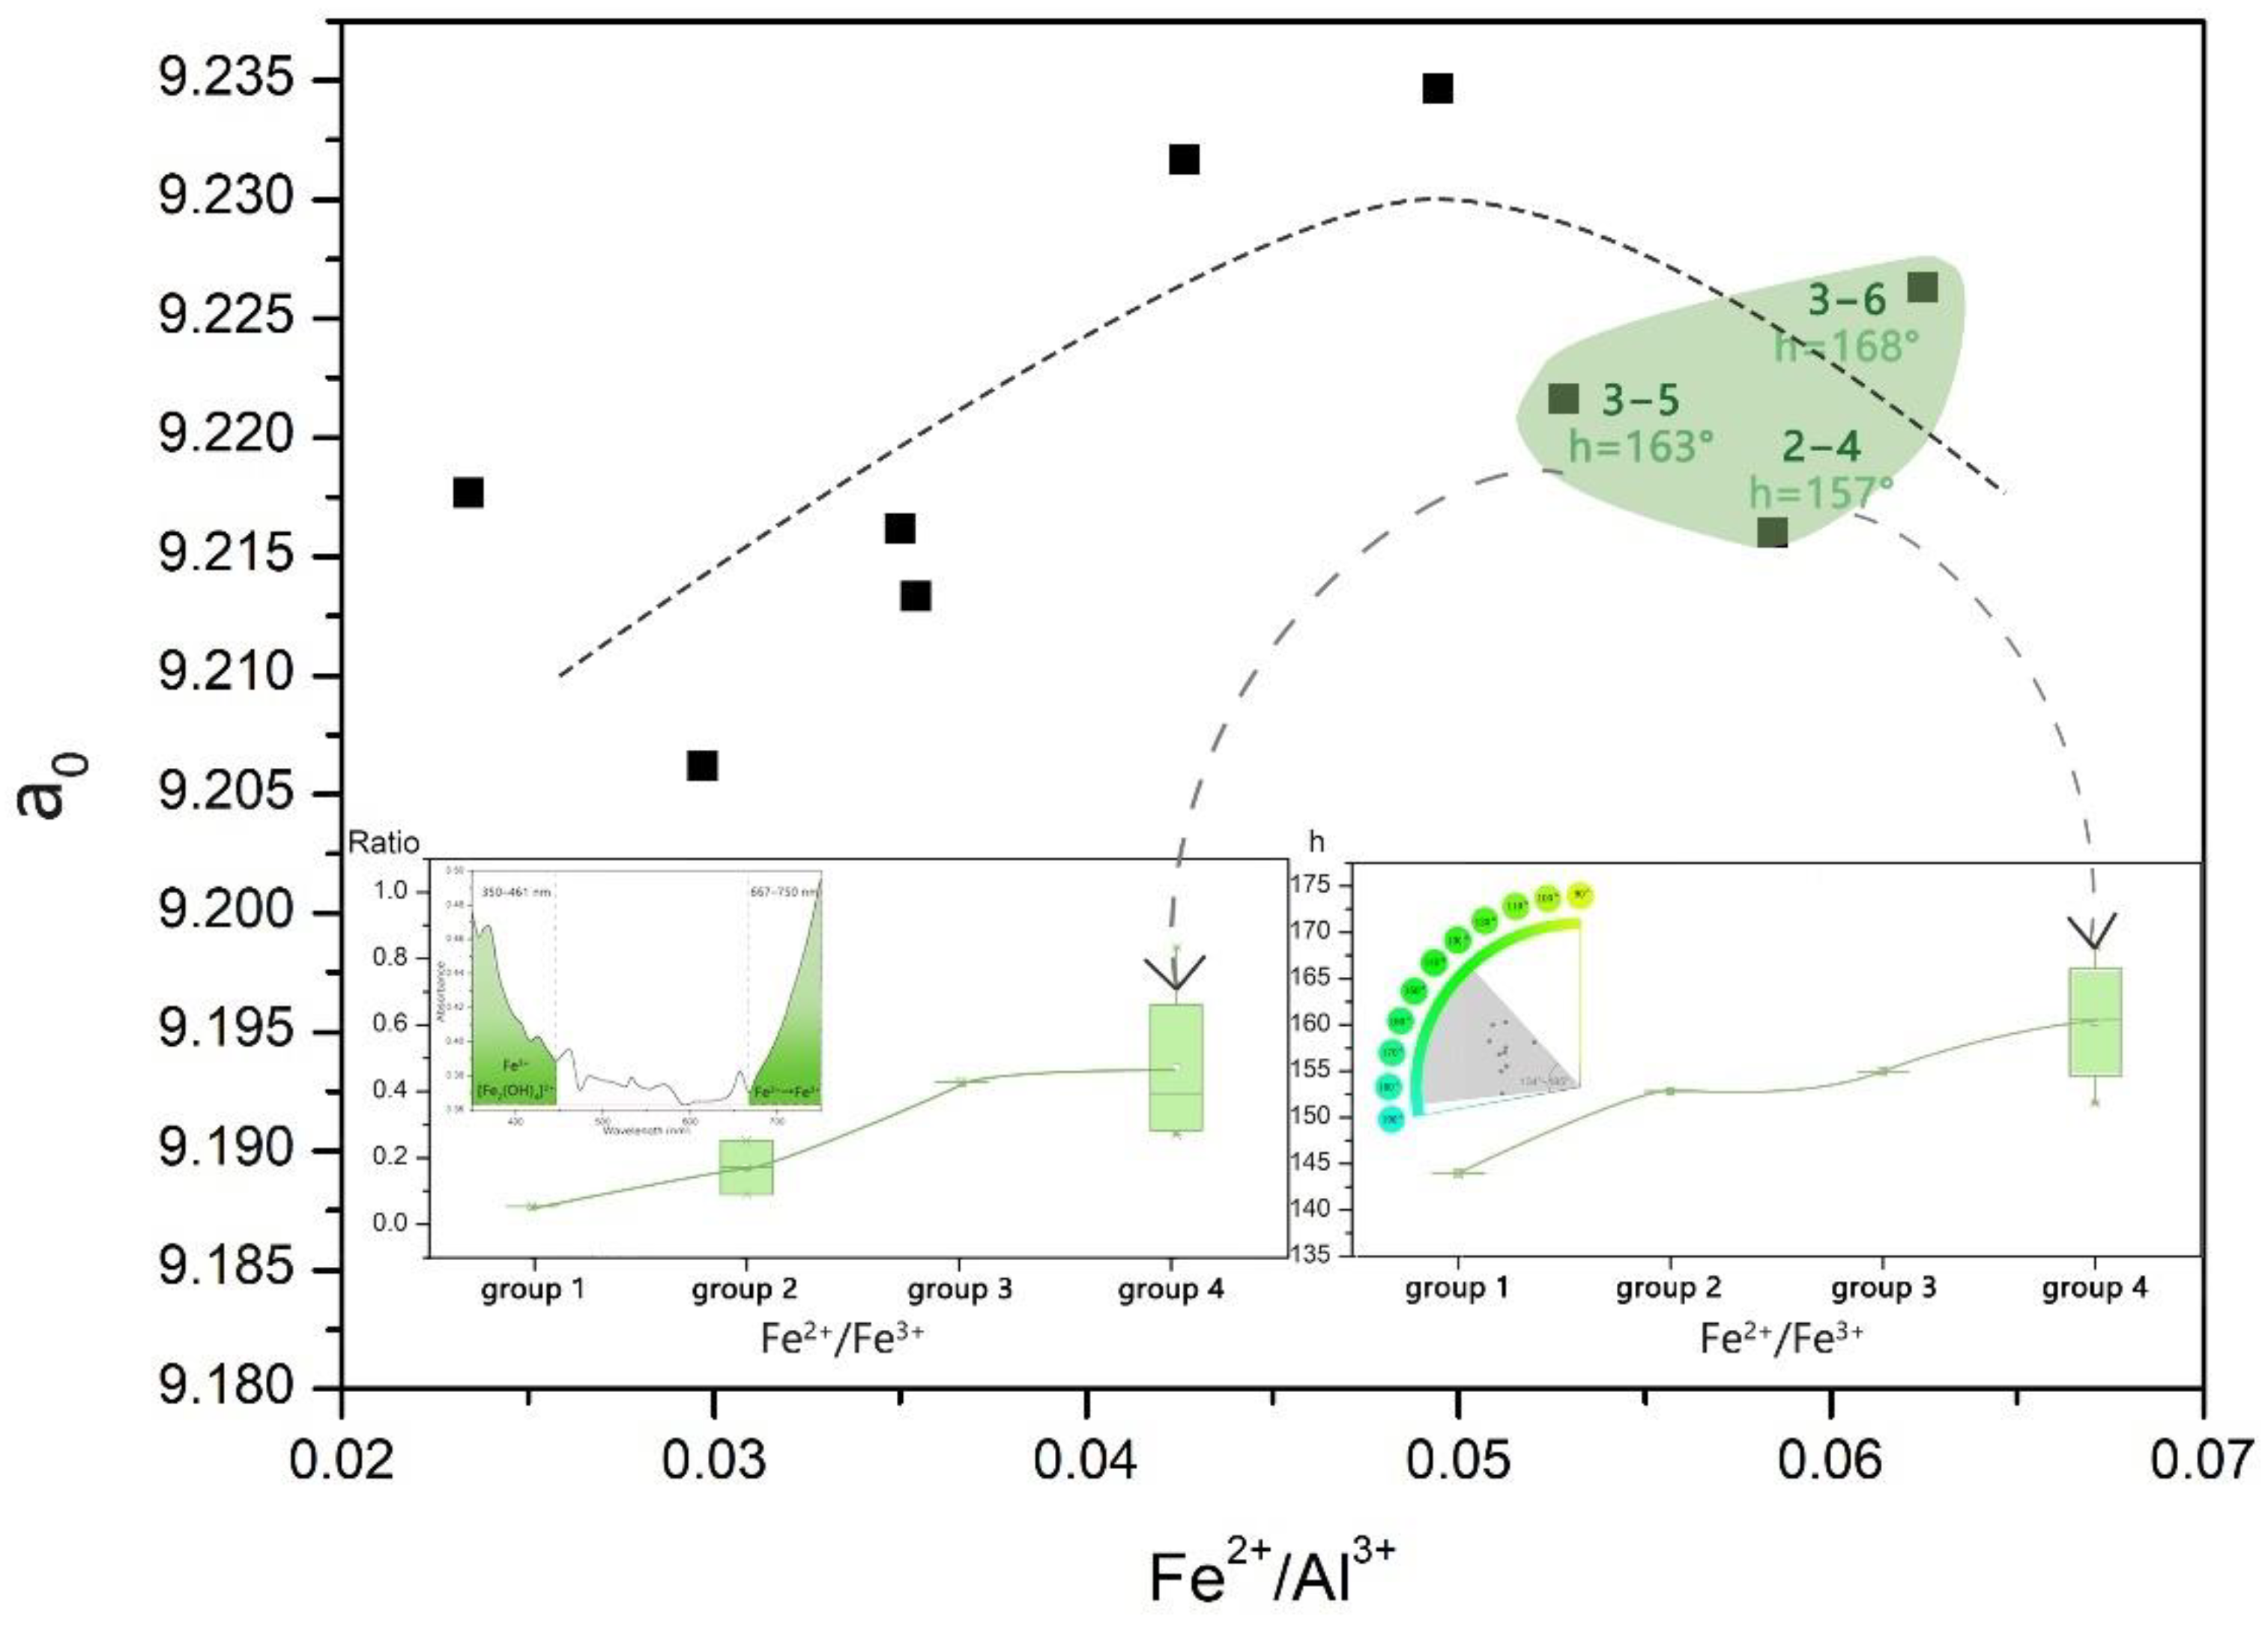
Wang [8] found that iron ions mainly replaced the Al3+ in the octahedral position, but the specific valence state could not be determined. Through the analysis of IR spectra and UV–vis spectra, it was speculated that the charge transfer of Fe2+ and Fe3+ in the octahedral position would produce absorption in the red region of UV–vis spectra. The d–d transition of the octahedral Fe3+ and the charge transfer between it and O2− and the [Fe2(OH)4]2+ in the channel would produce absorption in the blue–violet region. The absorptions in the two regions produced blue-green color. This conclusion could also be proven in the two illustrations at the bottom of Figure 10. With the increase of Fe2+/Fe3+, the absorption area ratio of the red region to the purple region in the UV–vis spectrum increased, as well as the hue angle (h). The test data of UV-vis can be found in Table S5 (see Supplementary Materials).
In this study, the total iron content tested by XRF and the Fe2+ tested by titration method were combined to further study the valence state of iron ions at different positions and their influence on color. Qi et al. [2] concluded that Fe3+ would enter the hexagonal ring channel in the form of filler impurity ions and hydrolyses with water molecules. Under the polymerization of alkali ions, [Fe2(OH)4]2+ copolymer and ion are generated:
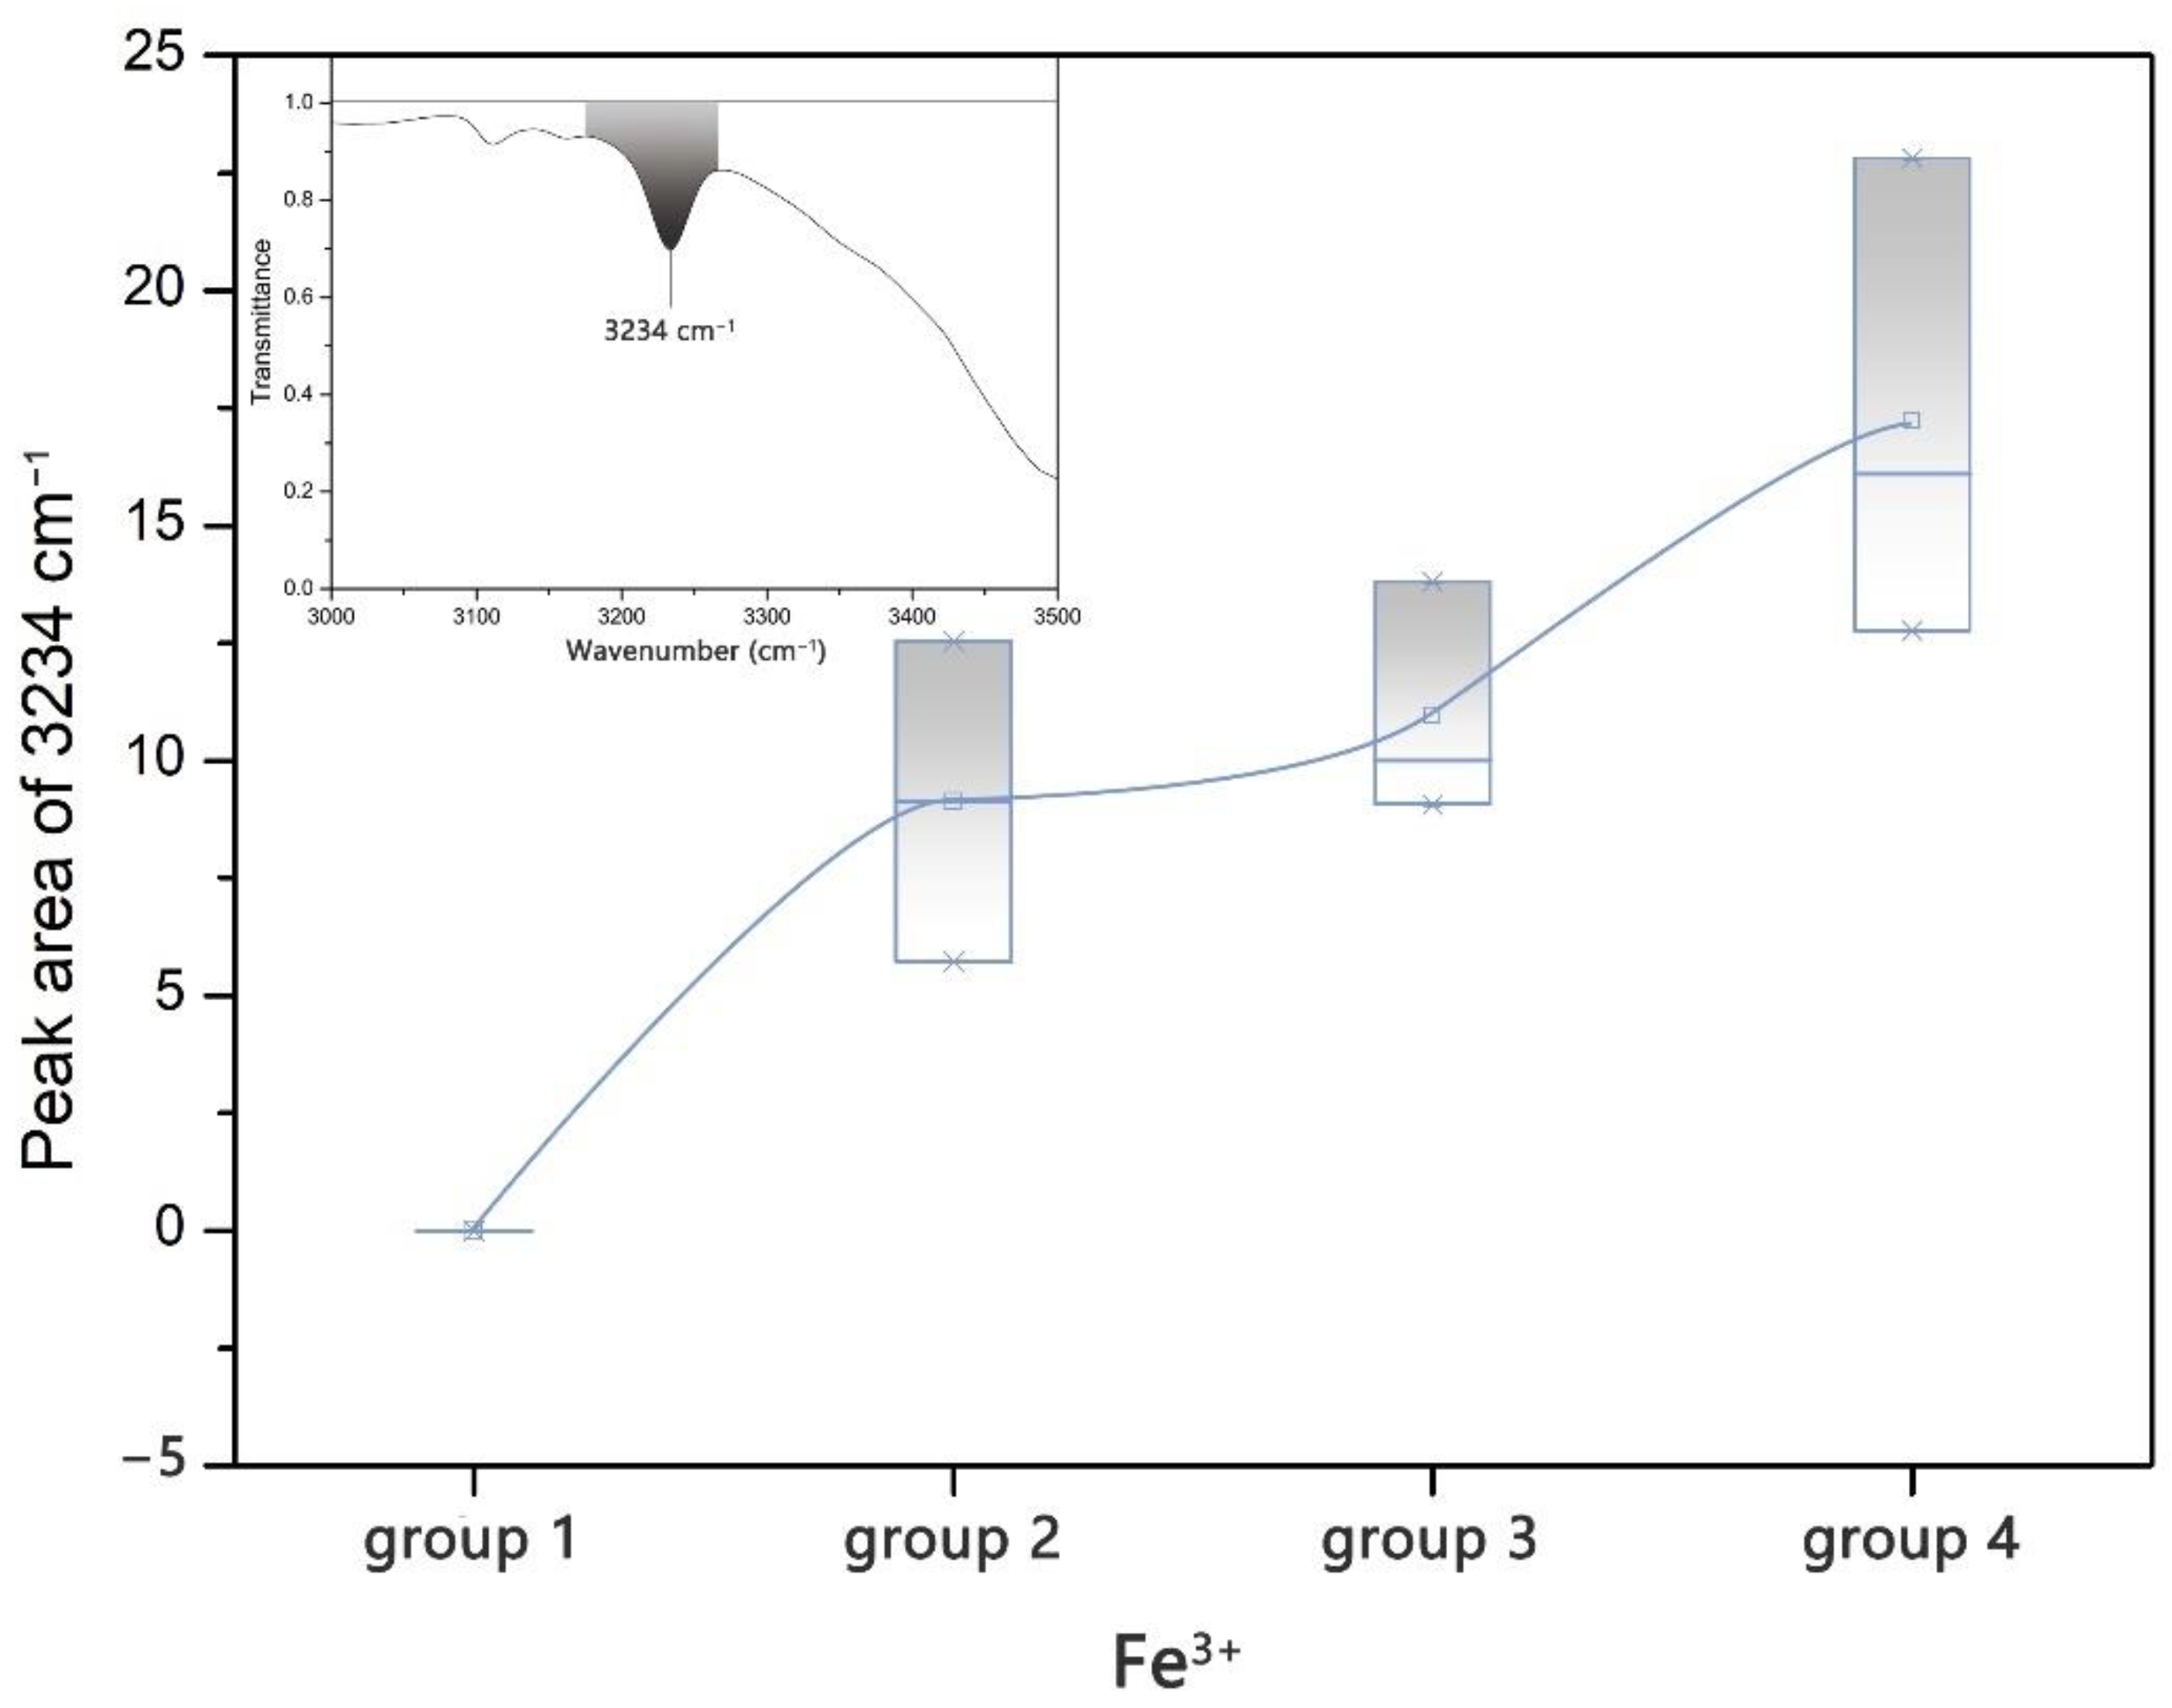
2Fe3+ + 4H2O = [Fe2(OH)4]2+ + 4H+ k = 10−291
It can be seen from Figure 11 that with the increase of Fe3+ content, the peak area at 3234 cm−1 (representing the content of [Fe2(OH)4]2+) also increased, proving that Fe3+ mainly exists in the channel in the form of hydration ions. However, Fe2+ didn’t completely exist in the octahedral position. It can be seen from Figure 10 that a0 showed an upward trend at the beginning with the increase of Fe2+, but when the Fe2+ increased to a certain extent, a0 did not increase, indicating that Fe2+ existed in other positions at this time, such as the channel and tetrahedron [28]. No matter what position it existed in, it would produce absorption in the red region of the UV–vis spectrum and produce blue tone. As shown in Figure 10, the three samples had the highest Fe2+ content but not the maximum cell parameter a0 value. In addition, in their UV–vis spectrum, the ratio of absorption area of the red region to that of the purple region is the largest, and the hue angle (h) is the largest. It indicated that the presence of Fe2+ in other positions except the octahedral position was also responsible for the blue tone. Absorptions in blue–violet region caused by [Fe2(OH)4]2+ and in red region caused by Fe2+ combined and produced the blue-green color of beryl.
5. Conclusions
Through the analysis of infrared spectrum, 5105 cm−1 and 5269 cm−1 were determined as the combined peaks of type II water, and the areas of these two peaks were used as the basis to infer the relative content of type II water. However, the absorption peaks at 7097 cm−1 and 7142 cm−1 were unlikely to be the combination and the overtone peak of type I water. It was found that the absorption peak at 7097 cm−1 was positively correlated with the absorption peak at 3162 cm−1 caused by Na–H, the absorption peak at 7142 cm−1 was positively correlated with the absorption peak at 3111 cm−1 caused by M–OH, and the absorption peak at 3234 cm−1 was caused by [Fe2(OH)4]2+.
With the different charge substitution of Fe2+ → Al3+ in the octahedral position, the blue-green beryl transition from yellow to blue and the increase of Na+ in the channel led to the increase of type II water content. In the IR spectrum, the absorption peak area at 5269 cm−1 was negatively correlated with b*, and positively correlated with the area at 3162 cm−1 and a0.
Fe3+ mainly existed in the channel as hydrated ions, but Fe2+ did not only exist in the octahedral position. [Fe2(OH)4]2+ produced a yellow tone, which, when combined with the blue tone produced by Fe2+, made beryl blue-green.
Supplementary Materials
The following supporting information can be downloaded at: https://0-www-mdpi-com.brum.beds.ac.uk/article/10.3390/cryst12030435/s1. Table S1: The test data of colour parameters of 23 samples; Table S2: The test data of IR; Table S3: The main elements content of 23 samples tested by XRF; Table S4: The Fe2+ content of 10 samples; Table S5: The test data of UV-vis.
Author Contributions
Conceptualization, H.W.; methodology, H.W. and T.S.; validation, Y.G.; formal analysis, J.C.; investigation, H.W.; resources, T.S. and J.C.; data curation, T.S. and J.C.; writing—original draft preparation and editing, H.W.; supervision, Y.G.; project administration, T.S.; funding acquisition, J.C. All authors have read and agreed to the published version of the manuscript.
Funding
This research received no external funding.
Institutional Review Board Statement
Not applicable.
Informed Consent Statement
Not applicable.
Data Availability Statement
Not applicable.
Acknowledgments
The experiments in this research were conducted in the laboratories of the Gemological Institute, China University of Geosciences, Beijing.
Conflicts of Interest
The authors declare no conflict of interest.
References
- Yang, S. Aquamarine Optimization Process and Mechanism. Master’s Thesis, Tong Ji University, Shanghai, China, 2014. [Google Scholar]
- Qi, L.; Ye, S.; Xiang, C. Vibration Spectrum and Irradiation Splitting of Mixture in Beryl Channels. Geol. Sci. Technol. Inf. 2001, 20, 59–64. [Google Scholar]
- Qi, L.; Zhao, B.; Zhou, Z. Constitution Water Irradiation Cracking and F-NIR Spectra Analysis of Yellow Beryl from Xinjiang. Acta Mineral. Sin. 2012, 10, 103–105. [Google Scholar]
- Goldman, D.S.; Rossman, G.R.; Parkin, K.M. Channel Constituents in Beryl. Phys. Chem. Miner. 1978, 31, 225–235. [Google Scholar] [CrossRef]
- Loeffer, B.M.; Burns, R.G. Shedding Light Other Colour of Gems and Minerals. Am. Sci. 1976, 64, 636–647. [Google Scholar]
- Hu, D. Colouration Mechanism and Positions of Impurities in Yellow Beryl from Wulateqianqi, Inner Mongolia. Master’s Thesis, China University of Geosciences, Beijing, China, 2010. [Google Scholar]
- Zhong, Q.; Liao, Z.; Zhou, Z. Gemmological Characteristic of Hydrothermal Synthetic Paraiba-Colour Beryl. J. Gems Gemmol. 2016, 18, 1–7. [Google Scholar]
- Wang, H.; Guan, Q.; Liu, Y.; Guo, Y. Effects of Transition Metal Ions on the Colour of Blue-Green Beryl. Minerals 2022, 12, 86. [Google Scholar] [CrossRef]
- Qiao, X.; Zhou, Z.; Nong, P. Study on the Infrared Spectral Characteristics of H2O Ⅰ-type Emerald and the Controlling Factors. Rock Miner. Anal. 2019, 38, 169–178. [Google Scholar]
- Zou, T. Colouration Mechanism and Controlling Factor of Aquamarine from China. Miner. Depos. 1996, 10, 55–61. [Google Scholar]
- Aurisicchio, C.; Grubessi, O.; Zecchini, P. Infrared spectroscopy and crystal chemistry of the beryl group. Can. Mineral. 1994, 32, 55–68. [Google Scholar]
- Charoy, B.; De Donato, P.; Barres, O.; Pinto-Coelho, C. Channel Occupancy in an Alkali-Poor Beryl from Serra Branca (Goias, Brazil): Spectroscopic Characterization. Am. Mineral. 1996, 81, 395–403. [Google Scholar] [CrossRef]
- Zhang, H.; Liu, C.; Ma, Y. Advances in Mineralogy and Hydrogen Isotope of H2O in Channel of Pegmatitic Beryl. Acta Mineral. Sin. 1999, 19, 370–378. [Google Scholar]
- Wood, D.L.; Nassau, K. The Characterization of Beryl and Emerald by Visible and Infrared Absorption Spectroscopy. Am. Mineral. 1968, 53, 777–800. [Google Scholar]
- Fridrichová, J.; Bacík, P.; Bizovská, V.; Libowitzky, E.; Škoda, R.; Uher, P.; Ozdín, D.; Števko, M. Spectroscopic and bond-topological investigation of interstitial volatiles in beryl from Slovakia. Phys. Chem. Miner. 2016, 43, 419–437. [Google Scholar] [CrossRef]
- Qi, L.; Xia, Y.; Yuan, X. Channel-Water Molecular Pattern and 1H, 23Na NMR Spectra Representation in Synthetic Red Beryl. Gems Gemmol. 2002, 4, 8–14. [Google Scholar]
- Jiang, Y.; Guo, Y.; Zhou, Y.; Li, X.; Liu, S. The Effects of Munsell Neutral Grey Backgrounds on the Colour of Chrysoprase and the Application of AP Clustering to Chrysoprase Colour Grading. Minerals 2021, 11, 1092. [Google Scholar] [CrossRef]
- Tang, J.; Guo, Y.; Xu, C. Colour effect of light sources on peridot based on CIE1976L*a*b*colour system and round RGB diagram system. Colour Res. Appl. 2019, 44, 932–940. [Google Scholar] [CrossRef]
- Mashkovtsev, R.I.; Thoms, V.G.; Fursenko, D.A.; Zhukova, E.S.; Uskov, V.V.; Gorshunov, B.P. FTIR Spectroscopy of D2O and HDO molecules in the C-Axis Channels of Synthetic Beryl. Am. Mineral. 2016, 101, 175–180. [Google Scholar] [CrossRef]
- Della Ventura, G.; Radica, F.; Bellatreccia, F.; Freda, C.; Guidi, M.C. Speciation and Diffusion Profiles of H2O in Water-Poor Beryl: Comparison with Cordierite. Phys. Chem. Miner. 2015, 42, 735–745. [Google Scholar] [CrossRef]
- Peng, M.; Wang, H. A Study on the Vibrational Spectra of Water in Tourmaline. Acta Mineral. Sin. 1995, 15, 372–377. [Google Scholar]
- Kolesov, B. Vibrational States of H2O in Beryl: Physical aspects. Phys. Chem. Min. 2008, 34, 727–731. [Google Scholar] [CrossRef]
- Kolesov, B.; Geiger, C.A. The Orientation and Vibrational States of H2O in Synthetic Alkali-Free Beryl. Phys. Chem. Min. 2000, 27, 557–564. [Google Scholar] [CrossRef]
- Le Breton, N. Infrared Investigation of CO2-Bearing Cordierites: Some Implications for the Study of Metapelitic Granulites. Contrib. Mineral. Petrol. 1989, 103, 387–396. [Google Scholar] [CrossRef]
- Li, X.; Zu, E. Near-Infrared Spectrum Analysis of Cyclosilicates Gem Minerals. Bull. Chin. Ceram. Soc. 2016, 35, 1318–1321. [Google Scholar]
- Guo, Y.; Wang, R.; Xu, S. A Study of the Structure of a Rare Tabular Crystal of Beryl. Geol. Rev. 2000, 46, 312–317. [Google Scholar]
- Weng, S.; Xu, Y. Fourier Transform Infrared Spectroscopy Analysis; Chemical Industry Press: Beijing, China, 2016; pp. 30–32. [Google Scholar]
- Qi, L.; Xiang, C.; Liu, G.; Pei, J.; Luo, Y. ESR Behaviour of Paramagnetic Mixture in Irradiated Beryl. Geol. Sci. Technol. Inf. 2001, 20, 59–64. [Google Scholar]
Figure 1.
The crystal structure of beryl. Al3+ can be replaced by Fe2+, Fe3+, and Mn2+; Be2+ can be replaced by Li+ and Cu2+; H2O, CO2, alkali ions, and M–OH are present in channels.
Figure 1.
The crystal structure of beryl. Al3+ can be replaced by Fe2+, Fe3+, and Mn2+; Be2+ can be replaced by Li+ and Cu2+; H2O, CO2, alkali ions, and M–OH are present in channels.

Figure 2.
Top view photo of 23 samples, hexagonal short columns.

Figure 3.
Colour distribution of samples in the CIELAB space. Hab ranges from 134° to 185°. L* ranges from 41 to 68 (from Wang H. [8]).
Figure 3.
Colour distribution of samples in the CIELAB space. Hab ranges from 134° to 185°. L* ranges from 41 to 68 (from Wang H. [8]).

Figure 4.
IR spectrum of 2000–8000 cm−1 and characteristic peaks. Schematic diagram of the vibration model of the H2O molecule is in the lower right.
Figure 4.
IR spectrum of 2000–8000 cm−1 and characteristic peaks. Schematic diagram of the vibration model of the H2O molecule is in the lower right.

Figure 6.
XRD pattern of no.1–6. Beryl peaks were marked by green lines.

Figure 7.
(1) The peak areas at 5105 cm−1 were positively correlated with the sum of peak areas at 3111 cm−1 and 3162 cm−1, which are represented by blue boxes. The samples were divided into five groups by K-means clustering. (2) The peak areas at 5105 cm−1 were positively correlated with the peak areas at 5269 cm−1, which are represented by green boxes. The samples were divided into five groups by K-means clustering.

Figure 8.
The peak area at 7097 cm−1 was positively correlated with the peak area at 3162 cm−1, as shown by the blue boxes. The peak area at 7142 cm−1 was positively correlated with the peak areas at 3111 cm−1 + 3234 cm−1, as shown by the green boxes. The upper left corner was the IR absorption spectrum within the range of 7000–7200 cm−1. The blue shaded part represented the absorption peak at 7097 cm−1, and the green shaded part represented the absorption peak at 7142 cm−1.

Figure 9.
The IR peak area at 5269 cm−1 was negatively correlated with the color parameter b*, and positively correlated with the Na–H absorption peak at 3162 cm−1, and positively correlated with cell parameter a0.
Figure 9.
The IR peak area at 5269 cm−1 was negatively correlated with the color parameter b*, and positively correlated with the Na–H absorption peak at 3162 cm−1, and positively correlated with cell parameter a0.

Figure 10.
Fe2+/Al3+ content was positively correlated with the cell parameter a0 at first, but no longer correlated when Fe2+ reached a certain content. Fe2+ content was the highest in the 2–4, 3–2, and 3–6 samples, the red area/purple area was the largest in UV–vis spectrum, and the hue angle (h) was the largest. The illustration on the left shows a positive correlation between the Fe2+/Fe3+ content and the red region absorption area/purple region absorption area in the UV–vis spectrum. On the right illustration, Fe2+/Fe3+ content was positively correlated with h.

Figure 11.
Fe3+ was positively correlated with the area of the IR absorption peak area at 3234 cm−1. The samples were divided into four groups by K-means clustering method, and each group of data was represented by a box.
Figure 11.
Fe3+ was positively correlated with the area of the IR absorption peak area at 3234 cm−1. The samples were divided into four groups by K-means clustering method, and each group of data was represented by a box.


Table 1.
Characteristic absorption peaks and assignment within 2000–8000 cm−1.
| Wavenumber (cm−1) | Assignment | Reference |
|---|---|---|
| 2291 | CO2 | [24] |
| 2358 | CO2 | [11,13,15] |
| 3111 | M–OH | [14] |
| 3162 | Na–H | [14] |
| 3234 | [Fe2(OH)4]2+ | [1,14] |
| 3558 | ν1I | [13] |
| 3590 | ν1IIs | [15,19,20] |
| 3605 | ν1IId | [15,19,20] |
| 3661 | ν3IId | [13,15,19,20] |
| 3694 | ν3I | [13] |
| 5105 | Need to be discussed | |
| 5269 | ν2II + ν3II | [14,25] |
| 7098 | Need to be discussed | |
| 7142 | Need to be discussed |
Table 2.
Different ion content and cell parameters in 23 samples.
| No. | Al3+ | Total Fe Ions | Fe2+ | a0 | c0 | No. | Al3+ | Total Fe Ions | Fe2+ | a0 | c0 |
|---|---|---|---|---|---|---|---|---|---|---|---|
| 1-3 | 17.04 | 1.81 | 0.60 | 9.21 | 9.20 | 2-10 | 15.24 | 3.32 | 9.22 | 9.19 | |
| 1-4 | 17.17 | 3.02 | 9.22 | 9.20 | 3-1 | 17.35 | 3.05 | 9.22 | 9.21 | ||
| 1-6 | 17.95 | 2.15 | 0.42 | 9.22 | 9.20 | 3-2 | 16.16 | 2.77 | 0.48 | 9.21 | 9.19 |
| 2-1 | 16.54 | 3.41 | 9.23 | 9.20 | 3-3 | 16.57 | 3.41 | 0.71 | 9.23 | 9.21 | |
| 2-2 | 16.87 | 3.22 | 9.23 | 9.20 | 3-4 | 14.18 | 2.14 | 9.22 | 9.21 | ||
| 2-3 | 14.40 | 3.67 | 9.23 | 9.20 | 3-5 | 16.35 | 3.40 | 0.86 | 9.22 | 9.21 | |
| 2-4 | 15.82 | 3.44 | 0.92 | 9.22 | 9.18 | 3-6 | 15.37 | 3.53 | 0.96 | 9.23 | 9.20 |
| 2-5 | 15.58 | 3.12 | 9.23 | 9.20 | 3-7 | 16.66 | 2.71 | 9.22 | 9.21 | ||
| 2-6 | 15.04 | 4.00 | 9.22 | 9.19 | 3-8 | 16.36 | 2.25 | 0.57 | 9.22 | 9.20 | |
| 2-7 | 15.48 | 3.08 | 9.21 | 9.19 | 3-9 | 16.66 | 2.75 | 9.22 | 9.19 | ||
| 2-8 | 15.46 | 3.36 | 9.23 | 9.20 | 3-10 | 15.93 | 3.58 | 0.79 | 9.23 | 9.21 | |
| 2-9 | 15.86 | 3.16 | 9.23 | 9.20 |
Publisher’s Note: MDPI stays neutral with regard to jurisdictional claims in published maps and institutional affiliations. |
© 2022 by the authors. Licensee MDPI, Basel, Switzerland. This article is an open access article distributed under the terms and conditions of the Creative Commons Attribution (CC BY) license (https://creativecommons.org/licenses/by/4.0/).
Share and Cite
MDPI and ACS Style
Wang, H.; Shu, T.; Chen, J.; Guo, Y. Characteristics of Channel-Water in Blue-Green Beryl and Its Influence on Colour. Crystals 2022, 12, 435. https://0-doi-org.brum.beds.ac.uk/10.3390/cryst12030435
AMA Style
Wang H, Shu T, Chen J, Guo Y. Characteristics of Channel-Water in Blue-Green Beryl and Its Influence on Colour. Crystals. 2022; 12(3):435. https://0-doi-org.brum.beds.ac.uk/10.3390/cryst12030435
Chicago/Turabian StyleWang, Hui, Tong Shu, Jingyi Chen, and Ying Guo. 2022. "Characteristics of Channel-Water in Blue-Green Beryl and Its Influence on Colour" Crystals 12, no. 3: 435. https://0-doi-org.brum.beds.ac.uk/10.3390/cryst12030435
Note that from the first issue of 2016, this journal uses article numbers instead of page numbers. See further details here.