
Envelope Function Analysis of Quasicrystals


Faculty of Physics and Applied Computer Science, AGH University of Science and Technology, 30-059 Krakow, Poland
*
Author to whom correspondence should be addressed.
Crystals 2022, 12(4), 536; https://0-doi-org.brum.beds.ac.uk/10.3390/cryst12040536
Submission received: 21 February 2022
/
Revised: 25 March 2022
/
Accepted: 8 April 2022
/
Published: 11 April 2022
(This article belongs to the Special Issue Frontiers of Intermetallic Compounds)
Abstract
:Quasicrystals have attracted a growing interest in material science because of their unique properties and applications. Proper determination of the atomic structure is important in designing a useful application of these materials, for which a difficult phase problem of the structure factor must be solved. Diffraction patterns of quasicrystals consist of a periodic series of peaks, which can be reduced to a single envelope. Knowing the distribution of the diffraction image into series, it is possible to recover information about the phase of the structure factor without using time-consuming iterative methods. By the inverse Fourier transform, the structure factor can be obtained (enclosed in the shape of the average unit cell, or atomic surface) directly from the diffraction patterns. The method based on envelope function analysis was discussed in detail for a model 1D (Fibonacci chain) and 2D (Penrose tiling) quasicrystal. First attempts to apply this technique to a real Al-Cu-Rh decagonal quasicrystal were also made.
1. Introduction
Phase retrieval is a long-term problem in the diffraction and structure analysis of not only aperiodic but also periodic crystals. Over the years, many numerical methods have been developed to retrieve phases of the structure factor for quasicrystals, including the low-density-elimination method [1] or the charge flipping algorithm [2,3], implemented in available software for structure solution [4,5], or other iterative approaches [6]. We present an original technique, which does not require iterative Fourier transformations, as an interesting alternative to the problem of phase retrieval.
Quasicrystals first observed by Shechtman in 1982 [7] are aperiodic systems with symmetry elements (like 5-, 10-fold rotational axes) of the diffraction pattern that are incompatible with translational symmetry [8]. Aperiodic symmetry also occurs locally in the atomic structure, making the structural and diffraction description of these materials much harder compared to periodic crystals [9]. However, the high quality of the samples and the diffraction data is possible at the level of the best periodic crystals, which allows for a detailed study of quasicrystals. Due to their unique atomic structure, quasicrystals also have very interesting physical-chemical properties [10]. Among them, applications such as heat insulating or non-friction coatings [11], hydrogen storage materials [12], photonic and phononic materials (such as light or sound insulators) [13]. To find an interesting and useful application of quasicrystalline materials, an atomic structure must be known. X-ray structure refinement is currently the best tool for discussing a detailed atomic structure of materials.
The diffraction pattern of the quasicrystals is, as mentioned, aperiodic with the distribution of diffraction peaks following the aperiodic ordering. However, it is known that the diffraction pattern of quasicrystals can be considered as a periodic series of peaks grouped within envelopes, which are periodically distributed in reciprocal space [14,15]. The period of occurrence of the envelopes is incommensurate with the period of peaks within the envelopes. The situation is similar to that observed in the diffraction patterns of commensurately/incommensurately modulated crystals, with the incommensurateness factor being a golden mean (for most of the known quasicrystals). If, in addition, the centrosymmetricity of the diffraction image is observed, it can be shown that the phases of the structure factor of a quasicrystal are 0 or π. Whenever the envelope function reaches (crosses) zero, the phase of all peaks grouped within this envelope changes. Assuming this, the phase retrieval procedure can be moved to the reciprocal space and the phases can be obtained directly from the diffraction patterns. The preliminary results of the first attempts to apply this method to the Al-Ni-Co decagonal quasicrystal were presented in [16]. This method does not require the iterative methods mentioned above. Its fundamentals and promising application will be discussed in the paper and tested against the real decagonal system of the Al-Cu-Rh quasicrystal. The technical details of this approach have not been presented in the literature to date.
2. Method of Envelope Function Analysis
2.1. Model 1D Quasicrystal
In this section, we present the idea of an envelope function analysis based on a simple 1D case, a Fibonacci chain. The Fibonacci chain (or Fibonacci sequence) is often considered as a model 1D quasicrystal. It can be derived as a sequence of atoms spaced by large (L) and small (S) distances (we assume the size ratio L:S = = 1.618…). The positions of each diffraction peak (k) for the Fibonacci chain can be described by two incommensurate vectors: k0 and q0 (again, k0:q0 = ), namely . The intensities of the diffraction peaks can be calculated as follows:
where .
Equation (1) is derived as the squared module of the structure factor (𝑘), which for the Fibonacci chain reads:
The phase factor in Equation (2) depends only on the integer parameter m.
The diffraction diagram of the Fibonacci chain is presented in Figure 1a. It has been shown [14,15] that the diffraction pattern is composed as follows (see Figure 1b): peaks of the same parameter (which are periodic) are grouped into series (connected by envelopes of different colors), which are then periodically distributed in -space. The two periods are incommensurate.
Introducing a reduced scattering vector: 𝑤 = 𝑘 − 2𝜋𝑚𝜏, we obtain a diffraction pattern reduced to a single envelope. From Equation (2) we know that the structure factor can only have the phase factor or (which means even or odd -values). Figure 2 presents the reduced diffraction pattern, as well as the real part of the structure factor for the Fibonacci chain. The reduced diffraction pattern can be described by an envelope function with analytical definition , similar to Equation (1), which is known as the cardinal sine (sinc) function in mathematics. It is also an expected shape of the Fourier transform of a uniform window.
The structure and diffraction description of the aperiodic crystals is possible within the statistical method (also called the average unit cell—AUC approach). The atomic structure is represented within this method as a probability distribution of projections of atomic positions onto a periodic reference lattice. We denote this distribution as P(u) and call it the AUC. For a Fibonacci chain, it is uniform and rectangular. All of the structural information of a quasicrystal is stored in P(u). The key result of the AUC approach is that the structure factor can be obtained directly from P(u) by the Fourier transform. It is possible, assuming centrosymmetricity (phase factor 0/π), to obtain the distribution P(u) directly from a diffraction pattern. The mutual relation holds [17]:
The numerically obtained from the theoretically obtained reduced diffraction pattern is presented in Figure 3.
2.2. Penrose Tiling
Penrose tilings are often proposed to model a 2-dimensional quasicrystalline lattice with a local 10-fold symmetry (and a decagonal symmetry of the diffraction pattern). We consider a rhombic Penrose tiling with two rhombs (thick and thin) representing the structural units (see Figure 4a) [18,19]. Penrose tiling was successfully used to describe the atomic structure of many decagonal systems, using multidimensional and statistical methods [20,21,22]. In the AUC approach, we attribute the Penrose tiling with the 2D distribution function with coordinates and representing atomic positions in the AUC along the and physical-space axes. is composed of four pentagons, whose exact shape strongly depends on the choice of the reference lattice [10,16]. The exemplar shape of the AUC for the Penrose tiling is shown in Figure 4b. The pentagons are of uniform height. Within the higher-dimensional method, the counterpart of the distribution is called an atomic surface. It is a 3D object spanned in the so-called perpendicular space (an orthogonal subspace to physical space, both together form a 5D superspace) with coordinates denoted as . Four plane pentagons in of the atomic surface are spanned along . The same 5D approach can be applied to describe a reciprocal space, where the multidimensional diffraction pattern consists of the 2D “physical” subspace and 3D “perpendicular” subspace (for details, see [18,23,24,25,26,27]).
2.3. Envelope Function Analysis of the Vertex-Decoration Rhombic Penrose Tiling
In this section, we discuss an application of the envelope function analysis to rhombic Penrose tiling with monoatomic decoration in the vertices of the rhombi. The diffraction pattern is now two-dimensional with four integer indices (denoted as . The formula for a reduced scattering vector is now more complex compared to the Fibonacci chain. It is given by [28]:
where .
In Figure 5 a full diffraction pattern of the Penrose tiling with vertex decoration is presented, as well as the reduced diffraction pattern in the reduced scattering vector ()-space. We clearly see a decagonal distribution of peaks in the reduced pattern, which is, however, distorted with respect to the original diffraction pattern, possessing 10-fold rotational symmetry. Peaks are grouped into several aggregations; the shape of an envelope function is difficult to determine.
The significant difference compared to the Fibonacci chain is now that the AUC consists of four pentagonal shapes (sum over in Equation (5)) labeled by component . The structure factor in the statistical method can be calculated as a sum of Fourier transforms of consecutive distributions with the phase factor different for different AUCs and dependent on extra components [28]:
where =. Parameters can be taken 1, 2, 3, 4 for consecutive pentagonal shapes, and are additional components to the scattering vector in the 5D reciprocal space used to describe a diffraction pattern for decagonal quasicrystals within a higher-dimensional method (see the discussion in Section 2.2).
The form of Equation (4) makes the inverse Fourier transform much more difficult. Thus, obtaining the shape of the probability distributions directly from the diffraction image is not as straightforward as in the case of the Fibonacci chain. The solution to this problem is in progress. Resigning from obtaining the exact shape of each of the pentagons separately, for an averaged single shape of the projection of all pentagons onto one region (along in perpendicular space—see Equation (5)) is one possibility we studied. However, it gives only an approximated structure factor, which cannot be used for a detailed structure refinement.
3. Application of the Envelope Function Method to Real Decagonal Quasicrystal
3.1. Decagonal Quasicrystal Al-Cu-Rh
The existence of a decagonal structure in the Al-Cu-Rh system was first noticed in 1989. In 2012, Kuczera et al. performed extensive research to obtain a diffraction pattern and refine the atomic structure of this system [22]. The mixture of Al, Cu, and Rh elements was arc melted at a high temperature of 1273 K and slowly cooled to 1173 K at a speed of 1 K/min. After reaching this temperature, the sample was annealed for two weeks and finally quenched in water. The whole process was carried out in an ampoule made of argon-filled tantalum. After EDX measurement, the chemical composition was found to be Al61.9Cu18.5Rh19.6. The diffraction pattern was collected with a KUMA KM6-CH single crystal diffractometer with X-rays of wavelength . Data collection and processing was performed using CrysAlis Pro software. Two datasets were collected using a short exposure time to avoid saturation for large reflections and a long exposure time to find the largest possible number of small reflections. Finally, a data set of 162,939 peaks with 2370 unique ones was collected [22]. In this paper, the full dataset collected by Kuczera et al. was used for the envelope function analysis.
The Al-Cu-Rh decagonal phase is considered one of the best-order quasicrystalline phases reported in the literature [29]. Its high atomic ordering is reflected in the diffraction pattern, which consists of sharp peaks with no diffuse scattering observed between peaks within or between the reciprocal space layers. It is often considered a reference decagonal system in structural disorder analysis [30,31,32]. The good quality data available also make testing the envelope approach to structure solution promising in our research.
3.2. Envelope Function Analysis of Al-Cu-Rh
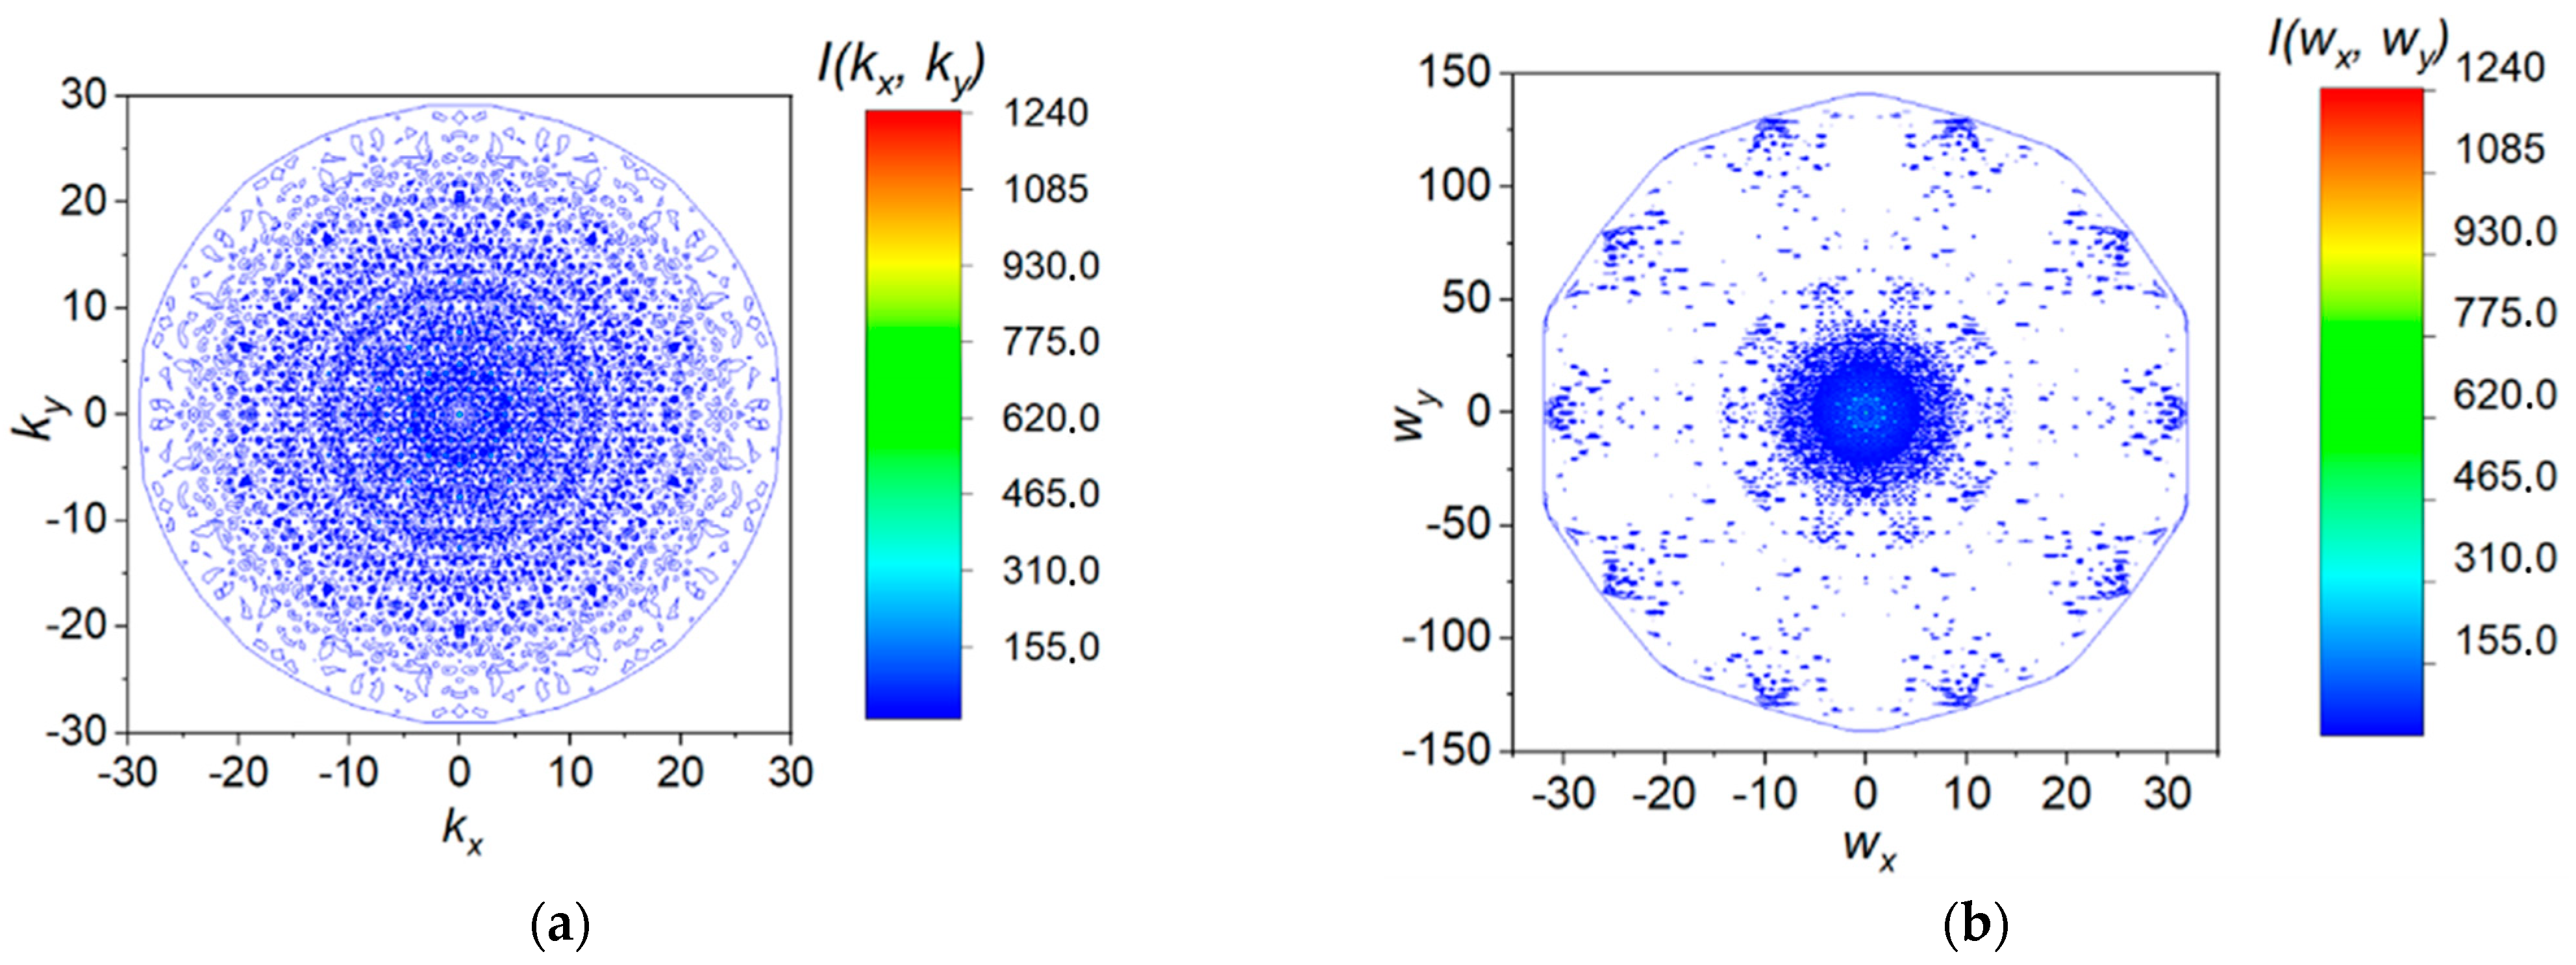
In this section, we discuss the application of the envelope function analysis to the real decagonal system. For this research, we used data obtained by Kuczera et al. in 2012 [22]. The complete diffraction pattern of 73,831 unique reflections (with intensities >1% of the strongest reflection) is presented in a contour plot in Figure 6a. Applying Equation (4) to the peak positions resulted in the reduced diffraction pattern shown in Figure 6b. Similarly to Figure 5, we observe a 10-fold symmetry of the diffraction pattern. The reduced pattern is composed of peaks grouped in several aggregates. The shape of the envelope is much more complex than in the case of the vertex decoration of the Penrose tiling. Further studies on the inverse Fourier transformation of the reduced pattern (as depicted in Section 2.1) are in progress. The goal of the study is to obtain a pentagon-shaped AUC for the real decagonal quasicrystal, which will provide full structural information about the system. However, at this stage, we can confirm that the full diffraction patterns can be successfully reduced to a single envelope.
4. Conclusions
In the paper we presented in details a fundamental information on the envelope function analysis of the diffraction pattern of quasicrystals in terms of the phase-retrieval problem. The diffraction patterns of quasicrystals consist of a periodic series of peaks. Periodically distributed peaks belong to a single envelope, and consecutive envelopes are also distributed periodically. However, the two periodicities are incommensurate. The full diffraction pattern can be reduced further to a single envelope. Knowing the decomposition of the diffraction pattern into series, information about the phase of the structural factor can be recovered without exploiting time-consuming iterative methods. For a model Fibonacci chain (1D quasicrystal) with monoatomic vertex decoration, the reduced envelope has a shape of the sinc function. By an inverse Fourier transform, it is possible to obtain the shape of the AUC(s) directly from the diffraction patterns. This easily reproduces a uniform (flat) distribution for the Fibonacci chain. For the Penrose tiling (and a real decagonal quasicrystal), the AUC is composed of four pentagons. The structure factor depends on each of them, but there is also mixing (represented by the phase factor in Equation (5)), which excludes a straightforward inverse Fourier transformation. However, the important conclusion of our hitherto studies is that the diffraction pattern (of a model, as well as real decagonal structures) can be successfully reduced to a single envelope function, although not analytically grasped. The results presented in this paper are a great starting point for a more detailed analysis in the future.
Author Contributions
Conceptualization, research design, results verification, writing manuscript R.S.; calculations, preparation of figures Ł.C.; revising manuscript, securing funding J.W. All authors have read and agreed to the published version of the manuscript.
Funding
The authors kindly acknowledge financial support from Polish National Science Center (NCN) under grant no. 2019/33/B/ST3/02063.
Data Availability Statement
Data sharing not applicable.
Conflicts of Interest
The authors declare no conflict of interest.
References
- Takakura, H.; Shiono, M.; Sato, T.J.; Yamamoto, A.; Tsai, A.P. Ab initio structure determination of icosahedral Zn-Mg-Ho quasicrystals by density modification method. Phys. Rev. Lett. 2001, 86, 236–239. [Google Scholar] [CrossRef] [PubMed]
- Oszlanyi, G.; Suto, A. Ab initio structure solution by charge flipping. Acta Cryst. A 2004, 60, 134–141. [Google Scholar] [CrossRef] [PubMed] [Green Version]
- Palatinus, L. Ab initio determination of incommensurately modulated structures by charge-flipping in superspace. Acta Cryst. A 2004, 60, 604–610. [Google Scholar] [CrossRef] [PubMed]
- Yamamoto, A. Software package for structure analysis of quasicrystals. Sci. Tech. Adv. Mat. 2008, 9, 013001. [Google Scholar] [CrossRef] [PubMed]
- Palatinus, L.; Chapuis, G. A computer program for the solution of crystal structures by charge flipping in arbitrary dimensions. J. Appl. Cryst. 2007, 40, 786–790. [Google Scholar] [CrossRef] [Green Version]
- Elser, V. Phase retrieval by iterated projections. J. Opt. Soc. Am. A 2003, 20, 40–55. [Google Scholar] [CrossRef] [Green Version]
- Shechtman, D.S.; Blech, I.; Gratias, D.; Cahn, J. Metallic phase with long-range orientational order and no translational symmetry. Phys. Rev. Lett. 1984, 53, 1951–1953. [Google Scholar] [CrossRef] [Green Version]
- Levine, D.; Steinhardt, P.J. Quasicrystals: A new class of ordered structures. Phys. Rev. Lett. 1984, 53, 2477–2480. [Google Scholar] [CrossRef] [Green Version]
- Socolar, J.E.S.; Steinhardt, P.J. Quasicrystals. II. Unit-cell configurations. Phys. Rev. B 1986, 34, 617–647. [Google Scholar] [CrossRef]
- Dubois, J.M. Useful Quasicrystals; World Scientific: Singapore, 2005. [Google Scholar]
- Zou, Y.; Kuczera, P.; Sologubenko, A.; Sumigawa, T.; Kitamura, T.; Steurer, W.; Spolenak, R. Superior room-temperature ductility of typically brittle quasicrystals at small sizes. Nat. Comm. 2016, 7, 12261. [Google Scholar] [CrossRef] [Green Version]
- Takasaki, A.; Gondek, L.; Czub, J.; Klimkowicz, A.; Zywczak, A.; Swierczek, K. Hydrogen Storage in Ti/Zr-Based Amorphous and Quasicrystal Alloys. In Hydrogen Storage Technologies; Sankir, M., Sankir, N.D., Eds.; Scrivener Publishing LLC: Beverly, MA, USA; John Wiley & Sons, Inc.: Hoboken, NJ, USA, 2008; pp. 117–145. [Google Scholar]
- Vardeny, Z.; Nahata, A.; Agrawal, A. Optics of photonic quasicrystals. Nat. Photon. 2014, 7, 177–187. [Google Scholar] [CrossRef]
- Wolny, J.; Kozakowski, B.; Kuczera, P.; Pytlik, L.; Strzałka, R. What periodicities can be found in diffraction patterns of quasicrystals? Acta Cryst. A 2014, 70, 181–185. [Google Scholar] [CrossRef] [PubMed]
- Wolny, J.; Kuczera, P.; Strzalka, R. Periodically distributed objects with quasicrystalline diffraction pattern. Appl. Phys. Lett. 2015, 106, 131905. [Google Scholar] [CrossRef]
- Kozakowski, B.; Wolny, J. Average Unit Cell in Fourier Space and Its Application to Decagonal Quasicrystal. In Aperiodic Crystals; Schmid, S., Withers, R.L., Lifshitz, R., Eds.; Springer Science: Dordrecht, The Netherlands; Business Media: Berlin/Heidelberg, Germany, 2013; pp. 125–132. [Google Scholar]
- Strzalka, R.; Buganski, I.; Wolny, J. Statistical Approach to Diffraction of Periodic and Non-Periodic Crystals—Review. Crystals 2016, 104, 1–19. [Google Scholar]
- Steurer, W.; Deloudi, S. Crystallography of Quasicrystals: Concepts, Methods and Structures; Springer: Berlin/Heidelberg, Germany, 2009. [Google Scholar]
- Baake, M.; Grimm, U. Aperiodic Order Vol. 1: A Mathematical Invitation; Cambridge University Press: Cambridge, UK, 2013; p. 149. [Google Scholar]
- Yamamoto, A. A five-dimensional model of decagonal Al–Pd–Mn quasicrystals. Acta Cryst. A 1993, 49, C337. [Google Scholar] [CrossRef] [Green Version]
- Takakura, H.; Yamamoto, A.; Tsai, A.P. The structure of a decagonal Al72Ni20Co8 quasicrystal. Acta Cryst. A 2001, 57, 576–585. [Google Scholar] [CrossRef] [PubMed] [Green Version]
- Kuczera, P.; Wolny, J.; Steurer, W. Comparative structural study of decagonal quasicrystals in the systems Al–Cu–Me (Me = Co; Rh; Ir). Acta Cryst. B 2012, 68, 578–589. [Google Scholar] [CrossRef]
- Wolny, J.; Buganski, I.; Strzalka, R. Model refinements of quasicrystals. Cryst. Rev. 2018, 24, 22–64. [Google Scholar] [CrossRef]
- de Wolff, P.M.; Janssen, T.; Janner, A. The superspace groups for incommensurate crystal structures with one-dimensional modulation. Acta Cryst. A 1981, 37, 625–636. [Google Scholar] [CrossRef]
- Duneau, M.; Katz, A. Quasiperiodic patterns. Phys. Rev. Lett. 1985, 54, 2688–2691. [Google Scholar] [CrossRef]
- Yamamoto, A. Crystallography of quasiperiodic crystals. Acta Cryst. A 1996, 52, 509–560. [Google Scholar] [CrossRef]
- Janssen, T.; Chapuis, G.; de Boissieu, M. Aperiodic Crystals: From Modulated Phases to Quasicrystals: Structure and Properties; IUCr Monographs on Crystallography, Oxford Science Publications: Oxford, UK, 2013. [Google Scholar]
- Kozakowski, B.; Wolny, J. Decorated quasicrystals and their diffraction patterns. Philos. Mag. 2005, 86, 549–555. [Google Scholar] [CrossRef]
- Steurer, W. Quasicrystals: What do we know? What do we want to know? What can we know? Acta Cryst. A 2018, 74, 1–11. [Google Scholar] [CrossRef] [PubMed] [Green Version]
- Wolny, J.; Buganski, I.; Kuczera, P.; Strzalka, R. Pushing the limits of crystallography. J. Appl. Cryst. 2016, 49, 2106–2115. [Google Scholar] [CrossRef] [PubMed] [Green Version]
- Strzalka, R.; Buganski, I.; Kuczera, P.; Pytlik, L.; Wolny, J. Atomic Structure of Decagonal Al-Cu-Rh Quasicrystal–Revisited: New Correction for Phonons. Crystals 2019, 9, 78. [Google Scholar] [CrossRef] [Green Version]
- Buganski, I.; Strzalka, R.; Wolny, J. New approach to phason disorder for a decagonal quasicrystal: The moments’ series expansion of the tiling’s distribution function for AlCuRh. J. Appl. Cryst. 2020, 93, 904–913. [Google Scholar] [CrossRef]
Figure 1.
(a) Diffraction pattern of the Fibonacci chain (, indexes , distances , ). (b) Diffraction pattern of the Fibonacci chain with the first five envelopes marked by different colors.
Figure 1.
(a) Diffraction pattern of the Fibonacci chain (, indexes , distances , ). (b) Diffraction pattern of the Fibonacci chain with the first five envelopes marked by different colors.

Figure 2.
(a) Real part of the structure factor for the Fibonacci chain with distinction for even/odd m values (phase factor 0/π). (b) Reduced diffraction pattern .
Figure 2.
(a) Real part of the structure factor for the Fibonacci chain with distinction for even/odd m values (phase factor 0/π). (b) Reduced diffraction pattern .

Figure 3.
Statistical distribution P(u) obtained as the inverse Fourier transform of the amplitudes of the diffraction peaks (Equation (3)). The characteristic oscillations for numerical calculations are observed. The non-symmetricity of P(u) is due to the chosen definition of a variable u. The width of the distribution is τ (the distribution is not normalized). Calculations performed for 500 atoms in the Fibonacci chain, diffraction amplitudes obtained with Equation (2). The red line represents the ideal shape of the P(u) distribution known theoretically for the Fibonacci chain (see, e.g., [17]). The shift from u = 0 results from the choice of the range selection of variable u in the calculation based on Equation (3).

Figure 4.
(a) Rhombic Penrose tiling as a quasicrystalline lattice to model decagonal quasicrystals. (b) The AUC for the Penrose tiling is a P(ux,uy) distribution consisting of four pentagons with uniform heights.
Figure 4.
(a) Rhombic Penrose tiling as a quasicrystalline lattice to model decagonal quasicrystals. (b) The AUC for the Penrose tiling is a P(ux,uy) distribution consisting of four pentagons with uniform heights.

Figure 5.
(a) Diffraction pattern of the Penrose tiling with monoatomic vertex decoration (all reflections with nx–my indices in a range −12…12, 2300 atoms). (b) Reduced diffraction pattern of the Penrose tiling.
Figure 5.
(a) Diffraction pattern of the Penrose tiling with monoatomic vertex decoration (all reflections with nx–my indices in a range −12…12, 2300 atoms). (b) Reduced diffraction pattern of the Penrose tiling.

Figure 6.
(a) Diffraction pattern of the AlCuRh decagonal quasicrystal (synchrotron data after [22]). (b) Reduced diffraction pattern of the AlCuRh decagonal quasicrystal. Values on axes shown in a.u.
Figure 6.
(a) Diffraction pattern of the AlCuRh decagonal quasicrystal (synchrotron data after [22]). (b) Reduced diffraction pattern of the AlCuRh decagonal quasicrystal. Values on axes shown in a.u.

Publisher’s Note: MDPI stays neutral with regard to jurisdictional claims in published maps and institutional affiliations. |
© 2022 by the authors. Licensee MDPI, Basel, Switzerland. This article is an open access article distributed under the terms and conditions of the Creative Commons Attribution (CC BY) license (https://creativecommons.org/licenses/by/4.0/).
Share and Cite
MDPI and ACS Style
Strzałka, R.; Chuchra, Ł.; Wolny, J. Envelope Function Analysis of Quasicrystals. Crystals 2022, 12, 536. https://0-doi-org.brum.beds.ac.uk/10.3390/cryst12040536
AMA Style
Strzałka R, Chuchra Ł, Wolny J. Envelope Function Analysis of Quasicrystals. Crystals. 2022; 12(4):536. https://0-doi-org.brum.beds.ac.uk/10.3390/cryst12040536
Chicago/Turabian StyleStrzałka, Radosław, Łukasz Chuchra, and Janusz Wolny. 2022. "Envelope Function Analysis of Quasicrystals" Crystals 12, no. 4: 536. https://0-doi-org.brum.beds.ac.uk/10.3390/cryst12040536
Note that from the first issue of 2016, this journal uses article numbers instead of page numbers. See further details here.