1. Introduction
The main requirements for modern radio-electronic components are miniaturization and reduction in production costs. To some extent, these requirements can be met by the use of ferroelectric materials.
Studies of the electrodynamic properties of functional materials in the microwave range have been actively conducted for several decades. Much attention in this field is paid to the study of ferroelectrics with high values of relative permittivity, which, together with a number of other parameters, allows them to be applied in many radio-electronic devices, such as microwave resonators, attenuators, and filters. The use of ferroelectrics in microwave technology has made it possible to meet the miniaturization requirement for all modern electronic components.
A number of review papers demonstrate achievements in the field of studying the dielectric properties of ferroelectric functional materials obtained in various solid states (ceramic solid solutions, thin films) from the point of view of their application in microwave devices [
1,
2,
3]. Among the many prospects for ferroelectric applications, the use of bulk monocrystalline or ceramic materials in tunable resonators, tunable filters, and lens antennas is distinguished. Ferroelectric thin films can be used in varicaps or phase shifters as part of an active electronically scanned array (AESA) [
1,
3]. Of no less interest are the studies of the radio-absorbing properties possessed by both ferromagnetic and ferroelectric materials [
2].
To study these properties, various methods are used, the choice of which is usually due to the frequency range under study. The electrodynamic properties of many different complex ferroelectric and multiferroic compositions in the frequency range (0.5–2.5 GHz) can be studied by the method that utilizes cavity resonators. Using this method, in [
4], the dependences of the real part of the permittivity and the tangent of the dielectric loss angle on the temperature and composition of SrTiO
3–BiMnO
3 (STO-BMO) solid solutions were investigated. It was found that solid solutions containing 60 and 70% BiMnO
3 exhibit high dielectric losses at room temperature. Similar studies were also carried out for solid solutions of the SrTiO
3–BiCrO
3 system in the same frequency range [
5], in which the loss level was slightly lower. In another paper [
6], it was shown that solid solutions of Pb(Fe
1/2Nb
1/2)O
3–Pb(Fe
2/3W
1/3)O
3 (PFN-PFW) have similar parameters in numerical equivalent but have sharper peaks in the permittivity spectrum.
When studying the permittivity of solid solutions of ferroelectric relaxors PbMg
1/3Nb
2/3O
3-PbSc
1/2Nb
1/2O3-PbZn
1/3Nb
2/3O
3 (PMN-PSN-PZN) at high temperatures, measurements at low frequencies (20 Hz–1 MHz) were carried out using a precision meter LCR HP 4284. At higher frequencies (90–900 GHz), this was accomplished using a spectrometer based on a system with an enhanced femtosecond laser [
7]. These studies have shown the nonlinearity of the spectrum at frequencies of 0.1–0.7 THz.
Similar studies were carried out when studying the properties of PLZT ceramics with different concentrations of components depending on the temperature in a wide frequency range (20 Hz–100 THz) [
8]. For measuring the dielectric constant in the range of 20 Hz–1 MHz, the HP 4284 precision LCR meter was also used, the coaxial and waveguide method using dielectric spectrometers was used in the range up to 4 GHz, and a Bruker IFS113v Fourier spectrometer was used in the infrared range.
At the moment, thin ferroelectric and multiferroic films have the greatest prospects for use in microwave technology, for the study of which the coaxial probe method described in [
9] is often used. In particular, this method was used to study the dielectric properties of lead ferroniobate (PFN) thin films on a strontium titanate (STO) substrate in the frequency range of 20 MHz–20 GHz [
10]. It was shown that the behavior of the measured permittivity demonstrates similarity with the one-dimensional Ising model.
However, despite the relevance and great interest in the use of ferroelectric materials in the microwave technology field, their development and research are difficult due to technical problems associated with the choice of specific conditions and methods for obtaining materials, both in the case of thin films and bulk samples. Moreover, it is well known that the electrodynamic properties of ferroelectric materials, regardless of solid state, also strongly depend on the conditions and methods of synthesis [
11,
12]. For example, in [
12], the results of a study of the dependence of the Q factor and dielectric permittivity on the number of oxygen vacancies of thin films (Ba
0.4Sr
0.6)TiO
3 on a MgO substrate obtained by laser-assisted deposition in an oxygen atmosphere at different pressures.
Thus, the complexity and variety of methods of obtaining, as well as measurement methods, slow down the development of scientific research in the direction of finding correlations between the structure and electrodynamic properties of ferroelectrics in the microwave range. In order to fully realize the potential of this research area, it is necessary to solve problems related to the development of new materials and methods for their production, as well as the development of new and well-known modeling and measurement methods that allow for more complete studies of previously studied materials. In particular, one of the defining characteristics of materials is microwave absorption. The scope of application of the developed materials depends on it.
As shown above, ferroelectrics, along with multiferroics, can exhibit high electromagnetic losses in the microwave range. One of the promising materials for applications in radio electronics is considered to be multicomponent ferroelectric media consisting of ferroelectric (PbTiO3), antisegnetoelectric (PbZrO3), and relaxor (PbMg1/3Nb2/3O3) components. High permittivity and complex phase composition can probably lead to high electromagnetic losses in the microwave range. Previously, these systems were not measured in the microwave range.
In this paper, it is proposed to study the dependence of the microwave-absorbing properties of ferroelectric samples on the composition using a microstrip line and a network analyzer. Much attention was paid to a detailed description of the developed measurement technique since such experiments were carried out for the first time. In most of the above studies, the details of the methods are described extremely superficially. We believe that a detailed description of the details of the experiment and calculations will help researchers in setting up similar experiments with other compositions, which will help in the search for optimal materials for specific applications in microwave technology.
2. Materials and Methods
Samples of four-component 0.98(
xPbTiO
3–
yPbZrO
3–
zPbMg
1/3Nb
2/3O
3)–0.02PbGeO
3 solid solutions system (for brevity, hereinafter PbTiO
3–PT, PbZrO
3–PZ, PbMg
1/3Nb
2/3O
3–PMN, and the whole system, PMN-PZT-PG) were the objects of this study. The Gibbs triangle with selected 1–5 sections corresponding to the content of PMN (1, 2) and PZ (3, 4) 5 and 15 mol.%, respectively, and an equal ratio of the concentrations of PMN and PZ (5) is shown in
Figure 1.
The composition of the first section is 0.98(xPbTiO3–yPbZrO3–0.05PbMg1/3Nb2/3O3)–0.02PbGeO3. The molar fraction of PT varies in range (0.37 < x < 0.57). The composition of the second section is 0.98(xPbTiO3–yPbZrO3–0.15PbMg1/3Nb2/3O3)–0.02PbGeO3. The molar fraction of PT varies in range (0.3 < x < 0.55). The molar fractions of PZ are related to the molar fractions of PT as y = 1 − x.
The composition of the third section is 0.98(xPbTiO3–0.05PbZrO3–zPbMg1/3Nb2/3O3)–0.02PbGeO3. The molar fraction of PT varies in range (0.11 < x < 0.5). The composition of the second section is 0.98(xPbTiO3–0.15PbZrO3–zPbMg1/3Nb2/3O3)–0.02PbGeO3. The molar fraction of PT varies in range (0.1 < x < 0.55). The molar fractions of PMN are related to the molar fractions of PT as z = 1 − x.
The composition of the fifth section is 0.98(xPbTiO3–yPbZrO3–zPbMg1/3Nb2/3O3)–0.02PbGeO3. The molar fraction of PT varies in range (0.23 < x < 0.52). The molar fractions of PMN and PZ are equal and calculated as (1 − x)/2.
The method of obtaining ceramics, XRD studies, and measurements of electrical parameters are described in Ref. [
13]. The samples were made in the form of cylinders with a diameter of 10 mm and a height of 1 mm. Mechanical surface treatment was carried out with a diamond tool according to the 6th accuracy class. The error of sample diameters and thicknesses was no more than 3% for thickness and no more than 1% for diameter.
Throughout the study, we carried out procedures while considering the concept of S parameters. The matrix of S parameters for a quadripole (2-port network) consists of 4 power ratio factors: S
11 and S
22 are the reflection coefficients for the first and second ports (the ratio of the reflected wave power to the incident one); S
12 and S
21 are the transmission coefficients for the first and second ports (the ratio of the transmitted wave power to the incident one) [
14].
Radio engineering measurements were performed using a vector network analyzer (VNA) P4M-18 “Mikran” with an operating frequency range of 10 MHz–20 GHz. Calibration was performed using an Agilent 85052D calibration kit, which uses coaxial connectors of the PC 3.5 standard and is designed for a frequency range of 0–26.5 GHz. Since not all measurements were taken on the same day, calibration was repeated for each series of measurements. This was performed in order to eliminate errors in previous calibrations, which could occur when disconnecting and reconnecting the measuring cables. The number of selected frequencies during calibrations and measurements was 1001 in the entire available VNA interval. It was experimentally found that such a number of frequencies provides sufficient accuracy to detect all ripples in the frequency dependences of the S parameters, including small ripples, presumably associated with the interference of reflections from coaxial connectors on the analyzer case.
For measurements, a measuring cell was used, which is a straight segment of a microstrip line (MSL) on a glass fiber reinforced epoxy substrate (FR4) with SMA 3.5 mm (SubMiniature version A—a standard for coaxial radio frequency connectors that are used in most electronic devices) coaxial connectors at both edges. The operating frequency range of the connectors was up to 18 GHz. During each series of measurements, the quality of the contacts of the MSL coaxial connectors and VNA microwave cables was checked by analyzing the S-parameter frequency dependences. If the quality of the contacts is poor, the frequency dependences of the S parameters may show differences between the reflection coefficients S
11 and S
22 and the transmission coefficients S
12 and S
21 for a line without a sample (
Figure 2), which increases when the samples are placed on the MSL.
The frequency dependences of the S parameters for the correctly connected MSL are shown in
Figure 3.
The bandwidth with a satisfactory degree of matching (the level of reflection coefficients (S
11, S
22) did not exceed −20 dB) was about 7 GHz. At higher frequencies, in the places where the central conductors of the connectors were soldered to the MSL, radiation occurred, and part of the energy was lost. The smallest reflection coefficient ripples with a minimum frequency step, shown in
Figure 3, were caused by the interference of small reflections from coaxial connectors located directly on the vector analyzer case, which was confirmed by their preservation in the absence of a measuring layout.
Thus, at the preparation stage for measurements, the following actions were performed:
Calibration was carried out, while the connection reliability of the measurement cables to the VNA and the calibration set was mechanically checked;
The S parameters of the empty line were measured, and the reliability of its connection with the measuring cables was checked both mechanically and by analyzing the dependence of the S parameters on frequency (if the connection is correct, there should be no symmetry violations, and the level of the reflection coefficient should not be higher than −20 dB);
For greater reliability, S parameters of MSL without sample were compared with previously obtained MSL measurements;
Preparatory procedures were stopped in case of a coincidence of characteristics.
The study was carried out using the technique described in Ref. [
15]. To compare the absorption coefficient of two or more materials with each other, the S parameters of the MSL were first measured without a sample. The energy dissipated in the MSL can be calculated as the difference between the incident energy and the sum of the reflected and transmitted energy. Then, the samples were sequentially placed in the same place on the MSL, and the dissipated energy was calculated for them in a similar way. Considering that the energy dissipated in MSL with a sample is greater than in MSL without a sample, one can find their difference. In this way, we determined the energy absorbed by the sample. The technique makes it possible to compare the absorption level of electromagnetic waves in the microwave range in various materials with close electrical parameters.
The measurements were carried out in the following way. The samples were placed in the center of the MSL. The sample’s location was marked so that all measurements were carried out under approximately the same conditions. Small deviations in the positioning of the samples (within 0.5 mm), as well as axial samples rotations, affected the measurement results insignificantly; at least the appearance of the frequency dependences of the S parameters did not change (
Figure 4).
As can be seen from
Figure 4, the frequency dependences of both the transmission coefficient and the reflection coefficient coincide within graphical accuracy for any orientation of the sample. All samples were measured in this way, and similar behavior was observed in all of them.
Sometimes, when positioning the sample, asymmetric dips in the reflection coefficient (
Figure 5) occurred, which disappeared with more careful positioning of the sample. In all cases, we sought to achieve symmetry of the reflection coefficients, since the shape, structure, and composition of the samples did not imply asymmetric behavior.
Thus, the measurements were carried out in the following order:
The sample was placed on the MSL at the marked location, as precisely as possible;
S parameters of the system were recorded;
The sample was replaced on the MSL, while it was rotated by about 90 degrees, or turned over, after which the S parameters were recorded again;
The procedure was repeated, while the frequency dependences of the S parameters were compared with each other;
If after several repetitions, the results were identical, work with the next sample was stopped.
All samples had relatively stable characteristics and did not have pronounced asymmetric dips in the reflection coefficient. Therefore, each sample was measured no more than three times. For further calculations, any of the obtained frequency dependences for each sample could be chosen.
After obtaining the frequency dependences of the S parameters for all samples, the absorption coefficient was calculated, after which the dependences of the absorption coefficient for all samples were compared with each other.
3. Results and Discussion
Since all the samples had the same shape and were placed in the same place on the MSL, the measurement results for all cuts turned out to be identical and had common features (a cut is a set of samples with a fixed concentration of one of the components; the cuts are marked with different markers in
Figure 1). Therefore, we describe the appearance of the amplitude–frequency characteristics using the fourth section of the system under study as an example (the PZ concentration was constant and amounted to
y = 0.15, while the ratio of PT and PMN components varied).
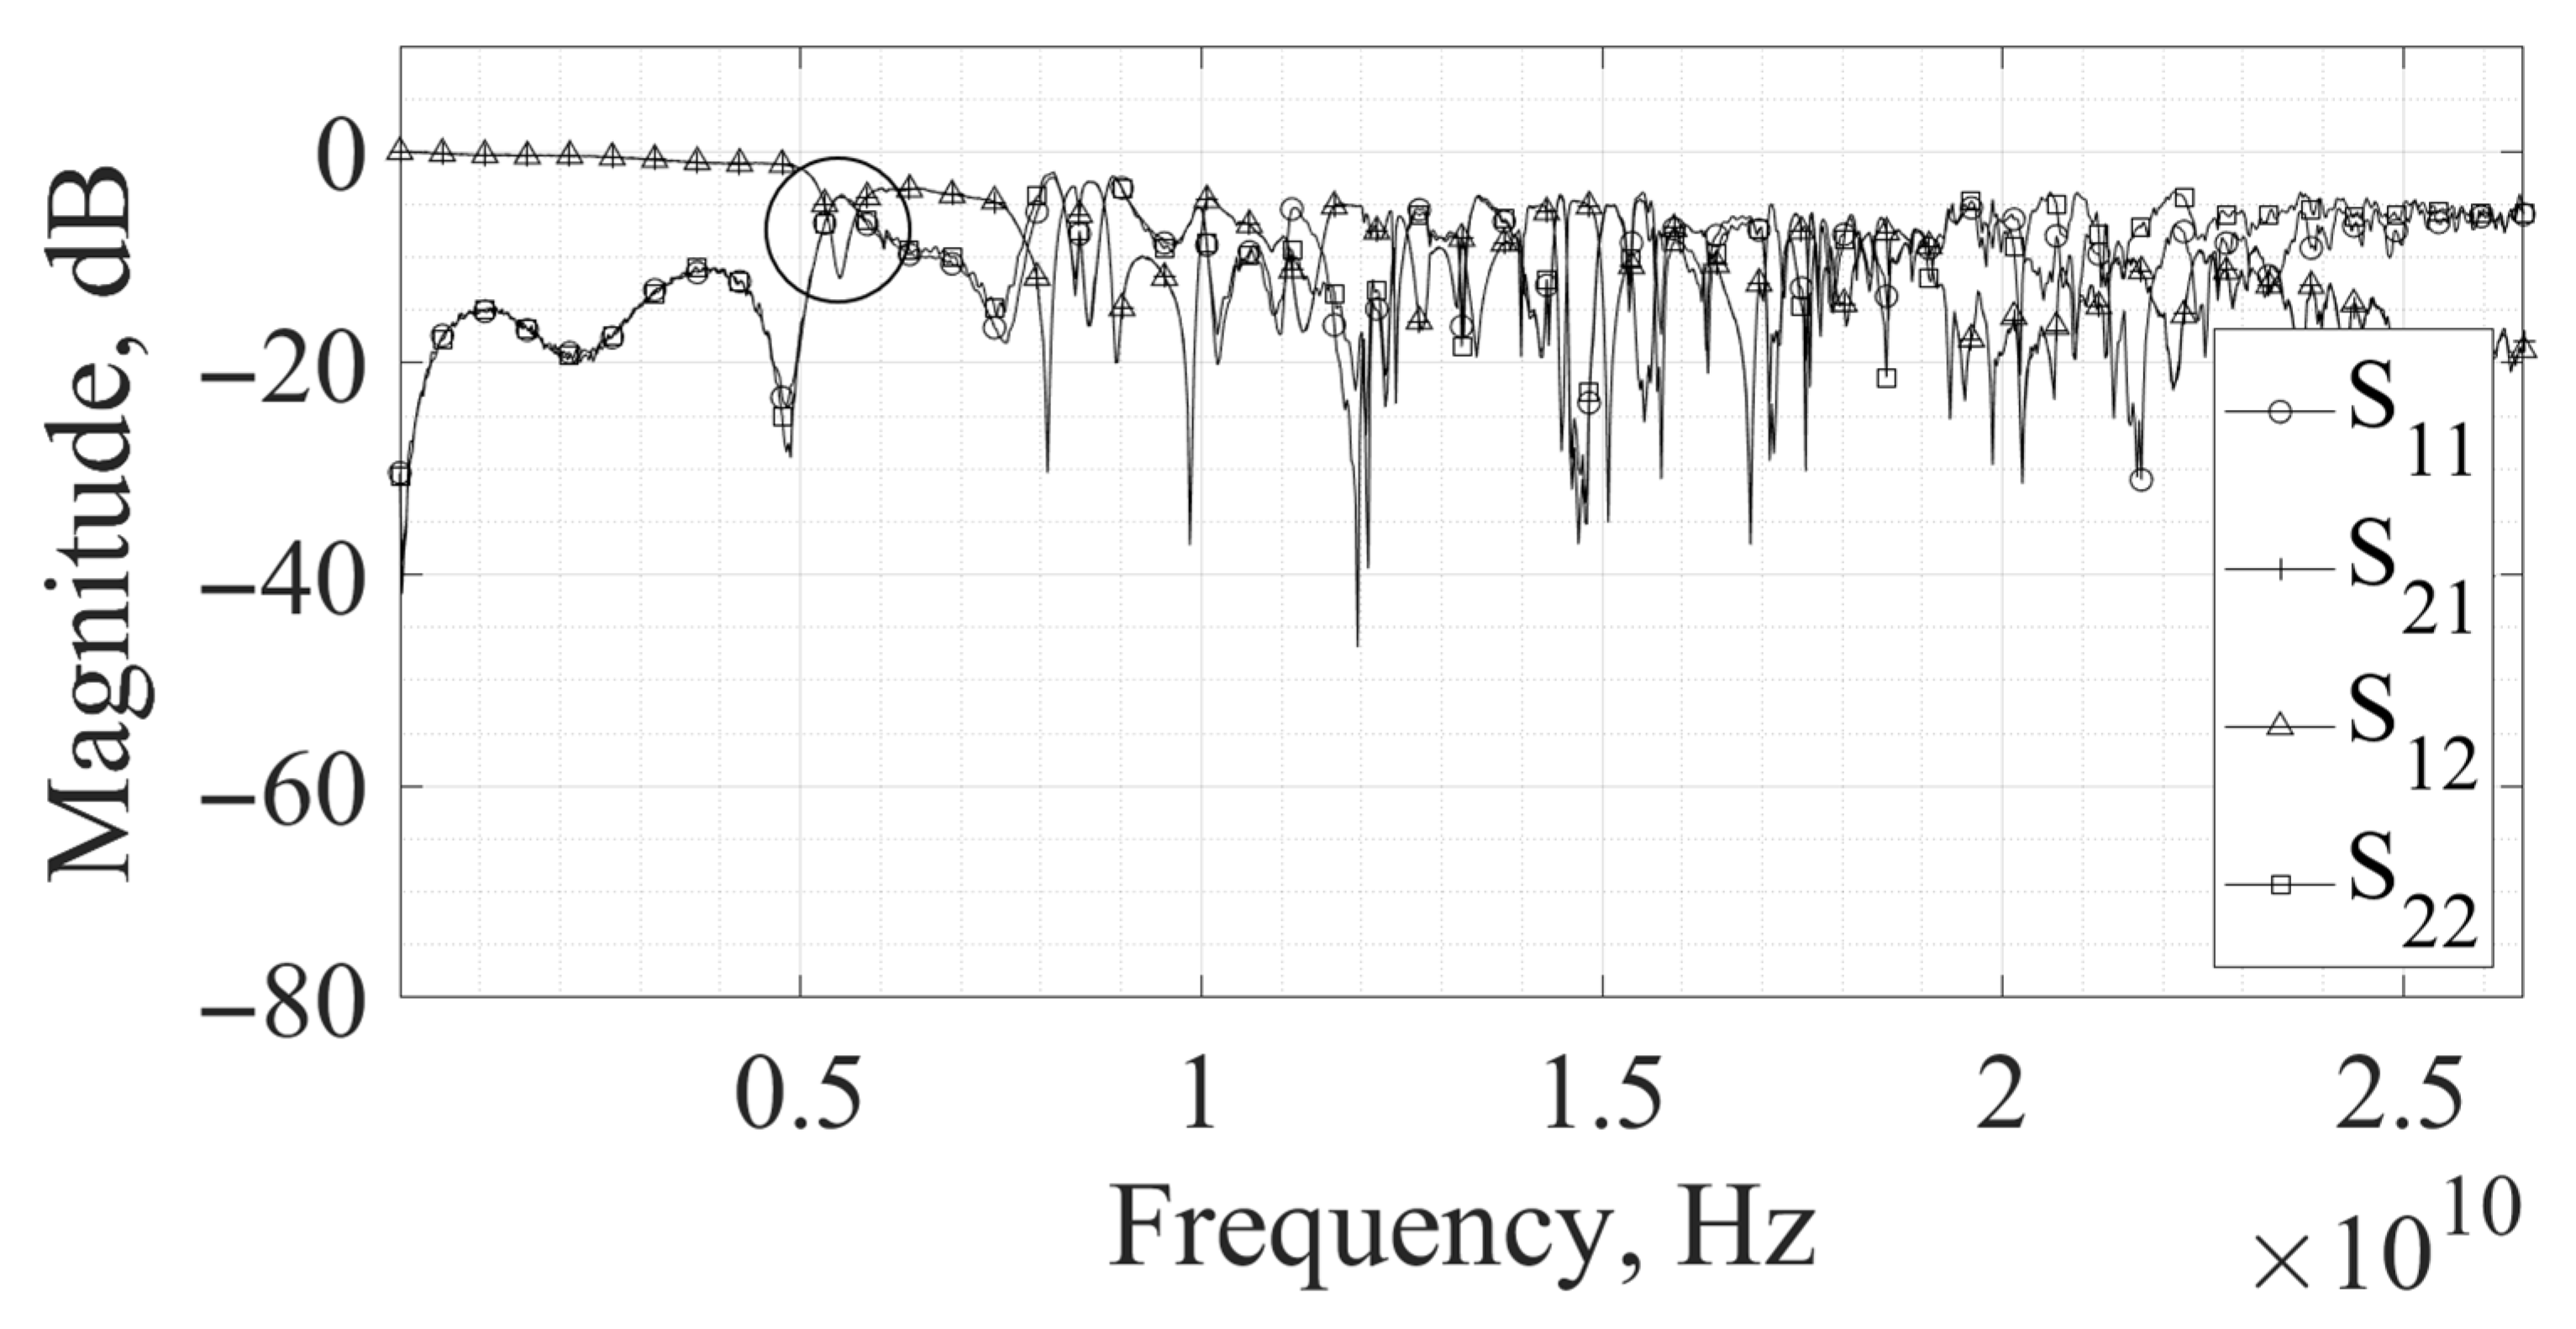
Figure 6 shows the frequency dependences of the S parameters of samples of the four-component PMN-PZT-PG system with PT concentrations
x = 0.1 and
x = 0.55. Here, and in what follows, x, y, and z are molar fractions of PT, PZ, and PMN, respectively, in composition.
As can be seen from the figures, the S parameters of both ports matched each other (S11 = S22, S12 = S21). This means that the studied quadripole network was symmetrical.
Comparing these patterns with the S parameters of the MSL without a sample (
Figure 3), it can be seen that the reflectivity dips disappeared. A sample placed on the MSL partly reflected and partly absorbed electromagnetic waves. In addition, it increased the electrical length of the MSL. All this led to the disappearance of interference minima in the measured range. At some frequencies, the reflected waves still added up in such a phase that new dips in the reflection coefficient occurred. One of these dips is marked with an arrow in
Figure 6. Changing the composition of the samples led to a change in the position of these features in the frequency responses. Next, we consider the patterns of their location in more detail.
Additionally, a number of samples showed gain dips, one of which is circled in
Figure 6b. This is most likely a very diffuse resonance of electromagnetic waves in the sample. Such resonances should undoubtedly arise in dielectric cylinders with high relative permittivity. Similar dips can be seen in dielectric resonators when placed on the MSL (
Figure 7).
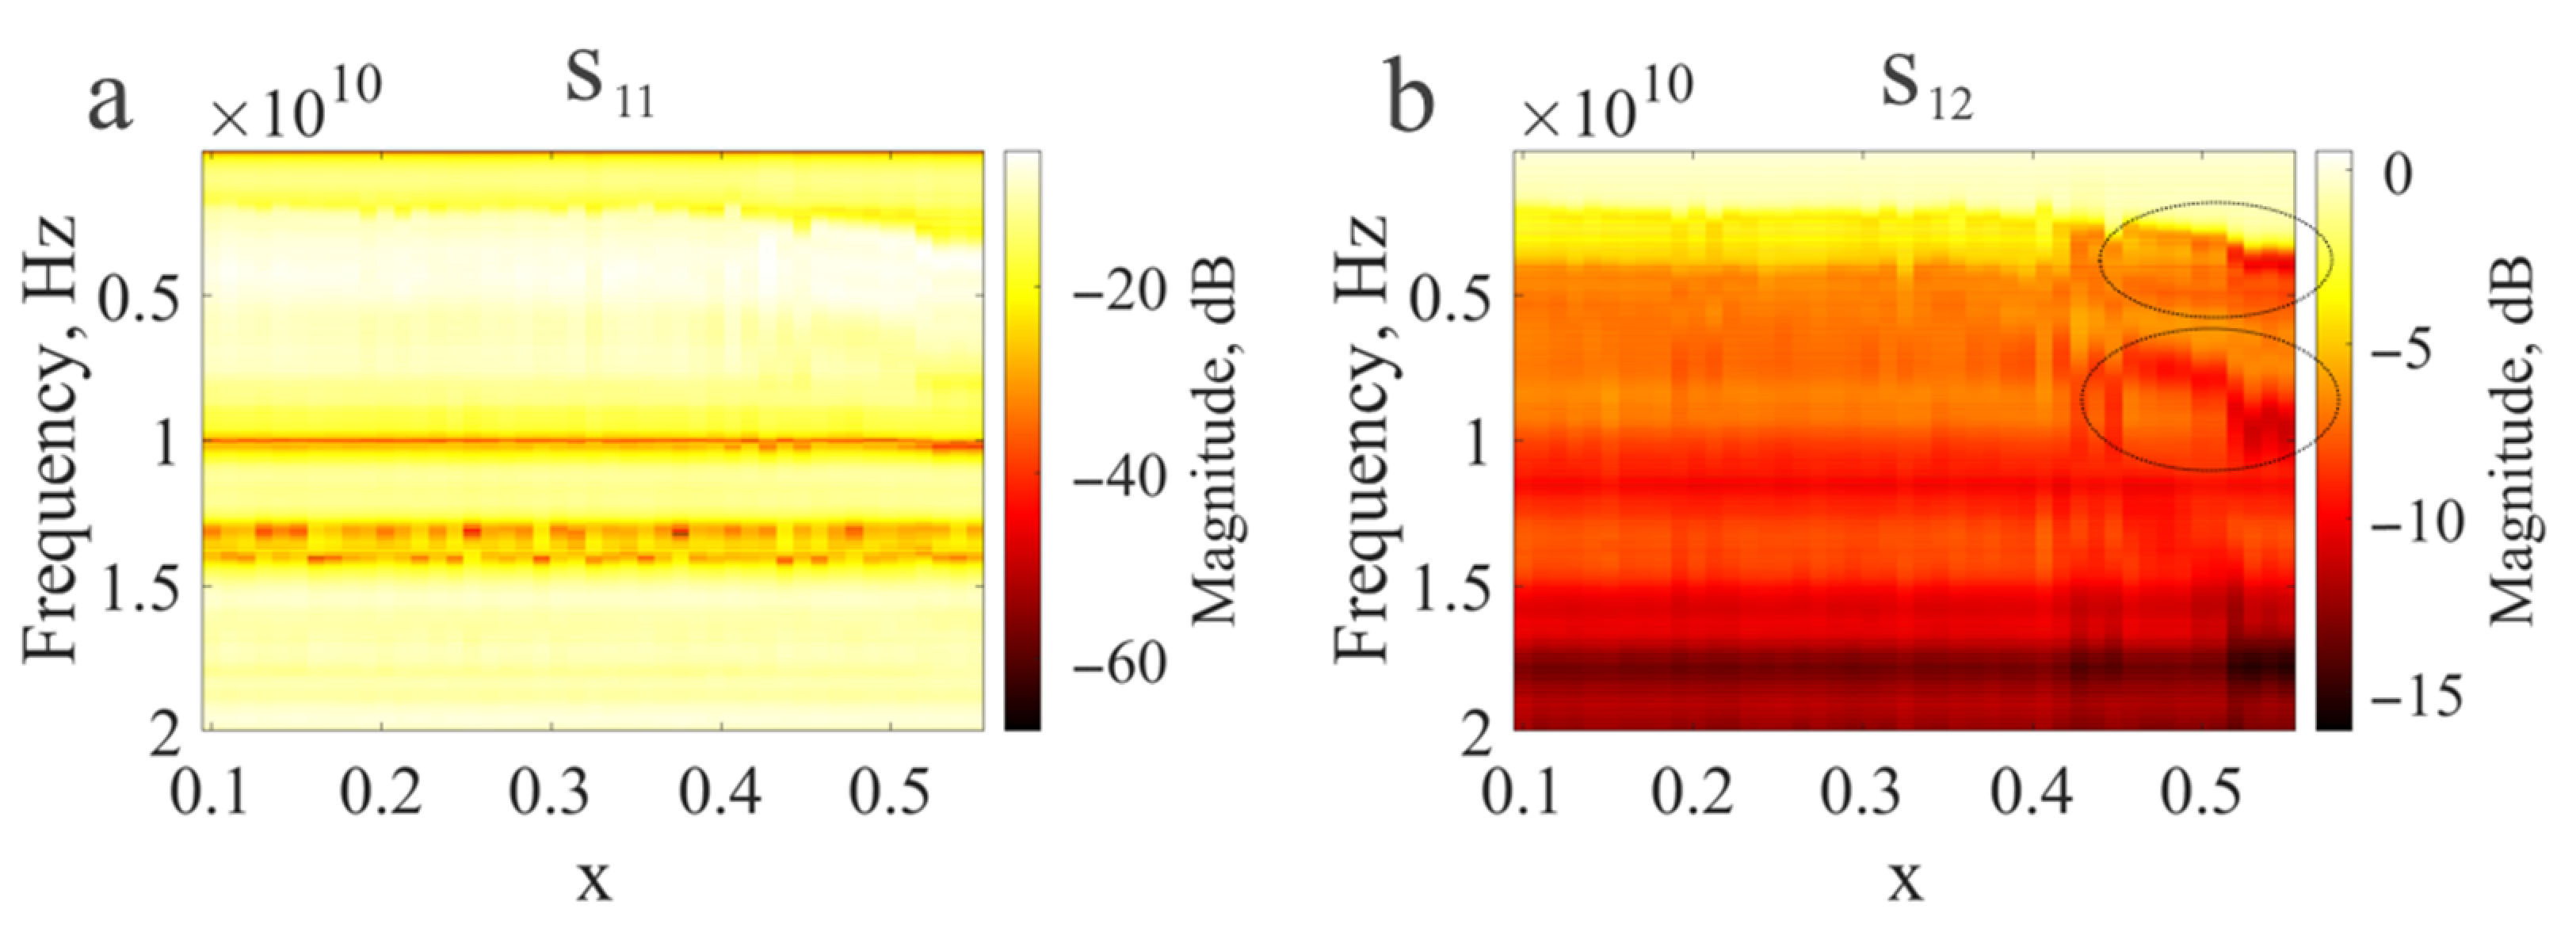
Figure 8 shows the dependence of the S parameters of MSL with samples on the frequency and composition of the samples. The frequency is plotted along the vertical axis, the concentration of PbTiO
3 is plotted along the horizontal axis, and the color indicates the level of reflected and transmitted power relative to the incident power.
As we noted earlier, the reflection coefficient dip that appeared in a sample with a concentration of PT
x = 0.1 shifted to higher frequencies with increasing concentration of PT, and at
x = 0.55, it was already at 2.5 GHz. In addition, as the concentration of PT in the samples increased, resonance occurred, as indicated by the minima of the transfer coefficient, marked by ellipses in
Figure 8b. This is due to a decrease in the permittivity of samples with a high concentration of PT (studies of the composition dependence of the permittivity are described in Ref. [
13]). Let us consider this in detail: For example, we observed reflection dip on certain frequencies in certain compositions. Another composition led to changes in permittivity. The changes in permittivity led to changes in the electrical length of the MSL, which led to phase rate changes. That is why reflected waves interfered at another frequency. There were at least four sources of reflection: two ports and two edges of the sample. If all of the waves interfered, the dips would be very low at certain frequencies, like it was on empty MPL. However, the conditions for the interference of four waves are very rare. That is why we rarely observed wide shallow dips. Additionally, they moved with changes in the sample’s permittivity.
There were also reflection dips at 10 GHz and 13 GHz and gain dips at 12 GHz, 16 GHz, and 18 GHz (dark lines) that did not change their position with composition, suggesting that these features are unrelated to the material from which the sample is made. Their position may depend on the size of the measuring cell or the position of the sample on the MSL.
All of the above features affect the radio-absorbing properties of the samples.
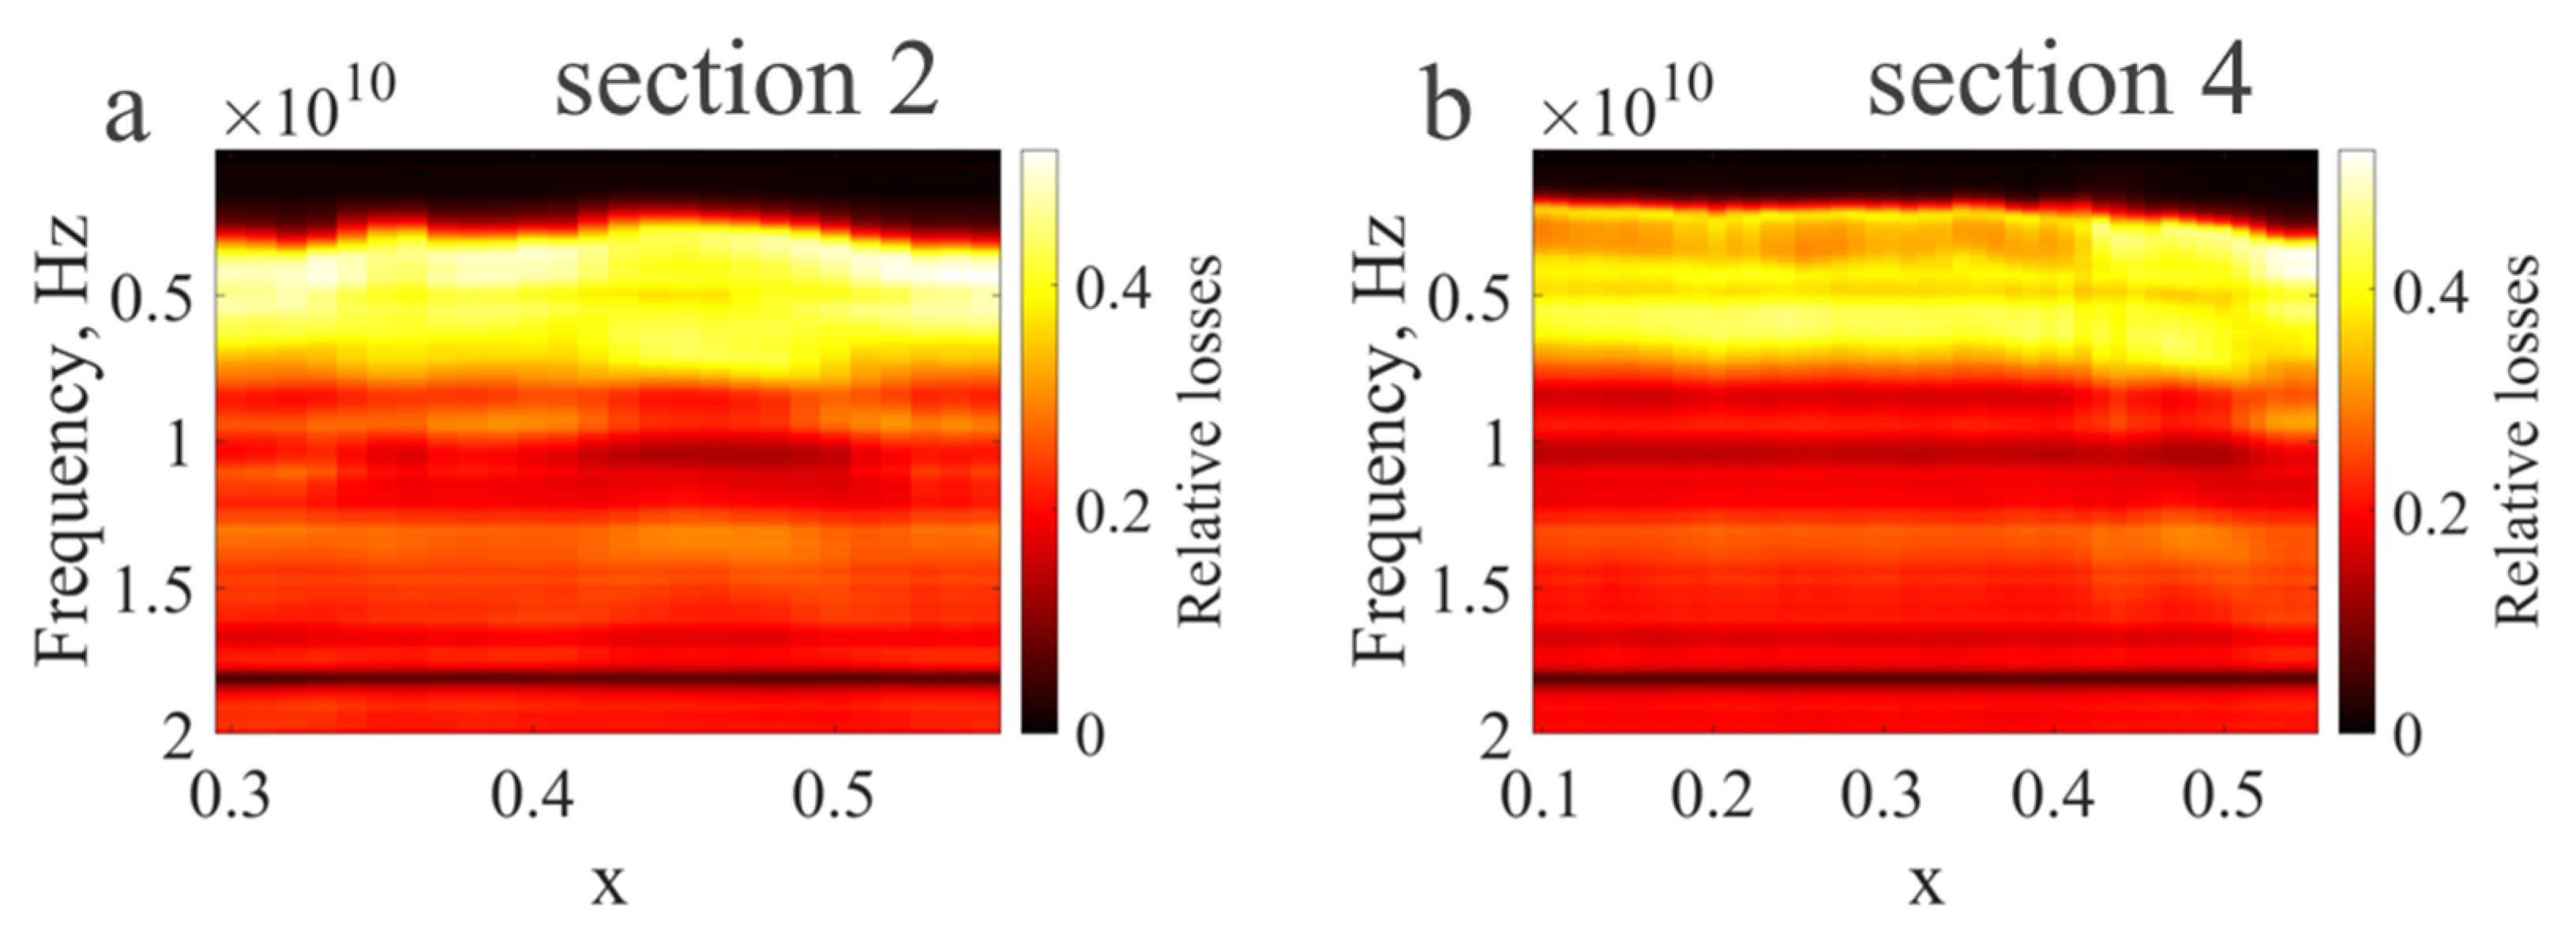
Figure 9 shows the dependence of the absorption coefficient on the frequency and concentration of PT for the second and fourth sections of the system.
Within the current research, we present the characteristics of only two sections, because the remaining three sections had similar parameters.
It was found that, for all samples, the frequency band with relatively high (more than 40%) losses was in the range from 2 to 10 GHz.
In the samples of
Section 2 (
Figure 1) (0.98(
xPbTiO
3–
yPbZrO
3–0.15PbMg
1/3Nb
2/3O
3)–0.02PbGeO
3, 0.3 <
x < 0.55,
y = 1 −
x), there was an increase in the absorption bandwidth in the concentration range PT 0.42 <
x < 0.5 to the level in 0.45, which indicated a loss of slightly less than half of the energy at frequencies of 3–8 GHz. For samples of
Section 1 (0.98 (
xPbTiO
3–
yPbZrO
3–0.05PbMg
1/3Nb
2/3O
3)–0.02PbGeO
3, 0.37 <
x < 0.57,
y = 1 −
x), a similar pattern was observed, and the widest band was in the range of 3–8 GHz in samples with a concentration of PT 0.45 <
x < 0.51.
No similar behavior was observed in the samples of
Section 3 and
Section 4 (
Figure 1) (0.98(
xPbTiO
3–0.05/0.15PbZrO
3–zPbMg
1/3Nb
2/3O
3)–0.02PbGeO
3); however, the absorption band had a constant width of 5 GHz and shifted to higher frequencies with increasing PT concentration. In both sections, the absorption band of samples with the lowest PT concentration (
x = 0.1) was located at frequencies of 2–7 GHz, and with the highest (
x > 0.5) in the range of 3–8 GHz.
In all samples, regions with low values of electromagnetic losses were observed at the same frequencies in different samples (for example, at a frequency of 18 GHz). The absorption level in these areas did not depend on the composition of the samples.
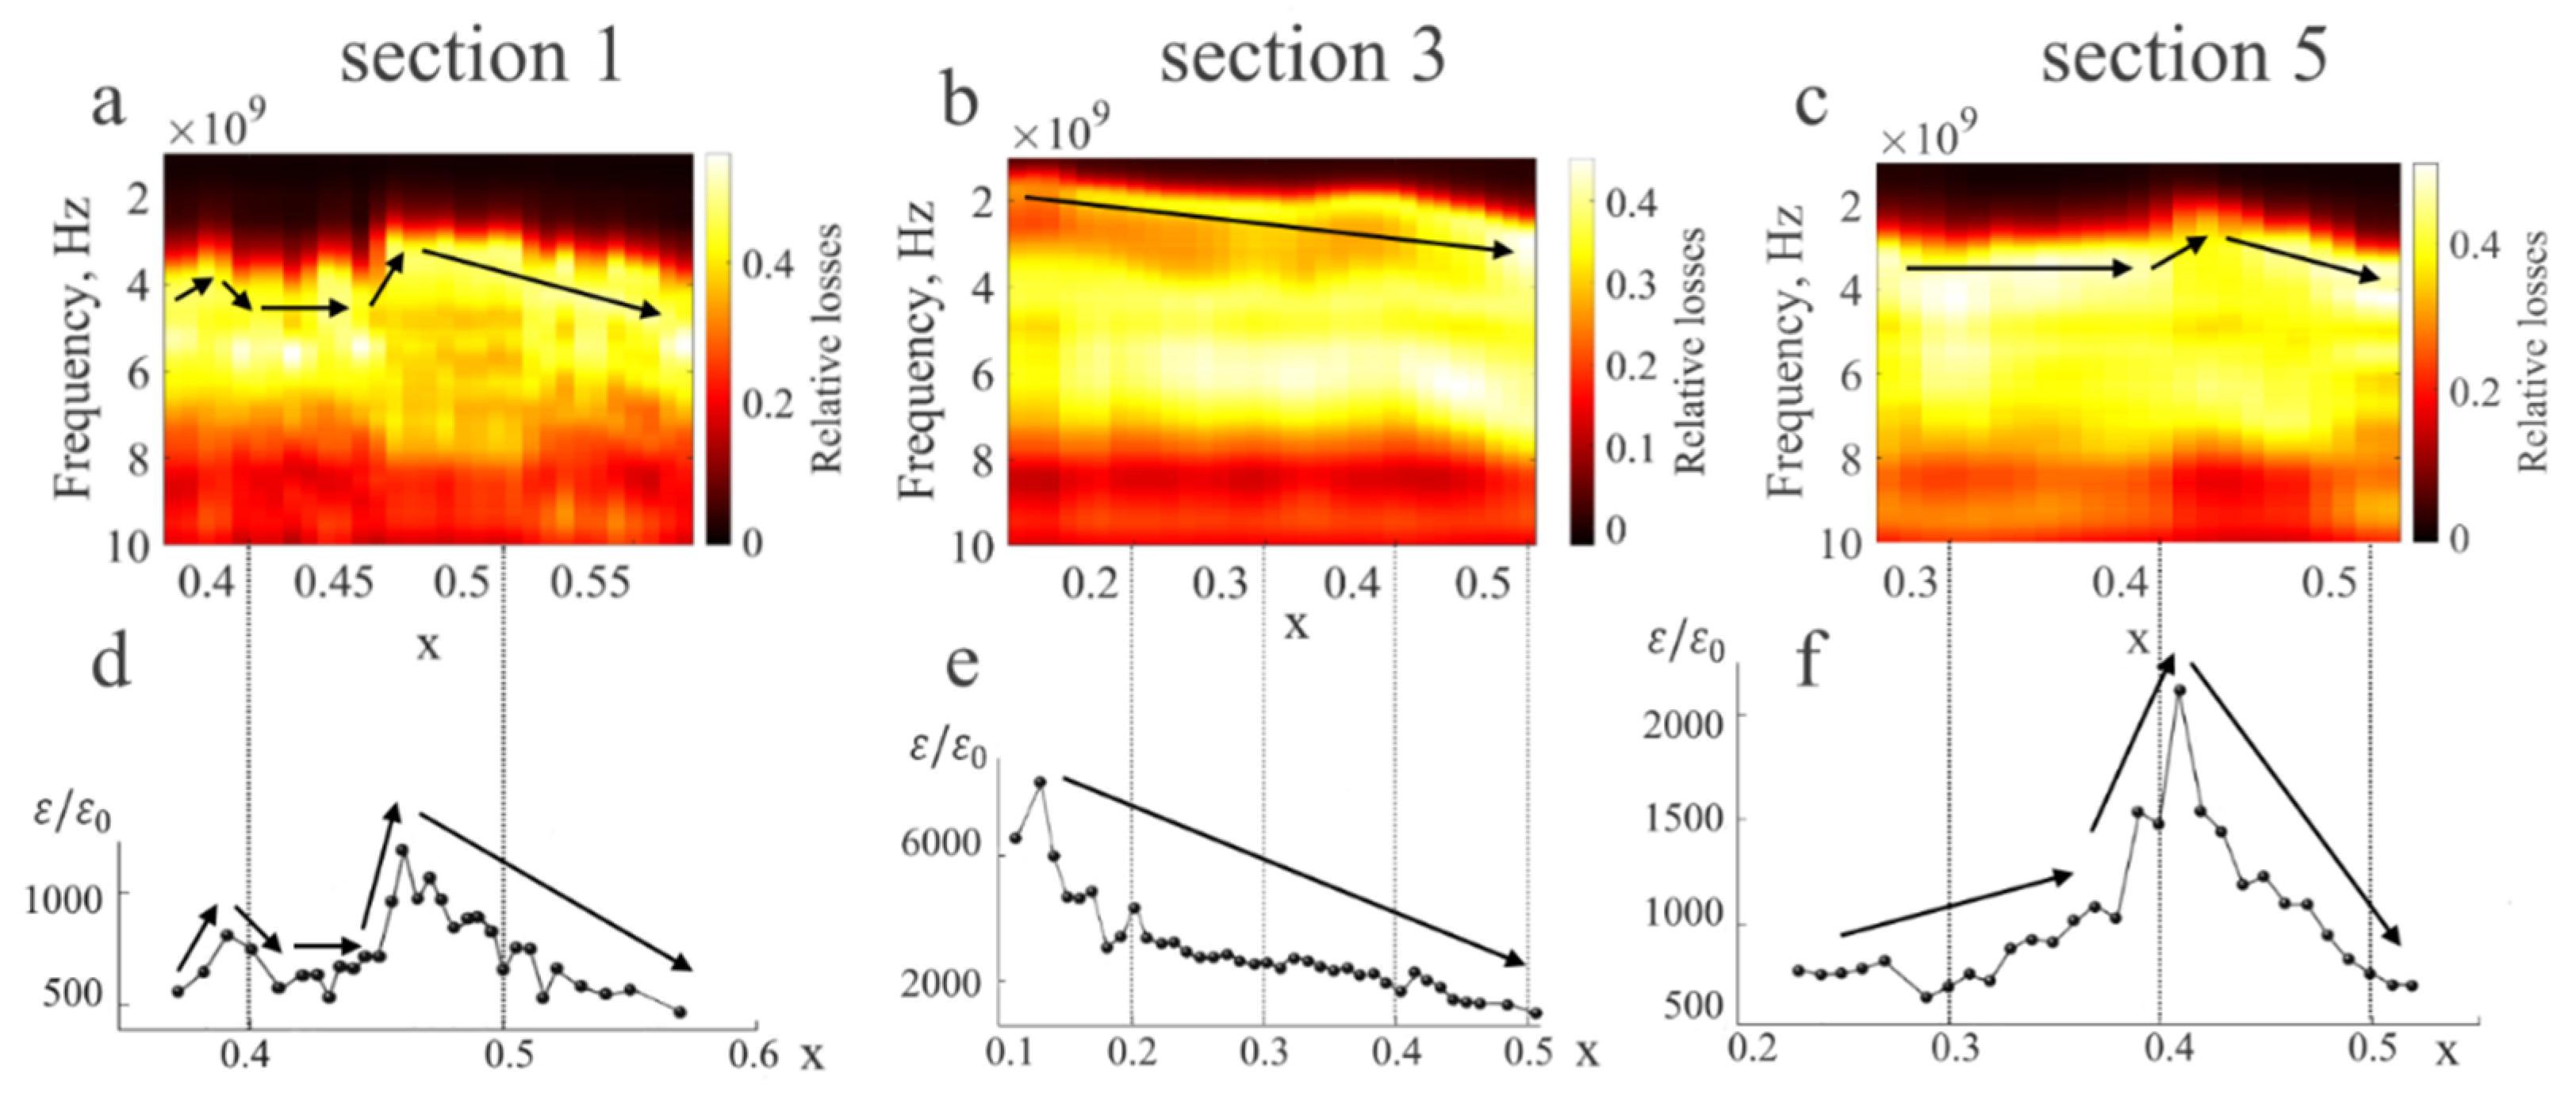
The width of the absorption band and its position for all sections correlated with the dependence of the permittivity on the frequency (
Figure 10). According to the results obtained in Ref. [
13], the extreme values of the dielectric permittivity were achieved during the transition from one phase to another and corresponded to the maximum content of the PSC phase. It is also worth noting that the correlation of the dielectric constant with the position and width of the absorption band was disproportionate, which may be due to the dispersion of the dielectric constant in the microwave range or other factors.
To study the radio-absorbing properties of two-component systems or multicomponent systems in which the ratio of two components changes, this method is quite suitable. However, when studying systems in which all three components change, it becomes difficult to compare the results of calculations with each other. Let us introduce as a characteristic describing the radio-absorbing properties of a sample in a certain frequency range, the effective bandwidth of the spectrum, which is calculated by the following formula:
where
Dmax is the maximum value of the absorption coefficient in the entire measured frequency range;
fmax,
fmin are the maximum and minimum frequencies, respectively, and
D(
f) is a dependence function of the absorption coefficient on frequency.
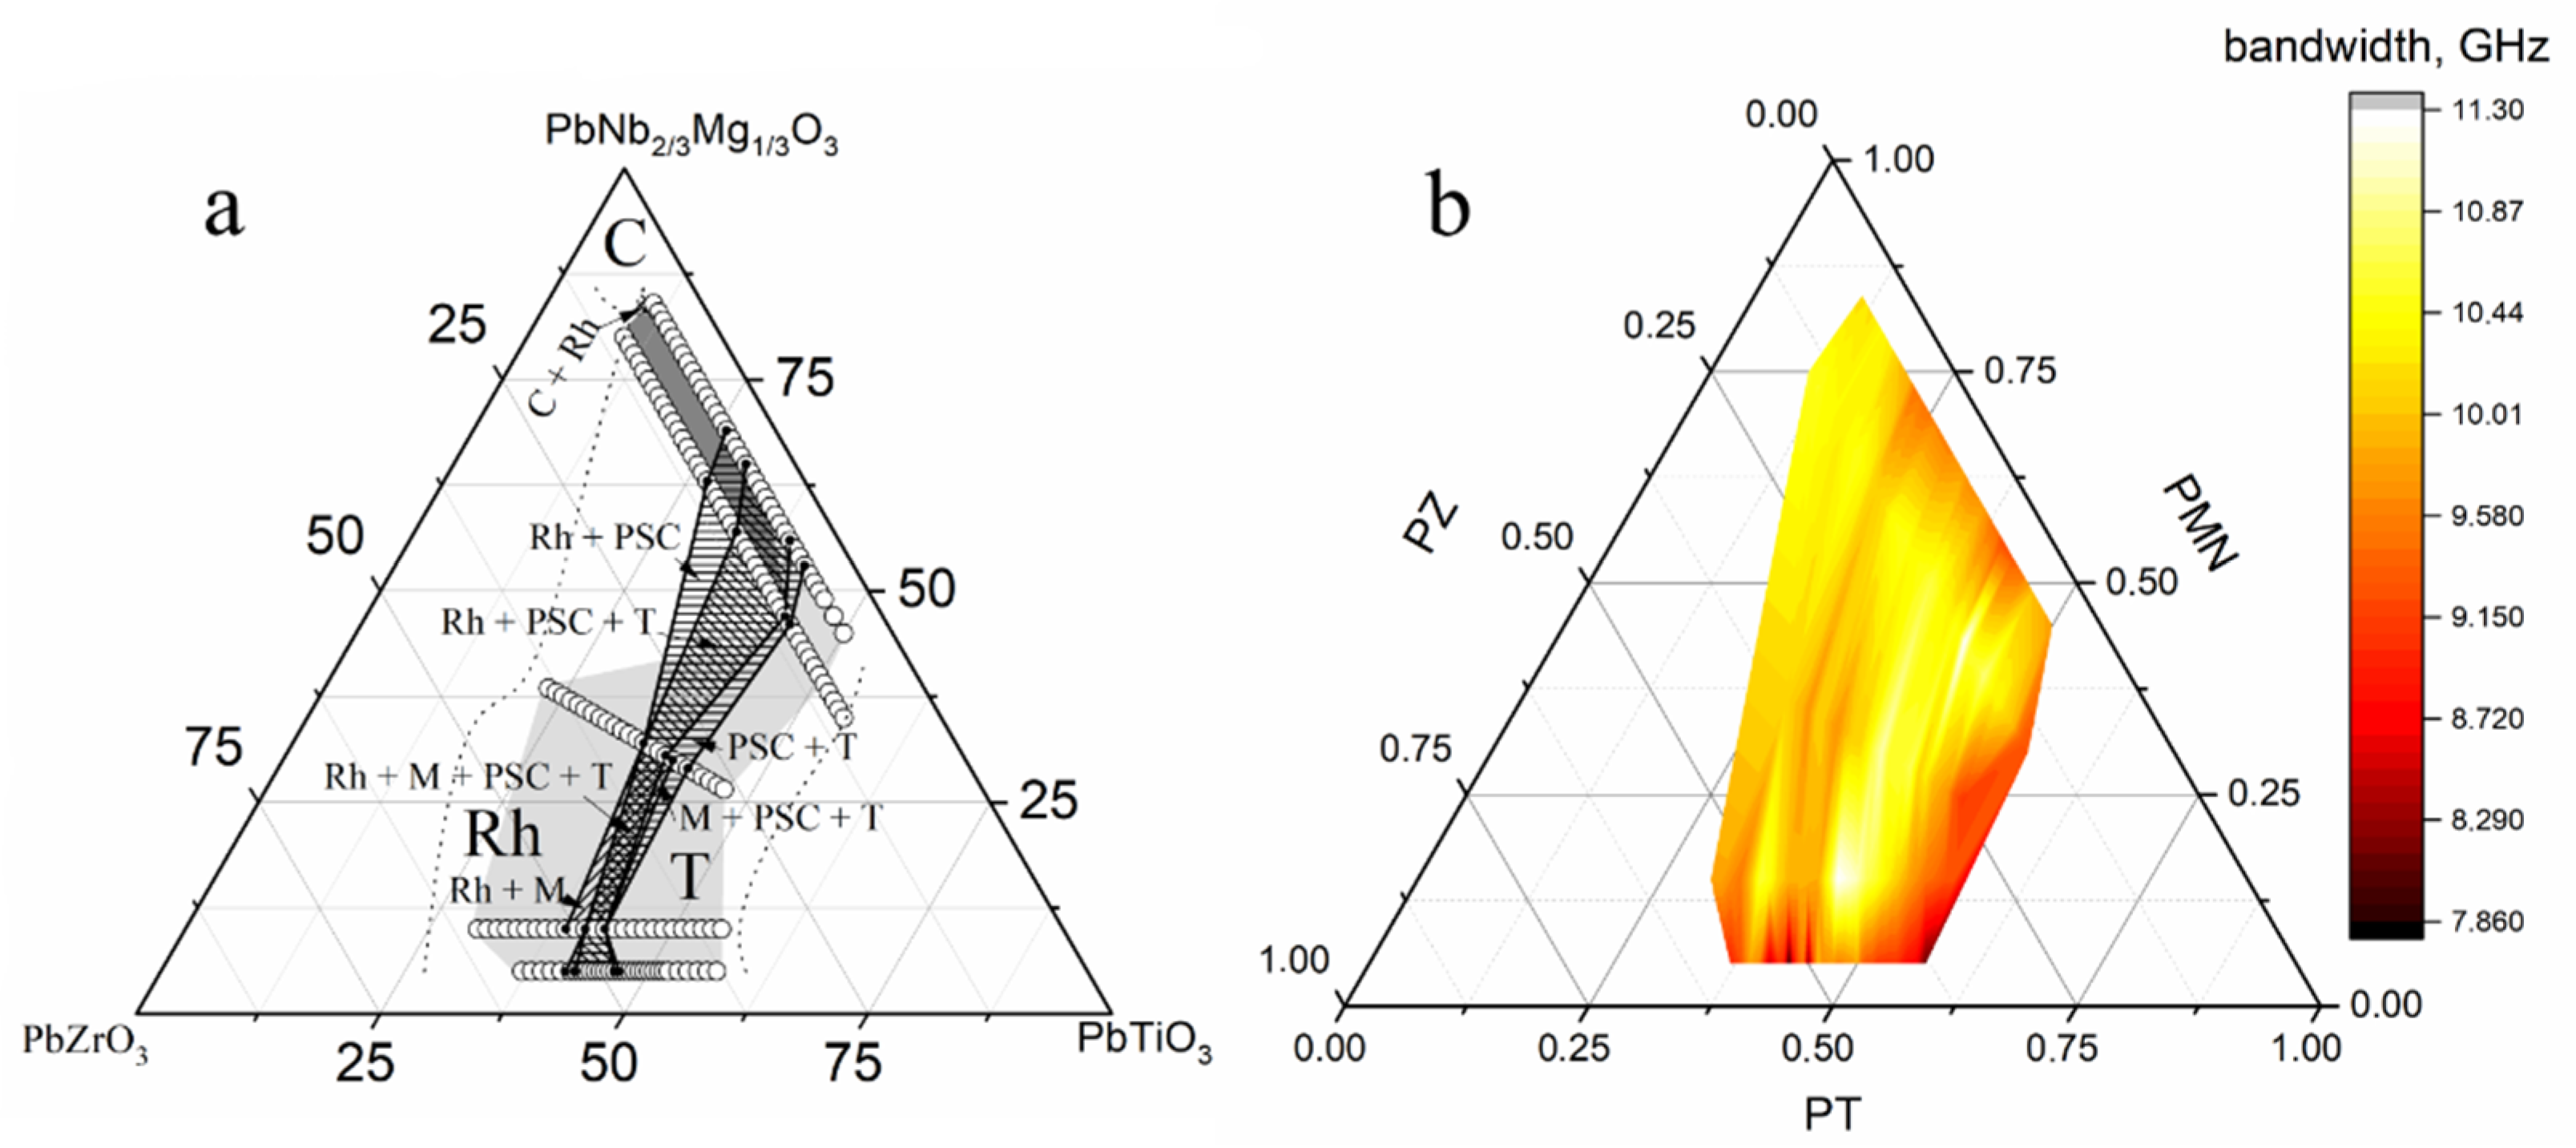
For each sample, the effective bandwidth of the spectrum was calculated, after which the Gibbs triangle with the distribution of effective absorption bandwidths by composition (
Figure 11b) was plotted. Missing points were added by linear interpolation.
The calculated absorption band has a width in the range of 7–12 GHz, while visually in
Figure 9, one can estimate the absorption bandwidth of 5 GHz. Therefore, the value of the absorption bandwidth, in this case, is unreliable, because it was calculated over a wide frequency range. However, these data show in which samples the absorption was greater and in which it was less, which makes it possible to compare different materials with each other. In
Figure 11b, the areas with the widest effective absorption band are highlighted in a light color. Comparing the obtained results with the phase diagram (
Figure 11a), it can be concluded that the compositions with the highest content of various phases had the widest absorption band. Additionally, it is worth noting that almost all compositions with a large variety of phases had pseudocubic phases (
Figure 11a). It is possible that the width and position of the absorption band were affected by its presence.
4. Conclusions
The use of the method described in this study makes it possible to reveal the relationship between the absorbing properties of the material and the composition without resorting to the manufacture of samples of complex shapes. This relationship was obtained by analyzing the radio-absorbing properties of only a given configuration of the measuring system (a sample of a certain shape placed in a concrete place on the MSL). To characterize the material as a whole, additional measurements are required, including modeling.
The relationship between the dielectric constant, the width, and the position of the absorption band in the studied material was found to be nonlinear, which is probably related to the dispersion of the dielectric constant in the microwave range.
Samples with the most diverse phase composition had the widest effective absorption band.
On average, the level of electromagnetic losses was not too high, which is partly associated with the occurrence of resonance in the samples; therefore, the 0.98(xPbTiO3–yPbZrO3–zPbMg1/3Nb2/3O3)–0.02PbGeO3 systems do not have great prospects as radio-absorbing materials.
However, knowing the distribution of radio-absorbing properties by composition, one can choose the most promising compositions for applications in passive and active radio-electronic components, conduct additional studies using other methods or modeling, and obtain permittivity spectra.


 ,
, 


