Article

Design and Numerical Study of Argon Gas Diversion System Using Orthogonal Experiment to Reduce Impurities in Large-Sized Casting Silicon

School of Energy and Power Engineering, Jiangsu University, Zhenjiang 212013, China
*
Author to whom correspondence should be addressed.
Submission received: 21 March 2022 / Revised: 9 April 2022 / Accepted: 13 April 2022 / Published: 17 April 2022
(This article belongs to the Special Issue Heat and Mass Transfer Modeling in Crystal Growth)

Abstract

:
To reduce oxygen and carbon impurities while casting silicon, an argon gas diversion system is proposed. A series of two-dimensional global transient numerical simulations are carried out using Fluent software according to the orthogonal experimental design, including heat transfer, convection of silicon melt and argon gas, and the fully coupling transport of impurities. The numerical results show that when the distance between the outer tube outlet and the cover is 10 mm, the backflow is inhibited by lateral outflow, thus the generation of CO is suppressed and the penetration of impurities into the silicon melt is decreased. The larger the flow rate, the more obvious the effect is. When the outer tube outlet is far from the cover, the effect of removing impurities is no longer significant. In addition, too large or too small an inner tube flow rate is not conducive to impurity reduction. The optimal parameter combination of outer tube flow rate, inner tube flow rate, and the distance between outer tube outlet and the cover are determined by the orthogonal experiment. Compared with the original furnace, the average concentration of oxygen and carbon in casting silicon ingots could be decreased by 7.4% and 59.9%, respectively, by using the optimized argon gas diversion system.

1. Introduction

Directional solidification (DS) technology is an important method for the casting of silicon ingots. This method has the advantages of wider feedstock tolerance, relatively low production costs, higher throughputs, and simpler processes. In addition, the equipment is low cost, high yield, and of simple operation [1,2,3]. However, due to grain boundaries, dislocations, and impurity defects, the quality of the cast silicon ingot is reduced, significantly affecting solar cell performance. Oxygen (O) and carbon (C) are the most common harmful impurities when casting silicon ingots. Excessive oxygen concentration will form thermal donors and boron–oxygen complexes in silicon, reducing the minority carrier lifespan and causing serious light-induced degradation in solar cells [4]. If the solubility limit of C is exceeded, silicon carbide (SiC) precipitates will form in silicon ingots, which will affect the subsequent process of ingot casting, and also lead to severe ohmic shunt in solar cells [5,6].
To effectively decrease the concentration of O and C and improve the quality of the silicon ingots cast, many researchers have proposed various methods and technologies. Some research has focused on suppressing the generation of O and C by controlling the source of pollution, such as by adding an inert material coating to the cover [7], or replacing the graphite cover with a cover made of other materials [8,9] and increasing the thickness of the silicon nitride (Si3N4) coating on the surface of the quartz crucible [10,11]. Another important method that cannot be ignored is to decrease the impurity concentration by controlling the transport path of O and C, for example, by increasing furnace pressure [12,13], or increasing the gas flow rate [2,14]. A lot of effort and attempts were also made in furnace structure design and optimization, including the modification and optimization of the cover [15,16,17], the improvement of the graphite heater [18,19], the design of an argon gas guidance structure [20,21,22], etc. However, some of this research neglected the O and C transport in the silicon melt or did not consider the segregation of O and C during the casting of the silicon. Some factors considered in the optimization of the structure are too singular, which means they cannot predict the influence on the final concentration and distribution of O and C in the silicon ingots comprehensively and deeply. Therefore, a more comprehensive and reasonable scheme is needed to control and predict the concentration and distribution of O and C in silicon ingots more effectively.
In this research, a series of two-dimensional (2D) global transient numerical simulations were carried out in which the coupling effect of the heat transfer, fluid flow, impurities transport, and the O and C segregation while casting silicon were considered. The argon gas diversion system (AGDS) with inner and outer tube structure was optimized by an orthogonal experimental design (OED) from three aspects: the outer tube flow rate (Qouter), inner tube flow rate (Qinner), and the distance between outer tube outlet and cover (H). The best scheme that is beneficial to decreasing the concentration of O and C in silicon ingot was obtained. The numerical results of O and C under this scheme were compared with those in the original furnace and discussed.

2. Model Description

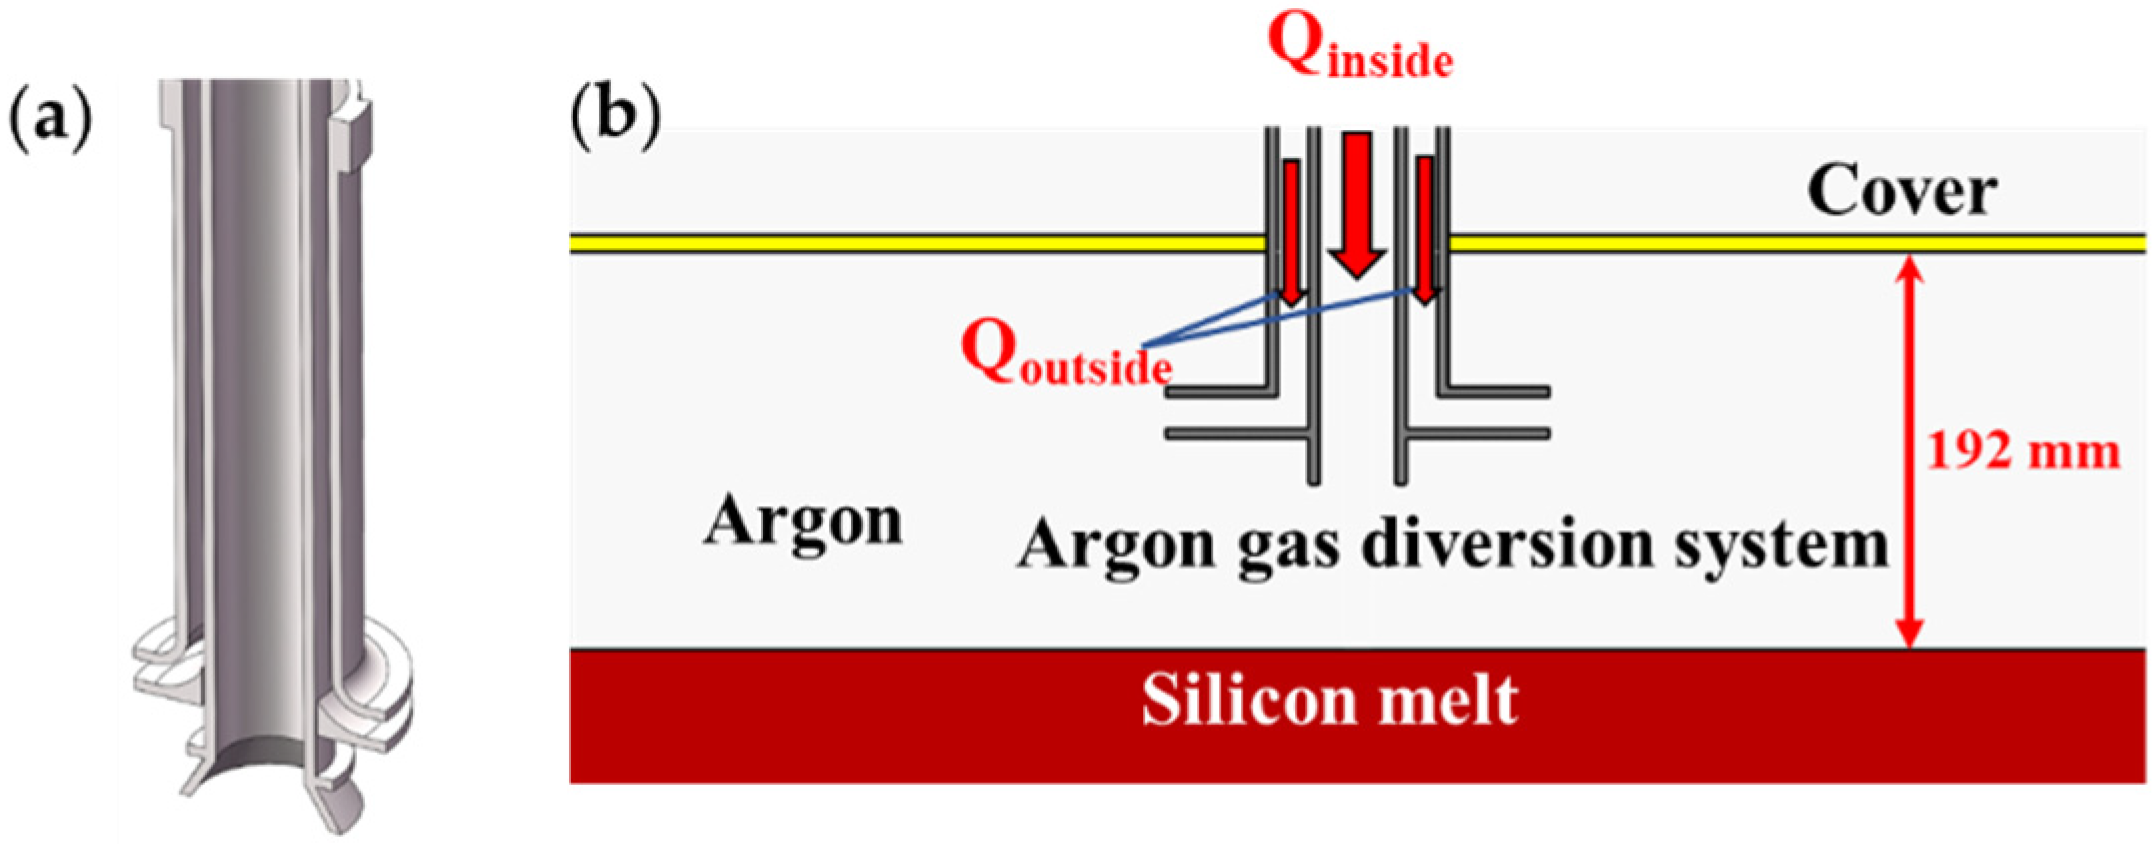
2.1. Geometry and Heat Transfer Model

The research was carried out on the basis of an industrial large-size ALD-G7 DS furnace, and the configuration and calculation grids of the furnace are shown in Figure 1. The size of the silicon ingot is 1320 × 1320 × 385 mm3 and the distance between the cover and the melt free surface is 192 mm. The structured/unstructured hybrid grids are used to divide the computing region. Other detailed descriptions of the furnace modeling and the governing equations of heat transfer and fluid flow are included in our previous published work [23,24]. Figure 2 shows the AGDS used in our study, which is composed of an inner tube and outer tube. To facilitate outward drainage, the nozzle of the outer tube is designed to extend for a certain distance. In addition, the flow rates of the inner and outer tubes can be controlled independently.

2.2. Coupled Model of Oxygen and Carbon Transport

The silicon feedstock is the initial source of O and C. In addition, the O from the quartz crucible also enters into the melt through a Si3N4 coating. The C comes from the surface reaction of the hot graphite parts. The transport pathway of O and C is mainly divided into five parts [17,25]: (1) the O dissolves in the silicon melt from the hot quartz crucible; (2) the O atoms dissolved in the silicon melt are transported to the free surface by diffusion and convection, and combine with silicon atoms to generate silicon monoxide (SiO) gas, which evaporates on the free surface; (3) the SiO is carried away by the argon flow to graphite part surfaces and reacts with C to form carbon monoxide (CO); (4) some of the reactant CO is transported back to the free surface by the effect of convection and diffusion, and then dissolves into the silicon melt in the form of C and O atoms; and (5) the C and O atoms at the crystal-melt (c-m) interface partially enter the growing silicon crystal by a segregation effect. The chemical reaction equations corresponding to the above impurities transport pathways are shown in Table 1.
The governing equations of O and C transport in the silicon region take into account the segregation effect at the c-m interface. When a multicomponent liquid solidifies, solutes diffuse from the liquid phase into the solid phase. This effect is quantified by the segregation coefficient of solute ki [26]. The segregation coefficients of O and C in silicon are 1.25 [27] and 0.07 [28], respectively. The molecular diffusivities for O and C in the melt are taken to be 5.0 × 10⁻⁸ m2·s−1 [29], and that in the crystal is 5.0 × 10⁻¹¹ m2·s−1 [14]. The governing equations are as follows [25]:
t ( ρ s i Y i ) + ( ρ s i β v l i q Y i , l i q ) = ( ρ s i β D i , l i q Y i , l i q ( 1 β ) ρ s i D i , s o l Y i , s o l )
Y i , s o l = k i Y i , l i q
where ρ is the density,   Y i is the mass fraction of species i atoms,   β is the liquid fraction, v l i q is the velocity, D i , l i i q and D i , s o l are the molecular diffusivity for species i atoms in the silicon melt and crystal, respectively,   and   k i is the segregation coefficient of species i atoms.
The governing equations and the molecular diffusivities of the SiO and CO species in argon gas are as follows [30]:
t ( ρ A r Y i ) + ( ρ A r Y i v A r ) = [ ( ρ A r D i + μ t S c t ) Y i ]
D s i o = 8 . 62611   ×   10 6 T 1.75 p
D c o = 1 . 79548   ×   10 5 T 1.75 p
where v A r is the argon gas flow velocity,   Y i are the mass fractions of SiO and CO in the argon gas region, D i is the molecular diffusivities of SiO and CO in the argon gas region, μ t is the turbulent viscosity, and S c t is the turbulent Schmidt number, the value of which is 0.7.
The corresponding equilibrium concentration of O at the interface of quartz crucible and silicon region is [31]:
c o = 0 . 5   ×   10 23   ×   a 1   -   a
a = 1 . 32   ×   e x p ( -   7510 T -   6 . 99 )
For the C atoms at the inside wall of the crucible, zero flux boundary condition is applied. At the interface between quartz crucible and silicon region, C atoms in the silicon melt are non-permeable and no chemical reaction occurs, so zero flux boundary condition is applied.
The concentration relationship of four impurities (O, C, SiO, and CO) is involved at the free surface of the silicon melt. There are four unknown concentration variables and the same number of equations needed to be solved. In addition to the boundary condition (8) and (9), two more boundary conditions are needed to solve all unknown variables according to the law of mass conservation at the melt free surface. The equilibrium relationships for c O ,   c C ,   c SiO ,   and   c CO at the melt free surface are given as follows:
c s i o = 101325 R T c o c s i e -   21000 T + 17 . 8
c c o = 101325 R T c o c s i c c c s i e -   5210 T + 14 . 6
c A r ( D S i O + μ t ρ A r S c t ) ( c s i o c A r ) + c A r ( D C O + μ t ρ A r S c t ) ( c c o c A r ) = c s i D O ( c o c s i )
c A r ( D C O + μ t ρ A r S c t ) ( c c o c A r ) = c s i D c ( c c c s i )
where c S i O is the molar concentration of SiO in the argon gas, c C O is the molar concentration of CO in the argon gas, c O is the molar concentration of O in the silicon melt, c C is the molar concentration of C in the silicon melt, and Rg is the universal gas constant, which is equal to 8.314 J/mol·K.
The SiO reacts with C at the surface of the hot graphite parts to generate CO. The reaction is assumed to be reversible and the Gibbs free energy of the reaction is expressed as follows [30]:
Δ G = { -   81300 + 3 . 02 T ,   T   <   1640   K -   22100   -   33 . 1 T ,   1640   K   <   T   <   1687   -   72100   -   3 . 44 T ,   T   >   1687   K K
The concentration relationship at the surface of the graphite parts is as follows:
C C O C S i O = K = e x p ( Δ G R T )
c A r ( D S i O + μ t ρ A r S c t ) ( c S i O c A r ) = c A r ( D C O + μ t ρ A r S c t ) ( c c o c A r )
The conversion relationship between the mass fraction and the molar concentration of impurities is as follows:
c i = Y i ρ M i
where Δ G is the Gibbs free energy of the reaction, K is the equilibrium constant of the chemical reaction,   and   M i is the atomic weight of the impurity species i.
The other surfaces are set with zero flux boundary condition and the concentrations of SiO and CO at the argon gas inlet and outlet are set to zero. The simulation results in our work are in good agreement with those in references [7,26].

3. Orthogonal Experimental Design

OED, or the Taguchi method, is a multi-factor experimental method based on the orthogonal array [32]. By selecting representative points that are uniformly distributed from the multi-factor tests allows these points to represent the overall situation, which can efficiently achieve the best combination in multi-factor experiments [33]. The Qouter, Qinner, and H were selected as the orthogonal design factors and each factor had three levels. These factors and levels were selected based on our extensive previous data. The schematic of each factor is indicated in Figure 2. The average concentration of O and the average concentration of C in the complete crystallized silicon ingots are taken as indexes, respectively. Moreover, the L9 (34) orthogonal table was selected for OED to evaluate the influence of various factors on the concentration of O and C during the casting of silicon. The table of the orthogonal design is shown in Table 2.

4. Results and Discussion

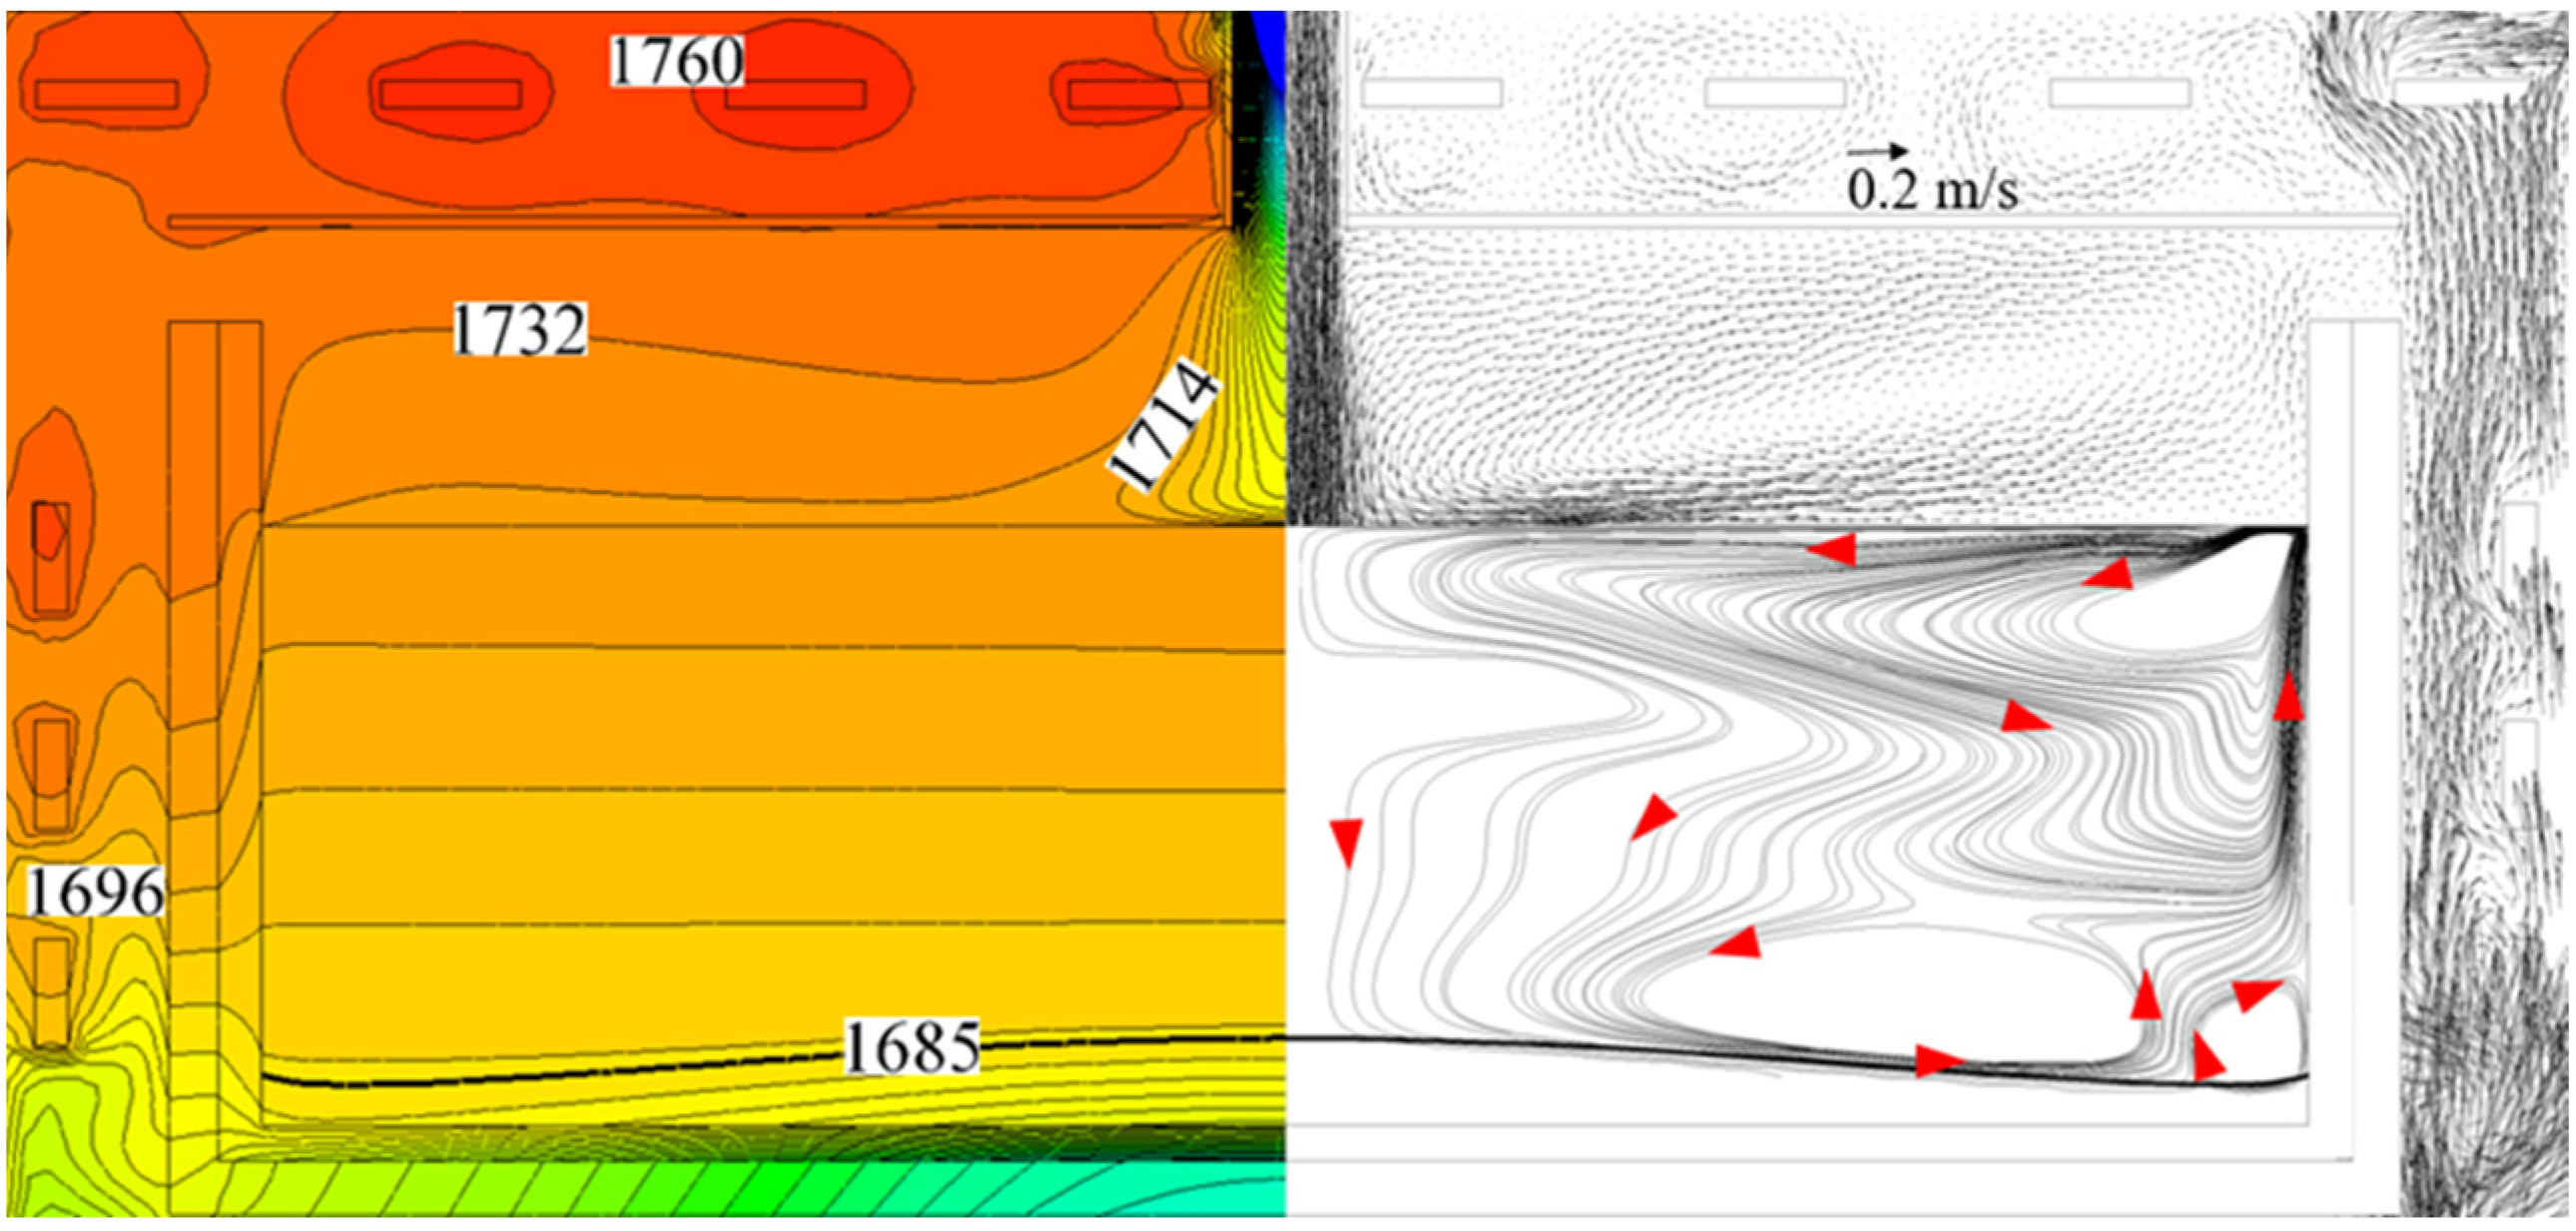
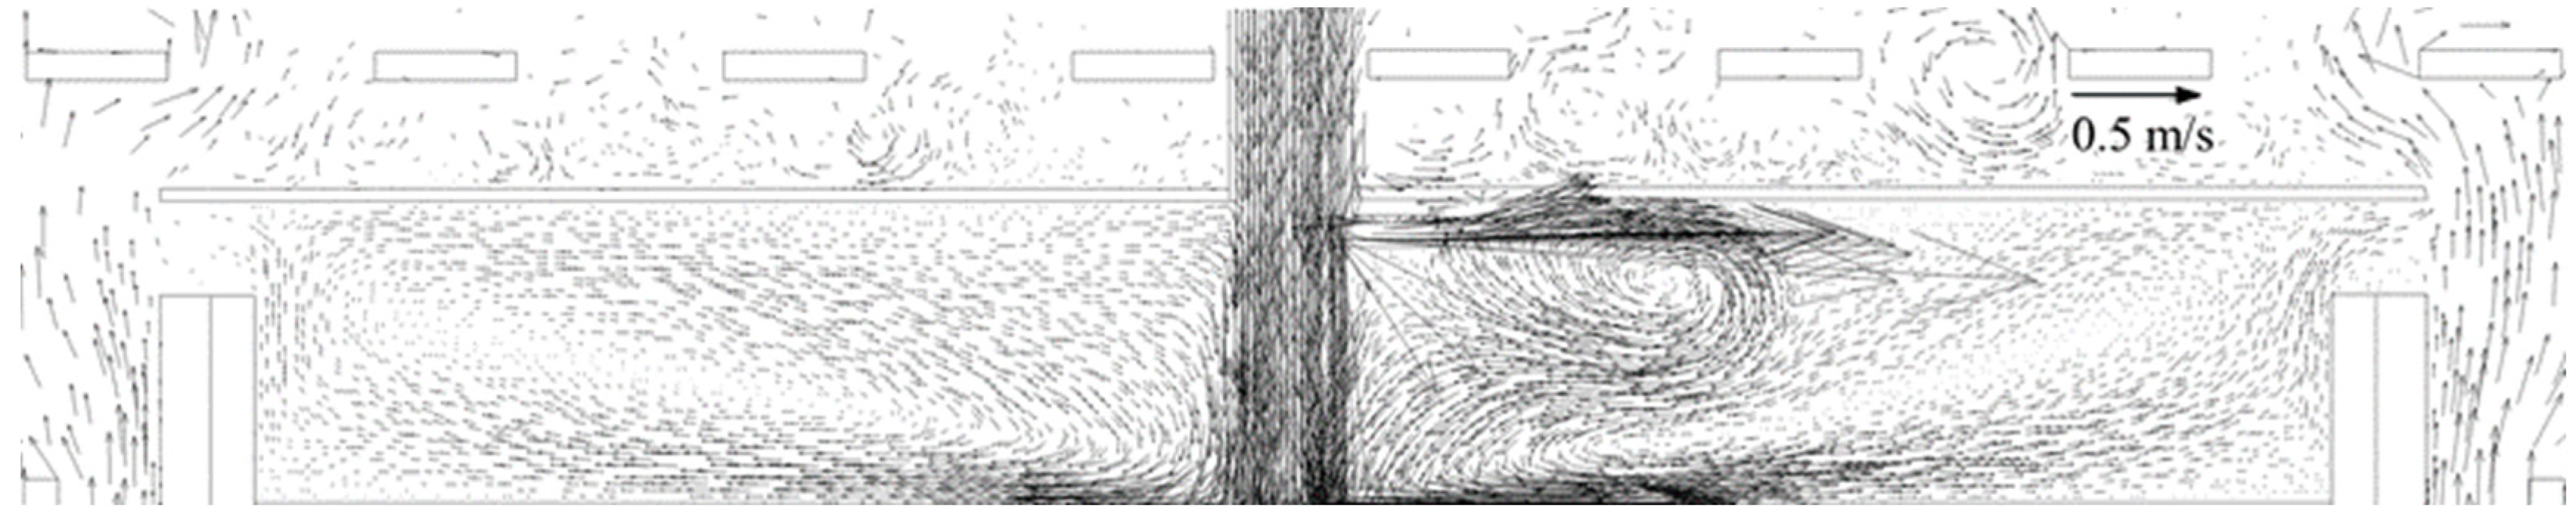
4.1. Heat Transfer and Fluid Flow in Large-Size Furnace

The flow pattern of silicon melt and argon gas significantly affects the distribution of impurities during the casting of silicon. Figure 3 shows the heat transfer and flow of argon and silicon melt in a conventional furnace. Argon gas is ejected from the argon tube above the free surface at a flow rate of 30 L·min−1 and then it sweeps along the free surface to the crucible. A part of the argon flows out of the crucible away from the silicon area, and another part forms a reflux, then flows back to the free surface along the cover. The flow of argon also changes the position of the isotherm above the free surface.

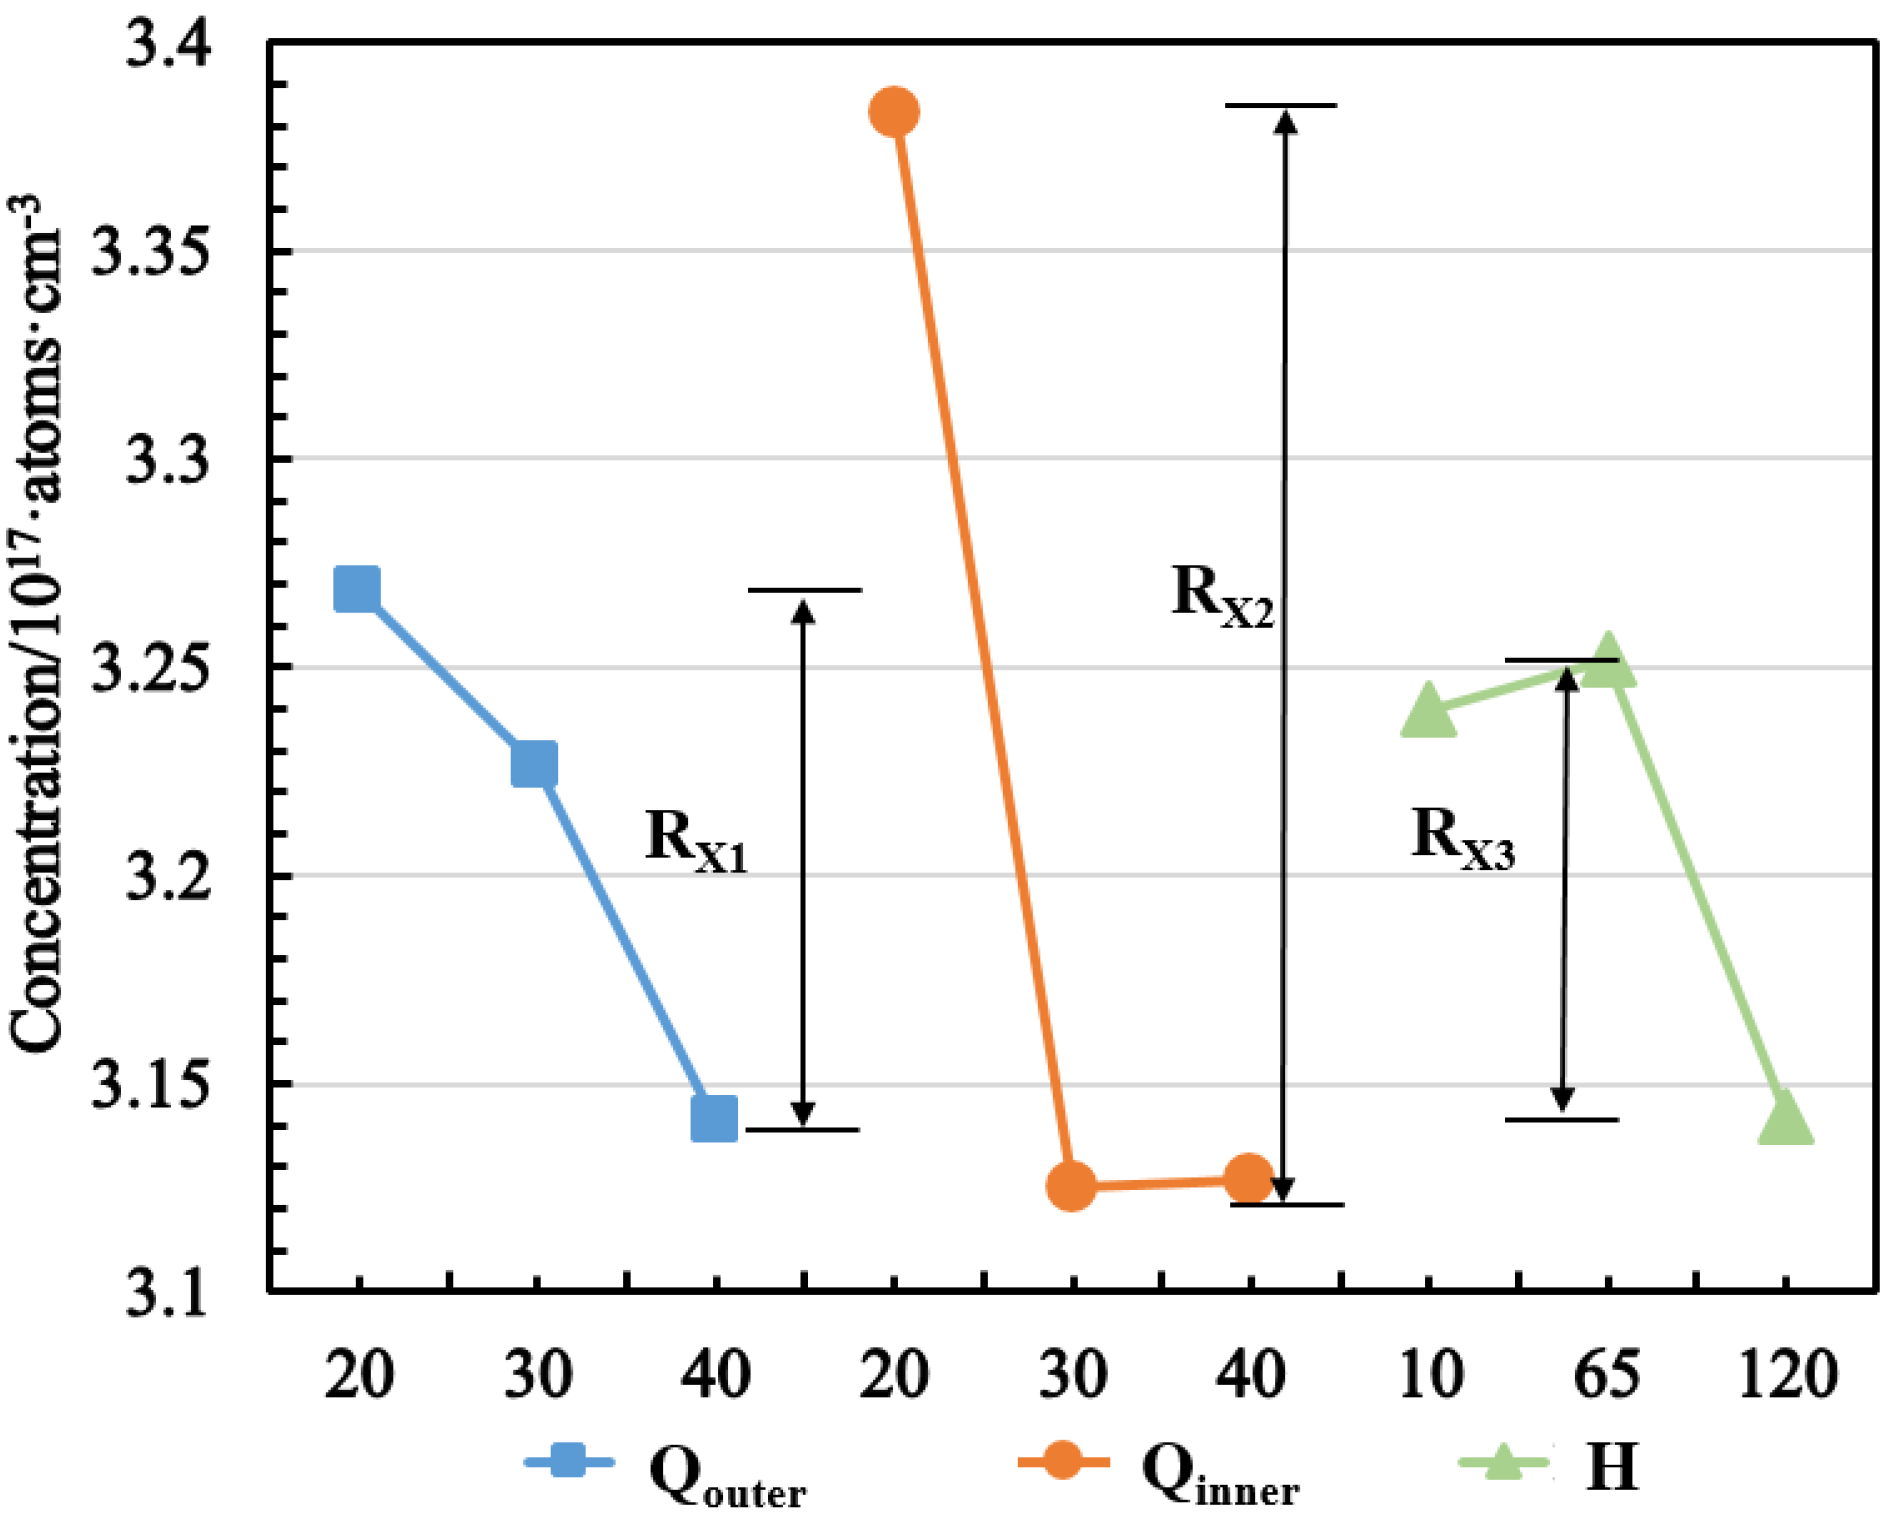
4.2. Orthogonal Experiment Analysis

To investigate the influence of the different levels on each factor, the average concentration of O (YO) and C (YC) in the completely crystallized silicon ingots were extracted as evaluation indexes, considering that the concentration of O and C in the silicon ingots is of more concern. According to the OED, nine representative calculations are required, and the configuration and results of each case are shown in Table 3.
Table 4 and Table 5 provide the evaluation indices of this orthogonal experiment, in which Z i ¯ (i = 1, 2, 3) and R are important parameters. Z i ¯ is defined as the average value of the impurity concentration at the i level of the corresponding factor Xj (j = 1, 2, 3). By comparing Z ¯ values, the optimal factor level can be obtained. The R value is an important analysis indicator and R is defined as the difference between the Z ¯ max and Z ¯ min values in the corresponding factor column, which indicates the fluctuation range of the R value. Therefore, the larger the R value, the more important this factor is [33,34].
Figure 4 and Figure 5 reflect the degree of influence on the evaluation indices when the levels of Qouter, Qinner, and H are changed. As can be seen from Figure 4, when the average concentration of O in a completely crystallized silicon ingot is the index, the relative degree of influence of each factor on it is RX2 > RX1 > RX3, that is, Qinner has the largest influence on the O concentration in this study followed by Qouter and H. This is because in the process of crystal growth, O atoms in the silicon melt continuously combine with silicon atoms to form SiO, which makes the free surface become the source of SiO. Compared with the argon flowing out of the outer tube, argon flowing out of the inner tube can directly reach the free surface of the melt under gravity, and its maximum velocity is at the bottom, so it can sweep the whole free surface and take away the evaporated SiO.
Qouter and H have little influence on the O concentration because even though the outer tube also provides a larger argon flow rate when H = 10 mm and H = 65 mm, its maximum flow rate is in the horizontal direction and the outflow position is relatively far from the free surface. Therefore, the effect of decreasing the O concentration is small. When H = 120 mm, the outflow of the outer tube is relatively close to the free surface, which makes the average concentration of O at this distance relatively low. When Qinner = 20 L·min−1, the vertical flow rate is small and the SiO on the free surface cannot be taken away quickly and forcefully, thus inhibiting the evaporation rate of SiO on the free surface, resulting in a higher O concentration in the silicon ingots. However, when Qinner increases to 40 L·min−1, the concentration of O actually increases. This is because the argon backflow gradually increases with the increase of Qinner. On the one hand, more SiO is brought back to the melt’s free surface. On the other hand, more CO is transported to the free surface, thereby increasing the O concentration in the silicon ingots. Therefore, for the lowest average concentration of O as the best index, the optimal scheme is Qouter = 40 L·min−1, Qinner = 30 L·min−1, and H = 120 mm.
As can be seen from Figure 5, when the average concentration of C in a completely crystallized silicon ingot is the index, the relative degree of influence of each factor on it is RX3 > RX1 > RX2, that is, the factor H has the largest influence on the O concentration in this study, followed by Qouter, and the degree of influence of Qinner is the smallest. During the casting of silicon, the SiO on the free surface is transported to the cover under the backflow of argon gas. The cover is made of graphite material and reacts with SiO to generate CO gas at high temperature. Therefore, the graphite cover is one of the sources of C impurity. When H is small, the outer tube outlet is close to the wall of the cover. On the one hand, the argon gas ejected from the side of the outer tube outlet continuously sweeps the wall of the nearby cover, and this part of the argon gas does not contain SiO, so there is no chemical reaction with the graphite cover in the area flushed by this part of argon, thereby reducing the contact area between SiO and the cover. On the other hand, the backflow of argon gas carries SiO to the center along the wall of the cover, and the side outflow close to the cover is opposite to the backflow direction of the argon gas containing SiO. Thus, the backflow of argon gas can be suppressed, and the probability of contact between the SiO in the backflow and the cover is reduced, which can suppress the generation of CO, thereby decreasing the C concentration in the melt. However, when H increases, the outer tube outlet gradually moves away from the wall of the cover, and the pure argon flowing out from the side can no longer sweep the cover strongly. Moreover, due to the change of the height of the side outflow, the inhibition effect on the argon backflow carrying SiO is no longer significant, and the reaction area between SiO and the graphite cover is larger, thus increasing the C concentration of the silicon melt. Therefore, H determines whether the argon gas flowing out of the outer tube can affect the chemical reaction at the cover. When H = 10 mm, it is the closest to the cover, and the side outflow can directly suppress part of the SiO from reaching the cover, thus avoiding the reaction between SiO and the cover. The larger the Qouter, the more significant the inhibition effect is to lower the C concentration in the silicon ingot. When H = 65 mm and H = 120 mm, the distance between the outer tube outlet and the cover is relatively far, and the generation of CO cannot be suppressed. It can be seen from the analysis in the previous section that increasing Qinner makes more SiO be transported to the cover by convection and diffusion, and generates more CO. So, the smaller the Qinner, the lower the average concentration of C in the silicon ingots. Therefore, for the lowest average concentration of C as the best index, the optimal scheme is Qouter = 40 L·min−1, Qinner = 20 L·min−1, and H = 10 mm.
O and C concentrations are both important indicators. For both O and C, the lowest average concentration of O and C in silicon ingot is obtained when Qouter = 40 L·min−1. When Qinner = 30 L·min−1, the average concentration of O is the lowest. The factor H has the least influence on the O, while the influence on C is very significant. According to the comprehensive evaluation of the average concentration of O and C in the silicon ingots, the best scheme of OED can be determined as Qouter = 40 L·min−1, Qinner = 30 L·min−1, and H = 10 mm.

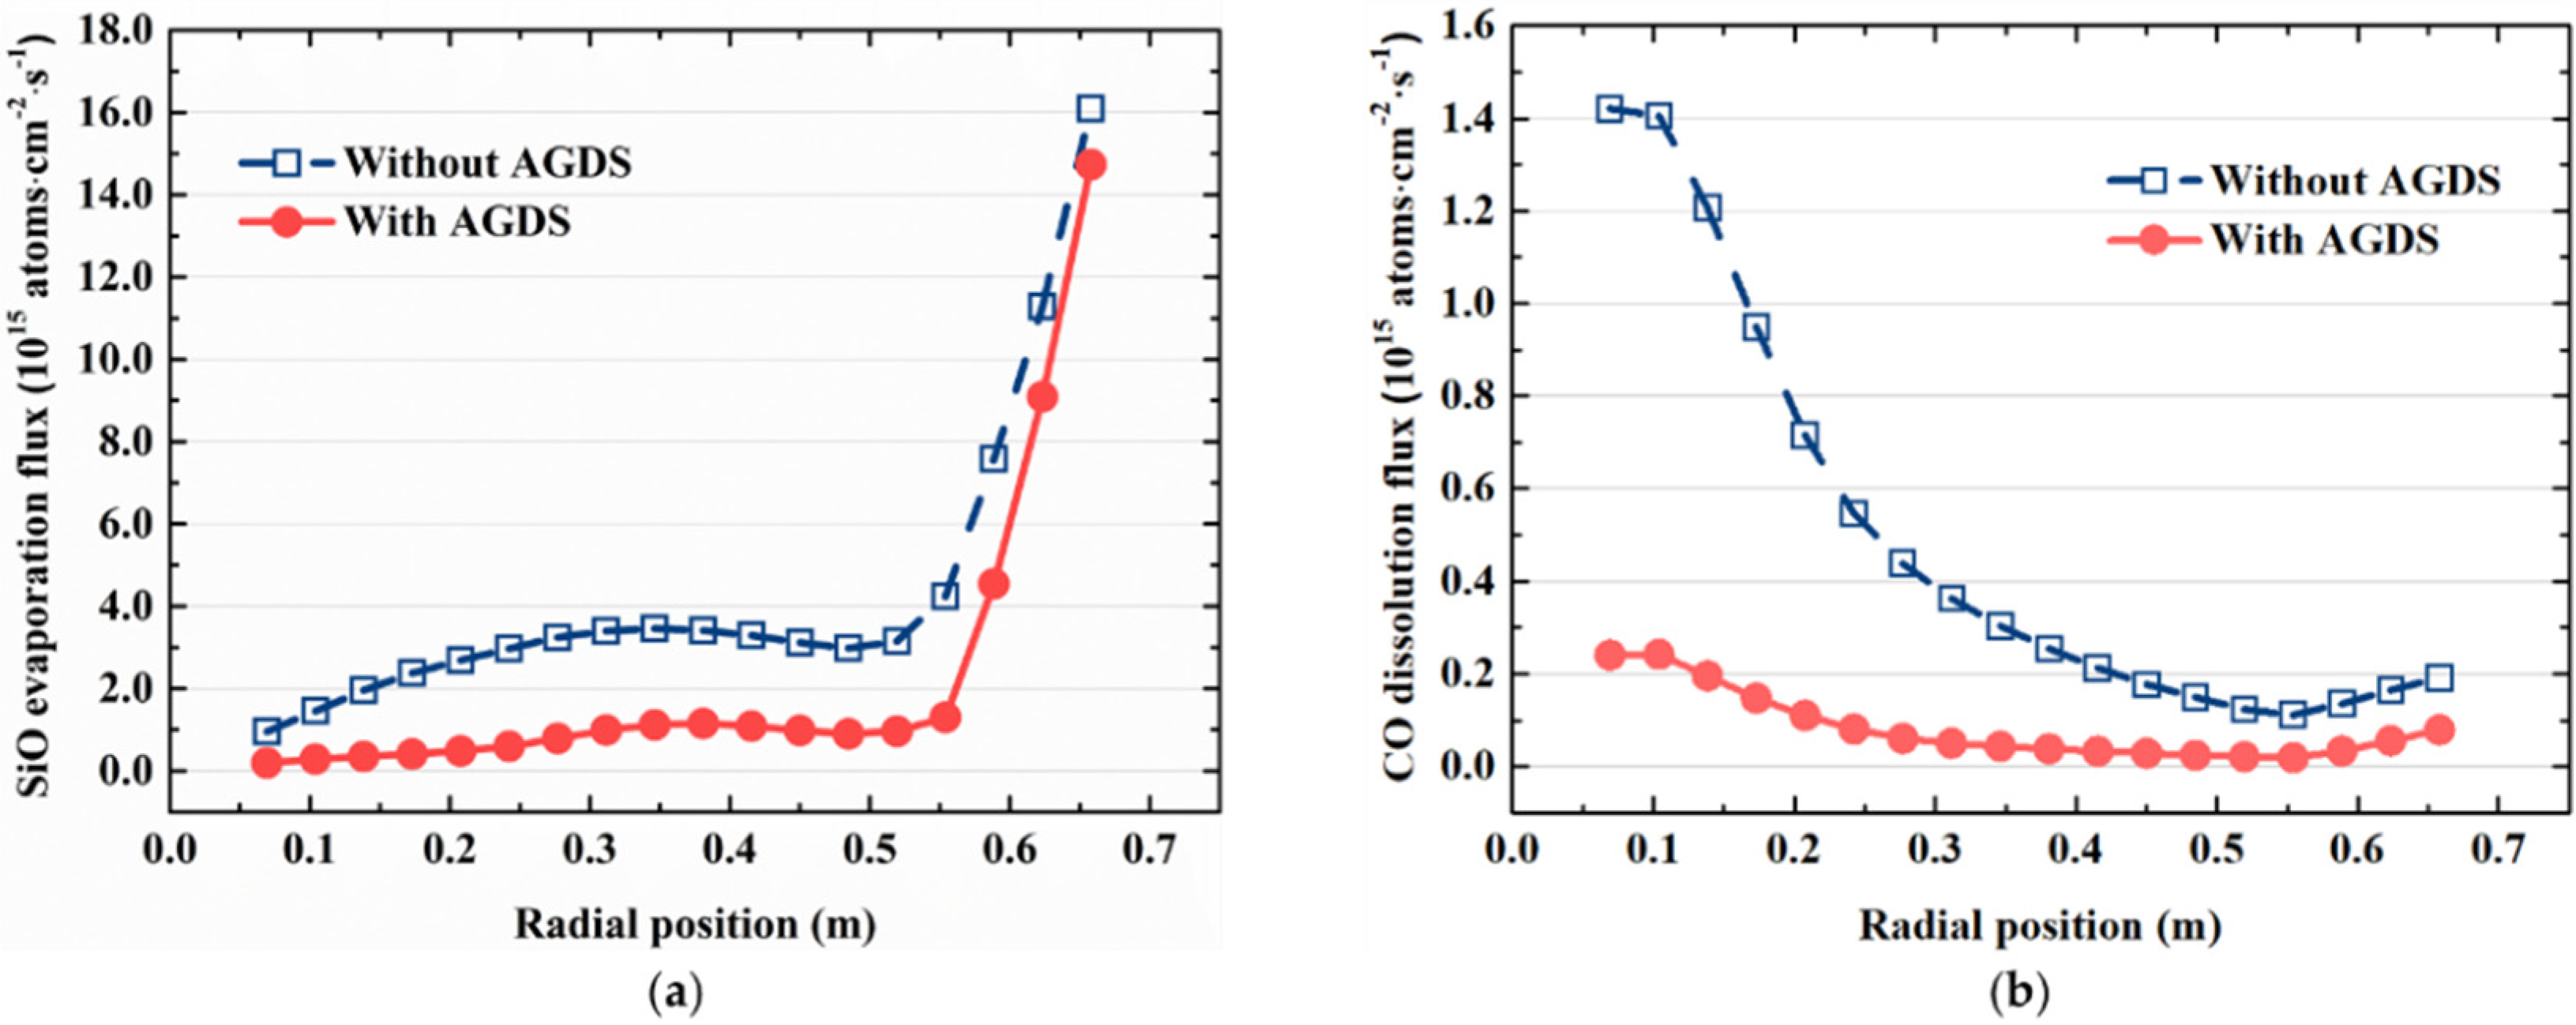
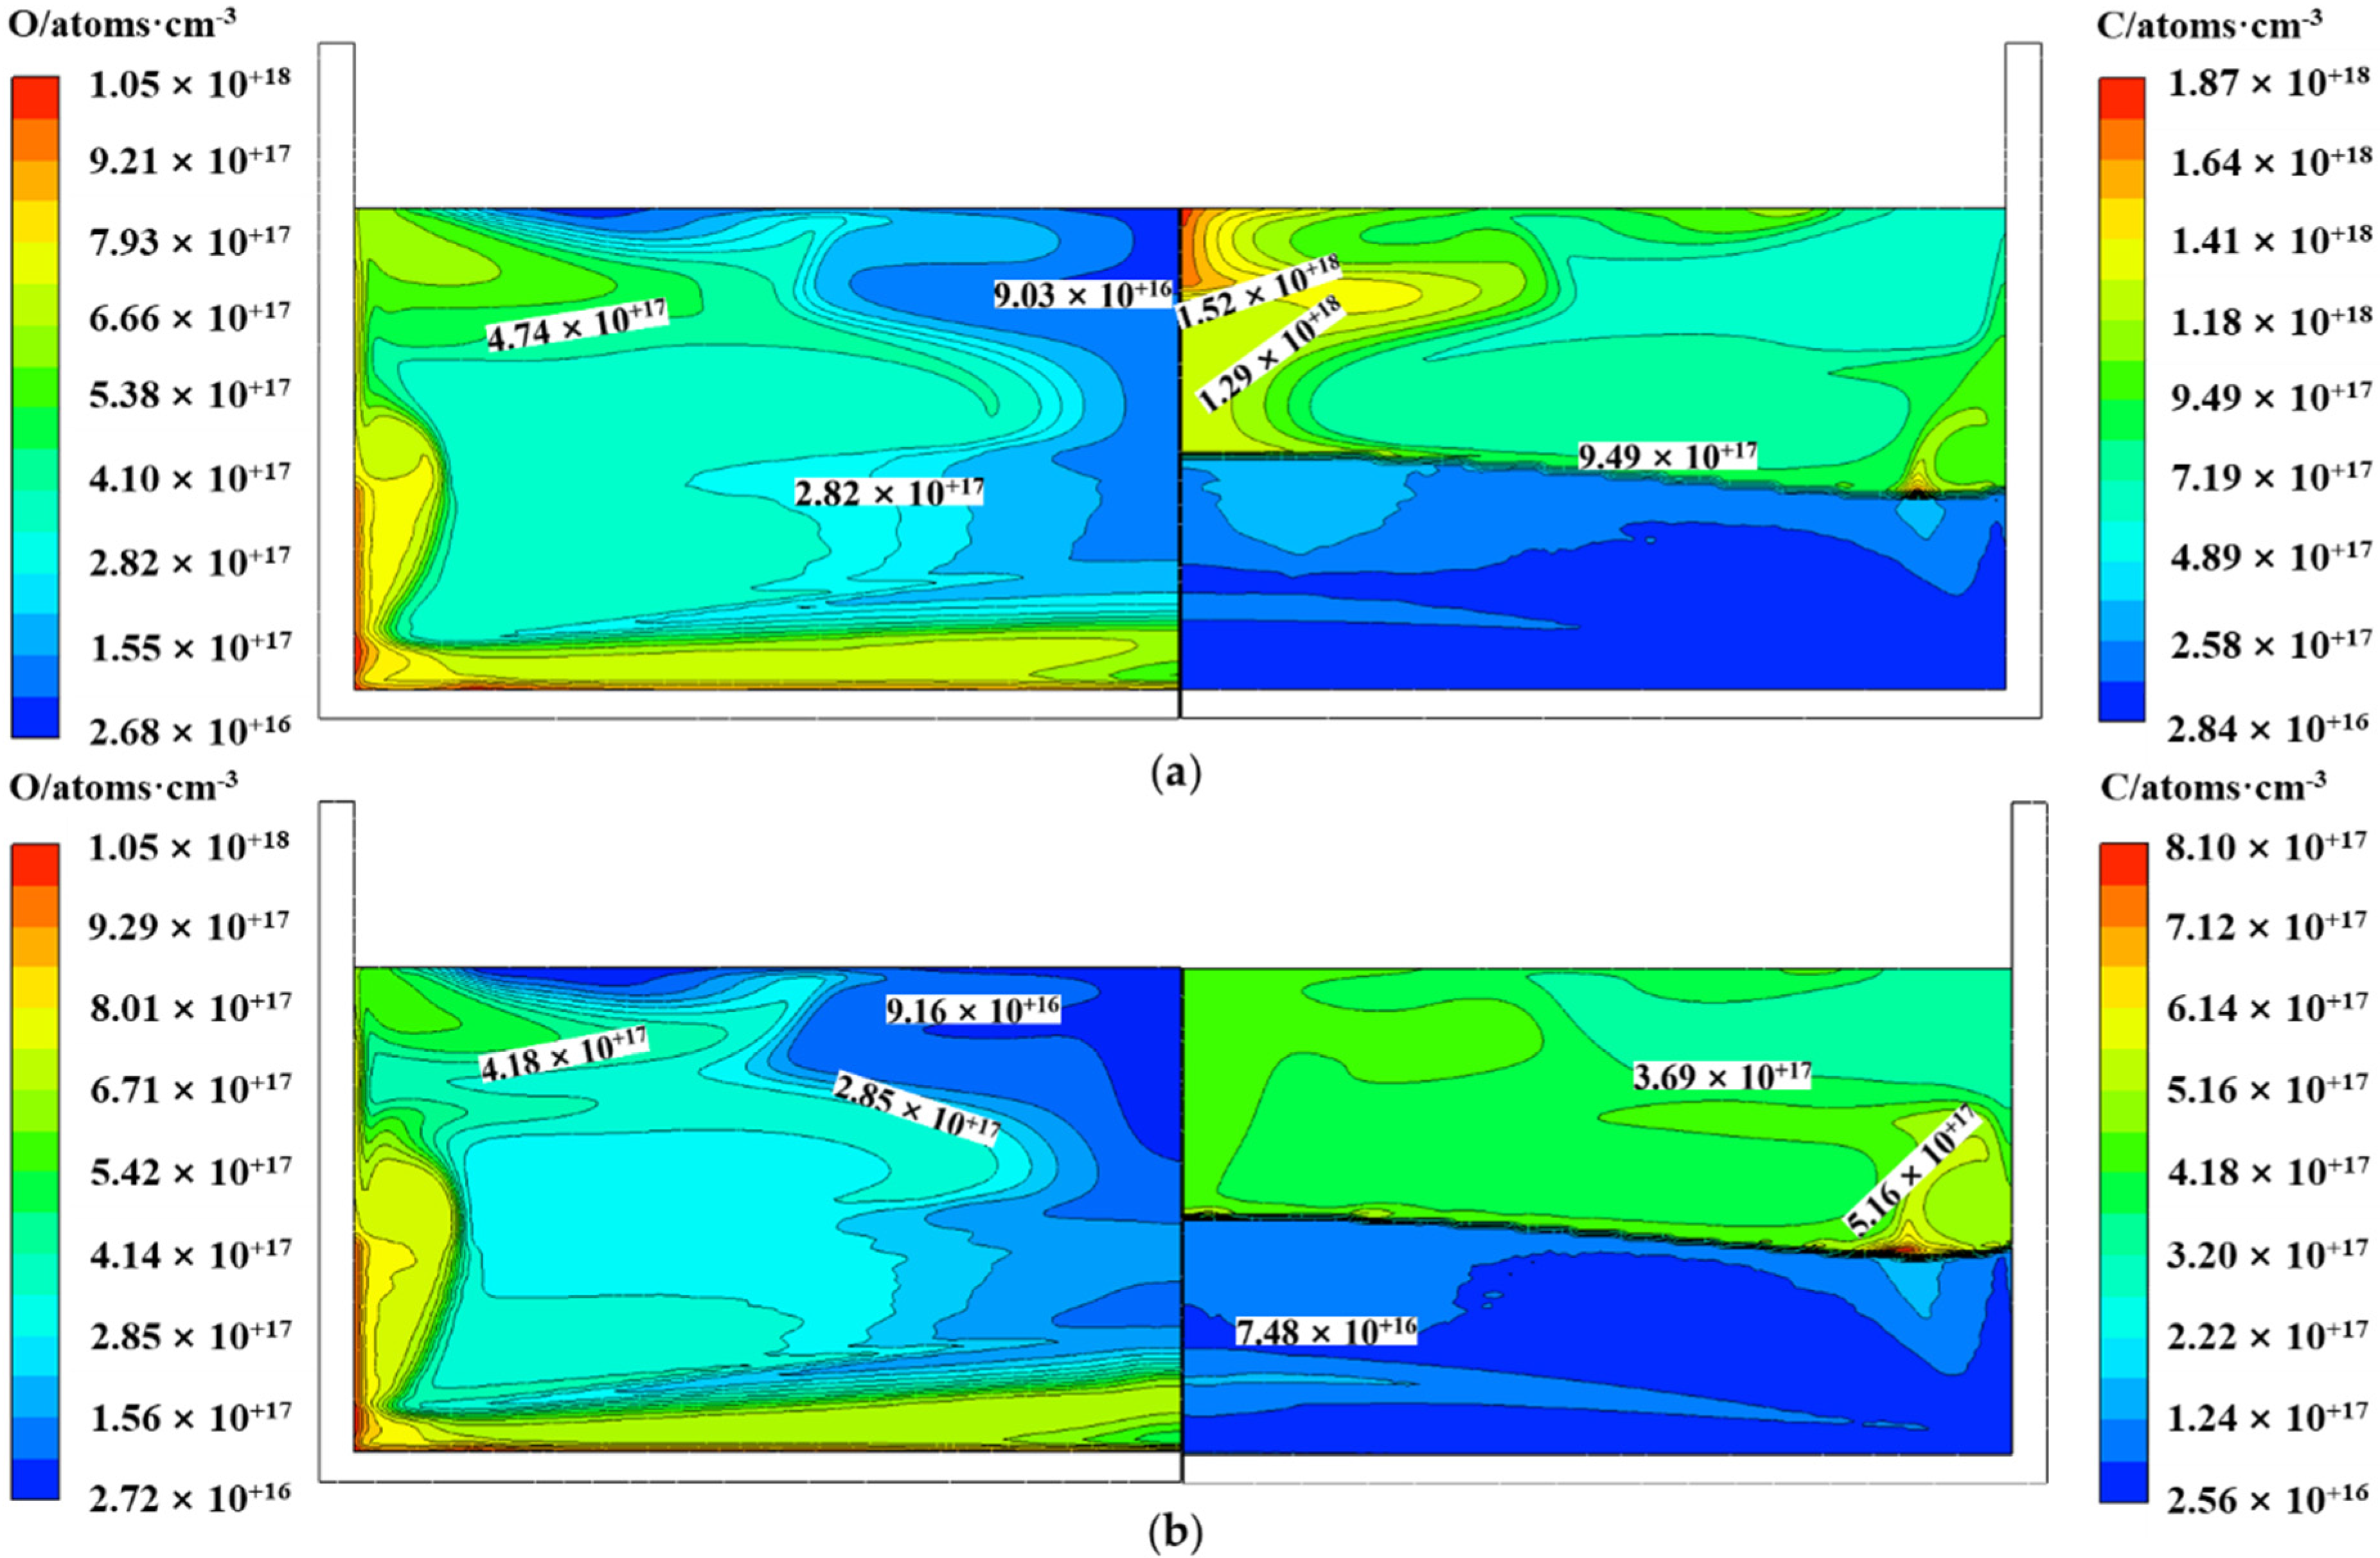
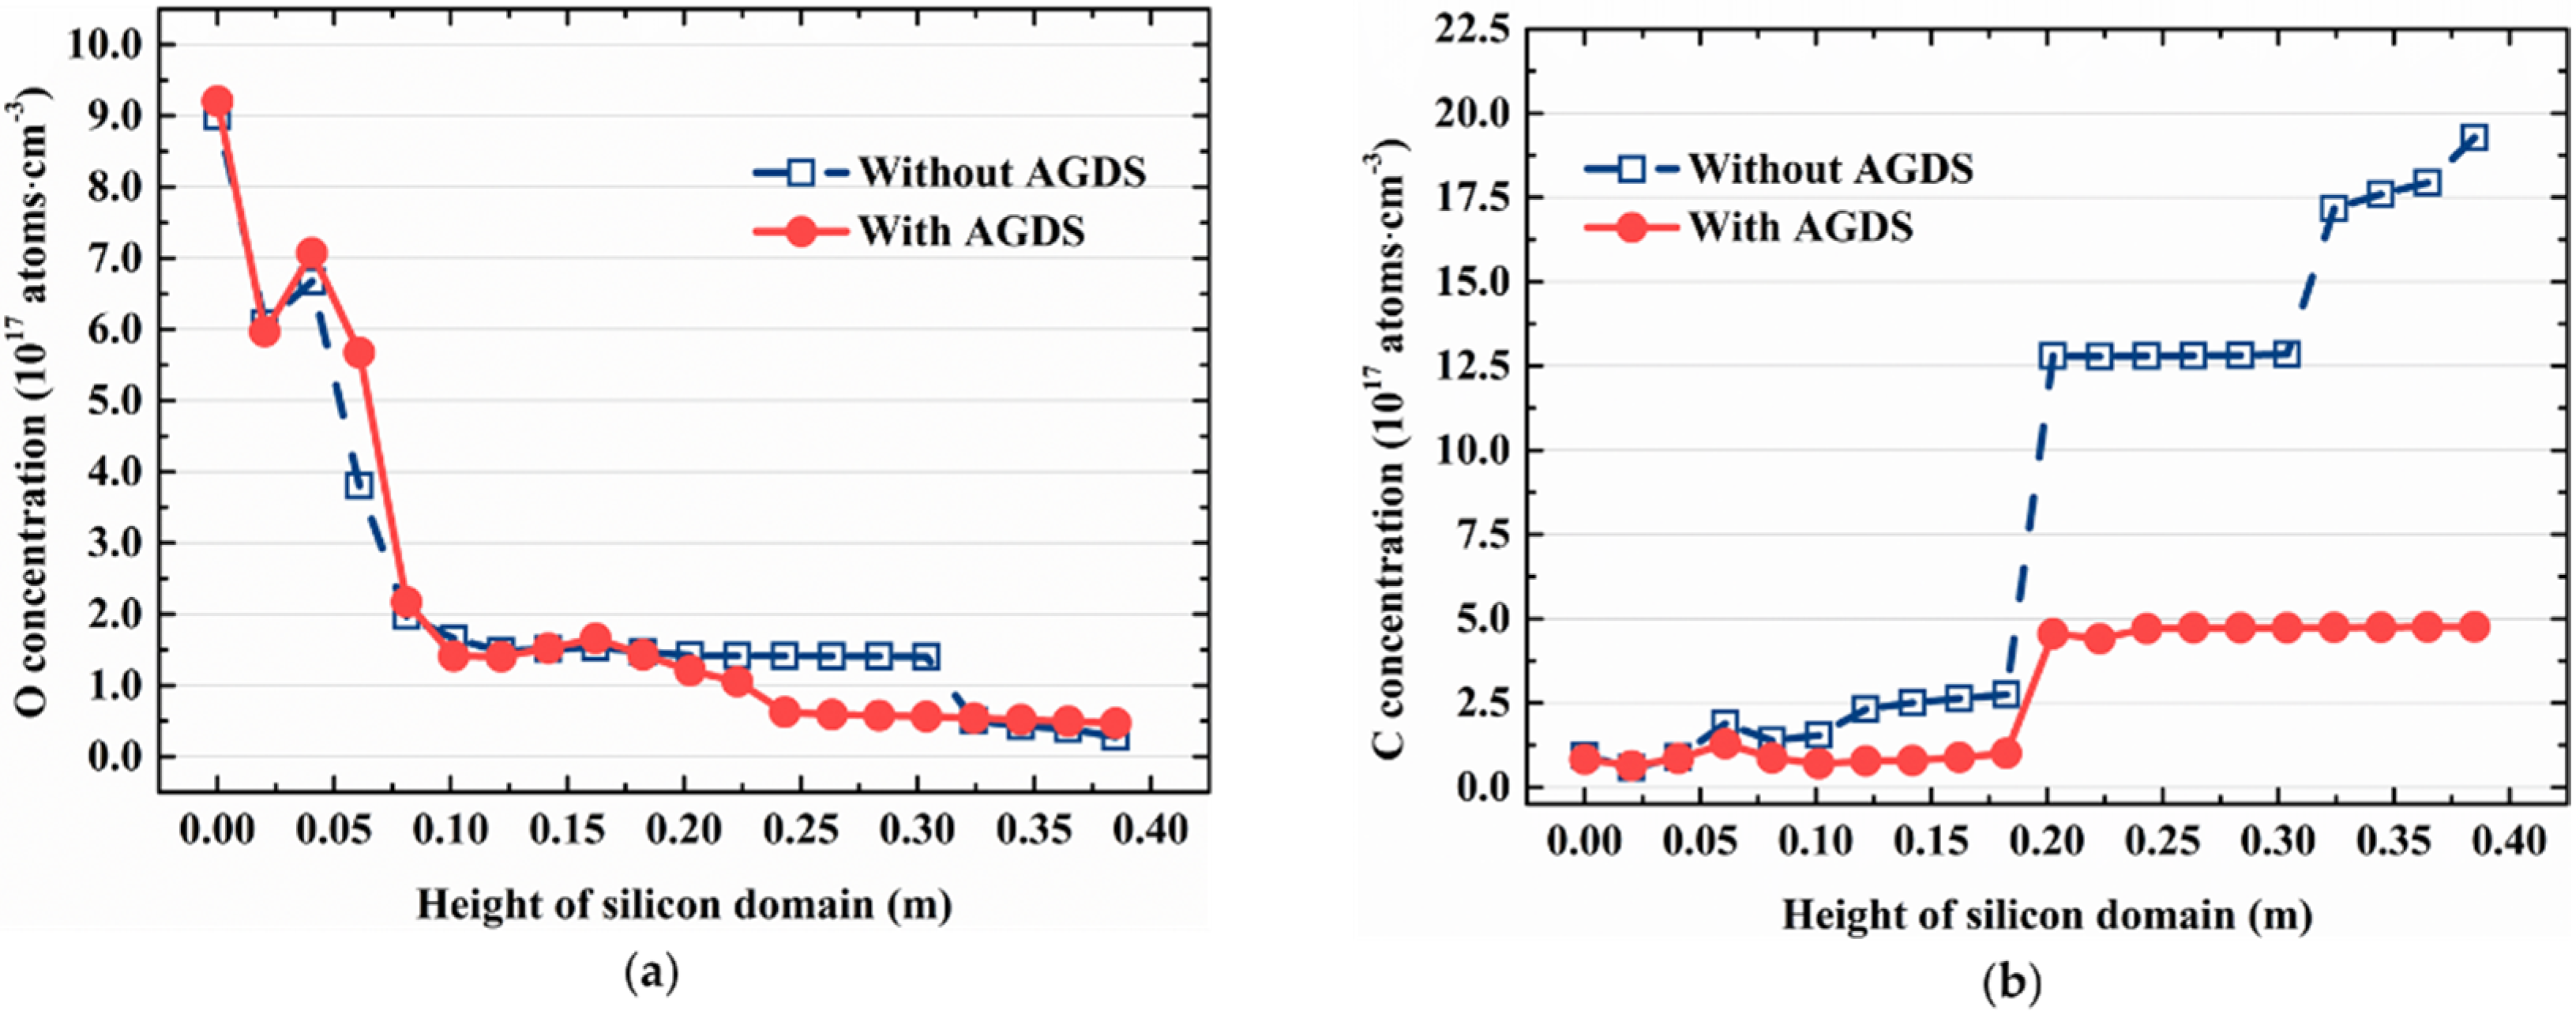
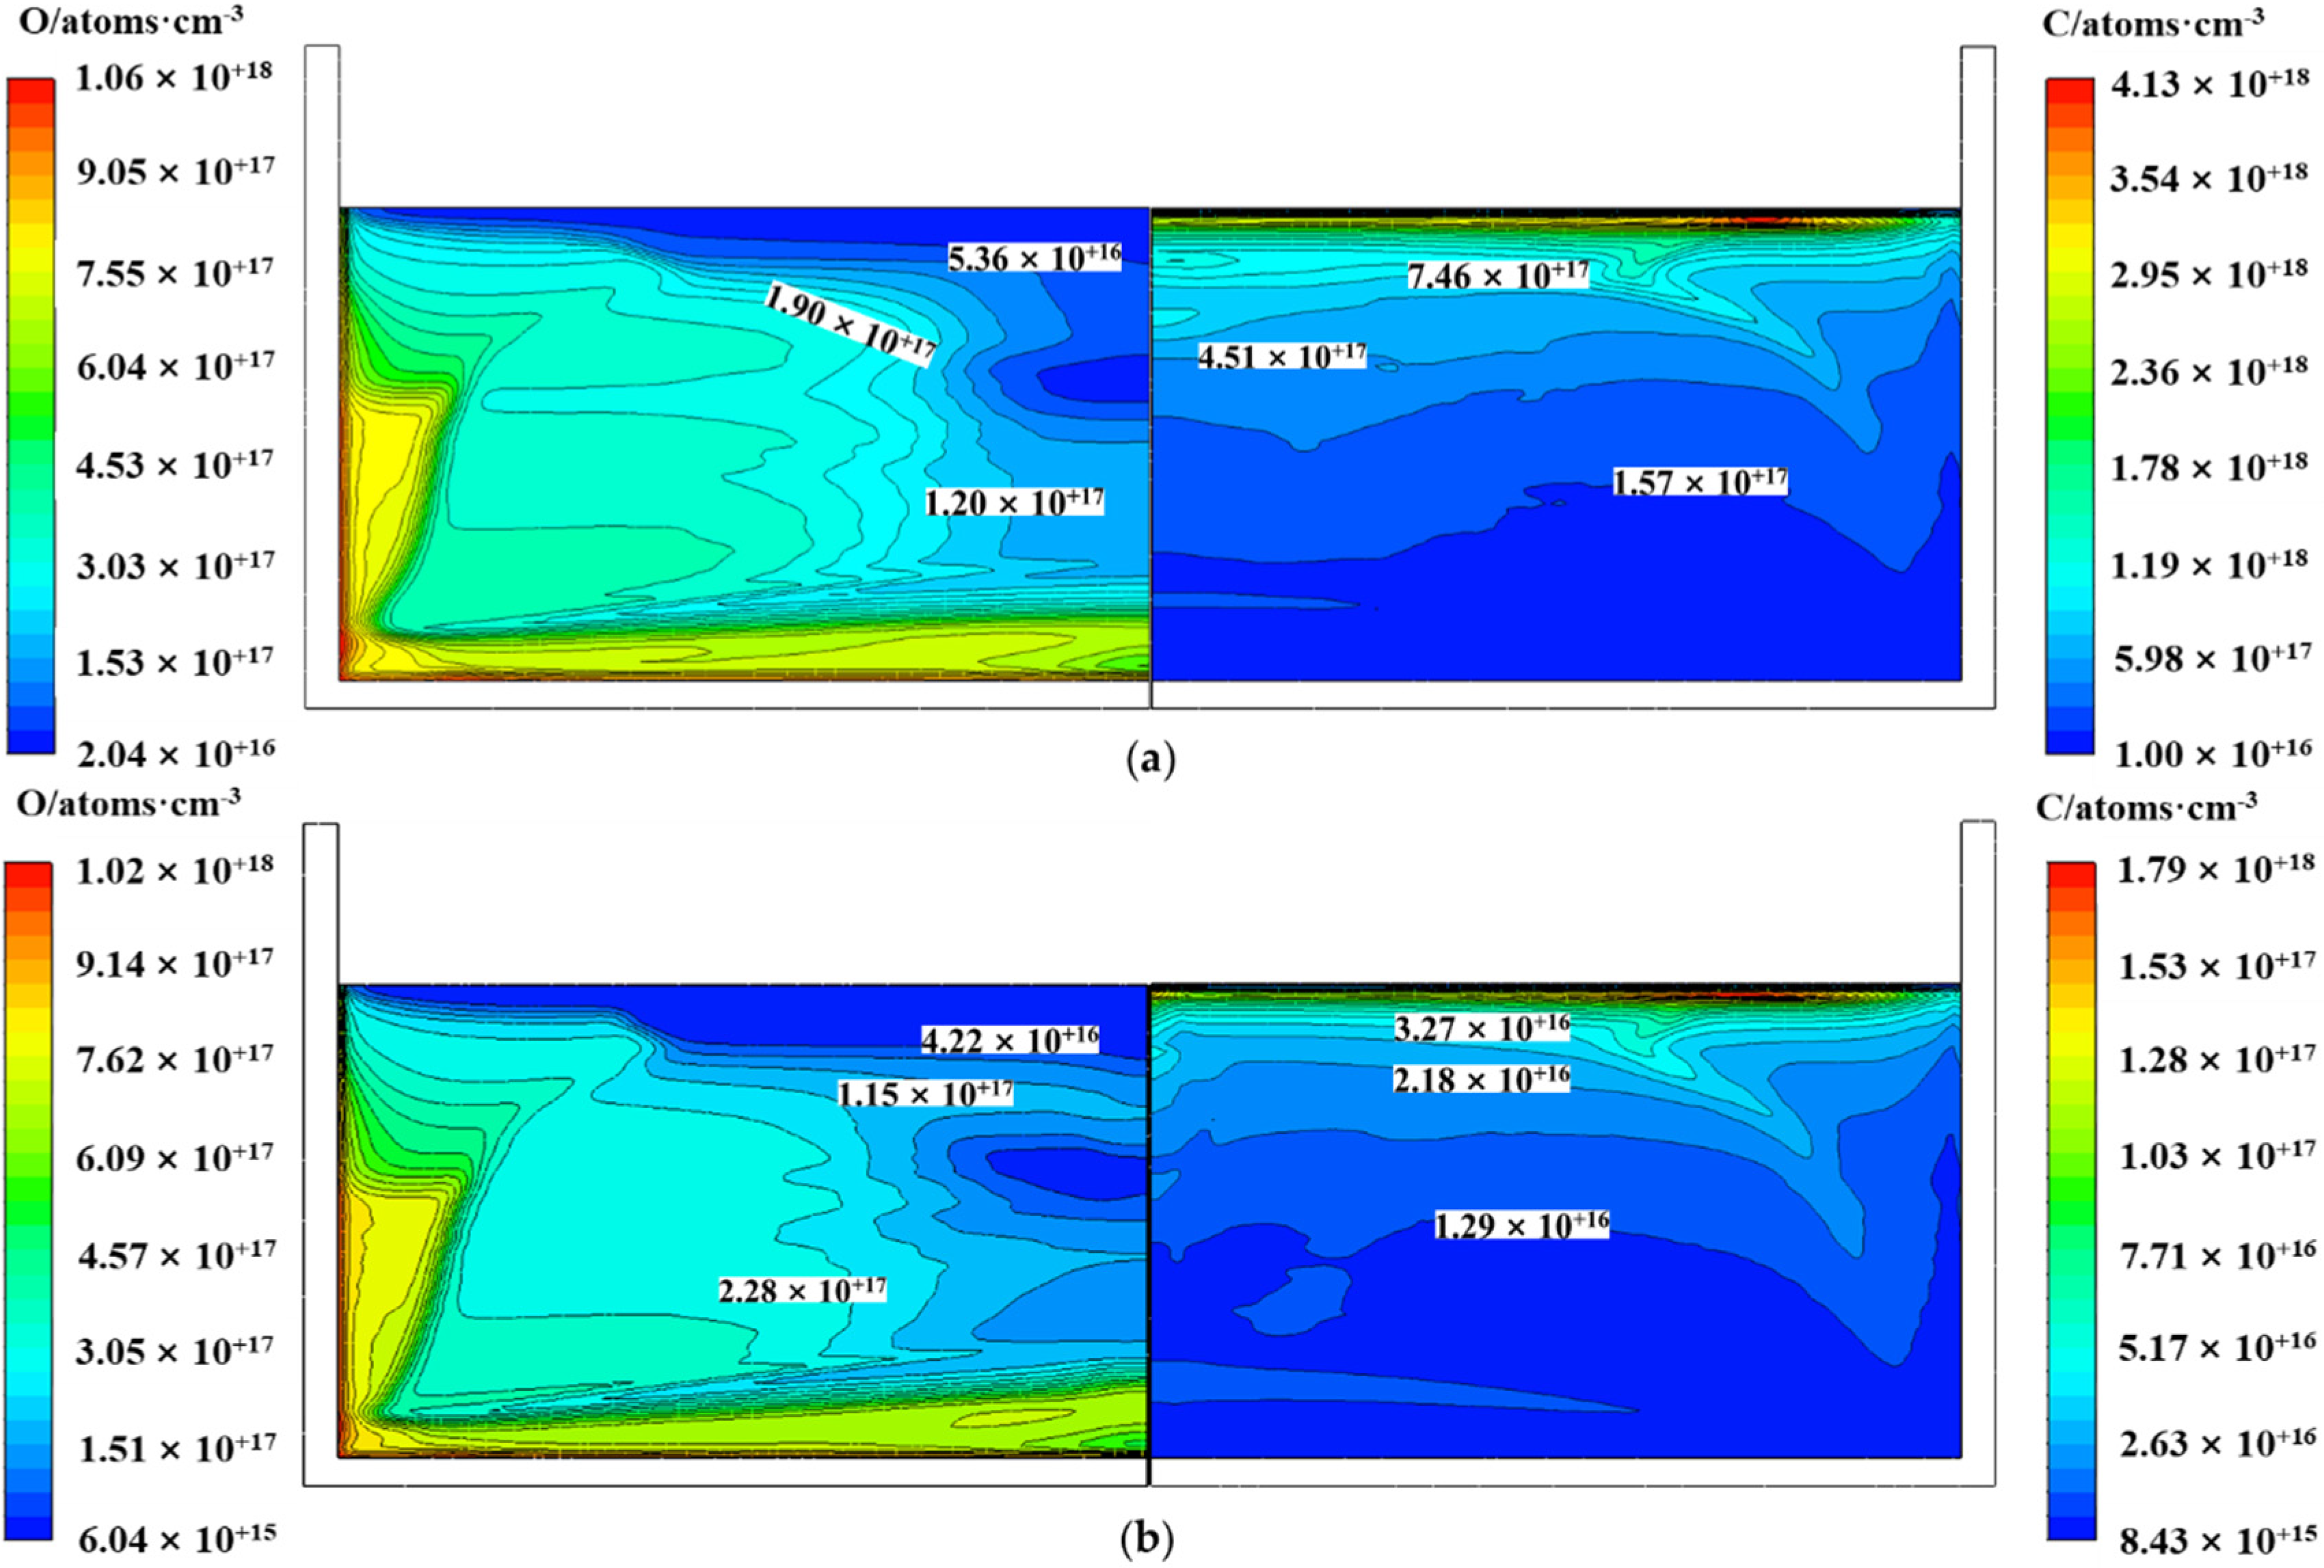
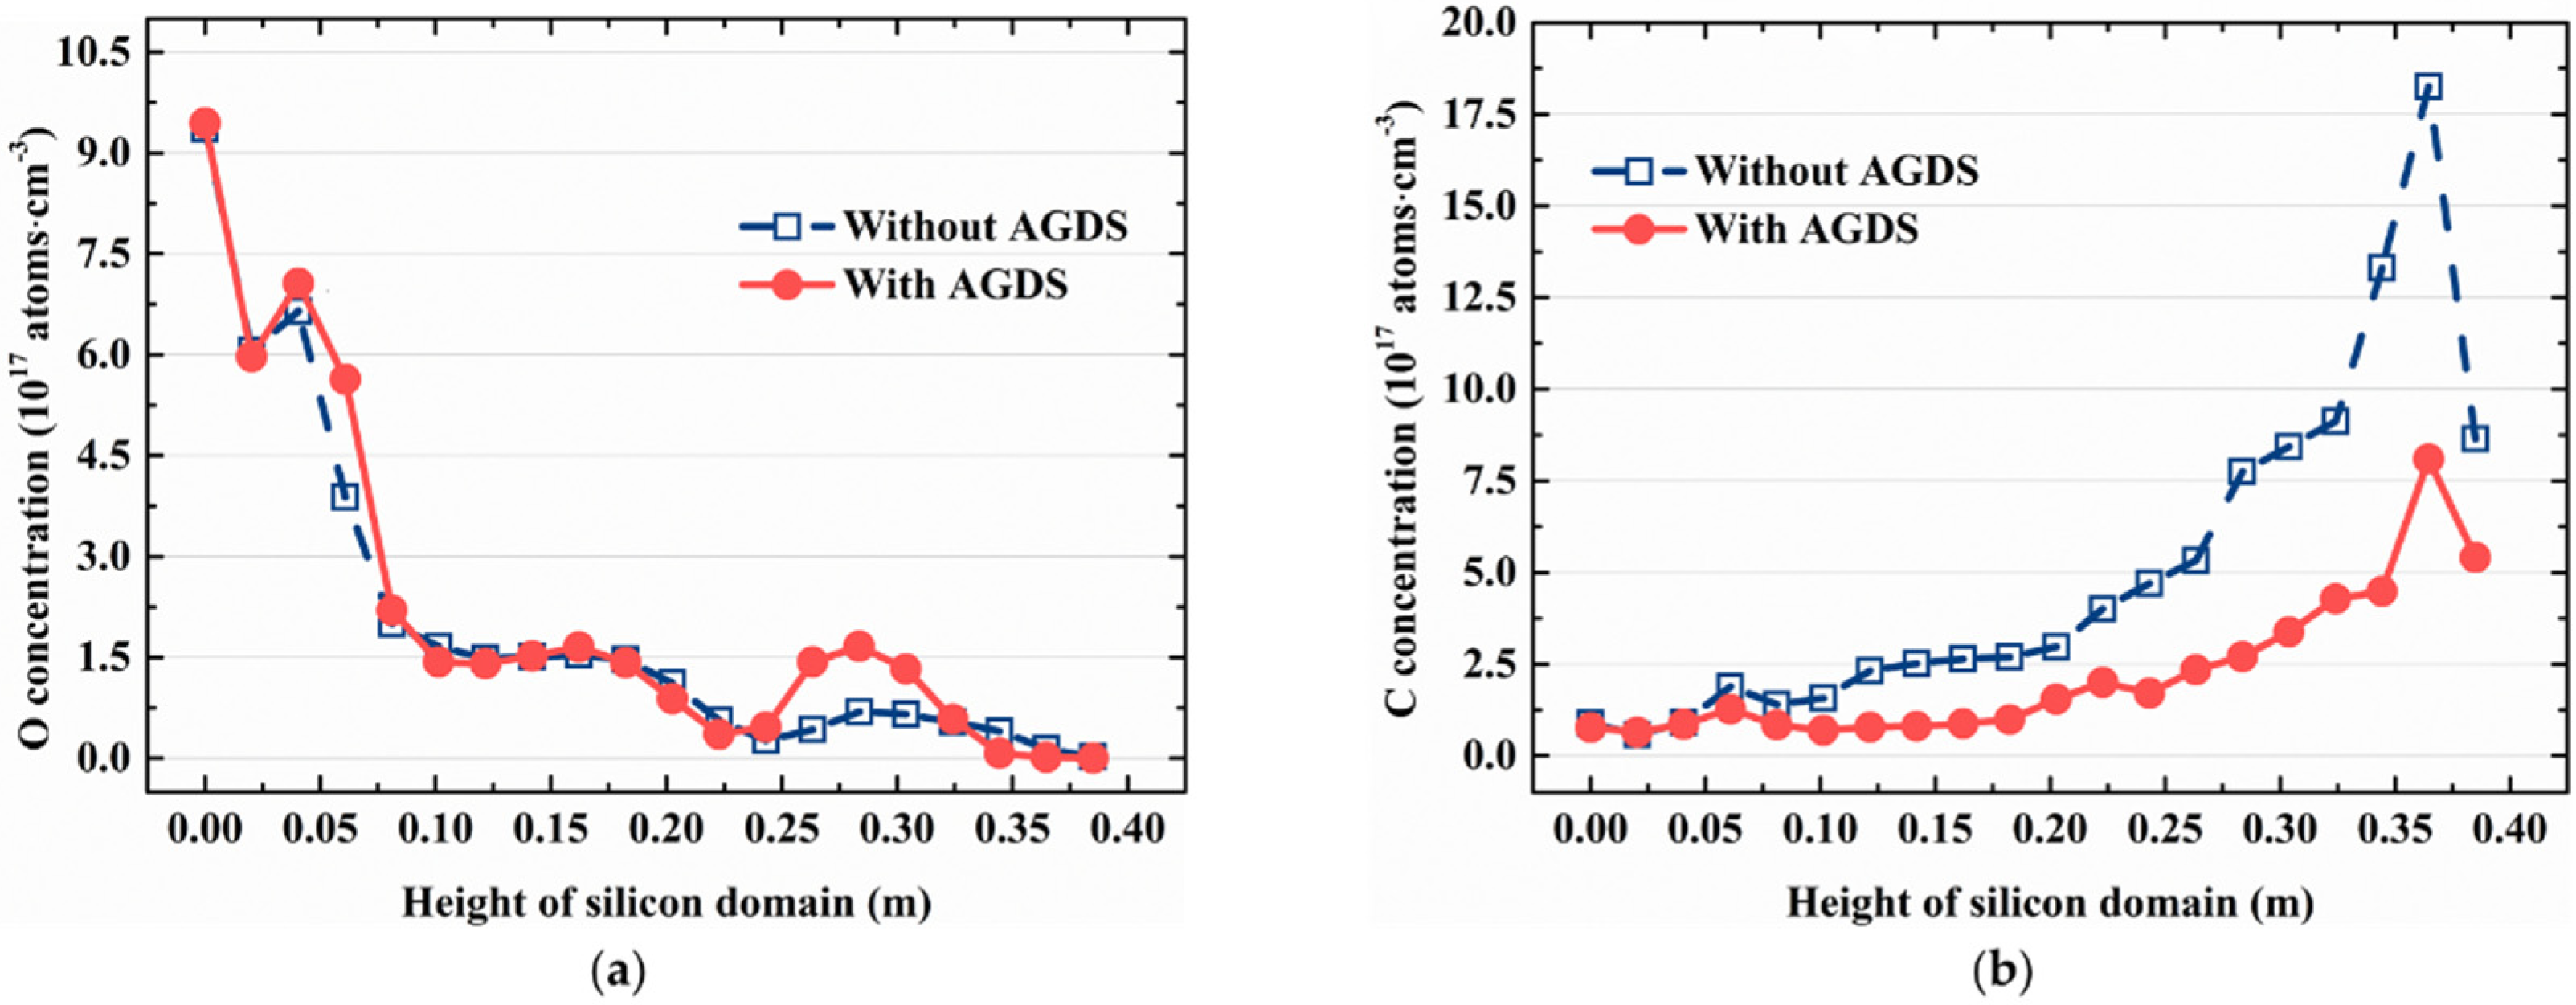
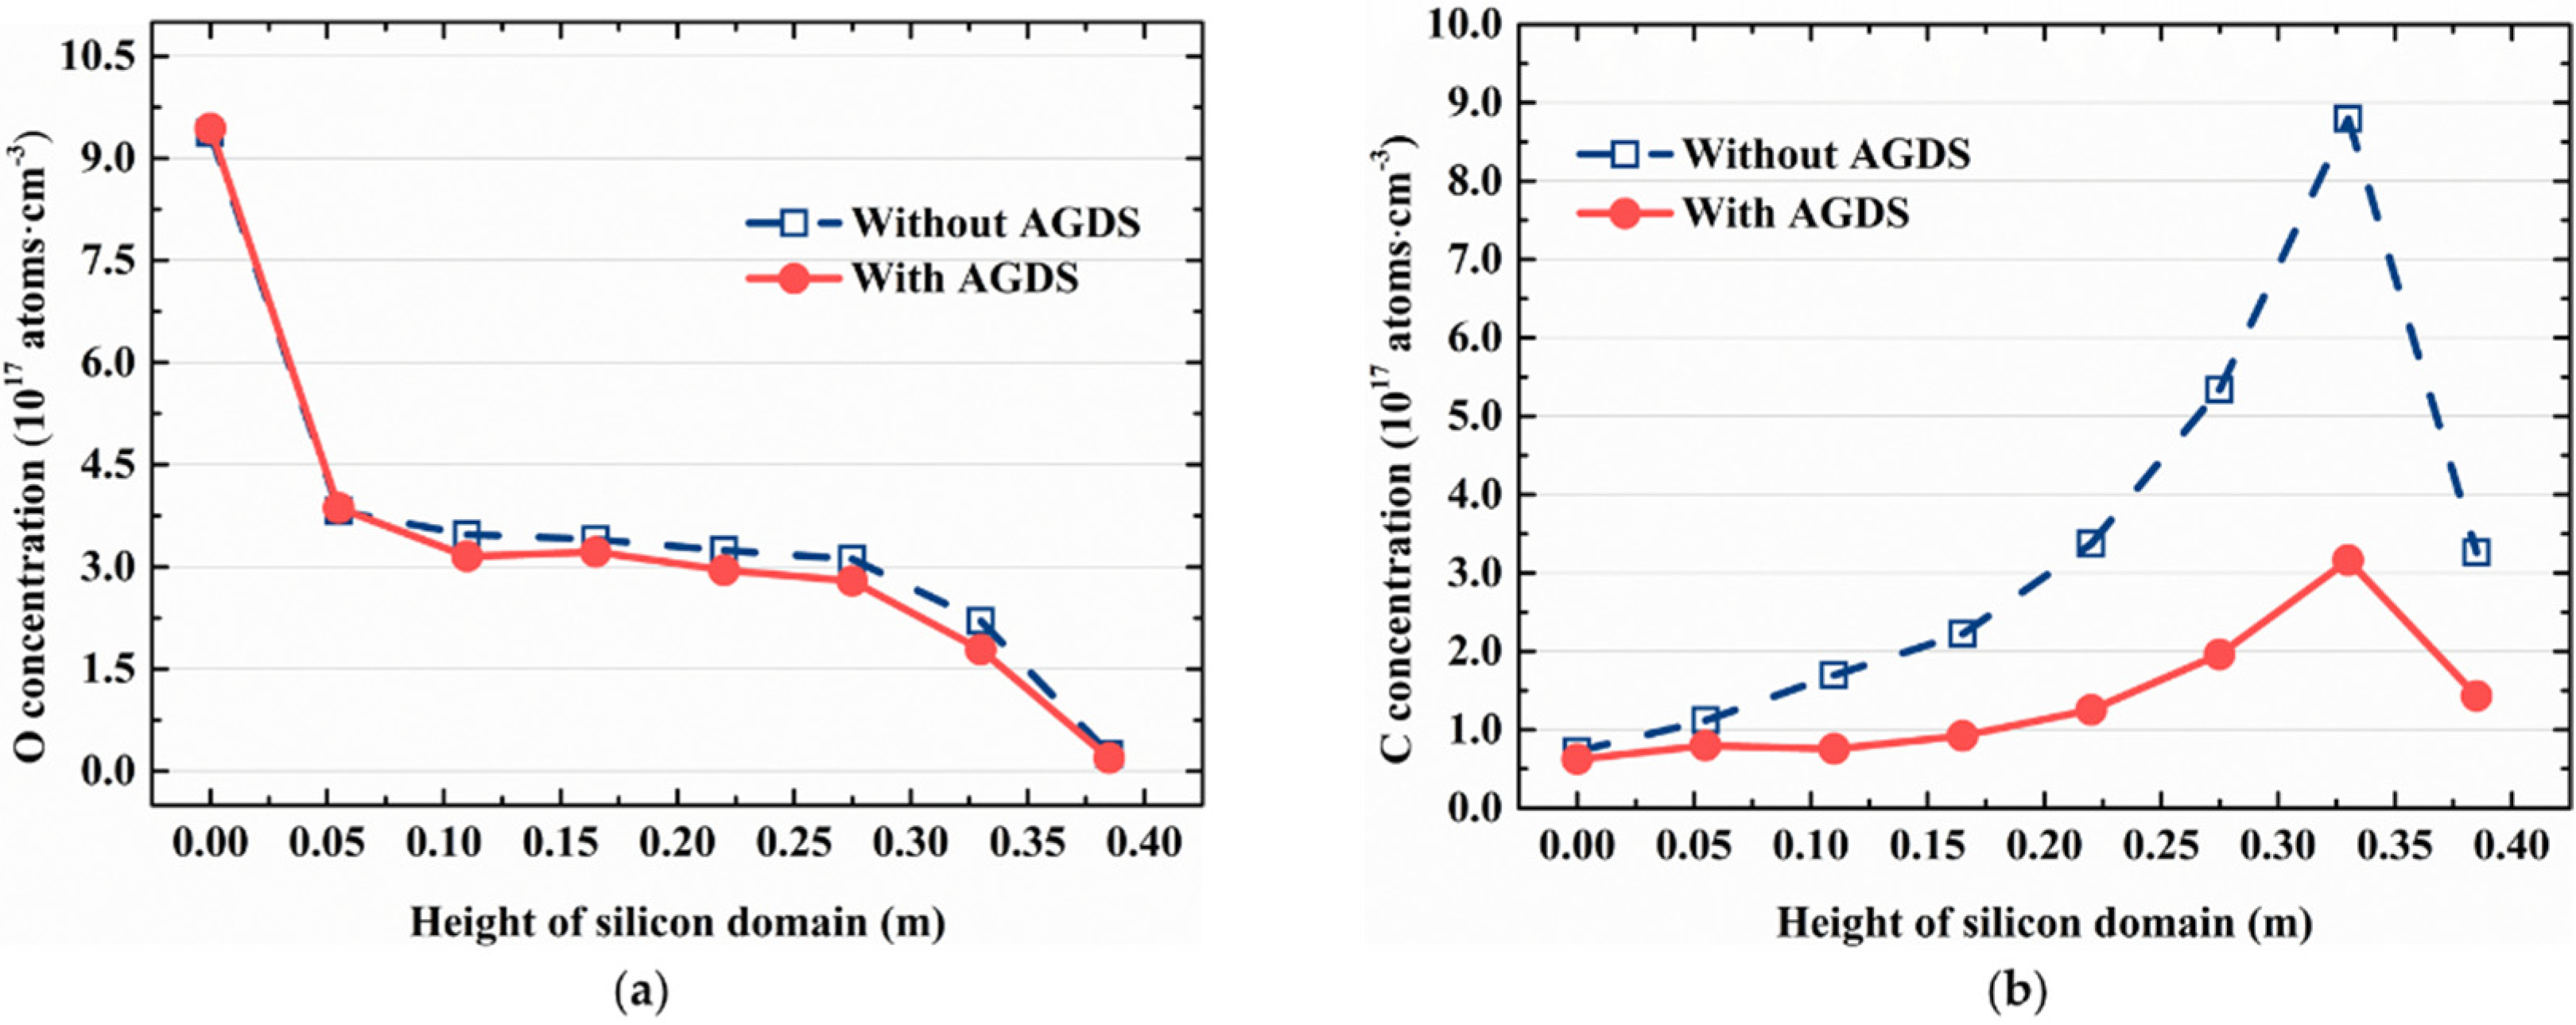
4.3. The Influence on O and C with and without the Optimized AGDS

By analyzing the statistical data of the orthogonal experiment, the optimum combination of AGDS parameters is obtained. In addition, to further study the decrease effect of optimized AGDS on O and C during the casting of silicon, we compared the influence of O and C in different crystalline stages with and without the optimized AGDS in the furnace. Figure 6 compares the argon flow above the free surface of the melt with or without a AGDS at the 50% crystalline fraction. As can be seen from the figure, there is a large vortex in the argon region above the free surface without the AGDS. There are two vortexes above the free surface when the AGDS is configured. When the side outflow of the outer tube sweeps the cover, a new vortex cell is formed under the combined influence of gravity and the backflow caused by the outflow of the inner tube. The large vortex exists for the same reason as the original structure.
Figure 7 shows the concentration distributions of SiO and CO above the free surface at 50% crystalline fraction with and without the AGDS. Figure 8 presents the evaporation flux of SiO and the dissolution flux of CO at this stage. It can be found that the convection and diffusion of SiO above the free surface are significantly suppressed because of the outflow of the outer tube, and the evaporation flux of SiO above the free surface is decreased. Because less SiO reaches the cover, the production of CO is decreased. At the same time, the continuous flow of the outer tube also obviously suppressed the chemical reaction at the cover, thus significantly decreasing the dissolution flux of CO at the free surface.
Figure 9 shows the concentration distributions of O and C in the silicon melt and crystal with and without the AGDS at the 50% crystalline fraction. We can see that in the silicon area the concentration of O is the highest on the bottom wall and sidewall of the silicon ingot where the O atoms dissolve into the melt. The dissolved O atoms are transported into the silicon melt. Because the segregation coefficient K O is greater than 1, some of the O atoms segregate into the growing crystal at the c-m interface. Most of the C mainly come from outside of the silicon region, and the segregation coefficient K C is far less than 1, so most C atoms are pushed into the silicon melt, resulting in a relatively high C concentration and C concentration gradient at the c-m interface, as shown in Figure 10b.
From Figure 10a we found that the configuration of AGDS has little influence on the concentration of O in the silicon region, and also has no significant influence on the distribution of O at the 50% crystalline fraction because, although the evaporation flux of SiO decreases, which means that fewer O atoms leave the silicon melt, it also reduces the O atoms that CO decomposes into the melt. However, the configuration of AGDS has a significant effect on the concentration of C in the silicon region, but the maximum concentration of C in the silicon melt decreases significantly. In the silicon melt, the maximum C concentration appears at the center of the melt without the AGDS. When AGDS is used, the maximum value of the C concentration only appears at the c-m interface. Meanwhile, as shown in Figure 10b, the C concentration decreased significantly along the central axis of the silicon region. As mentioned above, this is because the outflow of the outer tube suppresses the generation of CO and decreases the dissolution flux of CO at the free surface, thus decreasing the concentration of C in the silicon melt.
The final concentration of O and C after complete crystallization when casting silicon is of the most concern. Figure 11 depicts the concentration distribution of O and C in the completely crystallized silicon ingots with and without the AGDS. As can be seen from Figure 11, with an increase in the height of the silicon ingots, the O concentration in the silicon ingots decreases, which is mainly due to the segregation effect of the O atoms and the decrease of the contact surface between the melt and the quartz crucible. Similar O and C distributions in silicon ingots are obtained in the two cases. The concentration of O as a whole is close to the concentration of the silicon ingots under the original structure, but after the AGDS is configured, the O brought by the backflow of argon is reduced, and the minimum concentration of O is decreased. The AGDS, however, significantly influences the C concentration in the silicon ingot. After the AGDS is configured, the maximum and minimum C concentrations in the entire silicon ingot are significantly decreased.
Meanwhile, we compared the O and C concentration distributions along the central axis of the two groups of silicon ingots in Figure 12. It can be found that the O concentration at the center axis of the two groups of silicon ingot is similar, but the C concentration decreases significantly after the AGDS is configured. In addition, the maximum concentration of C along the axis of the silicon area is not at the top of the silicon ingots, which is caused by the rapid crystalline rate in the late growth period, when the C atoms are swallowed into the silicon crystal before the segregation behavior occurs.
To clarify the influence on the change of the average O and C concentrations in the fully crystallized silicon ingot with and without the AGDS, the average O and C concentrations of the radial cross-lines at different ingot heights were calculated respectively. The distribution of concentration along the height of the silicon ingot is shown in Figure 13. It can be seen that the radial average O concentration also gradually decreases with an increase in the height of the silicon ingot. On the one hand, this is because it is gradually farther away from the pollution source, the quartz crucible at the bottom, and, on the other hand, the segregation coefficient of O is relatively large. The radial average concentration of C also shows the same trend as the concentration along the central axis of the silicon ingot, and the reason for this trend is similar to that of O. On the one hand, this is due to the free surface becoming closer. On the other hand, the segregation coefficient of C is very small. The radial average O concentration of the silicon ingot with the AGDS is lower than that without the AGDS and the radial average C concentration of the silicon ingot decreases more obviously. This indicates that the concentration of O and C in the radial direction of the silicon ingot can be effectively reduced by using the AGDS. Through the calculation of the average O and C concentration of the entire silicon ingot, we found that if the AGDS with the optimized parameter combination is adopted, the average concentration of O and C in the silicon ingot is decreased by about 7.5% and 59.9%, respectively. This means that the AGDS with optimized parameters can effectively reduce the concentrations of O and C in silicon ingots, especially C.

5. Conclusions

In this research, an AGDS was designed and a series of 2D transient global numerical simulations were carried out, aiming to determine the optimal parameter combination of Qouter, Qinner, and H by OED, so as to decrease the concentrations of O and C in silicon ingots. Meanwhile, the influences of various factors on the transport of O and C in the casting process were evaluated. Qinner has the largest influence on the O in the silicon ingots, while the other two factors have little influence on the O. H is the most important factor affecting the C in the silicon ingots. Because the chemical reaction between SiO and the cover can be effectively suppressed when H is decreased, which can reduce the amount of CO generated, the concentrations of O and C are decreased. Moreover, the larger the side outflow, the more obvious the effect is. After comprehensive evaluation, it was determined that Qouter = 40 L·min−1, Qinner = 30 L·min−1, and H = 10 mm is the optimal parameter combination for the AGDS.
Furthermore, to further investigate the decrease effect of the AGDS with optimized parameters on O and C concentrations during the casting of silicon, we compared the influences on O and C in different crystalline stages with and without the optimized AGDS in the furnace. We found that the AGDS can effectively remove the O and C from the silicon ingots, especially C. The average concentrations of O and C in the silicon ingots are decreased by about 7.5% and 59.9%, respectively, which is conducive to improving the quality of the cast silicon ingots.

Author Contributions

Conceptualization, W.S.; methodology, J.L. (Jiulong Li) and W.S.; validation, J.L. (Jiulong Li), W.S., Z.Z., Z.G.; formal analysis, J.L. (Jiulong Li), Z.Z., Z.G.; investigation, J.L. (Jiulong Li), Z.Z., J.L. (Jiaqi Li); writing—original draft preparation, J.L. (Jiulong Li); writing—review and editing, J.L. (Jiulong Li), W.S., J.L. (Jiaqi Li), J.W. All authors have read and agreed to the published version of the manuscript.

Funding

The project is supported by the Key Research and Development Program of Jiangsu Province of China (Grant No. BE2019009-003). Industry-University-Research Project (Wuxi Suntech Solar Power Co., Ltd. Grant No. 8421130025). The National Natural Science Foundation for Young Scholars of China (Grant No. 51206069).

Data Availability Statement

The data presented in this study are available within the article.

Conflicts of Interest

The authors declare no conflict of interest.

References

  1. Sundaramahalingam, S.; Gurusamy, A.; Perumalsamy, R. Transient Simulation on the Growth of Mono-like Silicon Ingot in DS Process Using Crucible with Plano-Concave Bottom for PV Applications. Silicon 2021, 1–11. [Google Scholar] [CrossRef]
  2. Qi, X.; Xue, Y.; Su, W.; Ma, W.; Liu, L. Effect of Argon Flow on Oxygen and Carbon Coupled Transport in an Industrial Directional Solidification Furnace for Crystalline Silicon Ingots. Crystals 2021, 11, 421. [Google Scholar] [CrossRef]
  3. Li, J.; Chen, Y.; Hong, R. Modeling and optimization of the feedstock melting for industrial photovoltaic multi-crystalline silicon ingot. Sol. Energy 2016, 139, 108–115. [Google Scholar] [CrossRef]
  4. Haessler, C.; Höfs, H.-U.; Koch, W.; Stollwerck, G.; Müller, A.; Karg, D.; Pensl, G. Formation and annihilation of oxygen donors in multicrystalline silicon for solar cells. Mater. Sci. Eng. B 2000, 71, 39–46. [Google Scholar] [CrossRef]
  5. Chen, N.; Liu, B.; Qiu, S.; Liu, G.; Du, G. Study of SiC and Si3N4 inclusions in industrial multicrystalline silicon ingots grown by directional solidification method. Mater. Sci. Semicond. Process. 2010, 13, 231–238. [Google Scholar] [CrossRef]
  6. Du, G.; Chen, N.; Rossetto, P. On-wafer investigation of SiC and Si3N4 inclusions in multicrystalline Si grown by directional solidification. Sol. Energy Mater. Sol. Cells 2008, 92, 1059–1066. [Google Scholar] [CrossRef]
  7. Liu, L.; Ma, W.; Qi, X.; Li, Z.; Zhang, Y. Global simulation of coupled oxygen and carbon transport in an industrial directional solidification furnace for crystalline silicon ingots: Effect of crucible cover coating. Int. J. Heat Mass Transf. 2017, 108, 2355–2364. [Google Scholar] [CrossRef]
  8. Dropka, N.; Buchovska, I.; Degenhardt, U.; Kiessling, F. Influence of impurities from SiC and TiC crucible cover on directionally solidified silicon. J. Cryst. Growth 2020, 542, 125692. [Google Scholar] [CrossRef]
  9. Gao, B.; Nakano, S.; Kakimoto, K. Effect of crucible cover material on impurities of multicrystalline silicon in a unidirectional solidification furnace. J. Cryst. Growth 2011, 318, 255–258. [Google Scholar] [CrossRef]
  10. Raabe, L.; Pätzold, O.; Kupka, I.; Ehrig, J.; Würzner, S.; Stelter, M. The effect of graphite components and crucible coating on the behaviour of carbon and oxygen in multicrystalline silicon. J. Cryst. Growth 2011, 318, 234–238. [Google Scholar] [CrossRef]
  11. Kvande, R.; Arnberg, L.; Martin, C. Influence of crucible and coating quality on the properties of multicrystalline silicon for solar cells. J. Cryst. Growth 2009, 311, 765–768. [Google Scholar] [CrossRef]
  12. Teng, Y.; Chen, J.; Lu, C.; Chen, H.-I.; Hsu, C.; Chen, C. Effects of the furnace pressure on oxygen and silicon oxide distributions during the growth of multicrystalline silicon ingots by the directional solidification process. J. Cryst. Growth 2011, 318, 224–229. [Google Scholar] [CrossRef]
  13. Qi, X.; Liu, L.; Ma, W. Effects of Furnace Pressure on Oxygen and Carbon Coupled Transport in an Industrial Directional Solidification Furnace for Crystalline Silicon Ingots. J. Cryst. Growth 2016, 468, 933–938. [Google Scholar] [CrossRef]
  14. Li, Z.; Liu, L.; Ma, W.; Kakimoto, K. Effects of argon flow on impurities transport in a directional solidification furnace for silicon solar cells. J. Cryst. Growth 2011, 318, 304–312. [Google Scholar] [CrossRef]
  15. Kumar, M.A.; Srinivasan, M.; Ramasamy, P. Reduction of Carbon and Oxygen Impurities in mc-Silicon Ingot Using Molybdenum Gas Shield in Directional Solidification Process. Silicon 2020, 13, 4535–4544. [Google Scholar] [CrossRef]
  16. Liu, L.; Qi, X.; Ma, W.; Li, Z.; Zhang, Y. Control of the Gas Flow in an Industrial Directional Solidification Furnace for Production of High Purity Multicrystalline Silicon Ingots. Int. J. Photoenergy 2015, 2015, 1572–1576. [Google Scholar] [CrossRef] [Green Version]
  17. Gao, B.; Chen, X.J.; Nakano, S.; Kakimoto, K. Global growth of high purity multicrystalline silicon using a unidirectional solidification furnace for solar cells. J. Cryst. Growth 2010, 312, 1572–1576. [Google Scholar] [CrossRef]
  18. Venkatachalem, K.; Srinivasan, M.; Ramasamy, P. The Influence of Multiple-Heaters on the Reduction of Impurities in mc-Si for Directional Solidification. Silicon 2019, 11, 1335–1344. [Google Scholar] [CrossRef]
  19. Venkatachalem, K.; Srinivasan, M.; Perumalsamy, R. Optimizing Oxygen Impurities using different heater design in the Directional Solidification of Multi-Crystalline Silicon. Mater. Res. Express 2021, 6, 106323. [Google Scholar] [CrossRef]
  20. Bellmann, M.P.; Lindholm, D.; M’Hamdi, M. A novel method for gas flow and impurity control in directional solidification of multi-crystalline silicon. J. Cryst. Growth 2014, 399, 33–38. [Google Scholar] [CrossRef]
  21. Su, W.; Li, J.; Li, C.; Yang, W.; Wang, J. Design and Numerical Optimization of Gas Guidance System in Casting Silicon Furnace by the Orthogonal Experiment. Silicon 2021, 14, 301–307. [Google Scholar] [CrossRef]
  22. Teng, Y.; Chen, J.; Lu, C.; Chen, C. Numerical investigation of oxygen impurity distribution during multicrystalline silicon crystal growth using a gas flow guidance device. J. Cryst. Growth 2012, 360, 12–17. [Google Scholar] [CrossRef]
  23. Su, W.; Li, J.; Yang, W.; Han, X.; Guan, Z.; Zhang, Z. Numerical Investigation of Bottom Grille for Improving Large-Size Silicon Quality in Directional Solidification Process. Silicon 2021, 14, 211–221. [Google Scholar] [CrossRef]
  24. Su, W.; Yang, W.; Li, J.; Han, X.; Wang, J. Numerical Study of the Upgraded Hot Zone in Silicon Directional Solidification Process. Cryst. Res. Technol. 2021, 56, 2000180. [Google Scholar] [CrossRef]
  25. Gao, B.; Nakano, S.; Kakimoto, K. Global Simulation of Coupled Carbon and Oxygen Transport in a Unidirectional Solidification Furnace for Solar Cells. J. Electrochem. Soc. 2010, 157, H153–H159. [Google Scholar] [CrossRef]
  26. Bellmann, M.P.; Panjwani, B.; Syvertsen, M.; Meese, E.A. Dynamic simulation of impurity transport and chemical reactions in a Bridgman furnace for directional solidification of multi-crystalline silicon. J. Cryst. Growth 2013, 369, 47–54. [Google Scholar] [CrossRef]
  27. Yatsurugi, Y.; Akiyama, N.; Endo, Y.; Nozaki, T. Concentration, Solubility, and Equilibrium Distribution Coefficient of Nitrogen and Oxygen in Semiconductor Silicon. J. Electrochem. Soc. 1973, 120, 975–979. [Google Scholar] [CrossRef]
  28. Nozaki, T.; Yatsurugi, Y.; Akiyama, N. Concentration and Behavior of Carbon in Semiconductor Silicon. J. Electrochem. Soc. 1970, 117, 1566. [Google Scholar] [CrossRef]
  29. Liu, L.; Nakano, S.; Kakimoto, K. Investigation of oxygen distribution in electromagnetic CZ–Si melts with a transverse magnetic field using 3D global modeling. J. Cryst. Growth 2007, 299, 48–58. [Google Scholar] [CrossRef]
  30. Bornside, D.E.; Brown, R.A.; Fujiwara, T.; Fujiwara, H.; Kubo, T. The Effects of Gas-Phase Convection on Carbon Contamination of Czochralski-Grown Silicon. J. Electrochem. Soc. 1995, 142, 2790–2804. [Google Scholar] [CrossRef]
  31. Matsuo, H.; Bairava Ganesh, R.; Nakano, S.; Liu, L.; Kangawa, Y.; Arafune, K.; Ohshita, Y.; Yamaguchi, M.; Kakimoto, K. Thermodynamical analysis of oxygen incorporation from a quartz crucible during solidification of multicrystalline silicon for solar cell. J. Cryst. Growth 2008, 310, 4666–4671. [Google Scholar] [CrossRef]
  32. Deng, L.; Feng, B.; Zhang, Y. An optimized method for multi-objective and multi-factor designing of a ceramic slurry: Combining orthogonal experimental design with artificial neural networks. Ceram. Int. 2018, 44, 15918–15923. [Google Scholar] [CrossRef]
  33. Kang, P.; Zhao, Q.; Guo, S.; Xue, W.; Liu, H.; Chao, Z.; Jiang, L.; Wu, G. Optimization of the spark plasma sintering process for high volume fraction SiCp/Al composites by orthogonal experimental design. Ceram. Int. 2021, 47, 3816–3825. [Google Scholar] [CrossRef]
  34. Zhou, C.-C.; Yin, G.-F.; Hu, X.-B. Multi-objective optimization of material selection for sustainable products: Artificial neural networks and genetic algorithm approach. Mater. Des. 2009, 30, 1209–1215. [Google Scholar] [CrossRef]
Figure 1. Structure and configuration of ALD-G7 furnace (left) and computation grids (right).
Crystals 12 00562 g001
Figure 2. Schematic diagram of 3D (a) and 2D (b) structure of AGDS.
Crystals 12 00562 g002
Figure 3. Temperature field (left), and flow velocity vector and streamline (right) when the solidification fraction is 10%.
Crystals 12 00562 g003
Figure 4. The influence of various levels of factors on O impurity indicators.
Crystals 12 00562 g004
Figure 5. The influence of various levels of factors on C impurity indicators.
Crystals 12 00562 g005
Figure 6. Flow of argon above the free surface at 50% crystalline fraction without (left) and with (right) AGDS.
Crystals 12 00562 g006
Figure 7. The concentration distributions of SiO and CO above the free surface at 50% crystalline fraction without (a) and with (b) AGDS.
Crystals 12 00562 g007
Figure 8. Evaporation flux of SiO (a) and dissolution flux of CO (b) along the free surface at 50% crystalline fraction.
Crystals 12 00562 g008
Figure 9. The concentration distributions of O and C in the silicon melt and crystal without (a) and with (b) the AGDS at the 50% crystalline fraction.
Crystals 12 00562 g009
Figure 10. O (a) and C (b) concentration along the center axis of the silicon region.
Crystals 12 00562 g010
Figure 11. The concentration distributions of O and C in the silicon ingots at the 100% crystalline fraction without (a) and with (b) the AGDS.
Crystals 12 00562 g011
Figure 12. O (a) and C (b) concentration along the center axis of the silicon ingots.
Crystals 12 00562 g012
Figure 13. The radial average O (a) and C (b) concentrations along the height of silicon ingot at 100% crystallization.
Crystals 12 00562 g013
Table 1. Chemical reactions in the transport of oxygen and carbon impurities.
LocationChemical Reactions
(1) Quartz crucible-silicon melt interfaceSiO2(s)↔Si(m) + 2O(m)
(2) The free surface of silicon meltSi(m) + O(m)↔SiO(g)
(3) The surface of hot graphite partsSiO(g) + 2C(s)↔CO(g) + SiC(s)
(4) The free surface of silicon meltCO(g)↔C(m) + O(m)
(5) c-m interfaceO(m)↔O(c)
C(m)↔C(c)
In this table, the symbol (s) refers to solid, (m) to melt, (g) to gas, and (c) to crystal.
Table 2. Factors and levels used in the orthogonal experimental design L9 (34).
FactorsX1: Qinner/L·min−1X2: Qouter/L·min−1X3: H/mm
Levels
1202020
2303065
34040120
Table 3. Cases and results of the orthogonal experiment design.
FactorsX1: Qouter/L·min−1X2: Qinner/L·min−1X3: H/mmResult:
Y/1017·Atoms·cm−3
Exp# YOYC
12020103.4111.581
22030653.2484.357
320401203.1464.384
43020653.4703.473
530301203.0123.076
63040103.1952.131
740201203.2692.182
84030103.1151.874
94040653.3893.005
Table 4. Evaluation indices of the orthogonal experiment design (oxygen).
FactorsX1: Qouter/L·min−1X2: Qinner/L·min−1X3: H/mm
Evaluation
Z 1 ¯ 3.2683.3833.240
Z 2 ¯ 3.2263.1253.252
Z 3 ¯ 3.1413.1293.142
R0.1270.2580.110
Table 5. Evaluation indices of the orthogonal experiment design (carbon).
FactorsX1: Qouter/L·min−1X2: Qinner/L·min−1X3: H/mm
Evaluation
Z 1 ¯ 3.4412.4121.862
Z 2 ¯ 2.8933.1023.612
Z 3 ¯ 2.3543.1733.214
R1.0870.7611.750
Publisher’s Note: MDPI stays neutral with regard to jurisdictional claims in published maps and institutional affiliations.

