
The Correlation for Effective Distribution Coefficient with Initial Impurity Concentration and Growth Rate for Acrylic Acid in Melt Crystallization


1
Department of Chemical and Materials Engineering, Chang Gung University, Taoyuan 333, Taiwan
2
Department of Urology, Linkou Chang Gung Memorial Hospital, Taoyuan 333, Taiwan
Crystals 2022, 12(5), 709; https://0-doi-org.brum.beds.ac.uk/10.3390/cryst12050709
Submission received: 28 April 2022
/
Revised: 12 May 2022
/
Accepted: 13 May 2022
/
Published: 16 May 2022
(This article belongs to the Special Issue Heat and Mass Transfer Modeling in Crystal Growth)
Abstract
:The layer growth rates and resulting crystal purity during solid-layer melt crystallization were experimentally measured for acrylic acid (AA) with impurity propionic acid (PA) operated at various cooling temperatures. A power law was adopted to correlate the growth rate with the temperature difference between melt and coolant. The effective distribution coefficient was determined from the resulting crystal purity for each condition. An empirical equation modified from the analytical solution for the mass transfer boundary layer was proposed in this work to relate the effective distribution coefficient to the initial impurity concentration and growth rate.
1. Introduction
Melt crystallization is an important separation technique for the purification of organic compounds in the chemical and pharmaceutical industries [1,2,3,4]. It has many advantages over distillation due to no solvent addition, low energy consumption, low temperature operation, etc. It has been efficiently adopted to replace distillation for heat-sensitive materials. In melt crystallization, a crystal layer of the desired substance growing on a cooled wall is produced from the melt. Both static melt crystallization and falling film melt crystallization have been widely applied in industries. Although melt crystallization is typically a selective operation, some unwanted components can be incorporated into the crystal of the desired substance. The effective distribution coefficient, defined as the ratio of the impurities in the solid phase and the liquid phase, is often used to describe the degree of separation [1]. Numerous studies have investigated the crystal layer growth rate and effective distribution coefficient based on the fundamental energy balance and mass balance equations for various types of melt crystallization [5,6,7,8,9,10,11,12,13,14,15,16].
Acrylic acid (AA) is an important chemical used as a polymer form in many fields, such as diapers, textiles, coatings, and adhesives. Traditional AA synthesis is based on oxidation of propylene or propane obtained by steam cracking in the petrochemical process. Recently, research has focused on the biosynthesis of AA from renewable feed stocks, e.g., fermentable sugars and plant oils [17,18]. However, a high concentration of propionic acid (PA) is usually produced as an impurity in AA biosynthesis. Due to the close boiling points between AA (141 °C) and PA (141.15 °C), it is usually difficult to separate them by distillation. In recent years, melt crystallization has been applied to separate AA from melt with impurity PA [19,20,21]. To elucidate the influence of process parameters on the effective distribution coefficient, the objective of this study is to investigate the dependence of the effective distribution coefficient on the initial impurity concentration and layer growth rate for AA melt with PA as an impurity for industrial applications.
2. Experimental
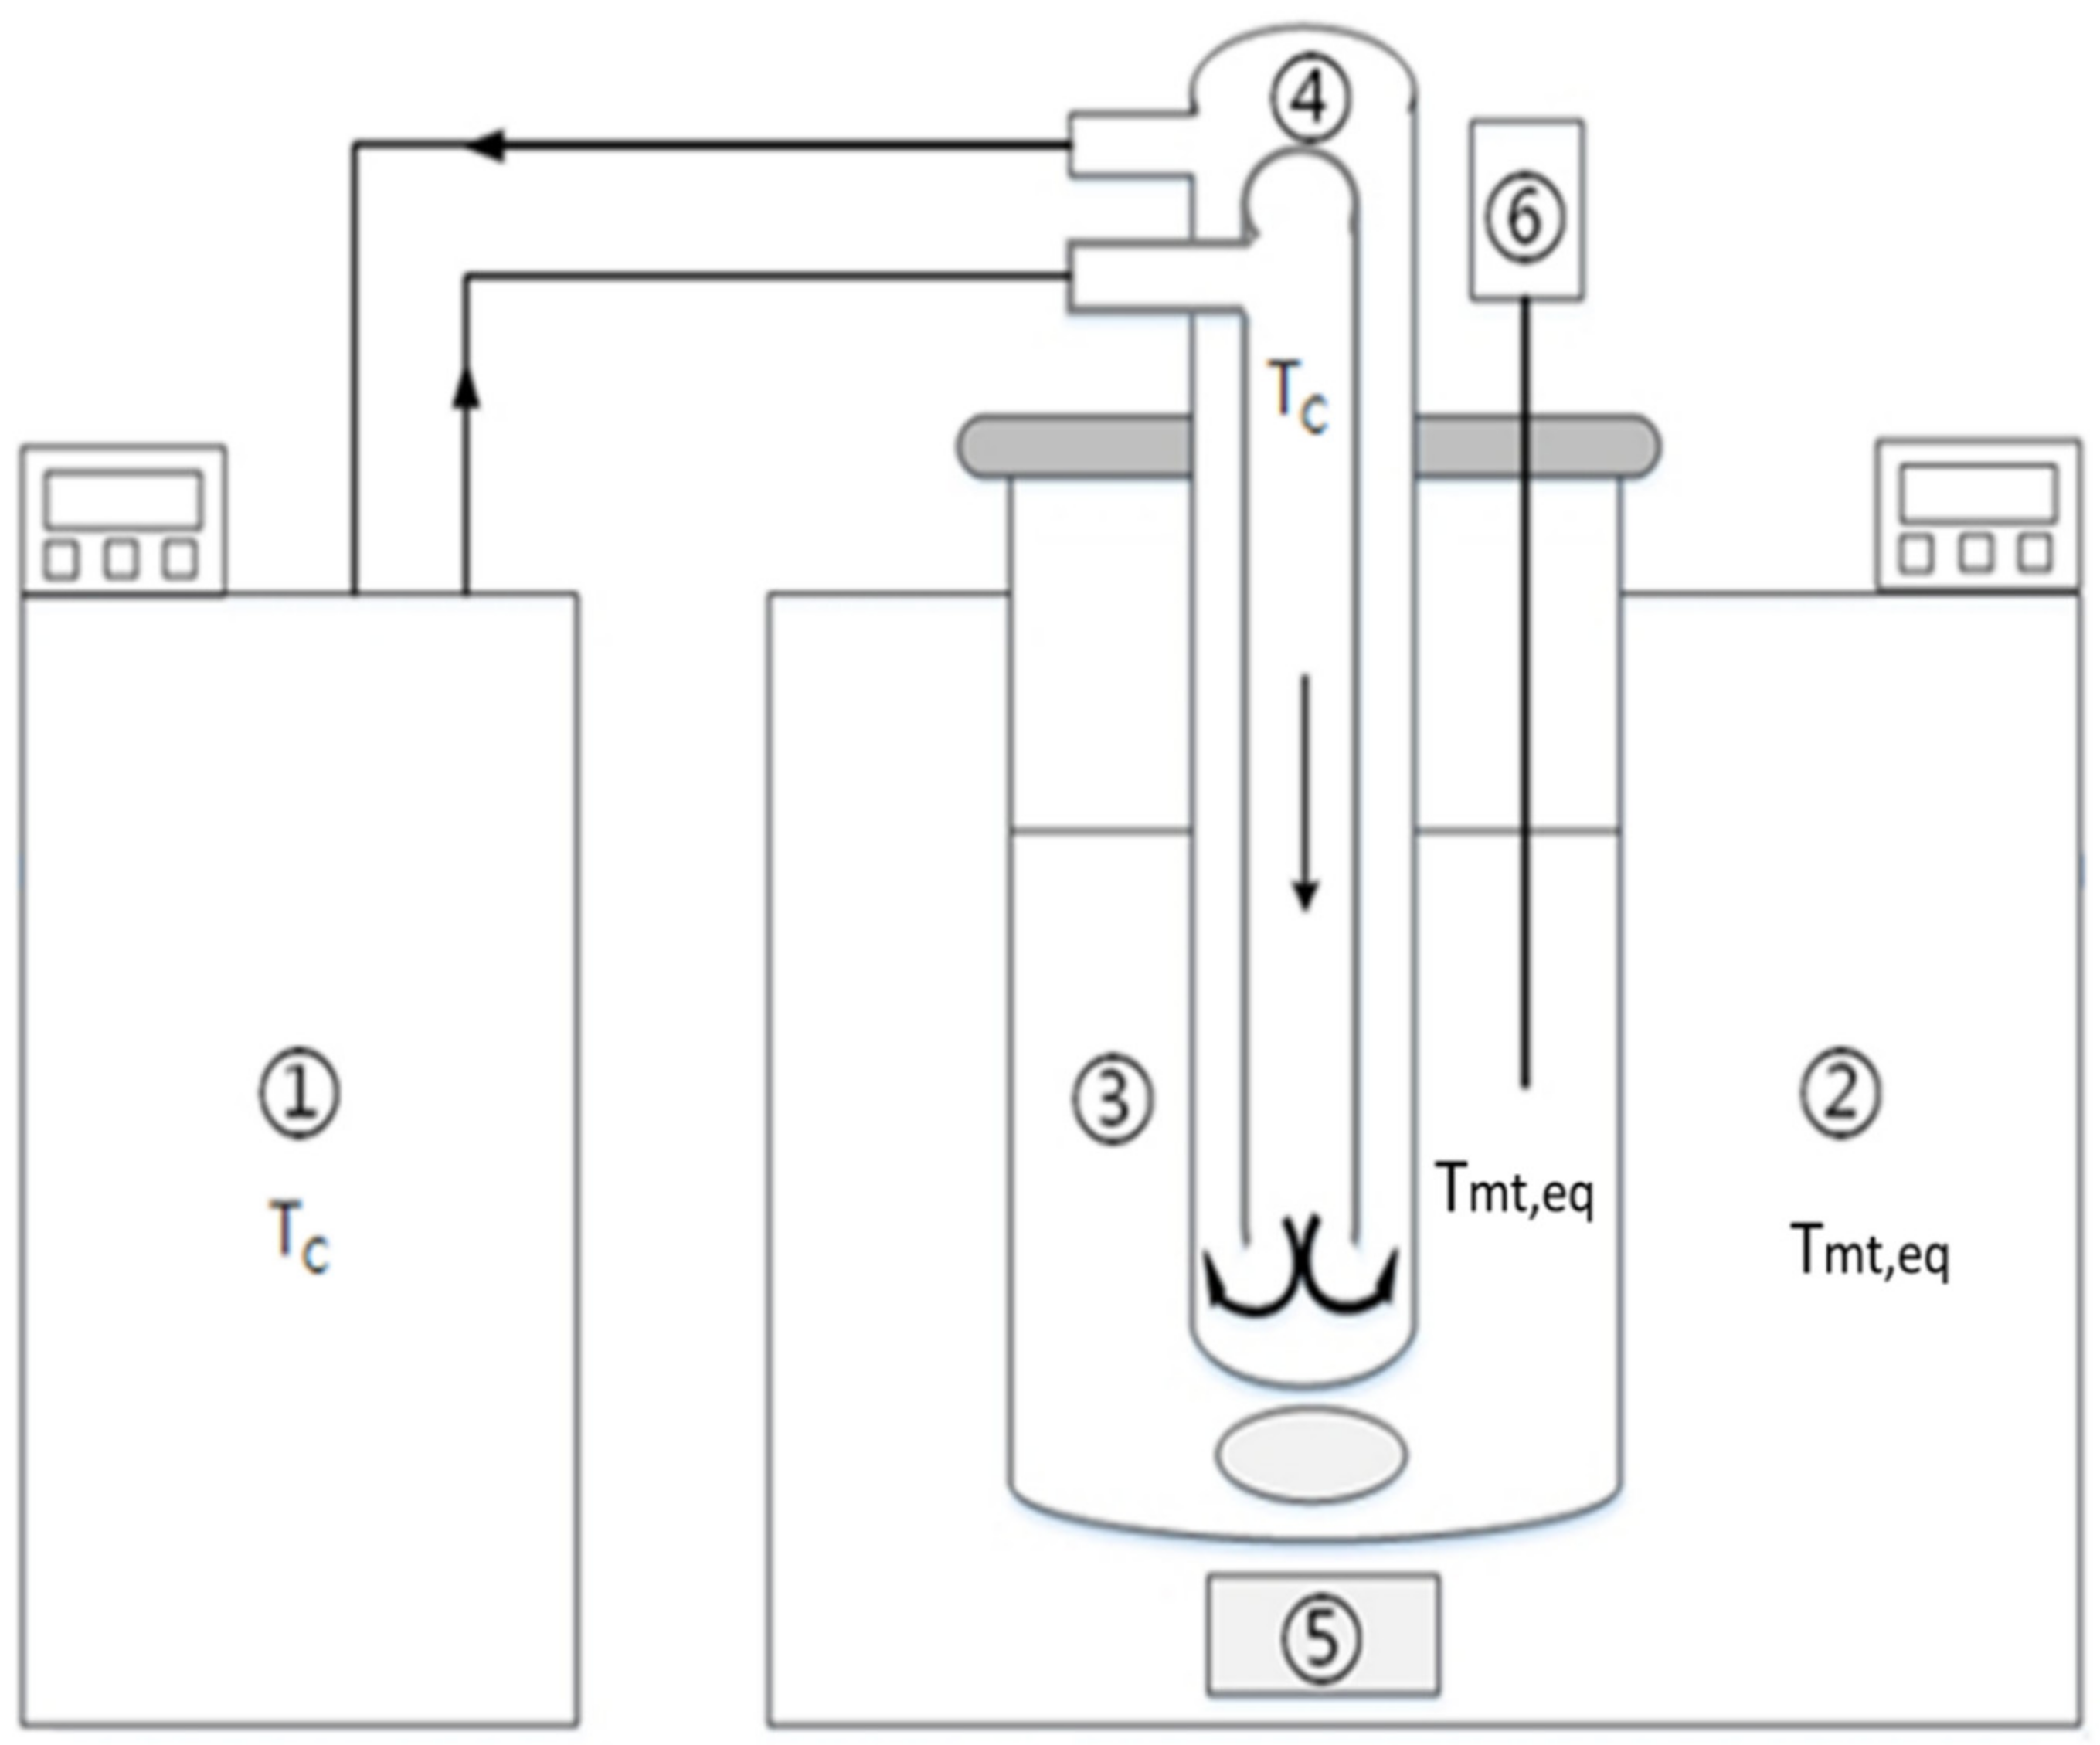
Solid-layer melt crystallization experiments were performed for the AA melt with impurity PA using a vessel immersed in a water bath with a cylindrical crystallizer internally cooled by the circulating coolant shown in Figure 1 [22]. The melt in the vessel was mixed using a magnetic stirrer with a stirring rate of 130 rpm.
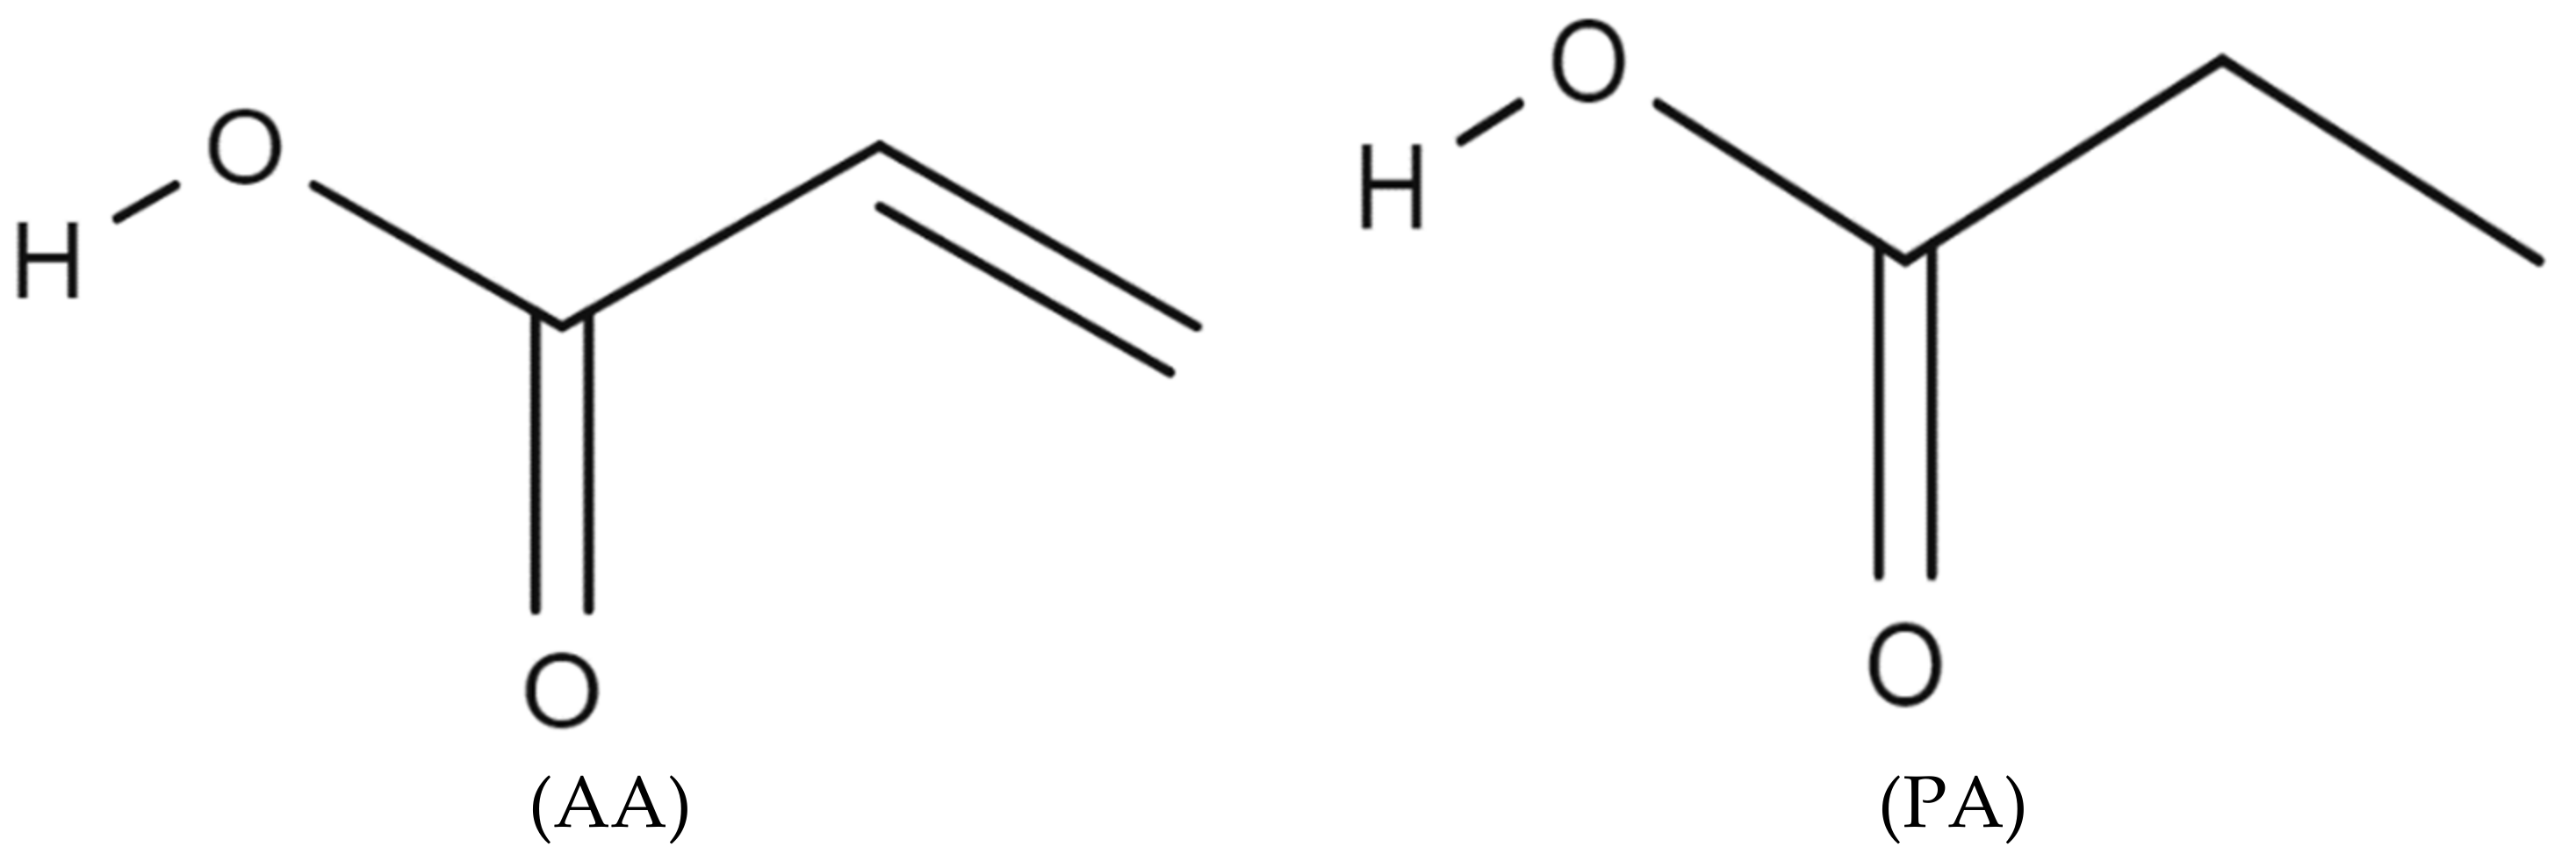
AA (99.5%, ACROS) and PA (99%, ACROS) were used to prepare a 1000 mL binary mixture with each mole fraction of AA, . The chemical structures of AA and PA are illustrated in Figure 2. According to the solid-liquid equilibrium data for the binary mixture of AA and PA reported in the literature [23,24], the relationship between the equilibrium temperature and the mole fraction of AA is given by
As listed in Table 1, was determined from Equation (1). The melt in the vessel was maintained at the corresponding for a given during each experiment. At the beginning of the experiments, the cylindrical crystallizer internally circulated with the coolant at 253 K was submerged into the melt for 5 s to initiate nucleation on the outer surface of the crystallizer. Then, the cylindrical crystallizer was removed from the melt. As the coolant was quickly switched to a specified cooling temperature , the cylindrical crystallizer was submerged into the melt again, and the crystal layer gradually grew on the outer surface of the cylindrical crystallizer during the experiments.
The total growth time for each experiment was kept at 600 s. At the end, the overall crystal layer grown on the outer surface of the cylindrical crystallizer was melted and weighed. The impurity mole fraction in the overall crystal layer was determined by GC using a China Chromatograph 2000 with a stainless steel capillary column (Zebron/ZB-FFAP, 30 m × 0.32 mm, Supelco, Bellefonte, PA, USA).
As shown in Figure 3, the bottom part of the cooling finger corresponds to a hemisphere with radius . As the height of the overall crystal on the surface of the cooling finger was kept the same for each experiment, the overall crystal volume on the surface of the cooling finger was given by
where represents the outer radius of the overall crystal on the surface of the cooling finger at the end of the experiment and is the crystal density of AA. Thus, as was measured at the end of each experiment, can be determined from Equation (2) using , and .
Once is determined, the growth rate is given by
where is the total growth time. As the crystal layer was generally smaller than at for all the experiments, was negligible compared to the initial mass of melt. Consequently, was nearly unchanged during each experiment.
3. Results and Discussion
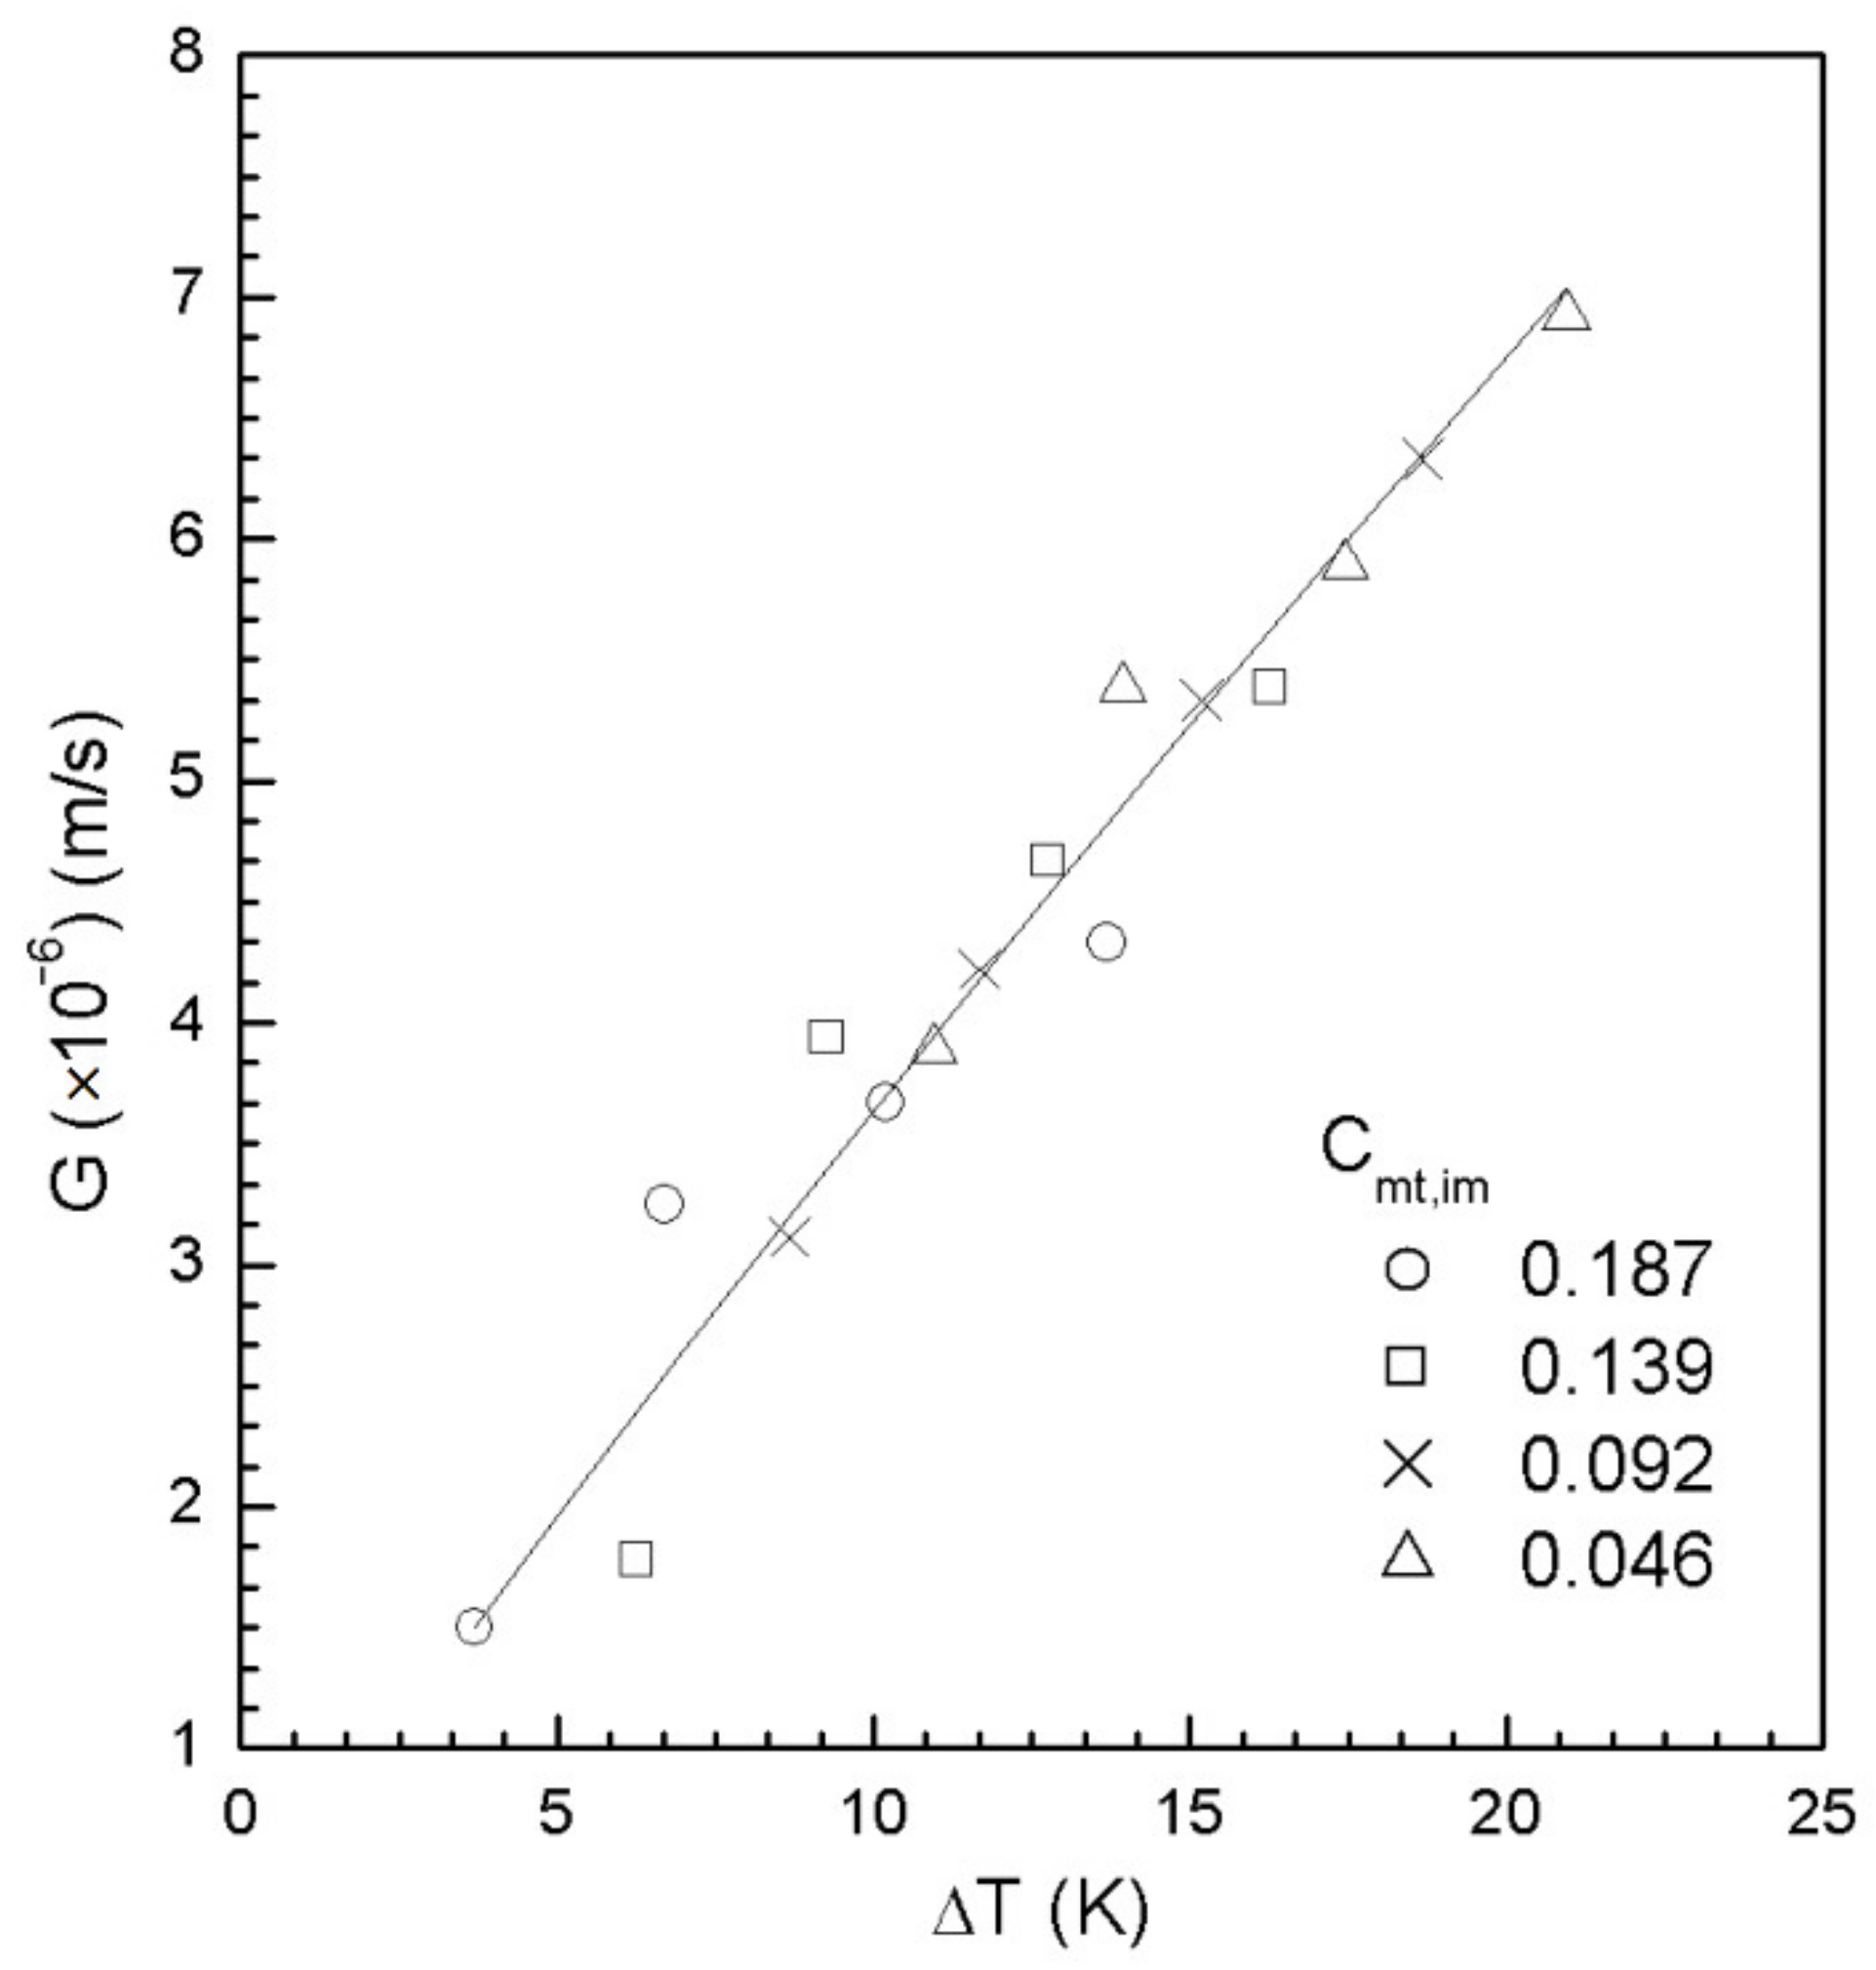
Table 1 lists the experimentally measured data of and for various operated at various . Note that , where represents the mole fraction of PA in the melt. As the coolant was circulated very quickly and the crystal layer grown on the outer surface of the cylindrical crystallizer was thin for each experiment, the crystallization heat released at the crystal–melt interface was assumed to be quickly removed by the coolant. Furthermore, as the melt was maintained at the corresponding for a given , the heat transfer rate from the crystal layer to the coolant should be related to . Consequently, the growth rate of the crystal layer should be proportional to the heat transfer rate. Thus, all the data in Figure 4 lead to [6]
Note that the line represents the fitted correlation. Figure 4 shows that increases with increasing .
The effective distribution coefficient between crystal and melt is defined as [1]
where is the impurity concentration in the melt and is the impurity concentration in crystal. Low values indicate high separation efficiency. The value of ranges from zero if crystals are totally pure to one if no separation occurs. Table 1 also lists the calculated from the experimentally measured for various operated at various . Figure 5 shows versus for each . Thus, decreases with decreasing at each while is generally smaller for a lower at a given . This trend for the dependence of on and is consistent with the findings reported in various systems [22,25,26].
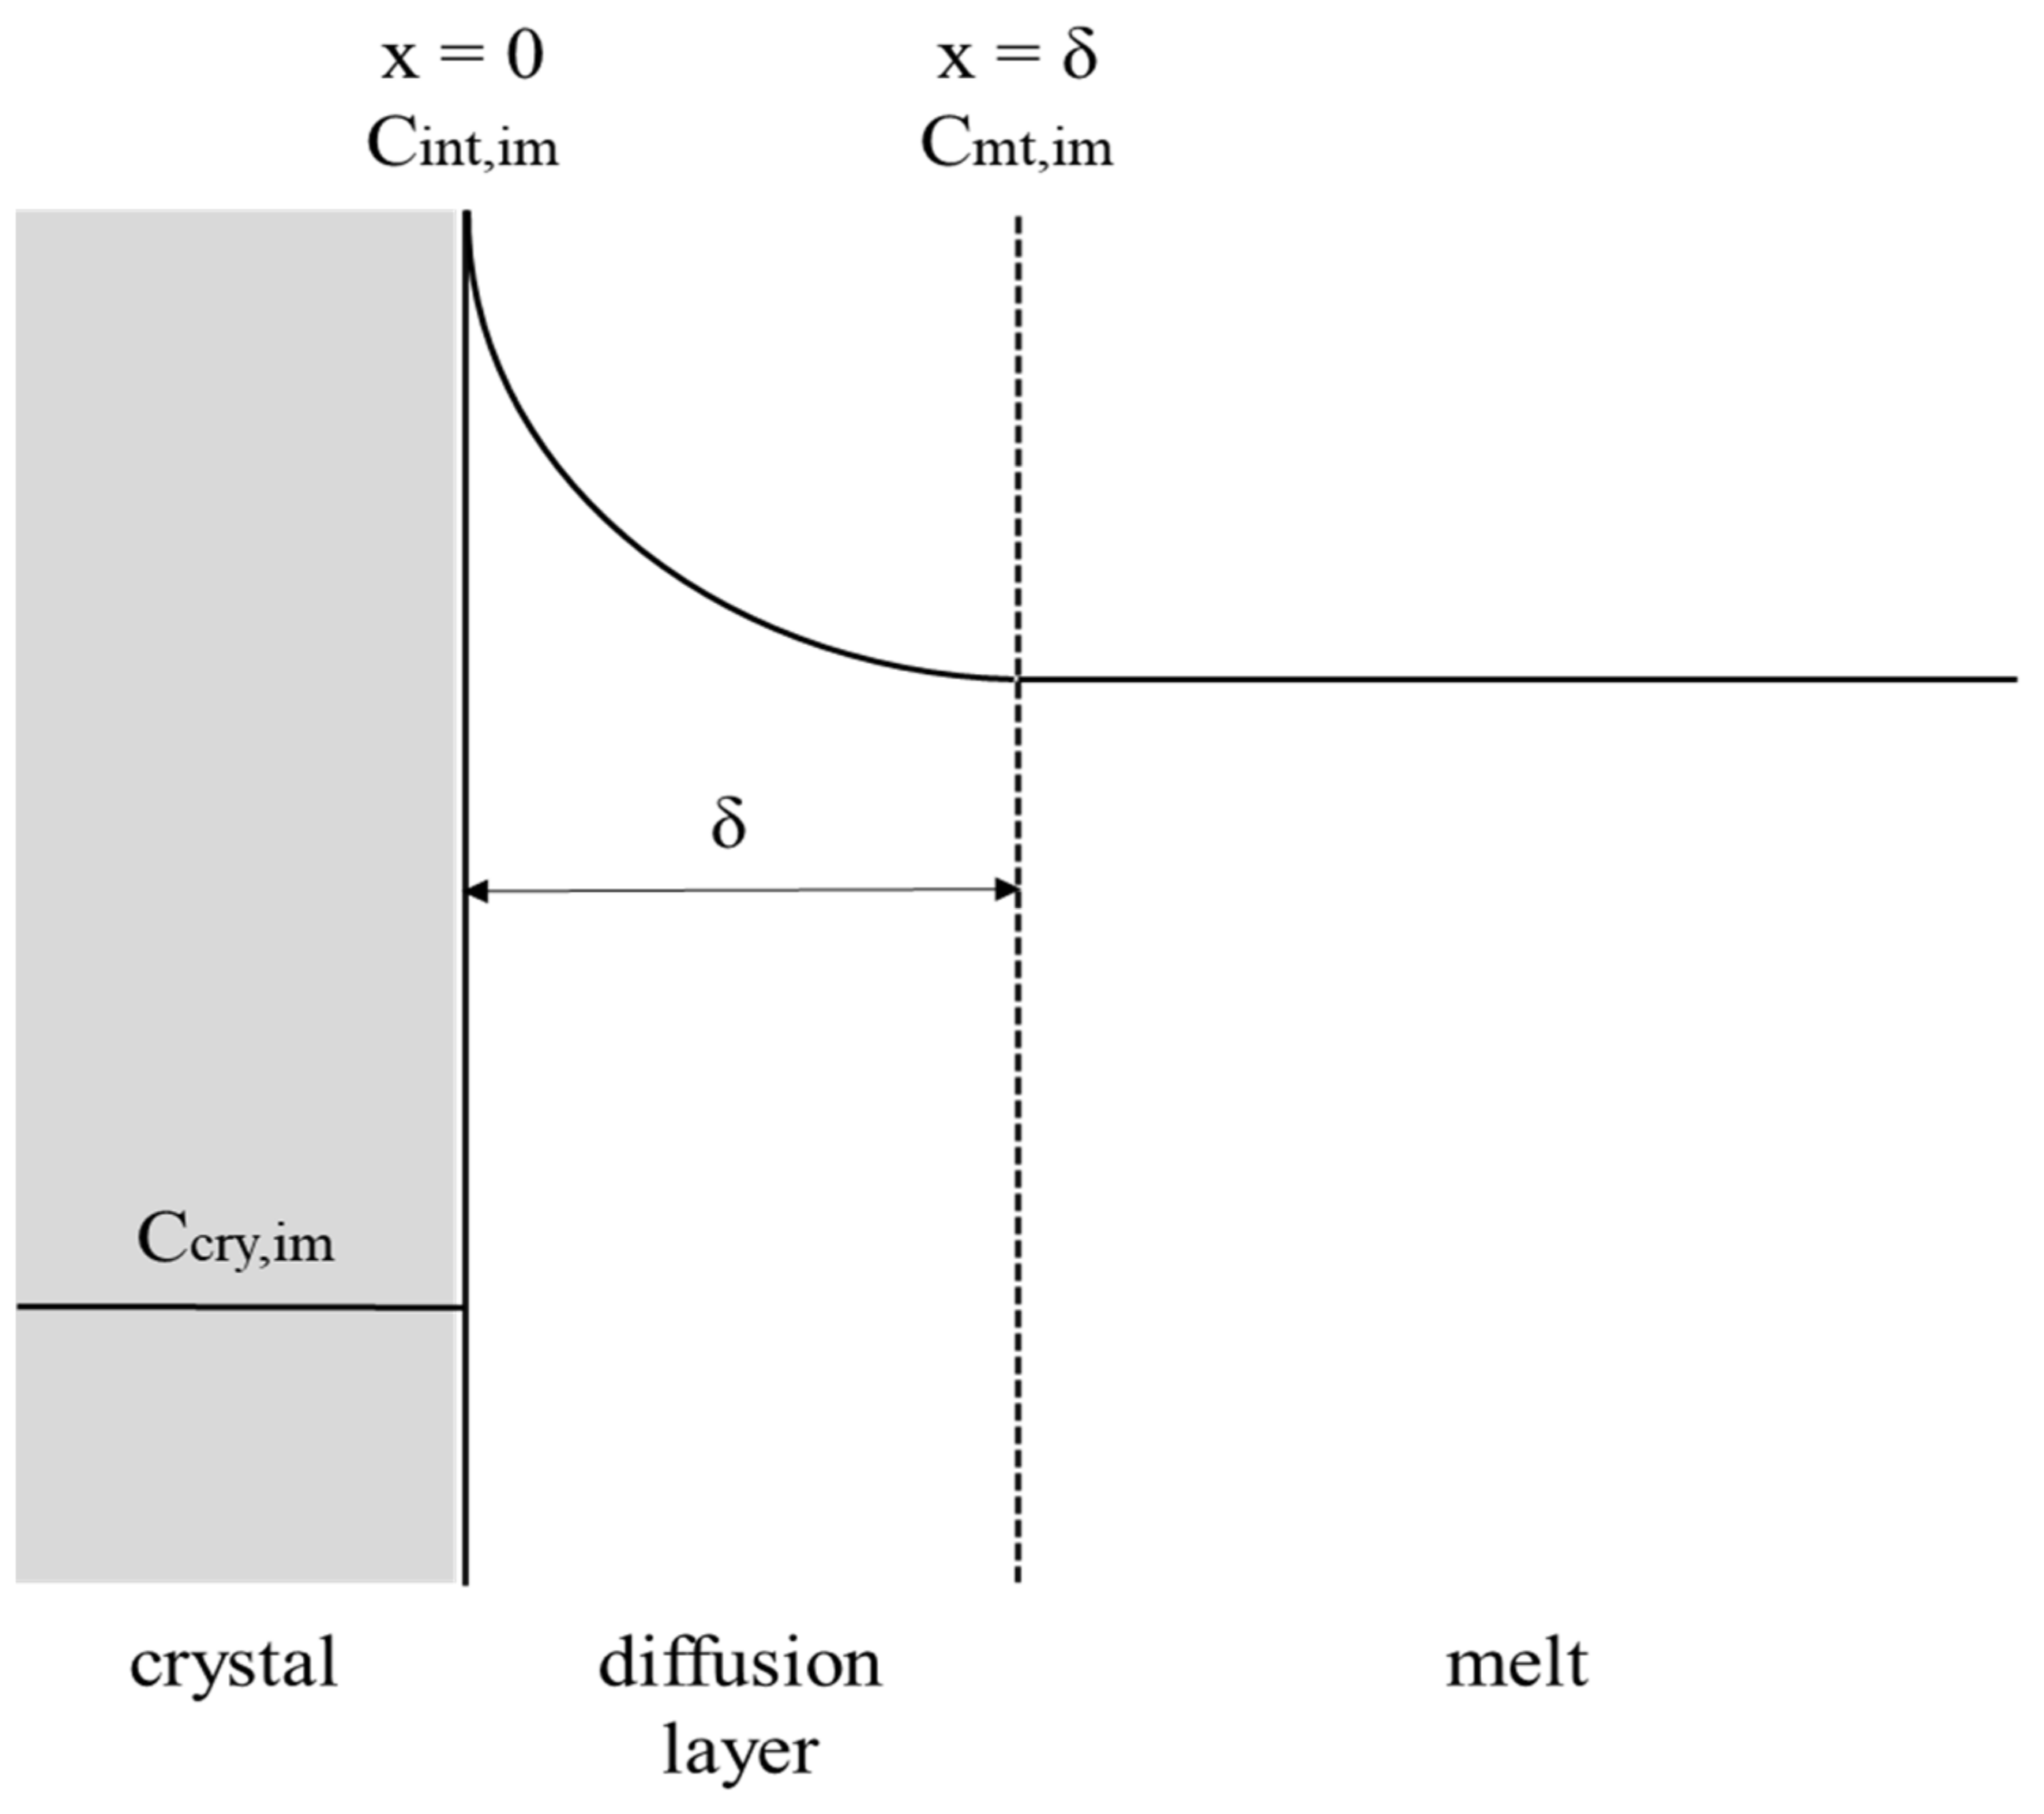
Figure 6 illustrates the impurity concentration in the mass transfer boundary layer along the direction perpendicular to the crystal–melt interface for a melt. As the variations in the impurity concentration in the boundary layer with time can be neglected for a thin boundary layer [5,6,27,28], one can derive
The boundary conditions for Equation (6) are given by
where is the impurity concentration in the melt and is the impurity concentration in the melt at the crystal–melt interface.
The solution of Equation (6) is
Substituting into Equation (9) yields
where the mass transfer coefficient is defined as [1]. Combining Equations (5) and (10) yields
Thus, Equation (11) is an analytical solution for in terms of the dimensionless groups, and . However, as generally cannot be experimentally measured, it is difficult to determine from Equation (11). In other words, is affected by the impurity concentration in melt at the crystal–melt interface, the impurity mass transfer coefficient in the melt, and the layer growth rate.
By comparing the experimental with Equation (11), some researchers indicated for simplicity that should be a function of the dimensionless groups, and [29,30,31]. For practical applications, an empirical form of is proposed in this study as
where , and are three coefficients. Equation (12) for reduces to the correlation adopted by Shiau [22]. However, Equation (12) provides a more generalized equation for applications. Taking the log of both sides, Equation (12) becomes
Thus, , and can be determined by fitting Equation (13) with the experimental data of versus for various . It should be noted that, cannot be calculated here unless is determined previously.
The data in Figure 5 fitted to Equation (13) lead to
with in mole fraction and in . Note that each line represents the fitted correlation for each .
4. Conclusions
The layer growth kinetics and resulting crystal purity for AA with impurity PA were experimentally measured in a solid-layer cylindrical crystallizer internally cooled by a circulating coolant operated at various cooling temperatures. The growth rate of the crystal layer was correlated well using a power law with the temperature difference between melt and coolant. The effective distribution coefficient was found to increase with the increasing initial impurity concentration and increasing growth rate. The effective distribution coefficient was fitted well to the proposed empirical equation, which provides a simple correlation for the dependence of the effective distribution coefficient on the initial impurity concentration and growth rate.
Funding
This research was funded by the Ministry of Science and Technology of Taiwan (MOST110-2221-E-182-006-MY2) and Chang Gung Memorial Hospital (CMRPD2K0012).
Institutional Review Board Statement
Not applicable.
Informed Consent Statement
Not applicable.
Data Availability Statement
Data is contained within the article.
Acknowledgments
The author would like to thank the Ministry of Science and Technology of Taiwan (MOST110-2221-E-182-006-MY2) and Chang Gung Memorial Hospital (CMRPD2K0012) for financial support of this research. The experimental work performed by Meng-Han Chiang, Yi-Chih Ke, Cheng-Zhe Xu, and Yi-Hsuan Chu was greatly appreciated.
Conflicts of Interest
The author declares no conflict of interest. The funders had no role in the design of the study; in the collection, analyses, or interpretation of data; in the writing of the manuscript, or in the decision to publish the results.
Abbreviations
| Notation | |
| impurity concentration in crystal layer (mole fraction, -) | |
| impurity concentration at the crystal–melt interface | |
| impurity concentration at the position in the boundary layer | |
| impurity concentration in melt . | |
| concentration of AA in melt | |
| diffusivity | |
| growth rate | |
| height of the crystal layer on the cooling finger | |
| mass transfer coefficient | |
| effective distribution coefficient | |
| mass of total crystal layer | |
| outer radius of the cooling finger | |
| outer radius of the crystal layer on the cooling finger | |
| cooling temperature of the cooling medium | |
| equilibrium temperature of the melt | |
| temperature gradient between melt and cooling medium | |
| total growth time | |
| distance perpendicular to the crystal–melt interface | |
| Greek letters | |
| crystal density | |
| thickness of the boundary layer | |
References
- Ulrich, J.; Glade, H. Melt Crystallization: Fundamentals, Equipment and Applications; Shaker: Aachen, Germany, 2003. [Google Scholar]
- Jiang, X.; Li, M.; He, G.; Wang, J. Research process and model development of crystal layer growth and impurity distribution in layer melt crystallization: A review. Ind. Eng. Chem. Res. 2014, 53, 13211–13227. [Google Scholar] [CrossRef]
- Wang, T.; Lu, H.; Wang, J.; Xiao, Y.; Zhou, Y.; Bao, Y.; Hao, H. Recent progress of continuous crystallization. J. Ind. Eng. Chem. 2017, 54, 14–29. [Google Scholar] [CrossRef]
- Jia, S.; Gao, Z.; Tian, N.; Li, Z.; Gong, J.; Wang, J.; Rohani, S. Review of melt crystallization in the pharmaceutical field, towards crystal engineering and continuous process development. Chem. Eng. Res. Des. 2021, 166, 268–280. [Google Scholar] [CrossRef]
- Chianese, A.; Santilli, N. Modelling of the solid layer growth from melt crystallization-the integral formulation approach. Chem. Eng. Sci. 1998, 53, 107–111. [Google Scholar] [CrossRef]
- Parisi, M.; Chianese, A. The crystal layer growth from a well-mixed melt. Chem. Eng. Sci. 2001, 56, 4245–4256. [Google Scholar] [CrossRef]
- Kim, K.J.; Ulrich, J. Impurity distribution in a solid-liquid interface during static layer crystallization. J. Colloid Interface Sci. 2002, 252, 161–168. [Google Scholar] [CrossRef]
- Jiang, X.; Hou, B.; He, G.; Wang, J. Falling film melt crystallization (I): Model development, experimental validation of crystal layer growth and impurity distribution process. Chem. Eng. Sci. 2012, 84, 120–133. [Google Scholar] [CrossRef]
- Zhou, L.; Su, M.; Benyahia, B.; Singh, A.; Barton, P.I.; Trout, B.; Myerson, A.S.; Braatz, R.D. Mathematical modeling and design of layer crystallization in a concentric annulus with and without recirculation. AIChE J. 2013, 59, 1308–1321. [Google Scholar] [CrossRef] [Green Version]
- Beierling, T.; Osiander, J.; Sadowski, G. Melt crystallization of isomeric long-chain aldehydes from hydroformylation. Sep. Purif. Technol. 2013, 118, 13–24. [Google Scholar] [CrossRef]
- Beierling, T.; Gorny, R.; Sadowski, G. Modeling growth rates in static layer melt crystallization. Cryst. Growth. Des. 2013, 13, 5229–5240. [Google Scholar] [CrossRef]
- Beierling, T.; Micovic, J.; Lutze, P.; Sadowski, G. Using complex layer melt crystallization models for the optimization of hybrid distillation/melt crystallization processes. Chem. Eng. Process. Process Intensif. 2014, 85, 10–23. [Google Scholar] [CrossRef]
- Yazdanpanah, N.; Myerson, A.; Trout, B. Mathematical modeling of layer crystallization on a cold column with recirculation. Ind. Eng. Chem. Res. 2016, 55, 5019–5029. [Google Scholar] [CrossRef]
- Fukui, K.; Fujikawa, T.; Satone, H.; Yamamoto, T.; Maeda, K. Application of solute distribution theory to melt crystallization of fatty acids. Chem. Eng. Sci. 2016, 143, 114–121. [Google Scholar] [CrossRef]
- Ioannou, I.S.; Kontos, S.S.; Koutsoukos, P.G.; Paraskeva, C.A. Mathematical modeling and experimental coupling of solution layer crystallization on a vertically cold surface. Sep. Purif. Technol. 2018, 197, 8–17. [Google Scholar] [CrossRef]
- Ding, S.; Huang, X.; Yin, Q.; Wang, N.; Wang, T.; Dong, Y.; Chen, Y.; Hao, H. Static layer crystallization: Effects of impurities on the growth behaviors of crystal layers. Sep. Purif. Technol. 2021, 279, 119764. [Google Scholar] [CrossRef]
- Liu, Z.; Liu, T. Production of acrylic acid and propionic acid by constructing a portion of the 3-hydroxypropionate/4-hydroxybutyrate cycle from Metallosphaera sedula in Escherichia coli. J. Ind. Microbiol. Biotechnol. 2016, 43, 1659–1670. [Google Scholar] [CrossRef]
- Fouilloux, H.; Thomas, C.M. Production and polymerization of biobased arylates and analogs. Macromol. Rapid Commun. 2021, 42, 2000530. [Google Scholar] [CrossRef]
- Chen, L.; Li, J.; Matsuoka, M. Experimental and theoretical investigation of the purification process of organic materials in a continuous inclined column crystallizer. Ind. Eng. Chem. Res. 2006, 45, 2818–2823. [Google Scholar] [CrossRef]
- Le Page Mostefa, M.; Muhr, H.; Plasari, E.; Fauconet, M. A purification route of bio-acrylic acid by melt crystallization respectful of environmental constraints. Powder Technol. 2014, 255, 98–102. [Google Scholar] [CrossRef]
- Le Page Mostefa, M.; Muhr, H.; Biget, A.; Plasari, E.; Fauconet, M. Intensification of falling film melt crystallization process through micro and milli-structured surfaces. Chem. Eng. Process. Process Intensif. 2015, 90, 16–23. [Google Scholar] [CrossRef]
- Shiau, L.D. The dependence of effective distribution coefficient on growth rate and mass transfer coefficient for p-xylene in solid-layer melt crystallization. Processes 2020, 8, 175. [Google Scholar] [CrossRef] [Green Version]
- Lohmann, J.; Ropke, T.; Gmehling, J. Solid-liquid equilibria of several binary systems with organic compounds. J. Chem. Eng. Data 1998, 43, 856–860. [Google Scholar] [CrossRef]
- Le Page Mostefa, M.; Muhr, H.; Plasari, E.; Fauconet, M. Determination of the solid-liquid phase diagram of the binary system acrylic acid + propionic acid. J. Chem. Eng. Data 2012, 57, 1209–1212. [Google Scholar] [CrossRef]
- Guardani, R.; Neiro, S.M.S.; Bulau, H.; Ulrich, J. Experimental comparison and simulation of static and dynamic solid layer melt crystallization. Chem. Eng. Sci. 2001, 56, 2371–2379. [Google Scholar] [CrossRef]
- Hasan, M.; Louhi-Kultanen, M. Ice growth kinetics modeling of air-cooled layer crystallization from sodium sulfate solutions. Chem. Eng. Sci. 2015, 133, 44–53. [Google Scholar] [CrossRef]
- Burton, J.A.; Prim, R.C.; Slichter, W.P. The distribution of solute in crystals grown from the melt. Part I. Theoretical. J. Chem. Physics. 1953, 21, 1987–1991. [Google Scholar]
- Burton, J.A.; Kolb, E.D.; Slichter, W.P.; Struthers, J.D. Distribution of solute in crystals grown from the melt. Part II. Experimental. J. Chem. Physics. 1953, 21, 1991–1996. [Google Scholar]
- De Goede, R.; van Rosmalen, G.M. Modelling of crystal growth kinetics: A simple but illustrative approach. J. Crystal Growth. 1990, 104, 392–398. [Google Scholar] [CrossRef]
- De Goede, R.; van Rosmalen, G.M. Crystal growth phenomenon of paraxylene crystals. J. Crystal Growth. 1990, 104, 399–410. [Google Scholar] [CrossRef]
- Wellinghoff, G.; Wintermantel, K. Schmelzkristallisation—Theoretische Voraussetzungen und technische Grenzen. Chem. Ing. Tech. 1991, 63, 881–891. [Google Scholar] [CrossRef]
Figure 1.
Schematic diagram of the experimental apparatus [22]: (1) water bath for the cylindrical crystallizer; (2) water bath for the vessel; (3) melt; (4) cylindrical crystallizer with coolant inlet and outlet; (5) magnetic stirrer; (6) temperature probe.
Figure 1.
Schematic diagram of the experimental apparatus [22]: (1) water bath for the cylindrical crystallizer; (2) water bath for the vessel; (3) melt; (4) cylindrical crystallizer with coolant inlet and outlet; (5) magnetic stirrer; (6) temperature probe.

Figure 2.
Chemical structures of acrylic acid (AA) and propionic acid (PA).

Figure 3.
Schematic diagram of the crystal layer grown on the outer surface of the cylindrical crystallizer ( and ), where the dark area represents the crystal layer [22].
Figure 3.
Schematic diagram of the crystal layer grown on the outer surface of the cylindrical crystallizer ( and ), where the dark area represents the crystal layer [22].

Figure 4.
The dependence of on for various .

Figure 5.
The dependence of on for various .

Figure 6.
Schematic diagram of the impurity concentration in the mass transfer boundary layer along the direction perpendicular to the crystal–melt interface.
Figure 6.
Schematic diagram of the impurity concentration in the mass transfer boundary layer along the direction perpendicular to the crystal–melt interface.


Table 1.
The experimentally measured data of and for various operated at various from the binary AA/PA mixture.
Table 1.
The experimentally measured data of and for various operated at various from the binary AA/PA mixture.
| (-) | (-) | (K) | (K) | (K) | (m/s) | (-) | (-) |
|---|---|---|---|---|---|---|---|
| 0.954 | 0.046 | 283.9 | 273 | 10.9 | 3.89 | 0.023 | 0.500 |
| 270 | 13.9 | 5.39 | 0.026 | 0.565 | |||
| 266.5 | 17.4 | 5.89 | 0.030 | 0.609 | |||
| 263 | 20.9 | 6.92 | 0.031 | 0.674 | |||
| 0.908 | 0.092 | 281.7 | 273 | 8.68 | 3.11 | 0.057 | 0.620 |
| 270 | 11.7 | 4.22 | 0.063 | 0.685 | |||
| 266.5 | 15.2 | 5.33 | 0.067 | 0.728 | |||
| 263 | 18.7 | 6.33 | 0.069 | 0.750 | |||
| 0.861 | 0.139 | 279.3 | 273 | 6.30 | 1.78 | 0.097 | 0.698 |
| 270 | 9.30 | 3.94 | 0.105 | 0.755 | |||
| 266.5 | 12.8 | 4.67 | 0.109 | 0.784 | |||
| 263 | 16.3 | 5.39 | 0.114 | 0.820 | |||
| 0.813 | 0.187 | 276.7 | 273 | 3.70 | 1.50 | 0.138 | 0.738 |
| 270 | 6.70 | 3.25 | 0.143 | 0.765 | |||
| 266.5 | 10.2 | 3.67 | 0.149 | 0.797 | |||
| 263 | 13.7 | 4.33 | 0.154 | 0.824 |
Publisher’s Note: MDPI stays neutral with regard to jurisdictional claims in published maps and institutional affiliations. |
© 2022 by the author. Licensee MDPI, Basel, Switzerland. This article is an open access article distributed under the terms and conditions of the Creative Commons Attribution (CC BY) license (https://creativecommons.org/licenses/by/4.0/).
Share and Cite
MDPI and ACS Style
Shiau, L.-D. The Correlation for Effective Distribution Coefficient with Initial Impurity Concentration and Growth Rate for Acrylic Acid in Melt Crystallization. Crystals 2022, 12, 709. https://0-doi-org.brum.beds.ac.uk/10.3390/cryst12050709
AMA Style
Shiau L-D. The Correlation for Effective Distribution Coefficient with Initial Impurity Concentration and Growth Rate for Acrylic Acid in Melt Crystallization. Crystals. 2022; 12(5):709. https://0-doi-org.brum.beds.ac.uk/10.3390/cryst12050709
Chicago/Turabian StyleShiau, Lie-Ding. 2022. "The Correlation for Effective Distribution Coefficient with Initial Impurity Concentration and Growth Rate for Acrylic Acid in Melt Crystallization" Crystals 12, no. 5: 709. https://0-doi-org.brum.beds.ac.uk/10.3390/cryst12050709
Note that from the first issue of 2016, this journal uses article numbers instead of page numbers. See further details here.